Article

A Comparison between One-Step and Two-Step Nesting Strategy in the Dynamical Downscaling of Regional Climate Model COSMO-CLM at 2.2 km Driven by ERA5 Reanalysis

Regional Model and geo-Hydrological Impacts (REMHI), Fondazione Centro Euro-Mediterraneo sui Cambiamenti Climatici, Via Thomas Alva Edison, 81100 Caserta, Italy
*
Author to whom correspondence should be addressed.
Atmosphere 2021, 12(2), 260; https://doi.org/10.3390/atmos12020260
Submission received: 23 December 2020 / Revised: 10 February 2021 / Accepted: 12 February 2021 / Published: 16 February 2021

Abstract

:
Recently, the European Centre for Medium Range Weather Forecast (ECMWF) has released a new generation of reanalysis, acknowledged as ERA5, representing at the present the most plausible picture for the current climate. Although ERA5 enhancements, in some cases, its coarse spatial resolution (~31 km) could still discourage a direct use of precipitation fields. Such a gap could be faced dynamically downscaling ERA5 at convection permitting scale (resolution < 4 km). On this regard, the selection of the most appropriate nesting strategy (direct one-step against nested two-step) represents a pivotal issue for saving time and computational resources. Two questions may be raised within this context: (i) may the dynamical downscaling of ERA5 accurately represents past precipitation patterns? and (ii) at what extent may the direct nesting strategy performances be adequately for this scope? This work addresses these questions evaluating two ERA5-driven experiments at ~2.2 km grid spacing over part of the central Europe, run using the regional climate model COSMO-CLM with different nesting strategies, for the period 2007–2011. Precipitation data are analysed at different temporal and spatial scales with respect to gridded observational datasets (i.e., E-OBS and RADKLIM-RW) and existing reanalysis products (i.e., ERA5-Land and UERRA). The present work demonstrates that the one-step experiment tendentially outperforms the two-step one when there is no spectral nudging, providing results at different spatial and temporal scales in line with the other existing reanalysis products. However, the results can be highly model and event dependent as some different aspects might need to be considered (i.e., the nesting strategies) during the configuration phase of the climate experiments. For this reason, a clear and consolidated recommendation on this topic cannot be stated. Such a level of confidence could be achieved in future works by increasing the number of cities and events analysed. Nevertheless, these promising results represent a starting point for the optimal experimental configuration assessment, in the frame of future climate studies.

1. Introduction

A proper spatial and temporal characterization of past precipitation regimes represents a pivotal challenge in climate research [1,2,3]. Such a challenge is more relevant when this information is adopted for driving impact models [4,5,6,7,8,9,10,11] and evaluating their performances [12,13,14]. The required accuracy and reliability are however hardly retrievable by in situ observation networks, especially in those areas characterized by a scarce homogeneity and density of observation points.
A first step forward in this view relies on the use of climate reanalyses. A climate reanalysis provides a physically consistent and reliable global reconstruction of past weather, without any gap in space or in time, through the data assimilation of historical observations for both atmospheric and soil variables. Recently, the European Centre for Medium Range Weather Forecast (ECMWF) has released a new generation of reanalysis, acknowledged as ERA5 [15]. Such a new generation of reanalysis provides a picture of the current climate from 1979 onwards at hourly resolution. ERA5 relies on 4D-Var data assimilation by using the Cycle 41r2 of the Integrated Forecasting System (IFS). Compared to the previous generation of reanalysis, acknowledged as ERA-Interim [16] and widely used as a reference by the climate community, ERA5 features an enhancement in spatial and temporal resolution (~31 km compared to the previous ~80 km), improving the representation of troposphere and tropical cyclones, with a better global balance of precipitation and evaporation.
Although ERA5 represents nowadays the most plausible description for current climate, its coarse resolution as well as the assumptions made in sub-grid parameterisations could discourage in some cases a direct use of these data as input for impact models, especially referring to precipitation. Such a gap could be partly faced thanks to a dynamical downscaling of ERA5 at convection permitting scale (resolution < 4 km, hereinafter referred also as “very high resolution” or VHR) over specific areas of interest.
Some European projects and initiative (e.g., H2020 European Climate Prediction, EUCP; Coordinated Downscaling Experiment for Flagship Pilot Study at Convection Permitting Scales, CORDEX-FPS CPS) and an increasing number of scientific works [17,18,19,20,21,22,23] have investigated the benefits of VHR simulations, showing their ability in providing a space and time consistent description of past events. In general, these studies have demonstrated as convection-permitting models provide an added value for the evaluation of the sub-daily rainfall characteristics, such as the diurnal cycle and intensity of hourly precipitation extremes [17,18,20,24,25,26,27,28,29]. An additional improvement is represented by a more accurate characterization of interactions with complex orography [17,24]. Finally, refining the spatial resolution may also enable to use specific parameterizations for modelling cities. It is indeed recognized that urban environments are usually warmer than their surroundings [30]. A proper parameterization of cities could affect the development of precipitation through an easier activation of convection dynamics due to large surface sensible heat fluxes [31].
A comprehensive desk-review has revealed that only few works have been devoted to the downscaling of reanalysis at VHR. Among the most interesting, there are some national activities for smaller regions (e.g., the high-resolution reanalysis system COSMO-REA6 [32]). In addition, advanced experiments in this field are the ERA5-Land reanalysis [33] representing a refined version of ERA5 with a spatial resolution of ~9 km, and the UERRA (Uncertainties in Ensembles of Regional Reanalyses) reanalysis [34] over Europe representing a refined version of ERA40/ERA-Interim at ~5.5 km.
Moving from a coarser resolution to a finer one, a pivotal issue is the selection of the optimal strategy to nest the finer simulation into the parent analysis. Traditionally, finer simulations are nested in an intermediate step with coarser resolution of the same model to respect a prescribed spatial resolution ratio (usually up to 10:1) [12]. However, recent studies on this topic [35,36,37,38] and experiences [39,40] in the operational chain building-up has investigated the performance of the finer simulation when such an intermediate step is avoided. Specifically, Brisson et al. [36] have investigated on how to reduce computational costs without a reduction of model performance; they have concluded that removing the one nesting step does not significantly influence the representation of precipitation at convection permitting scale. On the same topic, Marsigli et al. [39] have analyzed the effect of the direct nesting approach compared with the one based on the intermediate step, for ensemble forecasting over Italy in terms of precipitation; they highlight a little outperformance of the direct-nesting ensemble for intense precipitation. Matte et al. [37] have concluded that the double nesting approach reduces the effective resolution jump, drastically decreases the effect of spatial spin-up, and allows a reduction of the optimal domain size of the high-resolution simulation, resulting in important computational savings. Finally, Tolle et al. [38] have addressed the influence of the horizontal resolution of the intermediate simulation on extremes achieved with higher resolution at convection-permitting scale, finding that overestimation of precipitation persists in winter although a different horizontal resolution is used in the intermediate simulation.
The direct nesting strategy would be extremely attractive from several viewpoints, especially for saving time and computational resources, already aggravated by running VHR climate simulation. This is possible as long as an adequate level of accuracy and reliability of the prediction is achieved with respect to those carried out with traditional strategies.
Within this framework, a number of questions may be raised about the dynamical downscaling of ERA5 at convection permitting scale:
  • may the dynamical downscaling of ERA5 reproduce past precipitation dynamics reliably and coherently?
  • at what extent may the direct nesting strategy performances be adequately for the scope in hand?
These questions are addressed in this work by evaluating two ad-hoc climate experiments at ~2.2 km driven by ERA5, performed with an optimized configuration of the regional climate model COSMO-CLM [41] switching on the module TERRA-URB tailored for urban environments [42]. The former relies on a one-step nesting strategy, in which the simulation at 2.2 km is directly “one-way nested” in ERA5; the latter on a “two-step nesting strategy”, in which the simulation at 2.2 km is one-way nested in a 12 km grid spacing which in turn is one-way nested in ERA5.
Part of the central Europe covering the period 2007–2011 are investigated in both experiments. The evaluation is carried out at different spatial and temporal scales by comparing COSMO-CLM results with those provided by gridded observational datasets such as E-OBS [43] and the Radar-based Precipitation Climatology with Gauge-adjusted one-hour precipitation sum (RADKLIM-RW) [44] and existing reanalysis products such as ERA5-Land and UERRA.
This downscaling exercise represents a preliminary test whose ambition is to define the nesting strategy for a more comprehensive ERA5 downscaling at ~2.2 km over Europe for the period 1989–2018. For this reason, computational domain and investigated period have been assumed as a trade-off between computational effort and scope of the work.
The study firstly describes the climate experiments (§ 2.1) and the datasets (§ 2.2) considered to evaluate VHR enhancements at different spatial and temporal scales as well as the methodology used for the evaluation at each scale (§ 2.3). Then, it presents (§3) and discusses (§4) the main results for the several scales investigated (§ 3.1, 3.2, 3.3) focusing on the differences between the investigated nesting strategies.

2. Materials and Methods

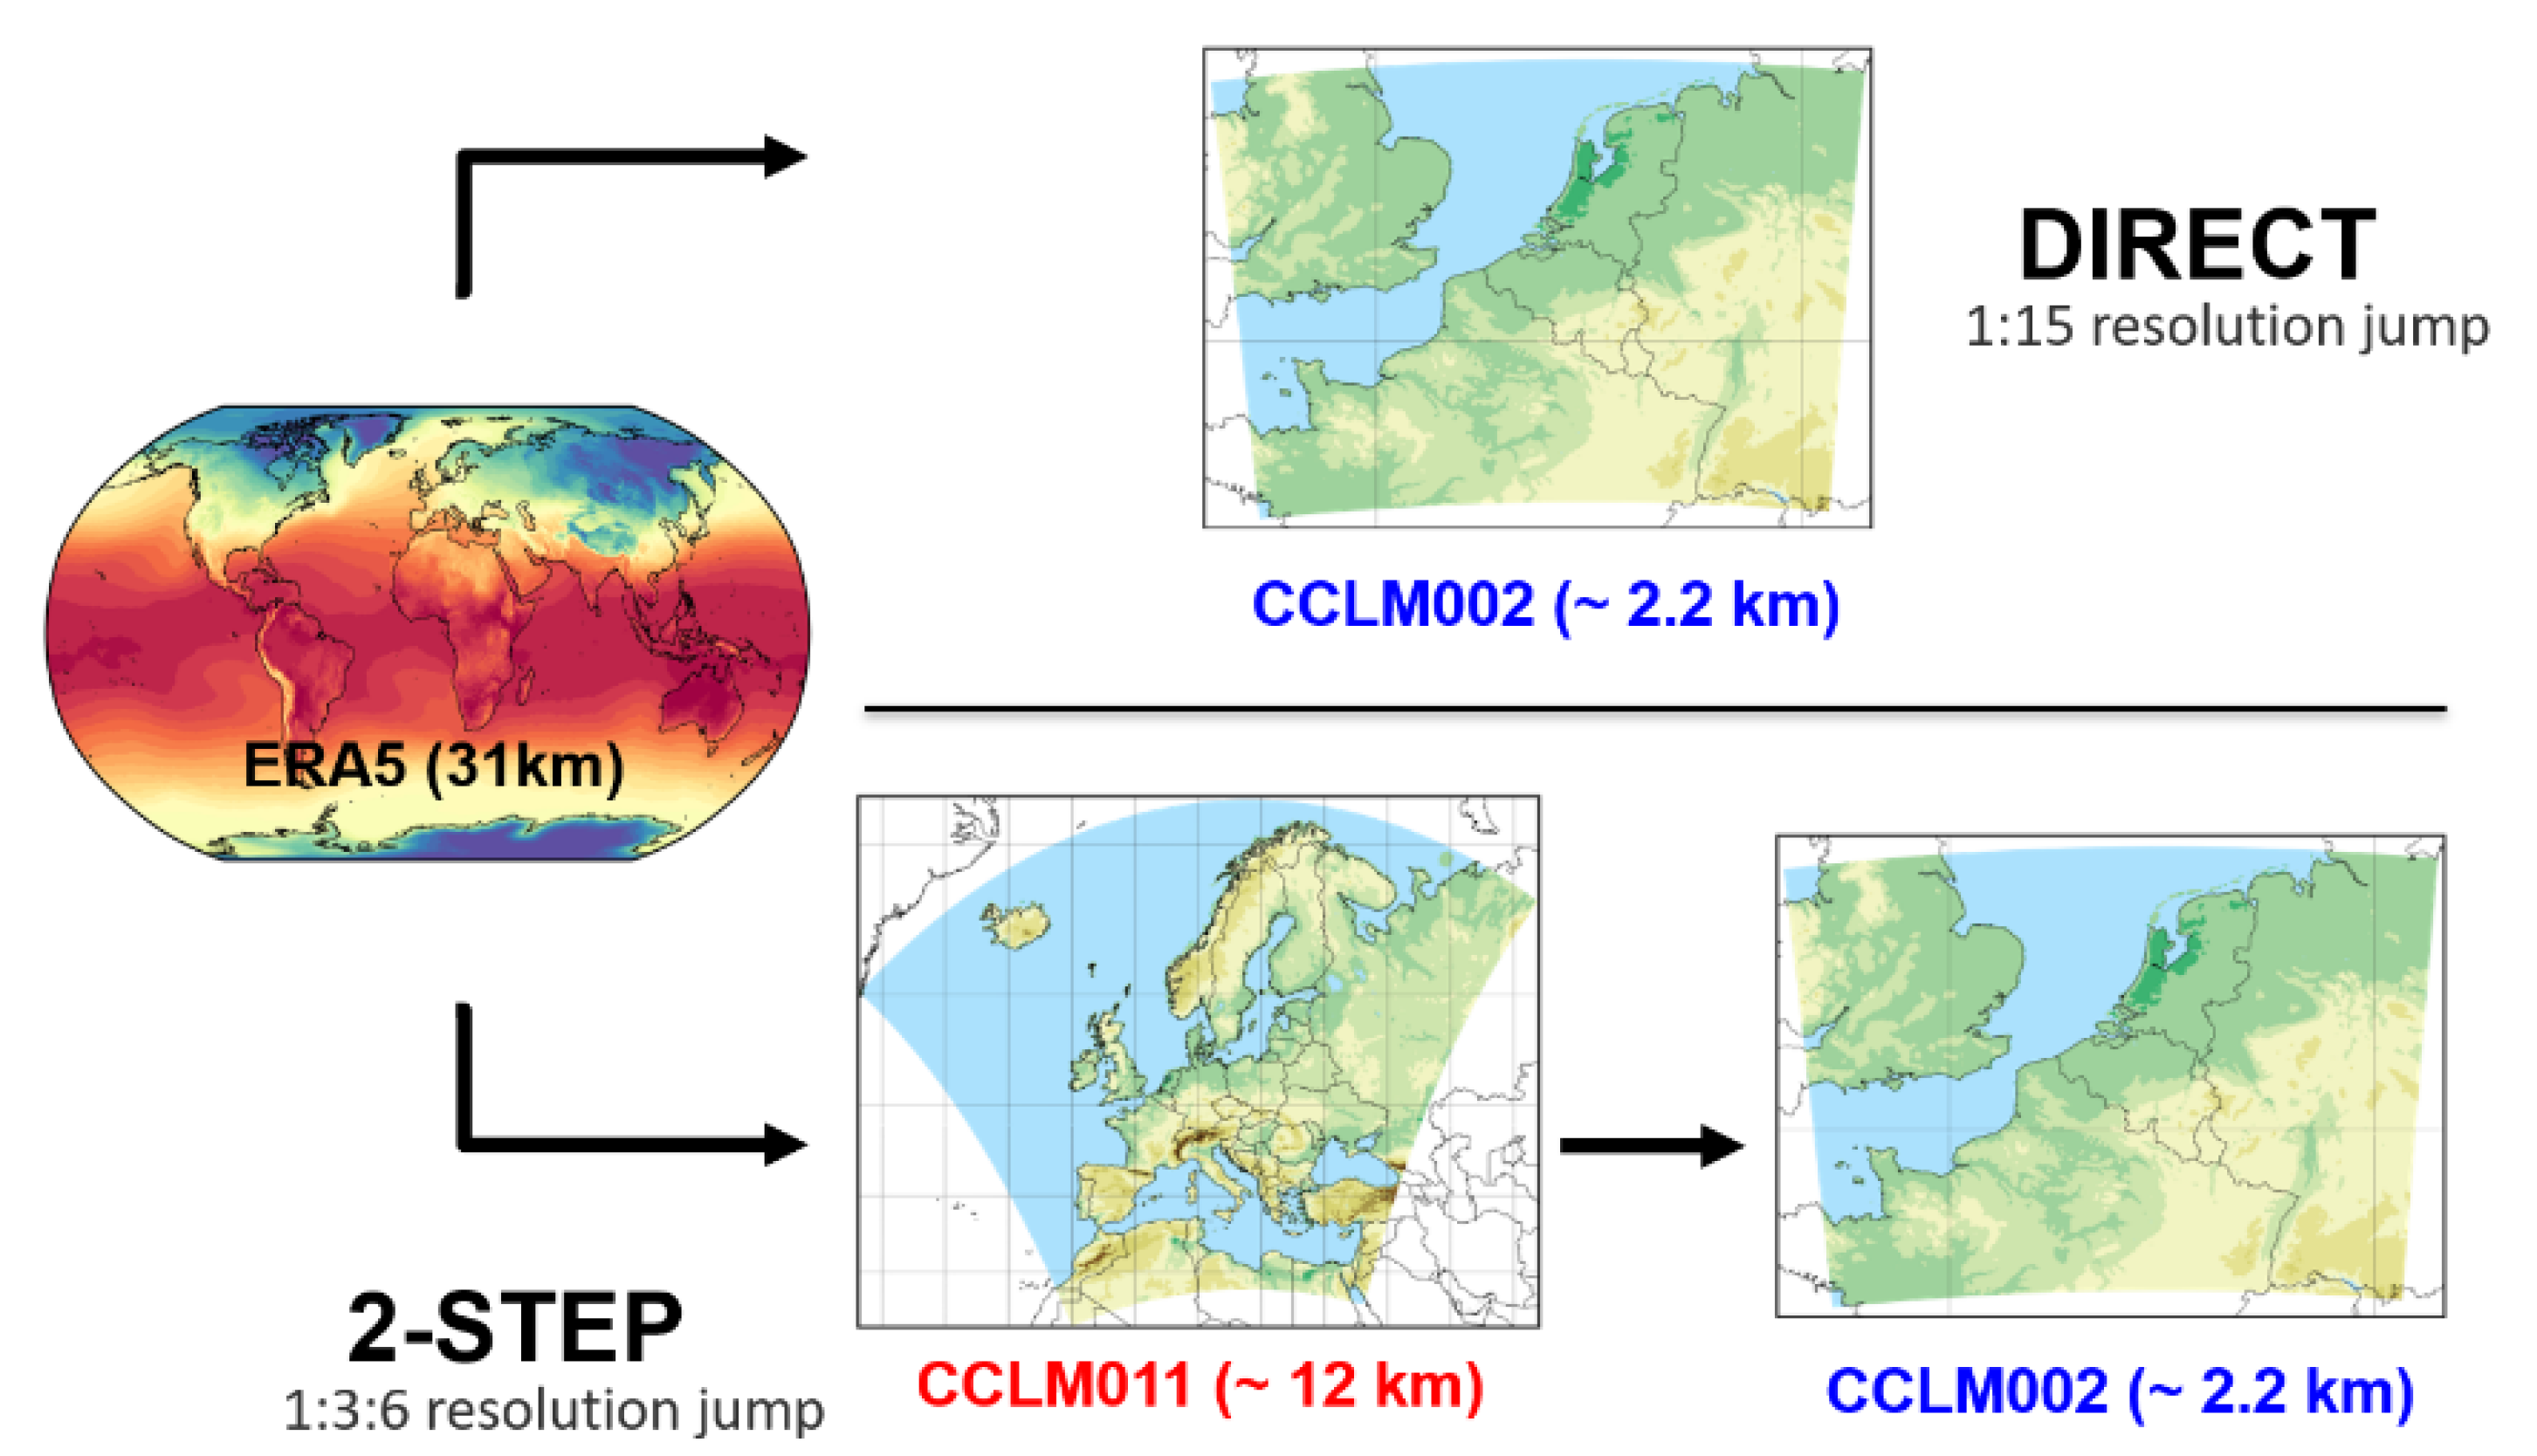
2.1. Climate Experiments

ERA5 is dynamically downscaled in this study at 0.02° (~2.2 km) over part of the Central Europe (Lon = 3° W–10.5° E; Lat = 47.5° N–53.5° N) with the regional climate model COSMO-CLM [41] switching on the module TERRA-URB for accounting the urban parameterizations [42].
Two experiments are performed to test different nesting strategies (Figure 1). The former, labelled as “CCLM002-Direct”, adopts a one-step nesting strategy, in which the simulation at 2.2 km is directly “one-way nested” in ERA5 (1:15 resolution jump); the latter, labelled as “CCLM002-Nest”, relies on a traditional “two-step nesting strategy”, in which the simulation at 2.2 km is one-way nested in a 12 km grid spacing which in turn is one-way nested in ERA5 (1:3:6 resolution jump).
Both CCLM002 experiments share parameterizations (Table 1), computational domain (Figure 2) and investigated period (2007–2011 with 2006 as spin-up). This period can be considered as long enough for sensitivity tests [45].
The optimized COSMO-DE setup is adopted for both CCLM002 experiments. It results from the protocol established in the frame of the Coordinated Downscaling Experiment (CORDEX) [46,47] of the World Climate Research Programme (WCRP) for the Flagship Pilot Study (FPS) on convection [19] focusing on the investigation of convective-scale events in a few key regions of Europe and the Mediterranean basin with convection-permitting regional climate models. Regarding the intermediate simulation (Table 1), it is run with COSMO-CLM over the common domain (Figure 2) investigated within the European branches of the CORDEX, acknowledged as EUROCORDEX [47]. The same setup as in EUROCORDEX is adopted for COSMO-CLM at 0.11°. All the configurations reported in Table 1 do not include the spectral nudging.
The experiments are performed on the Supercomputer ZEUS of the Fondazione Centro Euro-Mediterraneo sui Cambiamenti Climatici (CMCC). It is a Lenovo HPC cluster based on 348 Lenovo SD530 biprocessor nodes (for a total of 12.528 cores) all interconnected by means of an Infiniband EDR network. Regarding the computational costs, the finer experiments last about 222 h (~9.25 days with an average of 37 h for each year of simulation) while the intermediate one lasts about 42 h (~1.75 days with an average of 6 h for each year of simulation), employing 1800 cores distributed on 50 nodes.

2.2. Reference Datasets

2.2.1. Observational Datasets

Two observational datasets are considered for the evaluation of the climate experiments:
  • E-OBS [43,54]: it is a daily gridded land-only observational dataset over Europe at a horizontal resolution of 0.1° (~11 km). It contains data for precipitation amount, mean/maximum/minimum temperature, sea level pressure, and surface shortwave downwelling radiation. Its latest version (v.21) delivered by Copernicus Climate Data Store covers the period 1950–2019. As general information, the E-OBS relies on the “blended” time series from the station network of the European Climate Assessment & Dataset (ECA&D) project. It is calculated following a two-stage process to derive the daily field and the uncertainty in these daily estimates. The limitations due to the interpolation method are the underestimation (typically 10–20%) of high intensities (smoothing effect) and overestimation at low intensities (moist extension into dry areas), while systematic errors are more substantial for convective rainfall [17,55].
  • RADKLIM-RW [44]: it is a radar-based dataset for Germany (region of 1100 km × 900 km), available at the DWD Open Data Portal, at a horizontal resolution of 1 km. It provides hourly precipitation adjusted to rain gauge measurements. RADKLIM-RW represents a reanalysed and temporally extended version of RADOLAN-RW. It relies on consistent processing techniques, new correction algorithms (e.g., for distance- and height-dependent signal reduction and for spokes) and more rain gauges for adjustment. The dataset currently covers the period of 2001 to 2017.

2.2.2. Existing Reanalysis Dataset

In addition to the observational datasets, two reanalyses available on the Copernicus Climate Datastore (CDS) are considered for the evaluation of the climate experiments:
  • ERA5-Land [33]: it is an hourly land-only ERA5-driven reanalysis. It gives a consistent view of the land variables evolution from 1981 onwards at an enhanced horizontal resolution (~9 km) compared to ERA5. ERA5-Land is essentially an offline simulation of the ERA5 surface scheme with improved forcing, making it computationally affordable for relatively quick updates. Despite its resolution is enhanced with respect to ERA5, ERA5-Land does not derive from a dynamical downscaling, then precipitation should not be much improved.
  • UERRA (MESCAN-SURFEX option) [34,56]: it is a reanalysis at ~5.5 km providing estimations of the climate in Europe from 1961 to 2019 at 00, 06, 12, and 18 UTC. It descends from the UERRA-HARMONIE, a reanalysis (~11 km) based on a 3-D data assimilation system assuming along the lateral borders data from ERA40 for the years before 1979, and ERA-Interim for the years until 2019. Operatively, it combines the UERRA-HARMONIE with the MESCAN system and the land surface platform SURFEX to derive daily accumulated precipitation. To this aim, additional surface observations are considered.

2.3. Levels of Analysis

To inspect a multitude of features and potentialities, CCLM002 experiments are investigated at different spatial and temporal scale.
Specifically, three levels of analysis are defined:
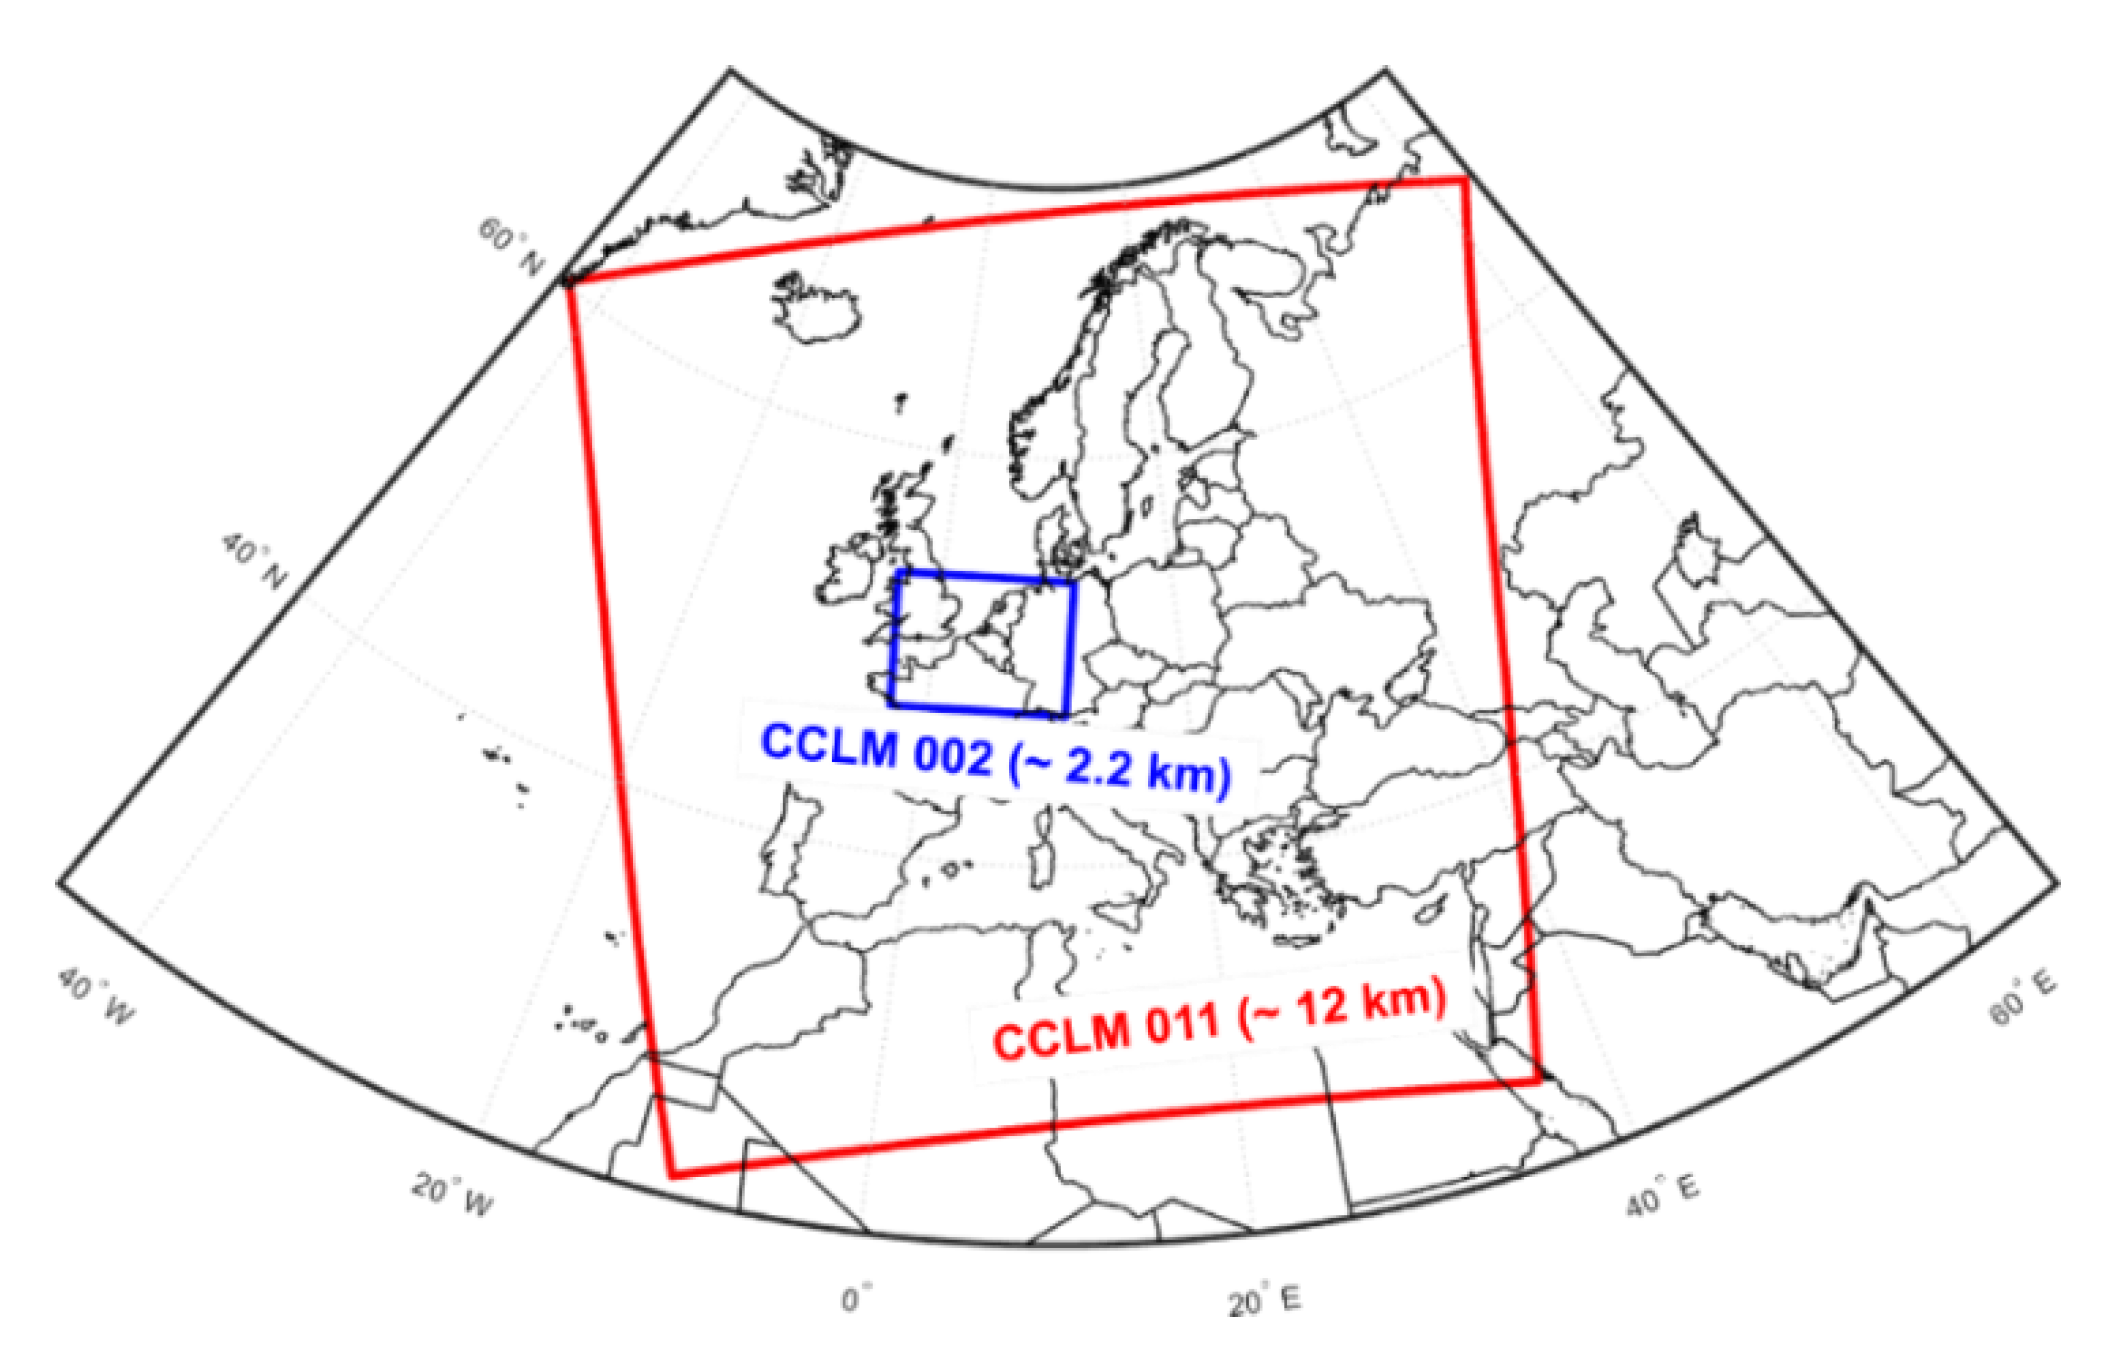
  • first level of analysis (i.e., evaluation at areal scale): it is designed to provide a general areal overview about the performances of the CCLM002-Direct and CCLM002-Nest with respect to E-OBS and existing reanalysis products (i.e., ERA5-Land and UERRA); such a first screening is performed considering spatial statistics over 2007–2011 on the evaluation domain shown in Figure 3;
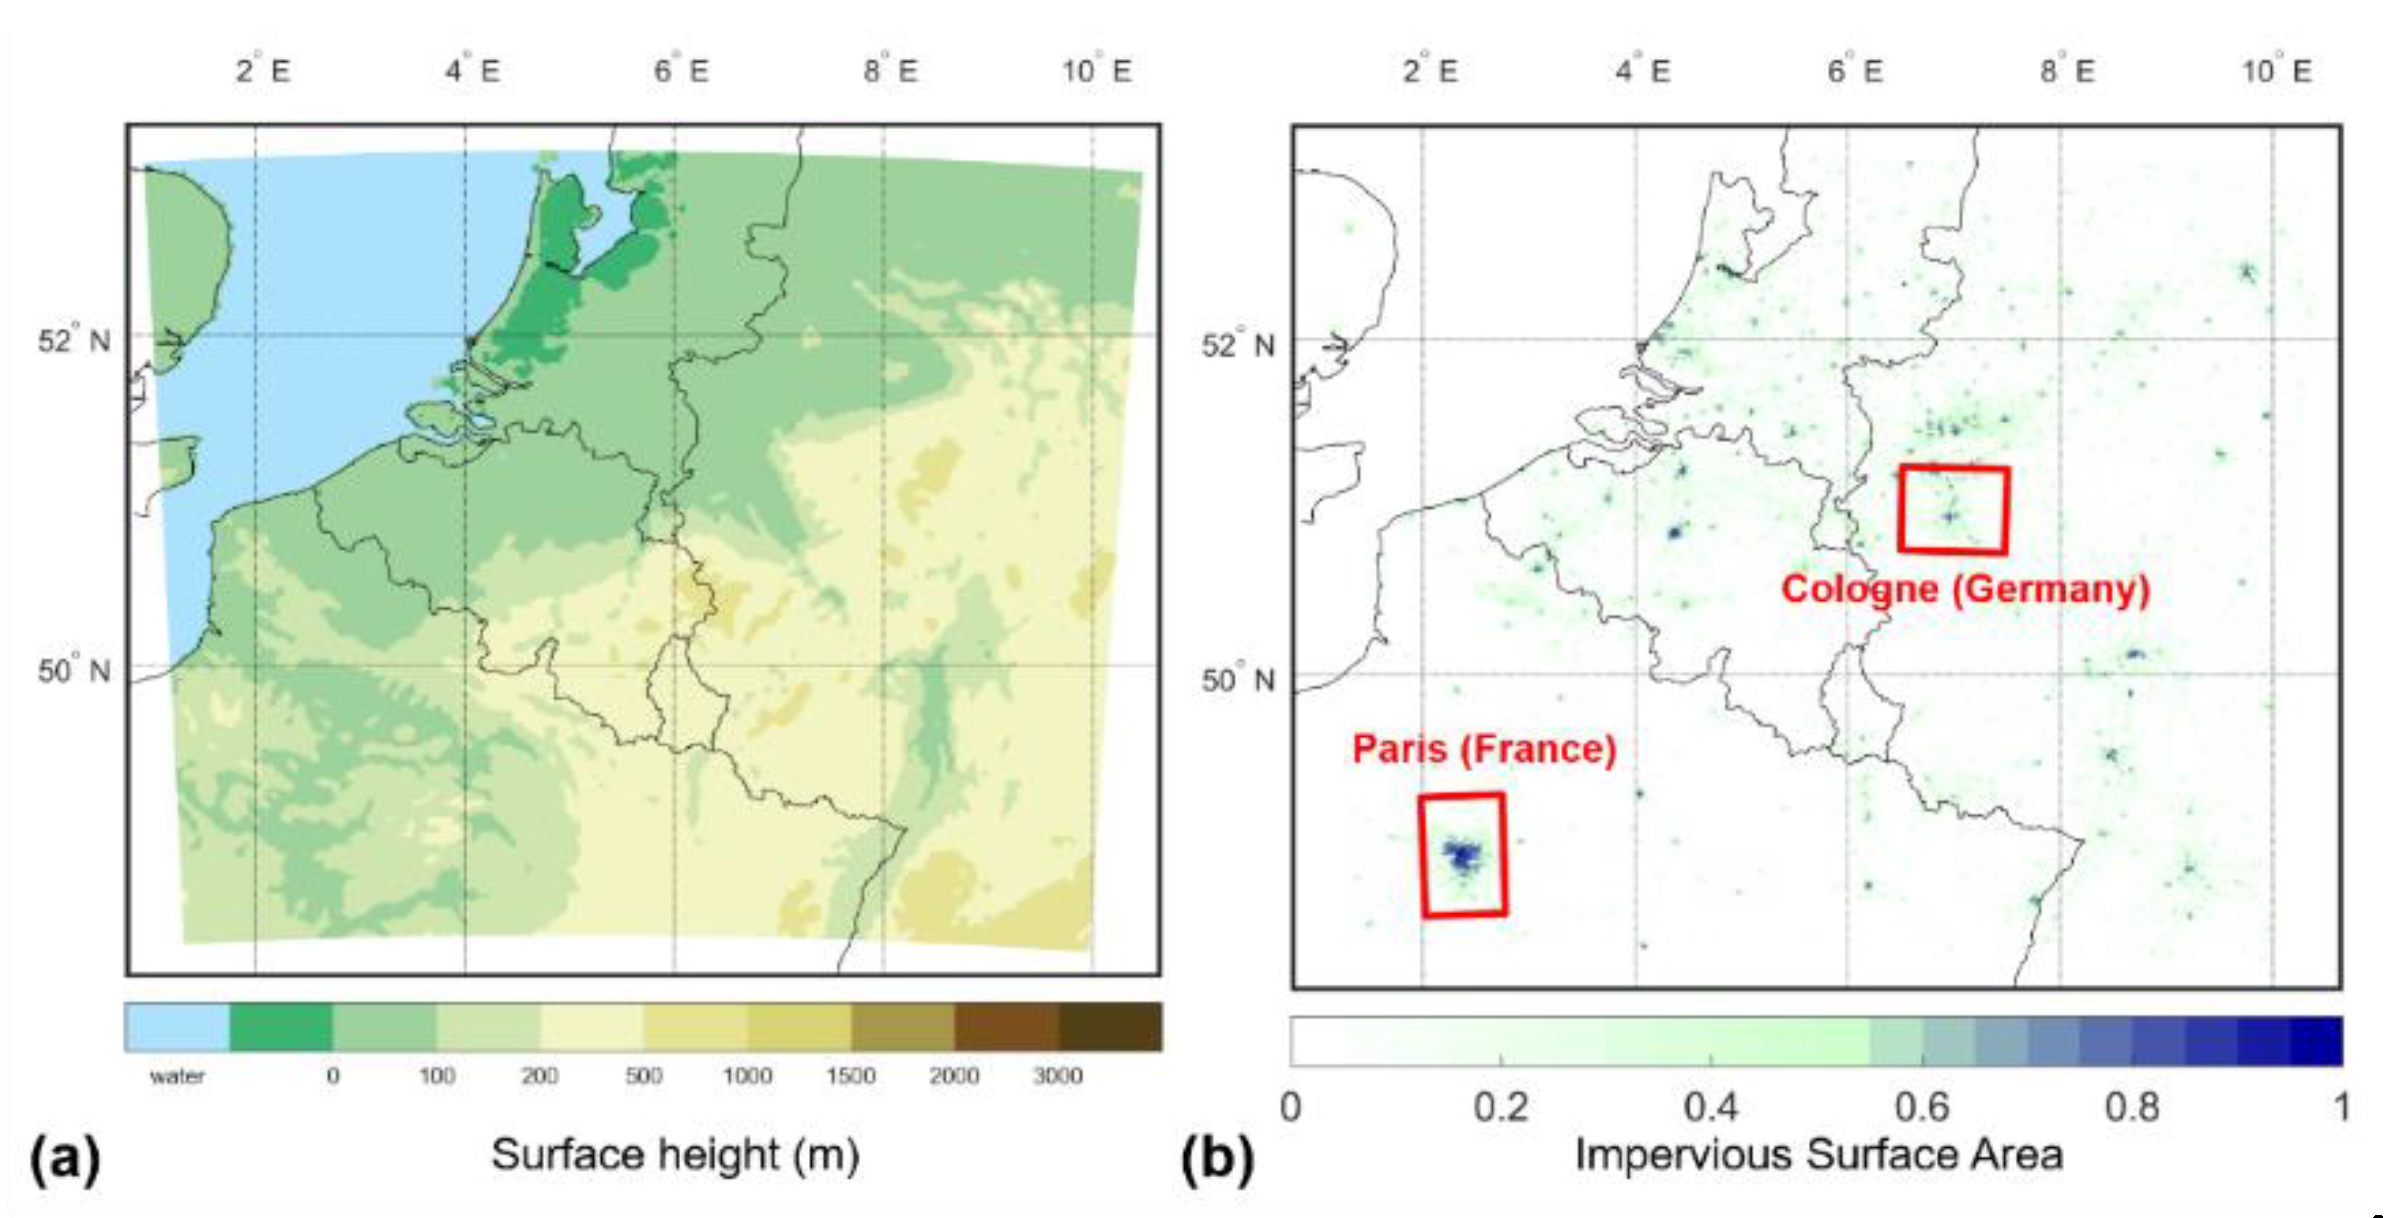
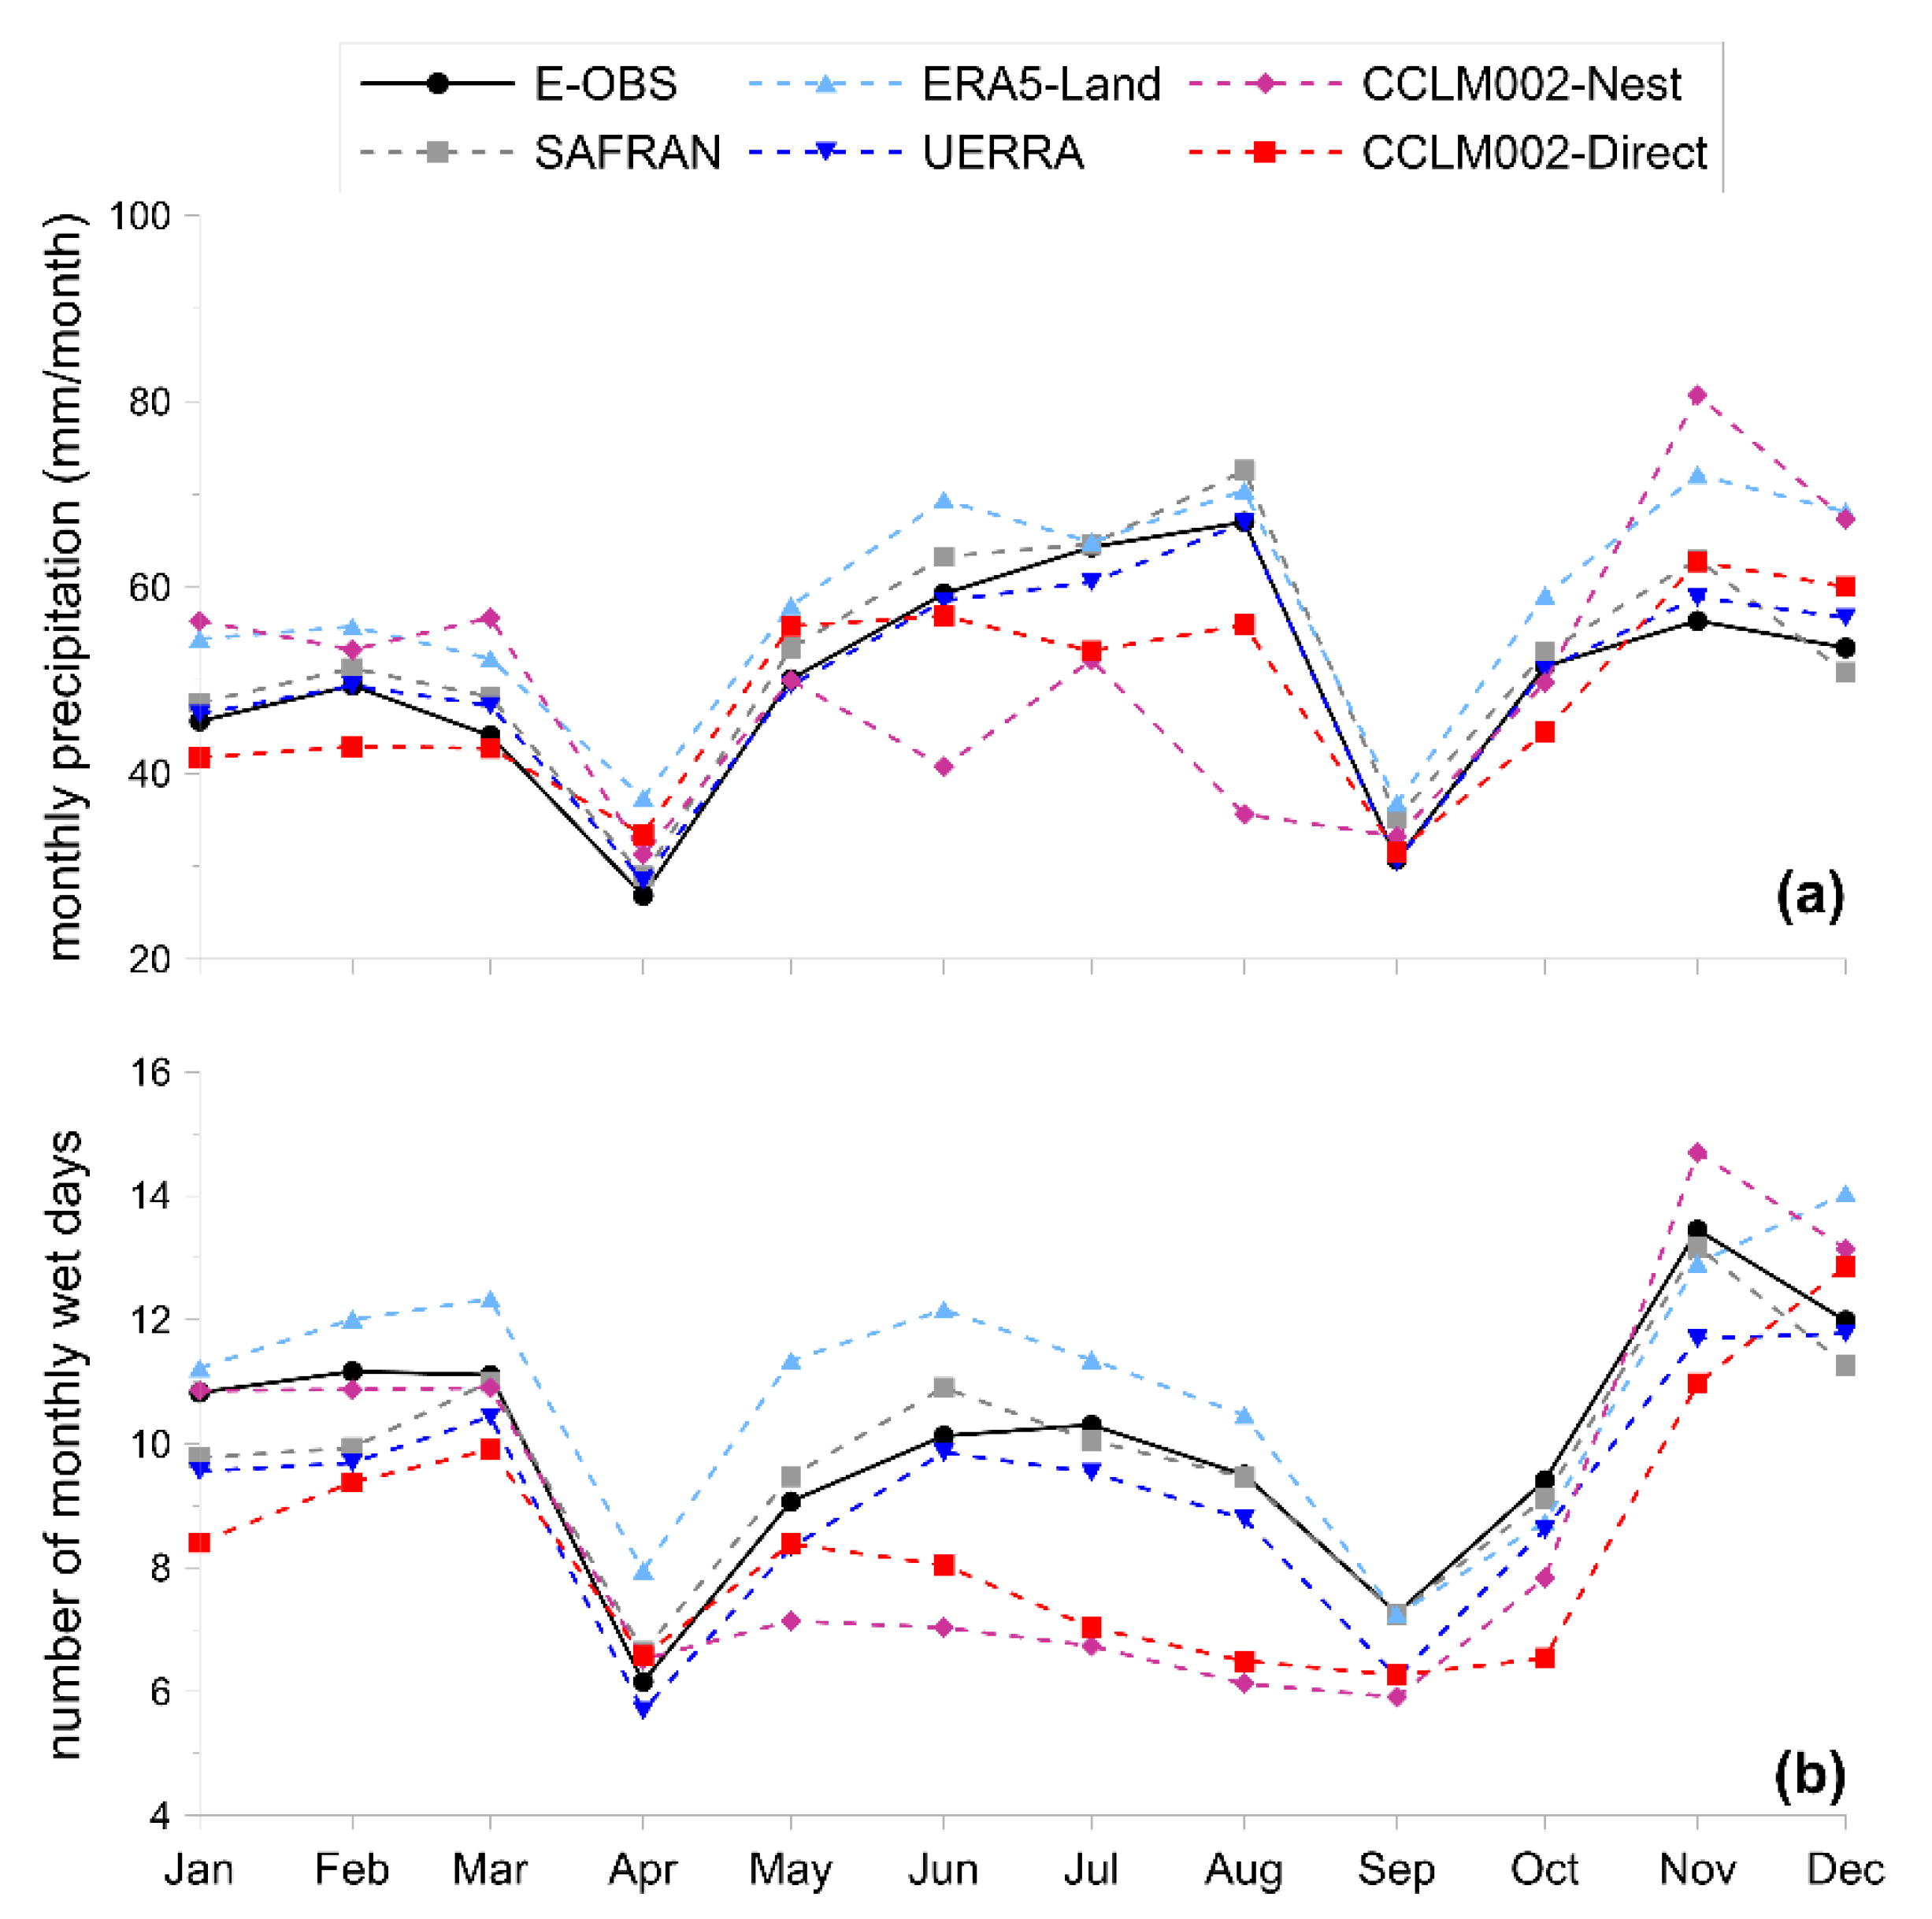
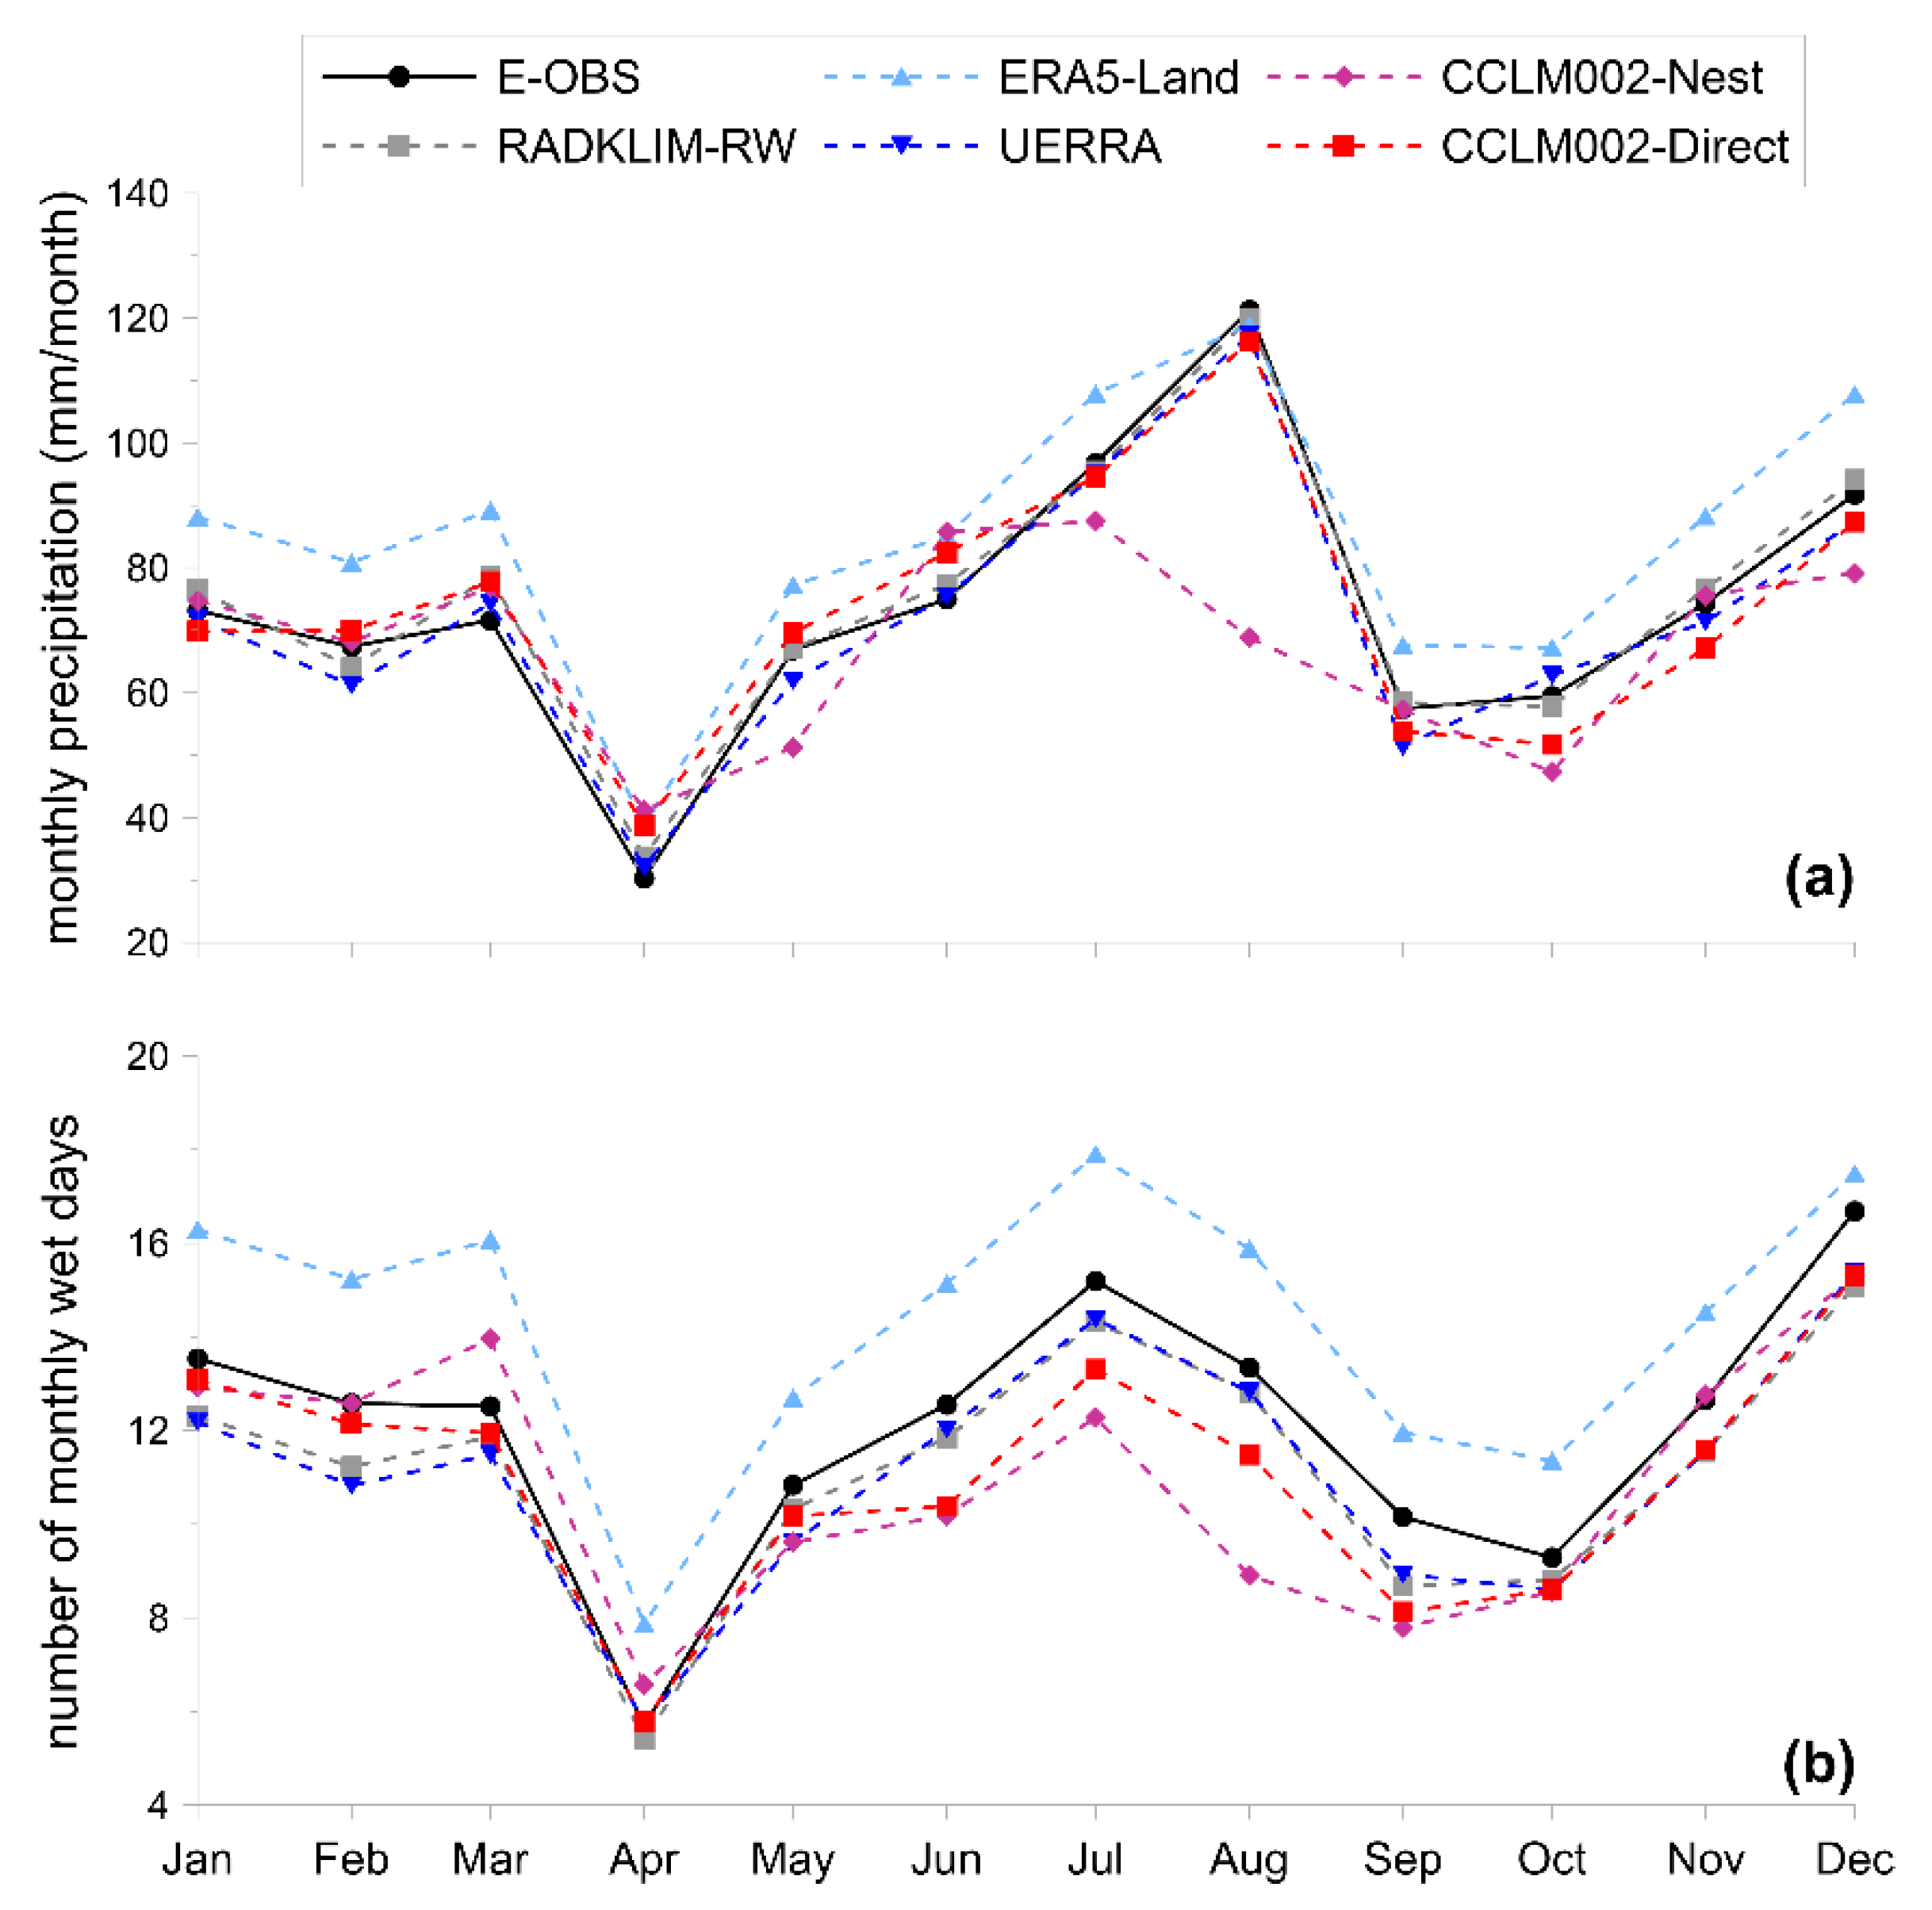
  • second level of analysis (i.e., evaluation at city scale): it serves as a base to understand the potentiality of CCLM002-Direct and CCLM002-Nest with respect to E-OBS and existing reanalysis products (i.e., ERA5-Land and UERRA), in describing precipitation features at city scale; such an evaluation is performed at monthly scale on the city of Paris (France, Lon = 1.95° E–2.75° E; Lat = 48.5° N–49.25° N), and Cologne (Germany, Lon = 6.5° E–7.5° E; Lat = 50.75° N–51.25° N) (Figure 3b);
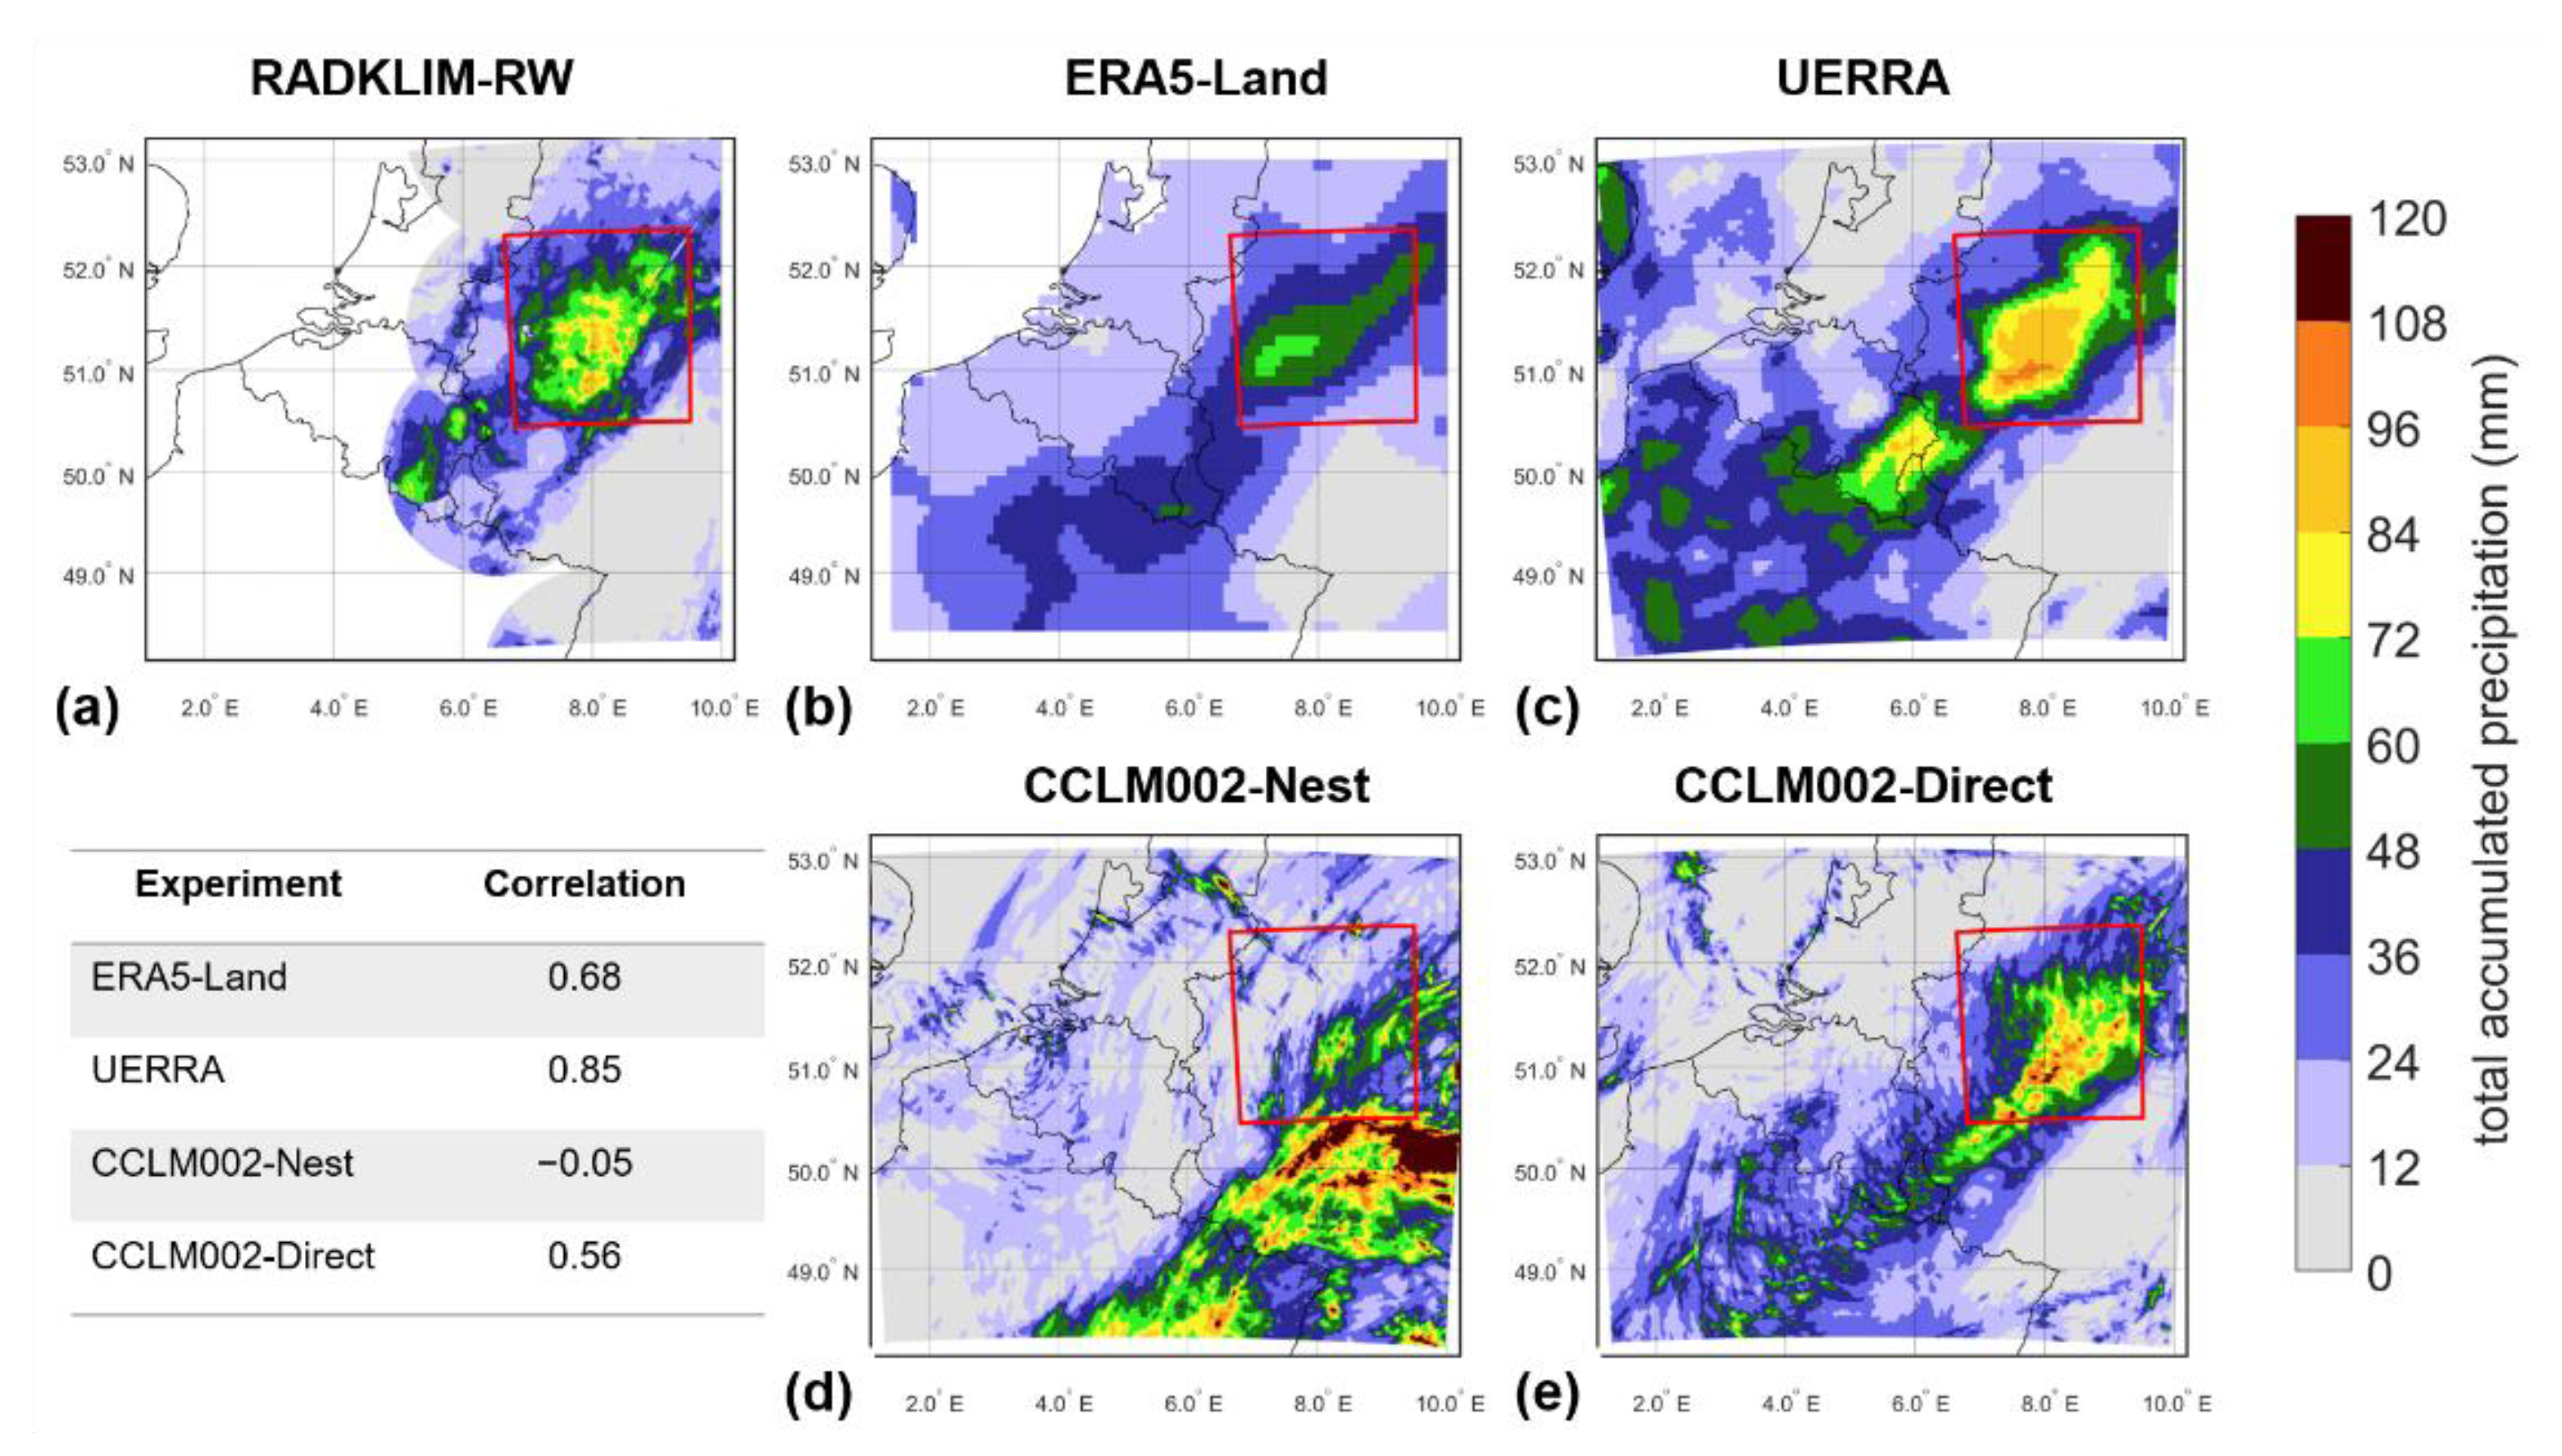
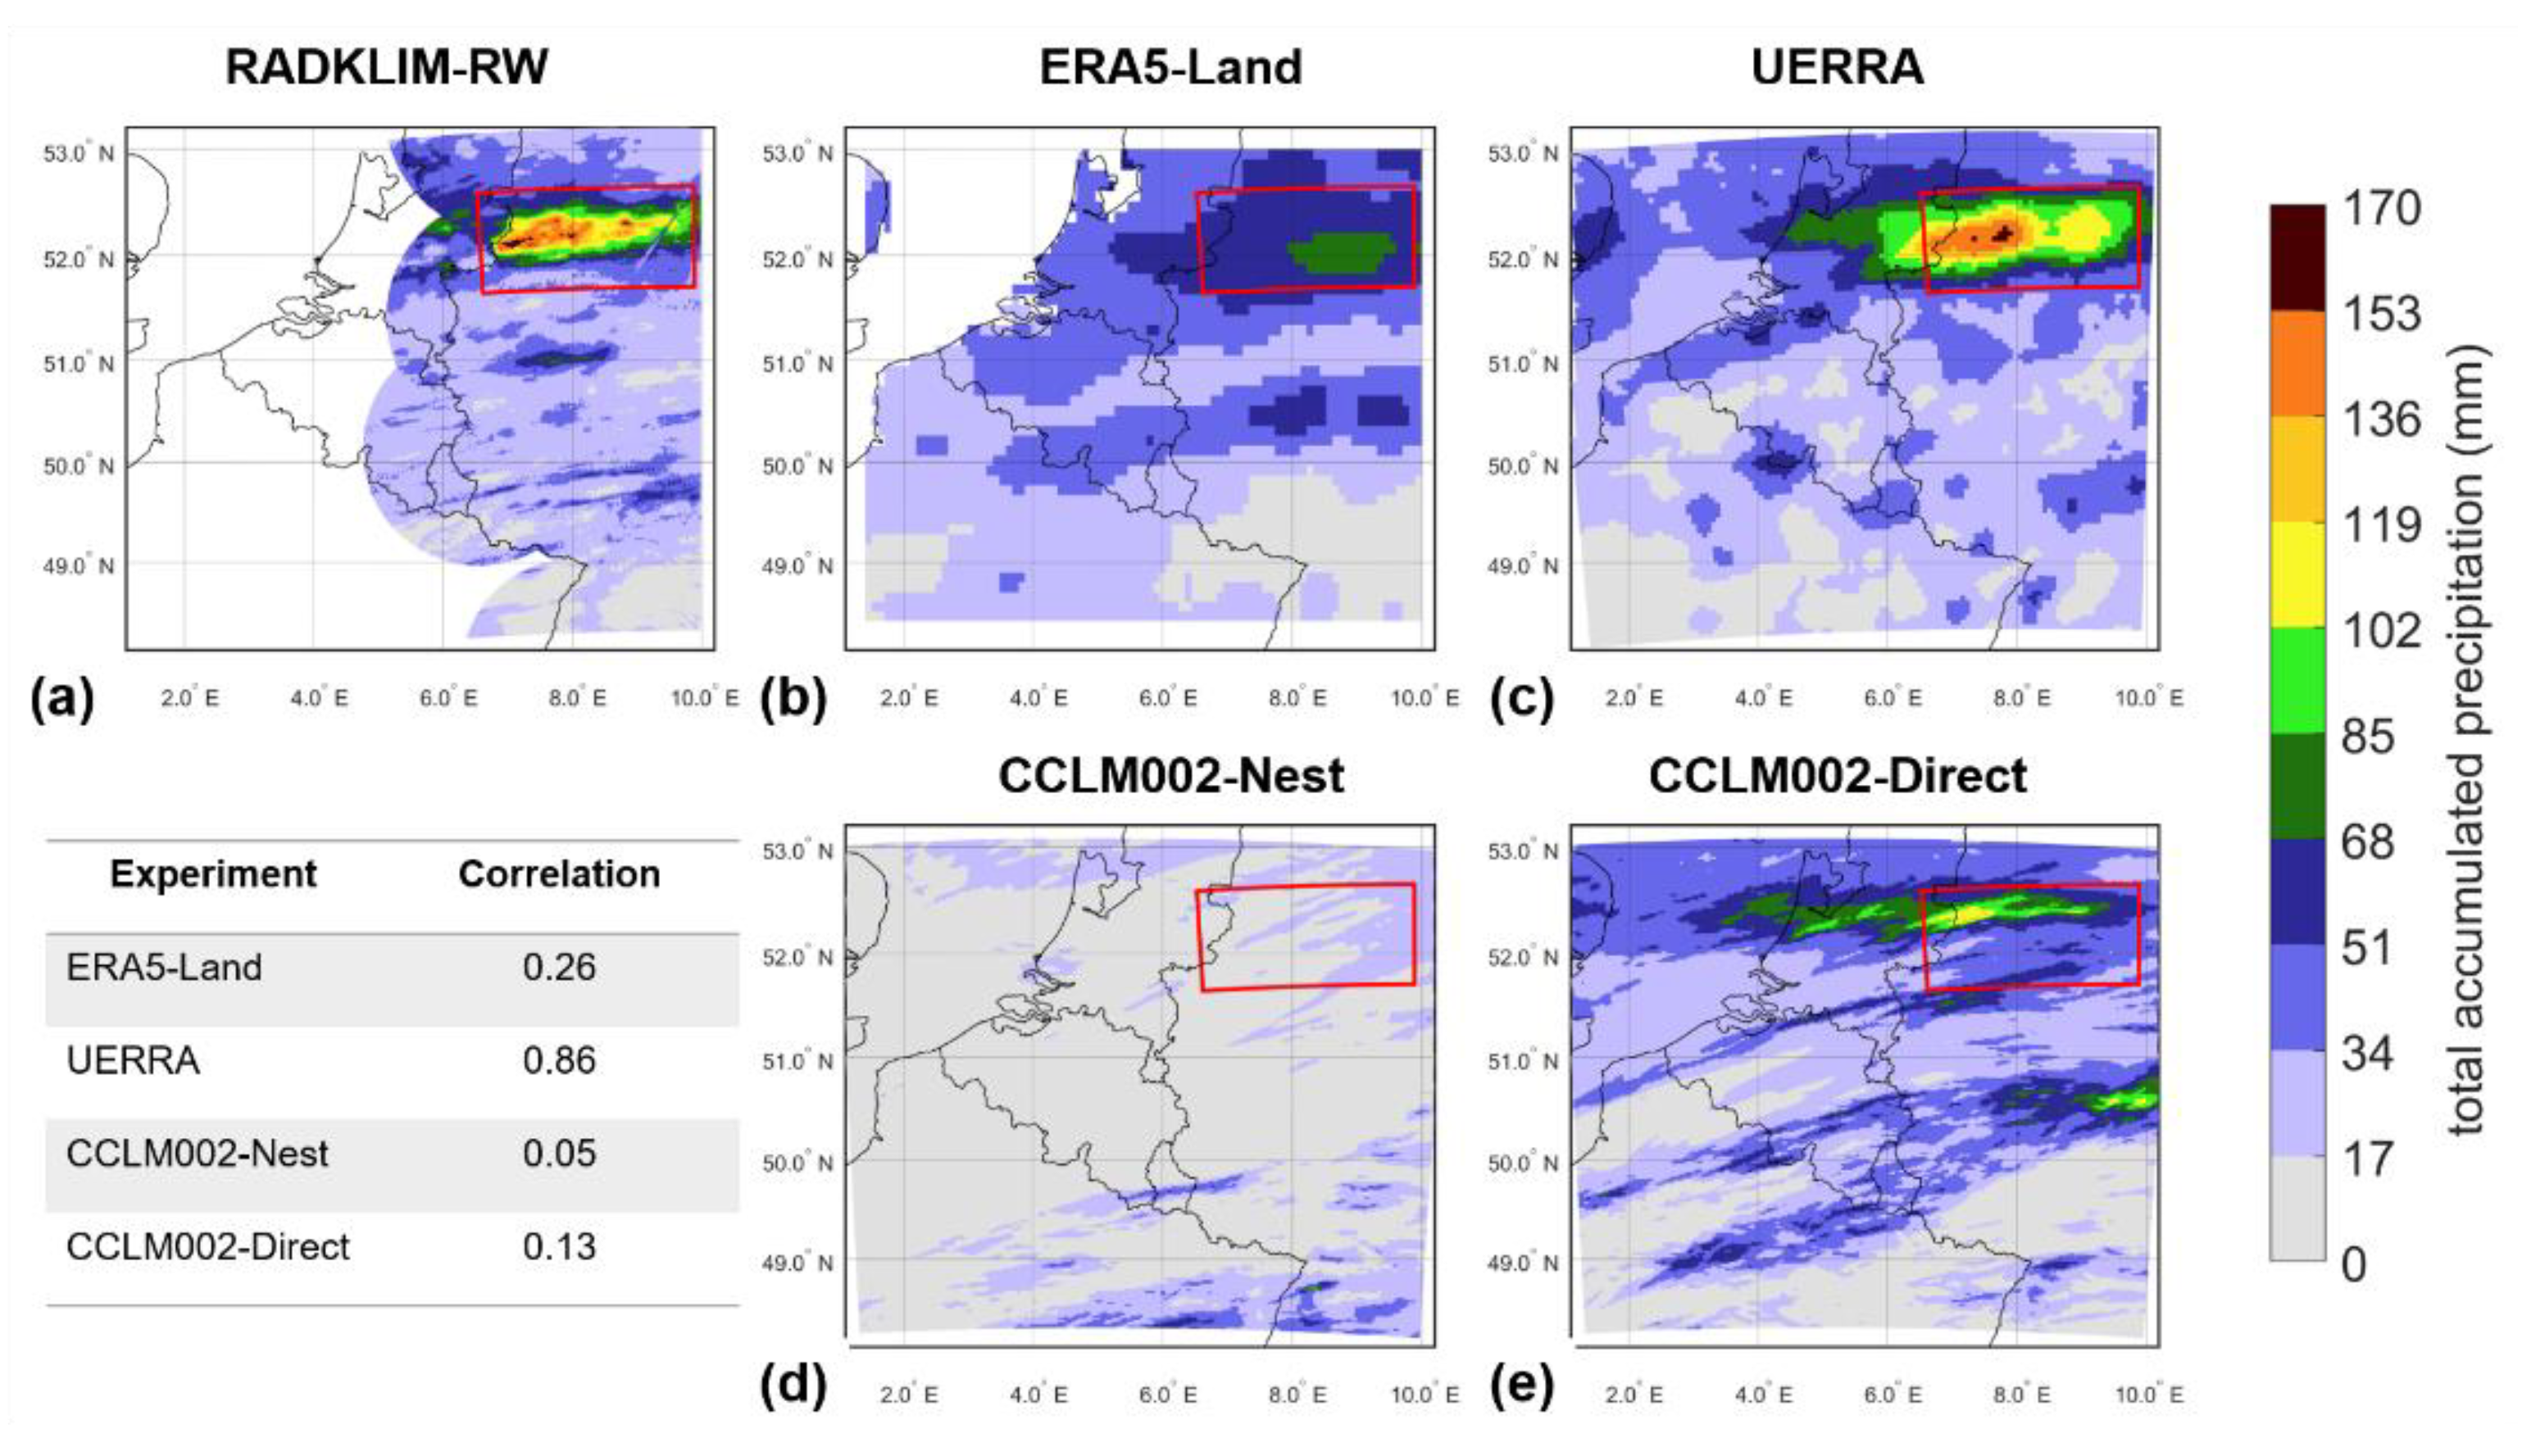
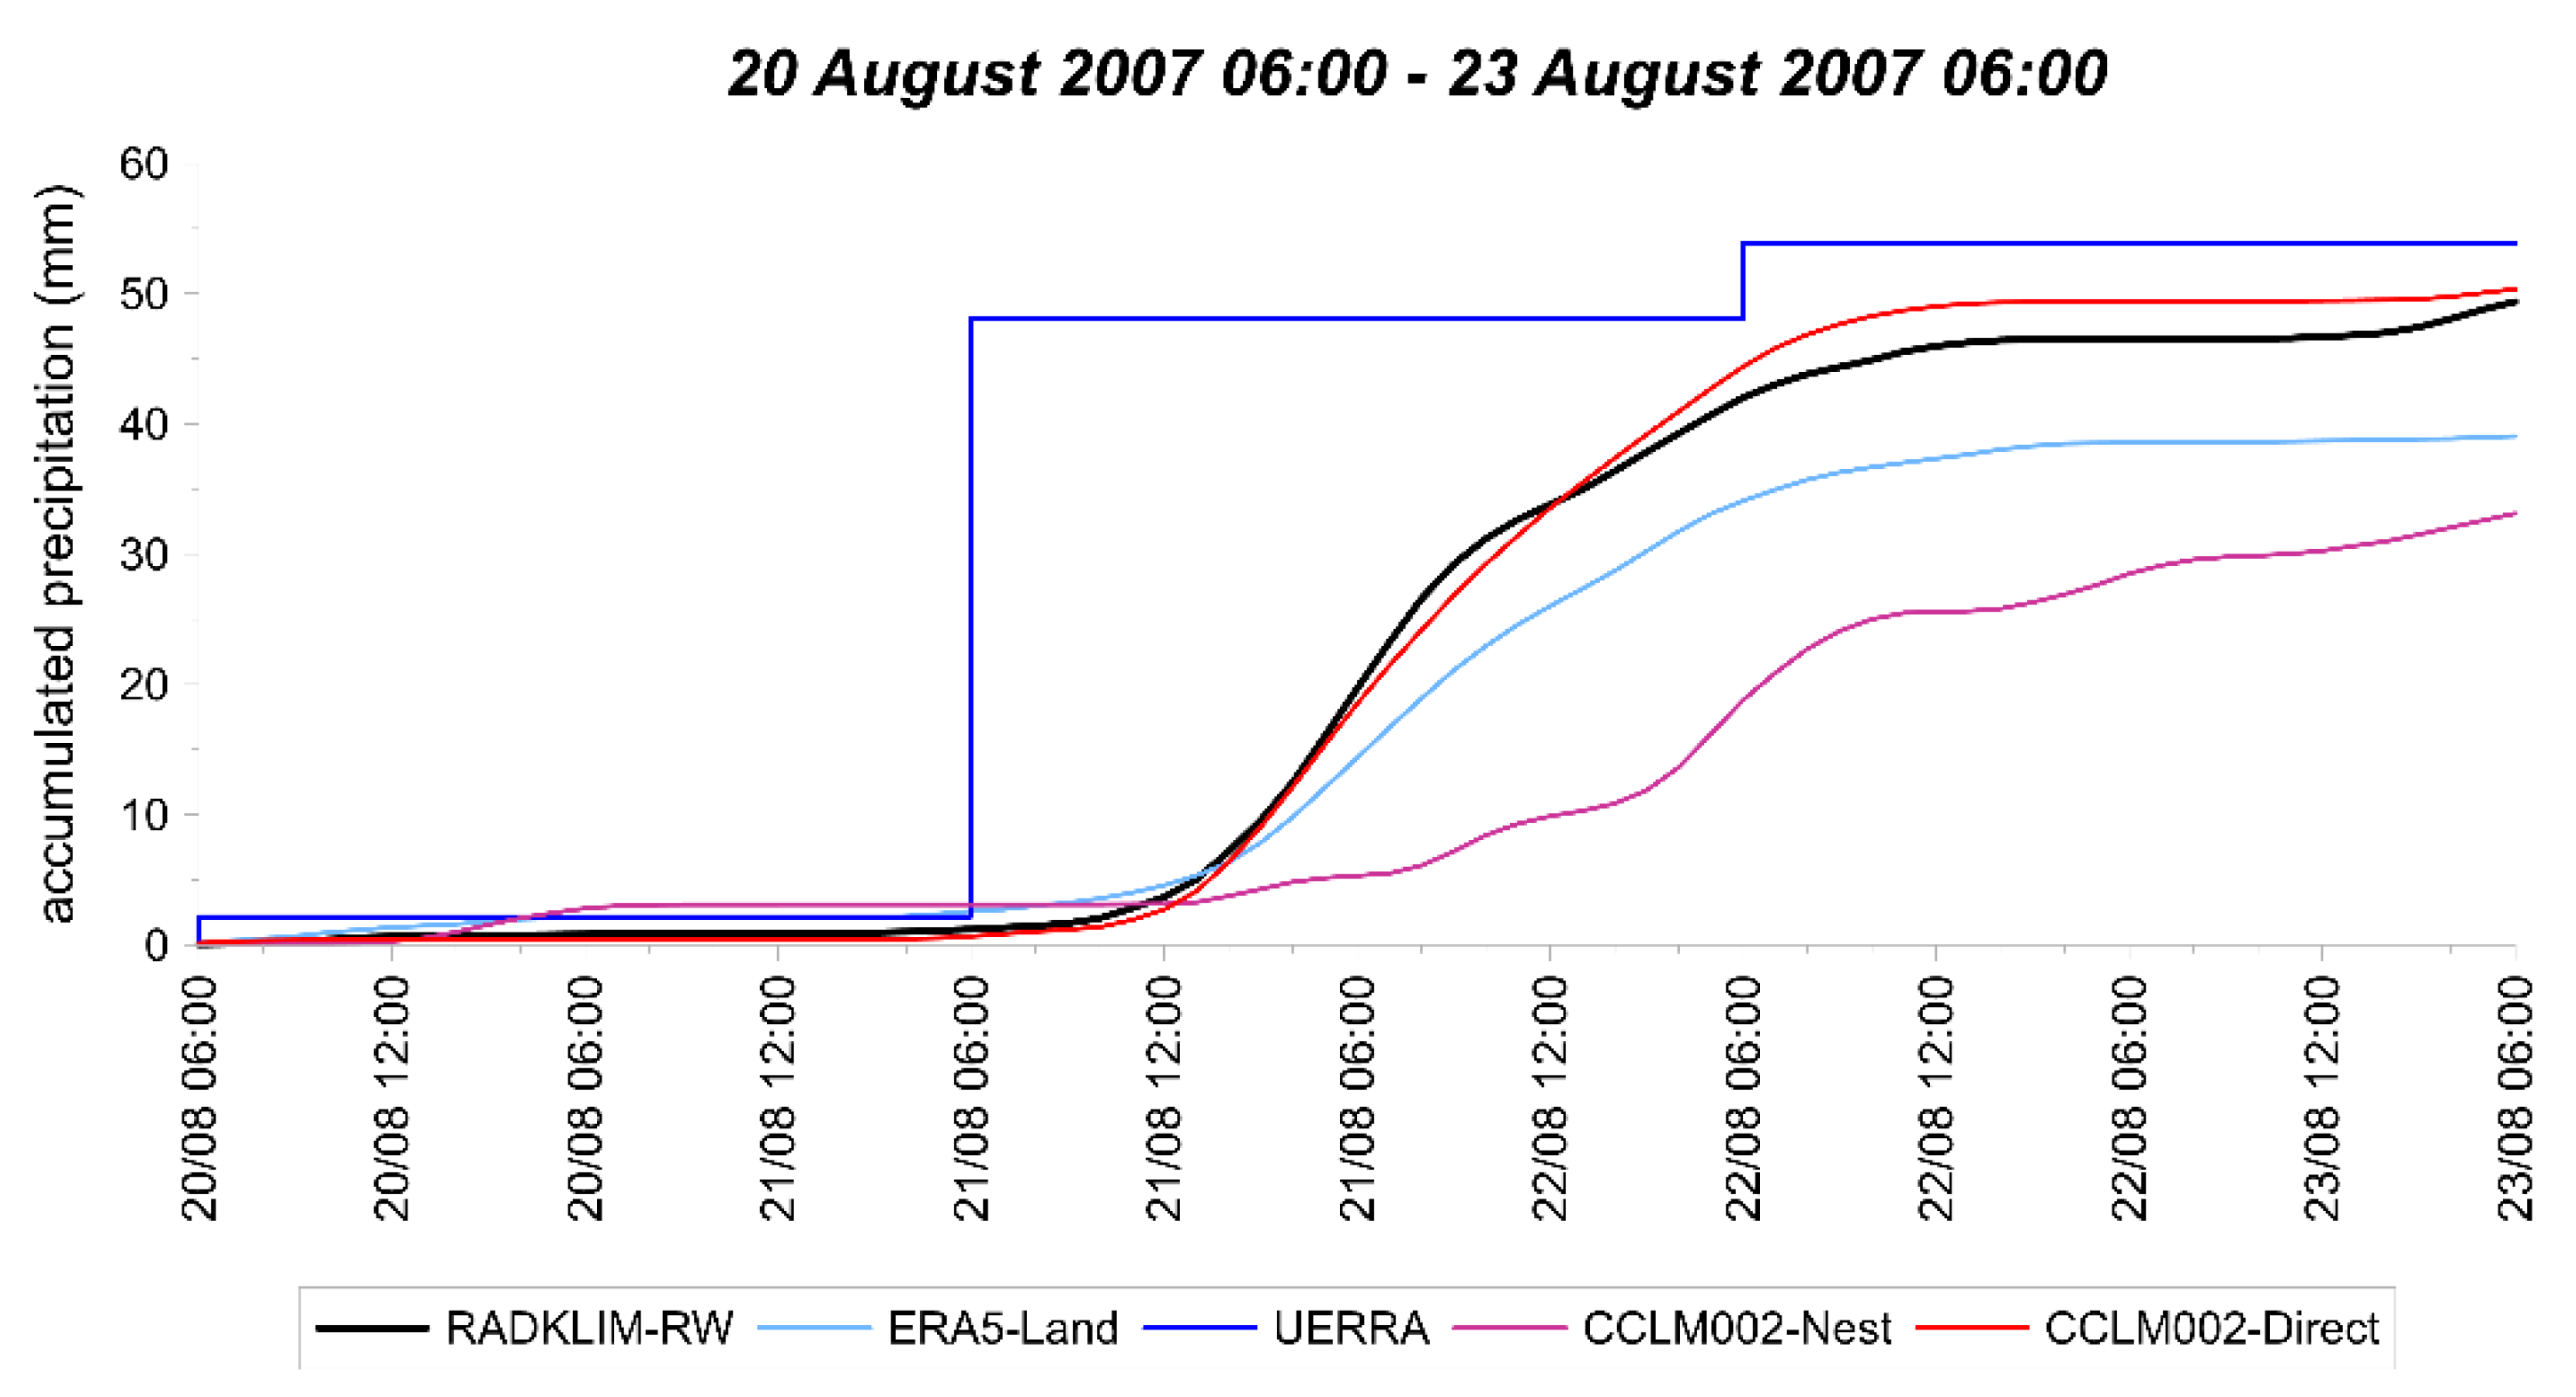
  • third level of analysis (i.e., evaluation at event scale): it aims at evaluating the ability of CCLM002-Direct and CCLM002-Nest in reproducing spatial precipitation patterns at the scale of event; to this aim, two summer precipitation events, occurred over the evaluation domain of Figure 3 in August 2007 and August 2010 are analyzed using RADKLIM-RW data as reference.
Precipitation data are processed considering a selection of indicators (see Table 2) based on the recommendations coming from the Expert Team on Climate Change Detection and Indices (ETCCDI) list [57]. These indicators traditionally assume 30-years as a reference period. Such a period reliably accounts for the intrinsic inter-annual variability, reducing the effect of external forcing that may induce statistically significant trends and thus undermine the homogeneity of the data. In this view, they merely provide in this study an indication on the climate experiments reliability and coherence, and not a specific climate characterization of the investigated area due to the reduced reference period (2007–2011).

2.4. Statistical Tools

The predictive skills of CCLM002 experiments are assessed with respect to observations (i.e., E-OBS or RADKLIM) by using as statistical tools the normalized Taylor diagram [58], the distribution added value (DAV) index [59] and the Kling–Gupta Efficiency (KGE) index [60]. These tools are also adopted for deriving the performances of CCLM experiments with respect to ERA5-Land and UERRA.
The Taylor diagram quantifies and displays the degree of correspondence between a variable simulated by a model and its observed counterpart according to three statistics: the Pearson correlation coefficient ρ, the root-mean-square deviation (RMSD) E’, and the normalized standard deviation σ. These three statistics are related as in the following:
E 2 = σ o b s 2 + σ m 2 2 σ o b s σ m ρ
where obs and m refer to observation and model, respectively.
DAV provides an objective and normalized measure of the added value in terms of potential gain in the performance of climate models due to the usage of a higher resolution, comparing higher- and coarser-resolution simulation probability density function (PDFs) to the observational PDF. In this perspective, DAV accounts for the difference in Perkins skill scores between high resolution (subscript hr) and low resolution (subscript lr) assuming the observations (subscript obs) as reference:
DAV = S h r S l r S l r = 1 n min ( Z h r , Z o b s ) 1 n min ( Z l r , Z o b s ) 1 n min ( Z l r , Z o b s )
where Shr and Slr are the Perkins skill score for high and low resolution, respectively; n represents the number of bin considered to obtain the PDF; Zhr, Zlr and Zobs are the frequencies of values in a given bin for high resolution, low resolution and observations, respectively.
DAV allows estimating the benefit associated with a higher resolution. Specifically, DAV = 0 indicates that no gain is found; DAV < 0 points out a loss associated with the usage of a higher resolution; DAV > 0 expresses the beneficial impact of increasing the grid spacing.
It should be emphasized that Taylor diagram statistics and DAV are quantified considering data on a common grid. To this aim, all datasets are interpolated onto the coarser grid (i.e., E-OBS grid).
KGE is a goodness-of-fit measure, traditionally adopted for an objective evaluation of runoff model performance. In general, this index evaluates the performance of a model timeseries (subscript m) with respect to an observed one (subscript obs):
KGE = 1 ( ρ 1 ) 2 + ( σ m σ o b s 1 ) 2 + ( μ m μ o b s 1 ) 2
where ρ is the Pearson correlation coefficient data while σ and μ represent, respectively, the standard deviation and the mean for model m and observation obs.
KGE = 1 indicates a perfect agreement between observed and simulated data; KGE < −0.41 indicates that model data underperform the mean of observed data [61].

3. Results

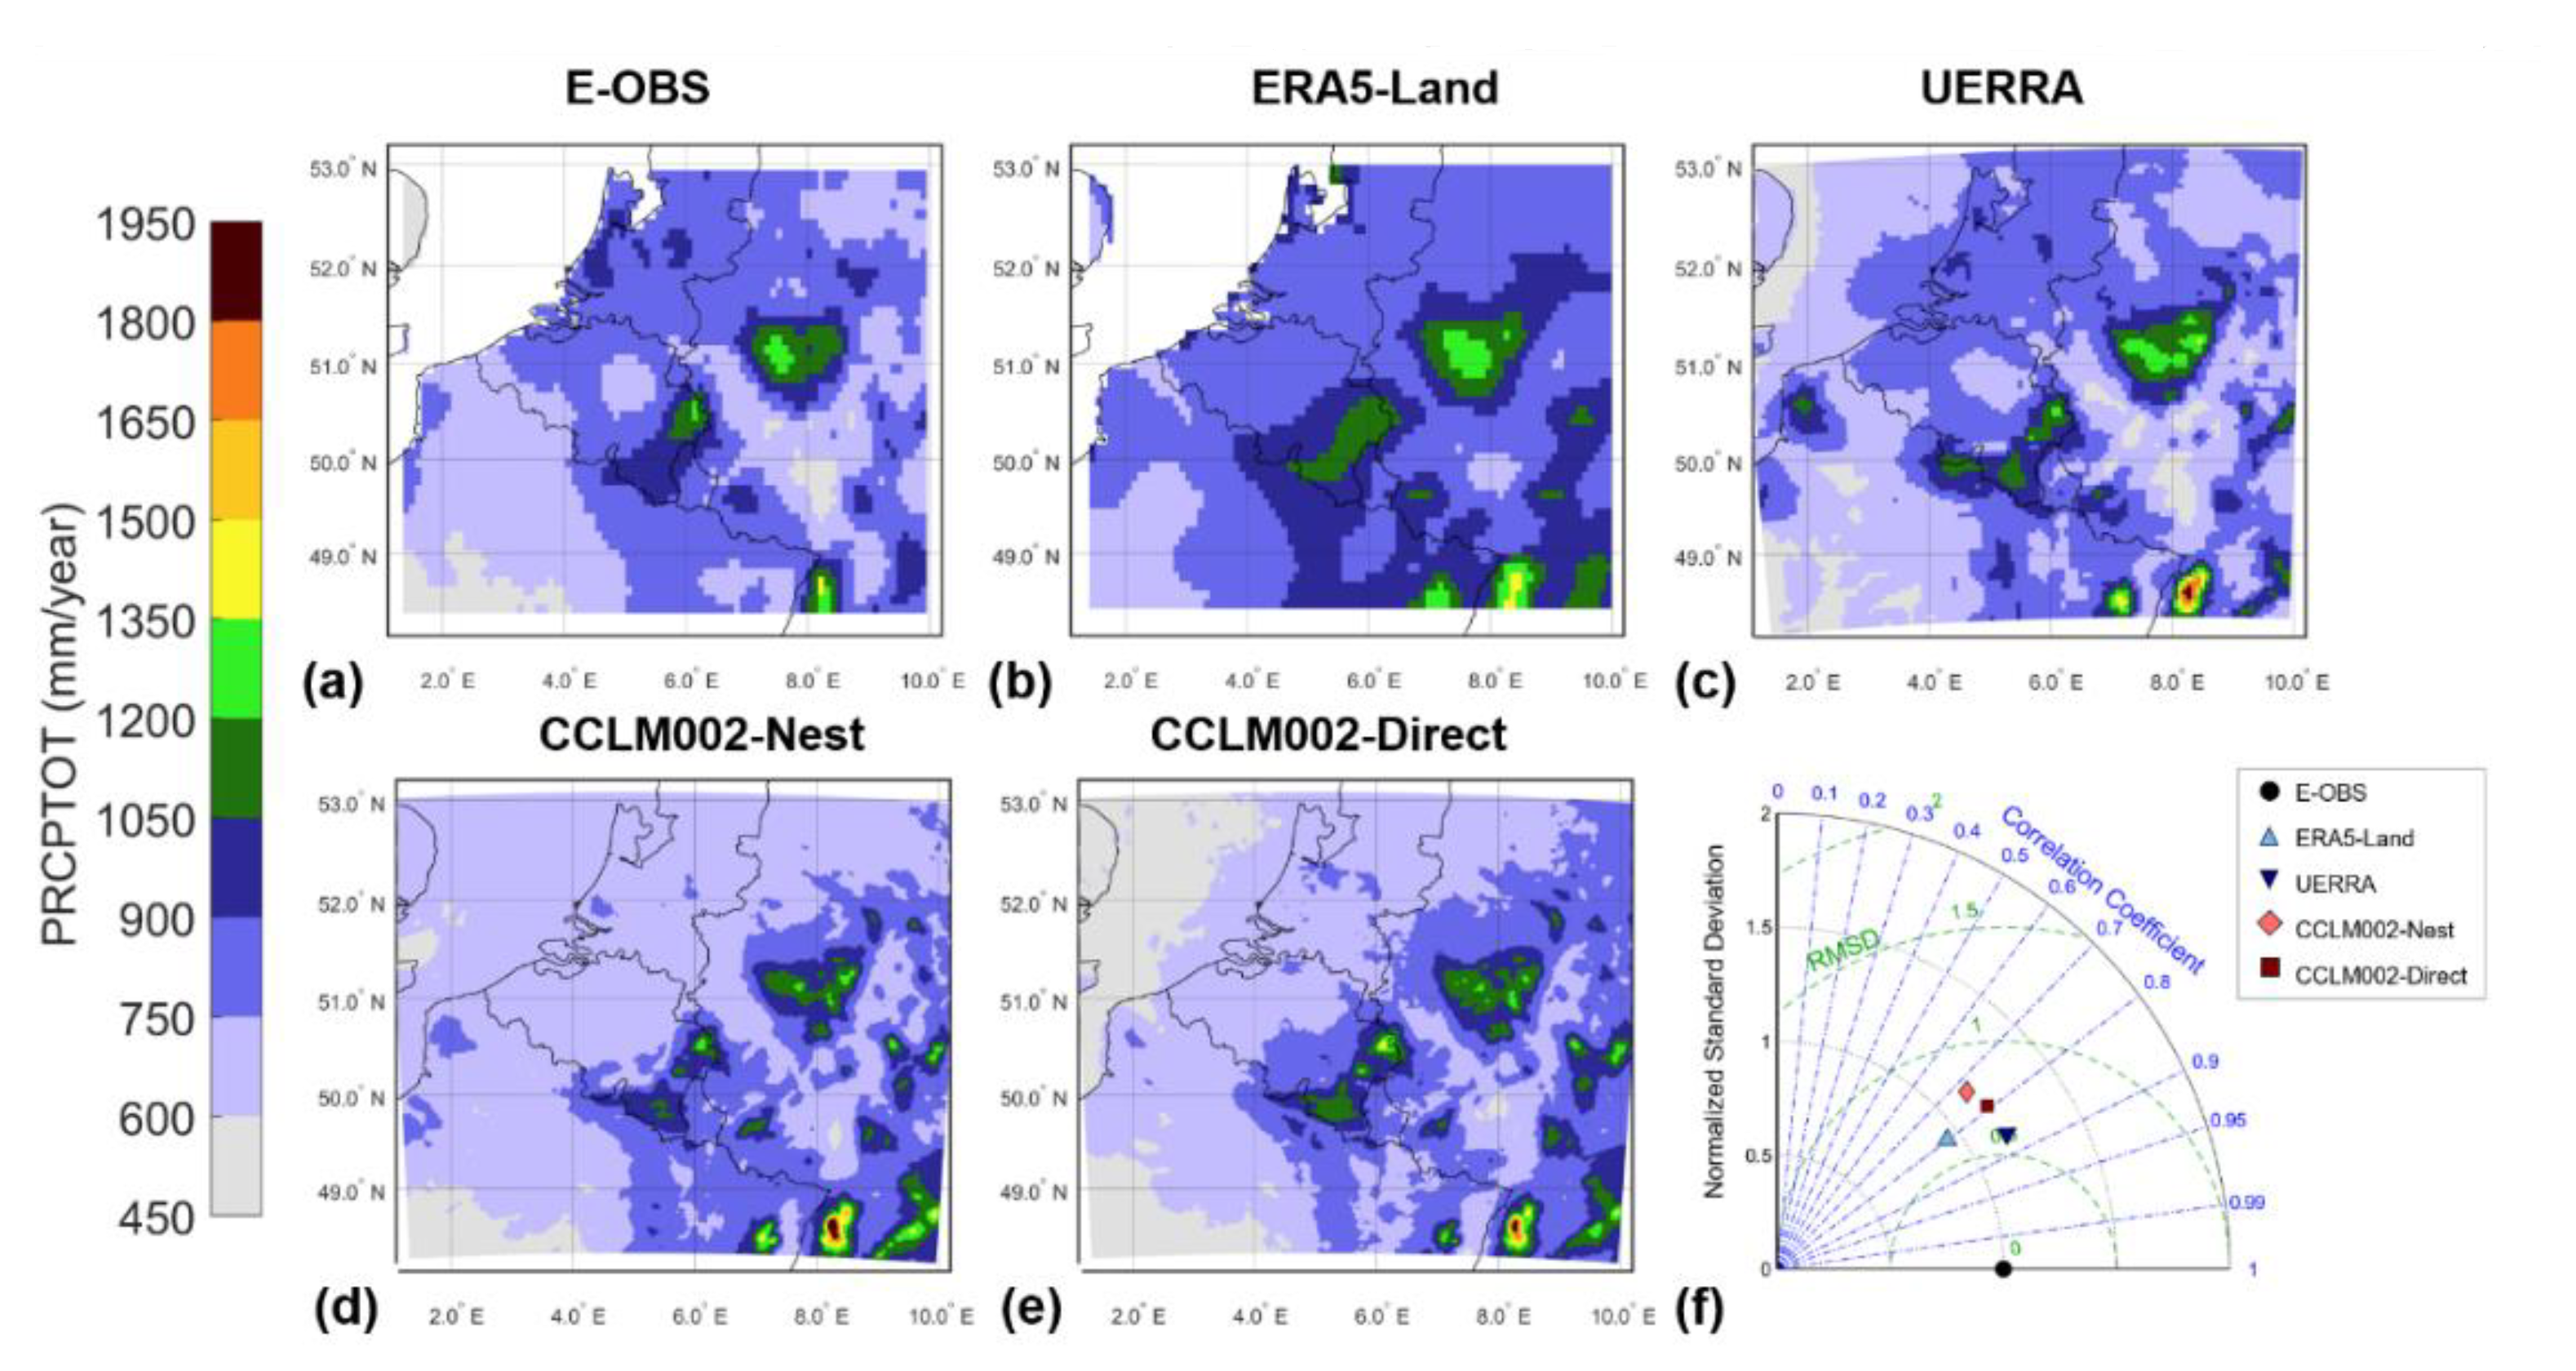
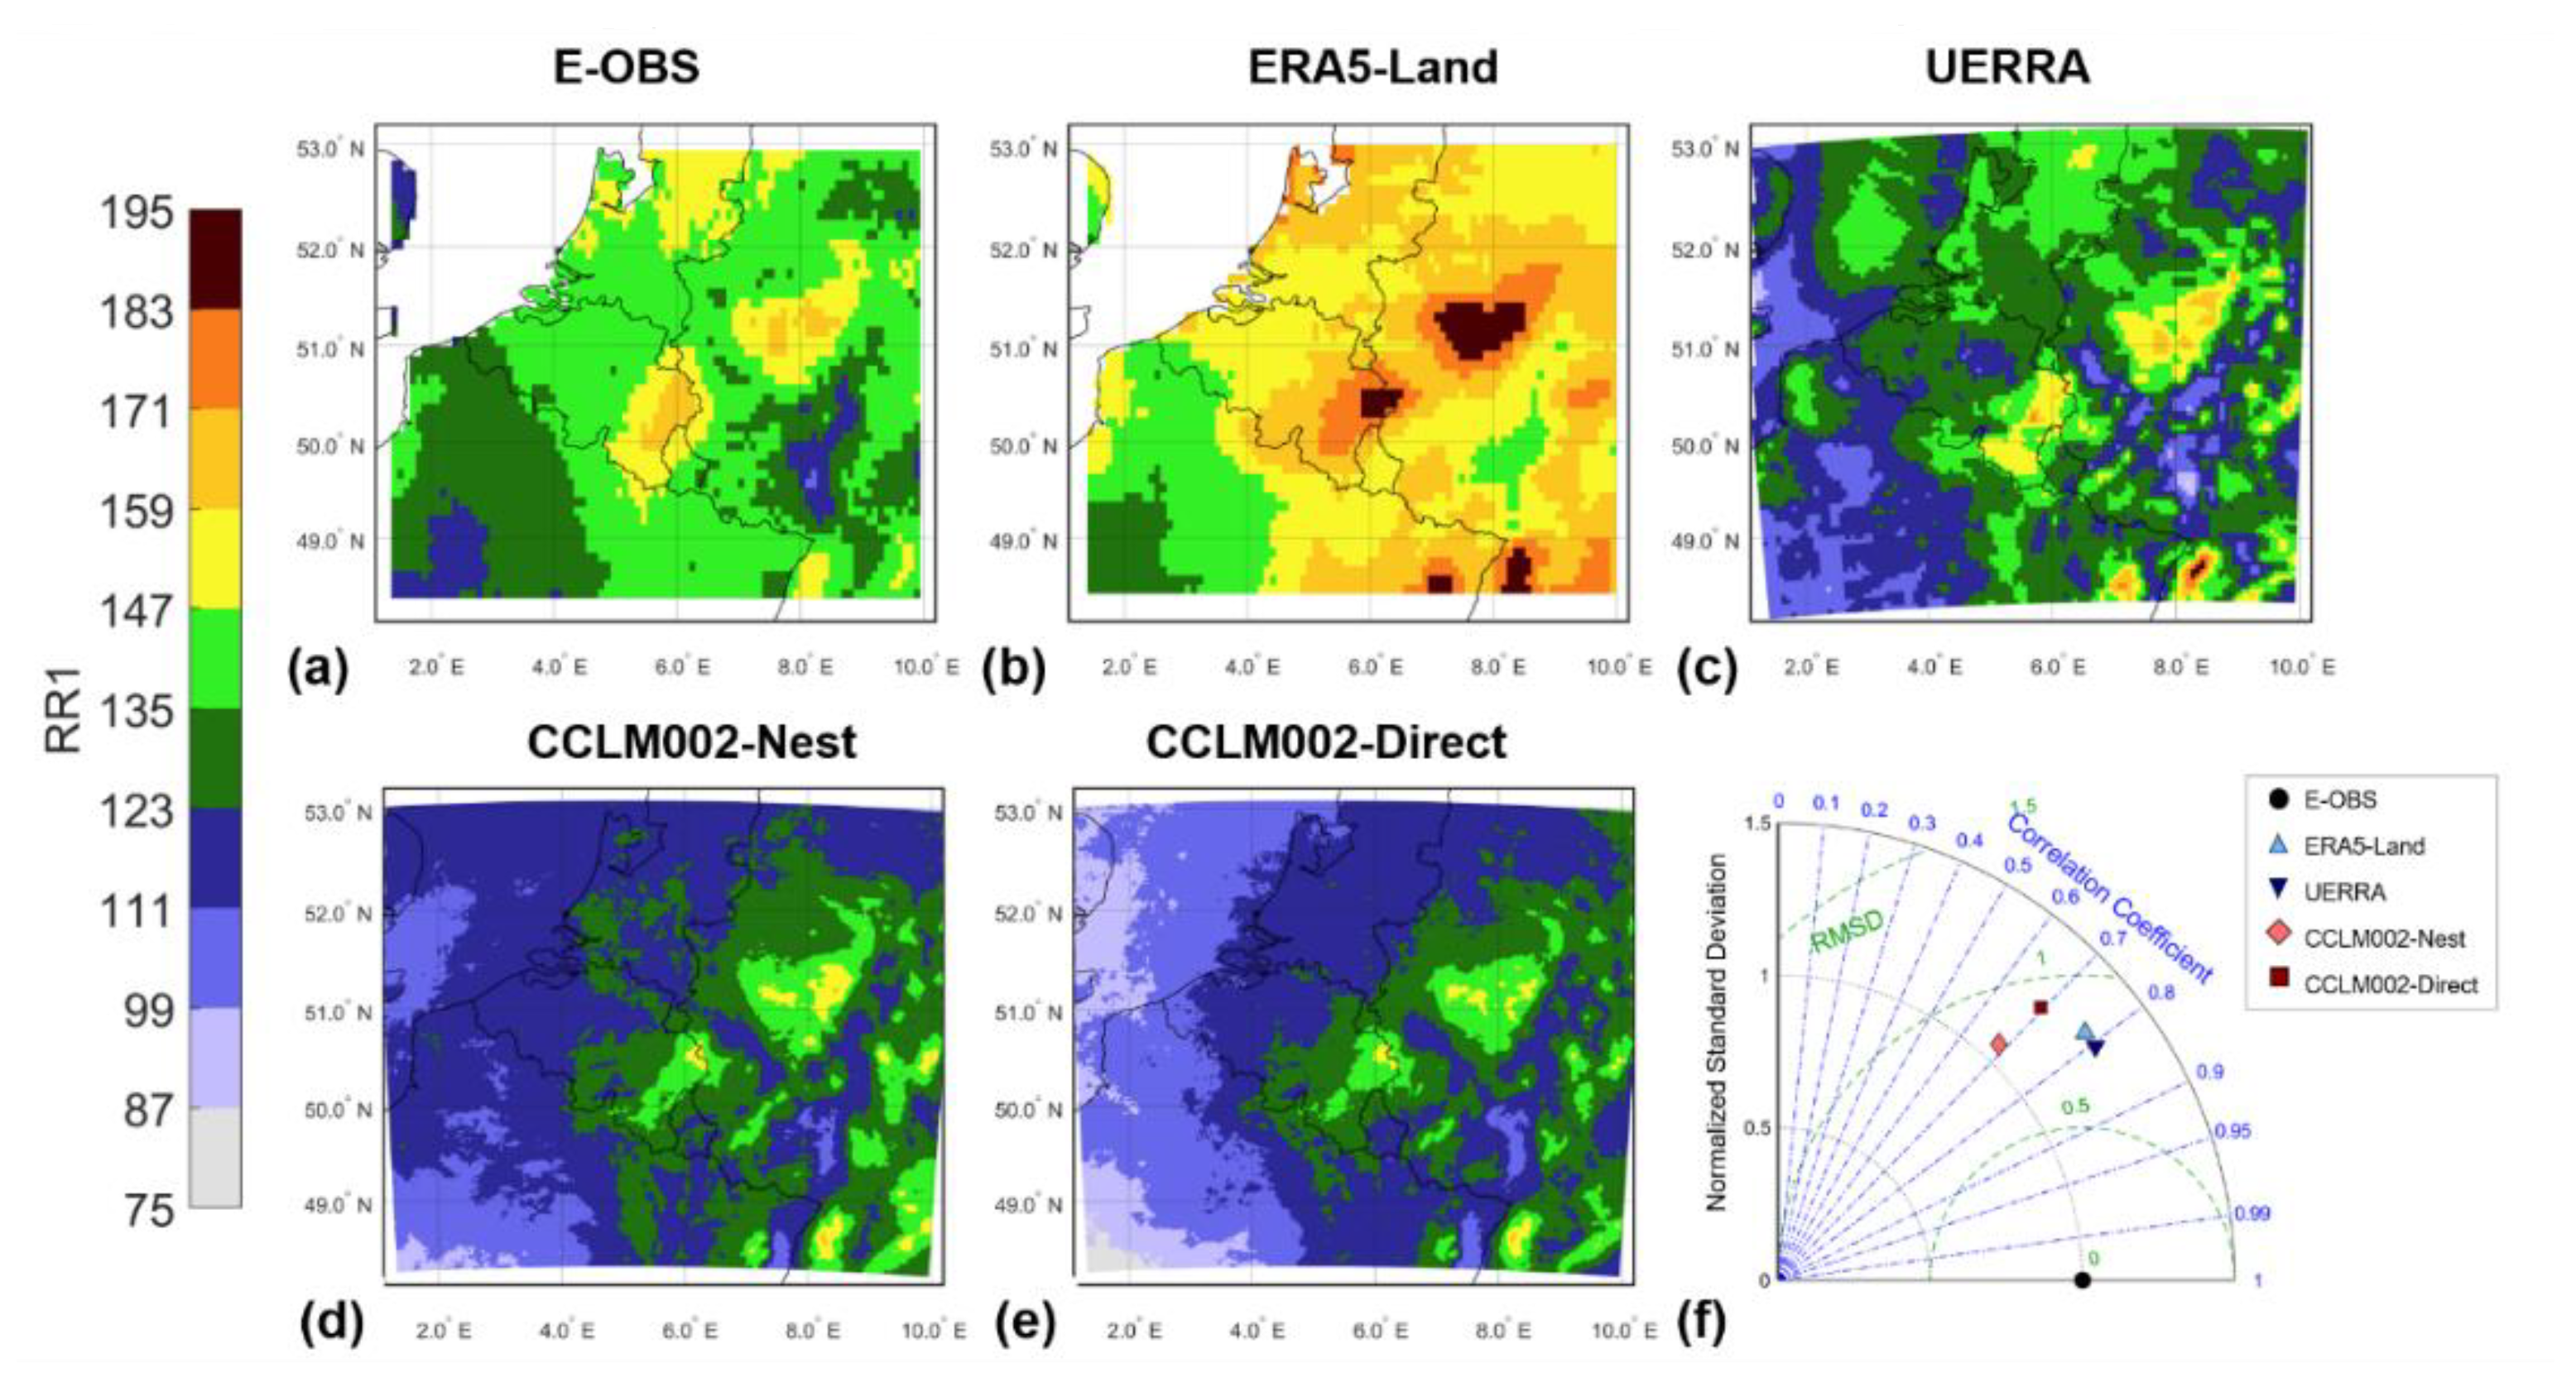
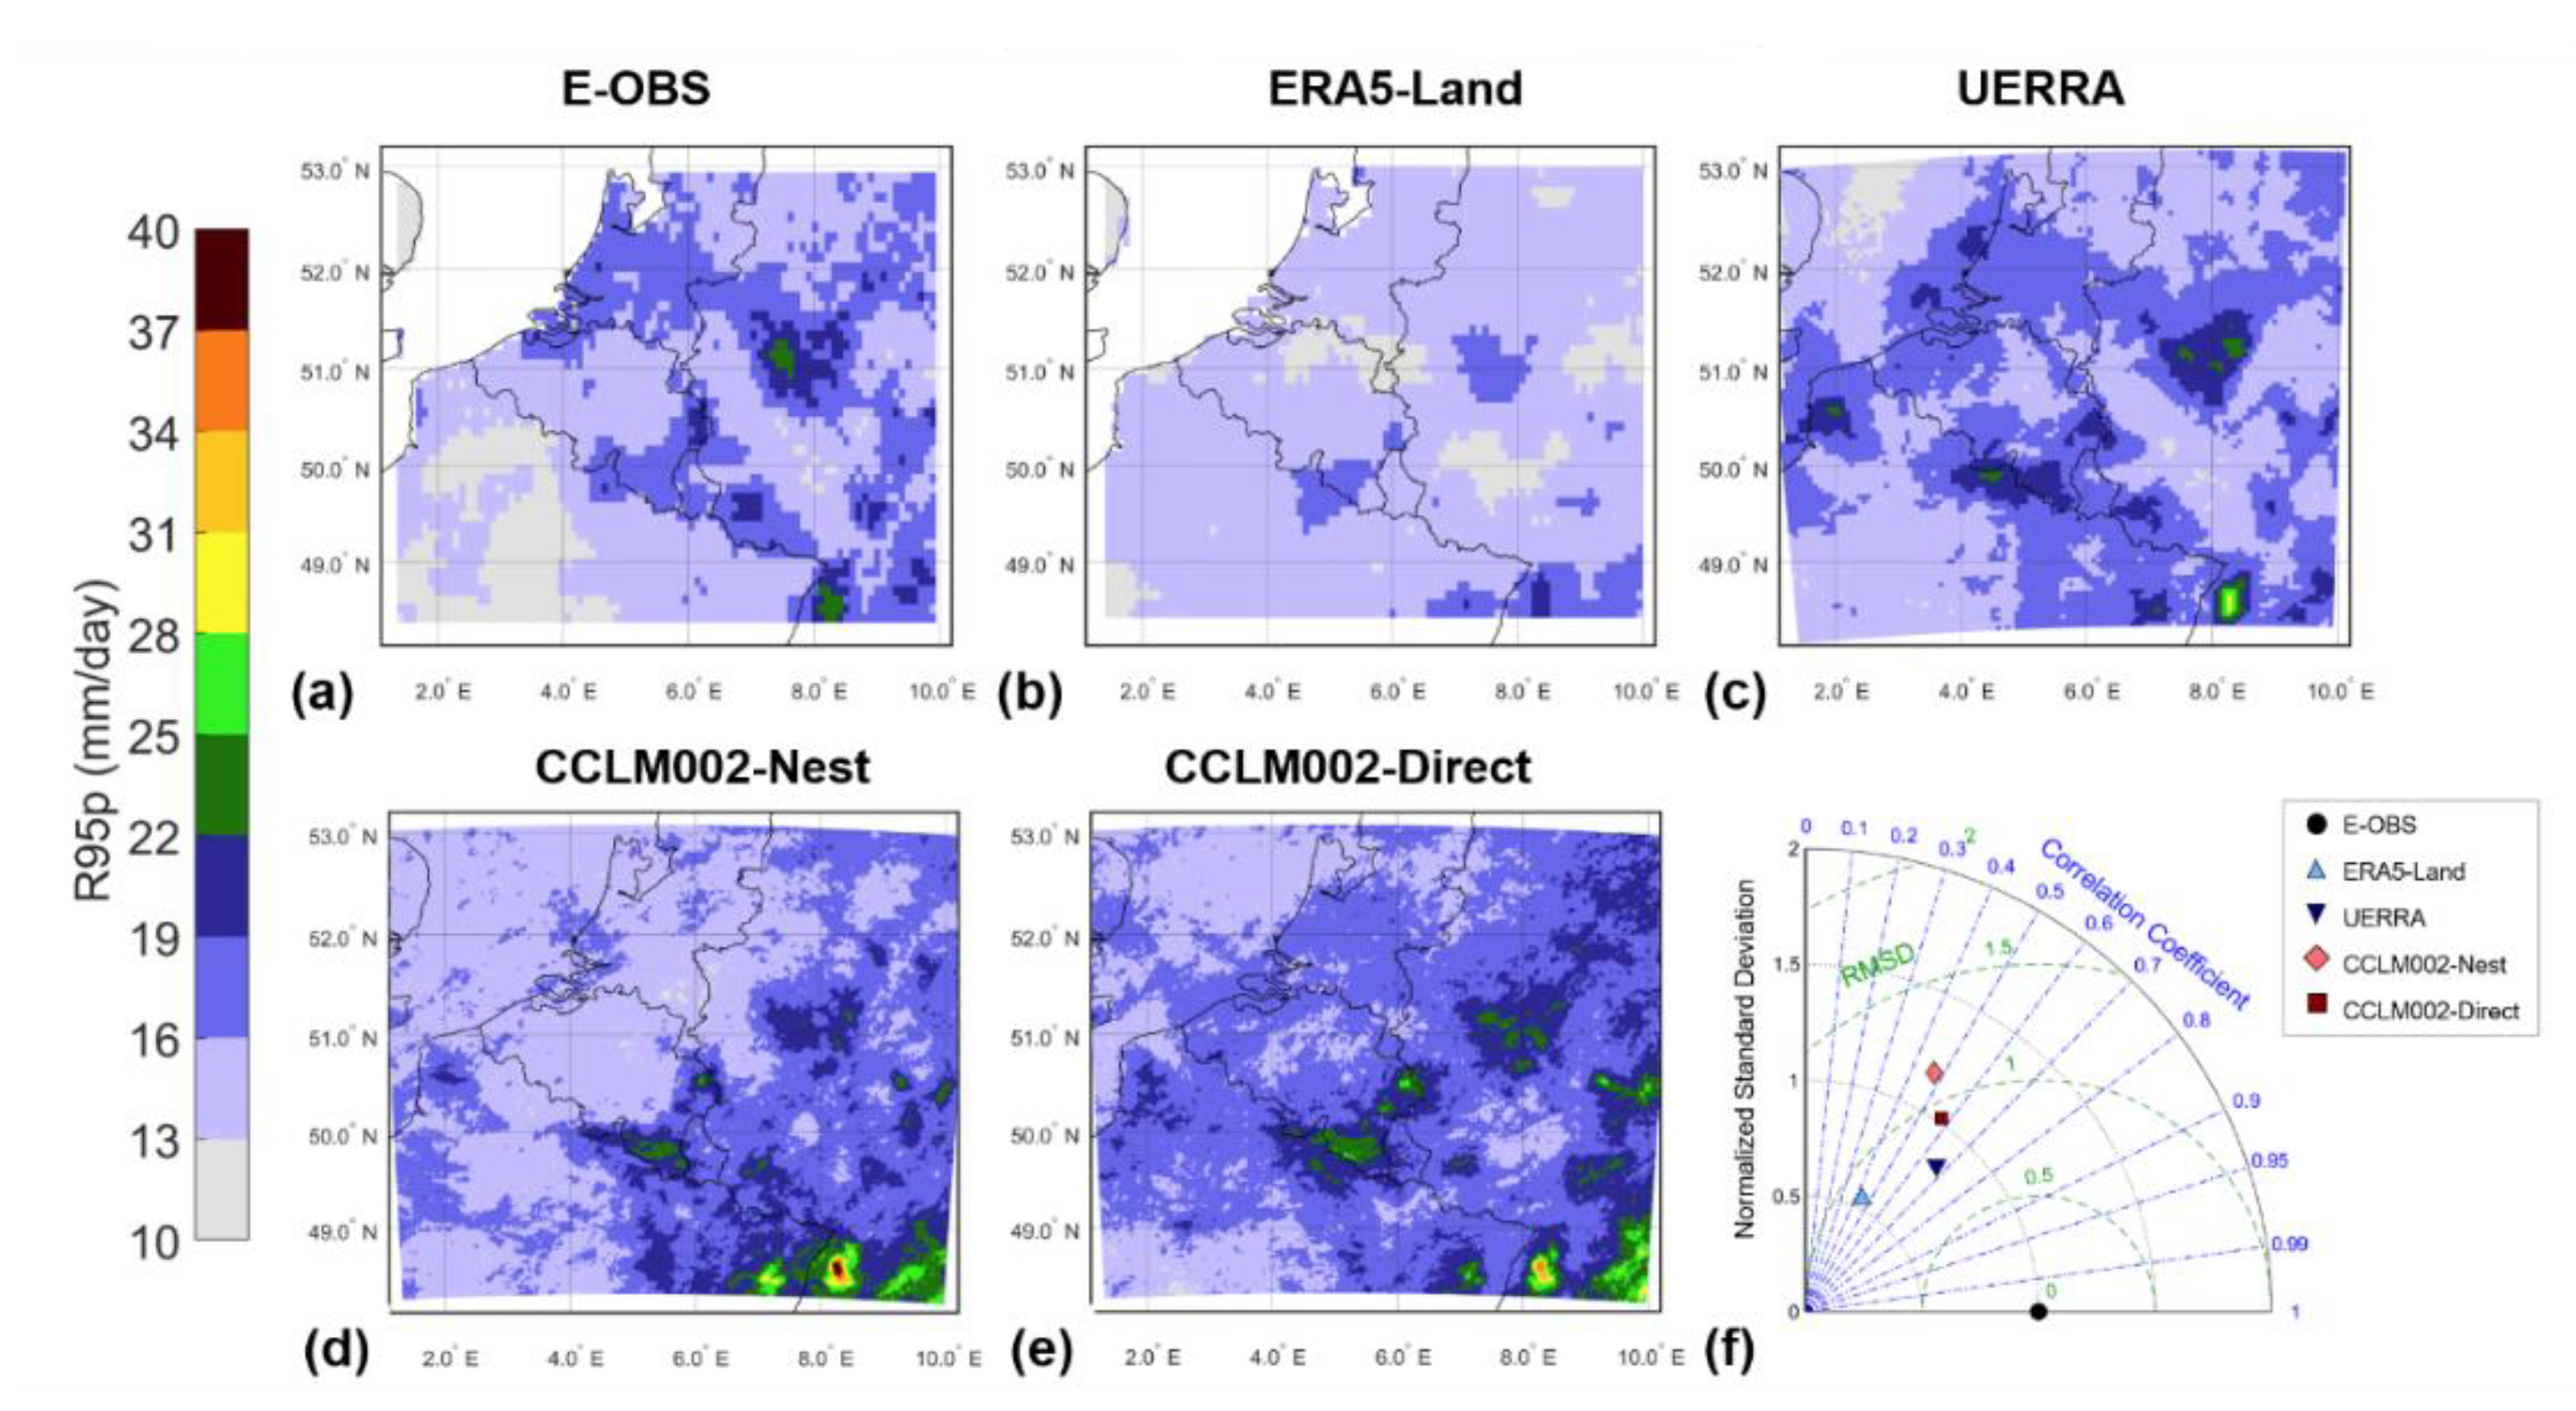
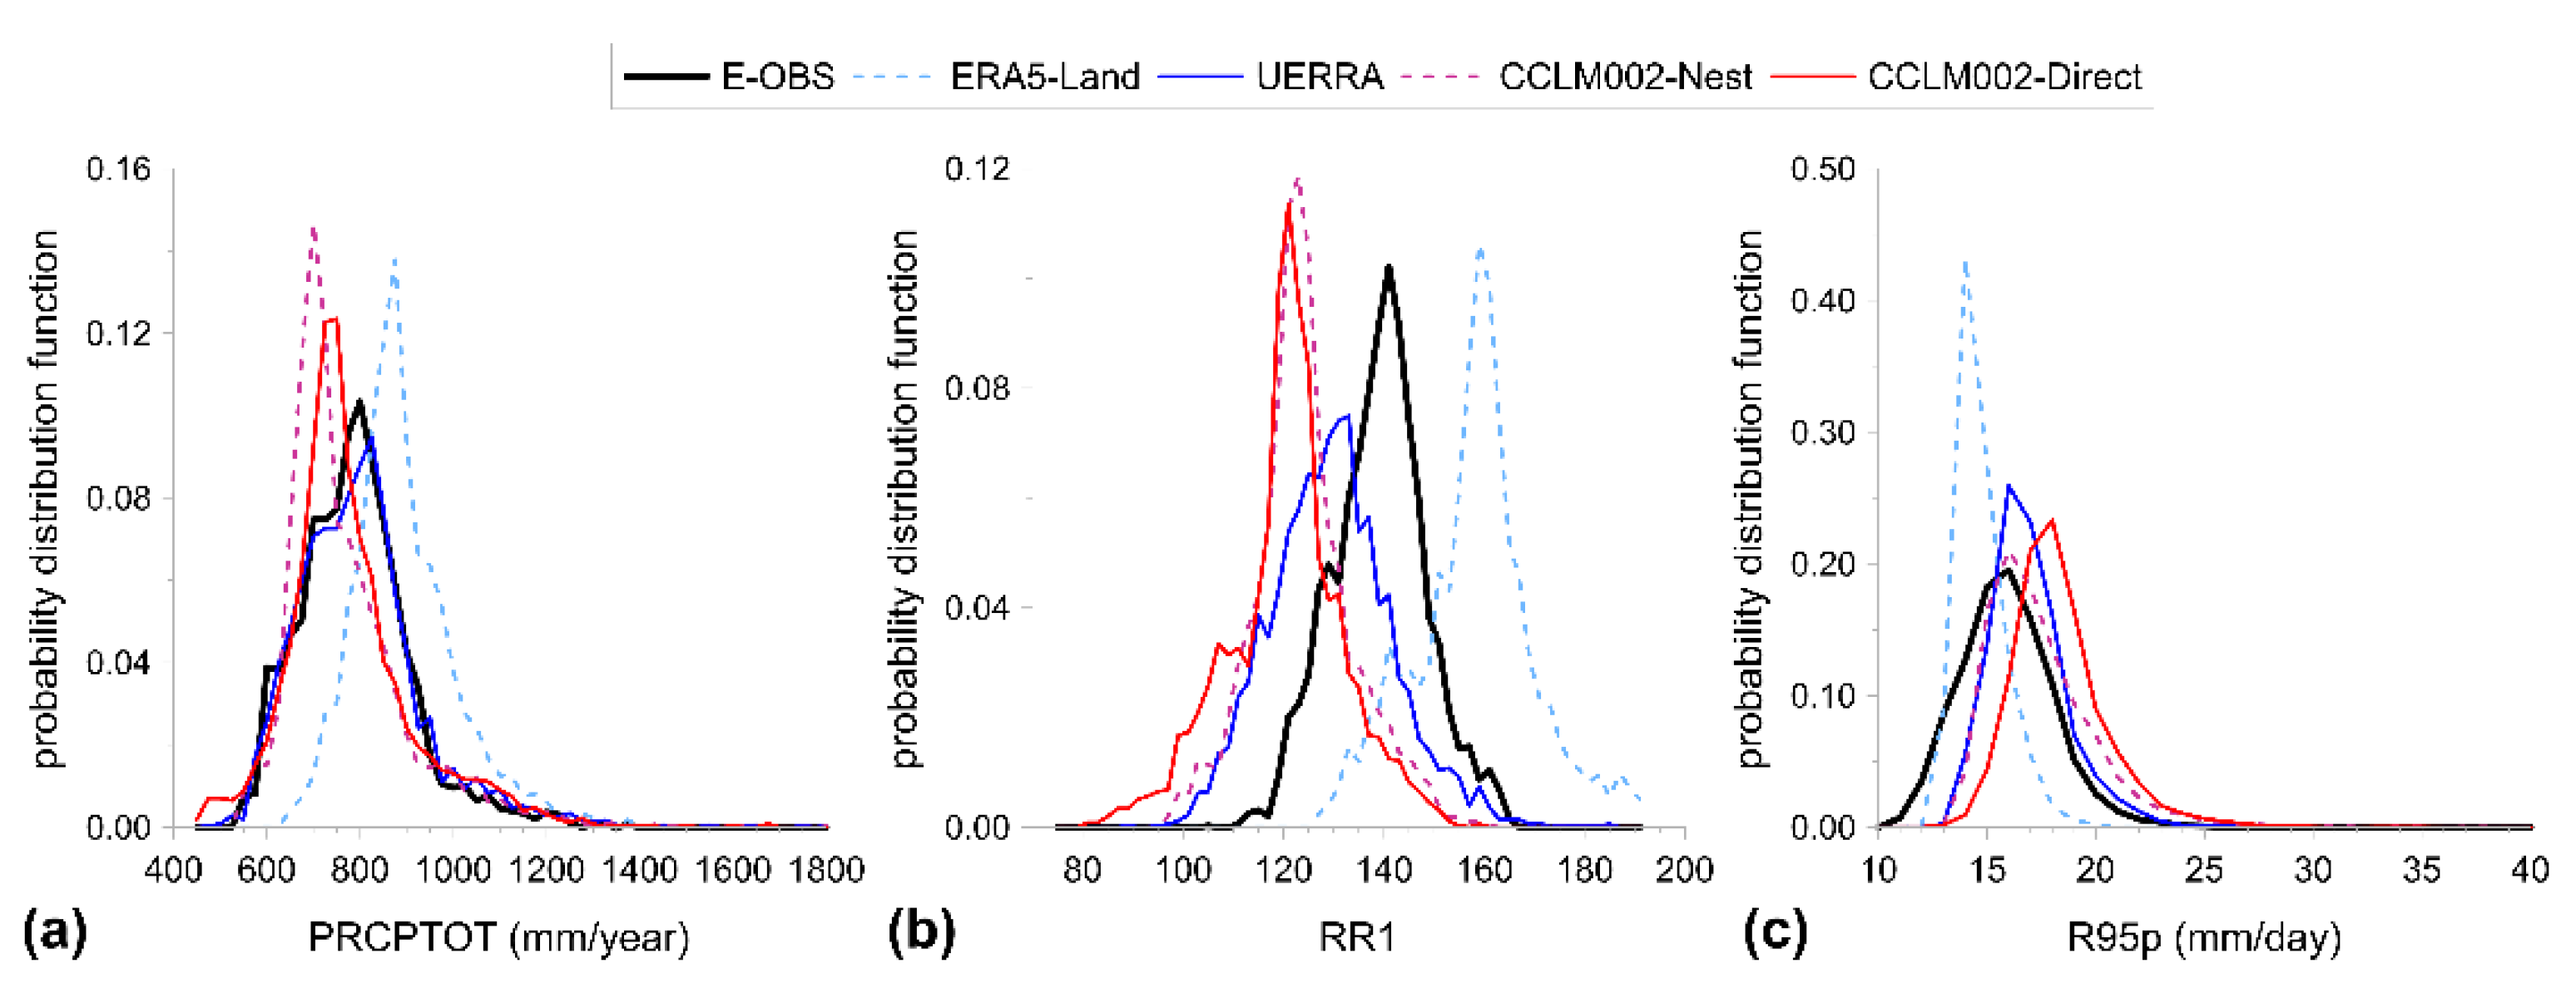
3.1. First Level of Analysis: Evaluation at Areal Scale

In the first level of analysis, the CCLM002 experiments are evaluated with respect to the E-OBS observational dataset and to the existing reanalysis products (i.e., ERA5-Land and UERRA) in terms of spatial distribution of PRCPTOT, RR1, and R95p. Operatively, PRCPTOT and RR1 are calculated on a yearly base and then averaged over 2007–2011, while R95p is derived as a statistic over the whole investigated period.
Figure 4, Figure 5, Figure 6 show the spatial distribution of PRCPTOT, RR1, and R95p with the relative normalized Taylor diagrams. In these representations, the maps are plotted considering all the grid points belonging to the evaluation domain in their native resolution (4089, 4089, 11484, and 69360 grid points for E-OBS, ERA5-Land, UERRA, and CCLM002 both direct and nested, respectively). Such an approach should penalize more a coarser resolved model (featuring a smaller spatial variability per construction); however, it aims at highlighting the actual spatial variability at a finer scale. Regarding the statistics for Taylor diagrams, they are instead obtained by processing data interpolated onto a common grid (i.e., the E-OBS grid).
As regards PRCPTOT (Figure 4), E-OBS (Figure 4a) returns values with a spatial average of 775 mm/year and a standard deviation of 120 mm/year. Compared to E-OBS, CCLM002-Nest (Figure 4d) and CCLM002-Direct (Figure 4e) result in values comparable in terms of spatial averages (743 mm/year and 740 mm/year, respectively) with a higher spatial variability (standard deviation = 134 mm/year for CCLM002-Nest; standard deviation = 145 mm/year for CCLM002-Direct), due to the spatial resolution refinement. Regarding the other reanalyses, UERRA (Figure 4c) further highlights the effect of spatial resolution returning a spatial average (~770 mm/year) and a variability (standard deviation = 138 mm/year) in line with CCLM002 experiments. On the other side, ERA5-Land (Figure 4b) overestimates the spatial average of PRCPTOT (~880 mm/year) with respect to the other cases, reducing the spatial variability to values (standard deviation = 114 mm/year) in line with E-OBS. The Taylor diagram (Figure 4f) places the CCLM002-Direct on the same level of the other considered reanalyses. It outperforms the CCLM002-Nest in terms of correlation and RMSD for PRCPTOT. As compared to UERRA and ERA5-Land, CCLM002-Direct returns similar performance as ERA5-Land while slightly worse than UERRA.
As concerns RR1 (Figure 5), E-OBS (Figure 5a) highlights lower values over the southwestern part of the domain, with values ranging between 110 and 135 days/year, and higher values over the northcentral part, with values up to 170 days/year. Compared to E-OBS, CCLM002-Nest (Figure 5d), and CCLM002-Direct (Figure 5e) return a much drier pattern, with values ranging between 85 and 125 days/year over the southwestern part of the domain, and between 125 and 160 days/year over the northcentral part. In this case, the CCLM002 experiments are quite similar in performance. Regarding the other reanalyses, UERRA (Figure 5c) shows a drier spatial distribution in line with CCLM002 experiments. On the other side, ERA5-Land (Figure 5b) highlights a wetter spatial distribution, also with respect to E-OBS, with values up to 195 days/year over the northcentral part. By looking at the Taylor diagram (Figure 5f), all the datasets feature higher variability than E-OBS. In terms of correlation, UERRA and ERA5-Land (correlation = ~0.8) slightly outperforms CCLM002 experiments (correlation = ~0.7).
Moving to R95p (Figure 6), E-OBS (Figure 6a) returns values with a spatial average of 15.4 mm/day and a standard deviation of 2.11 mm/day. A generalized increase in R95p is detected from coarser to finer resolution with the spatial averages varying between 14.2 mm/day for ERA5-Land (Figure 6b) and 17.5 mm/day for CCLM002-Direct (Figure 6e). If ERA5-Land overestimates PRCPTOT, it underestimates R95p across the evaluation domain (Figure 6b) with respect to E-OBS (Figure 6a) with a reduced variability (standard deviation = 1.17 mm/day). By looking at the Taylor diagram (Figure 6f), the variability increases with the refinement of resolution. In terms of correlation, UERRA and CCLM002-Direct present a higher correlation (~ 0.7 and ~ 0.6, respectively) with respect to ERA5-Land and CCLM002-Nest (~ 0.5). Finally, for the root-mean-square deviation RMSD, it varies between 0.5 and 1 for CCLM002-Direct, UERRA and ERA5-Land while it is > 1 for CCLM002-Nest.
To objectively rank the performances of CCLM experiments with respect to the other reanalysis products, the Probability Distribution Function (Figure 7) of PRCPTOT, RR1, and R95p are elaborated in terms of DAV score (Equation (2)) and reported in Table 3. For this elaboration, the same interpolated data as for Taylor diagrams are considered. The DAV is computed for each indicator by first comparing ERA5-Land, taken as lr, to CCLM002 experiments, taken as hr, and then comparing UERRA, assumed as lr, to CCLM002 experiments, assumed as hr.
Moving from ERA5-Land (about 9 km of resolution) to CCLM002 (about 2.2 km of resolution), both investigated nesting strategies point out an added value. In general, CCLM002-Nest outperforms CCLM002-Direct for RR1 (~+19 % against ~+4 %) and R95p (~+28 % against ~+4 %), whereas an opposite behaviour is returned in terms of PRCPTOT (~+29 % against ~+38 %).
Comparing CCLM002 experiments to UERRA (about 5.5 km of resolution), such an added value vanishes as UERRA outperforms CCLM002. Such an outperformance is relevant for RR1 (~−34 % for Nest and ~−42 % for Direct); it is instead attenuated for PRCPTOT (~−18 % for Nest and ~−12 % for Direct). Regarding R95p, an opposite tendency emerges as CCLM002-Nest shows a slight added value (~+2 %) while CCLM002-Direct returns a negative added value (~−29 %).

3.2. Second Level of Analysis: Evaluation at City Scale

A focused analysis is performed at city scale over the city of Paris (FR) and Cologne (DE) to evaluate the ability of downscaled reanalysis in reproducing precipitation amounts and precipitation occurrences with respect to observation reference. To this aim, Figure 8 and Figure 9 respectively plot the multi-year cycles of monthly precipitation (PRCPTOT, Figure 8a and Figure 9a) and monthly number of wet days (RR1, Figure 8b and Figure 9b), for the city of Paris and Cologne (Table 4).
From an operational viewpoint, the mean annual cycles of monthly precipitation and monthly number of wet days are averaged over the city domain (Figure 3b) to obtain a single time series. It is noteworthy to remark that E-OBS surely represents a consolidated reference for Germany cities as they are widely covered by the ECA&D network station; the same is not for the French cities for which the available observed data are more limited [62,63].
In this perspective, the uncertainty in observational dataset is highlighted by comparing E-OBS data with high resolution observations data (i.e., SAFRAN [64] for Paris and RAKDLIM-RW for Cologne). Such a comparison confirms the reliability of E-OBS for a Germany city (e.g., Cologne) while slight differences arise for a French city (i.e., Paris).
To objectively assess the performances of the different datasets, the Kling–Gupta Efficiency (KGE) index is calculated for monthly PRCPTOT and monthly RR1 over Paris and Cologne, assuming E-OBS as reference, and reported in Table 5.
Regarding the city of Paris (Figure 8), E-OBS monthly precipitation (Figure 8a) varies between 20 and 60 mm/month with maximum value in August. In terms of monthly number of wet days (Figure 8b), the evolution follows the same temporal pattern of monthly precipitation with values ranging between 6 and 14 number of wet days for month. In this case, the maximum value is recorded in November. Compared to E-OBS, CCLM002-Direct lowers monthly precipitation (Figure 8a) in the summer period (June, July, and August); on the other side, CCLM002-Nest reduces monthly precipitation (Figure 8a) in the summer period, returning a remarkable peak in November (~80 mm/day). In terms of number of monthly wet days (Figure 8b), both CCLM002 experiments show substantially lower values in the summer and in the early fall (values between 6 and 8 number of wet days for month). Furthermore, in this case, the CCLM002-Nest shows a peak in November. Regarding the other reanalyses, UERRA provides the more consistent evolution with respect to E-OBS as for monthly precipitation (Figure 8a) as for monthly number of wet days (Figure 8b). Finally, ERA5-Land overestimates both indicators; specifically, the overestimation is slight for monthly precipitation (Figure 8a) in June, November, and December, while it is remarkable in terms of monthly number of wet days (Figure 8b) from March to July.
The KGE index (Table 5) confirms how UERRA is for Paris the most reliable dataset (KGE = ~0.95 for monthly PRCPTOT and KGE = ~0.89 for monthly RR1); on the other side, ERA5-Land and CCLM002-Direct return a similar score for PRCPTOT (~0.82 against ~0.78), while they differ in terms of monthly RR1 (~0.84 against ~0.72). Finally, CCLM002-Direct significantly outperforms CCLM002-Nest in both indicators.
Moving to the city of Cologne (Figure 9), E-OBS monthly precipitation (Figure 9a) ranges between 20 and 120 mm/month with the peak recorded in August. In terms of monthly number of wet days (Figure 9b), the values vary between 4 and 16 number of wet days for month, with maximum values in July and December. This time, CCLM002-Direct is able to correctly reproduce the observed evolution as for monthly precipitation (Figure 9a) as for monthly number of wet days (Figure 9b). Such an improvement is detectable in terms of KGE (Table 5, ~0.91 for monthly PRCPTOT and ~0.87 for monthly RR1). On the other side, CCLM002-Nest fails in detect precipitation in July and August; this is reflected in lower values of KGE (~0.52 for monthly PRCPTOT). Regarding the other reanalyses, UERRA (KGE = ~0.95 for monthly PRCPTOT and ~0.89 for monthly RR1) provide evolution in line with E-OBS and CCLM002-Direct; on the other side, ERA5-Land once again overestimates the monthly precipitation (except for the summer period) and the number of monthly wet days, returning a reduced performance with respect to CCLM002-Direct.

3.3. Third Level of Analysis: Evaluation at sCale of Event

The last section focuses on the evaluation of the experiments’ accuracy in spatializing and amounting different extremes precipitation events occurred during the investigated time span. To this aim, instead of E-OBS, the RADKLIM-RW dataset is assumed as reference for its finer spatial resolution. Such a dataset covers partially the evaluation domain (Figure 3) providing data for Germany and some surrounding areas.
Two summer events (labelled as “Event 1” and “Event 2”) featuring different dynamics are investigated: the former (Figure 10) occurred in August 2007 (20 August 2007 06:00 UTC–23 August 2007 06:00 UTC) is selected as the one involving most of the RADLIM-RW domain in terms of spatial distribution; the latter (Figure 11) occurred in August 2010 (25 August 2010 06:00 UTC–28 August 2010 06:00 UTC) is selected as the one characterized by the maximum observed peak of total accumulated precipitation (Figure 11a). Both events are analysed as performed in Coppola et al. [19] identifying a region of maximum precipitation as indicated by observations (i.e., specific area of interest), and calculating the hourly accumulated precipitation averaged over each box (Figure 12 and Figure 13 for the Event 1 and Event 2, respectively). Such an evaluation strategy is adopted to assess the timing and intensity of the events. To support the analysis, the KGE scores are computed and reported in Table 6 for hourly precipitation.
The Event 1 (Figure 10) involves the north-eastern part of the domain (Figure 10a) with total accumulated precipitation ranging between 35 mm and 95 mm. The spatial distribution of this event is well recognized by CCLM002-Direct (Figure 10e, spatial correlation = 0.56), ERA-Land (Figure 10b, spatial correlation = 0.68) and UERRA (Figure 10c, spatial correlation = 0.85), even if ERA5-Land returns lower values of total accumulated precipitation. Finally, CCLM002-Nest (Figure 10d) fails in spatializing this event (spatial correlation = −0.05).
By looking at the selected specific area of interest (Figure 10), Figure 12 plots the evolutions of hourly accumulated precipitation returned by each dataset. It is noteworthy to remark that all the time-series start from 06:00 UTC to ensure a consistency between UERRA and the other datasets, as well as that UERRA is reported as a step plot since it provides only daily information.
CCLM002-Direct well detects timing and intensity of the event. On the contrary, ERA5-Land identifies the observed timing, but it fails in terms of intensity returning an underestimation with respect to RADKLIM-RW. Regarding CCLM002-Nest, it fails both in timing and in intensity: it delays the activation of precipitation and underestimates the total accumulated amount in comparison with RADKLIM-RW. Finally, UERRA cannot be evaluated in terms of timing while it slightly overestimates the observed total accumulated precipitation.
The performances of datasets for the Event 1 are also synthetically examined by using the KGE index for hourly data (Table 6). The KGE indications reflect those returned by Figure 12: CCLM002-Direct outperforms the other datasets (KGE ~0.95). Conversely, CCLM002-Nest completely fails with KGE < 0.20. It is worth noting that for UERRA only a daily KGE estimate is possible (KGE ~ 0.83) and that such a value would hint at a good performance of this dataset.
Regarding the Event 2 (Figure 11), it involves the northern part of the domain (Figure 11a) with total accumulated precipitation up to 160–170 mm. The spatial distribution of this event is well recognized by UERRA (Figure 11c, spatial correlation = 0.86), while ERA-Land (Figure 11b, spatial correlation = 0.26), CCLM002-Direct (Figure 11e, spatial correlation = 0.13), and CCLM002-Nest (Figure 11d, spatial correlation = 0.05) provide lower performances in this sense. In general, UERRA seems also to be the only dataset capable of reaching the observed peaks.
By looking at the selected specific area of interest (Figure 11a), Figure 13 plots the evolutions of hourly accumulated precipitation returned by each dataset. In terms of representation, the same remarks as for Figure 12 are valid.
This time, both ERA5-Land and CCLM002-Direct anticipate the accumulation, returning an underestimation in terms of total accumulated precipitation with respect to RADKLIM-RW. Conversely, UERRA overestimates the observed total accumulated precipitation (~90 mm for UERRA against ~70 mm for RADKLIM-RW). Finally, CCLM002-Nest is completely unsuitable in reproducing such an event.
By using also for the Events 2 the KGE index to synthetically highlighted the performances of datasets at hourly scale (Table 6) ERA5-Land and CCLM002-Direct return comparable performances according to this score index, while CCLM002-Nest returns even negative values of KGE. Furthermore, in this case, for UERRA only a daily KGE estimate is possible (KGE ~0.88); such a value highlights how UERRA generally outperforms the other datasets for the event in hand.

4. Discussion and Conclusions

Recent projects and activities aimed at enhancing the horizontal resolution of Regional Climate Models (~1 to 3 km) is stimulating an open debate on the redefinition of simulation protocols. This topic is becoming relevant as at present the end-users request data more and more tailored for adaptation purposes and capable of reassessing past precipitation events up to the city scale. In this view, an issue is represented by the selection of the optimal nesting strategy for the dynamical downscaling of reanalysis.
Multiple dynamical downscaling might offer beneficial perspectives to achieve high-resolution regional climate simulations, although its use may have an impact on the quality of simulations. On one hand the nesting techniques are responsible for an important part of RCM bias [36], on the other since the integration scale of global models (e.g., GCMs, reanalysis) largely differ from convection permitting scale, a multiple nesting strategy is required to carry out such simulations. Moreover, do additional nesting steps tend to increase the computational cost. It is therefore of interest to investigate the impact of difference multiple nesting strategies on model performance.
This works tries to contribute on this issue by evaluating two downscaling experiments of ERA5 at the convection permitting scale (~2.2 km). These experiments differ for nesting strategies, testing a traditional two-step against a direct one-way nesting strategy. They have been evaluated in terms of precipitation at different spatial and temporal scales in comparison with observational datasets (i.e., E-OBS and RADKLIM-RW) and existing reanalysis products (i.e., ERA5-Land and UERRA).
Although the limited investigated period (2007–2011) and spatial coverage (part of the central Europe), the results of this work provide some preliminary insights for a more comprehensive ERA5 downscaling activity.
The two-step nested experiment (i.e., CCLM002-Nest) shows similar capabilities than the one-step nested experiment (i.e., CCLM002-Direct) when it is evaluated for climate statistics (e.g., PRCPTOT, RR1, and R95p in §3.1). Specifically, according to the Taylor diagram statistics and DAV evaluation, it is shown that CCLM002-Direct returns enhanced performances for PRCPTOT and deteriorated performances for RR1 with respect to CCLM002-Nest. On the other side, the same level of confidence cannot be achieved for R95p as the Taylor diagram statistics suggest that CCLM002-Direct outperforms CCLM002-Nest while the opposite is carried out in terms of DAV. An added value in general arises for both CCLM002 experiments with respect to ERA5-Land (Table 3); such an improvement vanishes when CCLM002 are compared to UERRA (Table 3). Indeed, UERRA seems to be in this work the optimal reference as it directly includes observations through a data assimilation procedure; however, this is not a general rule as it strictly depends on the investigated variables and spatial domains [65].
The reliability of CCLM002-Nest decreases when it is evaluated at the city (§3.2) and event scale (§3.3). In these cases, CCLM002-Direct outperforms CCLM002-Nest. Specifically, at the city scale, it provides coherent and reliable results capturing trend and peaks of monthly precipitation amounts and monthly number of wet days, also in comparison with ERA5-Land and UERRA (Table 5). On the other hand, at the event scale, CCLM002-Direct is able to recognize timing and intensity of the rainfall events (Figure 12 and Figure 13), while CCLM002-Nest completely fails in their detection.
Such a different behaviour is in line with previous works. Specifically, CCLM002-Nest is driven at the Lateral Boundary Condition (LBC) by a freely evolving (i.e., not nudged) intermediate simulation (i.e., CCLM011), which allows internal variability to develop [18]. For this reason, events at the meteorological scale (§3.3) and over a very limited area of interest (§3.2) could not be correlated with the ERA5 reanalysis. CCLM002-Nest has then a low probability to properly reproduce the right timing and intensity of localized heavy events. Such a tendency seems to be attenuated when CCLM002 is directly nested into ERA5. It is noticeable to stress that the results can be highly model and event dependent [19] and then the number of cities and events should be increased to obtain a comprehensive evaluation on this topic. For this reason, despite the dynamical downscaling of ERA5 at ~2km seems to be able to reproduce past precipitation dynamics reliably and coherently, a clear recommendation cannot be stated about at what extent may the direct nesting strategy performances be adequately for the scope in hand. In this perspective, this work, based on ERA5 reanalysis, is in line with previous experiences on this topic [36,37,38,39], showing anyway a neutral or improved performance of the finer simulation when such an intermediate step is avoided.
Then, in general, it seems that the selection of the most appropriate nesting strategy depends mainly on the goals for which the data are produced (i.e., climate statistics and event-based analysis). This should be taken in mind when a new downscaling activity targeted to past climate is scheduled. Definitively, this work should be regarded as the first step of a deeper analysis, where more cases will be considered, especially including a large number of investigated cities and areas of analysis and a longer period of simulations.

Author Contributions

Methodology, all the authors; Software Analysis, M.R.; Data Curation, M.R., A.R., and M.A.; Writing—Original Draft preparation, M.R. and A.R.; Writing—Review and Editing, M.A., and P.M.; Visualization, M.R. and M.A.; Supervision, P.M. All authors have read and agreed to the published version of the manuscript.

Funding

This research received no external funding.

Data Availability Statement

Data and methods used in the research have been presented in sufficient detail in the paper

Acknowledgments

The experiments have been performed using the COSMO model in CLimate Mode (COSMO-CLM). COSMO-CLM is the community model of the German regional climate re­search jointly further developed by the CLM-Community. We acknowledge the members of the community for their common efforts to envelop the model and to find right set ups. ERA5-Land and UERRA data have been generated using Copernicus Climate Change Service Information and downloaded from the C3S CDS. We are also grateful to the E-OBS dataset from the EU-FP6 project UERRA (http://www.uerra.eu) and the Copernicus Climate Change Service, and the data providers in the ECA&D project (https://www.ecad.eu). The authors are grateful to DWD for providing open access RADKLIM-RW data and Météo-France for providing the SAFRAN dataset.

Conflicts of Interest

The authors declare no conflict of interest.

References

  1. Sillmann, J.; Thorarinsdottir, T.; Keenlyside, N.; Schaller, N.; Alexander, L.V.; Hegerl, G.; Seneviratne, S.I.; Vautard, R.; Zhang, X.; Zwiers, F.W. Understanding, modeling and predicting weather and climate extremes: Challenges and opportunities. Weather Clim. Extrem. 2017, 18, 65–74. [Google Scholar] [CrossRef]
  2. Robock, A.; Turco, R.; Harwell, M.; Ackerman, T.P.; Andressen, R.; Chang, H.S.; Sivakumar, M.V.K. Use of general circulation model output in the creation of climate change scenarios for impact analysis. Clim. Chang. 1993, 23, 293–335. [Google Scholar] [CrossRef]
  3. Giorgi, F.; Jones, C.; Asrar, G.R. Addressing Climate Information Needs at the Regional Level: The CORDEX Framework. World Meteorol. Organ. Bull. 2009, 58, 175–183. [Google Scholar]
  4. Fowler, H.J.; Blenkinsop, S.; Tebaldi, C. Linking climate change modelling to impacts studies: Recent advances in downscaling techniques for hydrological modelling. Int. J. Climatol. 2007, 27, 1547–1578. [Google Scholar] [CrossRef]
  5. Reder, A.; Rianna, G.; Vezzoli, R.; Mercogliano, P. Assessment of possible impacts of climate change on the hydrological regimes of different regions in China. Adv. Clim. Chang. Res. 2016, 7, 169–184. [Google Scholar] [CrossRef]
  6. Rianna, G.; Reder, A.; Pagano, L.; Mercogliano, P. Assessing future variations in landslide occurrence due to climate changes: Insights from an Italian test case. In Geotechnical Research for Land Protection and Development: Proceedings of CNRIG 2019; Calvetti, F., Cotecchia, F., Galli, A., Jommi, C., Eds.; Springer International Publishing: New York, NY, USA, 2020; Volume 40, pp. 255–264. [Google Scholar] [CrossRef]
  7. Adinolfi, M.; Rianna, G.; Mercogliano, P.; Maiorano, R.M.S.; Aversa, S. Behaviour of energy piles under climate-change scenarios: A case study in Southern Italy. Environ. Geotech. 2020, 4, 1–15. [Google Scholar] [CrossRef]
  8. Cucchi, M.; Weedon, G.P.; Amici, A.; Bellouin, N.; Lange, S.; Schmied, H.M.; Hersbach, H.; Buontempo, C. WFDE5: Bias Adjusted ERA5 Reanalysis Data for Impact Studies. Earth Syst. Sci. Data 2020, 12, 2097–2120. [Google Scholar] [CrossRef]
  9. Hackenbruch, J.; Schadler, G.; Schipper, J.W. Added value of high-resolution regional climate simulations for regional impact studies. Meteorol. Z. 2016, 25, 291–304. [Google Scholar] [CrossRef]
  10. Mearns, L.O.; Lettenmaier, D.P.; McGinnis, S. Uses of results of regional climate model experiments for impacts and adaptation studies: The example of NARCCAP. Curr. Clim. Chang. Rep. 2015, 1, 1–9. [Google Scholar] [CrossRef] [Green Version]
  11. Reder, A.; Rianna, G. Exploring ERA5 reanalysis potentialities for supporting landslide investigations: A test case from Campania Region (Southern Italy). Landslides 2021. [Google Scholar] [CrossRef]
  12. Montesarchio, M.; Zollo, A.L.; Bucchignani, E.; Mercogliano, P.; Castellari, S. Performance evaluation of high-resolution regional climate simulations in the Alpine space and analysis of extreme events. J. Geophys. Res. Atmos. 2014, 119, 3222–3237. [Google Scholar] [CrossRef]
  13. Dosio, A.; Panitz, H.J.; Schubert-Frisius, M.; Luthi, D. Dynamical downscaling of CMIP5 global circulation models over CORDEX-Africa with COSMO-CLM: Evaluation over the present climate and analysis of the added value. Clim. Dyn. 2015, 44, 2637–2661. [Google Scholar] [CrossRef] [Green Version]
  14. Feldmann, H.; Früh, B.; Schädler, G.; Panitz, H.J.; Keuler, K.; Jacob, D.; Lorenz, P. Evaluation of the precipitation for South-western Germany from high resolution simulations with regional climate models. Meteorol. Z. 2008, 17, 455–465. [Google Scholar] [CrossRef]
  15. Hersbach, H.; Bell, B.; Berrisford, P.; Hirahara, S. The ERA5 global reanalysis. Q. J. R. Meteorol. Soc. 2020, 146, 1999–2049. [Google Scholar] [CrossRef]
  16. Dee, D.P.; Uppala, S.M.; Simmons, A.J.; Berrisford, P.; Poli, P.; Kobayashi, S.; Andrae, U.; Balmaseda, M.A.; Balsamo, G.; Bauer, P.; et al. The ERA-Interim reanalysis: Configuration and performance of the data assimilation system. Q. J. R. Meteorol. Soc. 2011, 137, 553–597. [Google Scholar] [CrossRef]
  17. Ban, N.; Schmidli, J.; Schär, C. Evaluation of the new convective-resolving regional climate modelling approach in decade-long simulations. J. Geophys. Res. Atmos. 2014, 119, 7889–7907. [Google Scholar] [CrossRef]
  18. Berthou, S.; Kendon, E.J.; Chan, S.C.; Ban, N.; Leutwyler, D.; Schär, C.; Fosser, G. Pan-European climate at convection-permitting scale: A model intercomparison study. Clim. Dyn. 2018, 5, 1–25. [Google Scholar] [CrossRef] [Green Version]
  19. Coppola, E.; Sobolowski, S.; Pichelli, E.; Raffaele, F.; Ahrens, B.; Anders, I.; Ban, N.; Bastin, S.; Belda, M.; Belusic, D.; et al. A first-of-its-kind multi-model convection permitting ensemble for investigating convective phenomena over Europe and the Mediterranean. Clim. Dyn. 2020, 55, 3–34. [Google Scholar] [CrossRef]
  20. Fumière, Q.; Déqué, M.; Nuissier, O.; Somot, S.; Alias, A.; Caillaud, C.; Laurantin, O.; Seity, Y. Extreme rainfall in Mediterranean France during the fall: Added-value of the CNRM-AROME convection permitting regional climate model. Clim. Dyn. 2020, 55, 77–91. [Google Scholar] [CrossRef] [Green Version]
  21. Feldmann, H.; Schädler, G.; Panitz, H.J.; Kottmeier, C. Near future changes of mean and extreme precipitation derived from an ensemble of high-resolution RCM simulations. Int. J. Climatol. 2013, 33, 1964–1977. [Google Scholar] [CrossRef]
  22. Ehmele, F.; Kautz, L.A.; Feldmann, H.; Pinto, J.G. Long-term variance of heavy precipitation across central Europe using a large ensemble of regional climate model simulations. Earth Syst. Dyn. 2020, 11, 469–490. [Google Scholar] [CrossRef]
  23. Adinolfi, M.; Raffa, M.; Reder, A.; Mercogliano, P. Evaluation and Expected Changes of Summer Precipitation at Convection Permitting Scale with COSMO-CLM over Alpine Space. Atmosphere 2021, 12, 54. [Google Scholar] [CrossRef]
  24. Reder, A.; Raffa, M.; Montesarchio, M.; Mercogliano, P. Performance evaluation of regional climate model simulations at different spatial and temporal scales over the complex orography area of the Alpine region. Nat. Hazards. 2020, 102, 151–177. [Google Scholar] [CrossRef]
  25. Chan, S.C.; Kendon, E.J.; Fowler, H.J.; Blenkinsop, S.; Ferro, C.A.T.; Stephenson, D.B. Does increasing the spatial resolution of a regional climate model improve the simulated daily precipitation? Clim. Dyn. 2013, 41, 1475–1495. [Google Scholar] [CrossRef]
  26. Fosser, G.; Khodayar, S.; Berg, P. Benefit of convection permitting climate model simulations in the representation of convective precipitation. Clim. Dyn. 2015, 44, 45–60. [Google Scholar] [CrossRef] [Green Version]
  27. Pilon, R.; Zhang, C.; Dudhia, J. Roles of deep and shallow convection and microphysics in the MJO simulated by the Model for Prediction Across Scales. J. Geophys. Res. Atmos. 2016, 121, 10575–10600. [Google Scholar] [CrossRef] [Green Version]
  28. Prein, A.F.; Langhans, W.; Fosser, G.; Ferrone, A.; Ban, N.; Goergen, K.; Keller, M.; Tolle, M.; Gutjahr, O.; Feser, F.; et al. A review on regional convection-permitting climate modeling: Demonstrations, prospects, and challenges. Rev. Geophys. 2015, 53, 323–361. [Google Scholar] [CrossRef] [Green Version]
  29. Piazza, M.; Prein, A.; Truhetz, H.; Csaki, A. On the sensitivity of precipitation in convection-permitting climate simulations in the Eastern Alpine region. Meteorol. Z. 2019, 28, 323–346. [Google Scholar] [CrossRef]
  30. Reder, A.; Rianna, G.; Mercogliano, P.; Castellari, S. Parametric investigation of Urban Heat Island dynamics through TEB 1D model for a case study: Assessment of adaptation measures. Sustain. Cities Soc. 2018, 39, 662–673. [Google Scholar] [CrossRef]
  31. Sugawara, H.; Oda, R.; Seino, N. Urban Thermal Influence on the Background Environment of Convective Precipitation. J. Meteorol. Soc. Jpn. 2018, 96, 67–76. [Google Scholar] [CrossRef] [Green Version]
  32. COSMO-REA6. Available online: https://reanalysis.meteo.uni-bonn.de/?COSMO-REA6 (accessed on 23 December 2020).
  33. Muñoz Sabater, J. ERA5-Land Hourly Data from 1981 to Present. Copernicus Climate Change Service (C3S) Climate Data Store (CDS) 2019. Available online: https://cds.climate.copernicus.eu/cdsapp#!/dataset/reanalysis-era5-land?tab=overview (accessed on 23 December 2020).
  34. Ridal, M.; Olsson, E.; Unden, P.; Zimmermann, K.; Ohlsson, A. Uncertainties in Ensembles of Regional Re-Analyses. Deliverable D2.7 HARMONIE Reanalysis Report of Results and Dataset 2017. Available online: http://www.uerra.eu/component/dpattachments/?task=attachment.download&id=296 (accessed on 23 December 2020).
  35. Beck, A.; Ahrens, B.; Stadlbacher, K. Impact of nesting strategies on precipitation forecasting in dynamical downscaling of reanalysis data. Geophys. Res. Lett. 2004, 31, 19. [Google Scholar] [CrossRef]
  36. Brisson, E.; Demuzere, M.; van Lipzig, N.P.M. Modelling strategies for performing convection-permitting climate simulations. Meteorol. Z. 2016, 25, 149–163. [Google Scholar] [CrossRef]
  37. Matte, D.; Laprise, R.; Thériault, J.M. Comparison between high-resolution climate simulations using single-and double-nesting approaches within the Big-Brother experimental protocol. Clim. Dyn. 2016, 47, 3613–3626. [Google Scholar] [CrossRef] [Green Version]
  38. Tölle, M.H.; Schefczyk, L.; Gutjahr, O. Scale dependency of regional climate modeling of current and future climate extremes in Germany. Theor. Appl. Climatol. 2018, 134, 829–848. [Google Scholar] [CrossRef] [Green Version]
  39. Marsigli, C.; Montani, A.; Paccagnella, T. Provision of boundary conditions for a convection-permitting ensemble: Comparison of two different approaches. Nonlinear. Process. Geophys. 2014, 21, 393–403. [Google Scholar] [CrossRef] [Green Version]
  40. Klasa, C.; Arpagaus, M.; Walser, A.; Wernli, H. An evaluation of the convection-permitting ensemble COSMO-E for three contrasting precipitation events in Switzerland. Quart. J. Roy. Meteor. Soc. 2018, 144, 744–764. [Google Scholar] [CrossRef]
  41. Rockel, B.; Will, A.; Hence, A. The regional climate model COSMO-CLM (CCLM). Meteorol. Z. 2008, 17, 347–348. [Google Scholar] [CrossRef]
  42. Wouters, H.; Demuzere, M.; Blahak, U.; Fortuniak, K.; Maiheu, B.; Camps, J.; Tielemans, D.; van Lipzig, N.P.M. The efficient urban canopy dependency parametrization (SURY) v1.0 for atmospheric modelling: Description and application with the COSMO-CLM model for a Belgian summer. Geosci. Model. Dev. 2016, 9, 3027–3054. [Google Scholar] [CrossRef] [Green Version]
  43. Cornes, R.; van der Schrier, G.; van den Besselaar, E.J.M.; Jones, P.D. An ensemble version of the E-OBS temperature and precipitation datasets. J. Geophys. Res. Atmos. 2018, 123, 9391–9409. [Google Scholar] [CrossRef] [Green Version]
  44. Winterrath, T.; Brendel, C.; Hafer, M.; Junghänel, T.; Klameth, A.; Lengfeld, K.; Walawender, E.; Weigl, E.; Becker, A. RADKLIM Version 2017.002: Reprocessed gauge-adjusted radar data, one-hour precipitation sums (RW). Dtsch. Wetterd. 2018, 2. [Google Scholar] [CrossRef]
  45. Bucchignani, E.; Cattaneo, L.; Panitz, H.J.; Mercogliano, P. Sensitivity analysis with the regional climate model COSMO-CLM over the CORDEX-MENA domain. Meteorol. Atmos. Phys. 2016, 128, 73–95. [Google Scholar] [CrossRef]
  46. Giorgi, F.; Gutowski, W.J. Regional dynamical downscaling and the CORDEX initiative. Annu. Rev. Environ. Resour. 2015, 40, 467–490. [Google Scholar] [CrossRef]
  47. Jacob, D.; Petersen, J.; Eggert, B.; Alias, A.; Christensen, O.B.; Bouwer, L.M.; Braun, A.; Colette, A.; Deque, M.; Georgievski, G.; et al. EURO-CORDEX: New high-resolution climate change projections for European impact research. Reg. Environ. Chang. 2014, 14, 563–578. [Google Scholar] [CrossRef]
  48. Ritter, B.; Geleyn, J.F. A comprehensive radiation scheme for numerical weather prediction models with potential applications in climate simulations. Mon. Weather Rev. 1992, 120, 303–325. [Google Scholar] [CrossRef] [Green Version]
  49. Tiedtke, M. A comprehensive mass flux scheme for cumulus parameterization in large-scale models. Mon. Weather Rev. 1989, 117, 1779–1800. [Google Scholar] [CrossRef] [Green Version]
  50. Doms, G.; Forstner, J.; Heise, E.; Herzog, H.J.; Mironov, D.; Raschendorfer, T.; Reinhardt, T.; Ritter, B.; Schrodin, R.; Schulz, J.P.; et al. A Description of the Non-Hydrostatic Regional COSMO Model. Part-II: Physical Parameterization. 2011. Available online: https://klimanavigator.eu/imperia/md/content/csc/klimanavigator/cosmophysparamtr.pdf (accessed on 23 December 2020).
  51. Baldauf, M.; Schulz, J.P. Prognostic Precipitation in the Lokal Modell (LM) of DWD. COSMO Newsletter No. 4.; Deutscher Wetterdienst: Offenbach am Main, Germany, 2004; pp. 177–180. [Google Scholar]
  52. Joint Research Centre. Global land Cover 2000 Database, European Commission. Joint Research Centre 2003. Available online: https://forobs.jrc.ec.europa.eu/products/glc2000/glc2000.php (accessed on 23 December 2020).
  53. Mellor, G.L.; Yamada, T. A hierarchy of turbulence closure models for planetary boundary layers. J. Atmos. Sci. 1974, 31, 1791–1806. [Google Scholar] [CrossRef] [Green Version]
  54. Haylock, M.R.; Hofstra, N.; Klein Tank, A.M.G.; Klok, E.J.; Jones, P.D.; New, M. A European daily high-resolution gridded data set of surface temperature and precipitation for 1950–2006. J. Geophys. Res. Atm. 2008, 113. [Google Scholar] [CrossRef] [Green Version]
  55. Isotta, F.A.; Frei, C.; Weilguni, V.; Perčec Tadić, M.; Lassegues, P.; Rudolf, B.; Pavan, V.; Cacciamani, C.; Antolini, G.; Ratto, S.M.; et al. The climate of daily precipitation in the Alps: Development and analysis of a high-resolution grid dataset from pan-Alpine rain-gauge data. Int. J. Clim. 2014, 34, 1657–1675. [Google Scholar] [CrossRef]
  56. Bazile, E.; Abida, R.; Verelle, A.; Le Moigne, P.; Szczypta, C. MESCAN-SURFEX Surface Analysis. Deliverable D2.8 of the UERRA Project 2017. Available online: http://www.uerra.eu/publications/deliverable-reports.html (accessed on 23 December 2020).
  57. ETCCDI Climate Change Indices. Available online: http://etccdi.pacificclimate.org/list_27_indices.shtml. (accessed on 14 February 2021).
  58. Taylor, K.E. Summarizing multiple aspects of model performance in a single diagram. J. Geophys. Res. 2001, 106, 7183–7192. [Google Scholar] [CrossRef]
  59. Soares, P.M.M.; Cardoso, R.M. A simple method to assess the added value using high-resolution climate distributions: Application to the EURO-CORDEX daily precipitation. Int. J. Climatol. 2017, 38, 1484–1498. [Google Scholar] [CrossRef]
  60. Gupta, H.V.; Kling, H.; Yilmaz, K.K.; Martinez, G.F. Decomposition of the mean squared error and NSE performance criteria: Implications for improving hydrological modelling. J. Hydrol. 2009, 377, 80–91. [Google Scholar] [CrossRef] [Green Version]
  61. Knoben, W.J.M.; Freer, J.E.; Woods, R.A. Technical note: Inherent benchmark or not? Comparing Nash–Sutcliffe and Kling–Gupta efficiency scores. Hydrol. Earth Syst. Sci. 2019, 23, 4323–4331. [Google Scholar] [CrossRef] [Green Version]
  62. Lucas-Picher, P.; Boberg, F.; Christensen, J.H.; Berg, P. Dynamical downscaling with reinitializations: A method to generate finescale climate datasets suitable for impact studies. J. Hydrometeorol. 2013, 14, 1159–1174. [Google Scholar] [CrossRef]
  63. Prein, A.F.; Gobiet, A. Impacts of uncertainties in European gridded precipitation observations on regional climate analysis. Int. J. Climatol. 2017, 37, 305–327. [Google Scholar] [CrossRef] [PubMed]
  64. Vidal, J.P.; Martin, E.; Franchistéguy, L.; Baillon, M.; Soubeyroux, J.M. A 50-year high-resolution atmospheric reanalysis over France with the Safran system. Int. J. Climatol. 2010, 30, 1627–1644. [Google Scholar] [CrossRef] [Green Version]
  65. Pelosi, A.; Terribile, F.; D’Urso, G.; Chirico, G.B. Comparison of ERA5-Land and UERRA MESCAN-SURFEX Reanalysis Data with Spatially Interpolated Weather Observations for the Regional Assessment of Reference Evapotranspiration. Water 2020, 12, 1669. [Google Scholar] [CrossRef]
Figure 1. Nesting strategies adopted for the downscaling of ERA5 reanalysis at 2.2 km.
Atmosphere 12 00260 g001
Figure 2. Computational domains of the climate experiments (in red the domain for the intermediate run at ~12 km, in blue the domain for the runs at ~2.2 km).
Atmosphere 12 00260 g002
Figure 3. (a) Orography and (b) impervious surface area of the evaluation domain; red boxes represent the domains at city scale.
Atmosphere 12 00260 g003
Figure 4. Spatial distribution of yearly average PRCPTOT over 2007-2011 for E-OBS (a), ERA5-Land (b), UERRA (c), CCLM002-Nest (d), CCLM002-Direct (e), with associated normalized Taylor diagram statistics (f) assuming E-OBS as reference.
Atmosphere 12 00260 g004
Figure 5. Spatial distribution of yearly average RR1 over 2007–2011 for E-OBS (a), ERA5-Land (b), UERRA (c), CCLM002-Nest (d), CCLM002-Direct (e), with associated normalized Taylor diagram statistics (f) assuming E-OBS as reference.
Atmosphere 12 00260 g005
Figure 6. Spatial distribution of R95p over 2007–2011 for E-OBS (a), ERA5-Land (b), UERRA (c), CCLM002-Nest (d), CCLM002-Direct (e), with associated normalized Taylor diagram statistics (f) assuming E-OBS as reference.
Atmosphere 12 00260 g006
Figure 7. Probability Distribution Function of PRCPTOT (a), RR1 (b), and R95p (c).
Atmosphere 12 00260 g007
Figure 8. Multi-year cycle of (a) monthly PRCPTOT and (b) monthly RR1 for Paris (FR) yielded by ERA5-Land, UERRA, CCLM002-Nest, CCLM002-Direct assuming E-OBS and SAFRAN as references.
Atmosphere 12 00260 g008
Figure 9. Multi-year cycle of (a) monthly PRCPTOT and (b) monthly RR1 for Cologne (DE) yielded by ERA5-Land, UERRA, CCLM002-Nest, CCLM002-Direct assuming E-OBS and RADKLIM-RW as references.
Atmosphere 12 00260 g009
Figure 10. Spatial distribution of accumulated precipitation over the evaluation domain yielded by RADKLIM-RW (a), ERA5-Land (b), UERRA (c), CCLM002-Nest (d), and CCLM002-Direct (e) for the Event 1 (20 August 2007 06:00 UTC–23 August 2007 06:00 UTC). The red box indicates a specific area of interest. The table reports the spatial correlation computed for the specific area of interest, assuming RADKLIM-RW as reference.
Atmosphere 12 00260 g010
Figure 11. Spatial distribution of accumulated precipitation over the evaluation domain yielded by RADKLIM-RW (a), ERA5-Land (b), UERRA (c), CCLM002-Nest (d), and CCLM002-Direct (e) for the Event 2 (25 August 2010 06:00 UTC–28 August 2010 06:00 UTC). The red box indicates a specific area of interest. The table reports the spatial correlation computed for the specific area of interest, assuming RADKLIM-RW as reference.
Atmosphere 12 00260 g011
Figure 12. Accumulated precipitation evolution for the Event #1 (20 August 2007 06:00–23 August 2007 06:00).
Atmosphere 12 00260 g012
Figure 13. Accumulated precipitation evolution for the Event #2 (25 August 2010 06:00–28 August 2010 06:00).
Atmosphere 12 00260 g013
Table 1. Main characteristics of the experiment configurations.
ModelCCLM011CCLM002-NestCCLM002-Direct
Boundary forcingERA5-ReanalysisCCLM011ERA5-Reanalysis
Horizontal resolution0.11° (~12 km)0.02° (~2.2 km)0.02° (~2.2 km)
Time step (s)75 s20 s20 s
N° grid points450 × 438455 × 330455 × 330
N° vertical levels405050
Radiation schemeRitter and Geleyn [48]Ritter and Geleyn [48]Ritter and Geleyn [48]
Convection schemeDeep and shallow convection based on Tiedtke [49]Shallow convection based on Tiedtke [49]Shallow convection based on Tiedtke [49]
Microphysics schemeDoms et al. [50]; Baldauf and Schulz [51]Doms et al. [50]; Baldauf and Schulz [51]Doms et al. [50]; Baldauf and Schulz [51]
Land surface schemeTERRA-ML [50]TERRA-ML [50] with TERRA-URB [42] parametrizationTERRA-ML [50] with TERRA-URB [42] parametrization
Land use GLC2000 [52]GLC2000 [52]GLC2000 [52]
Planetary boundary layer schemeMellor and Yamada [53]Mellor and Yamada [53]Mellor and Yamada [53]
Lateral Boundary Condition (LBC) update frequency1 h1 h1 h
Soil initializationTemperature and moisture obtained by interpolation from ERA5-ReanalysisTemperature and moisture obtained by interpolation from CCLM011Temperature and moisture obtained by interpolation from ERA5-Reanalysis
Table 2. Climate indicators for the different level of analysis (first level = areal scale; second level = city scale; third scale = event scale).
IndicatorUnitDescriptionAreal ScaleCity ScaleEvent Scale
PRCPTOTmmTotal precipitation amount including dry daysXXX
RR1daysNumber of days with daily precipitation amount above 1 mm XX
R95pmmPrecipitation amount when daily precipitation exceeds the 95th percentile in wet days (daily precipitation ≥ 1 mm)X
Table 3. Distribution added value (DAV) score for each indicator at yearly scale.
IndicatorCCLM002
Experiment
DAV
(ERA5-Land vs. CCLM002) (%)
DAV
(UERRA-Land vs. CCLM002) (%)
PRCPTOTNest+29−18
Direct+38−12
RR1Nest+19−34
Direct+4−42
R95pNest+28+2
Direct−11−29
Table 4. Number of grid points belonging to the city domains in their native resolution for Paris (FR) and Cologne (DE).
CityE-OBSERA5-LandUERRACCLM002
Paris6464176988
Cologne6055130832
Table 5. Kling–Gupta Efficiency (KGE) index calculated for monthly PRCPTOT and monthly RR1 over Paris and Cologne assuming E-OBS as reference.
CityIndicatorERA5-LandUERRACCLM002-NestCCLM002-Direct
ParisPRCPTOT0.820.950.310.78
RR10.840.890.450.72
ColognePRCPTOT0.840.950.520.91
RR10.810.890.790.87
Table 6. Kling–Gupta Efficiency (KGE) index calculated for hourly precipitation assuming RADKLIM-RW as reference (N.E. = Not Evaluable).
EventPeriodERA5-LandUERRACCLM002-NestCCLM002-Direct
1August 20070.64N.E.0.130.95
2August 20100.65N.E.−0.120.55
Publisher’s Note: MDPI stays neutral with regard to jurisdictional claims in published maps and institutional affiliations.

