Next Article in Journal
Winds in the Lower Cloud Level on the Nightside of Venus from VIRTIS-M (Venus Express) 1.74 μm Images
Next Article in Special Issue
Spectra of Acoustic-Gravity Waves in the Atmosphere with a Quasi-Isothermal Upper Layer
Previous Article in Journal
Distinct Regimes of O3 Response to COVID-19 Lockdown in China
Previous Article in Special Issue
Comparison of Key Characteristics of Remarkable SSW Events in the Southern and Northern Hemisphere
 
 
atmosphere-logo
Article Menu
Article

Assessment of Morelian Meteoroid Impact on Mexican Environment

by
Maria A. Sergeeva
1,2,*,
Vladislav V. Demyanov
3,4,
Olga A. Maltseva
5,
Artem Mokhnatkin
6,
Mario Rodriguez-Martinez
7,
Raul Gutierrez
7,
Artem M. Vesnin
3,
Victor Jose Gatica-Acevedo
1,8,
Juan Americo Gonzalez-Esparza
1,
Mark E. Fedorov
4,
Tatiana V. Ishina
4,
Marni Pazos
9,
Luis Xavier Gonzalez
1,2,
Pedro Corona-Romero
1,2,
Julio Cesar Mejia-Ambriz
1,2,
Jose Juan Gonzalez-Aviles
1,2,
Ernesto Aguilar-Rodriguez
1,
Enrique Cabral-Cano
10,
Blanca Mendoza
11,
Esmeralda Romero-Hernandez
12,
Ramon Caraballo
1 and
Isaac David Orrala-Legorreta
1,13
add Show full author list remove Hide full author list
1
SCiESMEX, LANCE, Instituto de Geofisica, Unidad Michoacan, Universidad Nacional Autonoma de Mexico, Morelia, Michoacan C.P. 58089, Mexico
2
CONACYT, Instituto de Geofisica, Unidad Michoacan, Universidad Nacional Autonoma de Mexico, Morelia, Michoacan C.P. 58089, Mexico
3
Institute of Solar-Terrestrial Physics, Siberian Branch of the Russian Academy of Sciences, 664033 Irkutsk, Russia
4
Irkutsk State Transport University, 664074 Irkutsk, Russia
5
Institute for Physics, Southern Federal University, 344090 Rostov-on-Don, Russia
6
Keldysh Institute of Applied Mathematics of the Russian Academy of Sciences, 125047 Moscow, Russia
7
Escuela Nacional de Estudios Superiores Unidad Morelia, Universidad Nacional Autonoma de Mexico, Morelia, Michoacan C.P. 58190, Mexico
8
Instituto Politecnico Nacional, Mexico City 07738, Mexico
9
Centro de Ciencias de la Atmosfera, Universidad Nacional Autonoma de Mexico, Mexico City C.P. 04510, Mexico
10
Instituto de Geofisica, Universidad Nacional Autonoma de Mexico, Mexico City C.P. 04510, Mexico
11
Escuela Nacional de Ciencias de la Tierra, Universidad Nacional Autonoma de Mexico, Mexico City C.P. 04510, Mexico
12
LANCE, Facultad de Ciencias Fisico-Matematicas, Universidad Autonoma de Nuevo Leon, Monterrey C.P. 66451, Mexico
13
Facultad de Ciencias, Universidad Nacional Autonoma de Mexico, Mexico City C.P. 04510, Mexico
*
Author to whom correspondence should be addressed.
Atmosphere 2021, 12(2), 185; https://doi.org/10.3390/atmos12020185
Submission received: 31 December 2020 / Revised: 21 January 2021 / Accepted: 25 January 2021 / Published: 30 January 2021
(This article belongs to the Special Issue Dynamical and Chemical Processes of Atmosphere-Ionosphere Coupling)

Abstract

:
Possible ionospheric effects of the Morelian meteoroid that passed and exploded over Mexico on 19 February 2020 (18 February 2020 local time) were estimated. The meteoroid trajectory, velocity and time of occurrence were calculated based on outdoor camera records. Modeling was used to estimate the meteoroid initial diameter, density, mass, velocity, energy and their change during its flight in the atmosphere. The ensemble of ionospheric scintillation indices calculated from the high-rate GNSS data and the filtered slant Total Electron Content data were used to reveal the presence of ionospheric disturbances generated by shock waves excited by the meteoroid flight and explosion. The first ionospheric responses to phenomena accompanying the meteoroid were detected (2.5–3.5) min after the explosion. The disturbances were attenuated quickly with distance from their source and were rarely recorded by GNSS receivers located more than 600 km from the meteoroid explosion site. The ionospheric disturbances of intermediate-scale, small-scale, shock-acoustic-wave-scale and sometimes medium-scale were revealed. The detected disturbances corresponded to the range of acoustic-gravity waves. An asymmetry of the disturbance manifestation in different directions was observed. The obtained results are in accordance with results of the observation of other meteoroids. Although the object was smaller and of less energy than other known meteoroids, it is an interesting case because, to the best of our knowledge, it isthe first known to us low-latitude meteoroid with the detected ionospheric effects.

1. Introduction

The Earth’s atmosphere protects us from extraterrestrial bodies (meteoroids) that pass near our planet at low heights above the ground. The dark cold objects become fiery meteors or fireballs. Meteoroids causing meteors enter the atmosphere at speeds ranging between 11.2 and 72.5 km/s. On the evening side of the Earth, meteoroids must catch up to the Earth’s atmosphere to cause a meteor, and tend to be slow. On the morning side, they can collide with the atmosphere and tend to be fast. Some meteoroids consist of nearly pure iron with an interesting crystal structure, others are stony or ice objects. Large meteoroids burning only on the outside lose their speed and usually split apart in the air becoming meteorites. Large meteorites are rare phenomena. Most of them are rather well known. Tons of small meteorites and dust arrive per day on the Earth. At the same time, many meteoroids are too small and usually burn up in the atmosphere, not reaching the surface of the Earth.
Around 20:40 LT on 18 February 2020, social network users from different parts of Mexico reported seeing a luminous object that fell from the sky. According to these reports, it was seen in Mexico City, state of Mexico, Jalisco, Guanajuato, Queretaro, San Luis Potosi and Michoacán states. Indeed, it was a meteor that illuminated the Mexican sky, and was probably caused by a small object that burned up in the dense layers of the atmosphere.
It is of interest to make at least a rough assessment of the possible ionospheric effects of this meteoroid passage. For this purpose, the parameters of the meteoroid and its meteor (trajectory, time of passage, dimensions, mass, etc.) are needed. Unfortunately, the scientific optical instruments did not record the object passage: all-sky camera in the center of Mexico began to operate an hour later after the meteor was reported via social networks; the ORI-25 survey telescope of ISON in Sinaloa [1] observed the sky area that did not sweep the meteoroid passage trajectory. The Mexican Array Radiotelescope did not operate due to the maintenance work. Therefore, we needed to search for alternative sources of information taking into account that they can provide less certain data than the mentioned instruments.
A meteoroid event, which includes a meteoroid flight at hypersonic velocities, its meteor and explosion (fragmentation with an explosive release of energy during the atmospheric flight), could be accompanied by effects of turbulence, wave processes as well as plasma, magnetic, electrical, electromagnetic, ionospheric and seismic effects. The kinetic energy of the body is expended to its break-up, heating, melting, ablation, ionization, heating the substance in its trace (wake) and formation of shock waves (SW).
The accompanying phenomena that are able to influence the ionosphere can be divided into two groups: wake effects and waves excitation consequences. First, electrons emitted by a hot meteoroid ionize the environment, forming a wake behind the flying object. The wake diameter rapidly increases due to diffusion processes. Such ionized traces are created at 80–120 km above the ground (E-layer) and can last 0.1–100 s. The effectiveness of this process depends on the mass of the meteoroid. Sometimes electric currents occur inside a wake, but their electromagnetic radiation power is low.
Furthermore, a cosmic body movement in the atmosphere is accompanied by the process of a rapid release of large amounts of energy in the limited volume. This released energy leads to a variety of wave phenomena [2,3,4] and references therein. First, there is a shock in front of the meteoroid. Then, kinetic energy during a meteoroid flight is partially spent on the formation of a cylindrical SW along the meteoroid trajectory. Its strength depends on the energy deposition by the ablating meteoroid per unit path length. Behind the front of SW, the air is heated in a shock-compressed layer and plasma is formed consequently. Cylindrical SW is superimposed on the more intense spherical SW generated by an explosion. SWs expand from the body trajectory gradually fading. The energy of the explosive SW is transformed into the energy of acoustic waves. Upward SWs propagation leads to disturbance of the upper atmosphere.
Since the movement of the meteoroid disturbs the air, it leads to displacement of air parcels and as a result to formation of atmospheric gravity waves (GWs). Excited in the lower atmosphere, GW can reach ionospheric heights and be detected as Travelling Ionospheric Disturbances (TIDs) [5]. A complex meteoroid phenomenon can generate a wide range of GW and their associated TIDs of different wavelengths and lifetimes [6,7]. The flight and destruction of a meteoroid at stratospheric heights can cause infrasound waves. Acoustic waves provoked by a meteoroid can also transform into infrasound waves [2,4,8].
The aim of the present study was to consider possible effects of the meteoroid passage over Mexico on 19 February 2020 and identify which of them could be observed. It was of interest to reveal the presence or absence of each of them. Special focus was on estimation of possible ionospheric response. The tasks included (1) the assessment of the meteor trajectory and reconstruction of the meteoroid parameters; (2) revealing the features of the meteoroid’s impact on the ionosphere; and (3) examination of presence or absence of other possible effects. The ionospheric behavior was analyzed using data of slant Total Electron Content (sTEC) fluctuations, which is a “classical” approach to detect the ionospheric disturbances resulting from a meteoroid event. In addition, we suggest the detection of ionospheric response to SW using ionospheric scintillation indices, which is a new approach.
The paper is organized as follows: Section 2 discusses some recent meteoroid events. Section 3 introduces the background conditions during the Morelian meteoroid flight. Section 4 presents the results of meteor parameter calculations based on observations. Section 5 concerns the results of modeling of the meteoroid parameters and its trajectory in the atmosphere with time. Section 6 discusses the results of the meteoroid’s ionospheric impact detection by two methods. Section 7 estimates the possibility of other effects. Final remarks are given in Conclusions. A list of abbreviations is given in Appendix A.

2. Brief Review of Previous Meteoroid Events

Notwithstanding the seeming rarity of meteoroid phenomena, studies of the associated processes are of great interest, since, like in the case of geomagnetic storms, there is no identical meteoroid fall. This section highlights some recent cases. The most detailed description of physical processes accompanying a meteoroid phenomenon is given in [2,3]. The effects of the Romanian (2015) and Chelyabinsk, Russia (2013) meteoroids were compared. The two objects were of rather different size and impact intensity. An important conclusion is that the perturbations caused by the explosions of both meteoroids propagated both vertically (hundreds of km upwards) and horizontally (a thousand km). The registered disturbances occurred not only in the atmosphere, but also in the ionosphere and in the geomagnetic field. Ref. [9] described the case of the Beringovomorsky meteoroid, Russia (2018). If the estimate of its mass is correct, then it was the second by its explosion energy outer body in the atmosphere during the last 30 years (after Chelyabinsk event), with the destruction accompanied by shock wave formation. Ref. [10] presented the trajectory reconstruction for the Annama meteoroid, Russia, near the border with Finland (2014). Refs. [11,12] studied the effects of high-latitude meteoroids over Northern Finland (2017), over Vilyuisk, Russia (2014) and over Sayanogorsk, Russia (2016). The authors showed that the explosions provoked changes in the ionosphere and geomagnetic field. They detected the appearance of internal gravity waves and slow magneto-hydrodynamic waves. In the case of Northern Finland, the first ionospheric disturbance amplitude increased very sharply at the heights of 85–95 km being caused by the shock wave arrival and the second disturbance was similar to a wave packet form at the heights of 80–93 km caused by internal gravity waves. None of the mentioned works used TEC to estimate ionosphere changes. Ref. [13] analyzed sTEC behavior for the famous Chelyabinsk case using data of a dense GPS receiver network. They also provided the review of observations by other authors. The fine disturbance effects were revealed: several wave modes propagating with velocities 250–660 m/s. Ref. [14] also studied the effects of the Chelyabinsk event using TEC time series. They found the asymmetry of the ionospheric disturbance propagation from the epicenter of explosion and the absence of classical N-type response corresponding to the acoustic shock. Ref. [15] analyzed the Chelyabinsk event with TEC as well and revealed three types of TID propagating with different velocities. Some of the disturbances were associated with gravity waves and meteor acoustic waves (infrasound signals).
It was of interest to compare the changes in the ionosphere during some of the cases mentioned above. We estimated the overall ionospheric conditions with vertical TEC (vTEC) data (GIM JPL). When available, Vertical Ionospheric Sounding (VIS) data providing information on the ionospheric layers changes was analyzed. The data were summarized in Table 1 in the descending order of latitude of the event.
(1) For the most high-latitude case (Finland), at the moment of the meteoroid the Es layer appeared with the very high cut-off frequency foEs by Lovozero station data (68.0° N, 35.0° E), but no such layer was detected at Gorkovskaya station (60.27° N, 29.38° E). vTEC deviation from its median value (δvTEC) was negative.
(2) For the second high-latitude case, the foF2 data for Murmansk (68.57° N, 33.2° E) was available from SPIDR database (downloaded before the website was closed). δvTEC was calculated for three sites that limited the meteorite fall area. The values of both parameters decreased near the time of the meteorite fall at Murmansk station. Three Finnish stations (61.68° N, 23.24° E; 64.95° N, 26.01° E; 65.95° N, 29.72° E) showed the same effect being less with less latitude.
(3) According to data from the closest to the site of interest Yakutsk station (62.0° N, 129.6° E) obtained from DIDBase [16], the slight increase of foF2 values was observed. A slight decrease of vTEC was observed at Vilyuisk.
(4) In this case, at the background of the increased vTEC values during two days (18–19 December 2018), the smallest increase of vTEC was observed at the moment of the meteoroid passage, which in essence means the implicit decrease.
(5) For the most studied case, no foF2 data for Moscow station was available at 0 and 2 UT. In subsequent moments, foF2 < foF2(med); δvTEC also decreased.
(6) In the last case (the most low-latitude of the considered cases) δvTEC also decreased.
Assuming that vTEC changes characterize mostly F-region conditions and considering available VIS data, it seems that some tendency is observed. The values given in Table 1 may seem large but it should be taken into account that vTEC values themselves are small at high latitudes. From this perspective, the intermediate conclusion is that a meteoroid fall at mid/high-latitudes of the Northern Hemisphere can be accompanied by the appearance of dense sporadic Es layers and a decrease of the ionization in the F layer.
In this work, we study the low-latitude meteoroid case. vTEC behavior is illustrated in Figure 1 (lower panel). The influence of this meteoroid can be masked and the search for wave disturbances is challenging due to the mixed background conditions as discussed in the next section. However, the study of filtered GNSS data for individual satellites should make possible to reveal the presence of disturbances caused exactly by the meteoroid fall.

3. Background Conditions

3.1. Space Weather

2019 and 2020 were years of very low solar activity. Geomagnetic disturbances were rare and mostly weak when they occurred. Unfortunately, being quiet all month, geomagnetic conditions on 18–19 February 2020 were characterized by moderate and weak storms. Figure 1 shows Dst-index characterizing variations of geomagnetic field and vTEC variations representing the overall ionospheric behavior. The last was calculated for the closest to the meteoroid detection station UCOE. The moderate magnetic storm occurred on 18 February (Dstmin = −52 nT, Kpmax = 5). Its main phase (MP) lasted between 03 and 17 UT and was followed by the recovery phase (RP) that lasted until 2 UT of 19 February. Further this day, the weaker Dst disturbance was observed. These resulted in short-term vTEC enhancement characteristic for Mexican region during disturbances [17,18]. The meteoroid became visible as a meteor at 2:18 UT on 19 February, which was exactly between the moderate and the weak storm (vertical red line M in Figure 1).
Ionospheric disturbances caused by geomagnetic storms are of higher order of magnitude and duration if compared to much less intense short-time local effects that possibly could have been produced by small meteoroids. Therefore, in the first approximation, it seems possible to separate these two types of impacts.

3.2. Terminator

If a meteoroid passage and explosion occurs at sunrise or sunset, the passage of the solar terminator should be taken into account as it can be one of GW sources and also cause some disturbances in the ionosphere observed in sTEC variations [7,19]. Our meteoroid fell in the evening hours. Figure 2 shows the terminator position at different heights: 0 km (ground), 100 km (E-layer), 350 and 500 km (F2-layer). The blue dot in the center of Mexico is the site of the meteoroid explosion. Usually, major impact on GPS signal scintillations is produced in the ionospheric F region at ~350 km (±100 km). Although Mexico was already at the night side of the Earth, the terminator passed recently these heights over the site of the explosion (between 01:50 and 02:13 UT (5–28 min before the meteoroid)).

4. Meteor Trajectory Estimation

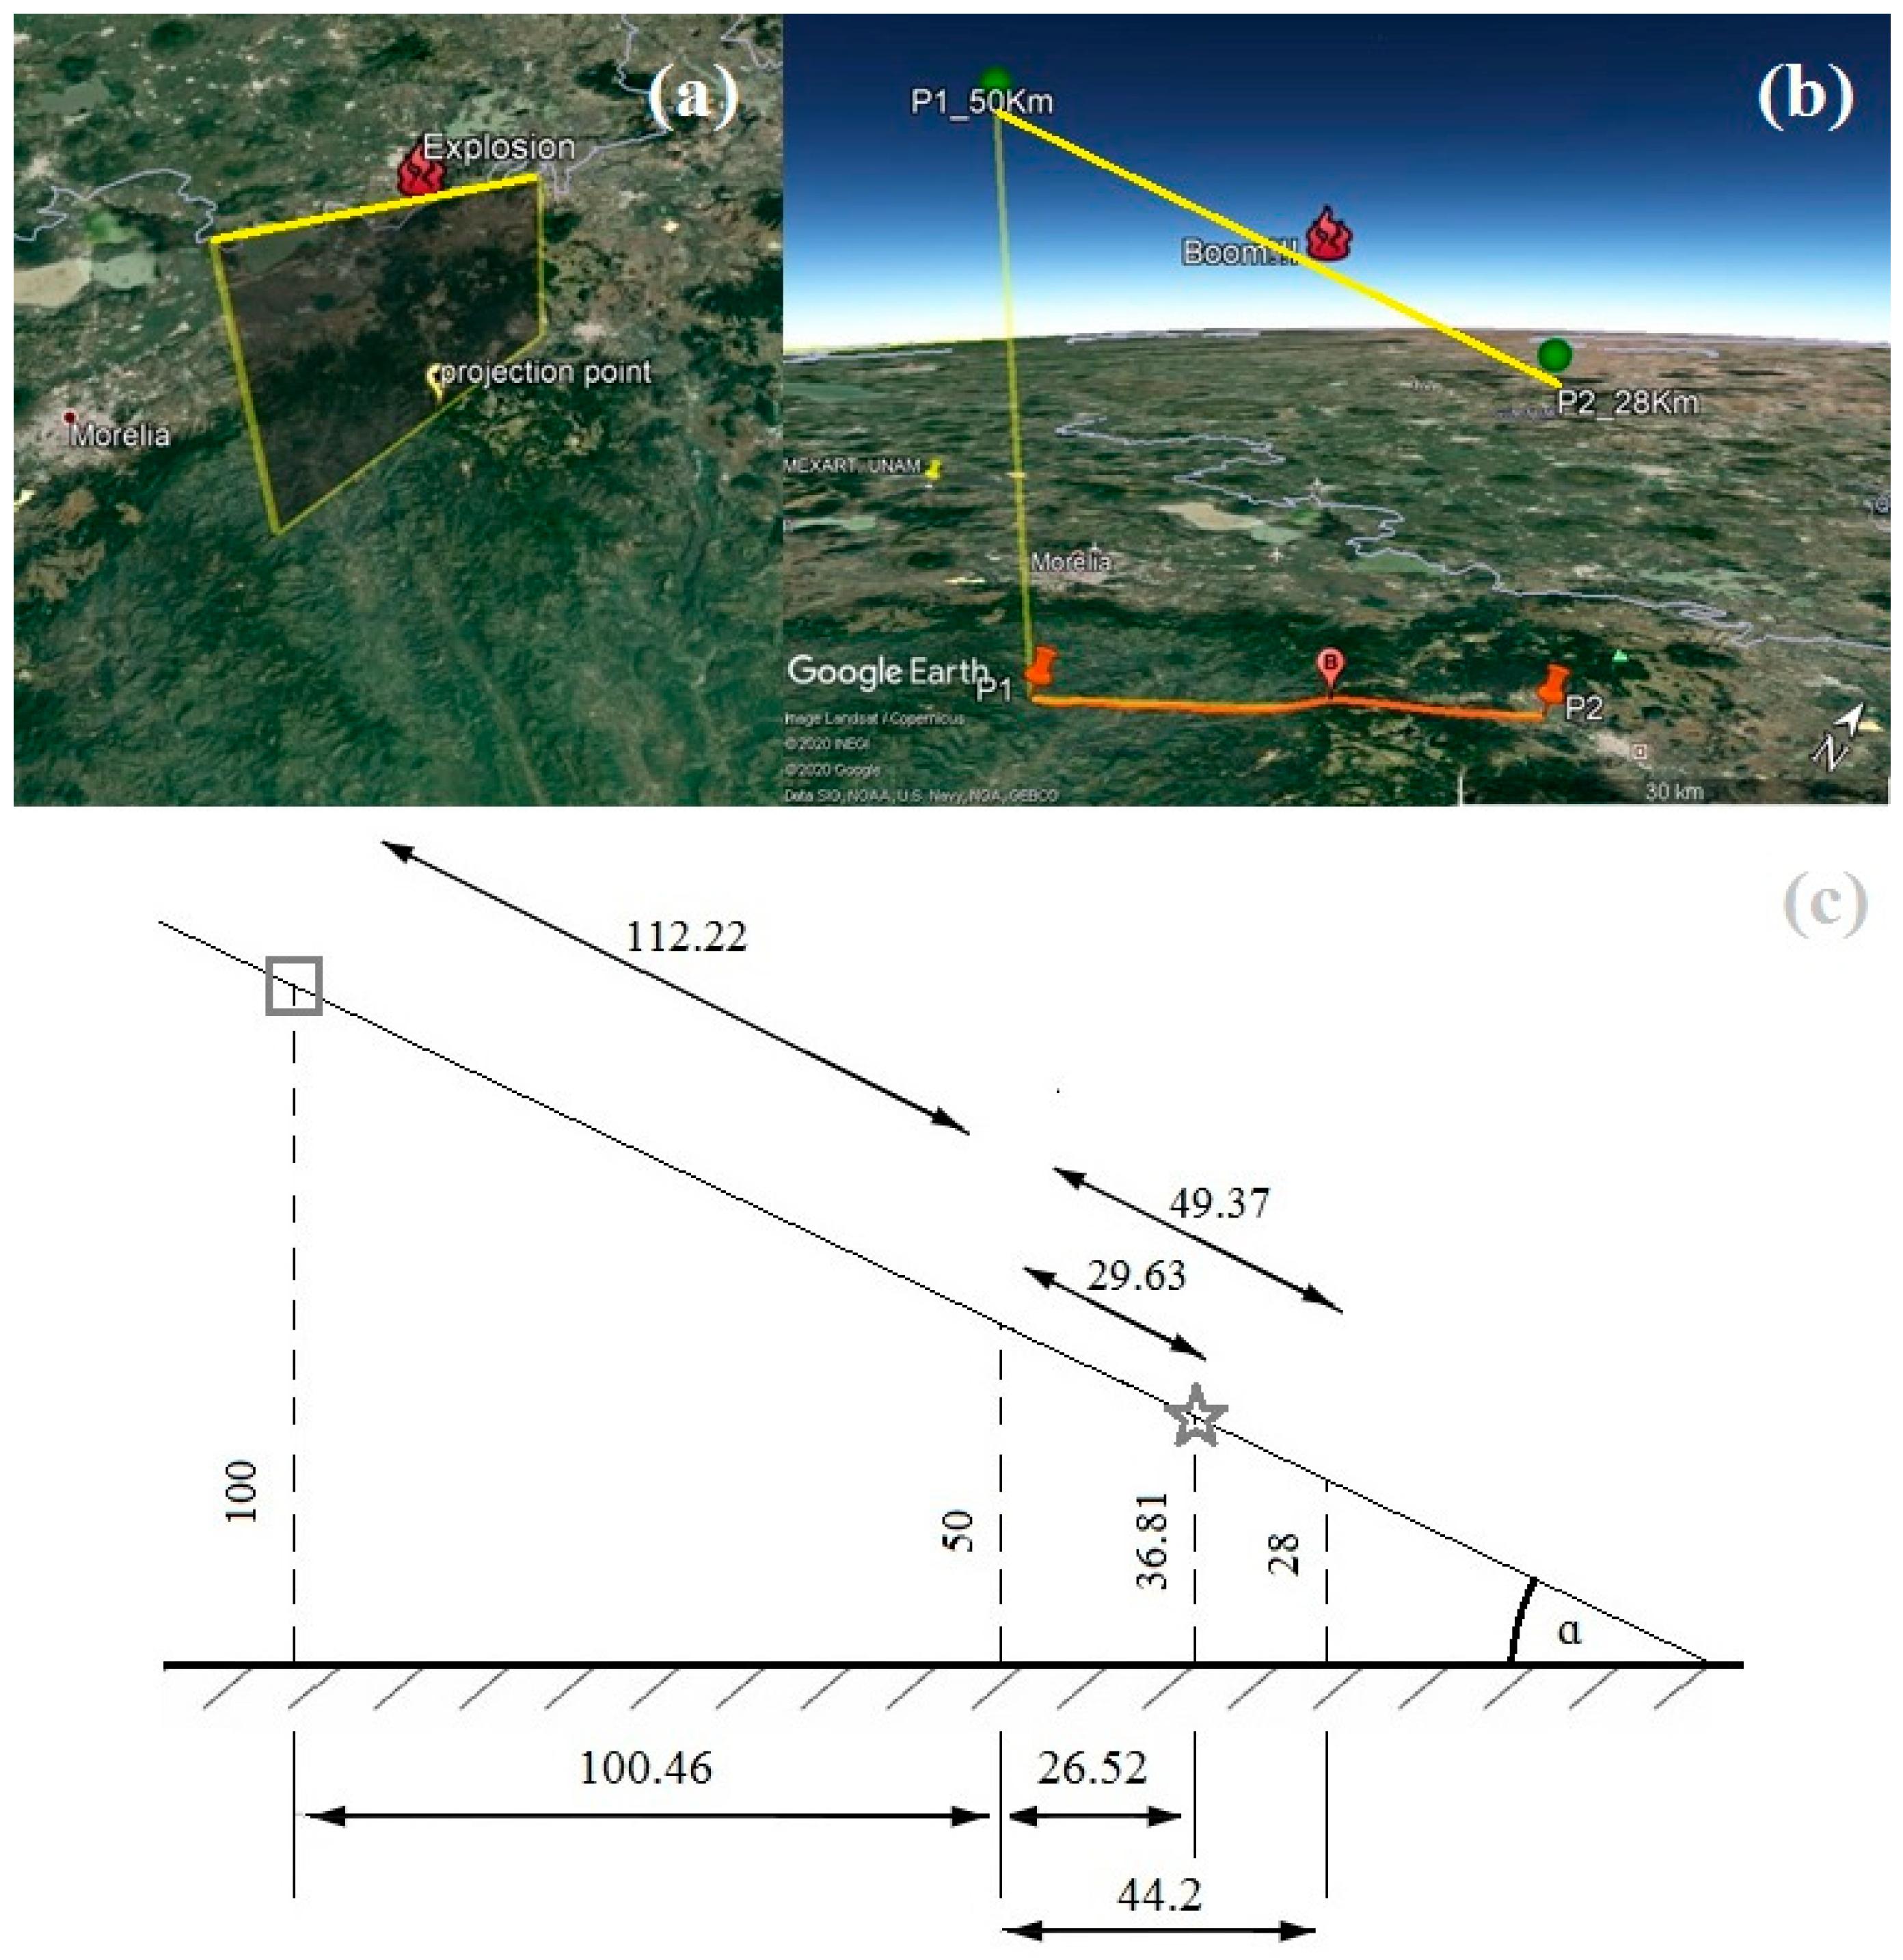
No data from regional all-sky cameras or other optical instruments were available for the moment of the meteoroid passage. There are methods of meteoroid trajectory determination based on data of multiple cameras, for instance [20,21]. We searched for videos by outdoor surveillance cameras which captured the meteor from different places. Four videos from the “Webcams de México” network of outdoor cameras (www.webcamsdemexico.com) were found (Appendix B). They were taken in (a) Puebla, (b) Mexico City, (c) Guadalajara and (d) San Miguel de Allende (Figure 3a). Thus, the meteor trajectory captured from four different locations was available for the analysis.
First, known object sizes were used (buildings, streets, landscape marks, etc.) to estimate the field of view, azimuth and the height of the cameras. Further, the planes of the apparent meteor trajectory for each camera were plotted. Figure 3b shows these planes represented by imaginary triangles and their intersection. The length of each triangle is random and serves only to illustrate different projections of the trajectory. Third, the meteor trajectory vector in the equatorial coordinate system was determined using the method [21] and based on estimations of azimuth and height for the initial and end points of the trajectory at different sites with the known geodetic coordinates.
The topocentric radiant (the point on the sky from which the meteor seems to appear) was estimated as RA 13.96 ± 9.085°, Dec −0.64° ± 0.16°. The geodetic azimuth (measured from the North) was approximately θ = ~242°. This means that the considered meteor is not associated with some major meteor shower, as the closest showers were Quadrantids in January and Lyrids in April. According to American Meteor Society information (www.amsmeteors.org/meteor-showers/2017-meteor-shower-list), the closest meteor showers were (a) the minor shower “alpha Centaurids” during 02–19 February 2020 (RA 14:04, Dec −58.2°; velocity 59.3 km/s) and (b) the weak shower “February Virginids” during 16 February–4 March 2020 (RA 16:12, −02.0°; velocity 62 km/s). Considering the high velocities at which meteoroids of these showers stroke the atmosphere, our object is assumed to be a sporadic (random) meteoroid.
Using triangulation, the coordinates of the initial point (beginning of the visible trajectory) were obtained: lat = 19°30′ N ± 11′, lon = 100°59′ W ± 2′, h~50 km. The point of disappearance (the end of the visible trajectory) was at lat = 19°42′ N ± 21′, lon = 100°37′ W± 1′, h~28 km. For further calculations, the values (19.500° N, 100.983° W and 19.700° N, 100.617° W) were used. According to the videos, the meteor was visible for five seconds between 02:18:46 and 02:18:51 UT. The time of the peak brightness (meteoroid explosion) was at 02:18:49 UT. Consequently, the approximate height and coordinates of its ground projection point can be found: 19.619° N, 100.764° W, h2 = ~36.8 km. The average slope of the atmospheric trajectory to the Earth’s surface (angle to the horizontal) was approximately at α = 26.46°. The average velocity during the meteor flight was υ(visible) = ~ 9.87 km/s. Figure 4 schematically illustrates the estimated meteor trajectory and its projection on the ground.
Our reconstruction was confirmed by satellite measurements. The Geostationary Lightning Mapper (GLM) installed on GOES-16 spacecraft (36,000 km altitude, 0° inclination) is a near-infrared optical transient detector operating in the single band 777.4 nm [22,23]. According to GLM data (Figure 5), the “lightning” was detected at 02:18:49 UT exactly over the coordinates of the meteoroid explosion (19.66865° N; 100.77114° W). Sometimes, a weak lightning discharge can occur in the meteoroid wake, but its energy is relatively small [2]. Thus, it could have been a weak lightning discharge, but most probably it was the light of the meteor explosion (anyway, both would be caused by the meteoroid). The time of the explosion in the videos and by GLM coincides. No lightning discharges (for detection of which serves GLM) or meteorological conditions for them were observed during 19 February in Michoacán state of Mexico. In addition, usually the discharges in this area are multiple and last at least several minutes, which would result in several marks in a sequence of images. However, only one “lightning” in one image was detected during 02–03 UT and it was exactly over the explosion point. Therefore, GLM detected the meteoroid explosion.
To sum up, the meteor caused by the sporadic slow-moving catching up the Earth night meteoroid was visually observed on 19 February 2020, during five seconds. The following estimates were received.
  • RA 13.96 ± 9.085°, Dec −0.64° ± 0.16°; θ = ~ 242°;
  • Meteor trajectory:
    • Initial point: 19.500° N, 100.983° W, h1 = ~50 km (02:18:46 UT, 19 February 2020);
    • Explosion point: 19.619° N, 100.764° W, h2 = ~36.8 km (02:18:49 UT, 19 February 2020);
    • End point: 19.700° N, 100.617° W, h3 = ~28 km (02:18:51 UT, 19 February 2020)
    • Angle to the horizontal: α = ~26.46°.
  • The average observed meteor velocity: υ(visible) = ~9.87 km/s.
As the explosion occurred near the city of Morelia in the Michoacán state of Mexico, hereafter we refer to the object as the Morelian meteoroid. To reveal if there was any effect, the meteoroid trajectory in the ionosphere (higher than h1 = ~50 km) needs to be known. Modeling was used to evaluate it.

5. Modeling Results

To reconstruct the parameters of a meteoroid crossing the Earth’s atmosphere, the program complex was developed. It is a numerical-analytical 2D solution of the equations of state, which represent the evolution of speed, mass, angle of the flight and height with time, taking into account the gravity force of our planet on the considered object. The program was based on the methods described in works [24,25,26]. For details, the reader is referred to these works and references therein. Basically, as input data, the program requires initial parameters of the body: its mass (diameter and density), speed and angle at the moment of its entry into the atmosphere. The output data are the values of the same parameters, which allow us to estimate the behavior of mass as a function of height or other parameter relationships.
The parameters values calculated from observations in the previous section correspond to the program output. Therefore, different initial conditions were simulated (input values varied) to reveal which of them corresponded to the known output values. For our simulations, 480 km was considered to be the atmospheric entry height. The change of azimuth angle between the moments of atmospheric entry and the visible part of the trajectory (meteor) may be neglected for our tasks [27,28]. The mass is defined by the object diameter and density. For our simulations, the initial diameter and velocity were varied as follows: d0 = (0.5–7.0) m and υ0 = (11.3–17) km/s. The initial angle to the horizontal (α0) was taken ~1° less than the observed value (α0 = 25.3°), as it slightly changes during a meteoroid passage. The ablation coefficient and pancake factor values [27,29] were determined experimentally during the series of simulations (1.1 × 10⁻⁷ and 4, respectively).
With the known υ(visible), α and the height of the break-up (h(breakup)), the Stagnation pressure can be calculated. Then, considering to which meteoroid composition it corresponds (ice/stone/iron), the meteoroid density could be estimated [29,30]. Unfortunately, in our case, h(breakup) is unknown. Therefore, we proceeded from simple assumptions. Stony and especially ice meteoroids when heated and explode are usually crushed into fragments. Metal projectiles can withstand pressure and reach to the ground surface entirely. The small body made of ice would not reach h3. If it were an iron body, then it would probably result in a meteorite and a small crater. However, considering the videos, it seems that the object totally (or almost totally) burned up in the atmosphere. Then, most probably, the meteoroid was stony. Consequently, for our simulations we varied the mean density of the object (ρ) between 2500 and 3500 kg/m3. In the process of simulations, the upper limit of ρ value was increased in order to bring the modeled explosion height h(burst) value closer to the observed explosion height (h2). Therefore, in the first approximation, the object seems to have been a dense rock with some iron inclusions.
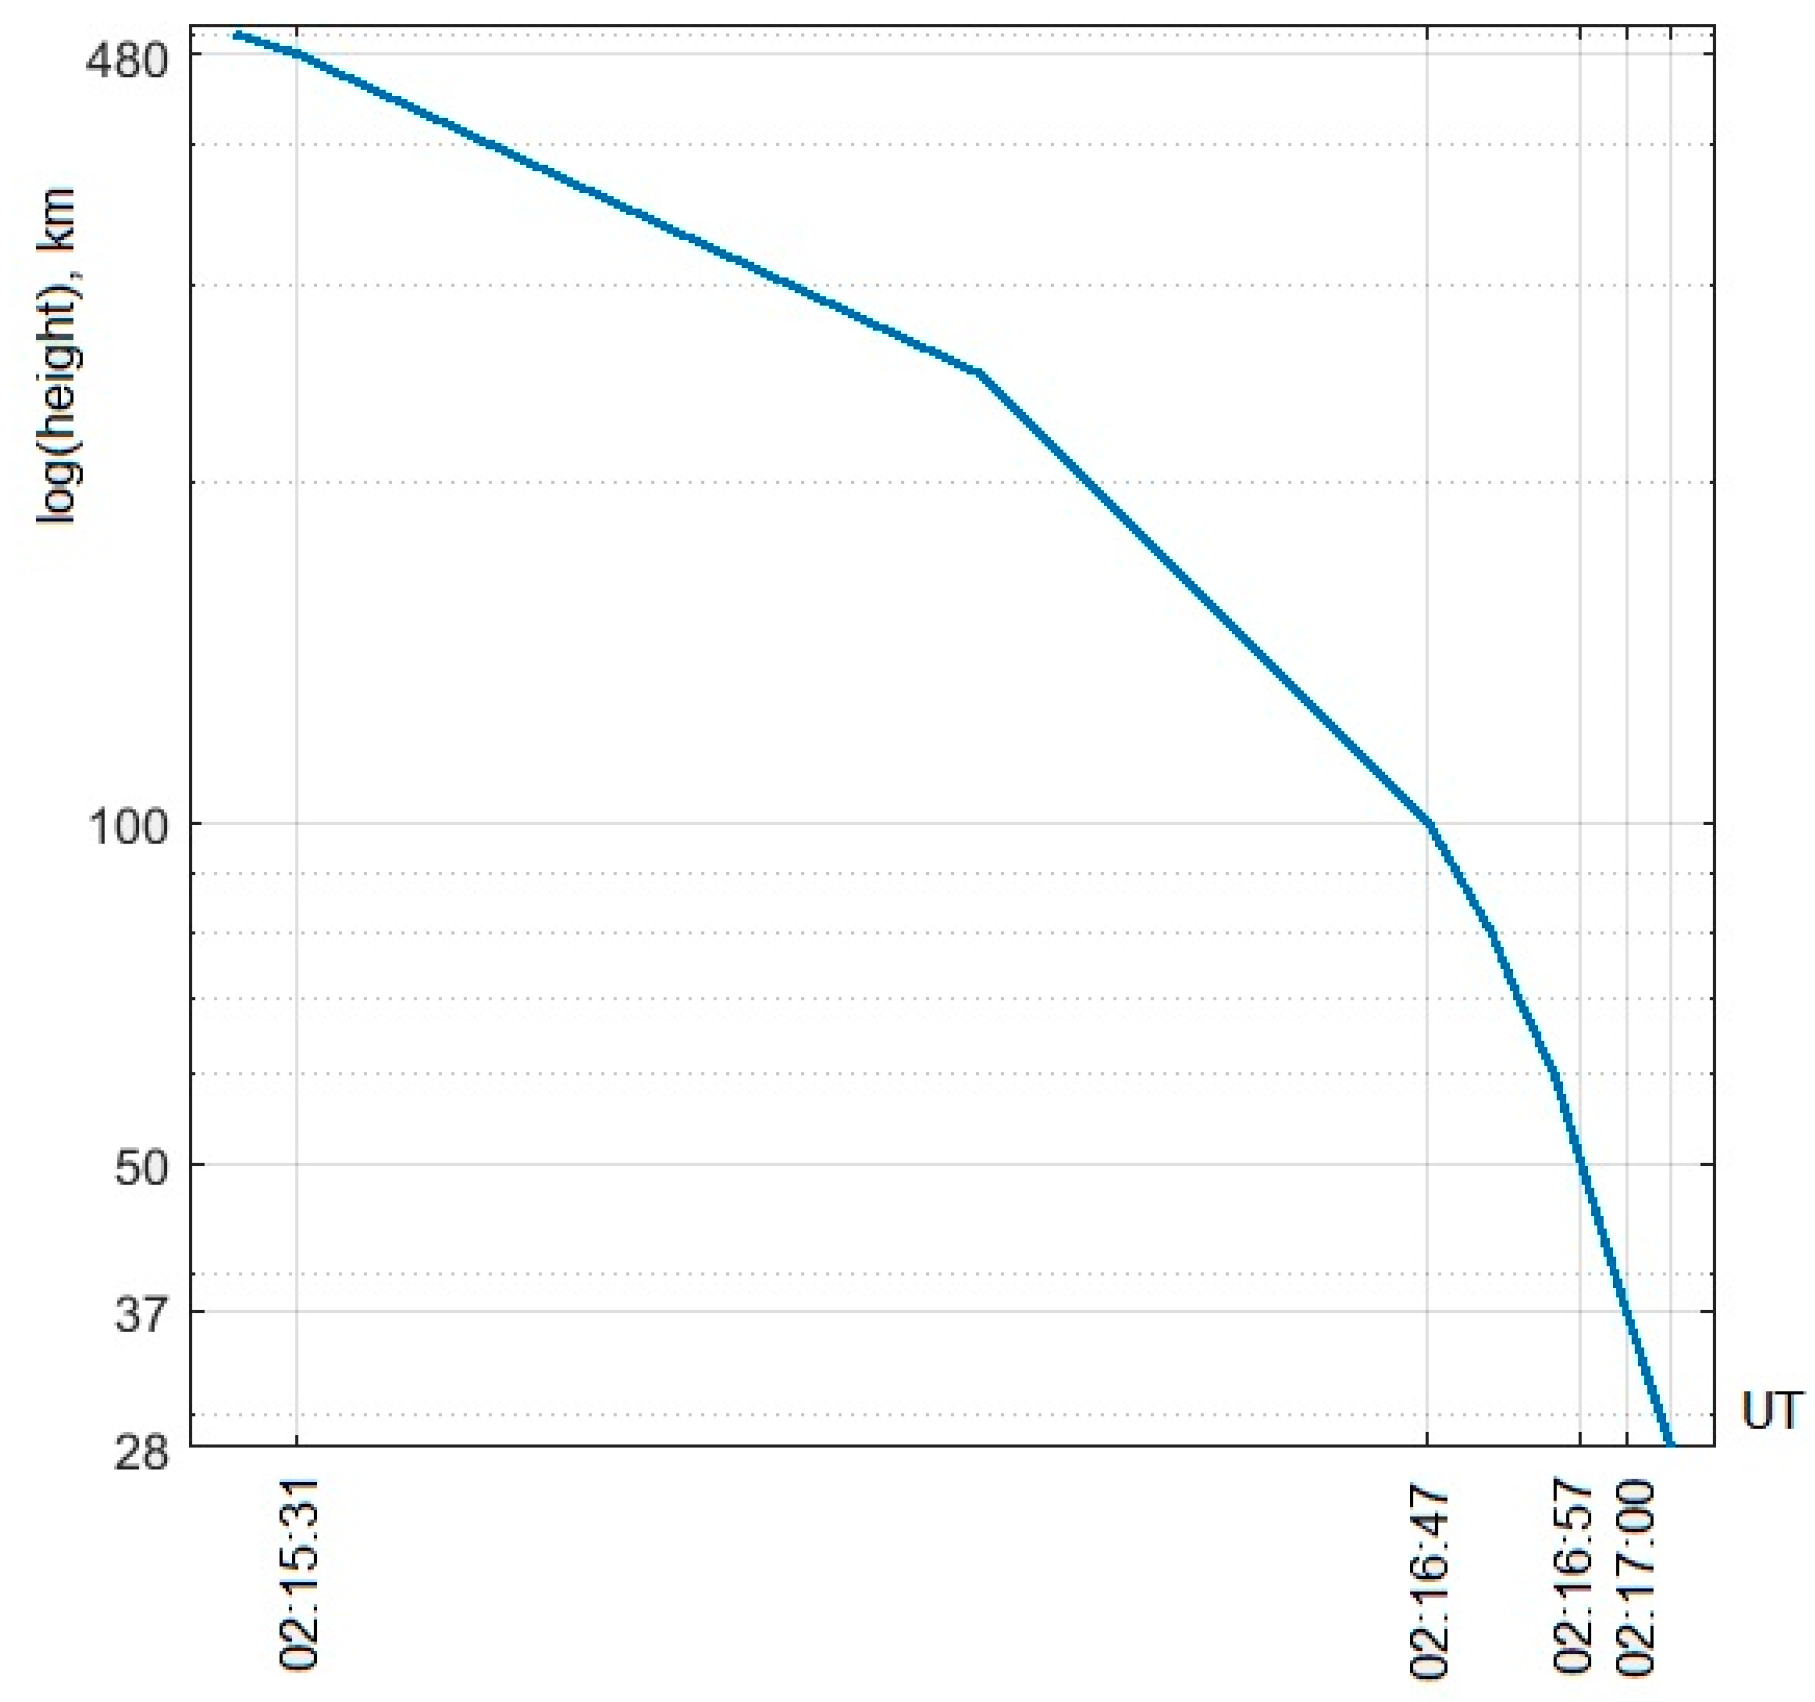
According to our simulations, the most probable scenario was as follows. (1) Atmospheric entry occurred with the following parameters h0 = 480 km, d0 = 0.7 m, ρ = 4000 kg/m3, m0 = 719.2 kg, α0 = 25.3°, υ0 = 12 km/s. The estimated total kinetic energy before the atmospheric impact was E0 = 5.1 × 10¹⁰ J. (2) The maximum energy deposition 806,775.8 J/m occurred at 55.3 km above the ground (before the explosion). (3) The break-up and explosion occurred at close altitudes h(breakup) = 40 km and h(burst) = 39.2 km, respectively. The energy deposited with the explosion was E = 271,160 J/m. (4) The “final” object’s dimensions were d = 18 cm, m = 14.05 kg at 36.6 km. The object speed at 37 km was υ = 9.87 km/s and α = 26.8°. Figure 6 illustrates reconstructed characteristics of the meteoroid flight.
The reconstructed value υ = 9.87 km/s at 37 km exactly coincides with υ(visible) = 9.87 km/s at 36.8 km. The reconstructed height of the explosion h(burst) = 39.2 km is close to the observed h2 = ~36.8 km. To validate our results we also compared them with the results by “ImpactEarth!” simulator [27] available at www.purdue.edu/impactearth introducing the reconstructed input values. The simulator results were h’(breakup) = 37.2 km, h’(burst) = 36.3 km, υ’(after burst) = 8.91 km/s; energy before the atmospheric entry 5.17 × 10¹⁰ J = 0.12 × 10⁻⁴ MegaTons TNT and the airburst energy 2.32 × 10¹⁰ J = 0.55 × 10⁻⁵ MegaTons. According to the simulator, no crater could be formed, although some fragments could strike the surface. The frequency of such a phenomenon is, on average, less than 1 month. The results are very similar. Therefore, we consider the reconstructed scenario to be possible. To emphasize, our estimation is of qualitative character as few observational data were available (only outdoor uncalibrated camera videos). Even when more data are known, the meteoroid parameter estimates vary significantly in literature, as, for example, for the Romanian meteoroid that passed on 7 January 2015. According to different authors [2,3,31,32], its initial diameter, velocity, heights of the fireball and explosion varied in different works as ~(0.87–1.15) m, ~(28–40) km/s, ~(100–39) km and ~43 km (~0.4 kilotons), respectively. The Morelian meteoroid seems to be to some extent similar to it (diameter, density, meteor and explosion heights). However, their energies were different (E = 1012 J in the Romanian case). According to [31], the Romanian meteoroid was not quite typical and there was a possibility of small fragments (maximum of a few centimeter size) reaching the ground. As far as the authors know, no fragments were found. In our case, we suppose that the body was totally or almost totally burned in the atmosphere. Maybe some small particles reached the ground, but we assume it would be impossible to find them due to the small size. Thus, we do not calculate the possible impact area.
Knowing the meteoroid’s velocity and time when it was at h1, and using the results of Figure 6e,f, it was possible to estimate the approximate time when it was at other heights including 480 km, 250 km (F region) and 100 km (E region). For this matter, the oblique path traversed by the meteoroid was calculated (analogously to Figure 4c) for each part of the trajectory characterized by different υ and α. This gave us the reconstructed trajectory of the object: coordinates of the path projection points corresponding to each altitude above the ground against time. Figure 7 illustrates the results. Therefore, we can associate the time and coordinates of the ionospheric response to the time and coordinates of the meteoroid event (entry, flight, explosion).

6. Possible Ionospheric Impact: Results of Observations

6.1. General Considerations and Methods (Approaches) Used

Rapid temporal fluctuations of the radio signal phase and amplitude are known as ionospheric scintillations [33]. In general, they are most pronounced during geomagnetic storms [34,35]. Other physical phenomena (e.g., tsunami, earthquakes, explosions, etc.) can provoke atmospheric and related ionospheric waves, which cause ionospheric irregularities that in turn provoke scintillations, e.g., [36]. The Morelian meteoroid could cause some small-scale ionospheric disturbances, which provoke these effects. Trajectories of large objects or objects with high kinetic energy, which pass through the atmosphere, can be considered as the source of shock-acoustic waves (SAW). In turn, SAW generates waves of multi-scale local electron concentration disturbances in the ionosphere [7]. A meteoroid that passes through the ionosphere and explodes in the lower atmosphere can provoke SAW. For instance, the large Chelyabinsk event caused by different estimates ionospheric disturbances with amplitudes of ~(0.1–0.5) TECU and periods (1.5–15) min [14,15,37].
The ionospheric parameter usually used for SAW-generated ionospheric disturbance detection is sTEC, for instance [38,39]. sTEC value is measured along the ray paths from GNSS satellites which cross (or pass near) a disturbance region in the ionosphere. Global availability of TEC data makes them a convenient tool for detection of fine effects in the ionosphere. At the same time, its potential sensitivity can be limited by the GNSS data temporal resolution and the processing procedures applied in a receiver [40]. To note, sTEC response to SAW is expected to be the most pronounced when SAW is excited in the F-region of the ionosphere. When a SAW source is at other altitudes or has a low power (our case), the sensitivity of sTEC-based detection tool can be insufficient. For the reliable detection of TIDs of different scale caused by a relatively weak SAW the use of an additional detection tool can be beneficial. In this study, in addition to sTEC, we suggest the possibility of detection of the secondary small-scale waves from ionospheric disturbance of the order of the first Fresnel zone at GPS frequencies (0.1–1 km) using ionospheric scintillation indices. The secondary wave disturbances generated by the main disturbance wave in the ionosphere last more than the primary (main) disturbance wave and if sufficiently intense (>(3–5)% change of the background electron density) can be a source of amplitude and phase scintillations of trans-ionospheric signals. For the experimental detection of SAW-generated waves of small-scale ionospheric disturbances, the amplitude (S4 and DROTI) and phase scintillation indices (σφ and d2fi) were used in this study. The use of high-rate measurements provided the high sensitivity of the indices [41].
Hence, to reveal the ionospheric response to the Morelian meteoroid flight and explosion, the data of ionospheric scintillation indices and processed sTEC time series were involved.

6.2. Data Used

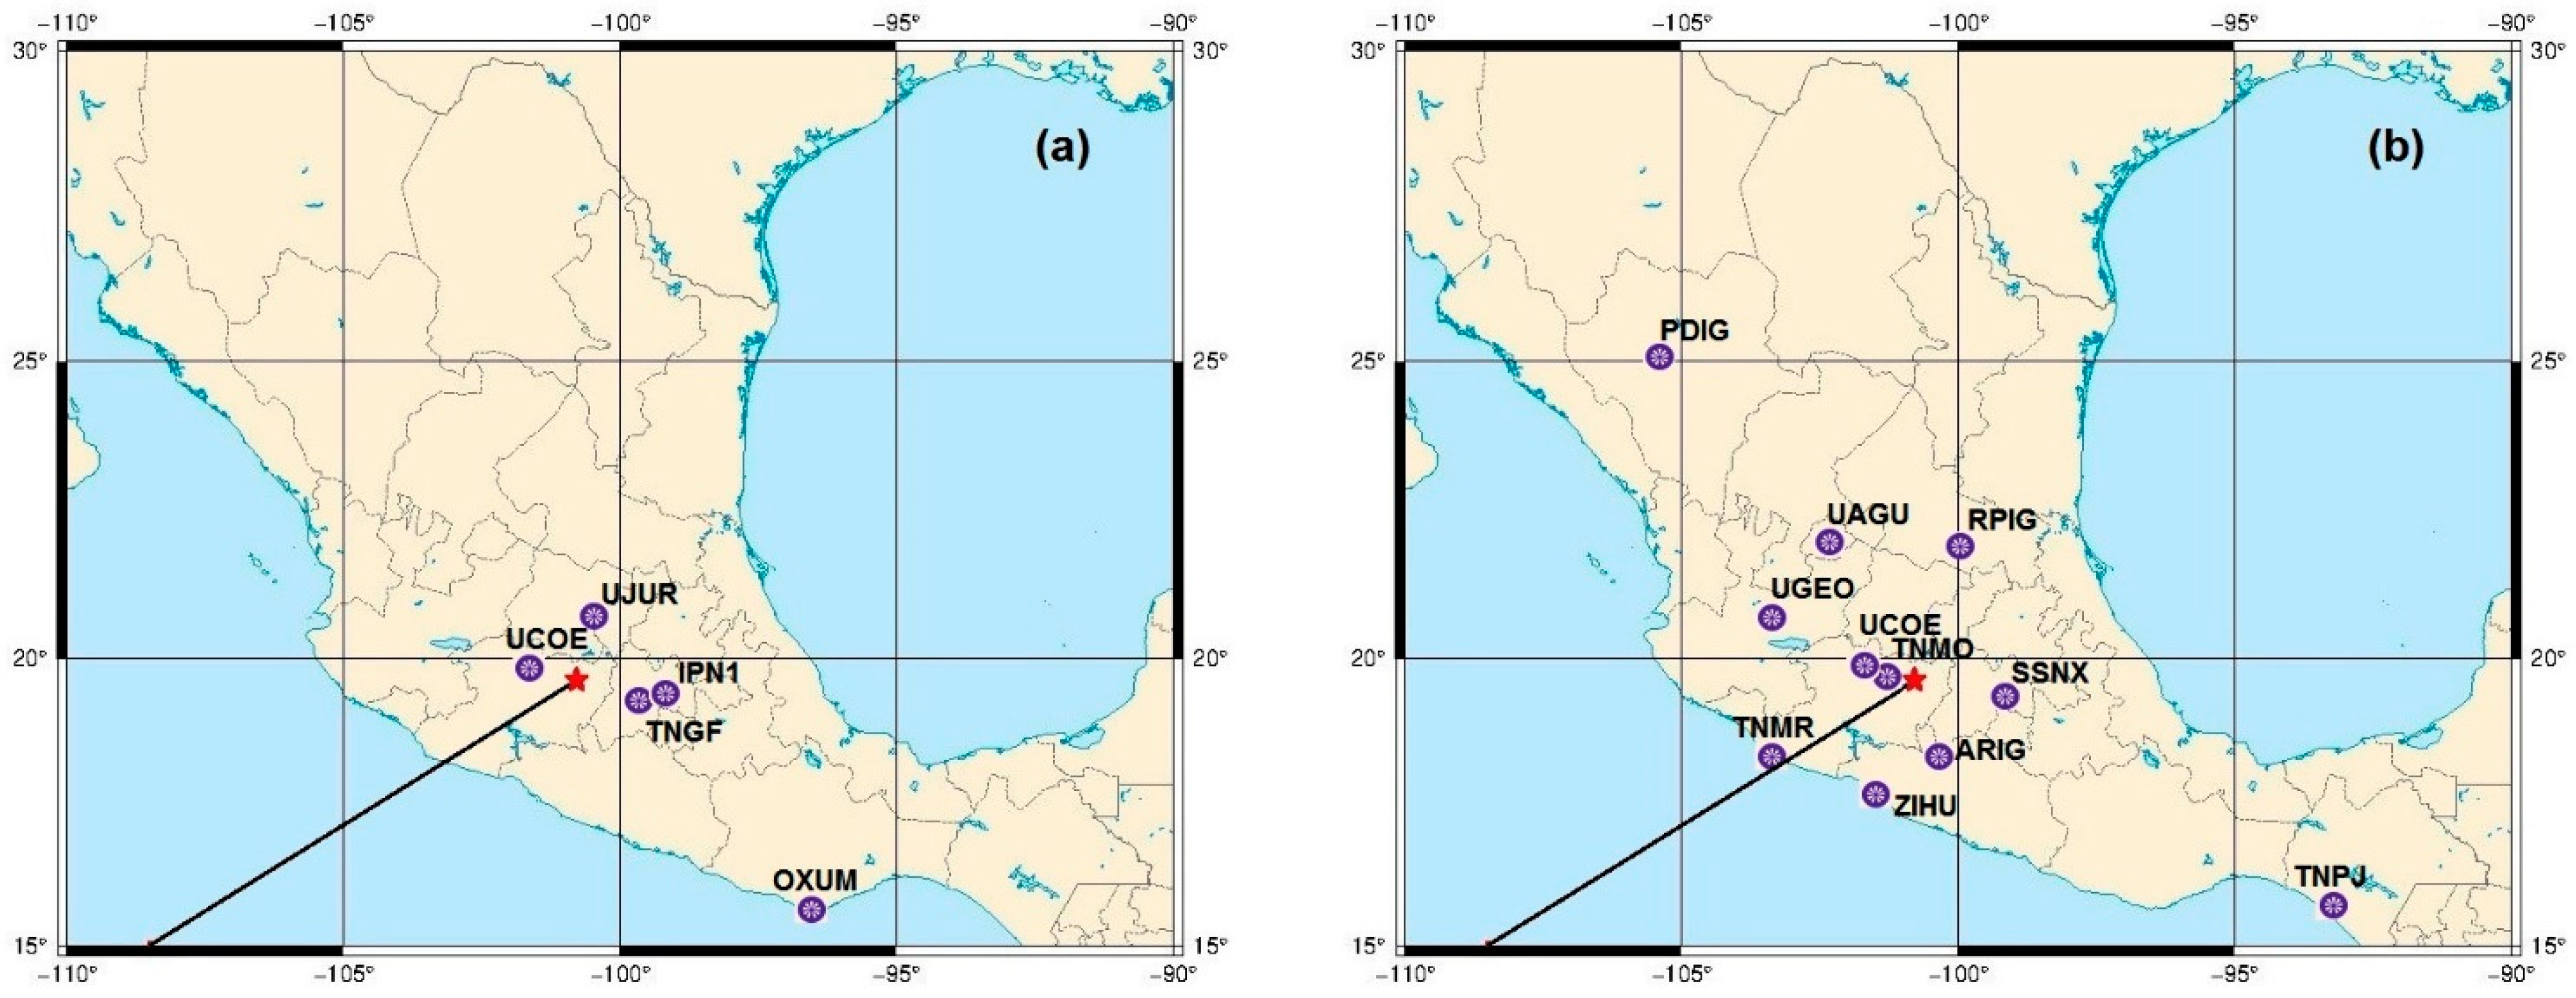
For scintillation indices calculation high-rate L1C and L2PY GPS observations were available from five GNSS receivers in Mexico (Table 2, Figure 8a). Only the measurements from GPS satellites with elevation angle θ ≥ 30° were used in order to separate the expected scintillation effects from the possible multipath effects. For the same reason, the data were compared with the measurements the day before and the day after the meteoroid. ROTI values were calculated from the detrended (by the centered moving window with 0.1 Hz cut-off frequency) sTEC data with 1 s time averaging [42]. The indices S4 and σφ were calculated from the detrended high-rate L1 data with 1 sec averaging time as well [43]. d2fi was calculated as the second-order derivative of GPS signal carrier phase without additional data pre-processing [41].
For the “classical” approach, the lower resolution data can be used. Such data were available from the eleven stations (Table 2, Figure 8b). Their data were processed with the SIMURG tools [44]. First, sTEC was calculated along the receiver–satellite line-of-sight (LoS) based on dual-frequency phase measurements. Further, sTEC series were detrended with splines and then filtered with the centered moving average with 2 and 10 min windows (2–10 min TEC variations). Finally, sTEC variations were converted to equivalent vertical variations (dIv). The same was done with 10 and 20 min windows (10–20 min TEC variations). Please see more details on the method in [44] and references therein.
The stations location of both high and low rate data allow us to estimate the spatial-temporal propagation of ionospheric disturbances after the meteoroid explosion.

6.3. Ionospheric Response Registered by Scintillation Indices

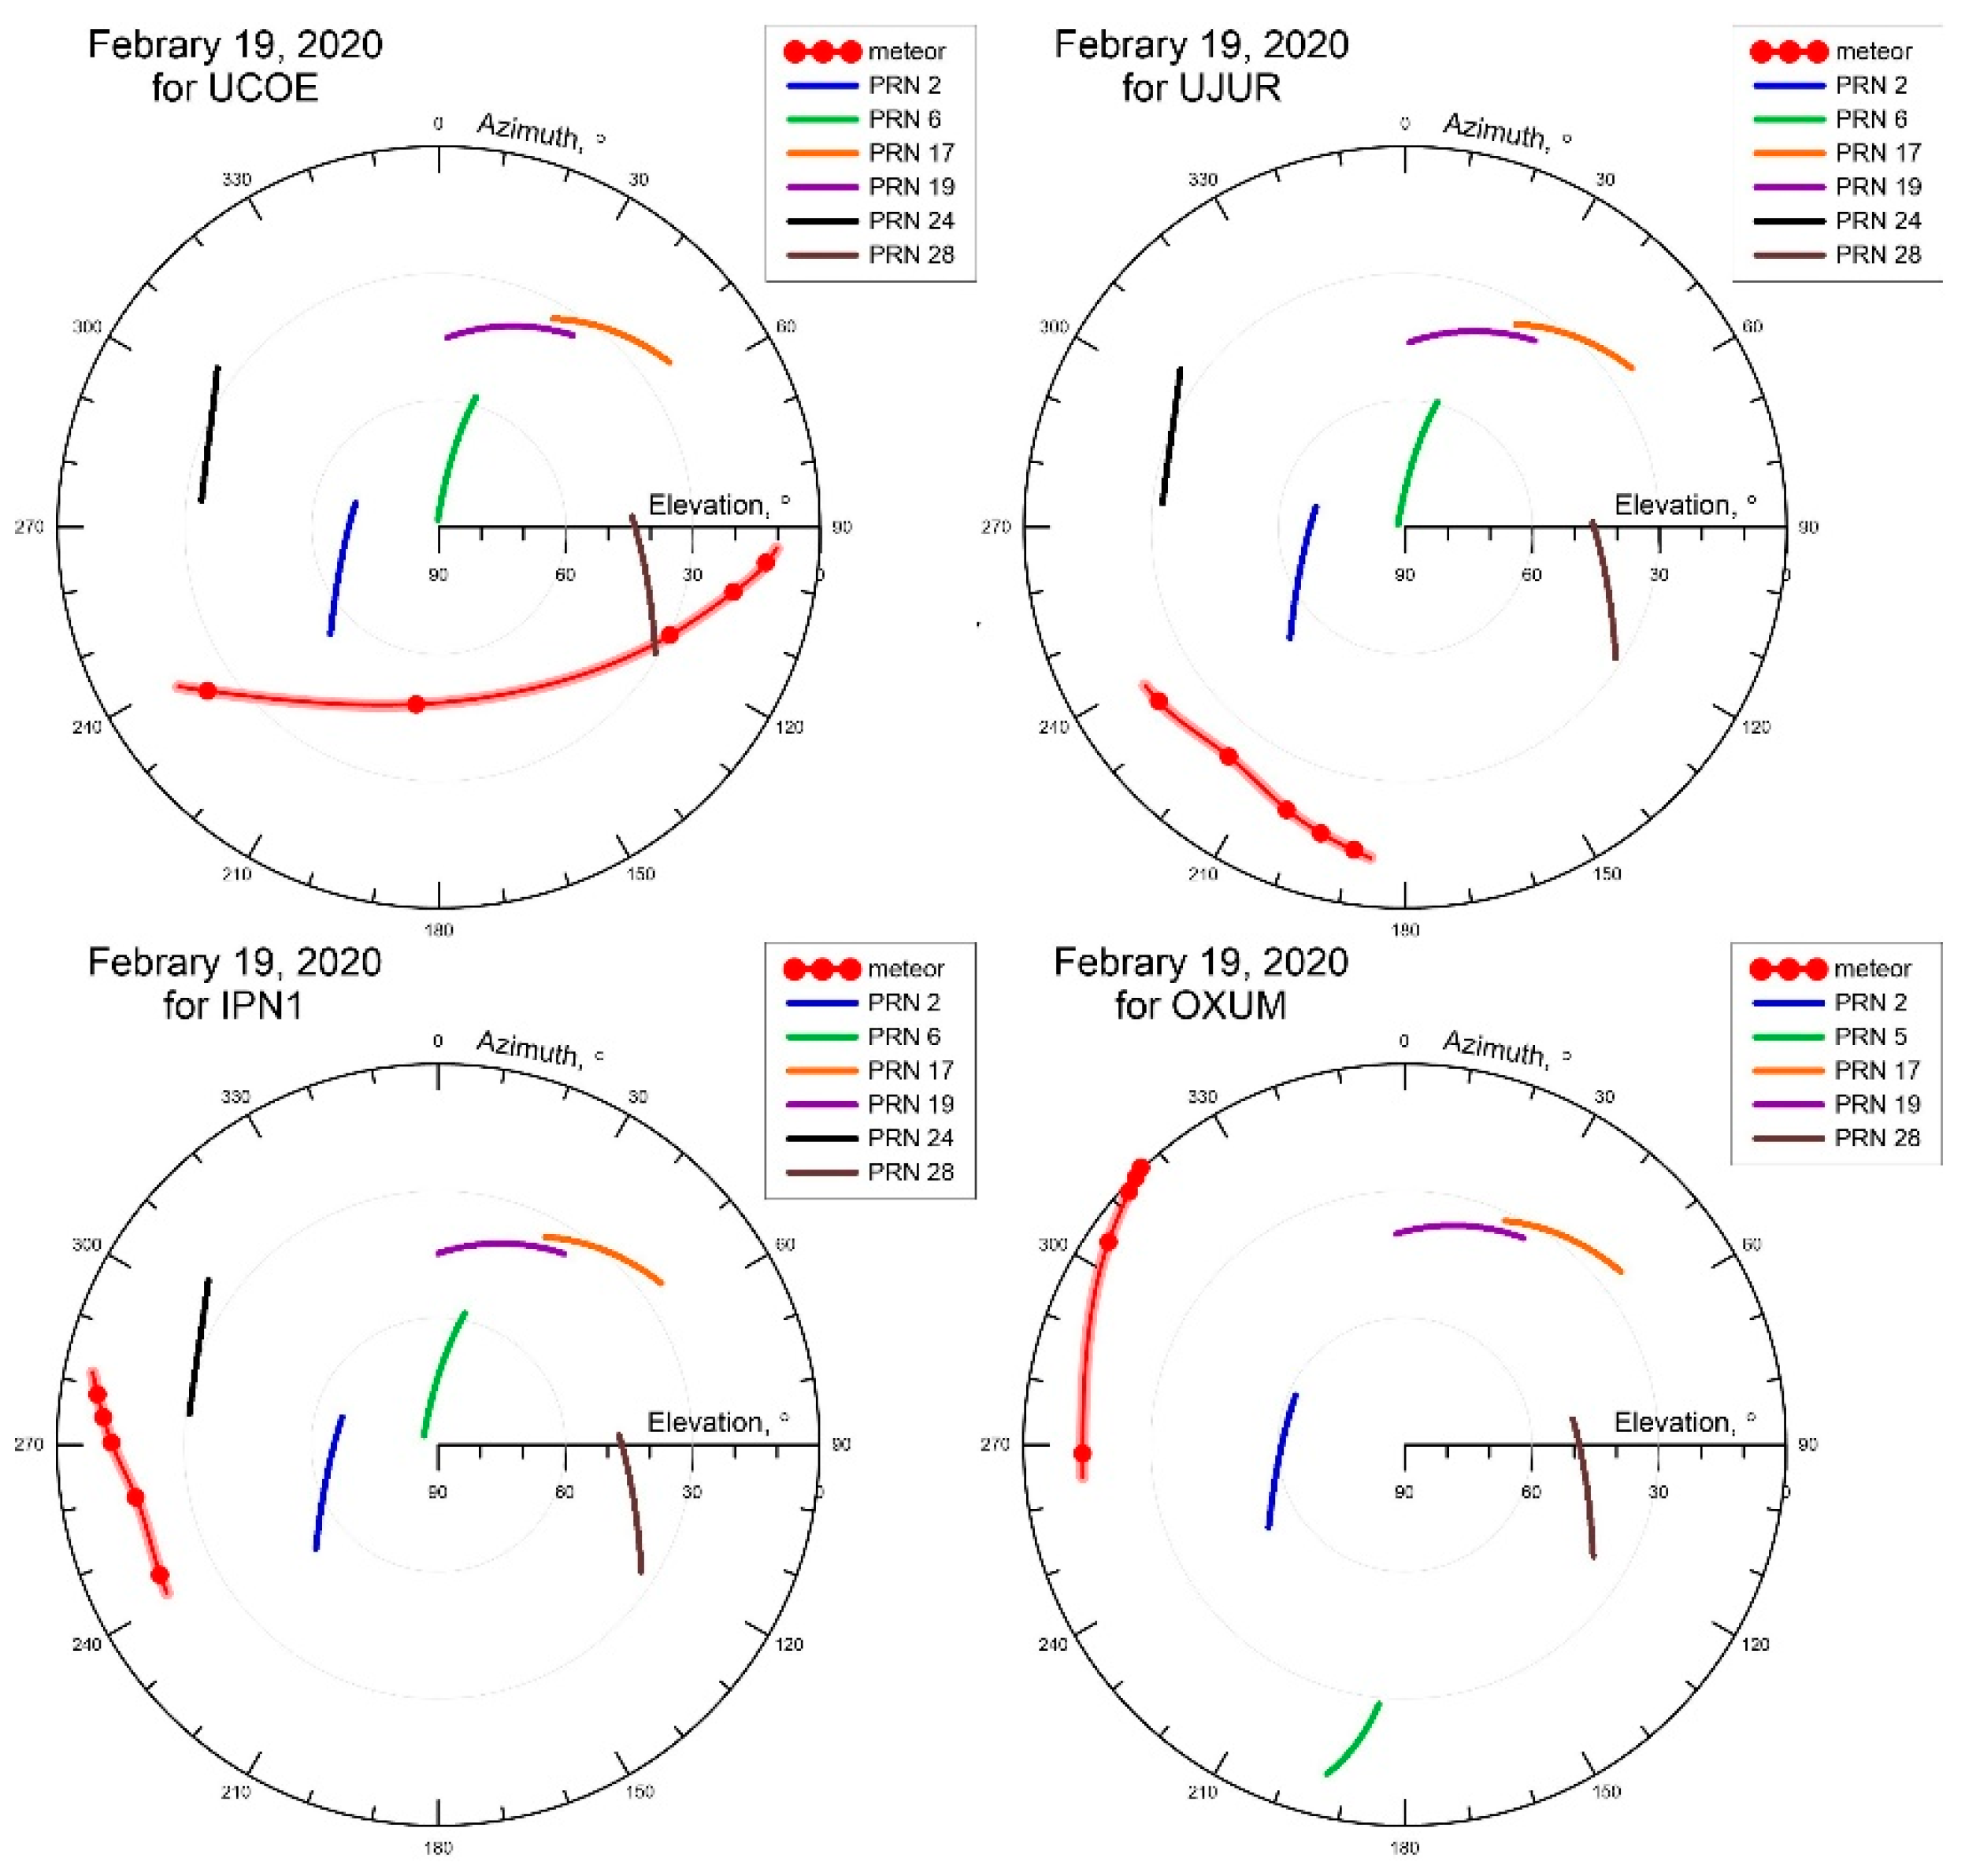
The meteoroid explosion occurred at h~37 km at ~02:18 UT generating a spherical SAW. In addition, a cylindrical SAW component was generated along the meteoroid flight and in front it [2,4]. The nearest station to the meteoroid trajectory and explosion site is UCOE (Table 2, Figure 8a). Stations UJUR, TNGF, IPN1 are “behind” the explosion and at greater distances. The most distant station OXUM is located southward from the meteoroid event.
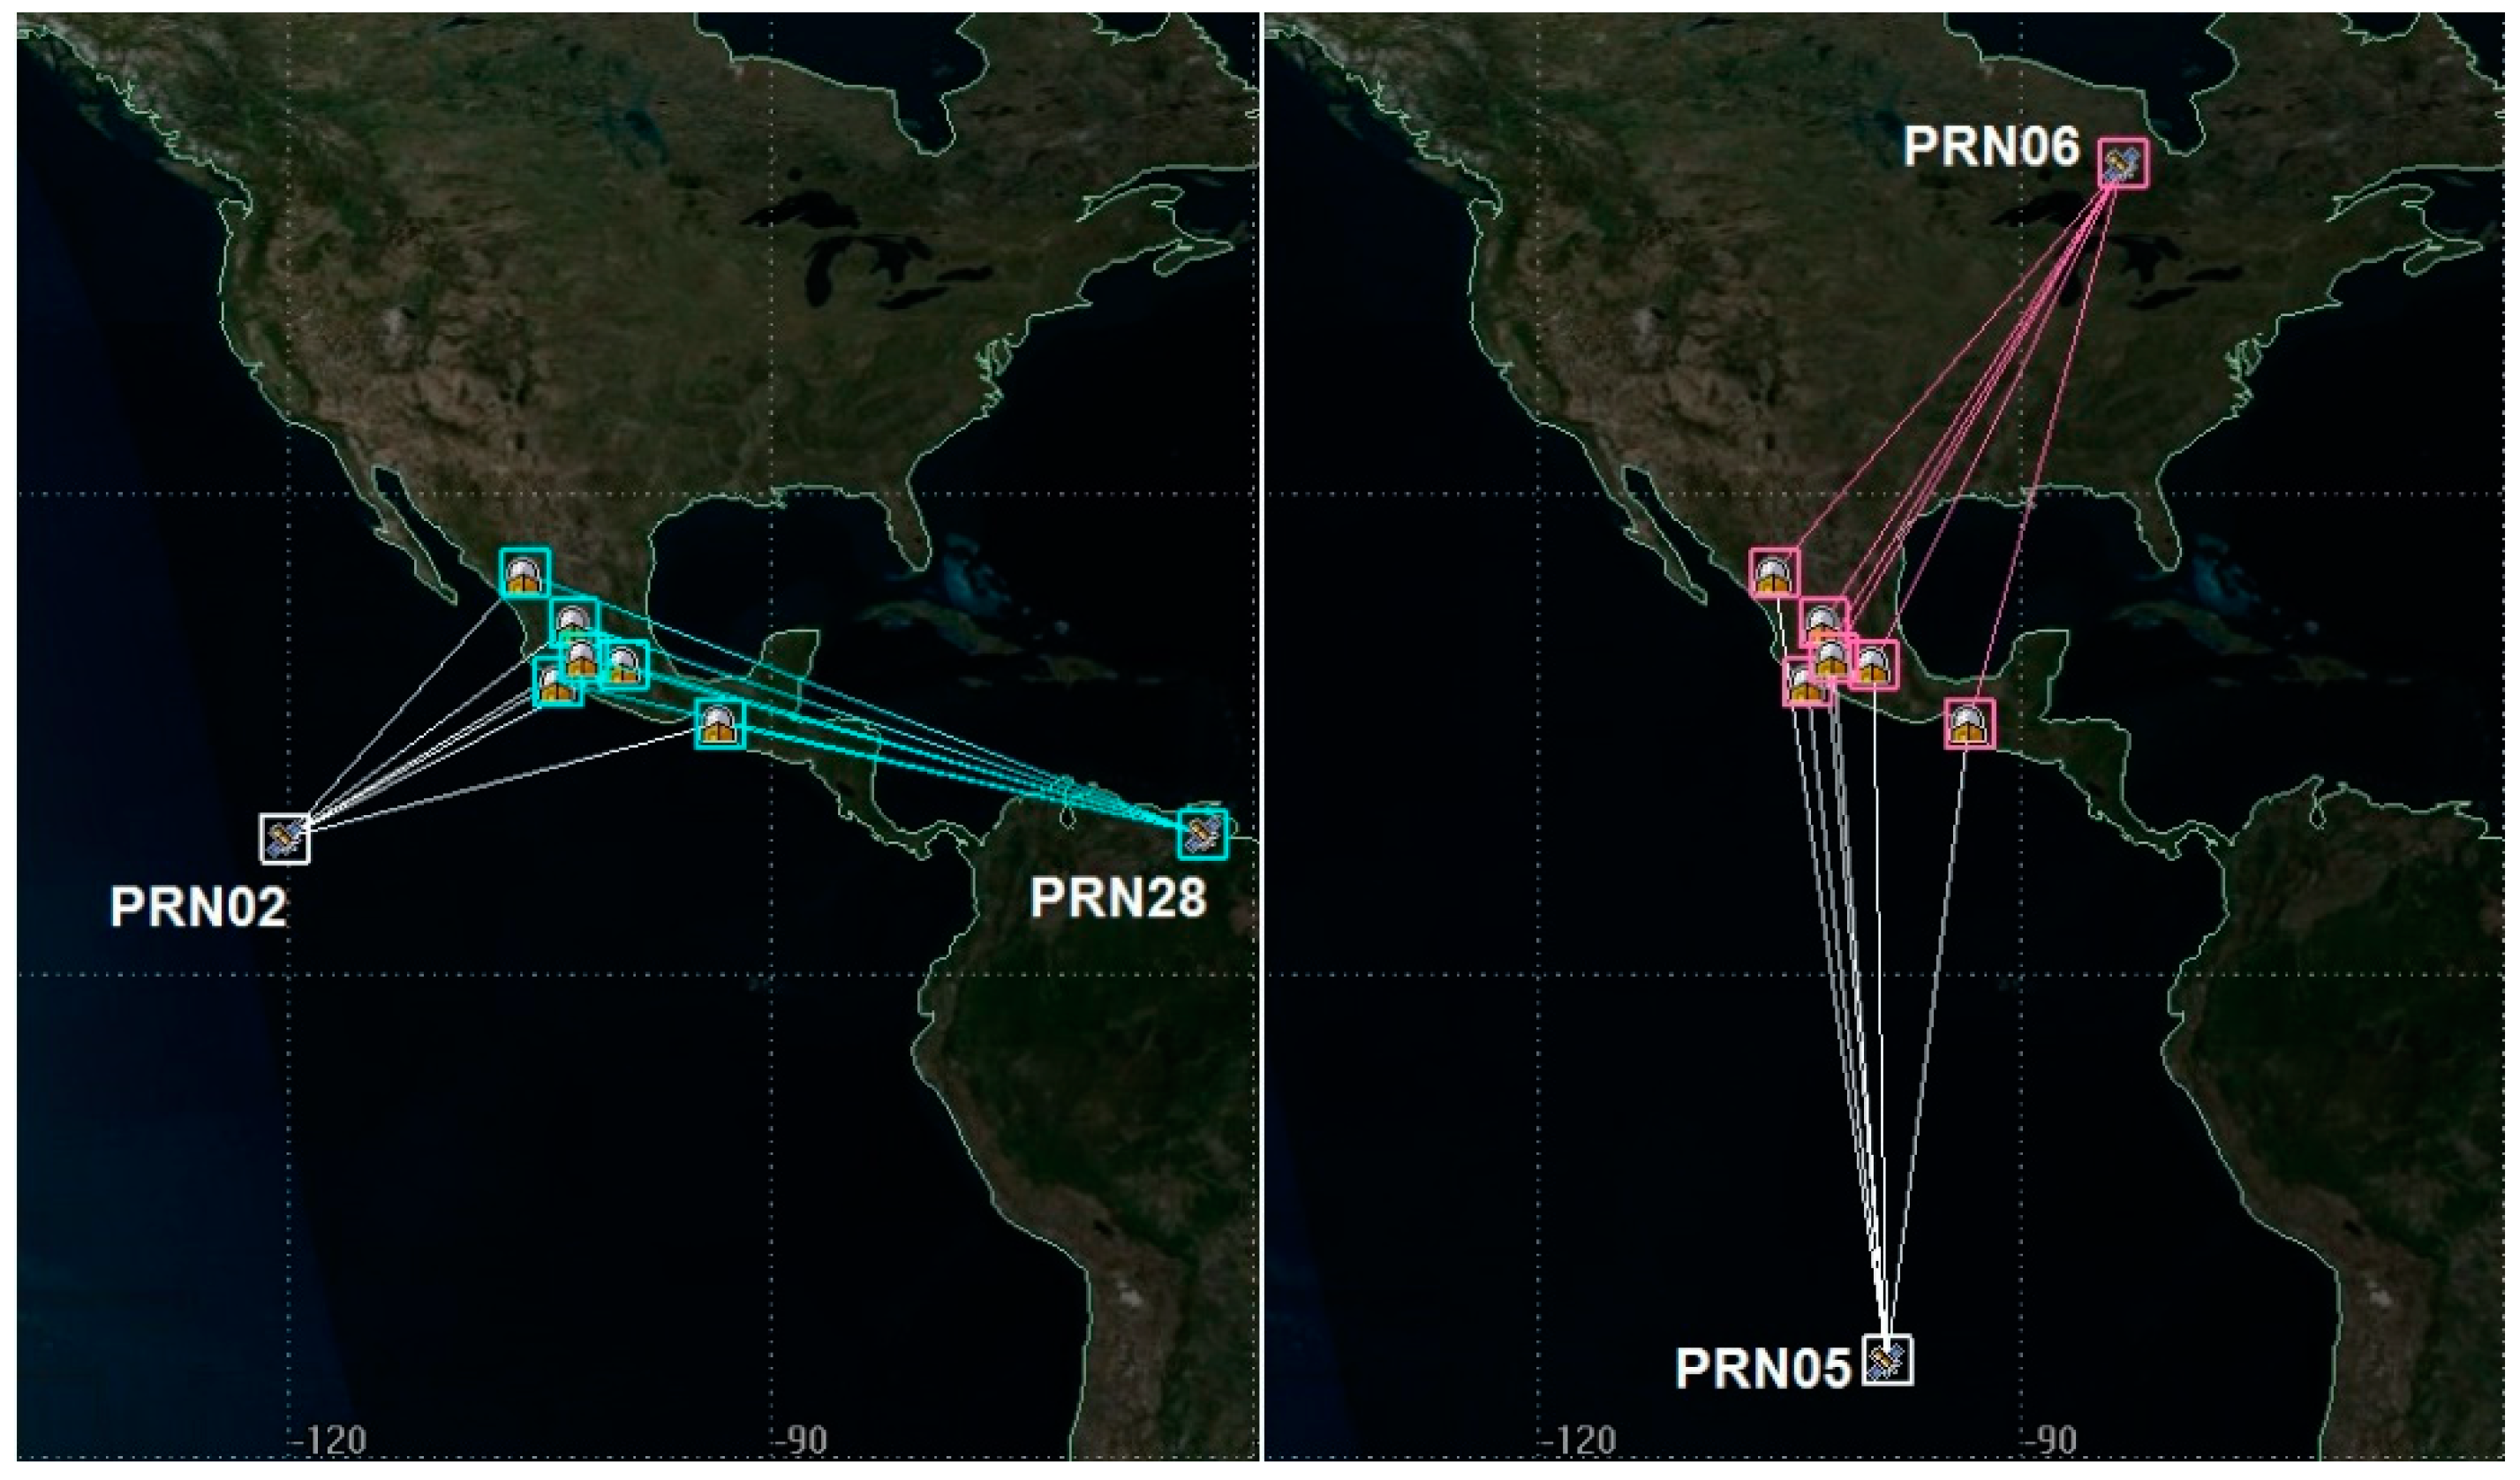
Figure 9 illustrates the ground projection of GPS satellite tracks selected to observe the ionospheric response to SAWs and the meteoroid trajectory with respect to receiver locations. The plot for TNGF is almost identical to IPN1 and not shown for the economy of space. The LoSs between PRN28 and PRN02 satellites and UCOE and UJUR receivers were the closest to the meteoroid trajectory. The only LoS at which the response to SAW was observed southward from the meteoroid trajectory was PRN05-OXUM.
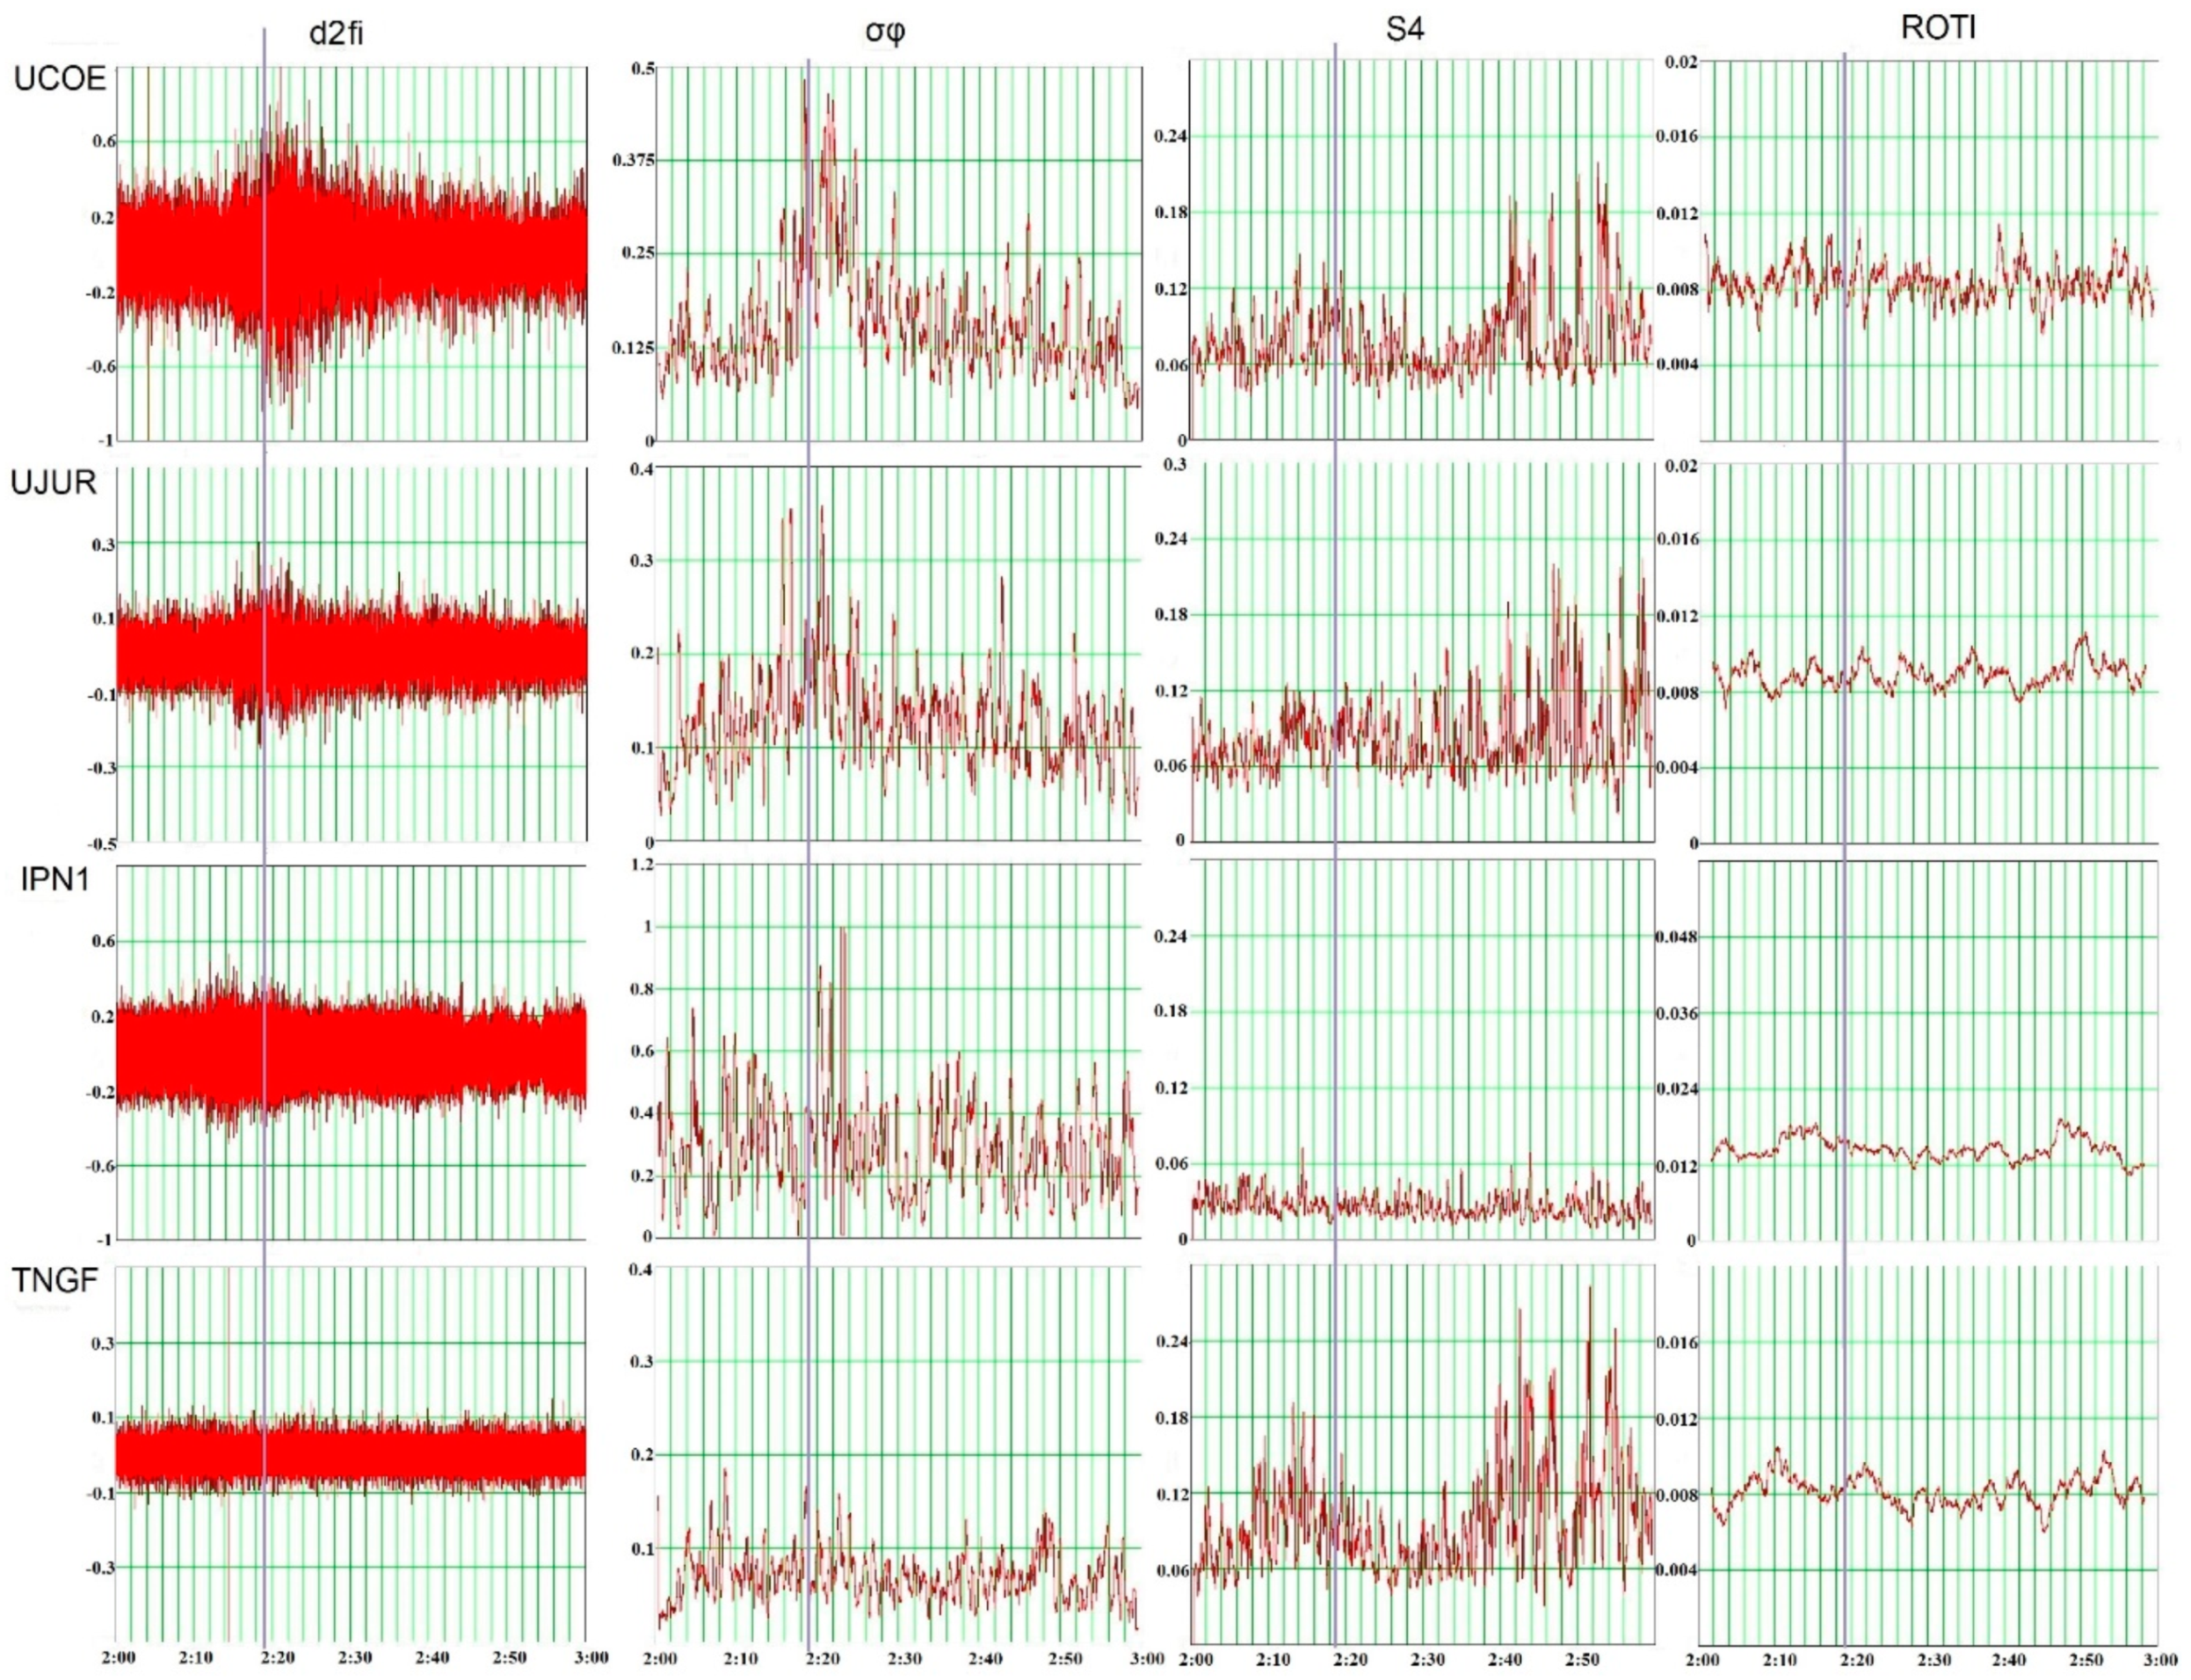
Figure 10 illustrates four scintillation indices behavior during 02–03 UT at LoSs between all the receivers and PRN02 calculated with L1 data. The same plots were constructed for other satellites (not shown for the economy of space; see Appendix C). Table 3 summarizes the overall picture of disturbance manifestations by different indices at different satellite-receiver rays. Columns from left to right are in order from the closest to the farthest to the meteoroid trajectory LoS with respect to UCOE. The sign “+” means an intense index response; “+/-” means a low intensity of manifestation; “^” means that a manifestation was delayed if compared to other indices at the same PRN; and “-“ means no index peak. The characteristic examples of index bursts are given in Figure 11.
The following overall picture of indices response to SAW-generated disturbances was observed.
(a) d2fi showed a clear response at all LoSs to UCOE (a bit earlier at PRN02-UCOE than at others because the meteoroid trajectory crossed this LoS first). d2fi behavior at UJUR was very similar to UCOE but with 3–4 times less amplitude and with more dispersed peaks. The responses registered at IPN1 were with few exceptions less pronounced and varied between the rays. The overall reaction to the event at TNGF was not so evident as at other stations. No response to the meteoroid was detected at any LoS to OXUM.
(b) σφ clear response at UCOE was registered first at PRN28, PRN02, PRN24 and a bit later at PRN06, PRN19, PRN17, which in general corresponded to the distance of the rays from the meteoroid trajectory. σφ measured at UJUR showed peaks of less amplitude and with some differences between the rays. The form of σφ response at IPN1 was similar to UJUR. To note, the σφ amplitude at IPN1 was higher than even at the closest to the explosion station UCOE. Maybe this could be related to the different processing procedures in this receiver because it is of different make (Leica) than others (Trimble). TNGF showed some mixed picture. OXUM showed σφ peaks at some rays with a certain delay as the farthest receiver of all. σφ second peak was detected at some satellite-receiver pairs about 6 min after the explosion.
(c) S4 peaks (when detected) appeared later than the peaks of phase scintillation indices. The picture at UCOE and UJUR was mostly similar. IPN1 showed the weakest or no response. TNGF showed almost no response. Different responses were detected at some LoSs to OXUM.
(d) ROTI reacted less frequently than the other three indices. Its bursts were registered only at some LoSs about 2.5–3 min after the explosion. Sometimes, the additional response was observed 6–9 min after.
Let us discuss some of the revealed general features.
(1) d2fi, σφ S4 and ROTI responded differently to the event when observed at a same LoS. This is because different scintillation indices respond to disturbances of different scale, lifetime and propagation parameters. This issue is discussed below.
(2) d2fi, σφ and ROTI first responded approximately (2.5–4) min after the explosion at the majority of LoSs. This is in accordance with the results of [38]. They revealed that the time period of ionospheric response to SAW generated by earthquakes was (180–390) s. Considering the F-layer height is at ~300 km, it gives us a range of SAW velocities of approximately (770–1660) m/s. In our case, the SAW source was at h2 = ~37 km; therefore, the SAW velocity was about ~1460 m/s, which is within the mentioned velocity range. The farther the station from the explosion site, the less pronounced (or even absent) and the later the detected response. At some satellite-receiver rays, the second peak of some index occurred 2.5–3.5 min after its first peak.
(3) Comparing four indices in all the plots, visually it seems that the d2fi-index highlights exactly the response to the meteoroid event, mostly ignoring other impacts (e.g., UCOE in Figure 10). This is because S4, σφ and ROTI variations depend both on the ionospheric turbulence intensity and the time of data averaging. In contrast, d2fi is calculated directly from the carrier phase measurements and better corresponds in time to the local ionospheric turbulences.
(4) In general, the character of σφ response was similar to d2fi. Sometimes, it was weaker, which is explained by the applied data averaging procedure because the averaging time does not always correspond to the prevailing scale of ionospheric disturbances. Although calculations of both d2fi and σφ were based on the carrier phase measurements, sometimes their response was not the same. Probably, the procedure of accumulation and averaging of the carrier phase counts for σφ calculation resulted in smoothing of the shortest small-scale disturbances and enhancement of the observed phase variations with a large period.
(5) Analyzing all plots, it was noticed that the overall response was pronounced more clearly to the northeast of the meteoroid trajectory. Westward from it, the response manifested itself much less. For example, according to Figure 10, d2fi showed its peaks at UCOE and UJUR, a finer effect was at IPN1 and nothing was registered at TNGF. The southern OXUM showed nothing as well due to the larger distance to the explosion site. Table 3 also confirms the more pronounced responses at UCOE and UJUR, than at IPN1 and TNGF. OXUM detected fewer indices peaks than other stations and only at some rays, which is due to its location.
The preliminary conclusion is that the SAW-generated disturbances moved non-uniformly. Probably, it is explained by the wind patterns at F-layer heights within the observation area. In general, at ~300 km the wind blows from the afternoon sector to the early-morning sector across the polar region and at the lower and middle latitudes zonally around the globe westward in the morning and eastward in the evening [45,46]. The value of the meridional component of its velocity is higher than the value of the zonal component. The direction of the winds undergoes very complex variations. The (20–30)° N zone of the northern hemisphere is a transient region between the wind patterns of high-middle and equatorial latitudes. The evening hours close to the solar terminator passage can also be considered as transient. Both apply in our case. The north-east component of the wind dominated at the time of the meteoroid explosion [46]. Considering that, it can be assumed that the neutral wind “filtered” the TIDs by their movement direction [7] which caused the non-uniform manifestation of scintillation indices response observed southward and northward from the meteoroid trajectory and explosion site. As the lifetime and speed of ionospheric disturbances of different scales are different, the neutral wind filtering effect can also partially explain the difference in the scintillation indices responses in time and at different angles of observation of satellites.
(6) The receivers TNGF (Leica) and IPN1 (Trimble) are at ~20 km from each other, which means practically the same conditions of observations. However, in many cases the indices behavior observed at two stations was different by amplitude and form of response. The significant difference in the level of phase measurement noise is notable for two stations (see d2fi in Figure 10). Despite the lower noise level at TNGF, in the majority of cases no index response was detected here. We suppose that the mentioned differences are due to the dependence of the measurement quality and sensitivity of the navigation receiver on its make/type, as it was shown in [40].
(7) In individual cases the peaks of particular indices were detected before the meteoroid explosion (e.g., S4 at 02:12 and 02:16 at some LoS to PRN28 and PRN06; ROTI at 02:17 at one LoS to PRN28). The gravity waves generated by the solar terminator are known to be a source of secondary waves of electron density disturbances in the F-region of the ionosphere [19,47]. According to the review [48], the medium-scale (~15 min) disturbances triggered by terminator usually are observed during (1–2) h or longer along the front of at least 1600 km two to three hours after the terminator passage at 100 km. Such electron density fluctuations tend to be of a wave packet form. However, in our case only some short (2–5 min) separate scintillation index peaks were observed individually. To add, the analysis of geometry of sub-ionospheric points and time of these individual peaks detection shows that they arose too early to be a terminator result. Therefore, the mentioned scintillation marks resulted from the isolated ionospheric irregularities. The last could be produced by a wide range of other than terminator phenomena. The ionosphere over Mexico is never stable as its latitudes are close to the sub-equatorial zone in which ionospheric scintillations predominantly occur.
(8) Some difference in the four indices responses to the same phenomenon at the same LoSs is explained by the fact that SAW generates multi-scale waves of electron concentration disturbances. A manifestation of refractive and/or diffractive effects of signal propagation through a disturbance depends on a signal wavelength, angular conditions (geometry of observations, disturbance scale and intensity). The ionospheric turbulences of several kilometers (intermediate scale disturbances) mostly result in the refractive effects and phase scintillation predominance over the amplitude scintillations of GPS signal. Usually, they are well detected with σφ and sometimes ROTI. When a disturbance size corresponds to the first Fresnel zone (about 300–400 m at GPS frequencies), both amplitude and phase scintillations can occur and usually manifest themselves in the well-correlated S4, σφ and d2fi behavior and sometimes ROTI sharp variations. The smaller turbulences (from tens of meters to 100–200 m) mostly result in the predominance of the diffractive scintillations of both amplitude and phase. d2fi and σφ are good tools for their detection. S4 usually detects the ionospheric turbulences of high intensity. The detection of diffractive small-scale turbulences depends on the data time resolution [41]. Our high-rate data allow this detection. Considering the said above, scintillation analysis should involve not some particular index but the ensemble of scintillation indices. Our results suggest that the registered TIDs were of small- (including 250–400 m corresponding to typical horizontal size of SAW generated disturbances), intermediate- and even medium-scale. According to [7], disturbances of intermediate and small-scale (0.1–1km) can accompany such phenomena as earthquakes, explosions, rocket launches, etc. The medium scale disturbances can be provoked by a variety of sources (including solar terminator). Magnetospheric storms are expected to provoke larger-scale disturbances. Thus, we are sure that the detected disturbances can be associated with the complex meteoroid event and not the geomagnetic perturbations that occurred before; neither were they a result of solar terminator.

6.4. Ionospheric Response Registered by dIv Data

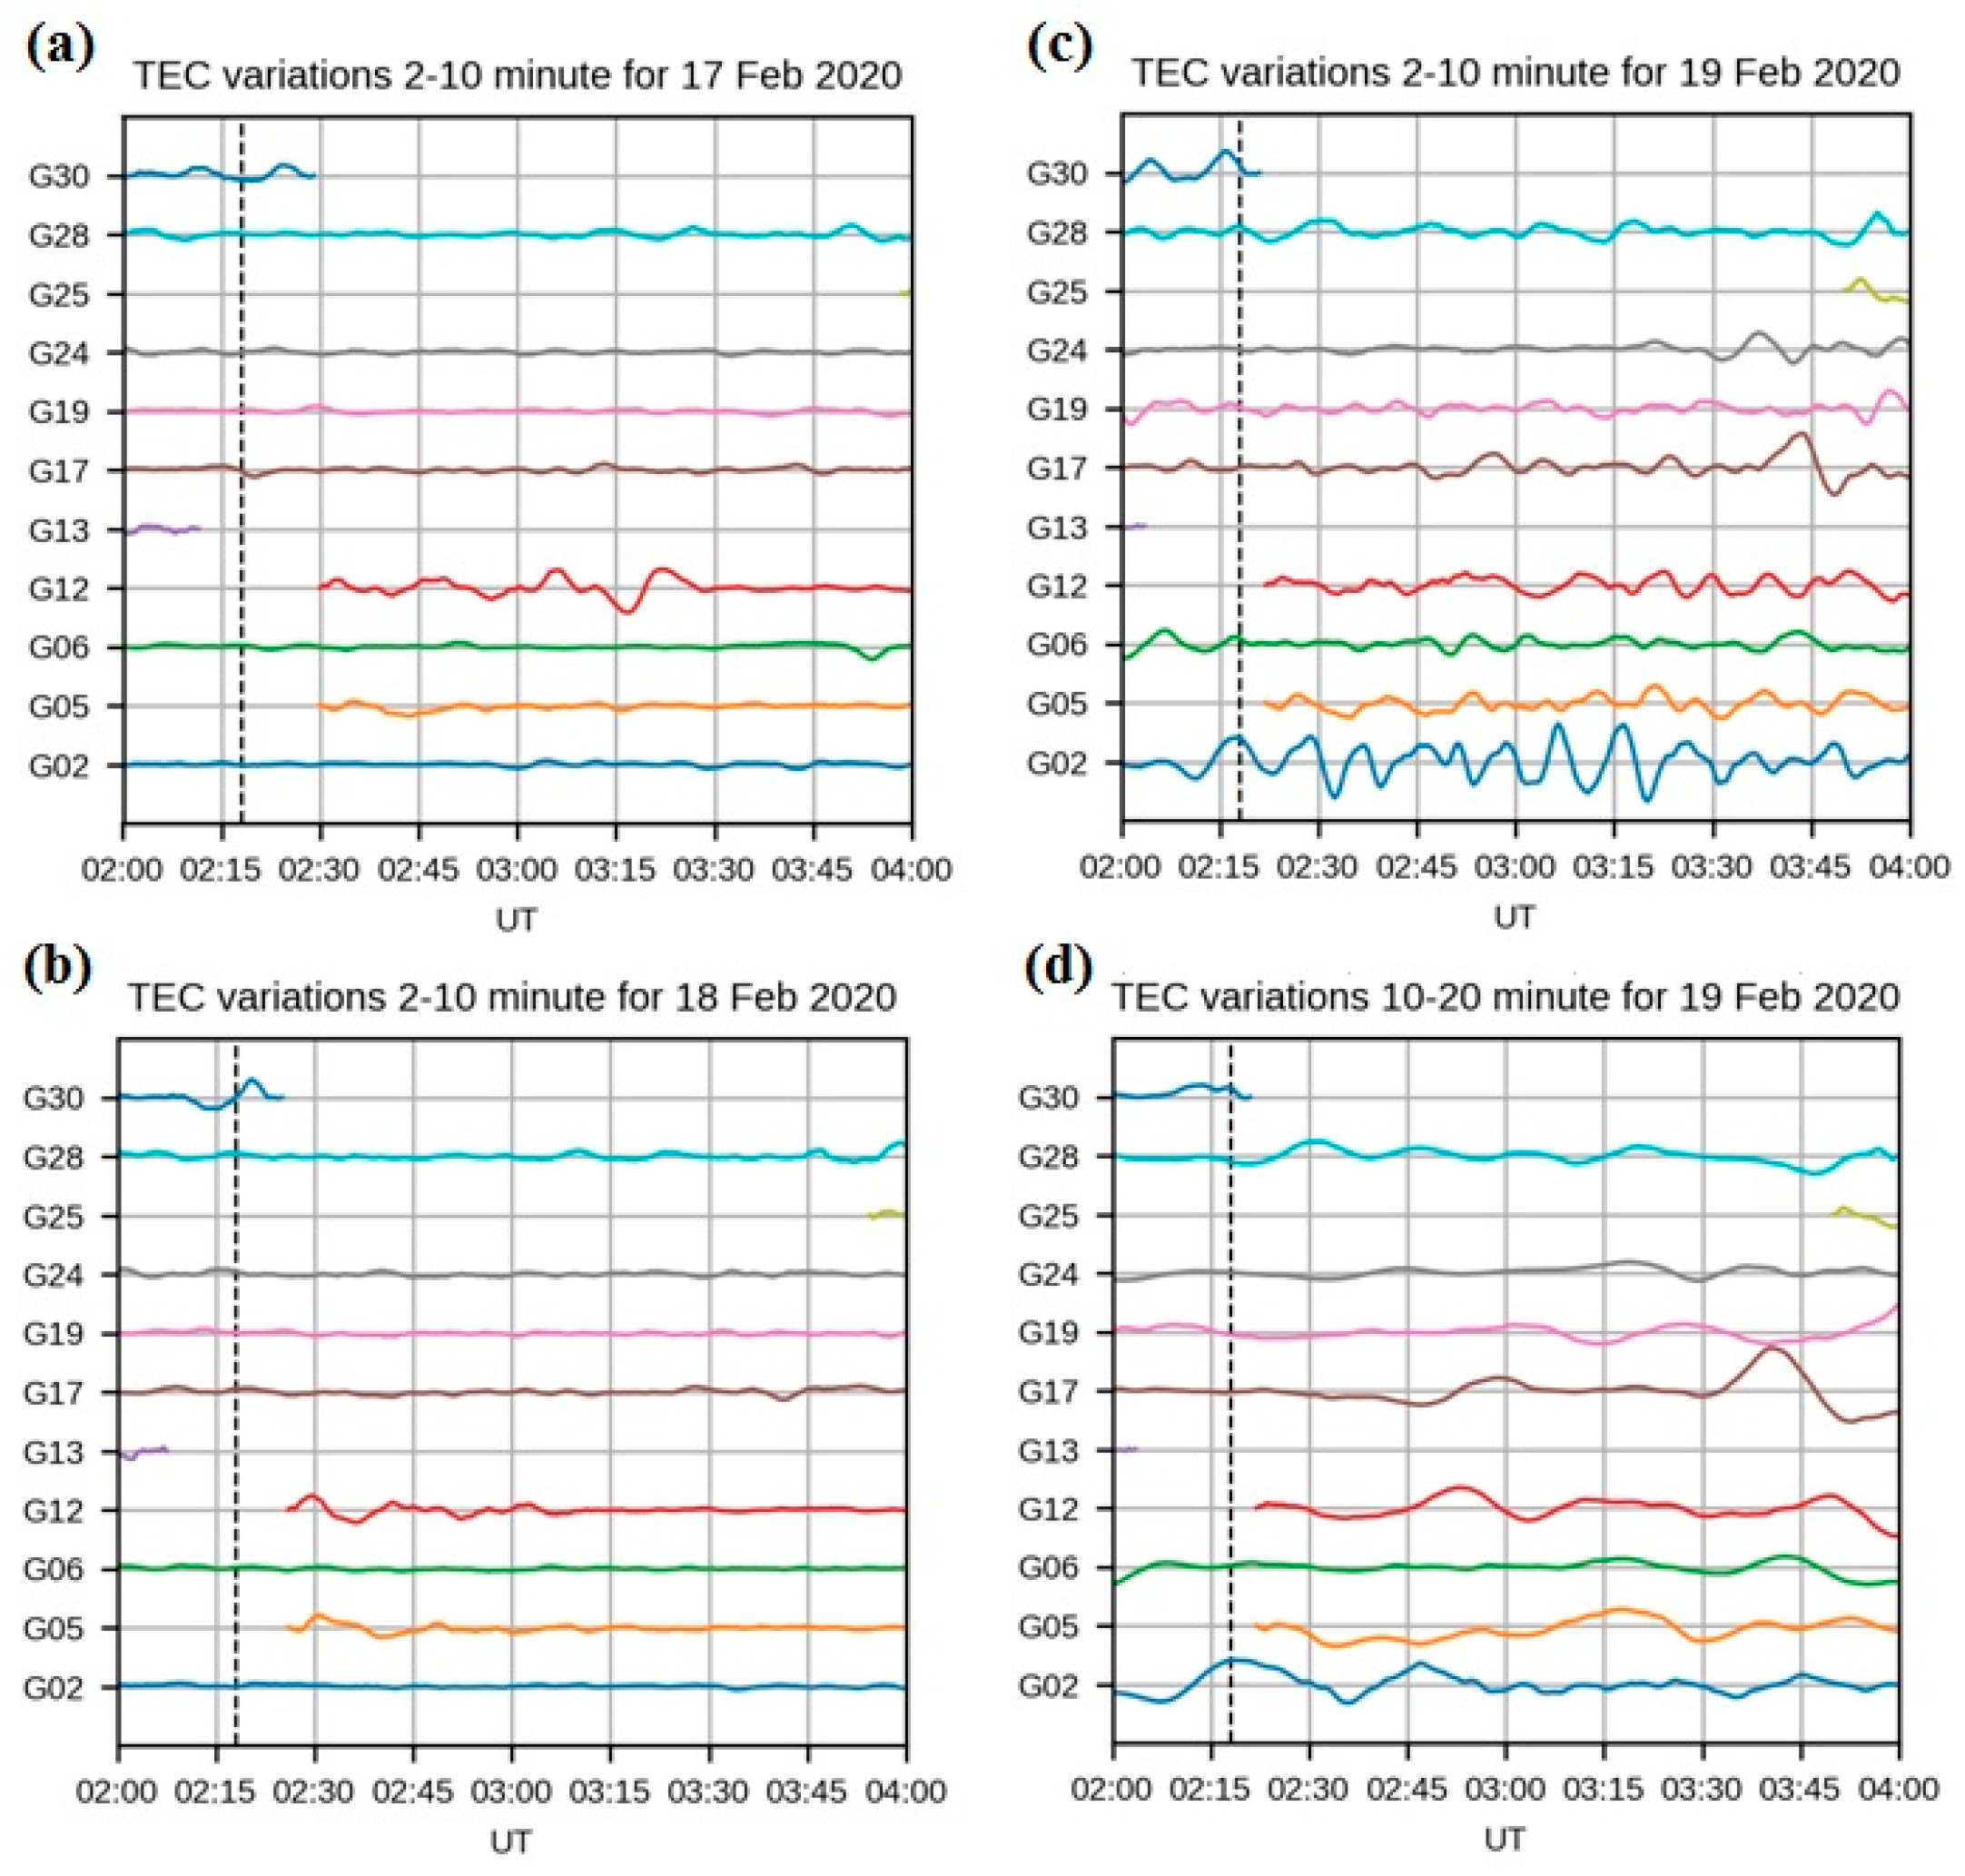
dIv time series for stations from Figure 8b were compared during the meteoroid day, the previous day characterized by moderate geomagnetic activity and the day before it which represents quiet conditions. Figure 12 shows the example of comparison for UCOE in the period of interest on 17–19 February 2020. The same plots were constructed for all the receivers. The overall picture was the same at all stations. (a) No ionospheric disturbances (except for some separate small peaks) were observed during the whole quiet day of 17 February. (b) On the following day, dIv at some lines-of-sight, showed isolated short disturbances detected within (19–21) UT. This interval corresponded to geomagnetic storm bay and its associated largest vTEC deviation (Figure 1). Therefore, these dIv fluctuations were the result of the storm. (c) In contrast to the previous days, 19 February was characterized by dlv > 0.1TECU. Despite the possible effects of solar terminator and geomagnetic storm, the characteristic disturbances caused by the meteoroid event can be distinguished at separate receiver-satellite rays during (02–04) UT.
The shape of the detected dIv disturbances in many cases looked like the wave-packet form (several minima and maxima), classified in work [13] as a type-III disturbance. According to this study, TEC disturbance of this type can be associated with gravity waves. Figure 13a,e provides the characteristic examples. Type-I disturbances characterized by a shockwave form of one maximum and one minimum (classical N-form response) were detected at several LoSs (Figure 13b,c). In some cases, the inverse N-form weak response (И-form) was observed (Figure 13d). The approximate period of type-I dIv fluctuations was about 15 min. According to [13], the type-I disturbances are generated by acoustic shockwaves. The type-II (isolated two maxima and one minimum) was not observed with some exceptions of the inverse type-II (two minima and one maximum) as in Figure 13f. The observation of different types of responses is due to different geometry of lines-of-site to satellites and their distance to the disturbance source. In many cases, the mixed complex fluctuations were observed which could be a result of superposition of different types. Probably, apart from the explosive SAW, the less intense cylindrical SAW formed by the meteoroid flight and the meteoroid wake played some role in the fluctuations in particular directions [3].
Such disturbance signatures as reported above were observed previously after powerful earthquakes ([38] and references therein) and after the Chelyabinsk meteorite [13,14,15,37]. The disturbance amplitudes of (0.1–0.2) TECU exceeded the level of background fluctuations on the control days. Such amplitudes and the period of (2–10) min correspond to small-, intermediate-scale and SAW disturbances. The time-scale of the observed dIv(2–10) disturbances (11.2–20 min) corresponds to the range of the acoustic-gravity waves. The “slower” dIv(10–20) variations (shown in Figure 12d) correspond to medium-scale TIDs. Similarly to dIv(2–10), the behavior of dIv(10–20) did not reveal disturbances during the previous days (not shown for the economy of space). In general, dIv(10–20) showed similar features of disturbances as dIv(2–10), but with larger amplitudes and periods.
Analyzing dIv behavior at all LoSs, the following was revealed.
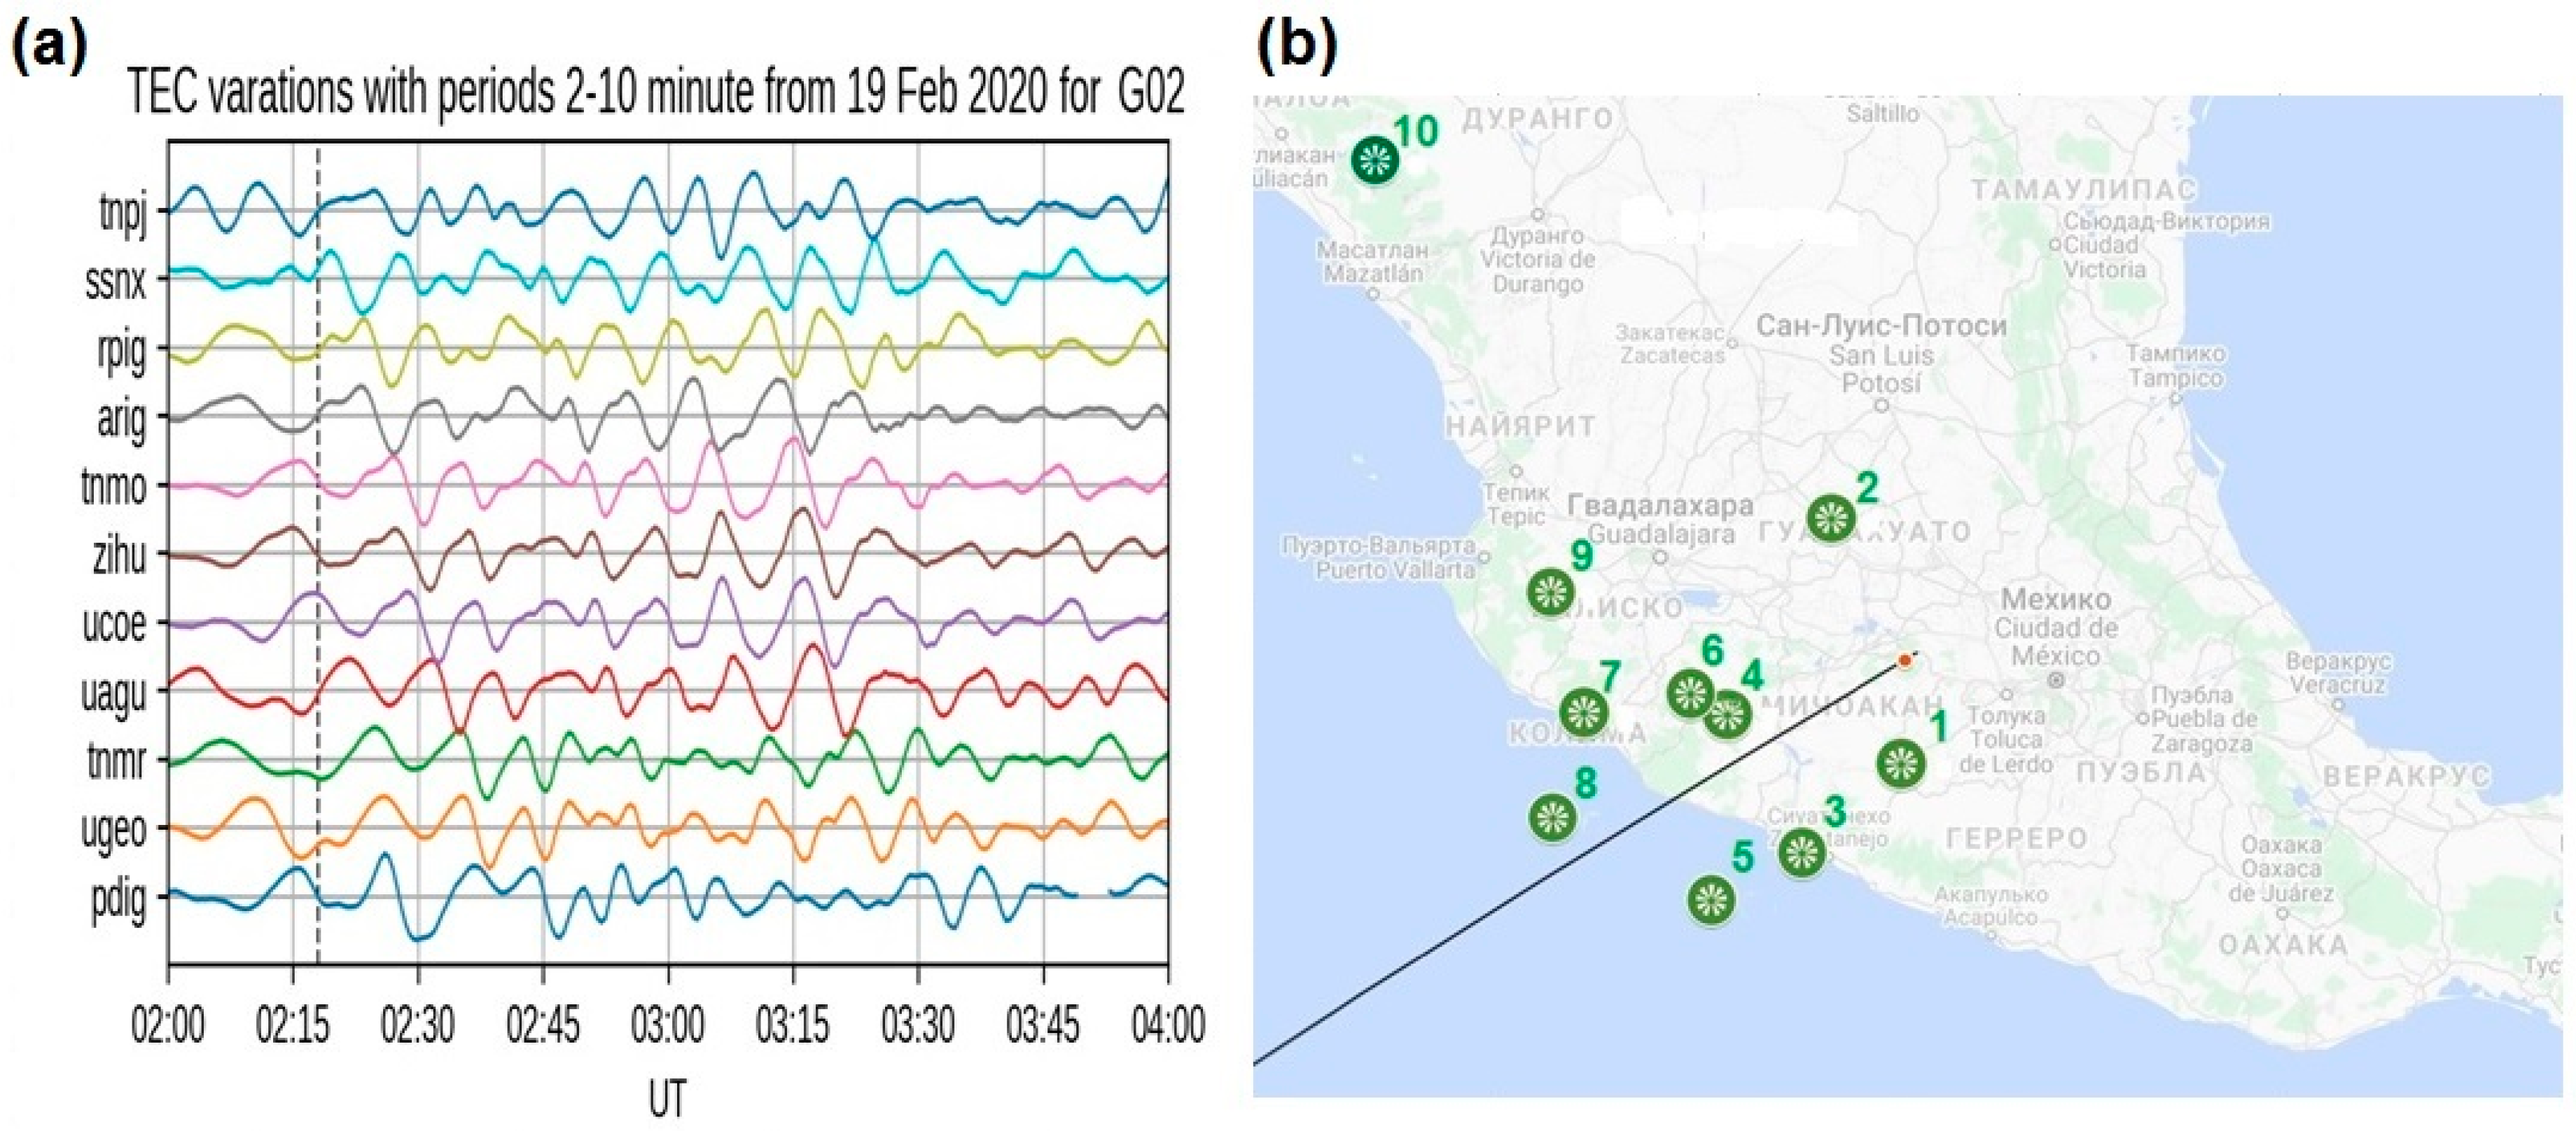
(a) The noticeable dIv response to the meteoroid manifested itself at the LoSs to PRN02 before the LoSs to other satellites and mostly with larger amplitudes (exceeding 0.1 TECU and reaching its maximum deviation more than 0.2 TECU). Maybe, it is connected with the fact that the PRN02 LoSs were approximately along the meteoroid trajectory. The disturbance registered at all LoSs to this satellite was of type-III slightly shifted in time for each receiver (Figure 14a). The “most shifted” response was detected at more distant PDIG, the most distinct response at TNPJ. The order of the dIv response appearance is illustrated in Figure 14b. Visually, it seems that there is a slight longitudinal effect. The time and order of appearance of the wave-packet disturbance at the sub-ionospheric points did not correlate to the time of terminator passage over coordinates of these points. The longitudinal effect was observed only for LoSs to one satellite. Thus, we do not associate these disturbances with the terminator passage. The order of the dIv disturbance registration at the sub-ionospheric points also does not correspond to the distances between the sub-ionospheric points and the explosion epicenter. Our inkling is that the source of the secondary disturbances could be shifted to the direction behind the explosion. In this case, it probably could explain the order of disturbance appearance. Consequently, as a preliminary conclusion at this point, we assume that the dIv wave-packets were the eventual result of the meteoroid event.
(b) Summarizing the dIv fluctuations features by station (one station—all LoSs), the following was noticed. The variations at TNPJ and PDIG (most distant stations at the opposite directions from the explosion site) were almost always different compared to all other receivers as well as between each other. Variations at TNPJ in many cases did not seem to be related to the meteoroid impact. The same but to less extent applies to PDIG. This implies that the disturbances attenuated rapidly with distance (see Table 1), because the energy of the meteoroid explosion was relatively low (weak event). The results at the close to each other TNMO and UCOE were very similar. UAGU results were similar to them but less intense, as this station is located farther from the explosion site. The results by the equidistant but located in different directions from the explosion TNMR and UAGU were different which argues for the asymmetry of the disturbance manifestations. Probably, the disturbance did not propagate backward to the direction from which the meteoroid came (TNMR). In contrast, the disturbances behind the trajectory were well-registered (RPIG). Results at UGEO and UAGU (both located northwestward from the meteoroid explosion) were similar.
(c) Analyzing dIv series at all LoSs (all receivers—all satellites), in many cases a difference was notable between the character of variations and the number of disturbances registered northwestward and southeastward from the meteoroid event. In addition, the intensity and forms of dIv disturbances observed at the satellites whose positions were on the “opposite sides” from the explosion were noted to be different. Figure 15 illustrates the examples. LoSs to PRN02 were westward from the meteoroid explosion and to some extent “along” the meteoroid trajectory. LoSs to PRN28 were eastward from the explosion. The disturbance amplitudes at PRN28 rays were at least twice less than at rays to PRN02. No valuable fluctuations were registered at LoSs to PRN05 (directly southward). At the same time, dIv at LoSs to PRN06 (directly northward) showed the response to the shock wave (though in few cases). The mentioned facts argue for the asymmetry of the effects again.
(d) The general picture of sub-ionospheric points, at which the disturbances of the particular type were registered, was different. For example, N-form was characteristic northward from the explosion and И-form manifestation seemed more “circular” though still more pronounced northward (Figure 16). Based on the previous works [13,37], it may be assumed that the explosive spherical SAW triggered a radial propagation of ionospheric disturbances. In that case, the comparison of distances and time of occurrence for dIv fluctuations of the same form (separately for positive and negative deviations), would suggest that the source of the secondary disturbances in the ionosphere was shifted northward from the explosion coordinates.
To sum up, the meteoroid-associated fluctuations at LoSs to the satellites, whose positions were westward or northward from the explosion site, were much more pronounced than at LoSs to the satellites southward from the explosion. The same picture was observed with the scintillation indices which indicates the same nature of the responses observed by two methods. In general, the intensity and time of appearance of the effects did not seem uniform in different directions from the meteoroid flight trajectory and explosion site. The farther from the trajectory, the less pronounced the effects which is natural because the disturbance energy is attenuated with distance which is well-observed during the weak events.

6.5. Comparative Analysis of Results by Two Methods

In conclusion of Section 6, the following characteristic features can be emphasized.
(1) The ionospheric effects caused by the meteoroid accompanying phenomena were detected in the vicinity of the meteoroid trajectory and explosion site by both the ensemble of scintillation indices and dIv data. The usefulness of such an integrated approach to event observation was demonstrated. The analysis of the ensemble of scintillation indices provided the clearer picture of spectral composition of a complex ionospheric reply to the meteoroid accompanying phenomena.
(2) The ionospheric response at stations OXUM, TNPJ and PDIG situated more than 600 km from the place of interest was almost absent except for one LoS over the Pacific Ocean in each case (OXUM-PRN05, TNPJ-PRN02 and PDIG-PRN02). This implies that the ionospheric disturbances were attenuated rapidly with distance, which is not surprising considering the relatively low energy of the meteoroid.
(3) The registered disturbances had complex structure. According to scintillation and dIv(2-10) data, a variety of the intermediate- (several km size), small- (0.1–1 km) and SAW-scale (300–400 m in our case) disturbances were formed after the meteoroid flight and explosion. The “slower” dIv(10–20) variations and some marks of scintillation indices point to the presence of some medium-scale TIDs. The detected horizontal scales of disturbances, the time of their observation by both methods and amplitudes of dIv indicate that the revealed effects could not be provoked by the geomagnetic storm.
(4) The detected dIv disturbance shapes (III-, I-, inversed II- and mixed types) and their time-scales (11.2–20 min) indicate that the disturbances can be associated with the acoustic-gravity waves excited by the meteoroid flight and explosion.
(5) The asymmetry of disturbances in different directions from the epicenter of explosion was detected by both methods. The ionospheric response was more pronounced northwestward and along the direction of the meteoroid trajectory (including behind it). Southeastward and backward to the meteoroid flight direction, the response manifested itself much less. Previously, the asymmetry of the ionospheric response to the acoustic shock caused by the meteoroid was also revealed in work [14]. Possibly, the complex wind patterns during the transition from day- to night-hours were responsible for the asymmetry. In addition, maybe the secondary disturbances source was not located exactly above the explosion site but shifted northward. The meteoroid wake probably also played some role.

7. Possibility of Other Effects

It is known that the fall and destruction of meteoroids can lead to a large number of phenomena. They were briefly described in the Introduction. It was of interest to examine the possibility of observation of the most notable meteoroid impacts for the Morelian case with the available data in the region. The results are given in this section.

7.1. Possible Schumann Resonance Effect

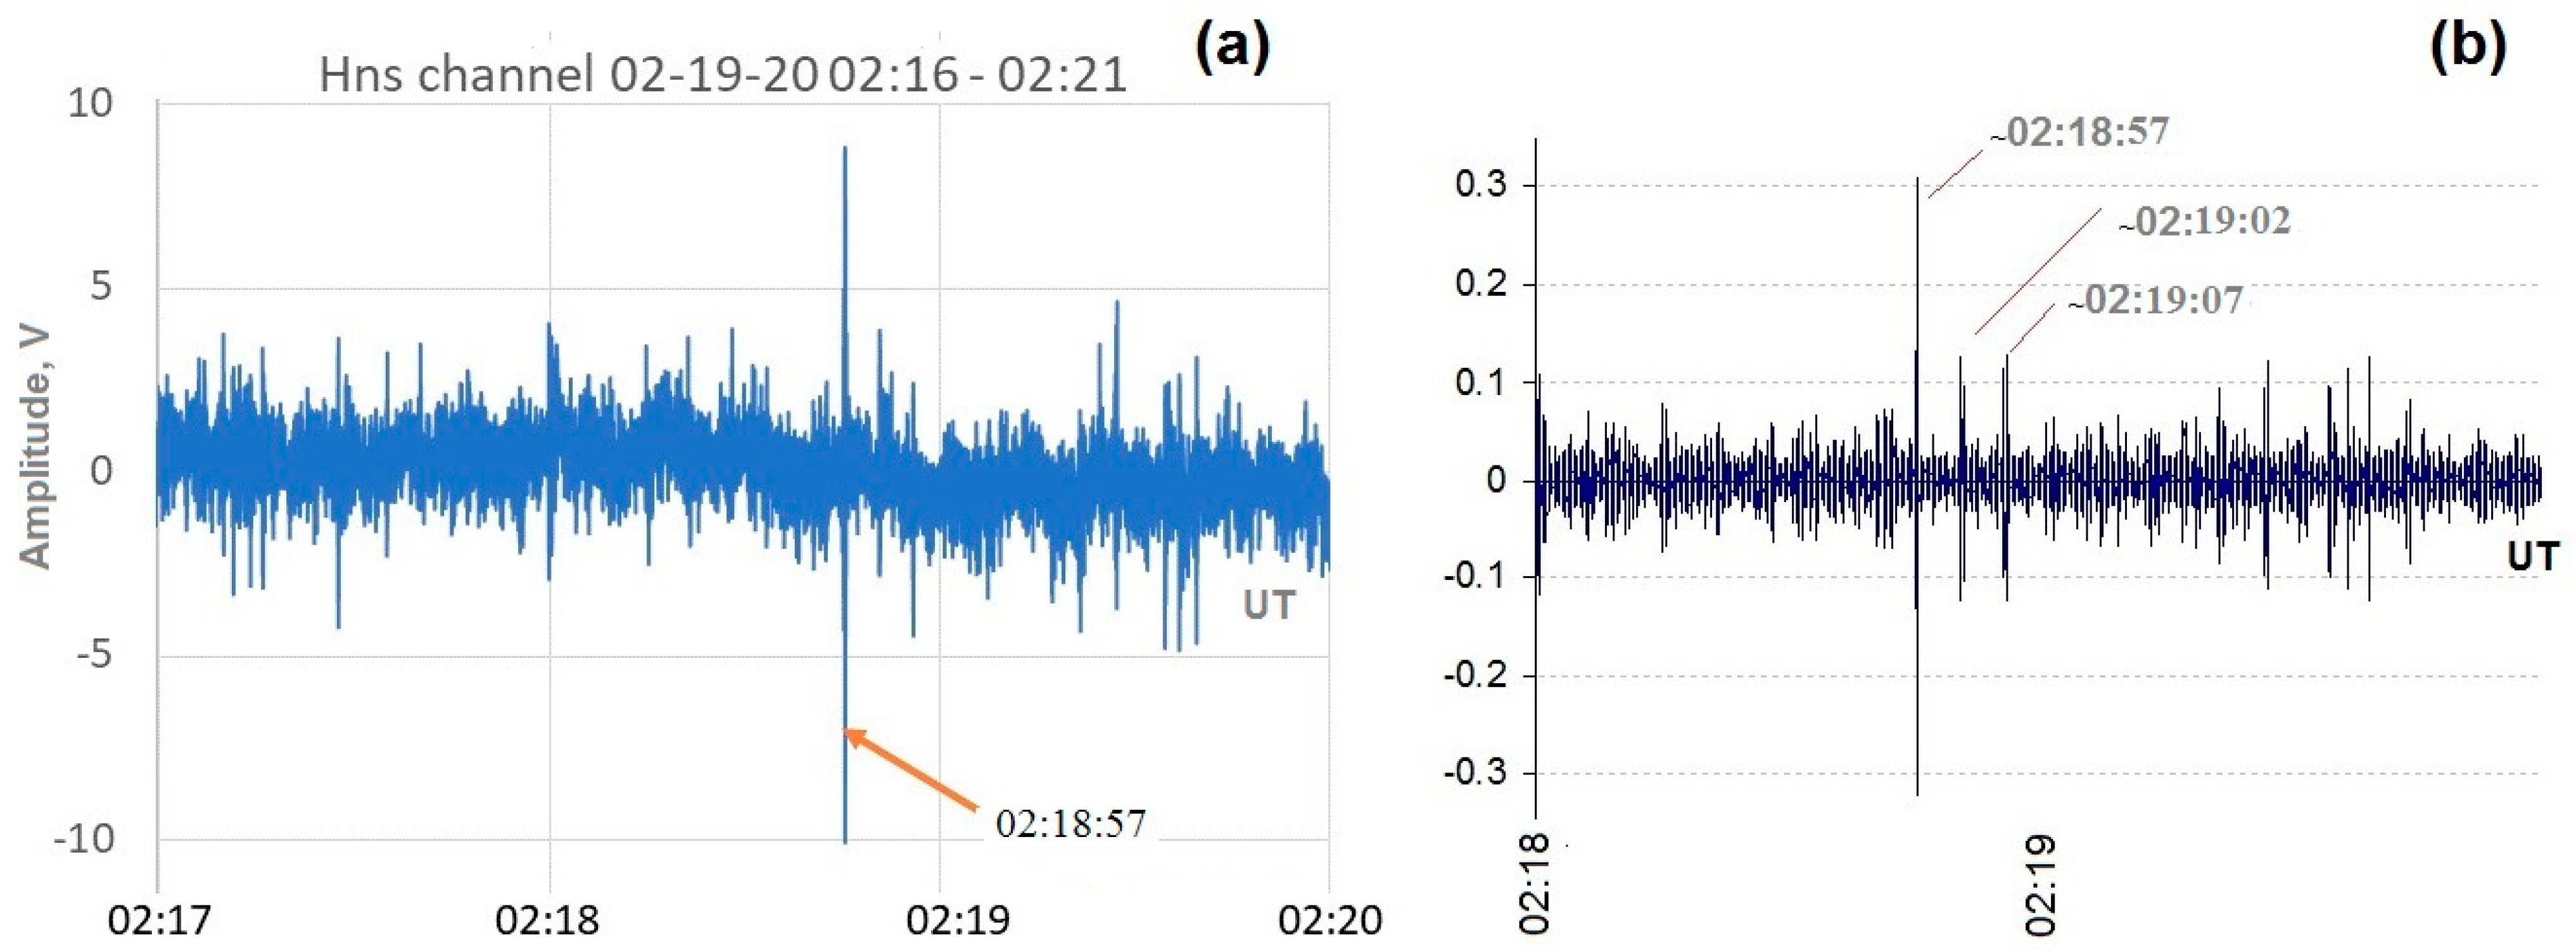
The Schumann resonance station is installed at the same site as the UCOE receiver. It operates in a range of (0–60) Hz (ELF). Its detailed description is given in [49]. The data temporal resolution is 130 observations per second. Only the north-south antenna operated on 19 February 2020. An infrasound wave can be a byproduct resulting from shock decay [4]. Previously, infrasound effects from meteoroids were reported in [3,4,8,15]. We had no access to data of any infrasound station, but considering the Schumann antenna operation range, we tried to search for a mark of possible interference. The speed of sound with which the infrasound signal propagates is about 343 m/s at 20 °C near to the Earth’s surface. In our case, the temperature was lower and consequently the speed as well. If we consider the wide range of velocities 250–340 m/s, then the wave could arrive at the station in (4:53–6:06) min. To add, maybe the wave was not excited immediately. Considering all this, we checked the data in 02:23:40–02:27:00 UT. The spectral analysis showed that during the period of interest the first three Schumann resonance harmonics (~8, ~15, ~21 Hz) did not change much (frequency value or amplitude). The meteoroid event was very weak; thus, the result is not surprising. We also checked the raw measurements of the north-south component of the horizontal magnetic field channel. There was a signal amplitude peak at 02:18:57 UT (Figure 17a). No similar effect was detected on the closest quiet day with the data available (27 February). The raw data time series were filtered by the second order derivative to eliminate the trends, which allowed us to reveal the two smaller peaks at 02:19:02 and 02:19:07 UT (Figure 17b). The period of ~5 s corresponds to the infrasound range. However, it can have no connection to the meteoroid event. This is an initial approximation. More statistics than one very weak event is needed to draw the final conclusions.

7.2. Possible Seismic Effect

A large meteoroid explosion among other effects can result in an impact-induced seismic shaking. For instance, the Chelyabinsk meteoroid explosion (the largest object that collided with Earth since Tunguska) at h = 23.3 km caused the related earthquake of Mw ~ (3–4) magnitude registered by the nearest seismic stations [37]. In our case, the object was much smaller and of much less kinetic energy. However, it was possible to feel the shock wave at a tall building at ~40 km from the explosion site (the author’s personal experience), which inspired us to check the seismic data. The nearest seismic station was 48.7 km far from the explosion site. The analysis showed that the considered period was characterized by the quiet seismic background with no trace of the meteoroid explosion impact. According to [2], about 10−5 of the shock wave energy from the explosion can be transformed to the energy of seismic waves Esw, which is related to the magnitude of an earthquake as follows: lg(Esw) = 4.8 + 1.5 × Mw. Considering the small energy released in the Morelian meteoroid explosion (see Section 5), the effect could be similar to an earthquake of Mw = 0.37. In general, Mexico is a seismically active zone. The activity of Mw ~ (1–4) is registered almost every day in some parts of the country. This “noisy” background, low Mw and a far distance between the seismic station and the explosion made it difficult to register the possible seismic effect.

7.3. Possible Magnetic Effects

According to literature, the turbulence in the plasma wake of the meteoroid passage can cause a slight increase in the magnetic field [12,50] and references therein. According to [3], it can be estimated as B(R) = B(0) × (w/R)3, where B is magnetic field, R is the distance from the meteoroid wake and w is wake diameter. In our case, R to magnetometer site was more than 190 km. If assume that w~10 m (as for the Romanian meteoroid), then the induced effect will be of the order of pT. It should be recalled that the meteoroid flew during the geomagnetic disturbance. Therefore, due to the weakness of the effect and the dominant disturbed background, it is impossible to detect the meteoroid induced magnetic field change.

8. Conclusions

This study discusses the possibility of the Morelian meteoroid impact on the low-latitude ionosphere (Mexico) under solar minimum conditions. Though it was smaller and of less energy than other known meteoroids, it is an interesting case as, to the best of our knowledge, it is the first meteoroid with detected ionospheric effects, which fell at low-latitudes. The aim of this work was to examine in general the presence or absence of ionospheric response of different scales that could be associated with the weak meteoroid event. Explanations of the obtained results were provided. Some of the revealed features/effects need to be studied further and may be the subject to future research.
(1) We roughly estimated the meteoroid parameters and their change with time. The object entered the atmosphere at 480 km above ground approximately at 02:17:20 UT on 19 February 2020 having the diameter of 0.7 m, mass of 719.2 kg, velocity of 12 km/s and moving with the ~25.3° angle from horizon. Its break-up and explosion occurred at the close heights, when the speed of the object (moving with ~26.46° angle from horizon) was 9.87 km/s. The explosion occurred at 02:18:49 UT at 36.8–39.2 km above ground when the diameter and mass of the object were 18 cm and 14.05 kg correspondingly. The calculated coordinates of the explosion projection point on the ground (19.619° N, 100.764° W) were confirmed by GOES-16 data. The site is close to the city of Morelia in Mexico. The results of the meteoroid parameters reconstruction were confirmed with “ImpactEarth!” simulator. It is worth noting that the only available source of observations were videos of outdoor uncalibrated cameras.
(2) We analyzed the meteoroid ionospheric impacts during other events known to the authors and tried to assess how the Morelian meteoroid fits in this framework. The intermediate conclusion (which needs to be proved with more statistics in the future) is that meteoroid events (if occurred at mid- and high-latitudes of the Northern Hemisphere) can be accompanied by the appearance of dense sporadic Es layers and decrease of ionization in the F layer.
(3) Two methods were used to search for possible impact of the Morelian event on the regional ionosphere. The new suggested approach proved its efficiency: the analysis of the ensemble of scintillation indices behavior allowed us to detect the SW-generated disturbances. The “classical” approach using filtered and processed sTEC time series confirmed the obtained results. It is worth noting that each method revealed some specific disturbance features. The obtained results are in accord with the previous works.
(4) The first ionospheric effects were registered (2.5–3.5) min after the meteoroid explosion and had the amplitudes of (0.1–0.2) TECU that exceeded the background fluctuations in the previous quiet and geomagnetically disturbed days. The disturbances quickly attenuated with distance. Almost no response or weak response was detected at the stations situated more than ~600 km from the explosion epicenter.
(5) The registered disturbances had complex structure. The intermediate- (several km size), small- (0.1–1 km) and SAW-scale (300–400 m in our case) disturbances were formed after the meteoroid flight and explosion. There were marks of the medium-scale TIDs presence.
(6) The Morelian meteoroid impact detection was challenging because it could be masked by geomagnetic disturbance and solar terminator passage effects. The performed analysis (the revealed horizontal scales and lifetime of disturbances by both methods and dIv amplitudes) allowed us to affirm that the detected effects were the responses exactly to the meteoroid accompanying phenomena.
(7) According to the detected dIv fluctuation shapes (types) and their time-scales (11.2–20 min), the detected disturbances are associated with SAW-generated acoustic-gravity waves. The meteoroid wake probably also had some impact on the electron concentration fluctuations along the flight trajectory.
(8) The propagation of the generated TIDs was non-uniform. The disturbances were more pronounced northwestward and along the direction of the meteoroid trajectory (including behind it) and less pronounced southeastward and backward from the direction of the flight. The asymmetry of the effects could be due to the complex winds picture and maybe the shift of the secondary disturbance source northward from the explosion.
(9) No seismic, geomagnetic field or Schumann resonance effects were detected due to the small size and low kinetic energy of the meteoroid together with the overall mixed background conditions.
To sum-up, the small sporadic (0.7 m) night catching up the Earth (12–9.87 km/s) meteoroid made of stone with small iron inclusions did not produce any significant impact on the low-latitude ionosphere under solar minimum conditions (small ionization rate). Nonetheless, its passage was detected with use of ionospheric scintillation indices based on the high-rate (5–50) Hz GNSS data, which is a new approach and with the dIv series based on the (15–30) s GNSS data.
In conclusion, it is worth noting that Mexico is vulnerable to many natural hazards: hurricanes, volcanoes, earthquakes, tsunamis, etc. [51]. Using the example of September 2017 events (Space Weather, hurricanes and intense earthquakes at the same time), Ref. [52] showed that the simultaneous combination of natural hazards can represent a significant danger. According to [4], deep penetrating meteoroids can result in the destructive consequences at the ground, even if an object does not make a touchdown. In this study, only fine ionospheric effects of the small meteoroid event were detected. At the same time, the complex “meteoroid-meteor-meteorite” phenomena should be taken into account in terms of civil protection management as much larger objects can hit the Earth’s atmosphere.

Author Contributions

Conceptualization, M.A.S.; methodology, M.A.S.; design of experiments, M.A.S. and V.V.D.; data collection and pre-processing, M.A.S., V.V.D., A.M.V., T.V.I., M.E.F., J.A.G.-E., L.X.G., P.C.-R., J.C.M.-A., J.J.G.-A., E.A.-R., E.R.-H., R.C. and I.D.O.-L.; investigation, M.A.S., V.V.D., O.A.M. and A.M.V.; meteor trajectory determination, A.M.; reconstruction of meteoroid parameters, M.R.-M. and R.G.; visualization, A.M.V., V.J.G.-A., T.V.I. and M.E.F.; foF2 and vTEC calculation, O.A.M.; literature review, O.A.M.; GNSS experiments, V.J.G.-A. and E.C.-C.; GLM data processing, V.J.G.-A.; Schumann antenna experiments and analysis, M.P. and B.M.; writing—original draft preparation, M.A.S., V.V.D. and O.A.M. All authors have read and agreed to the published version of the manuscript.

Funding

LANCE acknowledges partial support from CONACyT-AEM Grant 2017-01-292684 and CONACyT LN-314845. This work was also supported by grant № 18-05-00343 from Russian Foundation for Basic Research. The research of OAM was financially supported by the Ministry of Science and Higher Education of the Russian Federation (State assignment in the field of scientific activity, Southern Federal University № 0852-2020-0015). The work of AV was supported by the Ministry of Education and Science (Basic Research program II.16).

Institutional Review Board Statement

Not applicable.

Informed Consent Statement

Not applicable.

Data Availability Statement

GPS data for ARIG, SSNX, ZIHU, RPIG, TNMR, PDIG and TNPJ which were used in this study are available at http://tlalocnet.udg.mx/tlalocnetgsac. Data of TNMO, UGEO, UAGU can be downloaded from ftp://data-out.unavco.org/pub/rinex/obs. Other raw data related to this article can be found in the open-access data repositories by following the links: http://doi.org/10.6084/m9.figshare.13171964, http://doi.org/10.5281/zenodo.4141942 and https://doi.org/10.5281/zenodo.4243148.

Acknowledgments

The authors acknowledge LANCE technical support by Ernesto Andrade-Mascote, Pablo Villanueva-Hernandez, Adan Espinoza-Jimenez and Juan Luis Godoy-Hernandez. This material is based on GPS data provided by TLALOCNet, SSN-TLALOCNet and SSN GPS/GNSS networks operated by Servicio de Geodesia Satelital (SGS) [51], and Servicio Sismológico Nacional (SSN) [53] at the Instituto de Geofísica-Universidad Nacional Autónoma de México (UNAM) and the GAGE facility operated by UNAVCO Inc. We gratefully acknowledge all personnel from SGS, SSN and UNAVCO Inc. for station maintenance, data acquisition, IT support and data curation and distribution for these networks. TLALOCNet, SSN-TLALOCNet and other GPS related operations from SGS and SSN are supported by the Consejo Nacional de Ciencia y Tecnología (CONACyT) projects 253760, 256012 and 2017-01-5955, UNAM-Programa de Apoyo a Proyectos de Investigación e Innovación Tecnológica (PAPIIT) projects IN104213, IN111509, IN109315-3, IN104818-3 and PAPIIT project IN111509 to R. Pérez, National Science Foundation grant 2025104 and supplemental support from UNAM-Instituto de Geofísica. UNAVCO’s initial support for TLALOCNet (now part of NOTA) was performed under EAR-1338091 and is currently supported by the National Science Foundation and the National Aeronautics and Space Adminsitration under NSF Cooperative Agreement EAR-1724794. The authors thank IPN and in particular Miguel Sanchez-Meraz for GPS data from the IPN1 station. vTEC was calculated by the TayAbsTEC method (www.gnss-lab.org) [54]. The authors express their gratitude to the services of IGS for the opportunity of using IONEX data via Internet (ftp://cddis.gsfc.nasa.gov/pub/gps/products/ionex) and to SPIDR database (http://spidr.ngdc.noaa.gov/spidr) and DIDBase (https://ulcar.uml.edu/DIDBase) for the ionosonde data available for educational purposes. The authors also thank AARI (www.aari.ru) for the provided VIS data from Lovozero and Gorkovskaya stations. The OMNI data (Dst-index values) were obtained from the GSFC/SPDF OMNIWeb interface at http://omniweb.gsfc.nasa.gov. The authors thank Dr. Kalishin (AARI) for the opportunity to calculate the solar terminator positions with use of “Solar Terminator” software which is freely available by following the link www.sciesmex.unam.mx/integrantes/maria-sergeeva/solarterminator. The authors express their gratitude to the services of the “Webcams de México” network of outdoor cameras for the videos (www.webcamsdemexico.com) and to the developers of the web-program “ImpactEarth!” for the possibility of its use at the web page www.purdue.edu/impactearth. The program complex for meteoroid parameters modeling (Section 5) was developed in close collaboration with R. Gutierrez-Zalapa from the ENES, Unidad Morelia, UNAM. The authors thank R. Gutierrez-Zalapa for his help and fruitful discussions and Daniel González Avila from Instituto de Geofísica, UNAM, for his help with seismic data. GLM data (https://lightning.umd.edu/glm) were downloaded from Pando archive system (http://home.chpc.utah.edu/~u0553130/Brian_Blaylock/cgi-bin/goes16_pando.cgi). The authors are grateful to Dr. Daile Zhang from Earth System Science Interdisciplinary Center, University of Maryland, for her valuable help on GLM data use.

Conflicts of Interest

The authors declare no conflict of interest. The funders had no role in the design of the study; in the collection, analyses, or interpretation of data; in the writing of the manuscript, or in the decision to publish the results.

Appendix A

List of main abbreviations.
GNSSGlobal Navigation Satellite System
GPSGlobal Positioning System
SAWshock-acoustic wave
GWgravity wave
TIDTravelling Ionospheric Disturbance
Dstdisturbance storm time index of global magnetic activity
Kpplanetary three-hour index of global magnetic activity
sTECslant Total Electron Content
vTECvertical Total Electron Content
δvTECvTEC deviation from its median value
VISVertical Ionospheric Sounding
foF2critical frequency of F2 layer
RAright ascension for topocentric radiant
Decdeclination for topocentric radiant
PRNnumber of the pseudo-random noise code sequence unique for each satellite
GLMGeostationary Lightning Mapper
h(breakup)height of break-up
h(burst)height of explosion
LoSline-of-sight
dIvsTEC variations converted to equivalent vertical variations

Appendix B

Links for the outdoor camera videos:

Appendix C

Additional material can be found at: http://doi.org/10.6084/m9.figshare.13623215.

References

  1. Mokhnatkin, A.; Molotov, I.; Perez Tijerina, E.G.; Perez Leon, J.E.; Kokina, T.; Schildknecht, T. Implementing of the ISON project in Northern Mexico. Open Astron. 2018, 27, 167–174. [Google Scholar] [CrossRef]
  2. Chernogor, L.F. Physical effects of the Romanian meteoroid. 1. Space Sci. Technol. 2018, 24, 1. [Google Scholar] [CrossRef]
  3. Chernogor, L.F. Physical effects of the Romanian meteoroid. 2. Space Sci. Technol. 2018, 24, 2. [Google Scholar] [CrossRef]
  4. Silber, E.A.; Boslough, M.; Hocking, W.K.; Gritsevich, M.; Whitaker, R.W. Physics of meteor generated shock waves in the Earth’s atmosphere—A review. Adv. Space Res. 2018, 62, 489–532. [Google Scholar] [CrossRef] [Green Version]
  5. Cander, L.R. Lonospheric Space Weather; Springer Geophysics: Cham, Switzerland, 2019. [Google Scholar] [CrossRef]
  6. Hocke, K.; Schlegel, K. A review of atmospheric gravity waves and travelling ionospheric disturbances: 1982–1995. Ann. Geophys. 1996, 14, 917–940. [Google Scholar] [CrossRef]
  7. Afraimovich, E.L.; Perevalova, N.P. GPS Monitoring of Earth upper Atmosphere; Russian Academy of Sciences Siberian Branch: Irkutsk, Russia, 2006; 460p, ISBN 5-98277-033-7. [Google Scholar]
  8. ElGabry, M.N.; Korrat, I.M.; Hussein, H.M.; Hamamaa, I.H. Infrasound detection of meteors. NRIAG J. Astron. Geophys. 2017, 6, 68–80. [Google Scholar] [CrossRef] [Green Version]
  9. Gordeev, E.I.; Kulichkov, S.N.; Firstov, P.P.; Popov, O.E.; Chunchuzov, I.P.; Budilov, D.I.; Chebrov, D.V. Infrasonic waves and assessment of energy of explosion of Beringovomorsky meteoroid on December 19, 2018. Acad. Sci. Rep. 2019, 489, 409–413. [Google Scholar] [CrossRef]
  10. Trigo-Rodrıguez, J.M.; Lyytinen, E.; Gritsevich, M.; Moreno-Ibanez, M.; Bottke, W.F.; Williams, I.; Lupovka, V.; Dmitriev, V.; Kohout, T.; Grokhovsky, V. Orbit and dynamic origin of the recently recovered Annama’s H5 chondrite. Mon. Not. R. Astron. Soc. 2015, 449, 2119–2127. [Google Scholar] [CrossRef] [Green Version]
  11. Cherniakov, S.M.; Turyansky, V.A.; Gomonov, A.D. Ionospheric effects of meteor explosion over North Finland on November 2017. Physics of Auroral Phenomena. In Proceedings of the XLI Annual Seminar, Apatity, Russia, 12–16 March 2018; pp. 102–105. [Google Scholar] [CrossRef]
  12. Cherniakov, S.M.; Nikolashkin, S.V.; Tereshchenko, V.A. Siberian meteors: Ionospheric and geomagnetic effects in the lower ionosphere of high latitudes, Physics of Auroral Phenomena. In Proceedings of the XL Annual Seminar, Apatity, Russia, 13–17 March 2017; pp. 104–107. [Google Scholar]
  13. Perevalova, N.P.; Shestakov, N.V.; Voeykov, S.V.; Takahashi, H.; Guojie, M. Ionospheric disturbances in the vicinity of the Chelyabinsk meteoroid explosive disruption as inferred from dense GPS observations. Geophys. Res. Lett. 2015, 42, 6535–6543. [Google Scholar] [CrossRef]
  14. Ruzhin, Y.Y.; Kuznetsov, V.D.; Smirnov, V.M. The Ionosphere Effects of the Chelyabinsk Meteoroid Explosion. Int. J. Electron. Appl. Res. 2014, 1, 39–60. [Google Scholar]
  15. Yang, Y.-M.; Komjathy, A.; Langley, R.B.; Vergados, P.; Butala, M.D.; Mannucci, A.J. The 2013 Chelyabinsk Meteor Ionospheric Impact Studied Using GPS Measurements. Radio Sci. 2014, 49, 341–350. [Google Scholar] [CrossRef]
  16. Reinisch, B.W.; Galkin, I.A. Global ionospheric radio observatory (GIRO). Earth Planets Space 2011, 63, 377–381. [Google Scholar] [CrossRef] [Green Version]
  17. Sergeeva, M.A.; Maltseva, O.A.; Gonzalez-Esparza, J.A.; De la Luz, V.; Corona-Romero, P. Features of TEC behaviour over the low-latitude North-American region during the period of medium solar activity. Adv. Space Res. 2017, 60, 1594–1605. [Google Scholar] [CrossRef]
  18. Sergeeva, M.A.; Maltseva, O.A.; Gonzalez-Esparza, J.-A.; Mejia-Ambriz, J.C.; De la Luz, V.; Corona-Romero, P.; Gonzalez, L.X.; Gatica-Acevedo, V.J.; Romero-Hernandez, E.; Rodriguez-Martinez, M.; et al. TEC behavior over the Mexican region. Ann. Geophys. 2018, 61, 104. [Google Scholar] [CrossRef]
  19. Somsikov, V.M. Solar Terminator and Dynamic Phenomena in the Atmosphere: A Review. Geomagn. Aeron. 2011, 51, 707–719. [Google Scholar] [CrossRef]
  20. Gural, P.S. A new method of meteor trajectory determination applied to multiple unsynchronized video cameras. Meteorit. Planet. Sci. 2012, 47, 1405–1418. [Google Scholar] [CrossRef]
  21. Ceplecha, Z. Geometric, Dynamic, orbital and photometric data on meteoroids from photographic fireball networks. Bull. Astron. Inst. Czechoslov. 1987, 38, 222–234. [Google Scholar]
  22. Bruning, E.; Tillier, C.E.; Edgington, S.F.; Rudlosky, S.D.; Zajic, J.; Gravelle, C.; Foster, M.; Calhoun, K.M.; Campbell, P.A.; Stano, G.T.; et al. Meteorological imagery for the geostationary lightning mapper. J. Geophys. Res. Atmos. 2019, 124, 14258–14309. [Google Scholar] [CrossRef]
  23. Rudlosky, S.D.; Goodman, S.J.; Virts, K.L.; Bruning, E.C. Initial Geostationary Lightning Mapper Observations. Geophys. Res. Lett. 2019, 46, 1097–1104. [Google Scholar] [CrossRef]
  24. Wheeler, L.F.; Register, P.J.; Mathias, D.L. A fragment-cloud model for asteroid breakup and atmospheric energy deposition. Icarus 2017, 295, 149–169. [Google Scholar] [CrossRef]
  25. Register, P.J.; Mathias, D.L.; Wheeler, L.F. Asteroid fragmentation approaches for modeling atmospheric energy deposition. Icarus 2017, 284, 157–166. [Google Scholar] [CrossRef] [Green Version]
  26. Mathias, D.L.; Wheeler, L.F.; Dotson, J.L. A probabilistic asteroid impact risk model: Assessment of sub-300 m impacts. Icarus 2017, 289. [Google Scholar] [CrossRef]
  27. Collins, G.S.; Melosh, H.J.; Marcus, R.A. Earth Impact Effects Program: A web-based computer program for calculating the regional environmental consequences of a meteoroid impact on Earth. Meteorit. Planet. Sci. 2005, 40, 817–840. [Google Scholar] [CrossRef] [Green Version]
  28. Ferrier, L.; Verant, J.L.; Moschetta, J.M. Aerothermodynamical study for the entry of an Apophis-like asteroid. In Proceedings of the 49th AIAA Aerospace Sciences Meeting including the New Horizons Forum and Aerospace Exposition, Orlando, FL, USA, 4–7 January 2011. [Google Scholar] [CrossRef]
  29. Hills, J.G.; Goda, M.P. The fragmentation of small asteroids in the atmosphere. Astron. J. 1993, 105, 1114–1144. [Google Scholar] [CrossRef]
  30. Chyba, C.; Thomas, P.; Zahnle, K. The 1908 Tunguska explosion: Atmospheric disruption of a stony asteroid. Nature 1993, 361, 40–44. [Google Scholar] [CrossRef]
  31. Borovicka, J.; Spurny, P.; Grigore, V.I.; Svoren, J. The January 7, 2015, superbolide over Romania and structural diversity of meter-sized asteroids. Planet Space Sci. 2017, 143, 147–158. [Google Scholar] [CrossRef] [Green Version]
  32. Pricopi, D.; Dascalu, M.; Badescu, O.; Nedelcu, A.; Popescu, M.; Sonka, A.; Suran, D. Orbit reconstruction for the meteoroid of the meteorite-producting fireball that exploded over Romania on January 7, 2015. Proc. Rom. Acad. Ser. A 2016, 17, 133–136. [Google Scholar]
  33. Aarons, J. Global morphology of ionospheric scintillations. Proc. IEEE 1982, 70, 360. [Google Scholar] [CrossRef]
  34. Doherty, P.H.; Delay, S.H.; Valladares, C.E.; Klobuchar, J.A. Ionospheric Scintillation Effects in the Equatorial and Auroral Regions. Navig. J. Inst. Navig. 2003, 50, 235–245. [Google Scholar] [CrossRef]
  35. Juan, J.M.; Sanz, J.; González-Casado, G.; Rovira-Garcia, A.; Camps, A.; Riba, J.; Barbosa, J.; Blanch, E.; Altadill, D.; Orus, R. Feasibility of precise navigation in high and low latitude regions under scintillation conditions. J. Space Weather Space Clim. 2018, 8. [Google Scholar] [CrossRef] [Green Version]
  36. Hayakawa, M.; Molchanov, O.A. Seismo Electromagnetics: Lithosphere–Atmosphere–Ionosphere Coupling; Terra Sci.: Tokyo, Japan, 2008; p. 477. [Google Scholar]
  37. Perevalova, N.P.; Shestakov, N.V.; Zhupityayeva, A.S.; Yasyukevich, Y.V.; Voeikov, S.V.; Kutelev, K.A. Dynamics of Total Electron Content during the passage and explosion of Chelyabinsk meteoroid. Sol. Terr. Phys. 2013, 24, 36–41. [Google Scholar]
  38. Afraimovich, E.L.; Perevalova, N.P.; Plotnikov, A.V.; Uralov, A.M. The shock-acoustic waves generated by earthquakes. Ann. Geophys. 2001, 19, 395–409. [Google Scholar] [CrossRef] [Green Version]
  39. Chou, M.-Y.; Shen, M.-H.; Lin, C.C.H.; Yue, J.; Chen, C.-H.; Liu, J.-Y.; Lin, J.-T. Gigantic circular shock acoustic waves in the ionosphere triggered bythe launch of FORMOSAT-5 satellite. Space Weather 2018, 16, 172–184. [Google Scholar] [CrossRef]
  40. Demyanov, V.; Sergeeva, M.; Fedorov, M.; Ishina, T.; Gatica-Acevedo, V.J.; Cabral-Cano, E. Comparison of TEC Calculations Based on Trimble, Javad, Leica, and Septentrio GNSS Receiver Data. Remote Sens. 2020, 12, 3268. [Google Scholar] [CrossRef]
  41. Demyanov, V.V.; Sergeeva, M.A.; Yasyukevich, A.S. GNSS High-Rate Data and the Efficiency of Ionospheric Scintillation Indices. In Satellites Missions and Technologies for Geosciences; IntechOpen: London, UK, 2019. [Google Scholar] [CrossRef]
  42. Pi, X.; Mannucci, A.J.; Lindqwister, U.J.; Ho, C.M. Monitoring of global ionospheric irregularities using the worldwide GPS-network. Geophys. Res. Lett. 1997, 24, 2283–2286. [Google Scholar] [CrossRef]
  43. Tiwari, R.; Strangeways, H.J. Regionally based alarm index to mitigate ionospheric scintillation effects for GNSS receivers. Space Weather 2015, 13, 72–85. [Google Scholar] [CrossRef] [Green Version]
  44. Yasyukevich, Y.V.; Kiselev, A.V.; Zhivetiev, I.V.; Edemskiy, I.K.; Syrovatskii, S.V.; Maletckii, B.M.; Vesnin, A.M. SIMuRG: System for Ionosphere Monitoring and Research from GNSS. GPS Solut. 2020, 24. [Google Scholar] [CrossRef]
  45. Kazimirovsky, E.S.; Kokourov, V.D.; Vergasova, G.V. Dynamical climatology of the upper mesosphere, lower thermosphere and ionosphere. Surv. Geophys. 2006, 27, 211–255. [Google Scholar] [CrossRef]
  46. Hargreaves, J.K. The Upper Atmosphere and Solar Terrestrial Relations: An Introduction to the Aerospace Environment; Van Nostrand Reinhold: New York, NY, USA, 1979. [Google Scholar]
  47. Kazimirovsky, E.; Herraiz, M.; De la Morena, B.A. Effects on the ionosphere due to phenomena occurring below it. Surv. Geophys. 2003, 24, 139–184. [Google Scholar] [CrossRef]
  48. Afraimovich, E.; Astafyeva, E.; Demyanov, V.; Edemskiy, I.; Gavrilyuk, N.; Ishin, A.B.; Kosogorov, E.A.; Leonovich, L.A.; Lesyuta, O.S.; Palamartchouk, K.S.; et al. A review of GPS/GLONASS studies of the ionospheric response to natural and anthropogenic processes and phenomena. J. Space Weather Space Clim. 2013, 3. [Google Scholar] [CrossRef] [Green Version]
  49. Sierra, F.P.; Vázquez, H.S.; Andrade, M.E.; Mendoza, B.; Rodríguez-Osorio, D. Development of a Schumann-resonance station in Mexico: Preliminary measurements. IEEE Trans. Propag. Mag. 2014, 56, 112–119. [Google Scholar] [CrossRef]
  50. Chernogor, L.F. Geomagnetic field effects of the Chelyabinsk meteoroid. Geomagn. Aeron. 2014, 54, 613–624. [Google Scholar] [CrossRef]
  51. Cabral-Cano, E.; Pérez-Campos, X.; Márquez-Azúa, B.; Sergeeva, M.A.; Salazar-Tlaczani, L.; DeMets, C.; Adams, D.; Galetzka, J.; Feaux, K.; Serra, Y.L.; et al. TLALOCNet: A Continuous GPS-Met Backbone in Mexico for Seismotectonic, and Atmospheric Research. Seismol. Res. Lett. 2018, 89, 373–381. [Google Scholar] [CrossRef]
  52. Gonzalez-Esparza, J.A.; Sergeeva, M.A.; Corona-Romero, P.; Mejia-Ambriz, J.C.; Gonzalez, L.X.; De la Luz, V.; Aguilar-Rodriguez, E.; Romero-Hernandez, E. Space Weather Events, Hurricanes, and Earthquakes in Mexico in September 2017. Space Weather 2018, 16, 2038–2051. [Google Scholar] [CrossRef]
  53. Pérez-Campos, X.; Espíndola, V.H.; Pérez, J.; Estrada, J.A.; Cárdenas Monroy, C.; Bello, D.; González-López, A.; González Ávila, D.; Contreras Ruiz Esparza, M.G.; Maldonado, R.; et al. The Mexican National Seismological Service: An Overview. Seismol. Res. Lett. 2018, 89, 318–323. [Google Scholar] [CrossRef]
  54. Yasyukevich, Y.V.; Mylnikova, A.A.; Polyakova, A.S. Estimating the total electron content absolute value from the GPS/GLONASS data. Results Phys. 2015, 5, 32–33. [Google Scholar] [CrossRef] [Green Version]
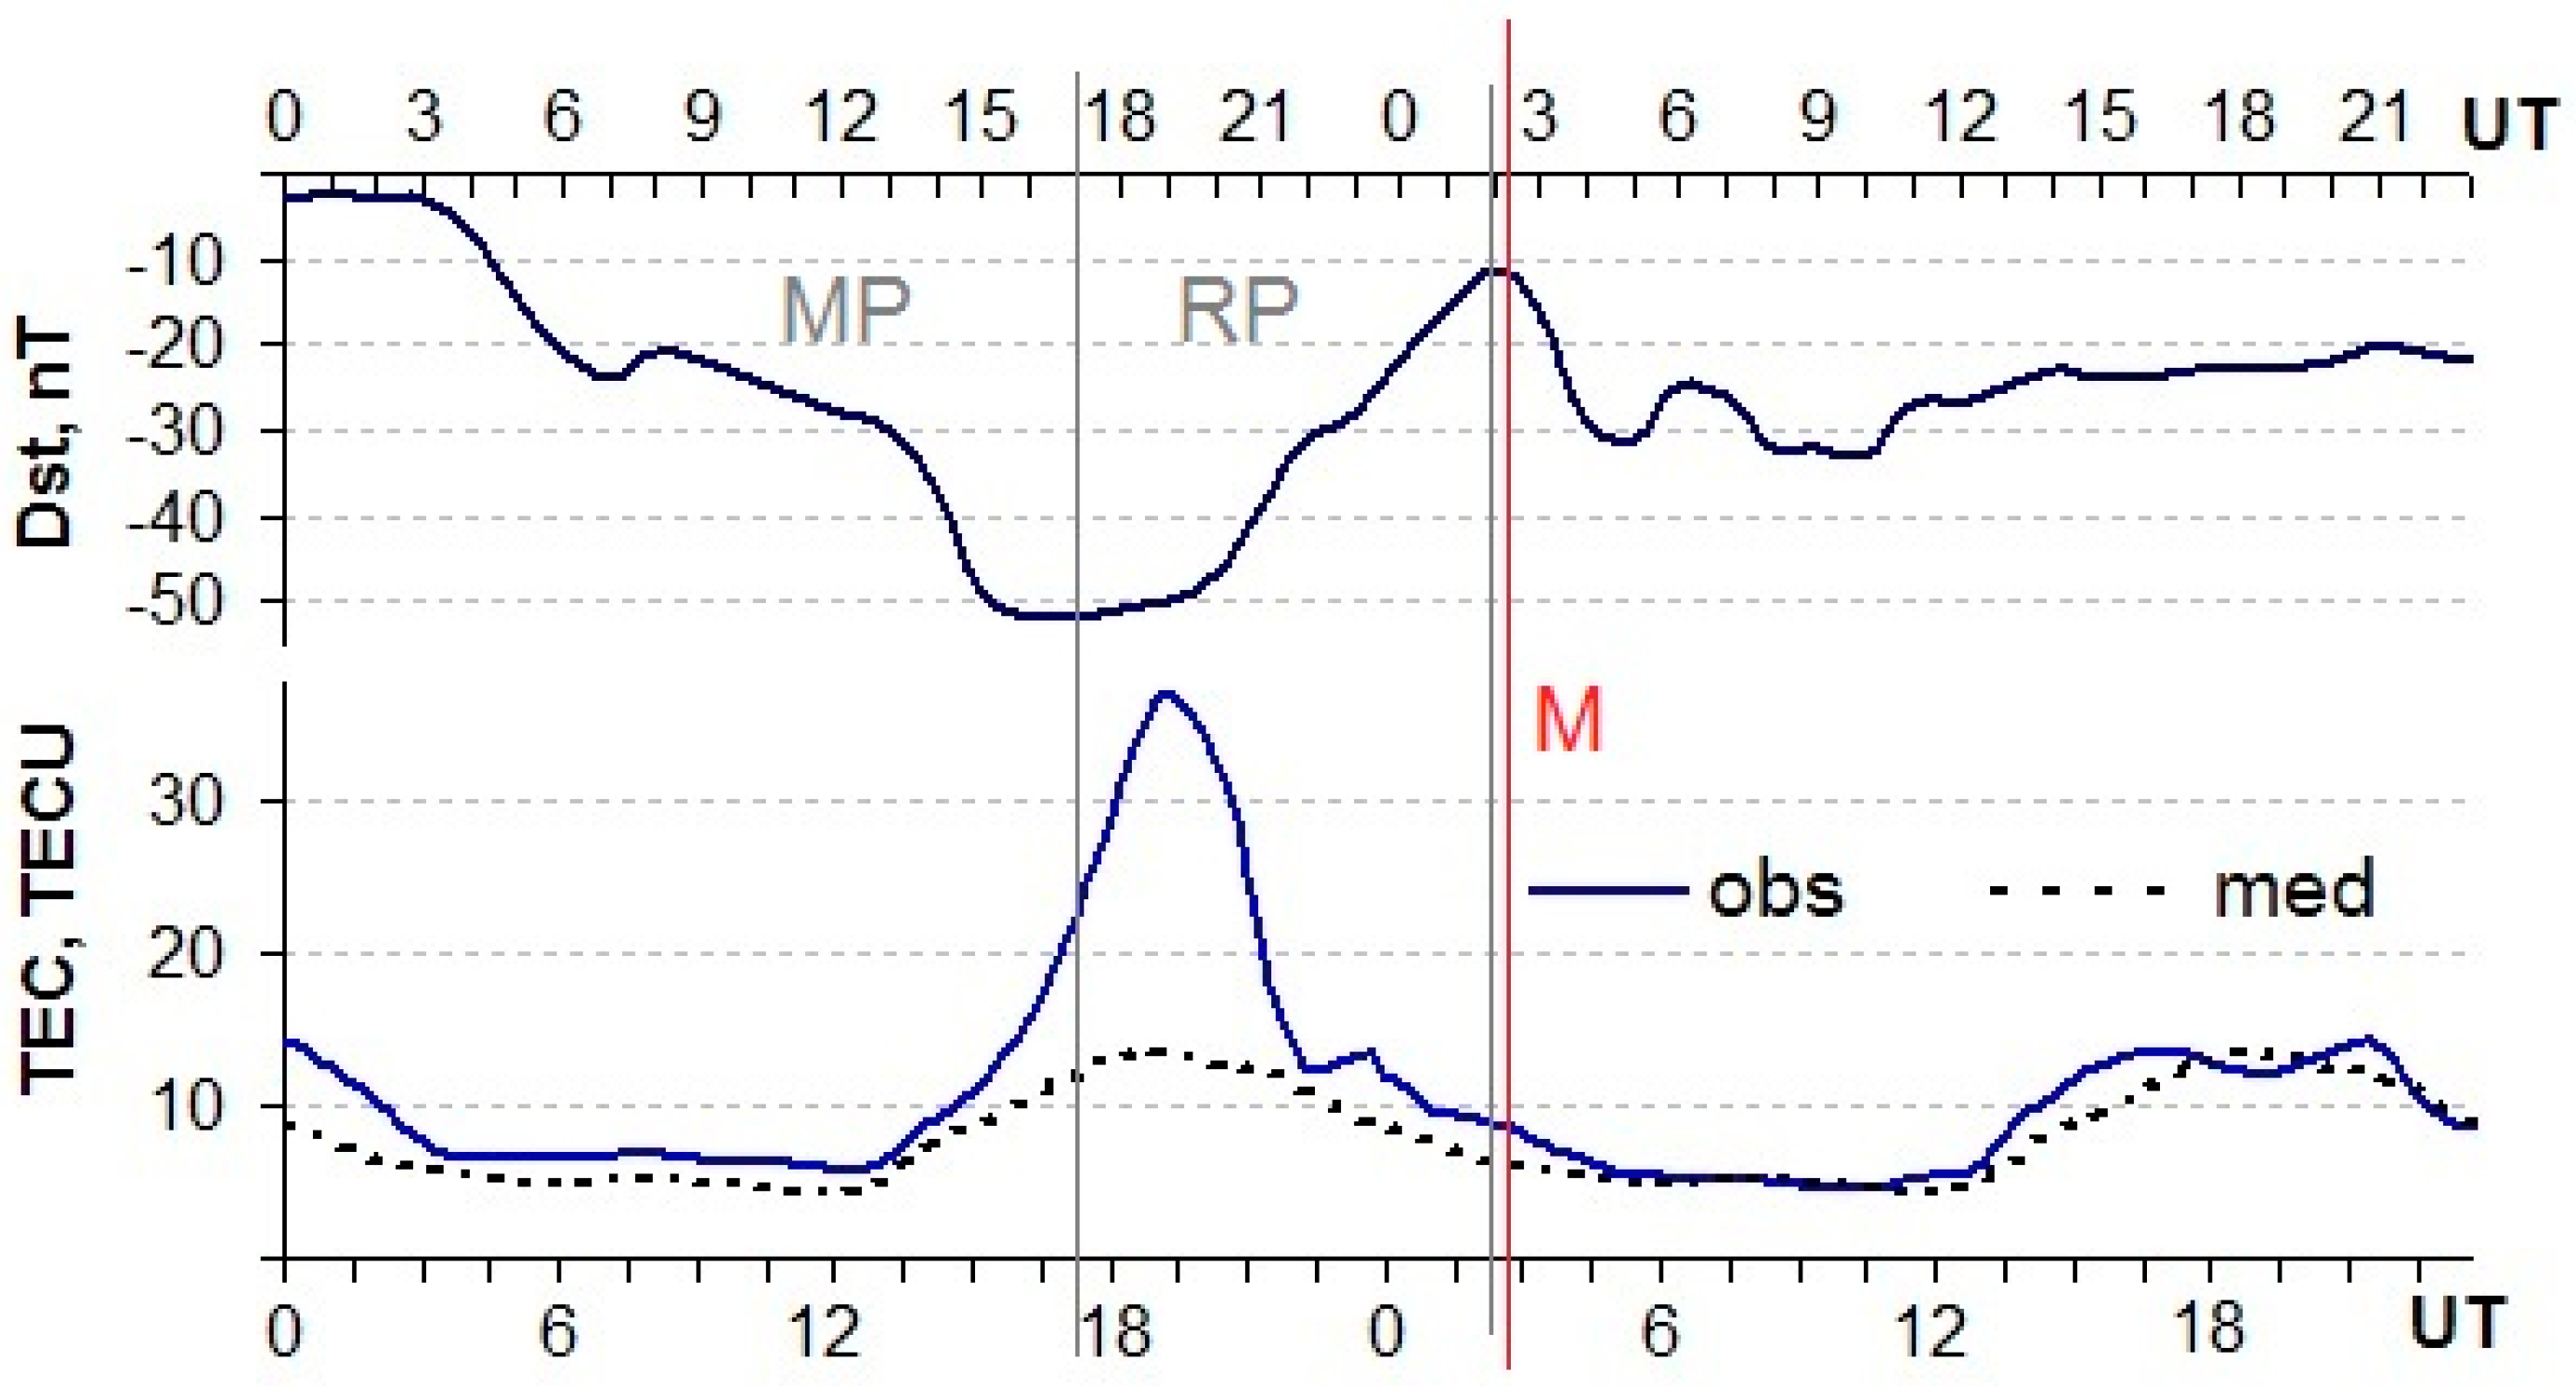
Figure 1. Variations of Dst-index (upper panel) and vTEC (lower panel) during 18–19 February 2020. Observed vTEC (blue curve); vTEC median by 27 previous days (black dotted curve).
Atmosphere 12 00185 g001
Figure 2. Terminator position at different heights at 02:18 UT on 19 February 2020. Blue dot indicates the meteoroid explosion site.
Atmosphere 12 00185 g002
Figure 3. (a) Cameras locations; (b) planes of the apparent meteor trajectory for each camera.
Atmosphere 12 00185 g003
Figure 4. (a,b) Illustration by Google Earth; (c) scheme of calculated meteoroid/meteor trajectory and its projection on the ground (approximate distances are indicated in km).
Atmosphere 12 00185 g004
Figure 5. Morelian meteoroid detection by GLM installed on GOES-16.
Atmosphere 12 00185 g005
Figure 6. Reconstruction of the Morelian meteoroid passage: (a) total energy change with altitude; (b) energy deposition, (c) mass loss and (d) pressure change with altitude; (e) α estimation; (f) velocity loss with altitude. Blue and black dotted lines indicate modeled break-up and burst heights.
Atmosphere 12 00185 g006
Figure 7. Reconstructed meteoroid oblique path in time.
Atmosphere 12 00185 g007
Figure 8. Map of stations whose data were used for calculation of (a) scintillation indices and (b) dIv. The meteoroid passage direction is marked with the line.
Atmosphere 12 00185 g008
Figure 9. Sub-satellite and meteoroid trajectories with respect to UCOE, UJUR (upper panels), IPN1 and OXUM locations (lower panels).
Atmosphere 12 00185 g009
Figure 10. d2fi, σφ, S4 and ROTI variations at LoSs between PRN02 and four receivers during 02–03 UT. Vertical line indicates the time of explosion.
Atmosphere 12 00185 g010
Figure 11. Examples of index bursts at different satellite-receiver rays after the meteoroid flight and explosion.
Atmosphere 12 00185 g011
Figure 12. (2–10) min dIv series in different LoSs to UCOE receiver during: (a) the quiet day, (b) geomagnetic disturbance day and (c) day of meteoroid. (d) The same as in panel “c” but for the (10–20) min dIv series. Each curve represents dIv for the corresponding satellite. The Y-axis unit is 0.1 TECU. The dashed line marks the explosion moment.
Atmosphere 12 00185 g012
Figure 13. (2–10) min dIv series for lines-of-site (a) SSNX-PRN02, (b) UCOE-PRN17, (c) RPIG-PRN06, (d) RPIG-PRN12, (e) RPIG-PRN19 and (f) ARIG-PRN28.
Atmosphere 12 00185 g013
Figure 14. LoSs to PRN02: (a) dIv time series; (b) sub-ionospheric point locations numbered in order of wave-packet disturbance registration.
Atmosphere 12 00185 g014
Figure 15. Schematic illustration of the geometry of LoSs to PRN02 and PRN28 (left) and PRN05 and PRN06 (right).
Atmosphere 12 00185 g015
Figure 16. Map of sub-ionospheric points at which N-form (left) and И-form (right) disturbances were detected. Red circles stand for positive and blue circles for negative dIv deviations in N- and И-form deviations.
Atmosphere 12 00185 g016
Figure 17. Schumann antenna signal amplitude on 19 February 2020: (a) raw time series; (b) its second order derivative time series.
Atmosphere 12 00185 g017
Table 1. Recent meteoroid phenomena.
Geographical Coordinates (Lat, Lon)°Data of Event (DD.MM.YYYY, HH:MM)VIS DataδvTEC, %
at the Site of Explosion/Meteor
Region
168.70, 23.816.11.2017, 16:40(+)−30Northern Finland
265.95, 29.7219.04.2014, 22:14(+)−10Annama
364.30, 123.104.03.2014, 21:29(+)−17.9Vilyuisk
456.90, 172.418.12.2018, 23:48 −3Bering Strait
555.00, 6115.02.2013, 03:20(+)−15Chelyabinsk
645.70, 27.107.01.2015, 01:06 −7.8Romania
Table 2. GNSS receivers whose data were involved in the analysis.
StationDistance to The Explosion Ground Projection Point, kmData Time ResolutionGeographicGeomagnetic
Lat°,NLon°,WLat°,NLon°,W
High-rate data
UCOE (Trimble)99.720 Hz19.8101.6827.8831.11
UJUR (Trimble)12550 Hz20.7100.4428.8329.85
TNGF (Trimble)17150 Hz19.3299.1727.5628.37
IPN1 (Leica)17250 Hz19.2999.6427.5428.89
OXUM (Trimble)6325 Hz15.6696.4924.1325.22
Low-rate data
UCOE99.715s19.8101.6827.8831.11
TNMO5415s19.65101.2927.7230.65
ARIG15530s18.28100.3526.4329.52
SSNX17130s19.3399.1827.5728.38
ZIHU23530s17.6101.4725.6730.64
RPIG26530s21.8999.9830.0429.48
UGEO29315s20.69103.3528.5732.94
UAGU30215s21.92102.3129.8831.97
TNMR30830s18.28103.3526.1832.69
PDIG76930s25.04105.432.6935.63
TNPJ91530s15.793.2224.3821.78
Table 3. Scintillation indices responses registered at different lines-of-sight.
StationPRN28PRN02PRN24 *PRN06PRN19PRN17
d2fiUCOE++++++
UJUR++/-++/-+/-+/-
IPN1+-++/-++^
TNGF------
OXUM------
σφUCOE++++++
UJUR++++++
IPN1++++++
TNGF------
OXUM+-no data-++
S4UCOE++^++++/-
UJUR++^+^++/-+
IPN1-----+^
TNGF++-^-+/---
OXUM+/-++--+
ROTIUCOE+--+++/-
UJUR----+-
IPN1+/---+/-++/-
TNGF----+-
OXUM----++
* in case of OXUM the column stands forPRN05 as PRN24 was not observed.
Publisher’s Note: MDPI stays neutral with regard to jurisdictional claims in published maps and institutional affiliations.