Article

Distinct Regimes of O3 Response to COVID-19 Lockdown in China

1
School of Earth and Space Sciences, University of Science and Technology of China, Hefei 230026, China
2
Center for Excellence in Regional Atmospheric Environment, Institute of Urban Environment, Chinese Academy of Sciences, Xiamen 361021, China
3
Key Laboratory of Environmental Optics & Technology, Anhui Institute of Optics and Fine Mechanics, Hefei Institutes of Physical Science, Chinese Academy of Sciences, Hefei 230031, China
4
Department of Precision Machinery and Precision Instrumentation, University of Science and Technology of China, Hefei 230026, China
5
Key Laboratory of Precision Scientific Instrumentation of Anhui Higher Education Institutes, University of Science and Technology of China, Hefei 230026, China
6
Anhui Province Key Laboratory of Polar Environment and Global Change, University of Science and Technology of China, Hefei 230026, China
7
Department of Computer Science, Hong Kong Baptist University, Hong Kong, China
8
School of Environmental Science and Optoelectronic Technology, University of Science and Technology of China, Hefei 230026, China
9
Institutes of Physical Science and Information Technology, Anhui University, Hefei 230601, China
10
Department of Geography, Hong Kong Baptist University, Hong Kong, China
*
Authors to whom correspondence should be addressed.
Atmosphere 2021, 12(2), 184; https://doi.org/10.3390/atmos12020184
Submission received: 10 January 2021 / Revised: 23 January 2021 / Accepted: 26 January 2021 / Published: 30 January 2021

Abstract

:
Restrictions on human activities remarkably reduced emissions of air pollutants in China during the COVID-19 lockdown periods. However, distinct responses of O3 concentrations were observed across China. In the Beijing–Tianjin–Hebei (BTH) and Yangtze River Delta (YRD) regions, O3 concentrations were enhanced by 90.21 and 71.79% from pre-lockdown to lockdown periods in 2020, significantly greater than the equivalent concentrations for the same periods over 2015–2019 (69.99 and 43.62%, p < 0.001). In contrast, a decline was detected (−1.1%) in the Pearl River Delta (PRD) region. To better understand the underlying causes for these inconsistent responses across China, we adopted the least absolute shrinkage and selection operator (Lasso) and ordinary linear squares (OLS) methods in this study. Statistical analysis indicated that a sharp decline in nitrogen dioxide (NO2) was the major driver of enhanced O3 in the BTH region as it is a NOx-saturated region. In the YRD region, season-shift induced changes in the temperature/shortwave radiative flux, while lockdown induced declines in NO2, attributable to the rise in O3. In the PRD region, the slight drop in O3 is attributed to the decreased intensity of radiation. The distinct regimes of the O3 response to the COVID-19 lockdown in China offer important insights into different O3 control strategies across China.

1. Introduction

Tropospheric O3 is formed through complex reactions involving volatile organic compounds (VOCs) and nitrogen oxides (NOx), along with influences of meteorological conditions (such as radiation, temperature, wind, relative humidity, daily precipitation amount, and surface pressure). O3 concentrations usually exhibit a nonlinear response to source emissions of precursors, in such a way that the O3 response to emission control of one precursor (e.g., NOx) also depends on emissions of other precursors (e.g., VOCs) due to their complex interactions [1]. Accordingly, it is challenging to identify the driving precursors and meteorological processes. There have been considerable attempts made to examine relationships between O3 and influencing factors, such as VOCs, NO2, sunshine hours, temperature, wind speed, relative humidity, daily precipitation amount, surface pressure and geopotential height [1,2,3,4,5,6]. It was demonstrated that the O3 sensitivity regimes and leading influencing meteorological factors vary across regions and time periods [1,2,3,4,5,6].
In December 2019, the coronavirus disease, named later as COVID-19 by the World Health Organization (WHO) [7], emerged in Wuhan and it has spread worldwide quickly since then. The entire metro network along with all other public transport in Wuhan were shut down on January 23, 2020 to prevent the spread of infection. Subsequently, public gatherings, planned events, etc. were canceled, and education was suspended in the rest of China. These restrictions remarkably reduced emissions of air pollutants in China [8]. TROPOspheric Monitoring Instrument (TROPOMI) and Ozone Monitoring Instrument (OMI) revealed the unprecedented declines in NO2 column density over China [9]. Evident declines in particulate matter and CO were also identified, whereas observations suggested an unexpected uptrend in O3 [10,11,12]. Liu et al. [13], Le et al. [14] and Zhang et al. [15] further declared that reductions in NOx emissions resulted in the enhancement of O3, which would have increased atmospheric oxidation and promoted the formation of secondary aerosols. Due to the uncertain sensitivity of O3 to precursors in air quality models and large uncertainties in emission inventories [16], these findings need more careful investigation along with observations. Additionally, the roles of meteorological conditions in the enhancement of O3 levels during the COVID-19 lockdown period are not well understood. The COVID-19 lockdown provides a terrific evaluation testbed of emission control policy in mitigating O3 pollution in China.
In this study, we used statistical methods, e.g., Lasso (the least absolute shrinkage and selection operator) and ordinary linear squares (OLS), to select the driving factors for the enhancement of O3 in China during the epidemic lockdown period. The selected factors are compared against those for previous years to represent the unusual situation of 2020. The results will advance our understanding of the relative importance of meteorological conditions and O3 precursors in the formation of O3 in China under a low-emission scenario.

2. Materials and Methods

2.1. Meteorological Data and Observations of Air Pollutants

In our study, gridded meteorological variables with a spatial resolution of 0 . 1 ° × 0 . 1 ° were derived from the European Centre for Medium-Range Weather Forecasts (ECMWF) ERA5 reanalysis dataset (https://cds.climate.copernicus.eu/cdsapp#!/home) [17]. We considered near surface temperature (T2), wind speeds (WS10), relative humidity (RH2), and mean surface net shortwave radiation flux (SWR) in this study. Hourly surface concentrations of O3, PM2.5, and NO2 were obtained from the China National Environmental Monitoring Center (CNEMC) network (http://106.37.208.233:20035/, last access: 9 August 2020) [18]. As VOCs are not monitored by the CNEMC network, we used formaldehyde (HCHO) tropospheric vertical column concentrations (VCDs) retrieved from the Ozone Mapping and Profiling Suite Nadir Mapper (OMPS-NM) [19], and surface HCHO concentrations from Ground based Multi-Axis Differential Optical Absorption Spectroscopy (MAX-DOAS) measurements in this study [20]. OMPS-NM measures UV radiation at wavelengths ranging from 300 to 380 nm using a single grating and a charge-coupled device (CCD) detector. It has a 110°cross-track field of view (FOV), similarly to OMI (Ozone Monitoring Instrument). OMPS-NM products are provided at 50 km × 50 km spatial grids by combining measurements into 35 cross-track bins in OMPS-NM standard Earth science mode. Ground based MAX-DOAS observes tropospheric aerosols and trace gases based on scattered sunlight under different viewing angles [21]. Additionally, tropospheric vertical column concentrations of HCHO and NO2 retrieved from TROPOspheric Monitoring Instrument (TROPOMI) [22,23,24], a satellite instrument on board of the Copernicus Sentinel-5 Precursor satellite, were used to distinguish O3 sensitivity regimes.
Previously, satellite HCHO measurements were used to constrain VOCs emissions in Asia, Fu et al. [25] and Su et al. [19] also demonstrated that tropospheric HCHO is mostly concentrated below 1 km. To examine the reliability of representing surface concentrations of HCHO with satellite observed HCHO column, we compared OMPS HCHO VCDs against surface HCHO observations from MAX-DOAS at multiple stations across China, and found that they are significantly correlated (Figure 1).

2.2. Statistical Analysis

To investigate the influence of the COVID-19 lockdown on the association between the features (O3 precursors and meteorological conditions) and O3, we first applied the least absolute shrinkage and selection operator (Lasso) for relevant feature selection and then used ordinary least square (OLS) regression to obtain the statistical significance of the selected features. Lasso, proposed by Tibshirani [26], is featured both in feature selection and model interpretability. Lasso excels over other feature selection methods, such as stepwise selection, with consideration of a penalty term, which can shrink the regression coefficients towards zero to prevent overfitting. We can regard it as a variant of OLS by imposing sparse constraint to the regression model as follows:
β lasso = arg min β { 1 2 i = 1 N ( y i β 0 j = 1 p x i j β j ) 2 + λ j = 1 p | β j | }
where y i and x i j are the regression target and the value of j t h feature for the i t h sample, respectively. { β j } j = 1 p are feature weights to be estimated from the model, and λ is a hyperparameter controlling the strength of the sparse constraint. Here, we choose the optimal value of λ via cross validation. The optimization algorithm to iteratively infer { β j } j = 1 p is least angle regression (LARs) [27]. Considering the features are of different scales, instead of directly feeding them into the Lasso model, they are first normalized to have a zero mean and standard deviation of one. The output of Lasso is a set of features with non-zero weight values. In order to statistically assess their importance (e.g., sensitivity of O3 concentration to gaseous precursors and meteorological parameters), we adopted OLS to generate p values of t-tests for input features.

3. Results

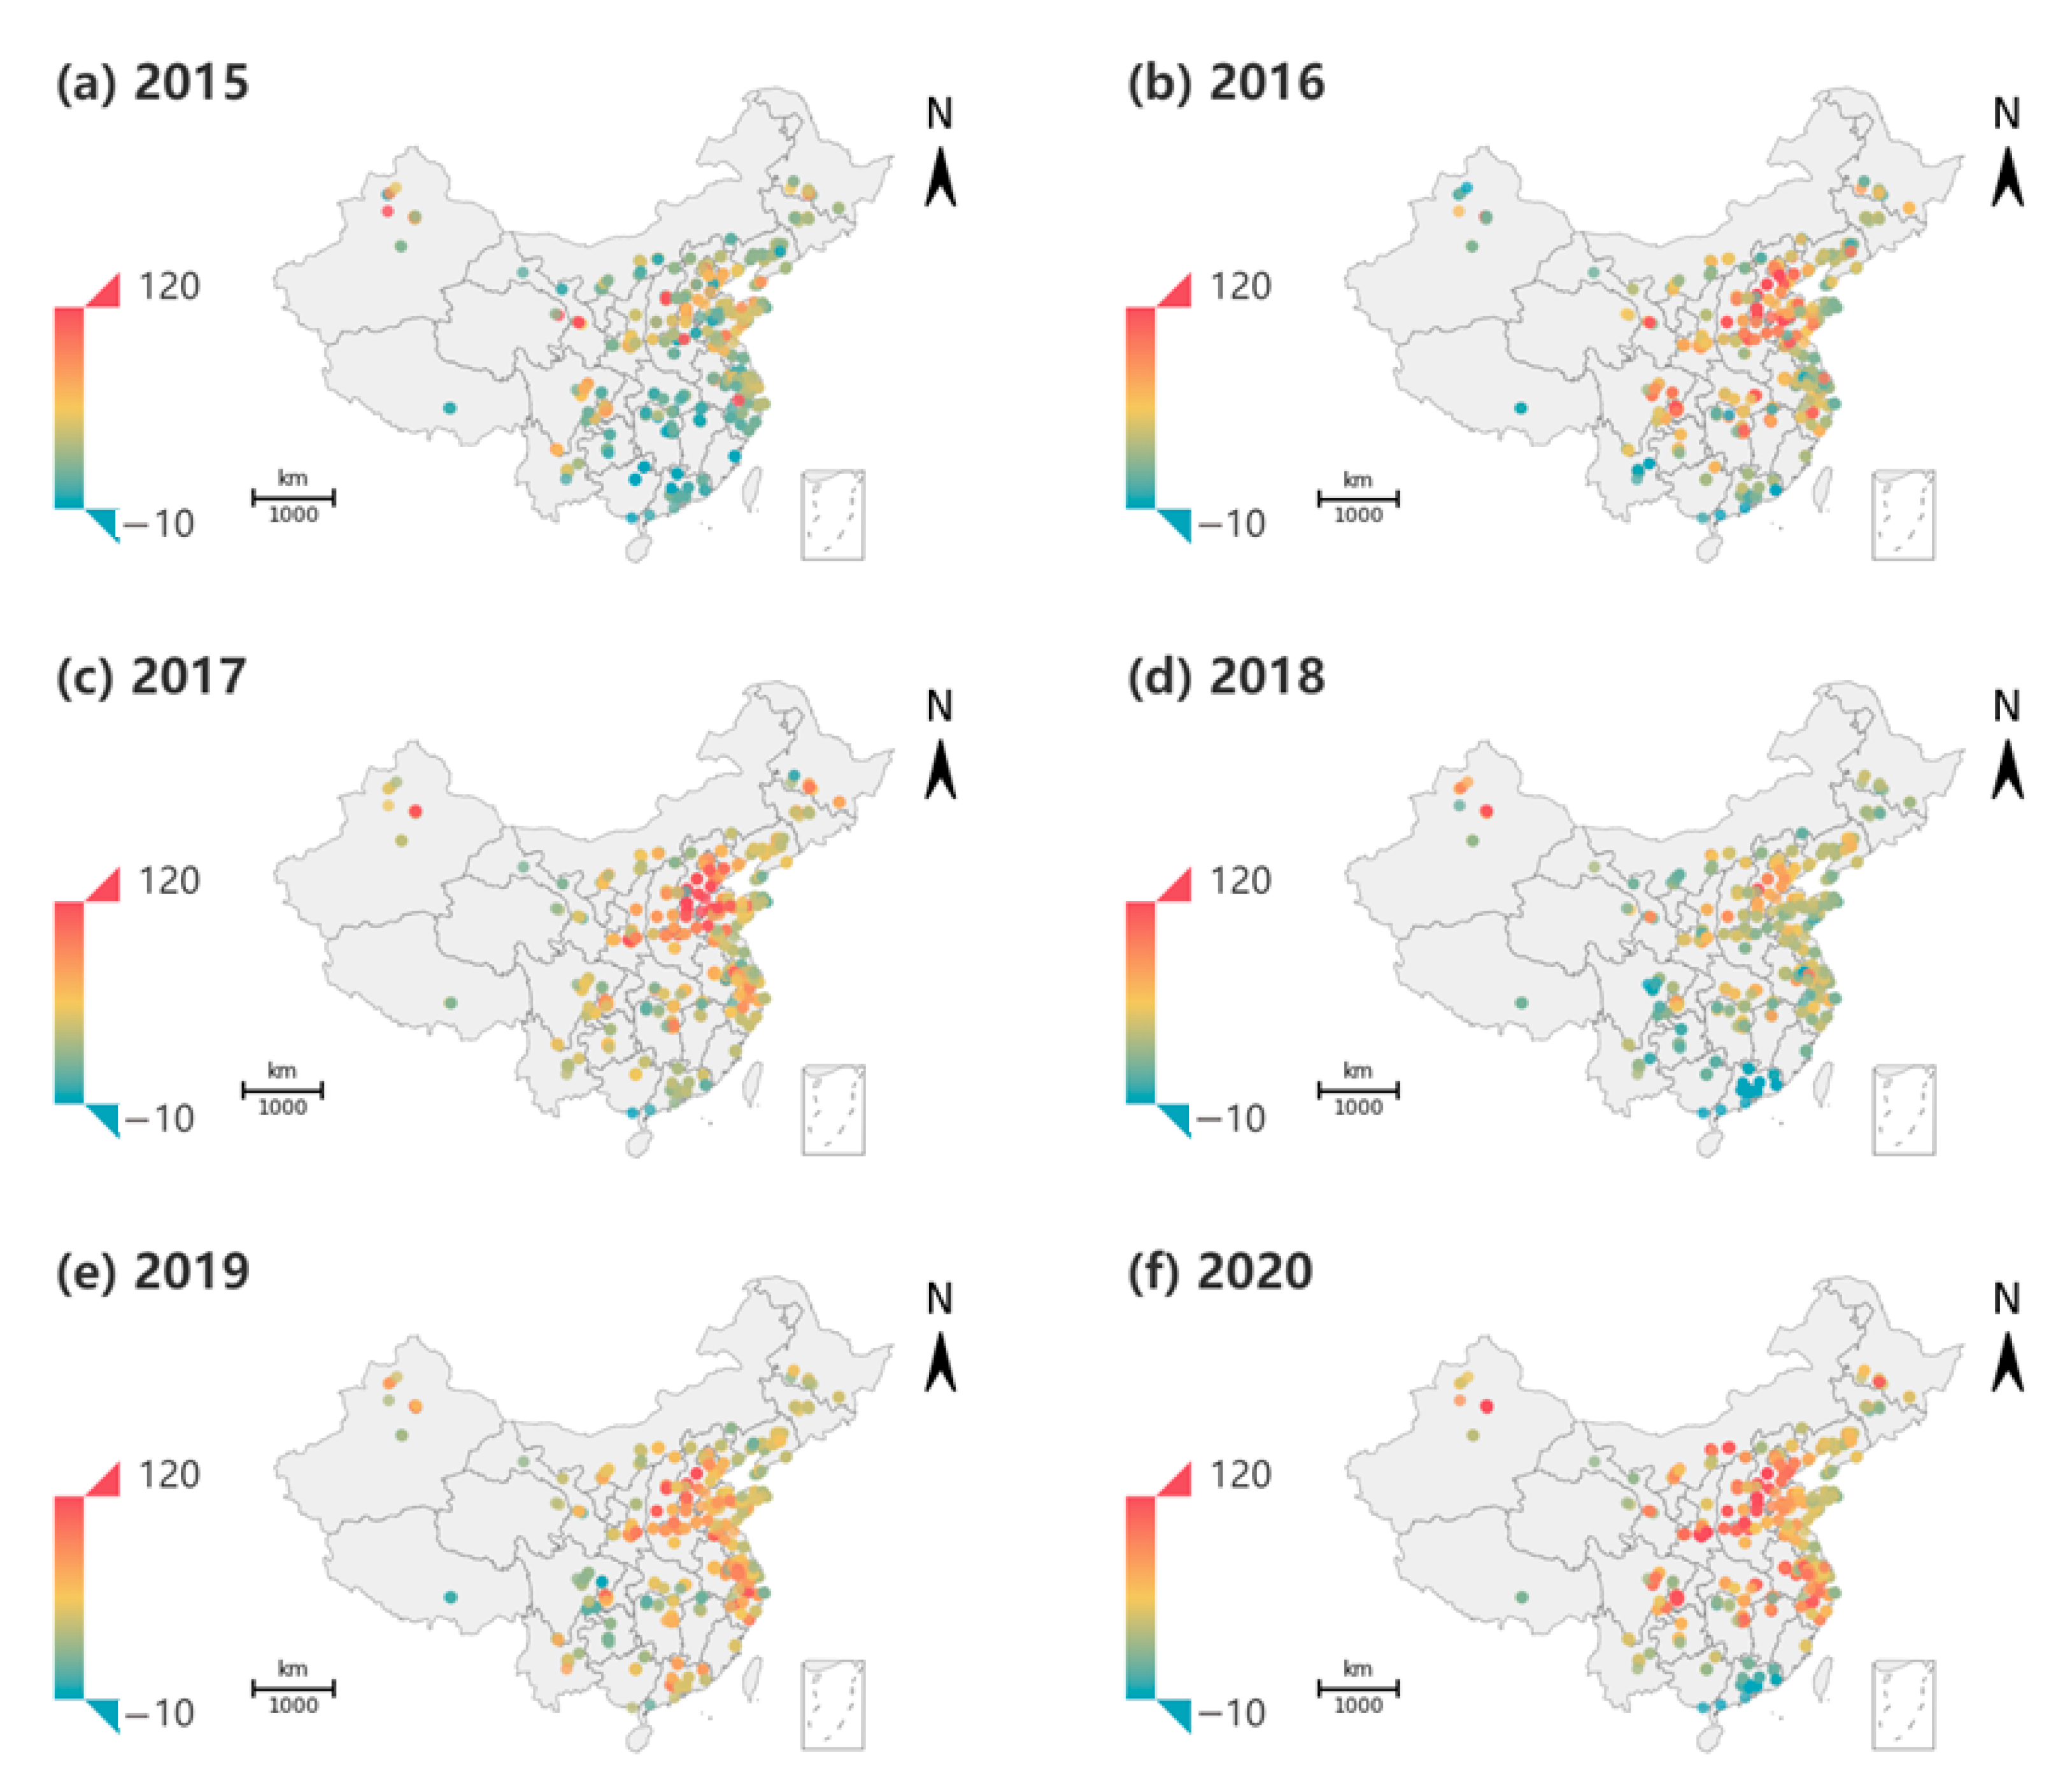
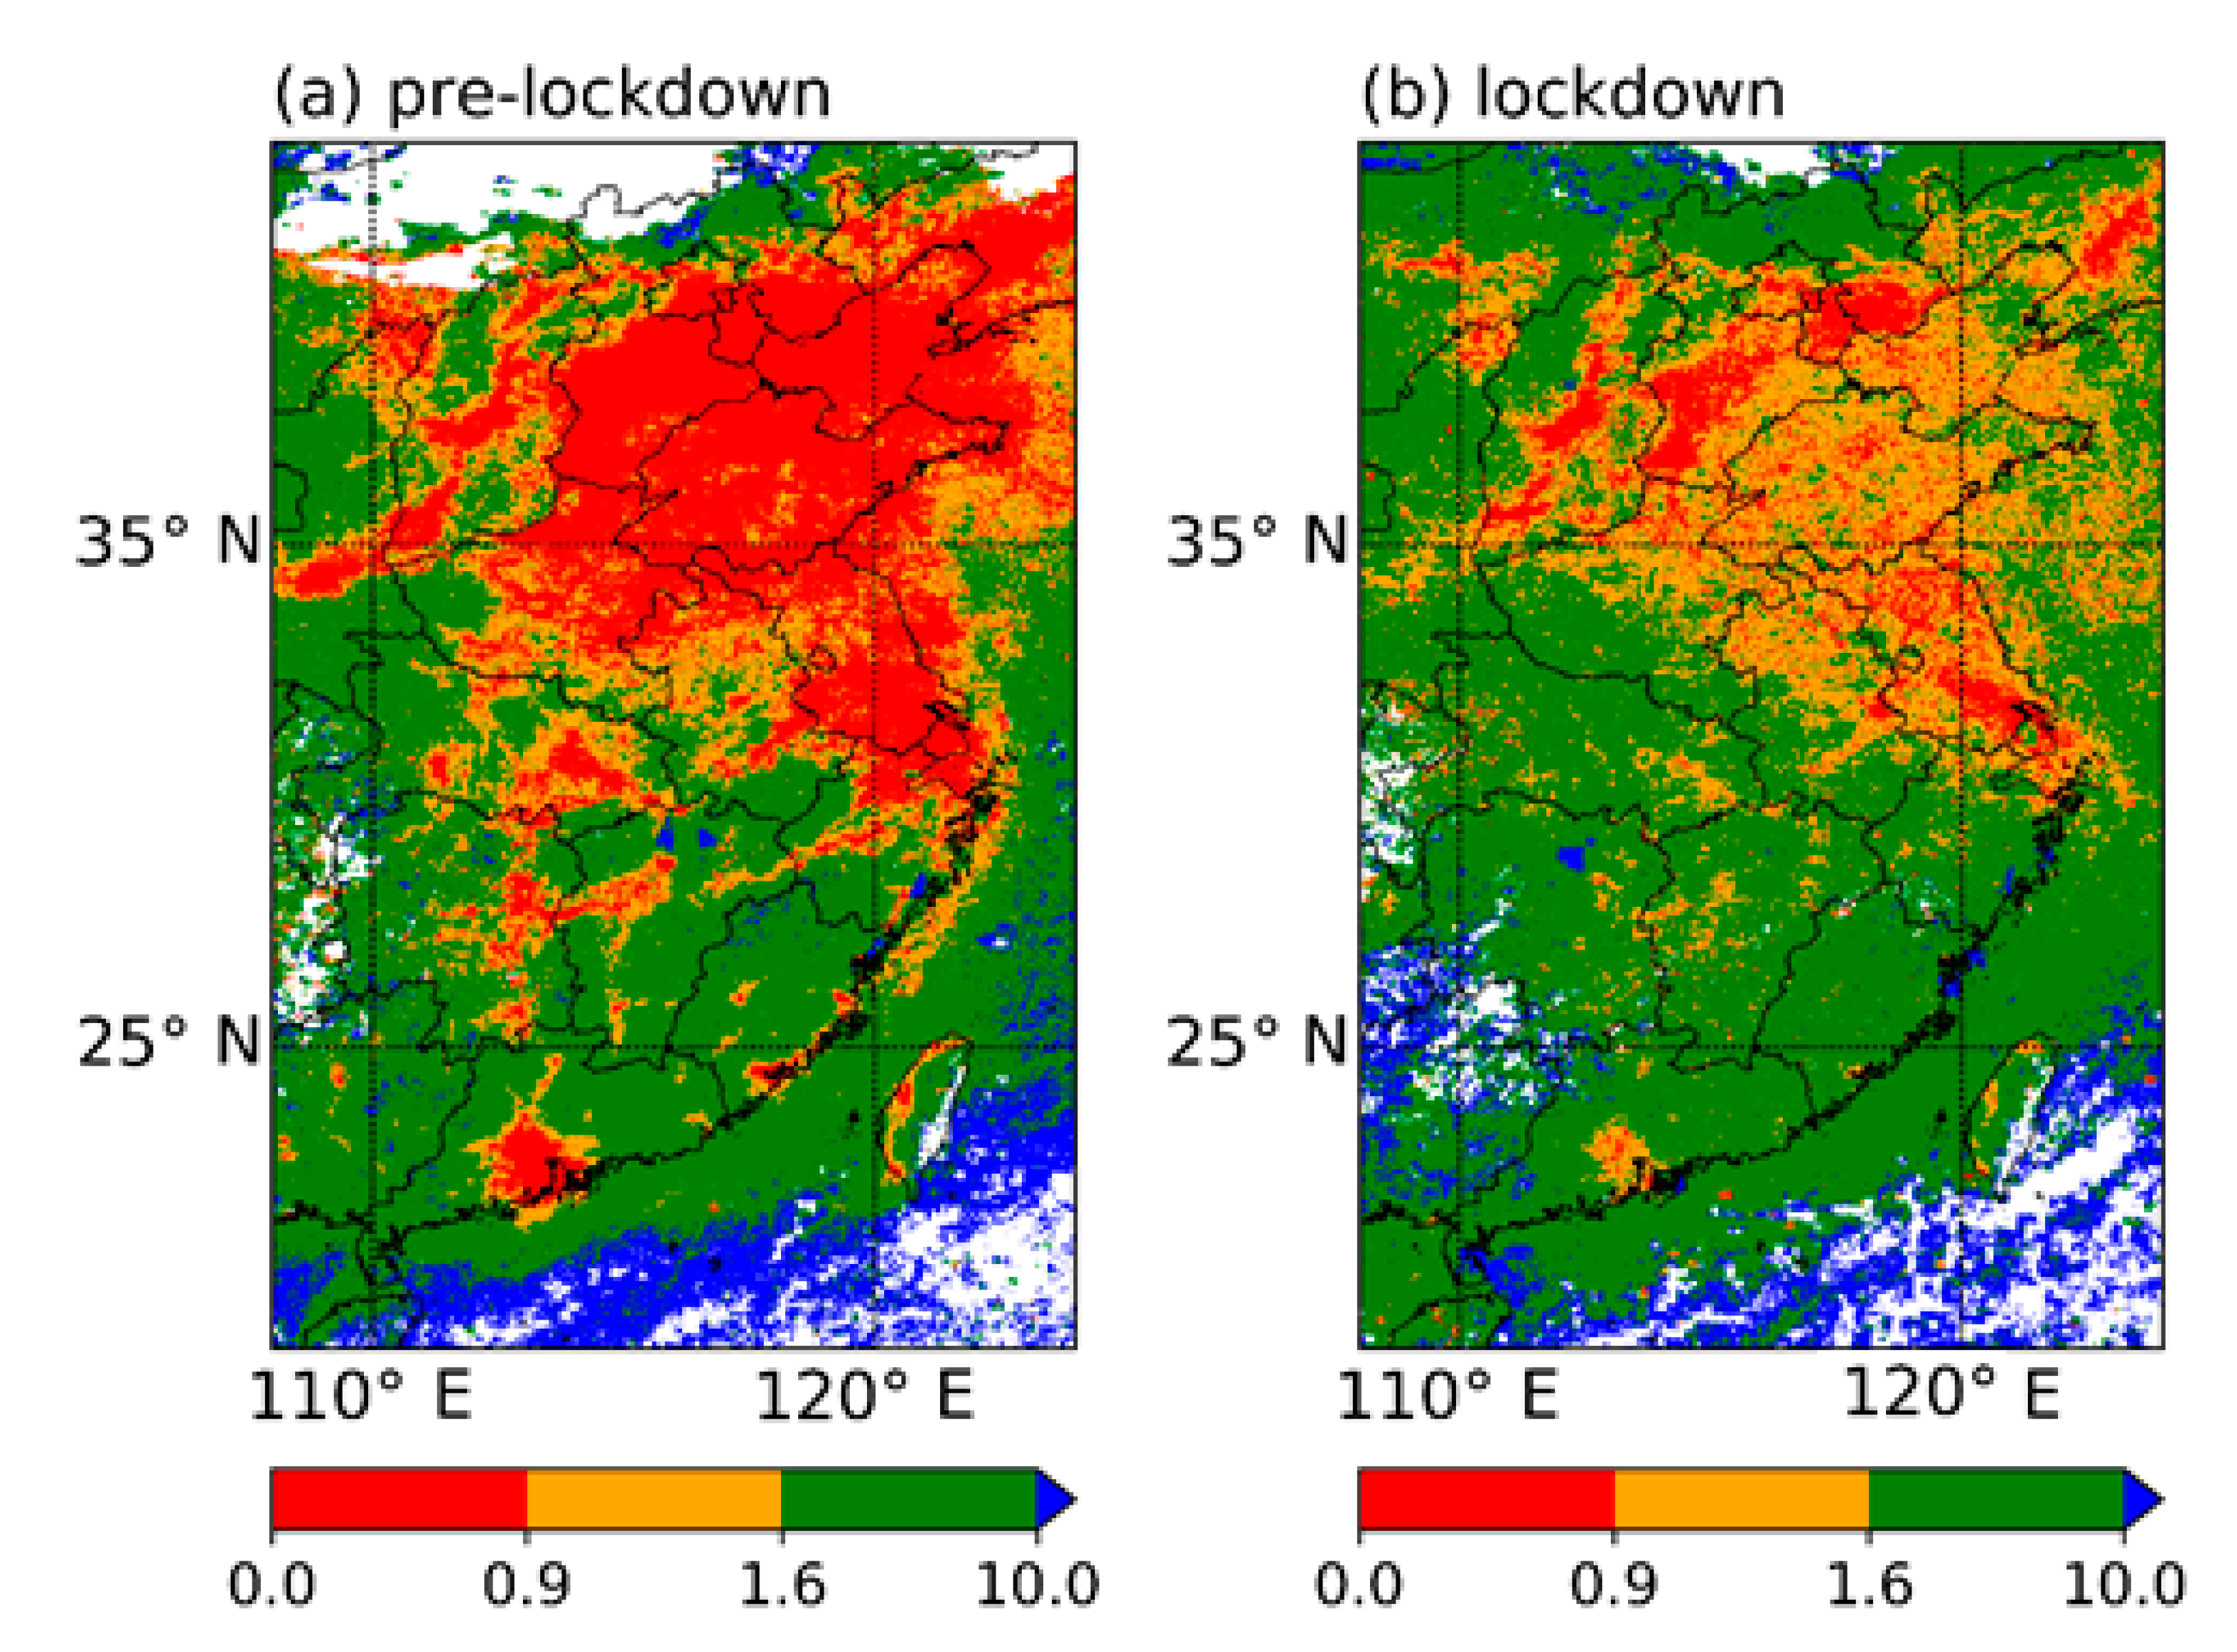
3.1. Evolution of O3 from Pre-Lockdown to Lockdown Periods over 2015–2020

Since 23 January 2020 when Wuhan announced the lockdown, most of the economic activities and public transportation in China were restricted [28]. We define pre-lockdown and lockdown periods in this study as the five weeks before and after 23 January, respectively. Although lockdown occurred only in 2020, we use pre-lockdown and lockdown periods in this study to denote the same time periods in previous years as well. Human activities during the spring festival holidays are usually distinctively different from those during working days, including widespread usage of fireworks, reduction in traffic flow, shutdown of factories, etc. [29,30]. To avoid such influence, we exclude data over the spring festival holidays of 2015–2020. As emission levels and meteorological conditions vary greatly across seasons and years, we use the percentage changes of O3 concentrations from pre-lockdown to lockdown periods to investigate the driving factors. As listed in Table 1, compared to the pre-lockdown period, O3 concentrations in China increased by 64.27% in 2020, significantly higher than any previous year over 2015–2019 and the mean percentage change of 41.63% over 2015–2019 (p < 0.001).
However, the changes of O3 from before and after January 23 exhibit a heterogeneous spatial distribution (Figure 2). Pronounced growth of O3 is observed in the Beijing–Tianjin–Hebei (BTH) region, especially in 2016, 2017 and 2020 (Figure 2b,c,f). In 2020, O3 concentrations in the BTH region increased by 90.21% from pre-lockdown to lockdown periods, higher than the percentage changes for other years (Table 1). Similar enhancements of O3 concentrations are also observed in the Yangtze River Delta (YRD) region (Figure 2) over 2015–2020. In 2020, O3 concentrations in the YRD region rose by 71.79% from pre-lockdown to lockdown periods, significantly higher than that for any other year and the mean of previous years (Table 1). In contrast, an opposite trend of O3 from pre-lockdown to lockdown (−1.1%) periods in 2020 was identified for the Pearl River Delta (PRD) region (Table 1), which is significantly different from those for previous years. Over 2015–2019, the mean O3 concentrations increased by 14.83% from five weeks before January 23 to five weeks after January 23 in the PRD (Table 1). These inconsistent responses of O3 to pandemic lockdown across China indicate distinct regimes of O3 control.

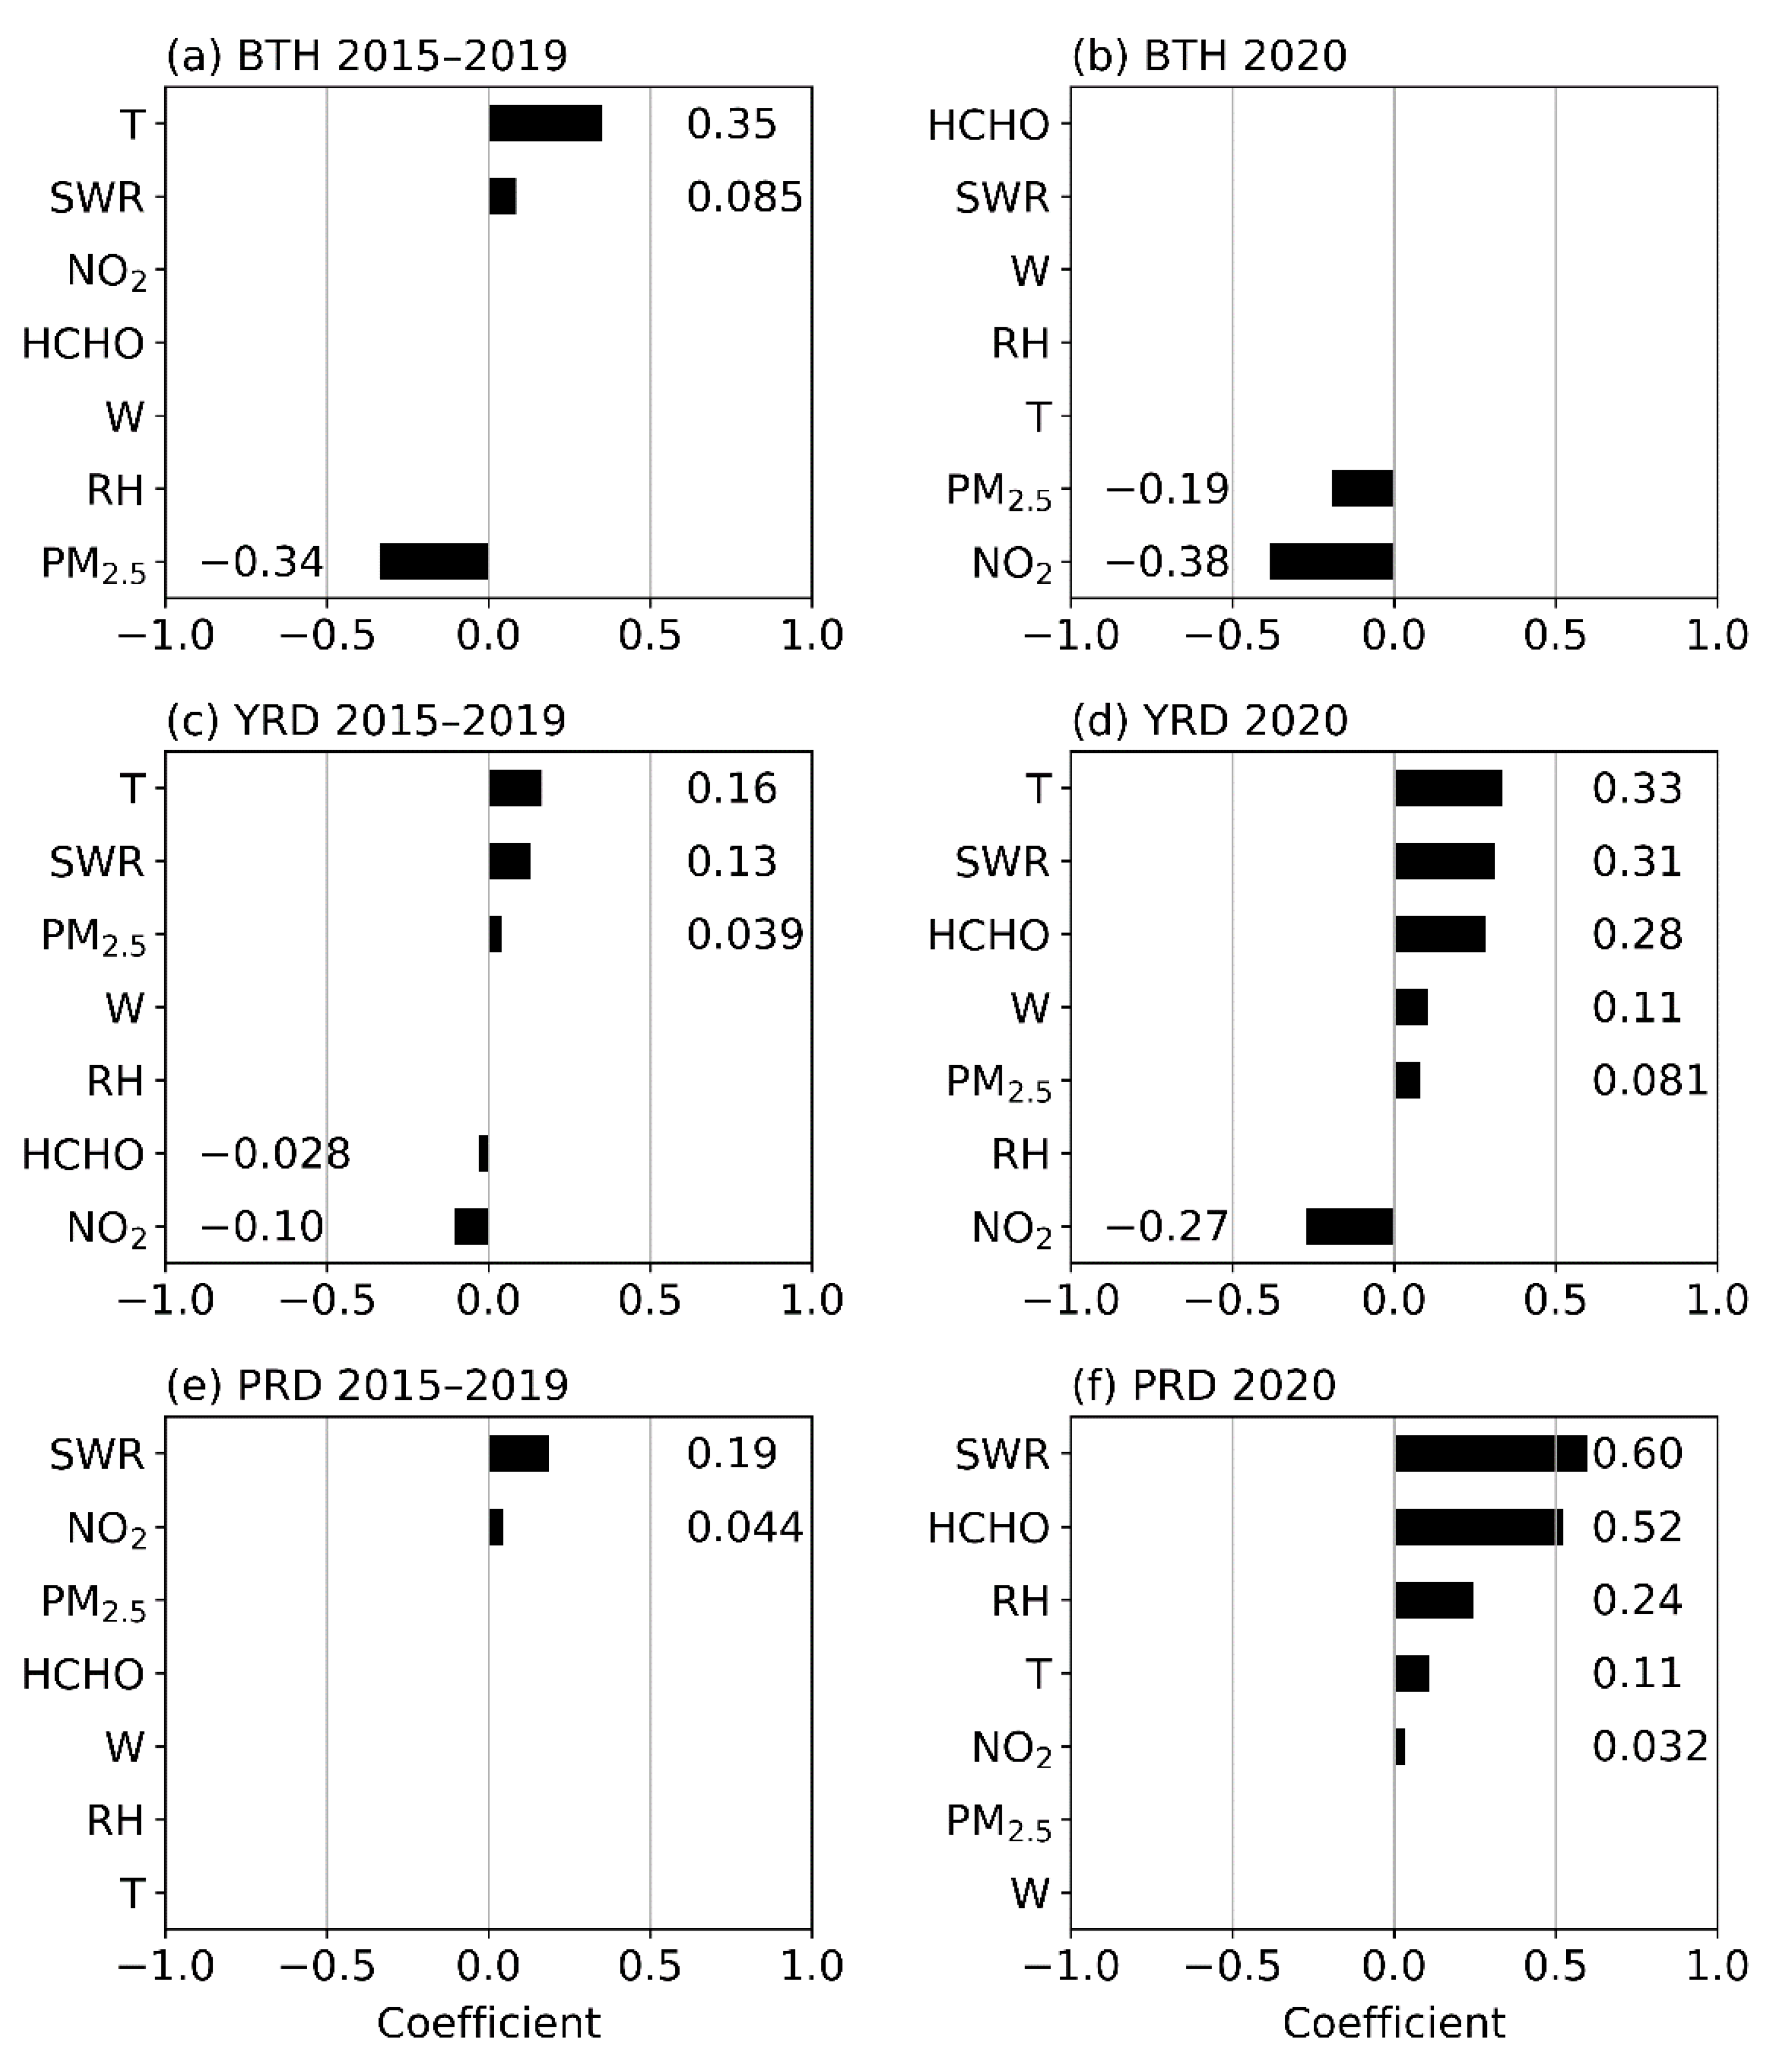
3.2. Potential Driving Factors for Different Responses of O3 to Pandemic Lockdown in China

The concentration of O3 is affected by multiple factors, including the abundance of gaseous precursors (i.e., VOCs and NOx), intensity of radiation, winds, etc. We consider, in this study, meteorological parameters including temperature (T2), wind speed (WS10), relative humidity (RH2), and mean surface net shortwave radiation flux (SWR). Stronger temperature and solar radiation enhance emissions of O3 precursors and accelerate photochemical O3 production under high precursor concentrations [31]. Given the spatial distribution of natural emissions of VOCs across China, the effects of accelerated photochemical O3 production would be more important in north China, while both effects could be important in south China [31]. For the influence of related chemical species, we include concentrations of HCHO, PM2.5 and NO2. PM2.5 concentrations are considered based on the recent reports on the interactions between O3 formation and particles in China [32]. Similarly to the analysis of O3, we calculated the percentage changes of these parameters for each observation site. We then used Lasso and OLS methods to explore the potential triggering factors for the changes in O3 during the COVID-19 lockdown period in different regions in China, as the relationship between O3 formation and influencing factors would vary across regions [33,34]. The results for the unusual year of 2020 are also compared against those over 2015–2019.
Figure 3 illustrates the dominant factors for percentage changes of O3 over 2015–2019 and in 2020 for the BTH, YRD and PRD regions. Coefficients of some variables listed in Figure 3 are zero, suggesting the negligible roles of these variables. The importance of each selected parameters is statistically evaluated and summarized in Table S1. In the BTH region, intensified T and SWR from pre-lockdown to lockdown periods are important factors (positive effects) for enhanced O3 over previous years (2015–2019), due to enhanced emissions of biogenic VOCs and photochemical O3 production [35,36]. Additionally, declines in PM2.5 might have also played a role (Figure 3a), due to the effects of higher actinic flux and reduced sink of hydroperoxyl [32]. A negative correlation between O3 and PM2.5 was also revealed by Chu et al. [37] in the winter in north China when the PM2.5 concentration was above 50 ug/m3. In 2020, the enormous increase in O3 was provoked mainly by the sharp declines in NO2, while reduced concentrations of PM2.5 might also have played a role (Figure 3b). Different from previous years, changes in meteorological conditions exhibit negligible contributions in 2020 in the BTH region (Figure 3b). Previous model sensitivity analysis by Gao et al. [18] suggests that the BTH region is VOC-limited in winter and the same sensitivity is observed during the pre-lockdown period (Figure 4) in the BTH region, where declines in NOx would be likely to enhance O3 concentrations [38,39,40]. Accordingly, enhanced O3 concentrations in the BTH region during the 2020 pandemic lockdown was mainly driven by sharp declines in NO2 (Table S1).
In the YRD region, for both previous years and 2020, O3 is enhanced by augmented T and SWR, while being negatively affected by changes in NO2 (Figure 3c). In 2020, the influences of these factors are stronger than those over 2015–2019. The response of O3 to declines in NO2 in the YRD region is in line with that in the BTH region. This is also consistent with the findings of sensitivity of O3 to emission sectors in the YRD by Gao et al. [18] and the sensitivity indicated by satellites (Figure 4). In addition, a positive relationship between changes in HCHO and response of O3 is identified in 2020 in the YRD. Although HCHO levels declined in the YRD region in 2020 (−18.64%, Table S3), its suppression of O3 formation might have been downplayed by stronger declines in NO2 (−56.63%, Table S3) and intensified T/SWR (Table S3). Thus, meteorological conditions (i.e., T and SWR) and changes in gaseous precursors (mainly declines in NO2) work together to augment O3 in the YRD.
In the PRD region, the enhancement of O3 from pre-lockdown to lockdown periods over 2015–2019 are well explained by the intensified SWR due to shift of season (Figure 3e). Additionally, increases in NO2 would also slightly promote the formation of O3 (Figure 3e). As indicated in Gao et al. [18] and Figure 4, the PRD region exhibits a different sensitivity regime from the BTH and YRD regions, and the increase in NOx emissions is likely to promote the formation of O3 in the PRD. From pre-lockdown to lockdown periods in 2020, both T and SWR declined (Table S4). Lower T and SWR would suppress the photochemical reaction rates and reduce emissions of precursors to lower levels of O3. As indicated in Figure 3f, the dominant non-meteorological factor for the response of O3 in the PRD in 2020 is HCHO. As observed by satellite and surface monitors, HCHO abundance in the PRD increased from 9.83 to 9.97 × 10¹⁵ molec/cm2, while NO2 concentrations declined by 55.47% (Table S4). In the PRD region, changes of O3 positively correlate with both changes in HCHO and NO2 (Figure 5b), suggesting that O3 formation in the PRD region is likely in the transition regime [5]. The promotion of O3 by enhanced HCHO might have been downplayed by reduced intensity of SWR. Thus, decreased SWR from pre-lockdown to lockdown periods in 2020 served as the major driver of slightly declined O3 in the PRD region.

4. Discussion

Due to the uncertainties in chemical transport modeling, we use statistical methods in this study, i.e., Lasso and OLS, to understand the driving factors for diverse responses of O3 concentration in China during the COVID-19 lockdown. We report that O3 exhibits distinct responses across China. In the BTH region, enhanced O3 concentrations during lockdown were mainly driven by sharp reductions in NOx emissions, which is related to the restrictions on transportation and economic activities. In the YRD region, both meteorological conditions (i.e., T and SWR) and changes in gaseous precursors (mainly declines in NO2) work together to augment O3 in the YRD. However, O3 declined in the PRD region during the pandemic lockdown, mainly due to decreased intensity of SWR. These results implicate that controlling sources of VOCs would be more efficient to reduce wintertime O3 levels in both BTH and YRD regions, while controlling either NOx or VOCs would work for the PRD region.
These results highly depend on the quality of the used observation datasets. The accuracy of CNEMC data has been validated and demonstrated extensively with independent surface observations in previous studies [41]. However, uncertainties in the adopted HCHO satellite column and its representation of near surface HCHO would bring about uncertainties in the conclusion. As O3 concentrations in the BTH region are mainly affected by NO2, and meteorological factors played a more important role in the other two regions, the adverse effects of the uncertainties in HCHO observations are limited in this study. Yet, this further emphasizes the need for densely distributed ground-based observations of HCHO and other VOC species. Our results also emphasize that O3 control strategies should be carefully designed with consideration of differences among regions.

Supplementary Materials

The following are available online at https://www.mdpi.com/2073-4433/12/2/184/s1, Table S1: The relationship between percentage changes of O3 and associated factors in the BTH, YRD and P RD regions (coefficients listed are significant at 0.05 level); Table S2: The mean values of considered parameters during pre-lockdown, lockdown periods, and percentage changes in the BTH region; Table S3: The mean values of considered parameters during pre-lockdown, lockdown periods, and percentage changes in the YRD region; Table S4: The mean values of considered parameters during pre-lockdown, lockdown periods, and percentage changes in the PRD region.

Author Contributions

M.G. and C.L. conceived the research project and organized paper; S.L. carried out data analysis; M.G., S.L., X.Y., and Q.H. offered explanations of the research; W.S., J.L., C.Z., C.X., X.J., W.T. and H.L. contributed to the acquisition of data; M.G. and S.L. wrote the paper with approval from all the authors. All authors have read and agreed to the published version of the manuscript.

Funding

This research was funded by grants from the National Key Research and Development Program of China (No. 2018YFC0213104, 2017YFC0210002, 2016YFC0203302 and 2017YFC0212800), the National Natural Science Foundation of China (No. 41722501, 51778596, and 41977184), Anhui Science and Technology Major Project (No. 18030801111), the Strategic Priority Research Program of the Chinese Academy of Sciences (No. XDA23020301), the National Key Project for Causes and Control of Heavy Air Pollution (No. DQGG0102 and DQGG0205).

Institutional Review Board Statement

Not applicable.

Informed Consent Statement

Not applicable.

Data Availability Statement

Data are contained within the article.

Acknowledgments

We thank the Ministry of Environmental Protection of the People’s Republic of China for providing the O3, PM2.5 and NO2 surface concentrations from the China National Environmental Monitoring Center (CNEMC) Network (http://106.37.208.233:20035/).

Conflicts of Interest

The authors declare no conflict of interest. The funders had no role in the design of the study; in the collection, analyses, or interpretation of data; in the writing of the manuscript, or in the decision to publish the results.

References

  1. Wang, P.; Chen, Y.; Hu, J.; Zhang, H.; Ying, Q. Attribution of Tropospheric Ozone to NOx and VOC Emissions: Considering Ozone Formation in the Transition Regime. Environ. Sci. Technol. 2018, 53, 1404–1412. [Google Scholar] [CrossRef] [PubMed]
  2. Gong, X.; Hong, S.; Jaffe, D.A. Ozone in China: Spatial Distribution and Leading Meteorological Factors Controlling O3 in 16 Chinese Cities. Aerosol Air Qual. Res. 2017, 18, 2287–2300. [Google Scholar] [CrossRef] [Green Version]
  3. Li, Y.; Lau, A.K.H.; Fung, J.C.H.; Zheng, J.; Liu, S. Importance of NOx control for peak ozone reduction in the Pearl River Delta region. J. Geophys. Res. Atmos. 2013, 118, 9428–9443. [Google Scholar] [CrossRef]
  4. Liu, Y.; Wang, T. Worsening urban ozone pollution in China from 2013 to 2017–Part 2: The effects of emission changes and implications for multi-pollutant control. Atmos. Chem. Phys. Discuss. 2020, 20, 6323–6337. [Google Scholar] [CrossRef]
  5. Guo, H.; Lyu, X.; Cheng, H.; Ling, Z.; Guo, H. Overview on the spatial–Temporal characteristics of the ozone formation regime in China. Environ. Sci. Process. Impacts 2019, 21, 916–929. [Google Scholar] [CrossRef]
  6. Zhang, Z.; Zhang, X.; Gong, D.; Quan, W.; Zhao, X.; Ma, Z.; Kim, S.-J. Evolution of surface O3 and PM2.5 concentrations and their relationships with meteorological conditions over the last decade in Beijing. Atmos. Environ. 2015, 108, 67–75. [Google Scholar] [CrossRef]
  7. World Health Organization Coronavirus Disease (COVID-19) Out-Break. Available online: https://www.who.int/emergencies/diseases/novel-coronavirus-2019 (accessed on 28 January 2021).
  8. Huang, X.; Ding, A.J.; Gao, J.; Zheng, B.; Zhou, D.; Qi, X.; Tang, R.; Wang, J.; Ren, C.; Nie, W.; et al. Enhanced secondary pollution offset reduction of primary emissions during COVID-19 lockdown in China. Natl. Sci. Rev. 2020, 137. [Google Scholar] [CrossRef]
  9. Bauwens, M.; Compernolle, S.; Stavrakou, T.; Müllerid, J.-F.; Van Gent, J.; Eskes, H.; Levelt, P.F.; Van Der, R.; Veefkind, J.P.; Vlietinck, J.; et al. Impact of Coronavirus Outbreak on NO 2 Pollution Assessed Using TROPOMI and OMI Observations. Geophys. Res. Lett. 2020, 47, 3. [Google Scholar] [CrossRef]
  10. Shi, X.; Brasseur, G.P. The Response in Air Quality to the Reduction of Chinese Economic Activities during the COVID-19 Outbreak. Geophys. Res. Lett. 2020, 47, 1. [Google Scholar] [CrossRef]
  11. Wang, Y.; Wen, Y.; Wang, Y.; Zhang, S.; Zhang, K.M.; Zheng, H.; Xing, J.; Wu, Y.; Hao, J. Four-Month Changes in Air Quality during and after the COVID-19 Lockdown in Six Megacities in China. Environ. Sci. Technol. Lett. 2020, 7, 802–808. [Google Scholar] [CrossRef]
  12. Zhao, Y.; Zhang, K.; Xu, X.; Shen, H.; Zhu, X.; Zhang, Y.; Hu, Y.; Shen, G. Substantial Changes in Nitrogen Dioxide and Ozone after Excluding Meteorological Impacts during the COVID-19 Outbreak in Mainland China. Environ. Sci. Technol. Lett. 2020, 7, 402–408. [Google Scholar] [CrossRef]
  13. Liu, T.; Wang, X.; Hu, J.; Wang, Q.; An, J.; Gong, K.; Sun, J.; Li, L.; Qin, M.; Li, J.; et al. Driving Forces of Changes in Air Quality during the COVID-19 Lockdown Period in the Yangtze River Delta Region, China. Environ. Sci. Technol. Lett. 2020, 7. [Google Scholar] [CrossRef]
  14. Le, T.; Wang, Y.; Liu, L.; Yang, J.; Yung, Y.L.; Li, G.; Seinfeld, J.H. Unexpected air pollution with marked emission reductions during the COVID-19 outbreak in China. Science 2020, 369, 702–706. [Google Scholar] [CrossRef] [PubMed]
  15. Zhang, Q.; Pan, Y.; He, Y.; Walters, W.W.; Ni, Q.; Liu, X.; Xu, G.; Shao, J.; Jiang, C. Substantial nitrogen oxides emission reduction from China due to COVID-19 and its impact on surface ozone and aerosol pollution. Sci. Total Environ. 2021, 753, 142238. [Google Scholar] [CrossRef] [PubMed]
  16. Chen, S.; Brune, W.H. Global sensitivity analysis of ozone production and O3–NOx–VOC limitation based on field data. Atmos. Environ. 2012, 55, 288–296. [Google Scholar] [CrossRef]
  17. Hersbach, H.; Dee, D. ERA5 Reanalysis Is in Production. ECMWF Newsl. 2016, 147, 5–6. [Google Scholar]
  18. Gao, M.; Gao, J.; Zhu, B.; Kumar, R.; Lu, X.; Song, S.; Zhang, Y.; Jia, B.; Wang, P.; Beig, G.; et al. Ozone Pollution over China and India: Seasonality and Sources. Atmos. Chem. Phys. 2020, 20, 4399–4414. [Google Scholar] [CrossRef] [Green Version]
  19. Su, W.; Liu, C.; Hu, Q.; Zhao, S.; Sun, Y.; Wang, W.; Zhu, Y.; Liu, J.; Kim, J. Primary and secondary sources of ambient formaldehyde in the Yangtze River Delta based on Ozone Mapping and Profiler Suite (OMPS) observations. Atmos. Chem. Phys. Discuss. 2019, 19, 6717–6736. [Google Scholar] [CrossRef] [Green Version]
  20. Xing, C.; Liu, C.; Wang, S.; Chan, K.L.; Gao, Y.; Huang, X.; Su, W.; Zhang, C.; Dong, Y.; Fan, G.; et al. Observations of the vertical distributions of summertime atmospheric pollutants and the corresponding ozone production in Shanghai, China. Atmos. Chem. Phys. Discuss. 2017, 17, 14275–14289. [Google Scholar] [CrossRef] [Green Version]
  21. Hönninger, G.; Von Friedeburg, C.; Platt, U. Multi axis differential optical absorption spectroscopy (MAX-DOAS). Atmos. Chem. Phys. Discuss. 2004, 4, 231–254. [Google Scholar] [CrossRef] [Green Version]
  22. Zhang, C.; Liu, C.; Hu, Q.; Cai, Z.; Su, W.; Xia, C.; Zhu, Y.; Wang, S.; Liu, J. Satellite UV-Vis Spectroscopy: Implications for Air Quality Trends and Their Driving Forces in China during 2005–2017. Light Sci. Appl. 2019, 8. [Google Scholar] [CrossRef] [PubMed] [Green Version]
  23. Su, W.; Liu, C.; Chan, K.L.; Hu, Q.; Liu, H.; Ji, X.; Zhu, Y.; Liu, T.; Zhang, C.; Chen, Y.; et al. An improved TROPOMI tropospheric HCHO retrieval over China. Atmos. Meas. Tech. 2020, 13, 6271–6292. [Google Scholar] [CrossRef]
  24. Zhang, C.; Liu, C.; Chan, K.L.; Hu, Q.; Liu, H.; Li, B.; Xing, C.; Tan, W.; Zhou, H.; Si, F.; et al. First Observation of Tropospheric Nitrogen Dioxide from the Environmental Trace Gases Monitoring Instrument Onboard the GaoFen-5 Satellite. Light Sci. Appl. 2020. [Google Scholar] [CrossRef] [PubMed] [Green Version]
  25. Fu, T.-M.; Jacob, D.J.; Palmer, P.I.; Chance, K.; Wang, Y.X.; Barletta, B.; Blake, D.R.; Stanton, J.C.; Pilling, M.J. Space–Based formaldehyde measurements as constraints on volatile organic compound emissions in east and south Asia and implications for ozone. J. Geophys. Res. Space Phys. 2007, 112, 1–15. [Google Scholar] [CrossRef] [Green Version]
  26. Tibshirani, R. Regression Shrinkage and Selection Via the Lasso. J. R. Stat. Soc. Ser. B Methodol. 1996, 58, 267–288. [Google Scholar] [CrossRef]
  27. Fike, N.; Kehoe, B.; Miller, G. Supporting software nearing the end of its life–Cycle. IEEE Global Telecommun. Conf. Exhib. Commun. Inf. Age 2003, 32, 407–499. [Google Scholar] [CrossRef]
  28. Wang, P.; Chen, K.; Zhu, S.; Wang, P.; Zhang, H. Severe air pollution events not avoided by reduced anthropogenic activities during COVID-19 outbreak. Resour. Conserv. Recycl. 2020, 158, 104814. [Google Scholar] [CrossRef]
  29. Wang, C.; Huang, X.-F.; Zhu, Q.; Cao, L.-M.; Zhang, B.; He, L.-Y. Differentiating local and regional sources of Chinese urban air pollution based on the effect of the Spring Festival. Atmos. Chem. Phys. Discuss. 2017, 17, 9103–9114. [Google Scholar] [CrossRef] [Green Version]
  30. Huang, K.; Zhuang, G.; Lin, Y.; Wang, Q.; Fu, J.S.; Zhang, R.; Li, J.; Deng, C.; Fu, Q. Impact of anthropogenic emission on air quality over a megacity–Revealed from an intensive atmospheric campaign during the Chinese Spring Festival. Atmos. Chem. Phys. Discuss. 2012, 12, 11631–11645. [Google Scholar] [CrossRef] [Green Version]
  31. Lu, X.; Zhang, L.; Chen, Y.; Zhou, M.; Zheng, B.; Li, K.; Liu, Y.; Lin, J.; Fu, T.-M.; Zhang, Q. Exploring 2016–2017 surface ozone pollution over China: Source contributions and meteorological influences. Atmos. Chem. Phys. Discuss. 2019, 19, 8339–8361. [Google Scholar] [CrossRef] [Green Version]
  32. Li, K.; Jacob, D.J.; Liao, H.; Zhu, J.; Shah, V.; Shen, L.; Bates, K.H.; Zhang, Q.; Zhai, S. A two-pollutant strategy for improving ozone and particulate air quality in China. Nat. Geosci. 2019, 12, 906–910. [Google Scholar] [CrossRef]
  33. Hu, B.; Liu, T.; Yang, Y.; Hong, Y.; Li, M.; Xu, L.; Wang, H.; Chen, N.; Wu, X.; Chen, J. Characteristics and Formation Mechanism of Surface Ozone in a Coastal Island of Southeast China: Influence of Sea-land Breezes and Regional Transport. Aerosol Air Qual. Res. 2019, 19, 1734–1748. [Google Scholar] [CrossRef]
  34. Wang, J.; Yang, Y.; Zhang, Y.; Niu, T.; Jiang, X.; Wang, Y.; Che, H. Influence of meteorological conditions on explosive increase in O3 concentration in troposphere. Sci. Total Environ. 2019, 652, 1228–1241. [Google Scholar] [CrossRef] [PubMed]
  35. Wang, T.; Xue, L.; Brimblecombe, P.; Lam, Y.F.; Likun, X.; Zhang, L. Ozone pollution in China: A review of concentrations, meteorological influences, chemical precursors, and effects. Sci. Total Environ. 2017, 575, 1582–1596. [Google Scholar] [CrossRef]
  36. Zhao, S.; Yin, D.; Yu, Y.; Kang, S.; Qin, D.; Dong, L. PM2.5 and O3 pollution during 2015–2019 over 367 Chinese cities: Spatiotemporal variations, meteorological and topographical impacts. Environ. Pollut. 2020, 264, 114694. [Google Scholar] [CrossRef]
  37. Chu, B.; Ma, Q.; Liu, J.; Ma, J.; Zhang, P.; Chen, T.; Feng, Q.; Wang, C.; Yang, N.; Ma, H.; et al. Air Pollutant Correlations in China: Secondary Air Pollutant Responses to NOx and SO2 Control. Environ. Sci. Technol. Lett. 2020, 7, 695–700. [Google Scholar] [CrossRef]
  38. Wang, P.; Guo, H.; Hu, J.; Kota, S.H.; Ying, Q.; Zhang, H. Responses of PM2.5 and O3 concentrations to changes of meteorology and emissions in China. Sci. Total Environ. 2019, 662, 297–306. [Google Scholar] [CrossRef]
  39. Reynolds, S.D.; Blanchard, C.L.; Ziman, S.D. Understanding the effectiveness of precursor reductions in lowering 8 hr ozone concentrations. J. Air Waste Manag. Assoc. 2003, 53, 195–205. [Google Scholar] [CrossRef] [Green Version]
  40. Jin, X.; Fiore, A.M.; Murray, L.T.; Valin, L.C.; Lamsal, L.N.; Duncan, B.; Boersma, K.F.; De Smedt, I.; Abad, G.G.; Chance, K.; et al. Evaluating a Space-Based Indicator of Surface Ozone-NOx-VOC Sensitivity Over Midlatitude Source Regions and Application to Decadal Trends. J. Geophys. Res. Atmos. 2017, 122, 10–439. [Google Scholar] [CrossRef]
  41. Gao, M.; Saide, P.E.; Xin, J.; Wang, Y.; Liu, Z.; Wang, Y.; Wang, Z.; Pagowski, M.; Guttikunda, S.K.; Carmichael, G.R. Estimates of Health Impacts and Radiative Forcing in Winter Haze in Eastern China through Constraints of Surface PM2.5 Predictions. Environ. Sci. Technol. 2017, 51, 2178–2185. [Google Scholar] [CrossRef]
Figure 1. Scatter plot of Ozone Mapping and Profiling Suite (OMPS) observed tropospheric formaldehyde (HCHO) vertical column concentrations (VCDs) with Multi-Axis Differential Optical Absorption Spectroscopy (MAX-DOAS) measured surface concentrations of HCHO at (a) Beijing, (b) Qingdao and (c) Shanghai sites (daily data from five weeks before 23 January 2020 to five weeks after 23 January 2020).
Atmosphere 12 00184 g001
Figure 2. The spatial distribution of percentage changes of O3 during lockdown periods relative to pre-lockdown periods in China (%, (af) are for years from 2015 to 2020).
Atmosphere 12 00184 g002
Figure 3. Lasso regression selected driving factors for changes of O3 during 2015–2019 and 2020 for (a,b) BTH, (c,d) YRD and (e,f) PRD regions. SWR: shortwave radiation flux; RH: relative humidity.
Atmosphere 12 00184 g003
Figure 4. The ratio of HCHO and NO2 concentrations observed by TROPOspheric Monitoring Instrument (TROPOMI) during (a) pre-lockdown and (b) lockdown periods in 2020 (HCHO/NO2 < 0.9 indicates NOx-saturated; HCHO/NO2 > 1.6 indicates NOx-limited; 0.9 < HCHO/NO2 < 1.6 indicates transitional regime).
Atmosphere 12 00184 g004
Figure 5. Scatter plots of standardized values of percentage changes between pre-lockdown and lockdown periods of O3 and (a) temperature (T), relative humidity (RH) and mean surface net shortwave radiation flux (SWR), and (b) HCHO and NO2 from monitoring stations in PRD in 2020.
Atmosphere 12 00184 g005
Table 1. Mean O3 concentrations (ppbv) during pre-lockdown and lockdown periods and the percentage changes over 2015–2020 in China.
China201520162017201820192015–20192020
pre-lockdown23.2822.5625.5427.5921.6924.1323.93
lockdown29.3133.0739.1436.4232.9634.1839.31
percentage25.9046.5953.2532.0051.9641.6364.27
significance******************-
BTH
pre-lockdown17.8216.2117.6922.4818.9218.6219.30
lockdown25.8430.3433.5335.8831.7531.4736.71
percentage45.0187.1789.5459.6167.8169.9990.21
significance***--*********-
YRD
pre-lockdown25.2426.3628.0727.0721.4225.6324.03
lockdown32.2337.0642.7436.9935.0536.8141.28
percentage27.6940.5952.2636.6563.6343.6271.79
significance****************-
PRD
pre-lockdown38.4523.9237.7844.7523.2533.6339.09
lockdown40.7227.7149.7938.0736.8038.6238.66
percentage5.9015.8431.79−14.9358.2814.83−1.10
significance****************-
*** indicates that the differences between previous years and 2020 are significant at 0.001 level, * indicates that the previous years and 2020 are significant at 0.1 levels, and - means no significant difference (p > 0.1). BTH: Beijing–Tianjin–Hebei; YRD: Yangtze River Delta; PRD: Pearl River Delta.
Publisher’s Note: MDPI stays neutral with regard to jurisdictional claims in published maps and institutional affiliations.

