Article

Understanding Spatial Variability of NO2 in Urban Areas Using Spatial Modelling and Data Fusion Approaches


1
Department of Civil and Structural Engineering, The University of Sheffield, Sheffield S1 3JD, UK
2
Department of Automatic Control and Systems Engineering, The University of Sheffield, Sheffield S1 3JD, UK
*
Author to whom correspondence should be addressed.
Atmosphere 2021, 12(2), 179; https://doi.org/10.3390/atmos12020179
Submission received: 3 January 2021 / Revised: 23 January 2021 / Accepted: 25 January 2021 / Published: 29 January 2021
(This article belongs to the Special Issue Air Quality in the UK)

Abstract

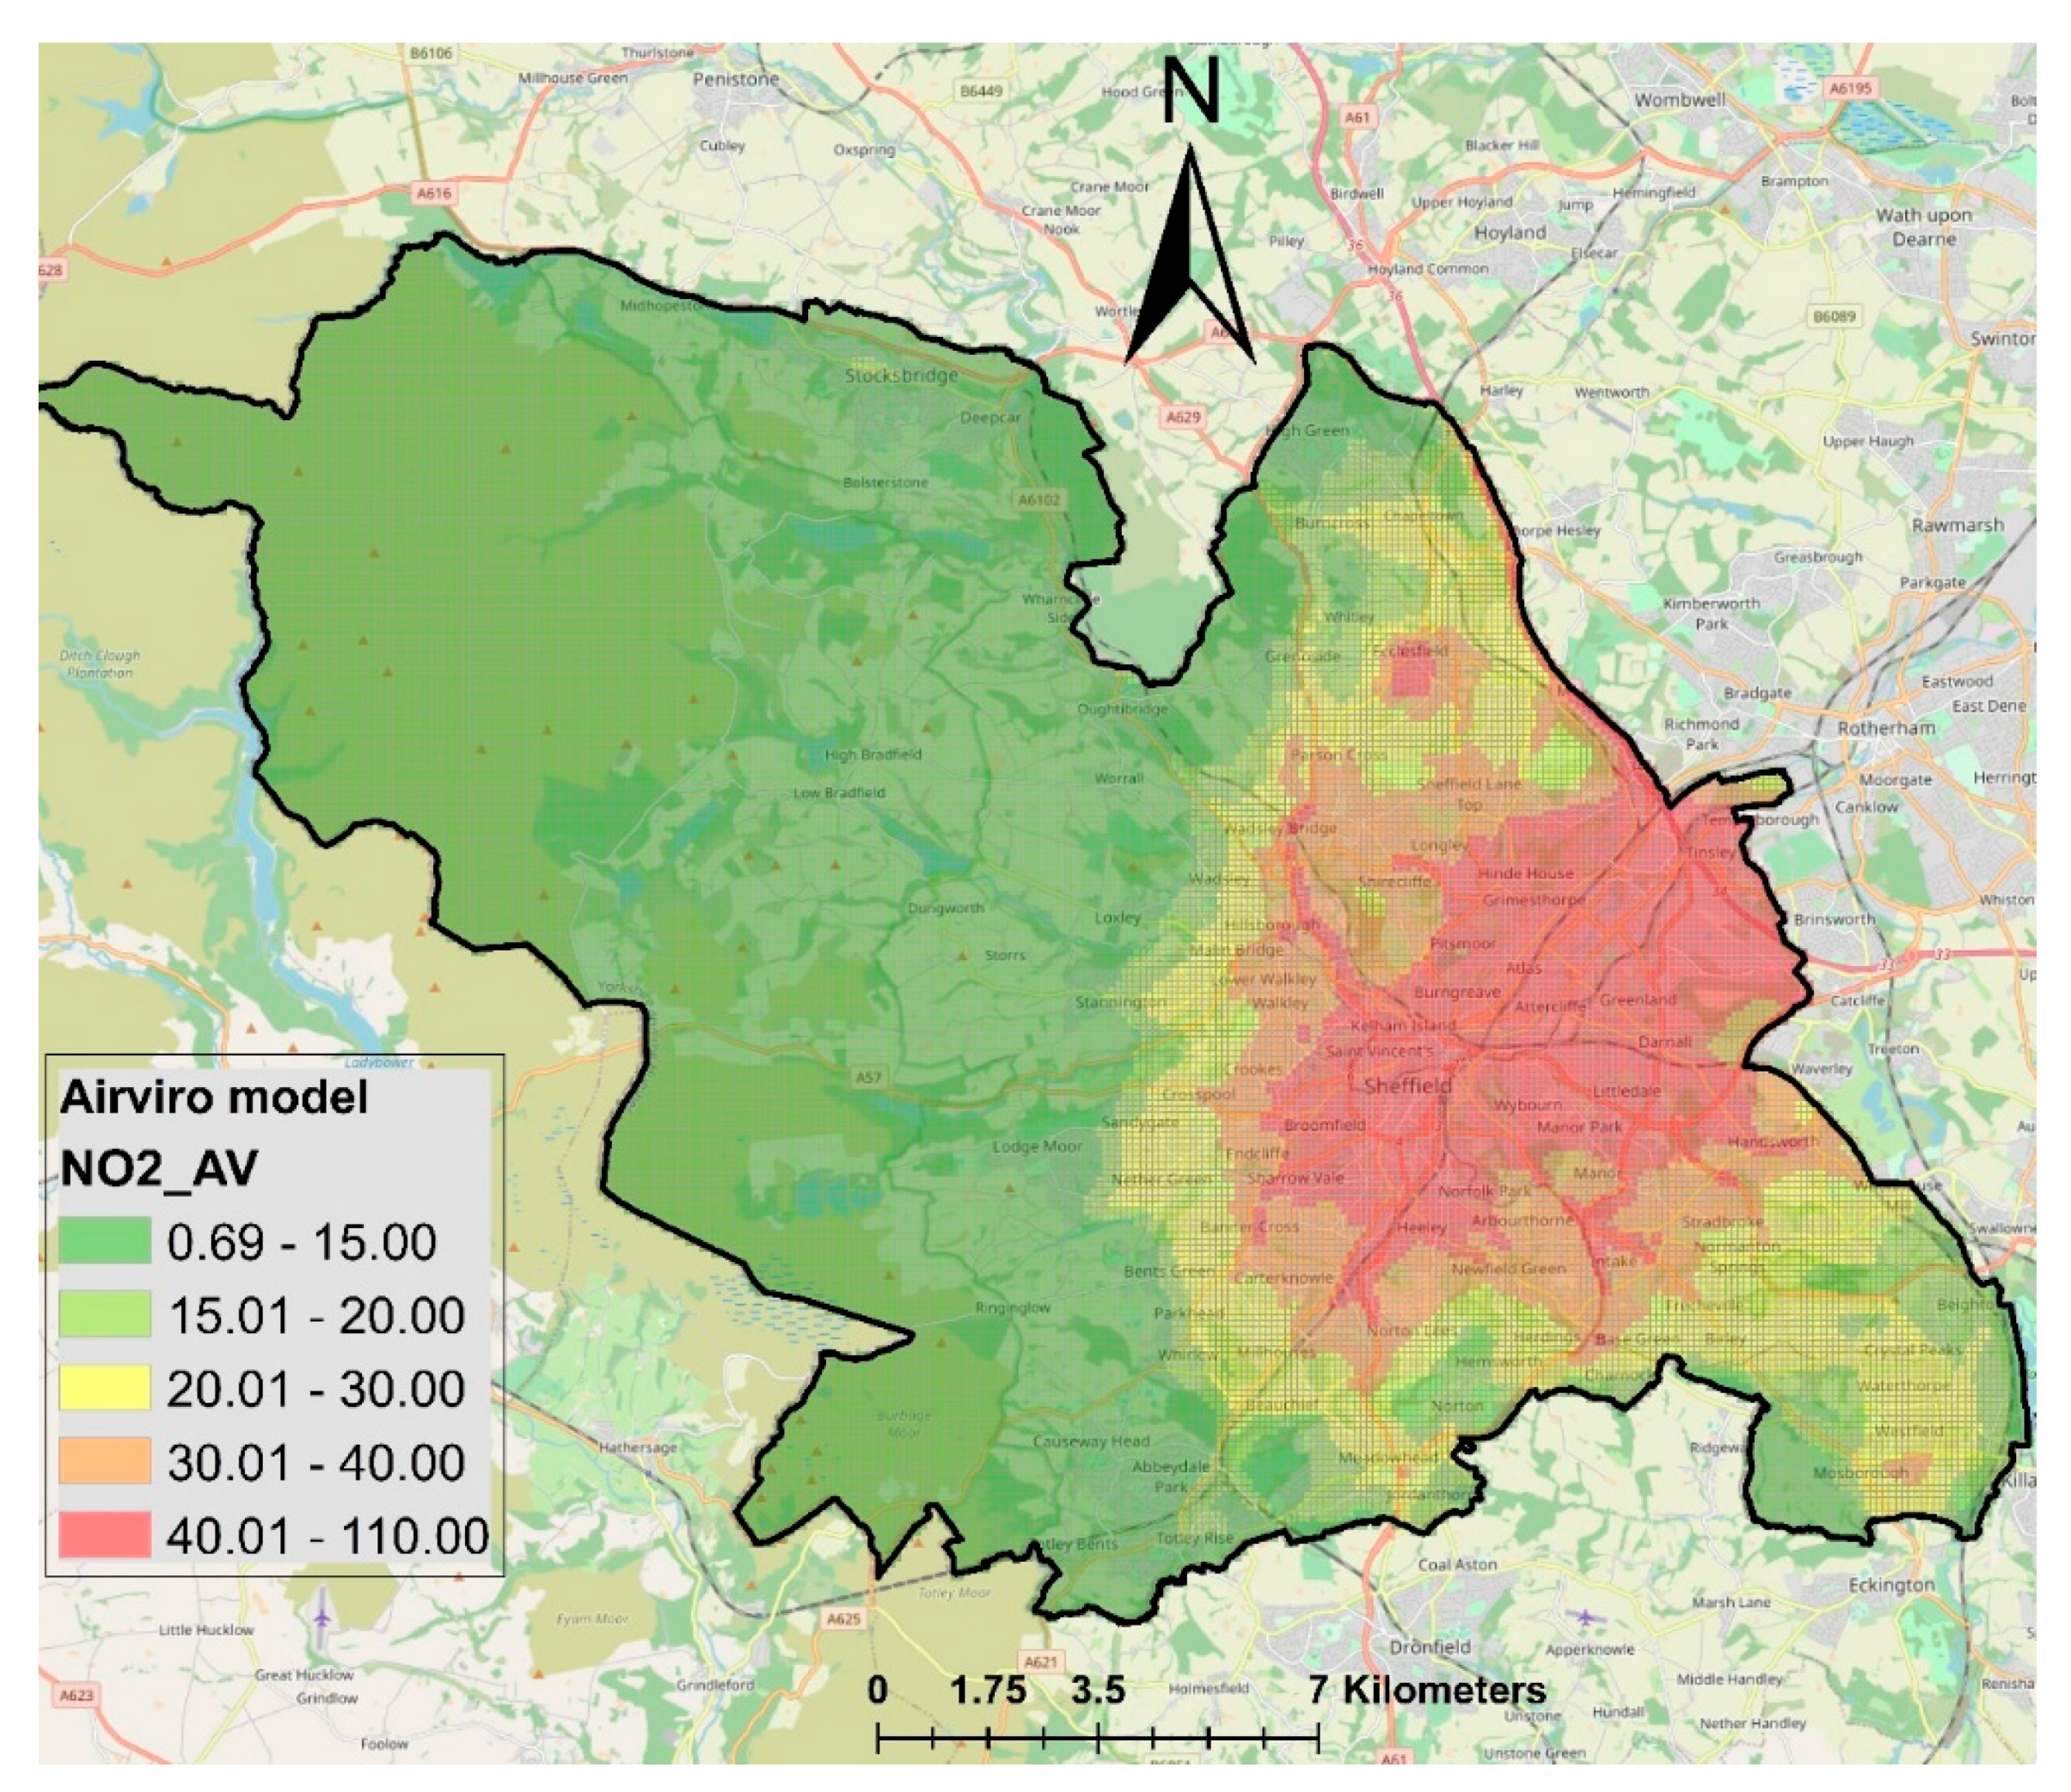
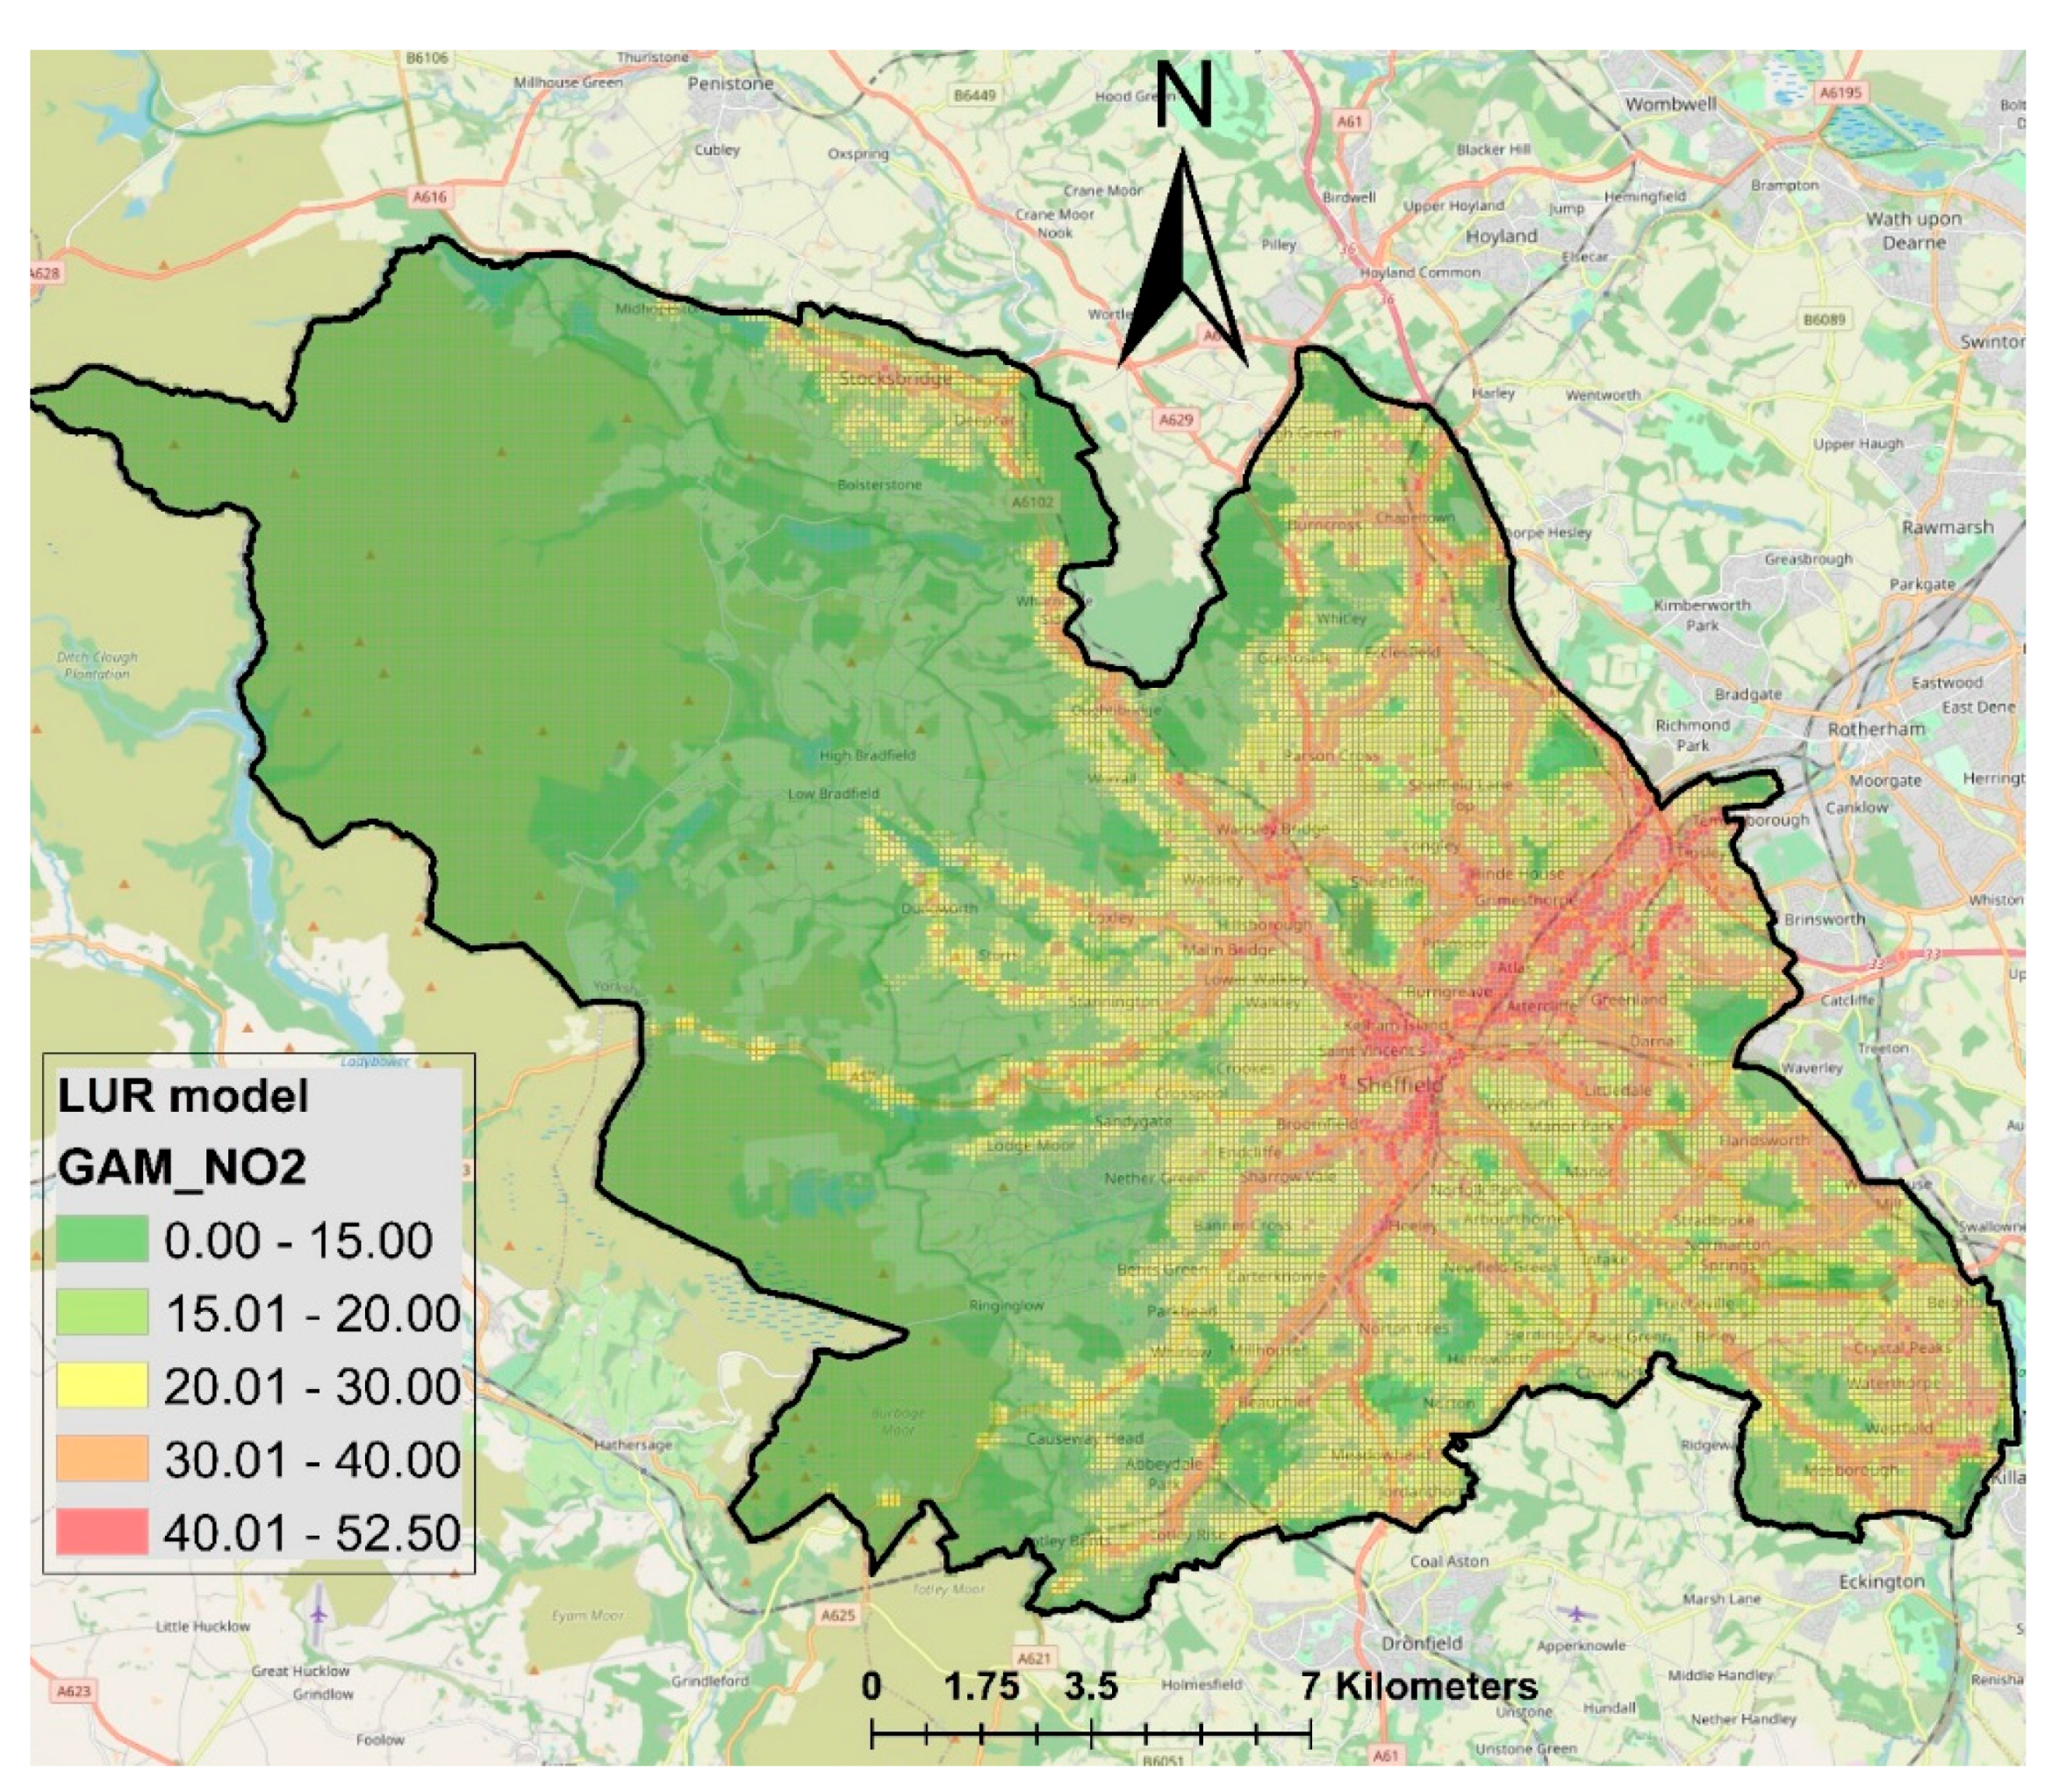
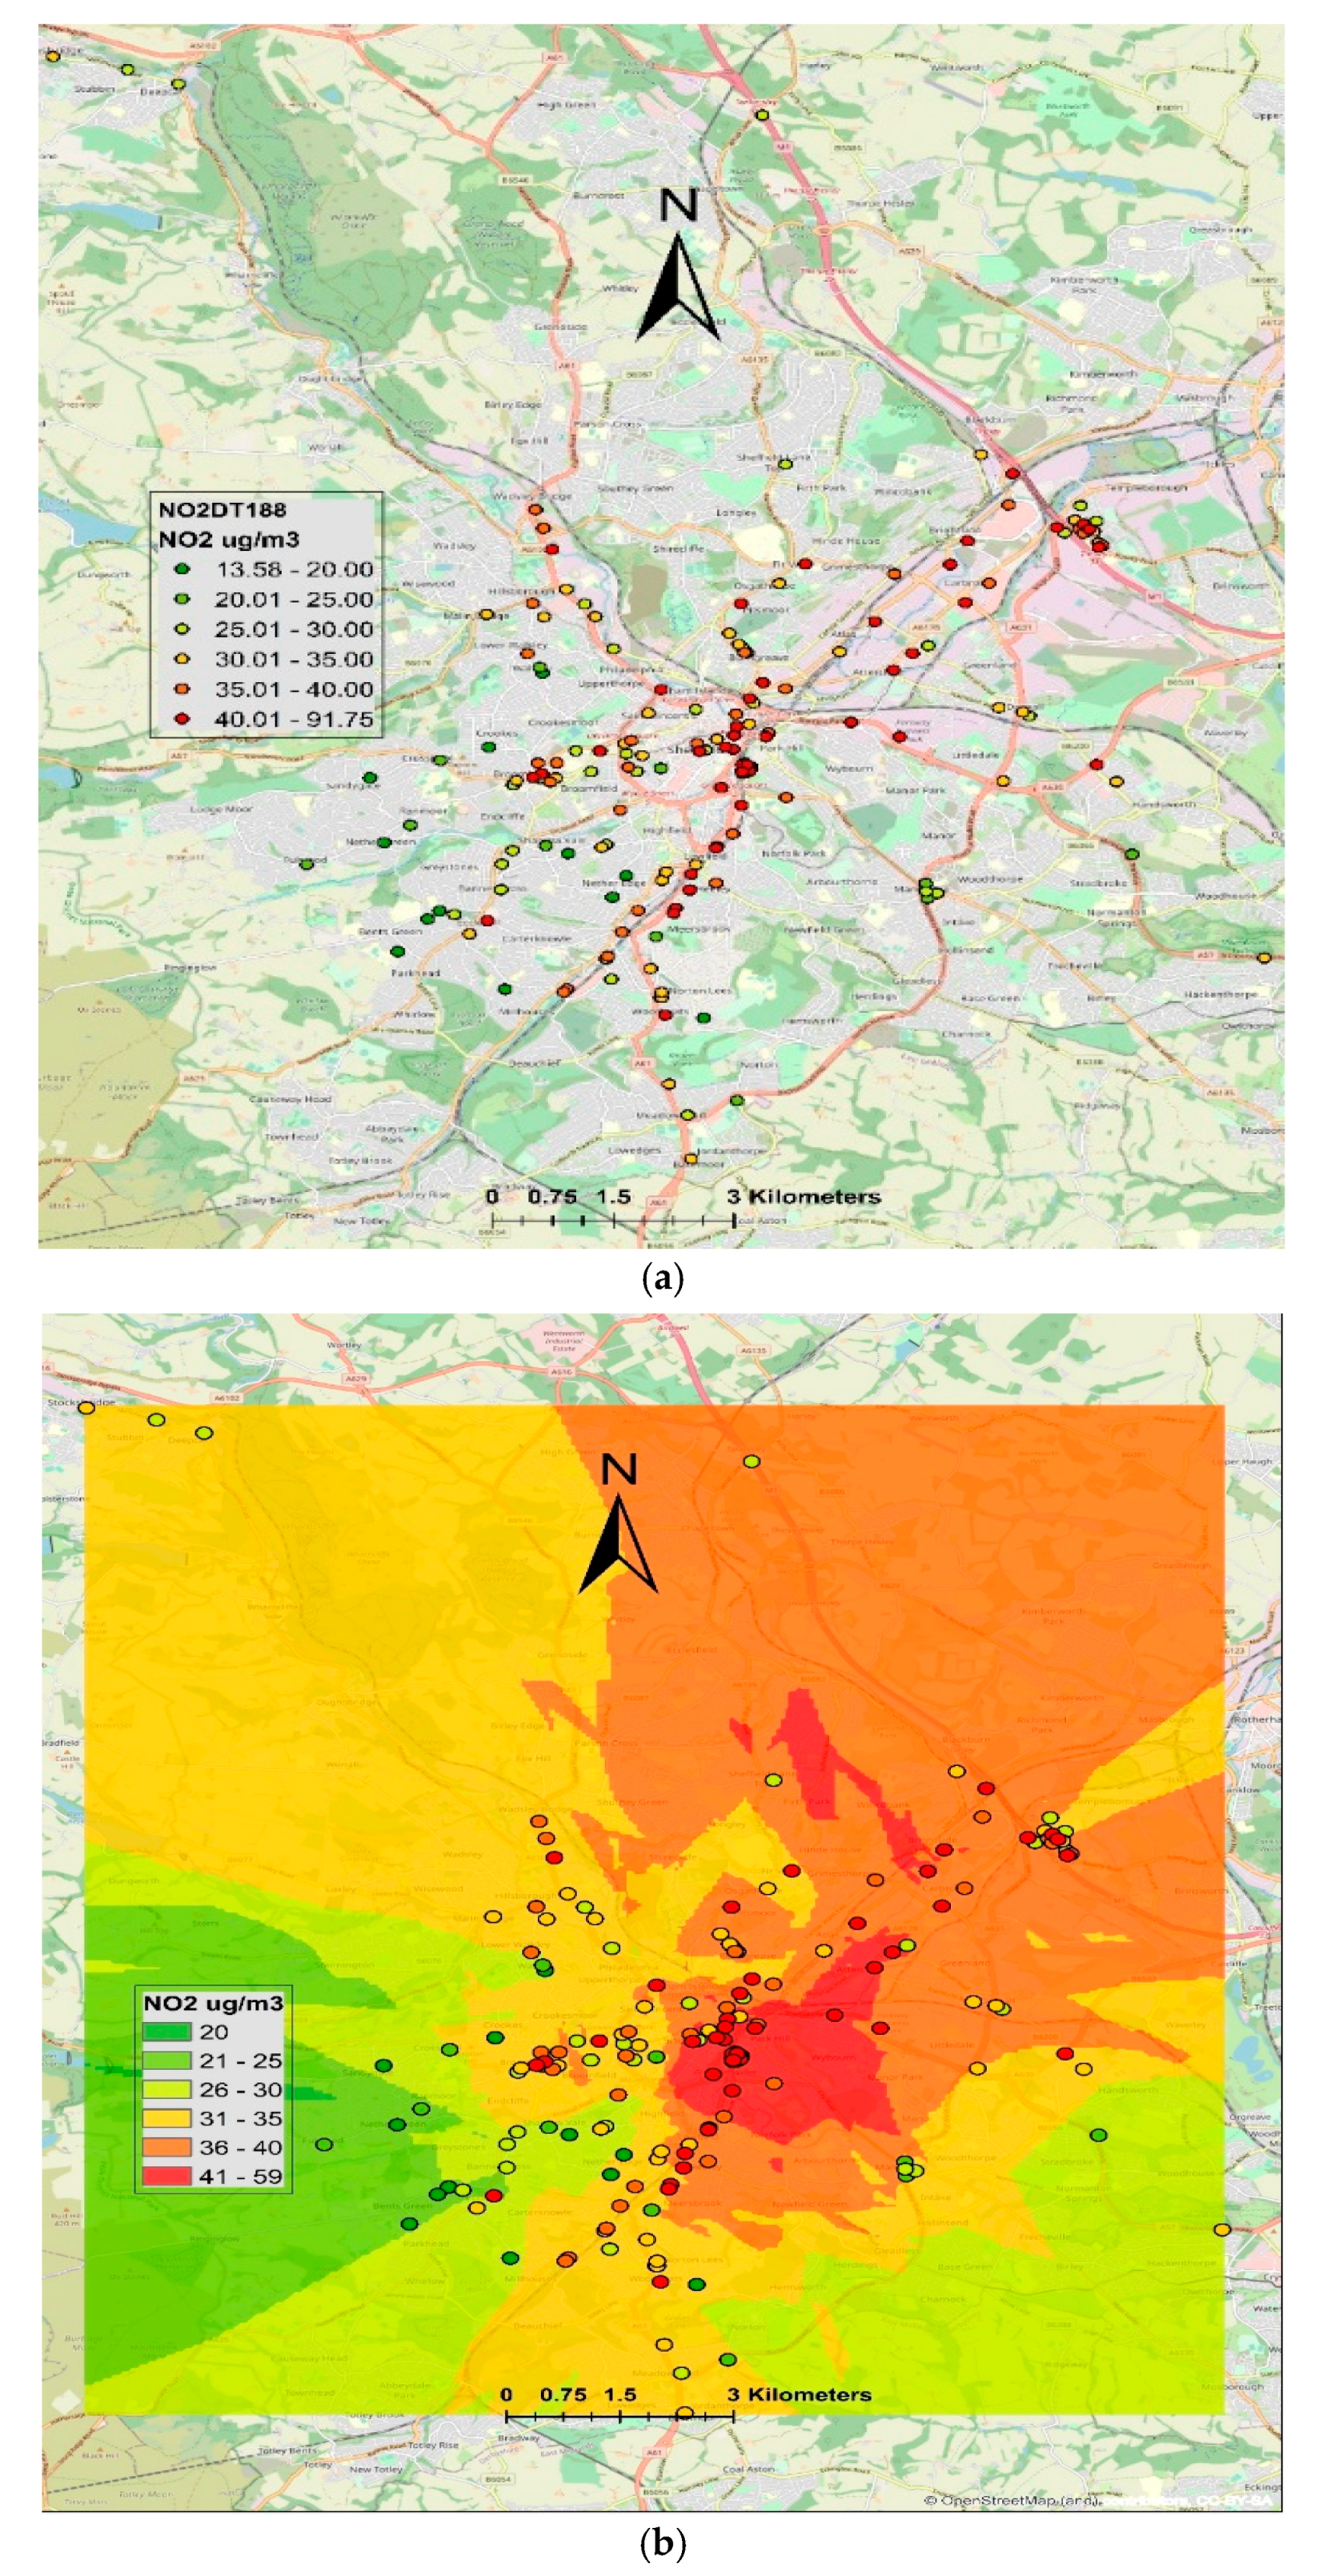
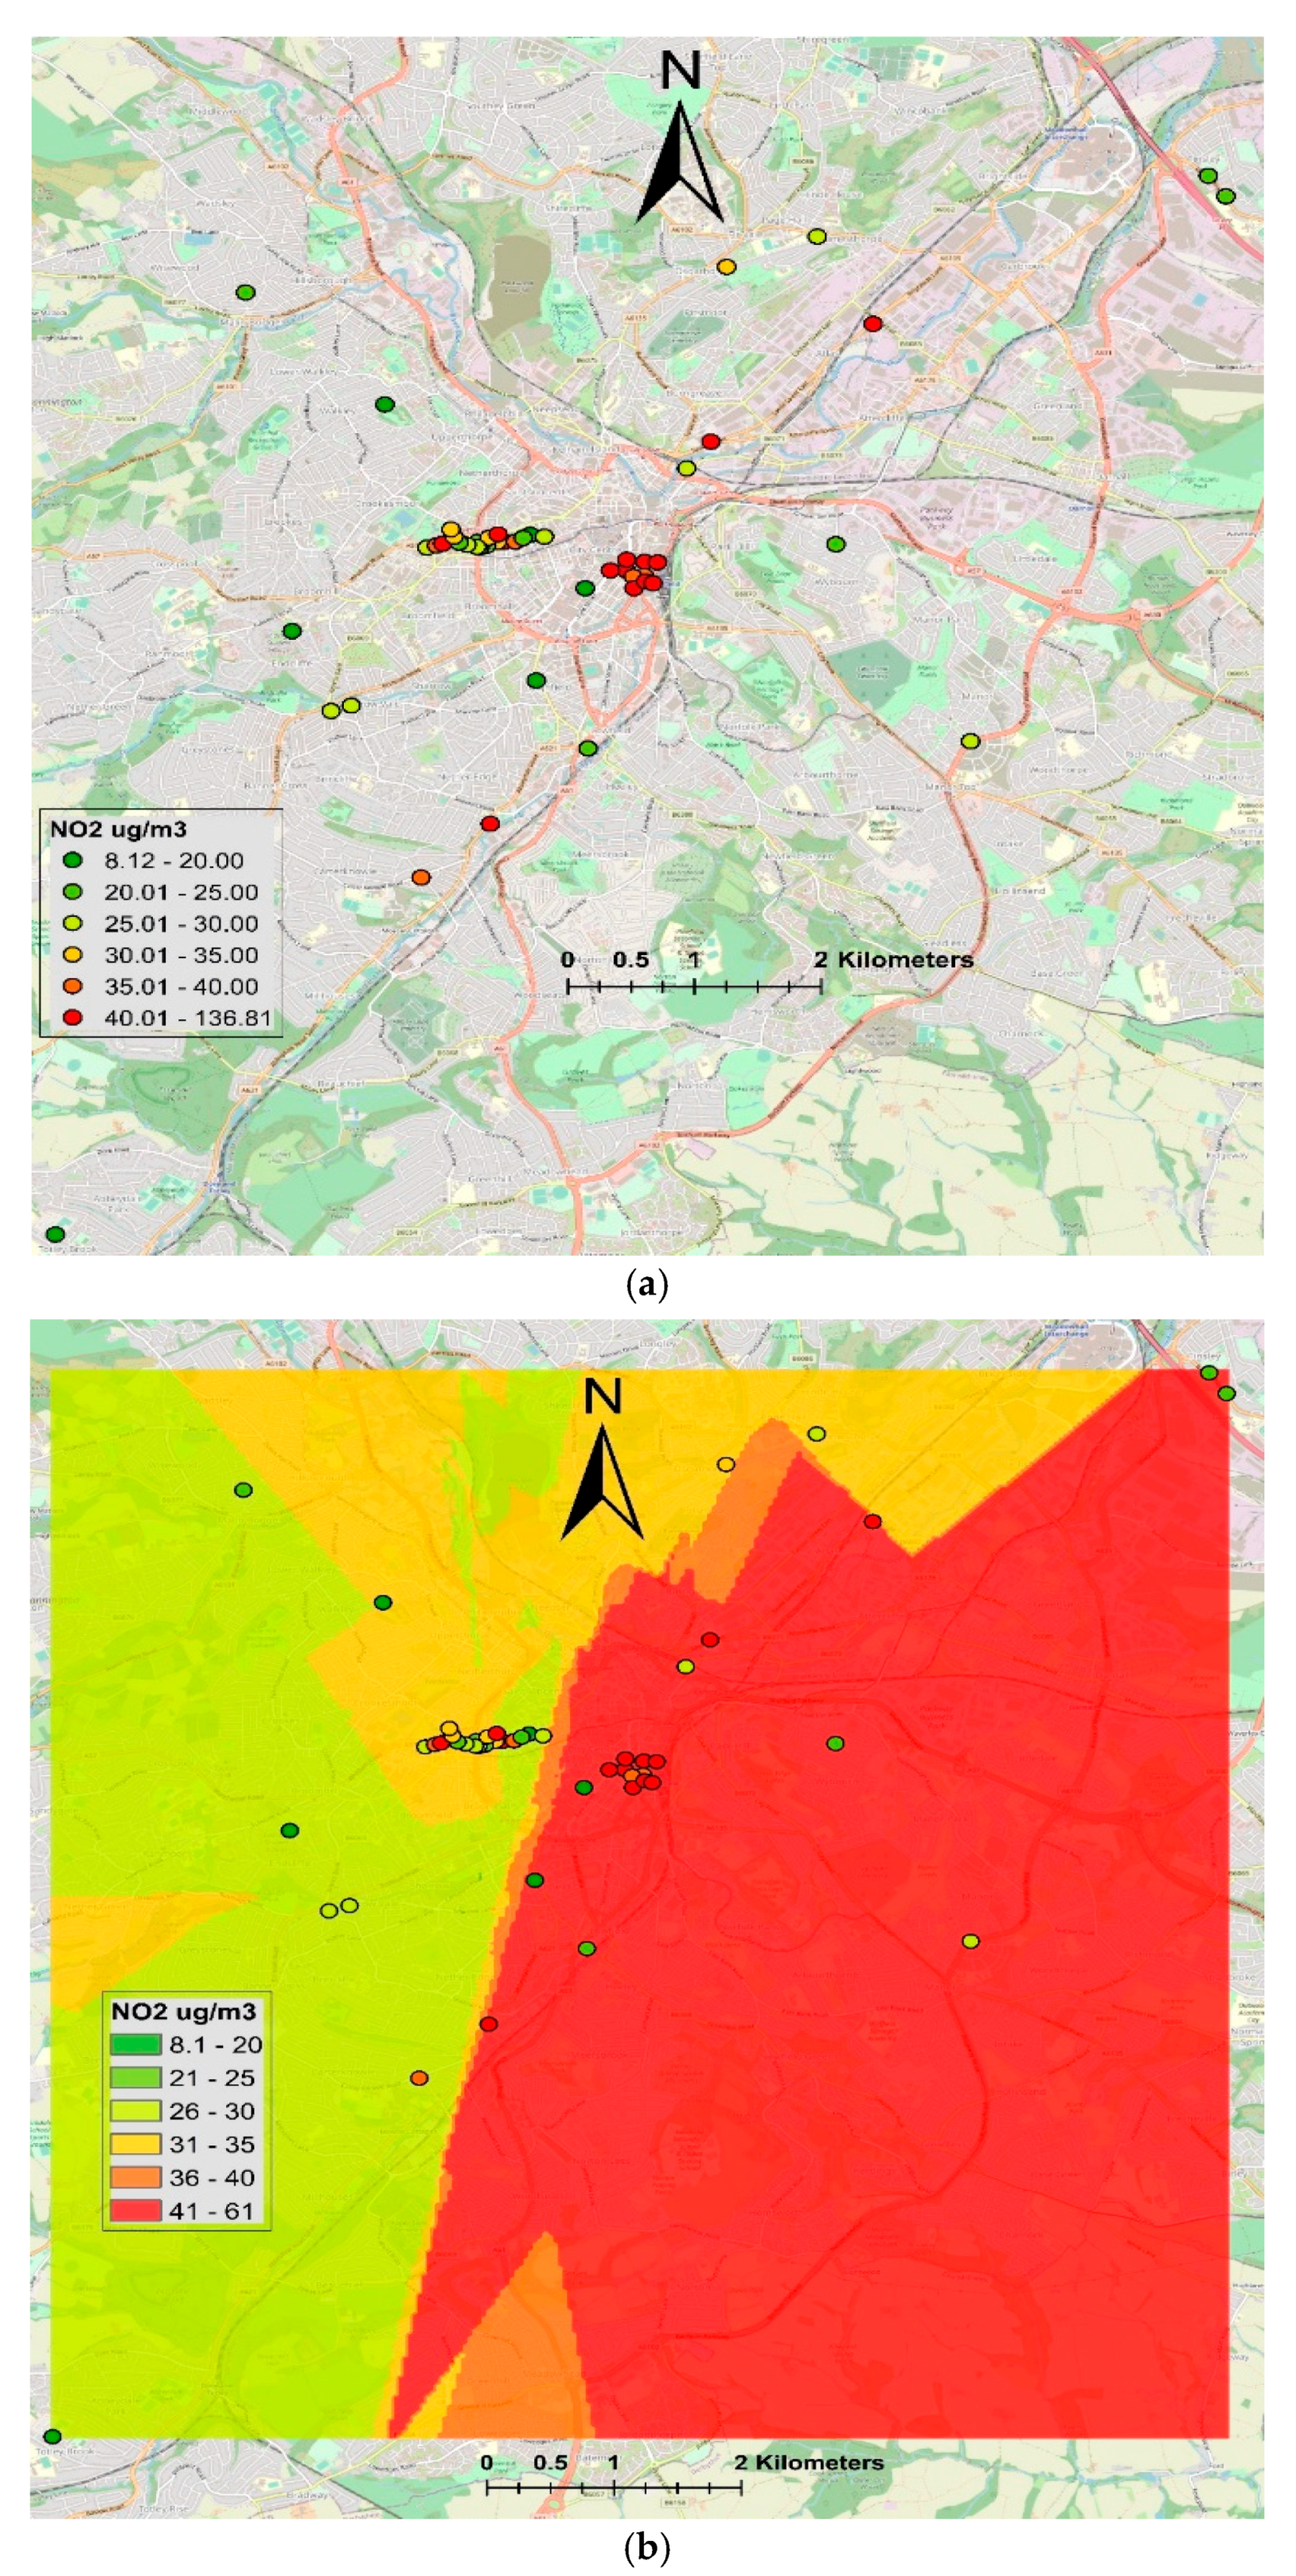
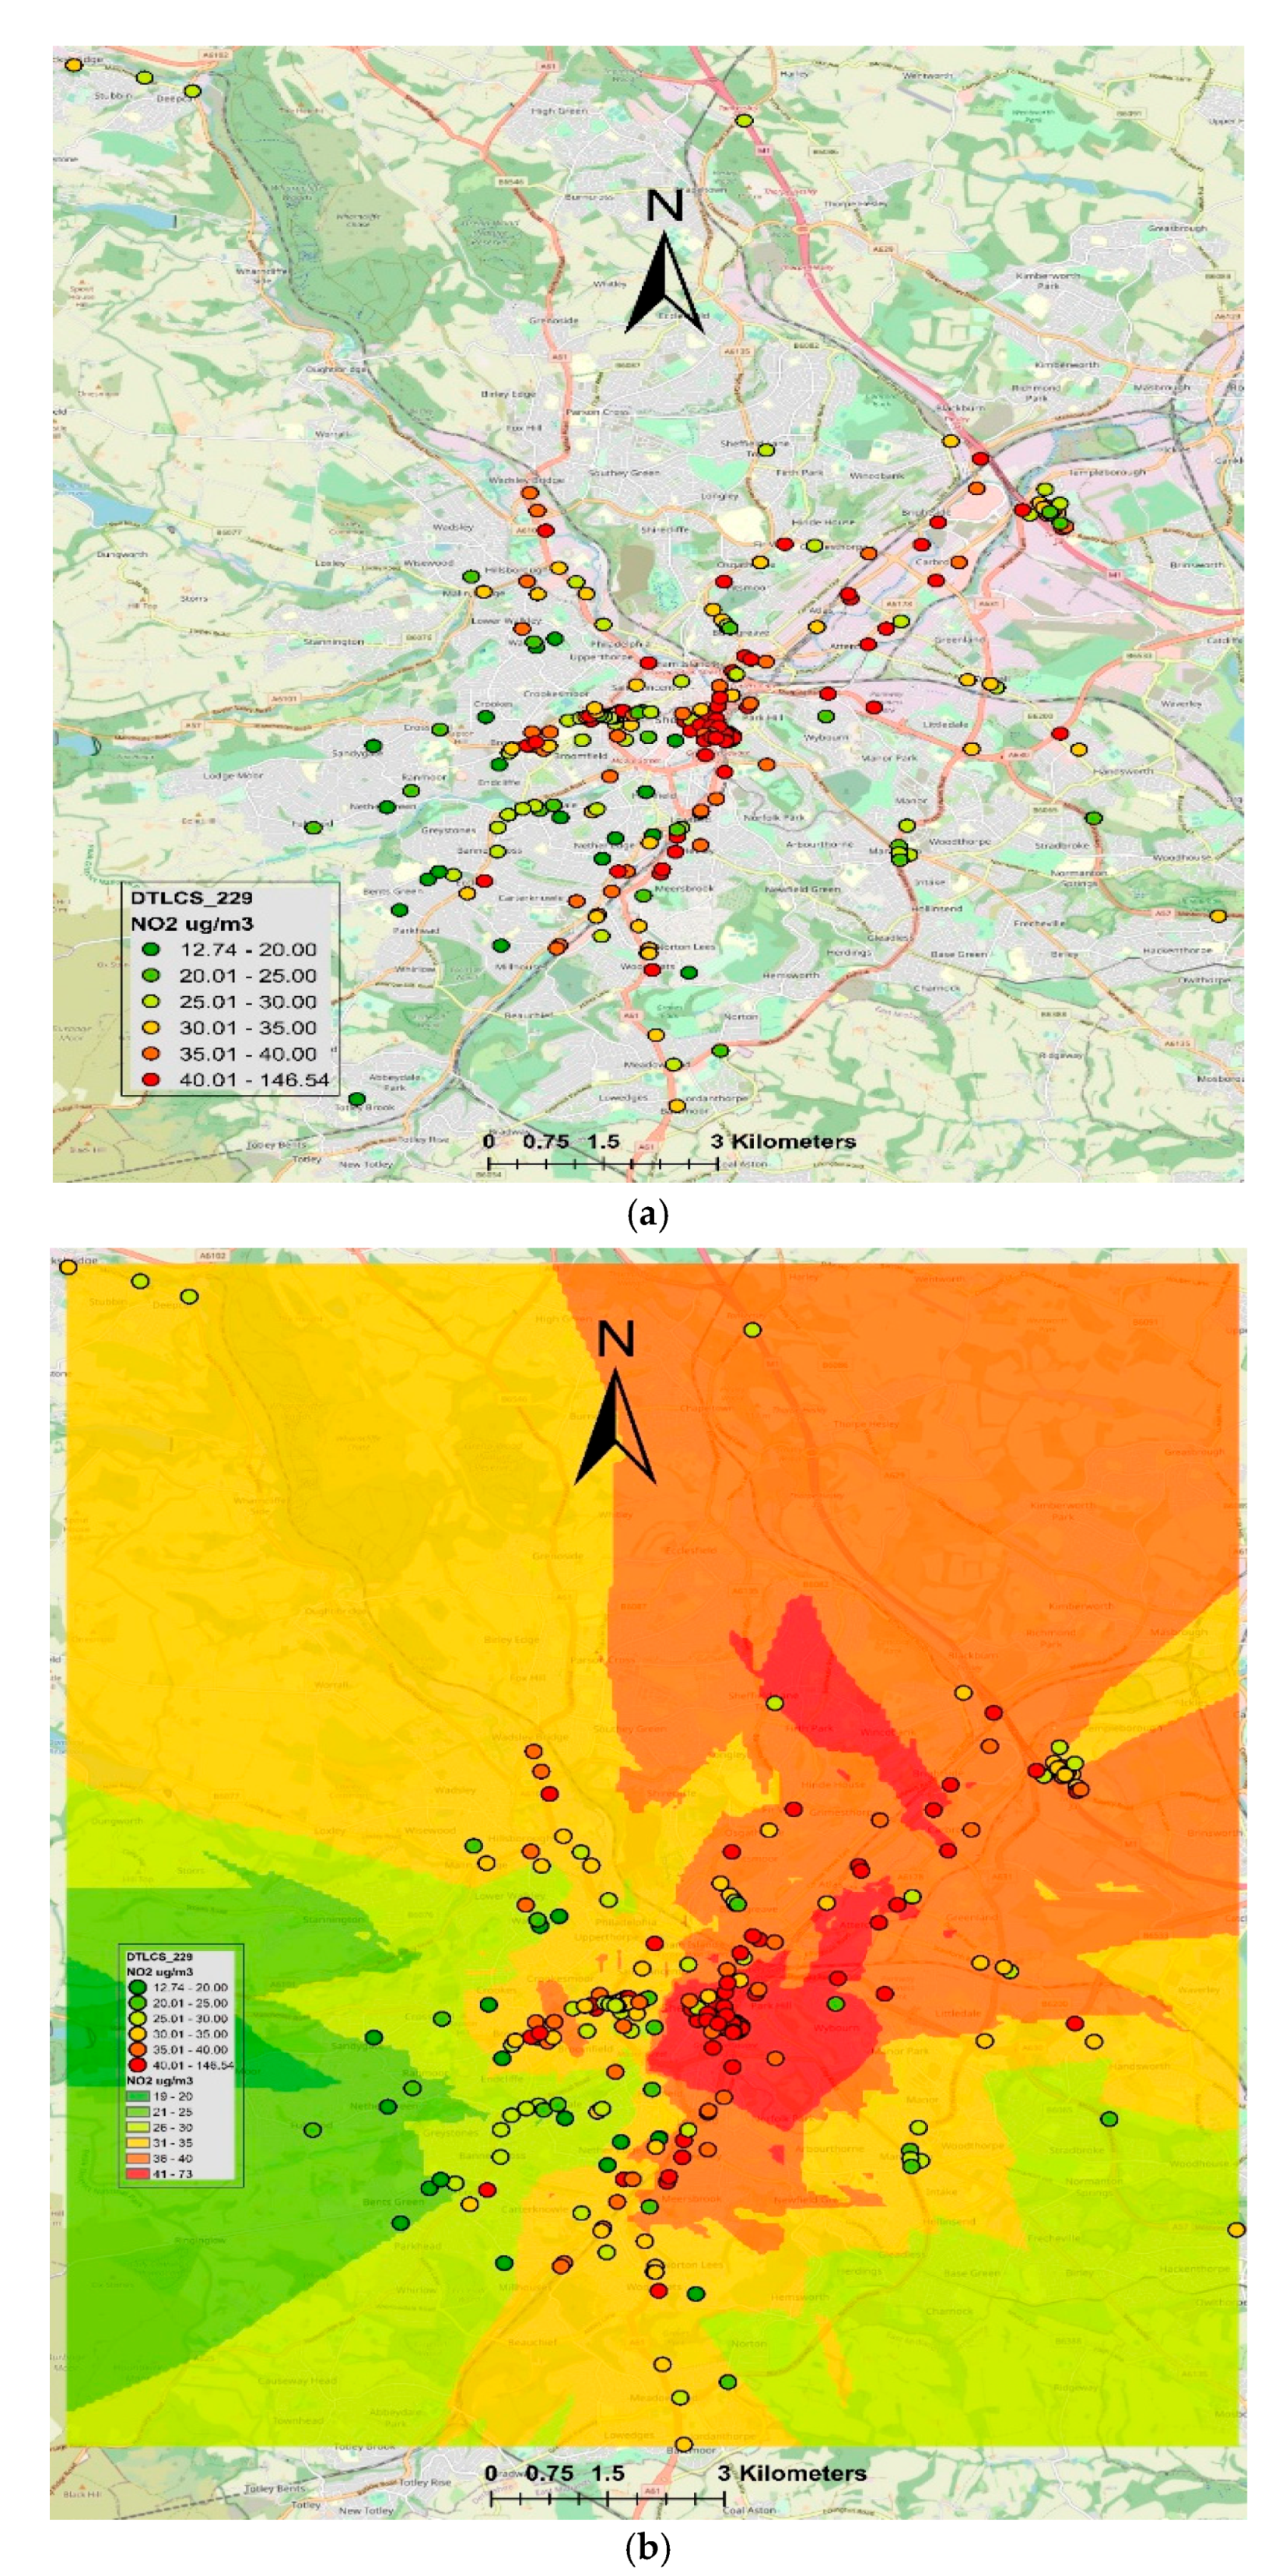
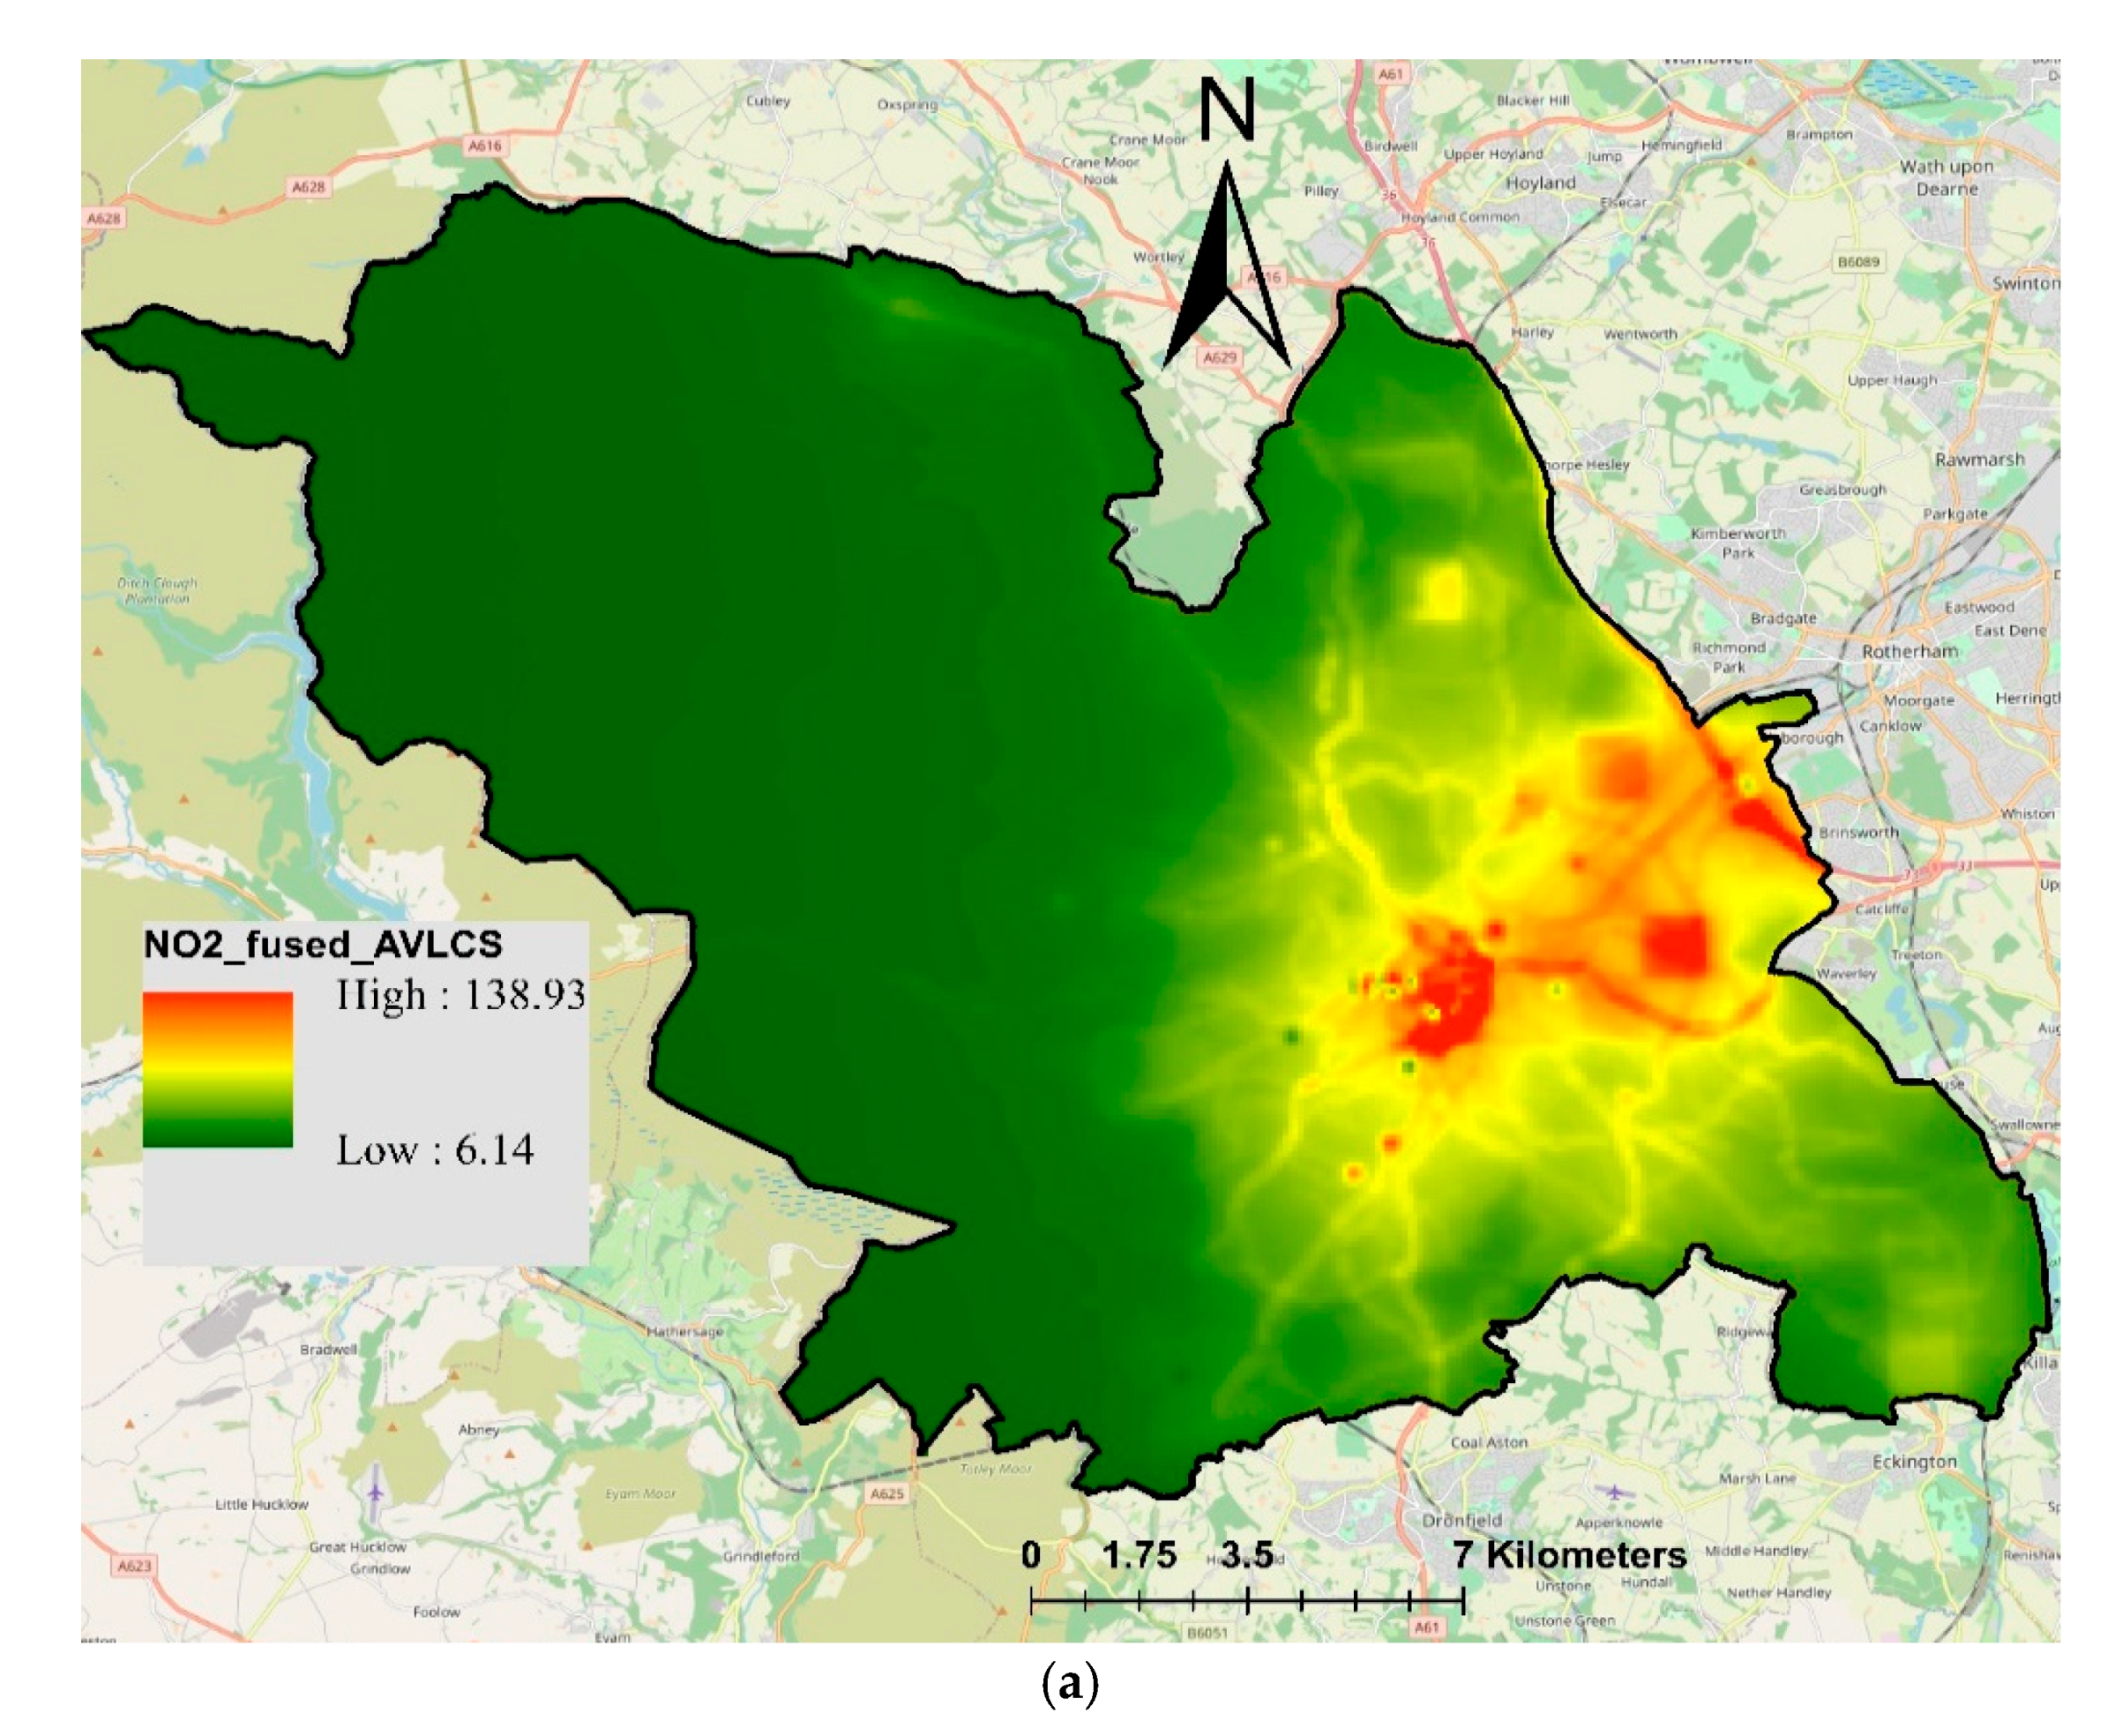
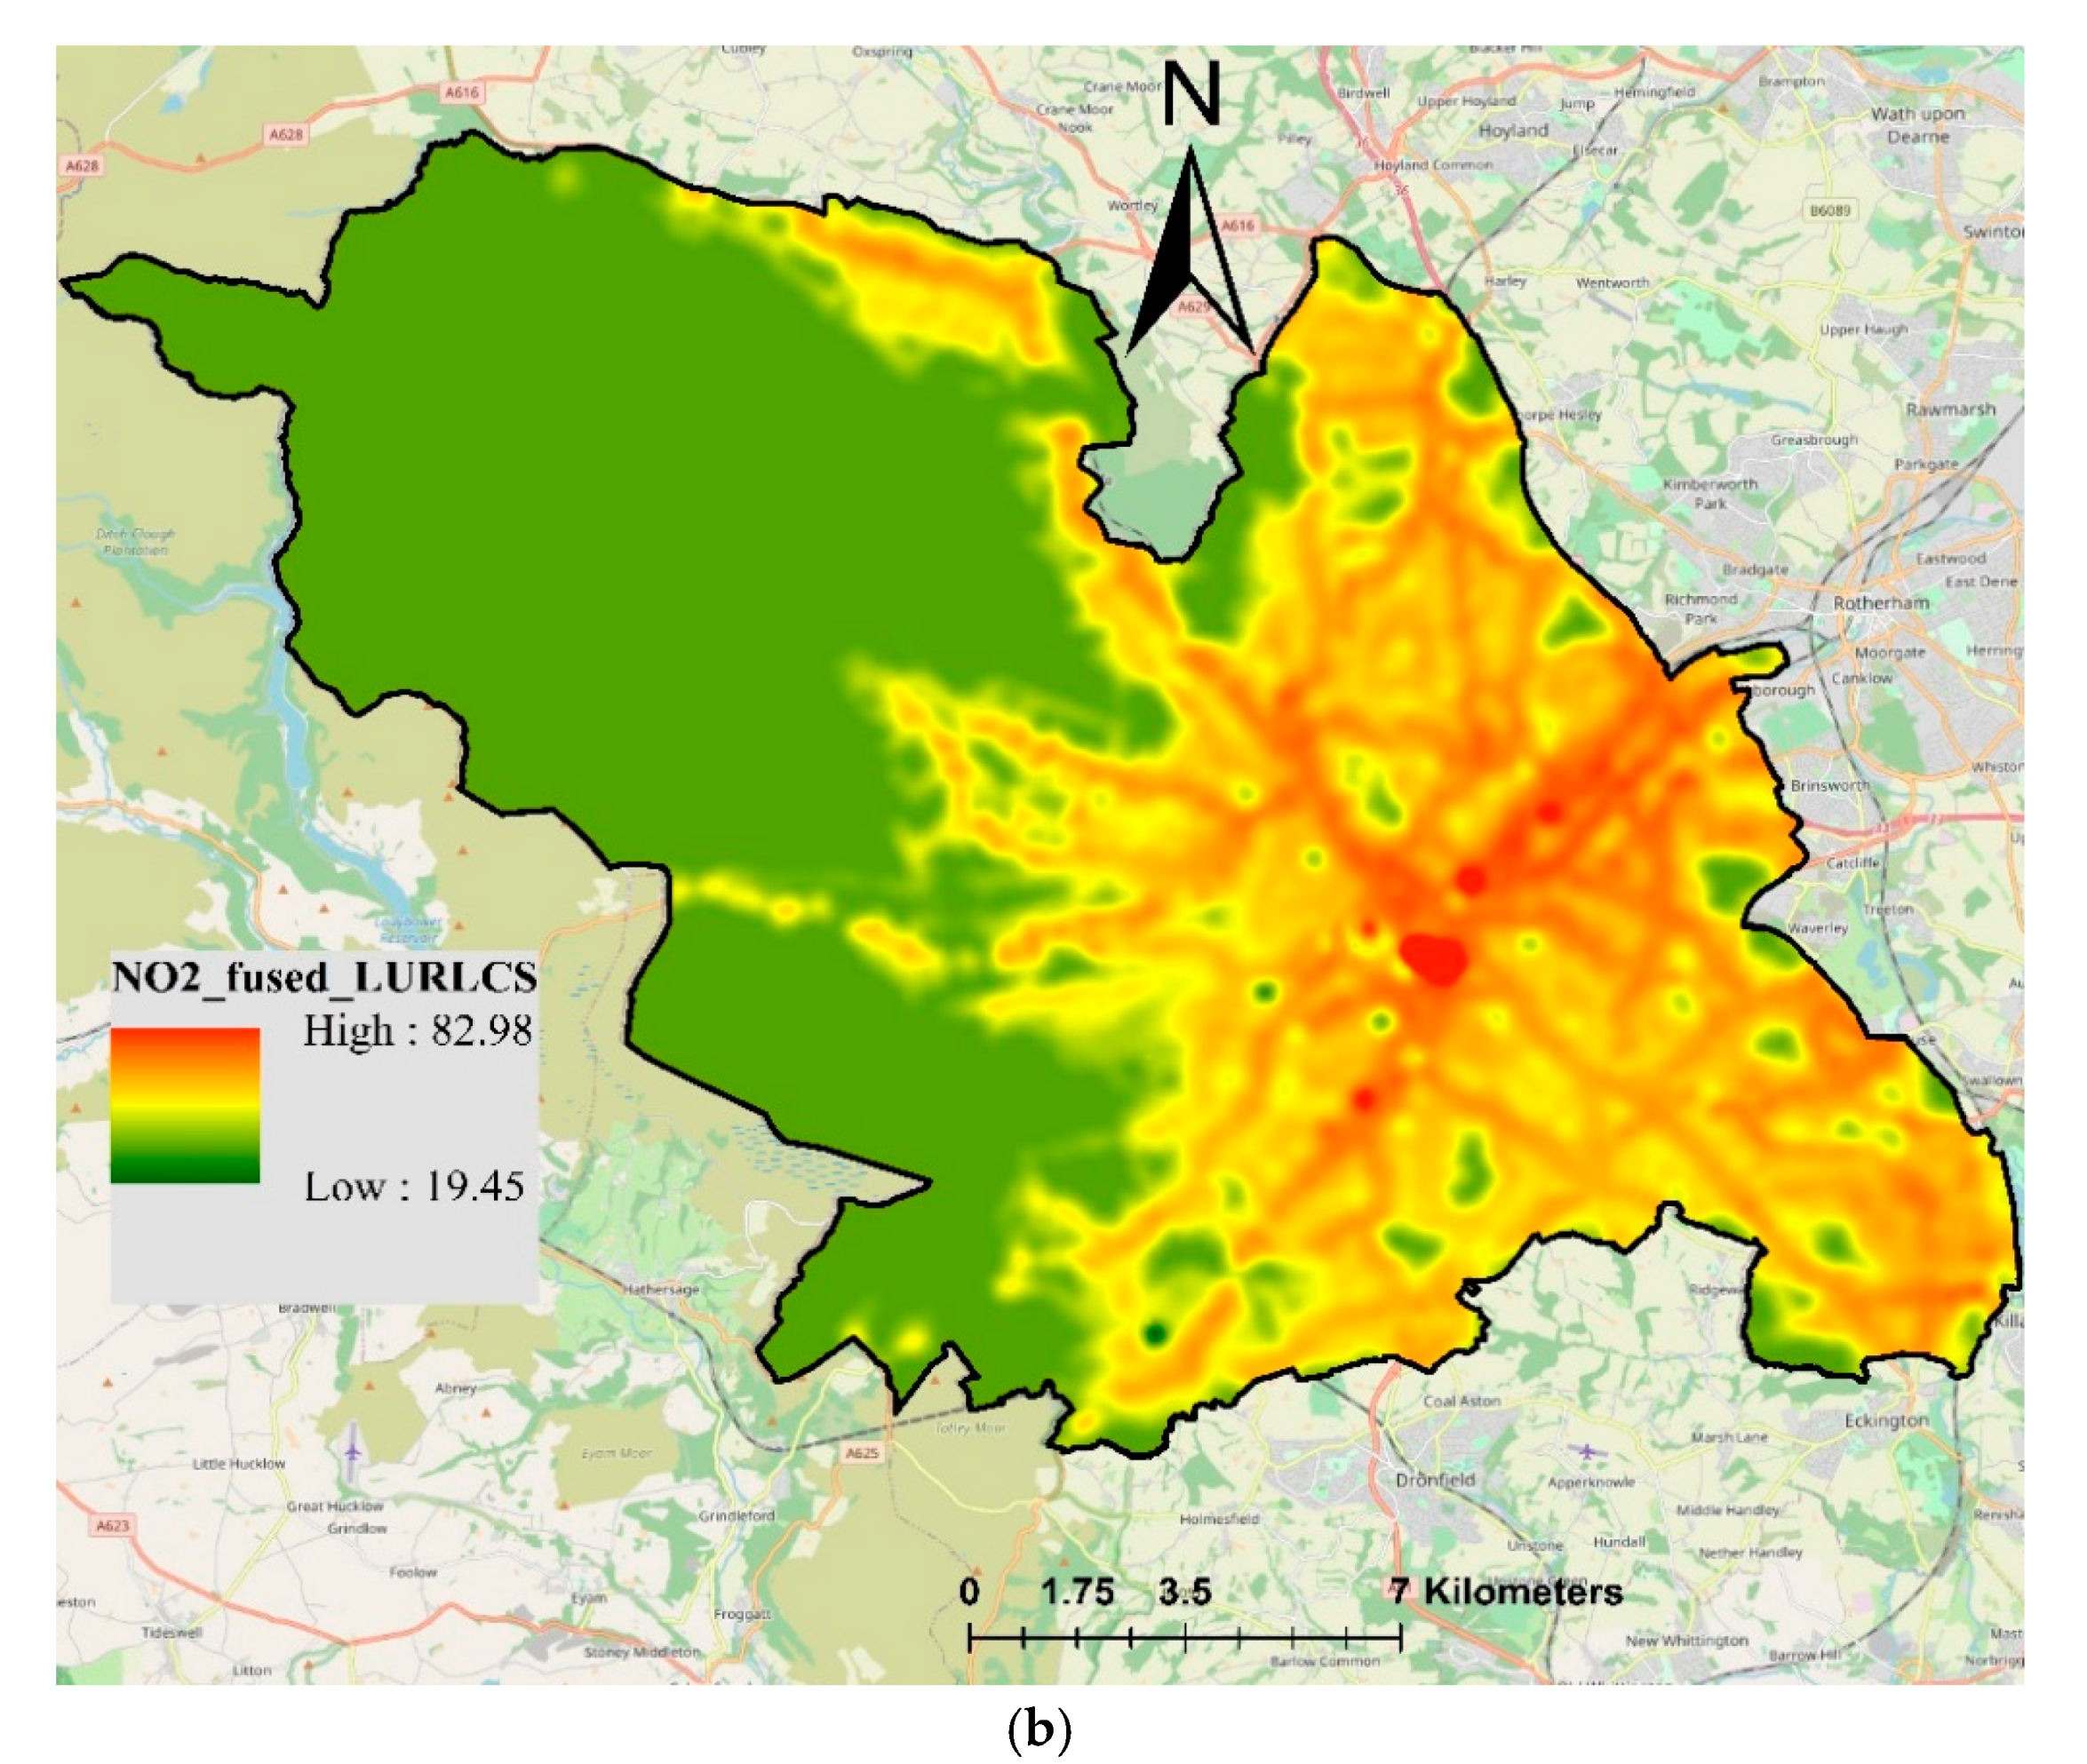
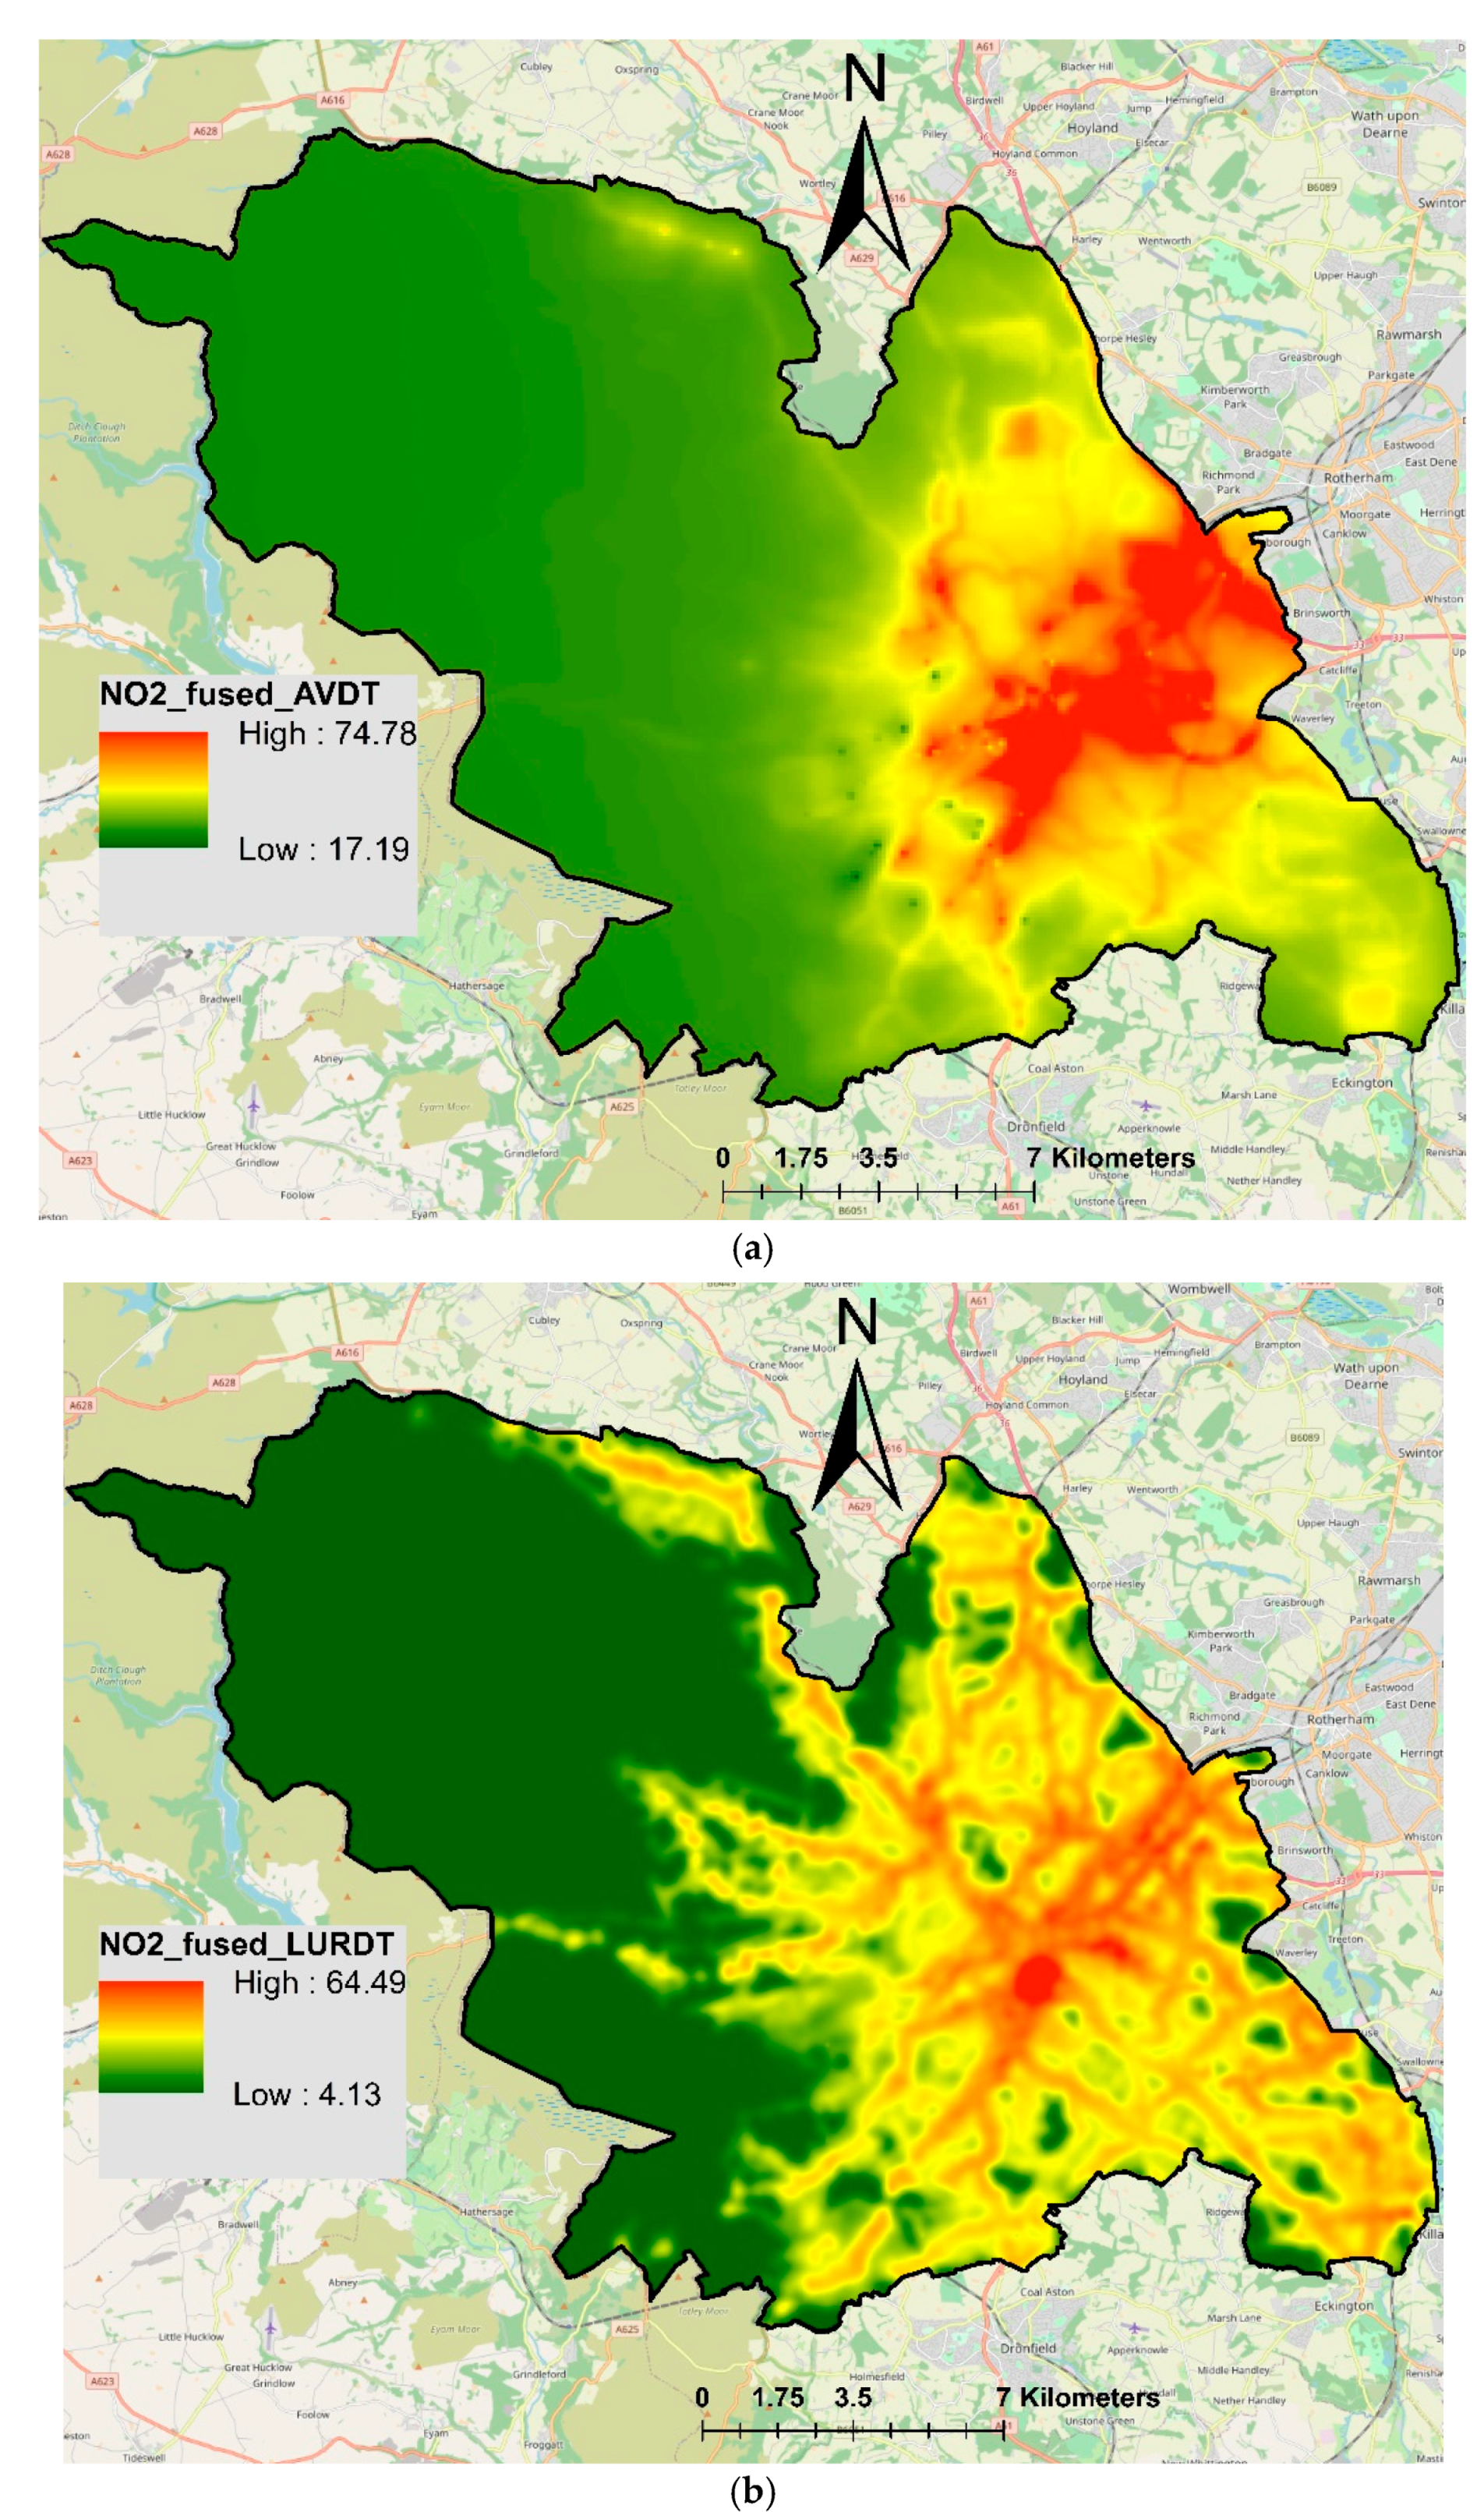
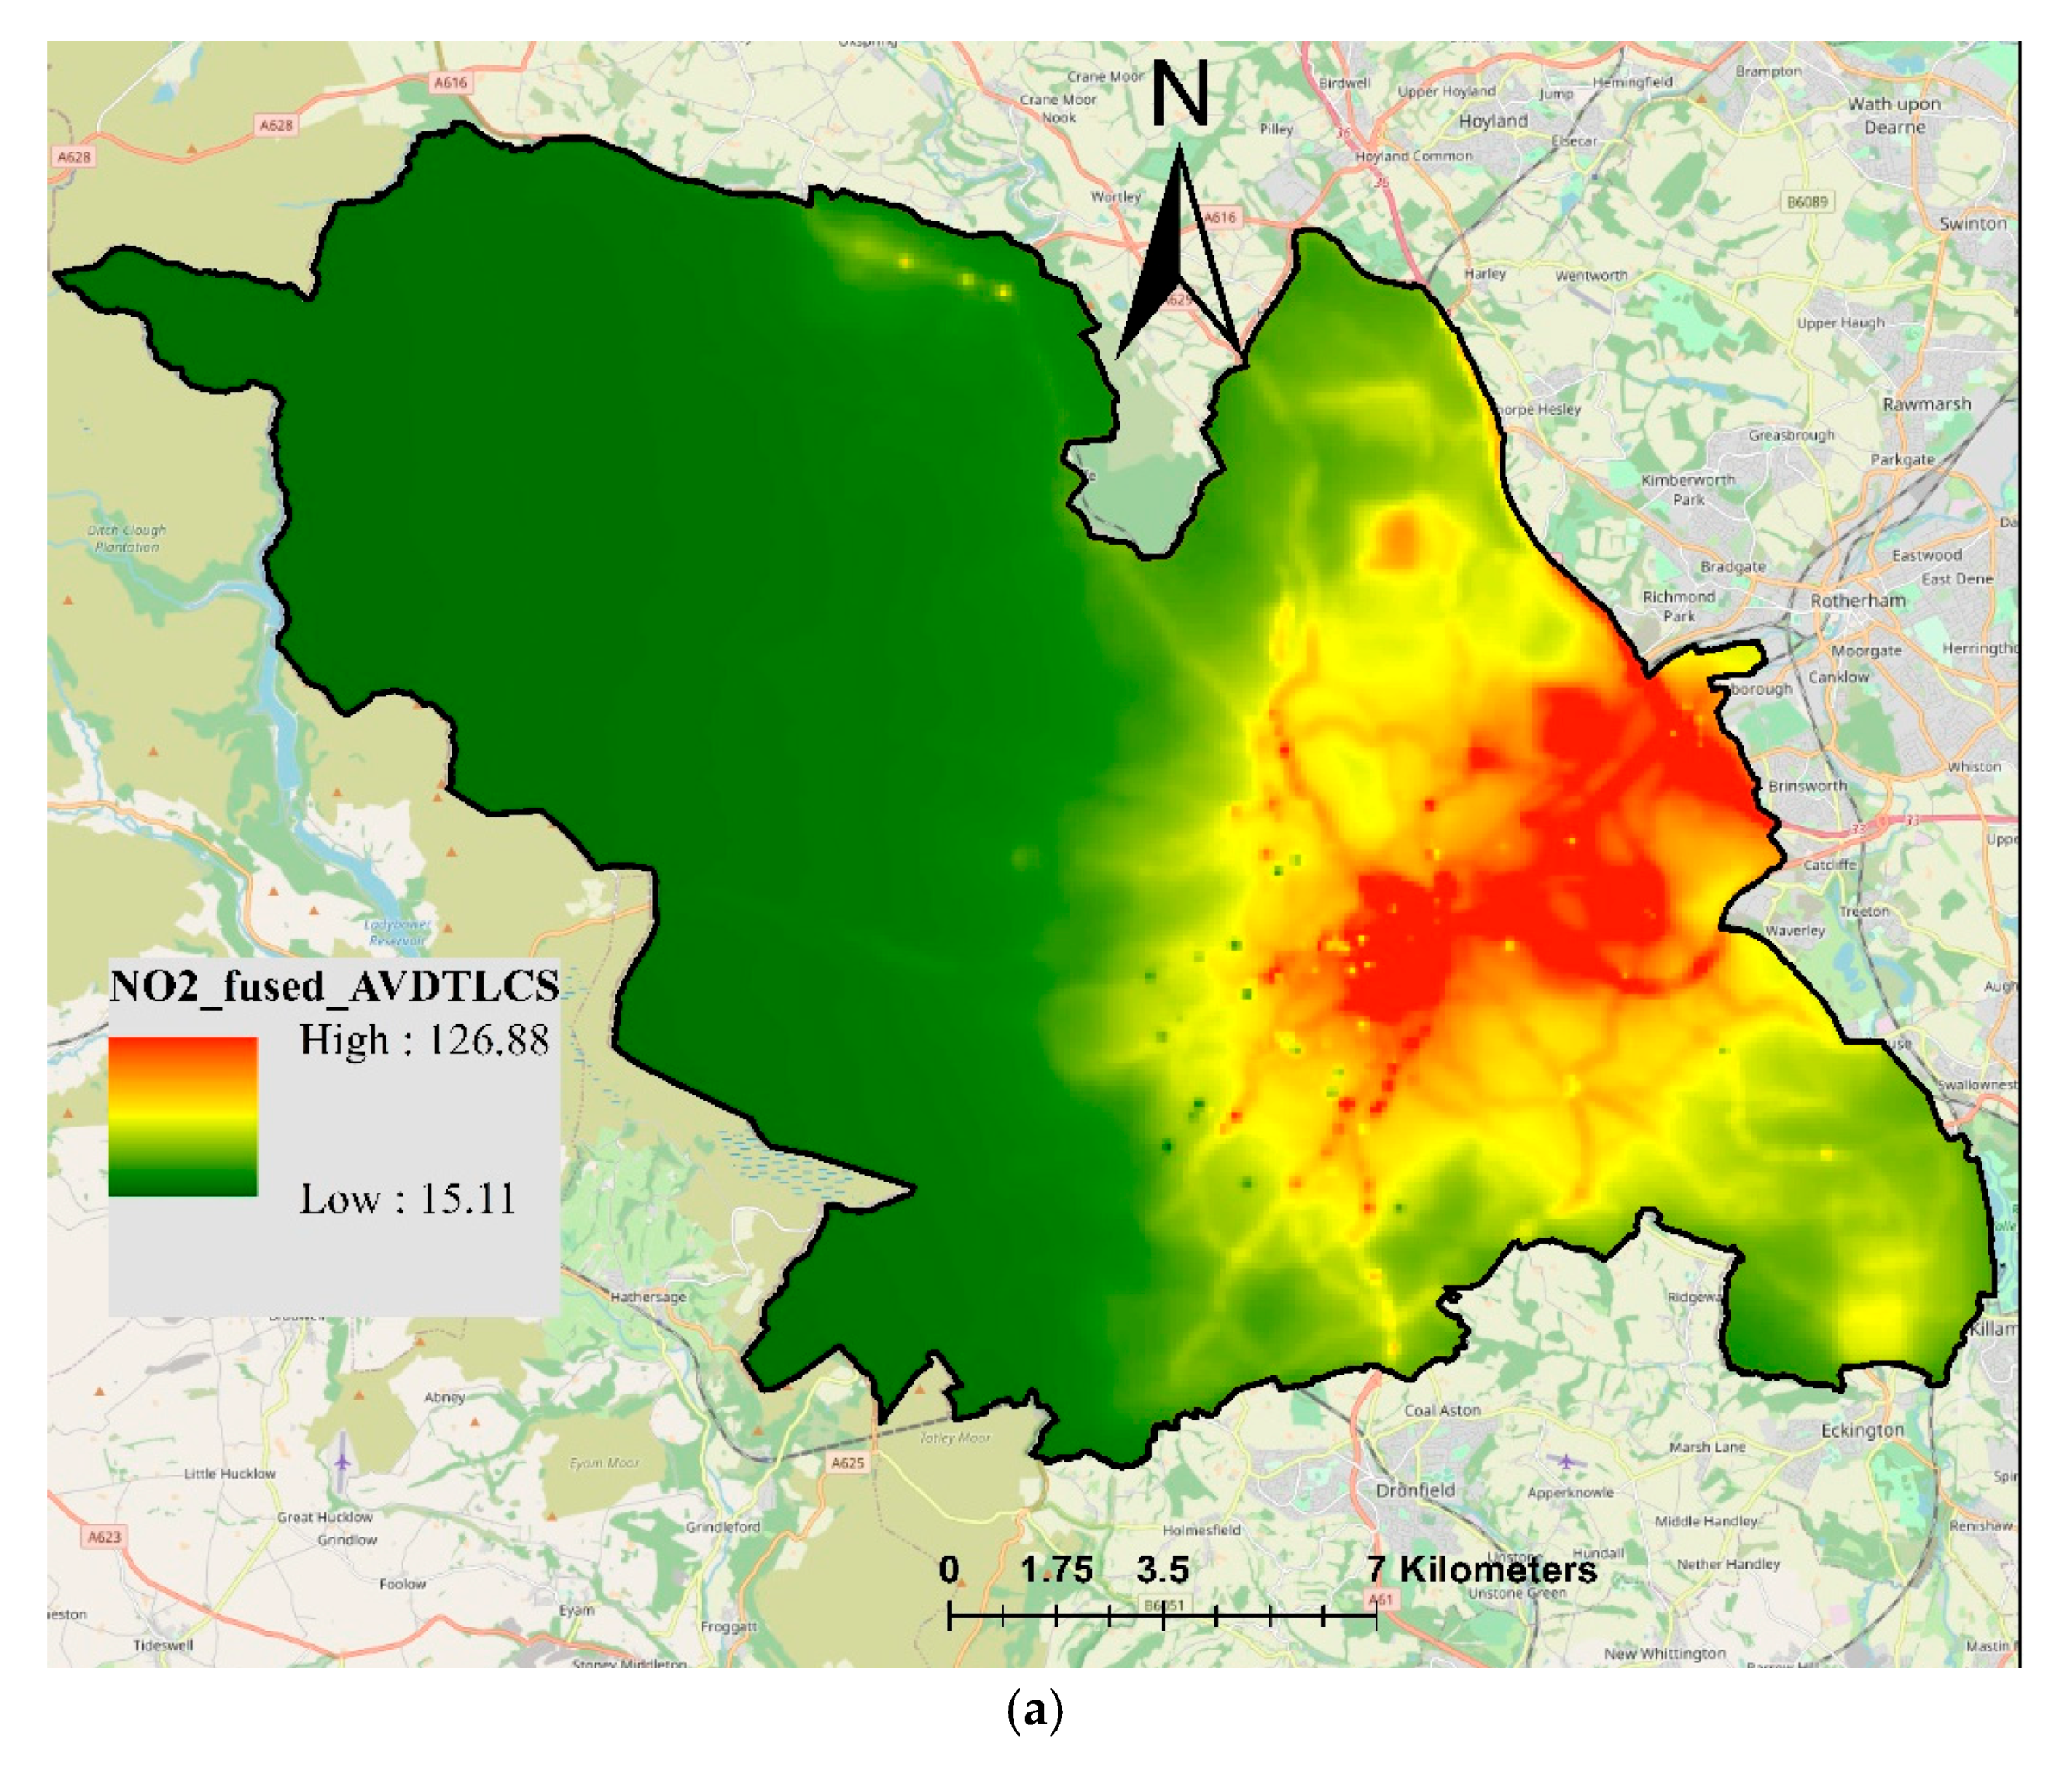
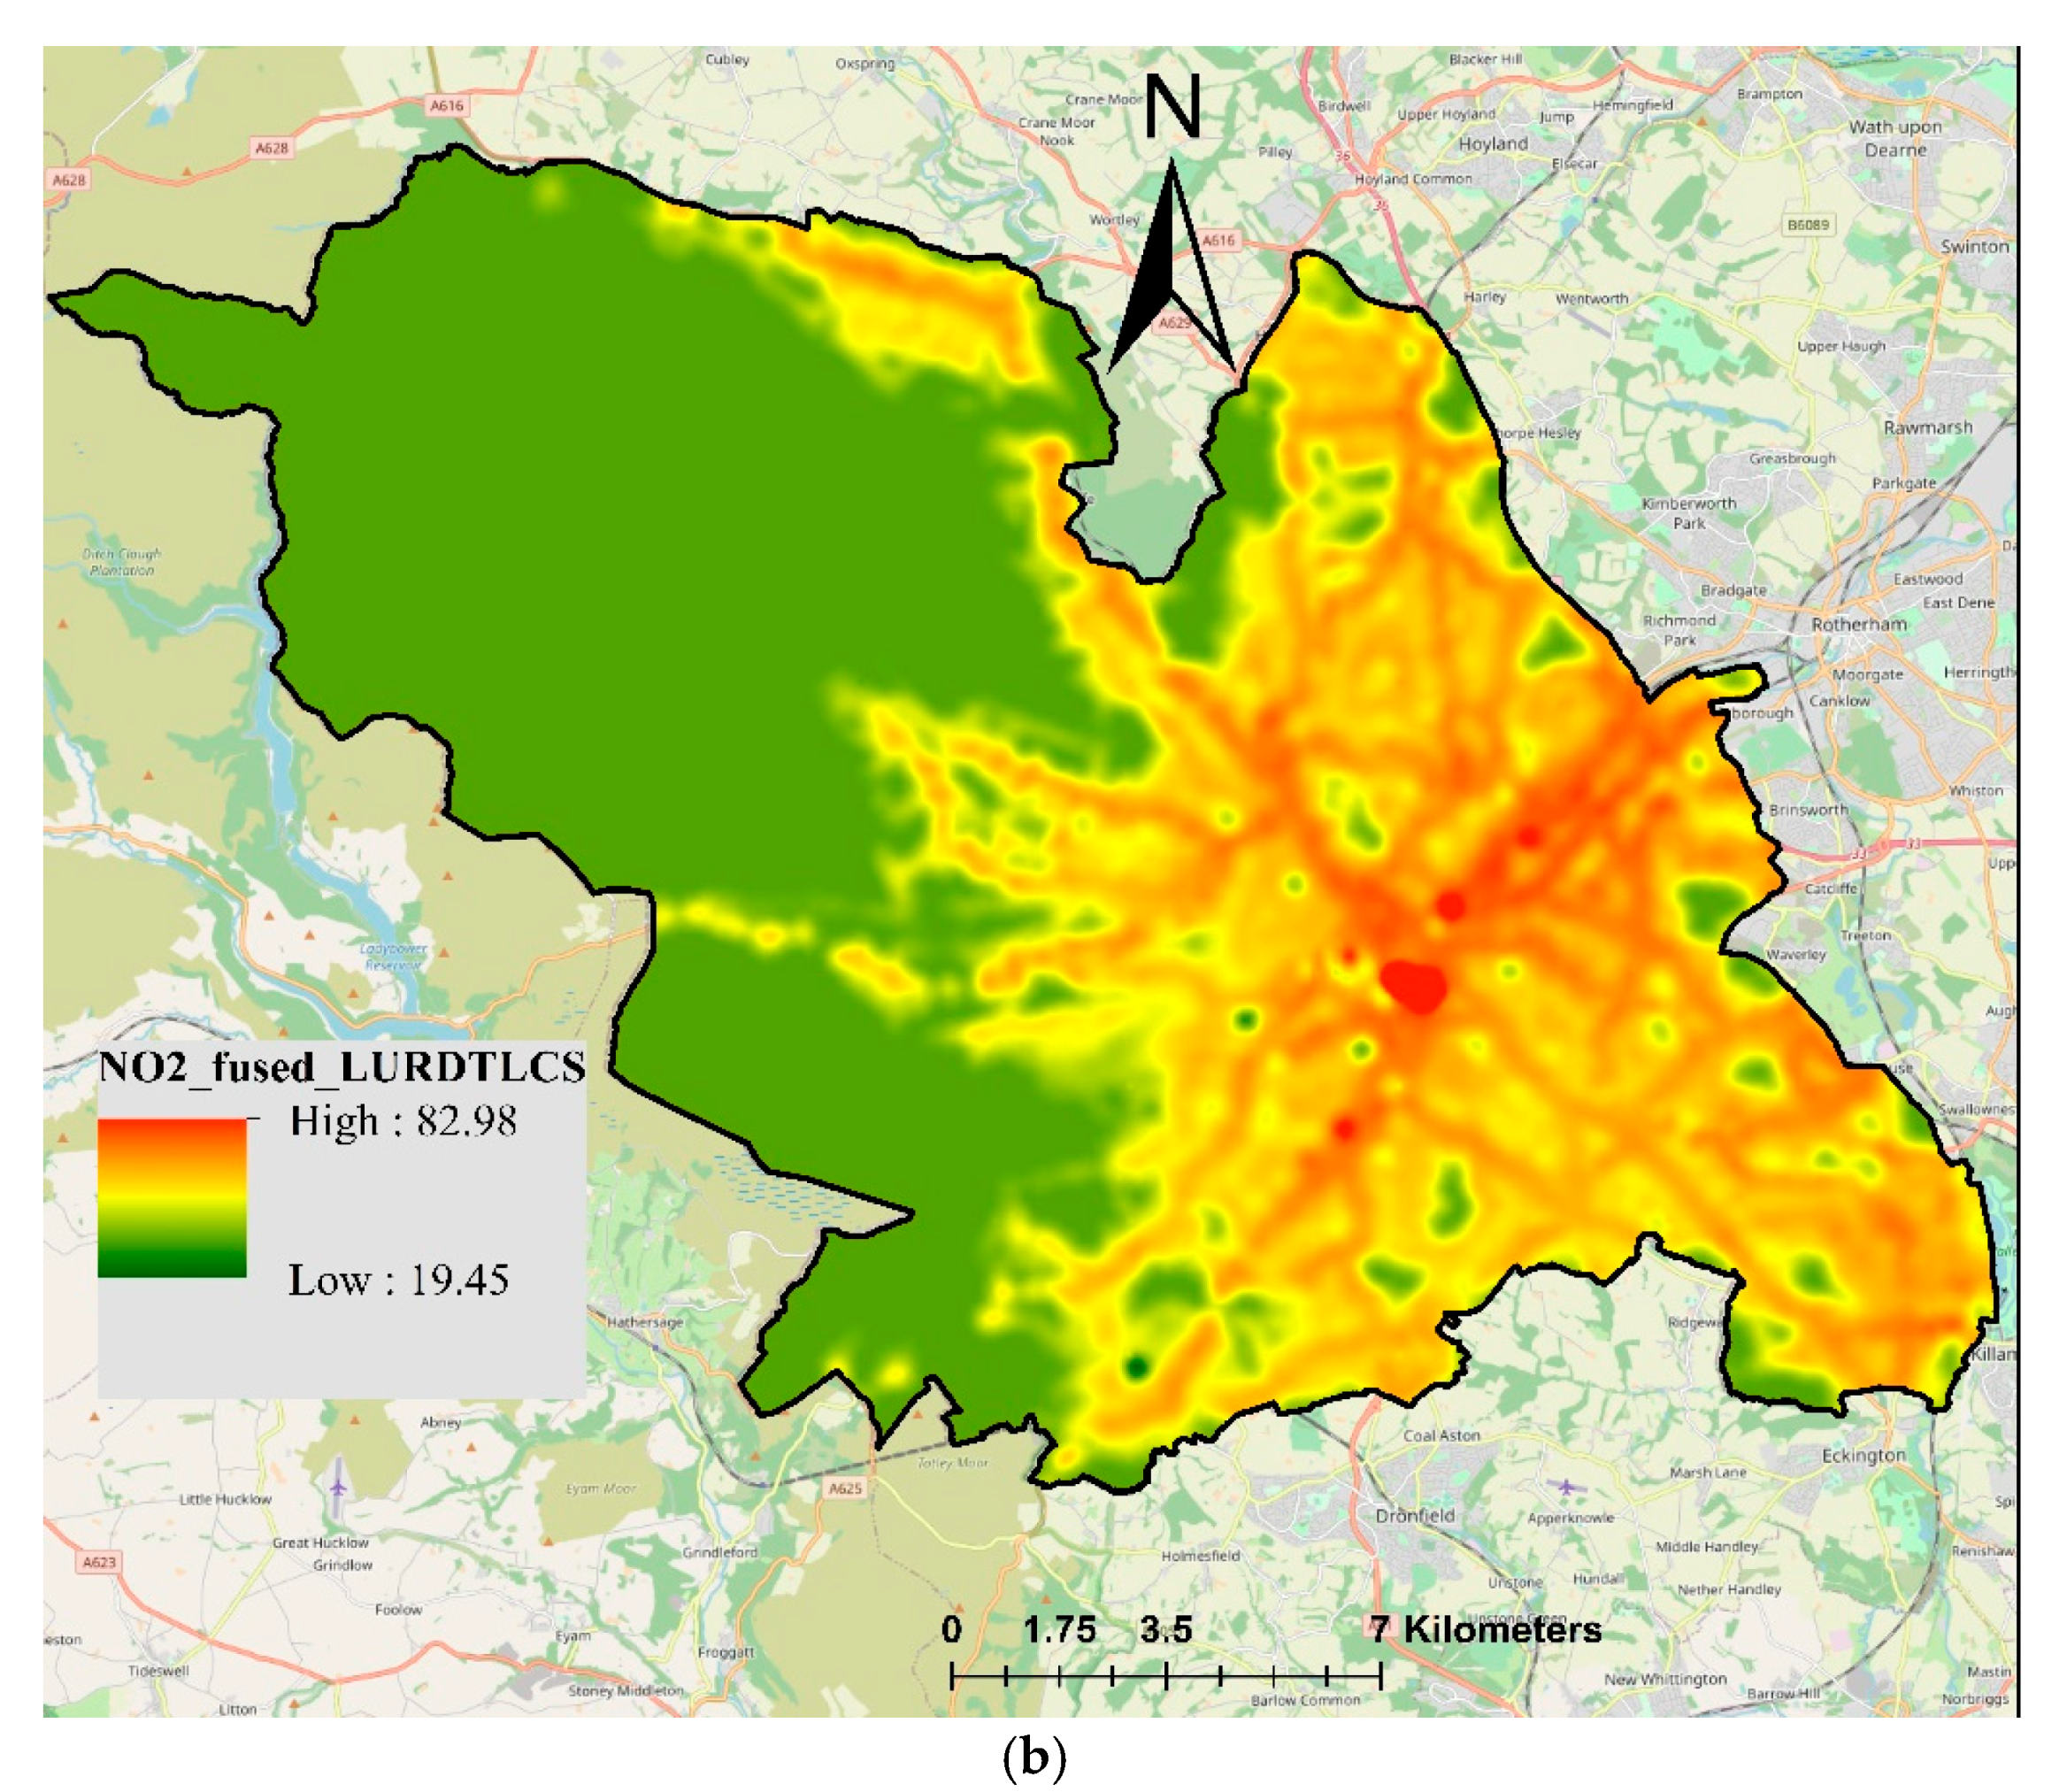
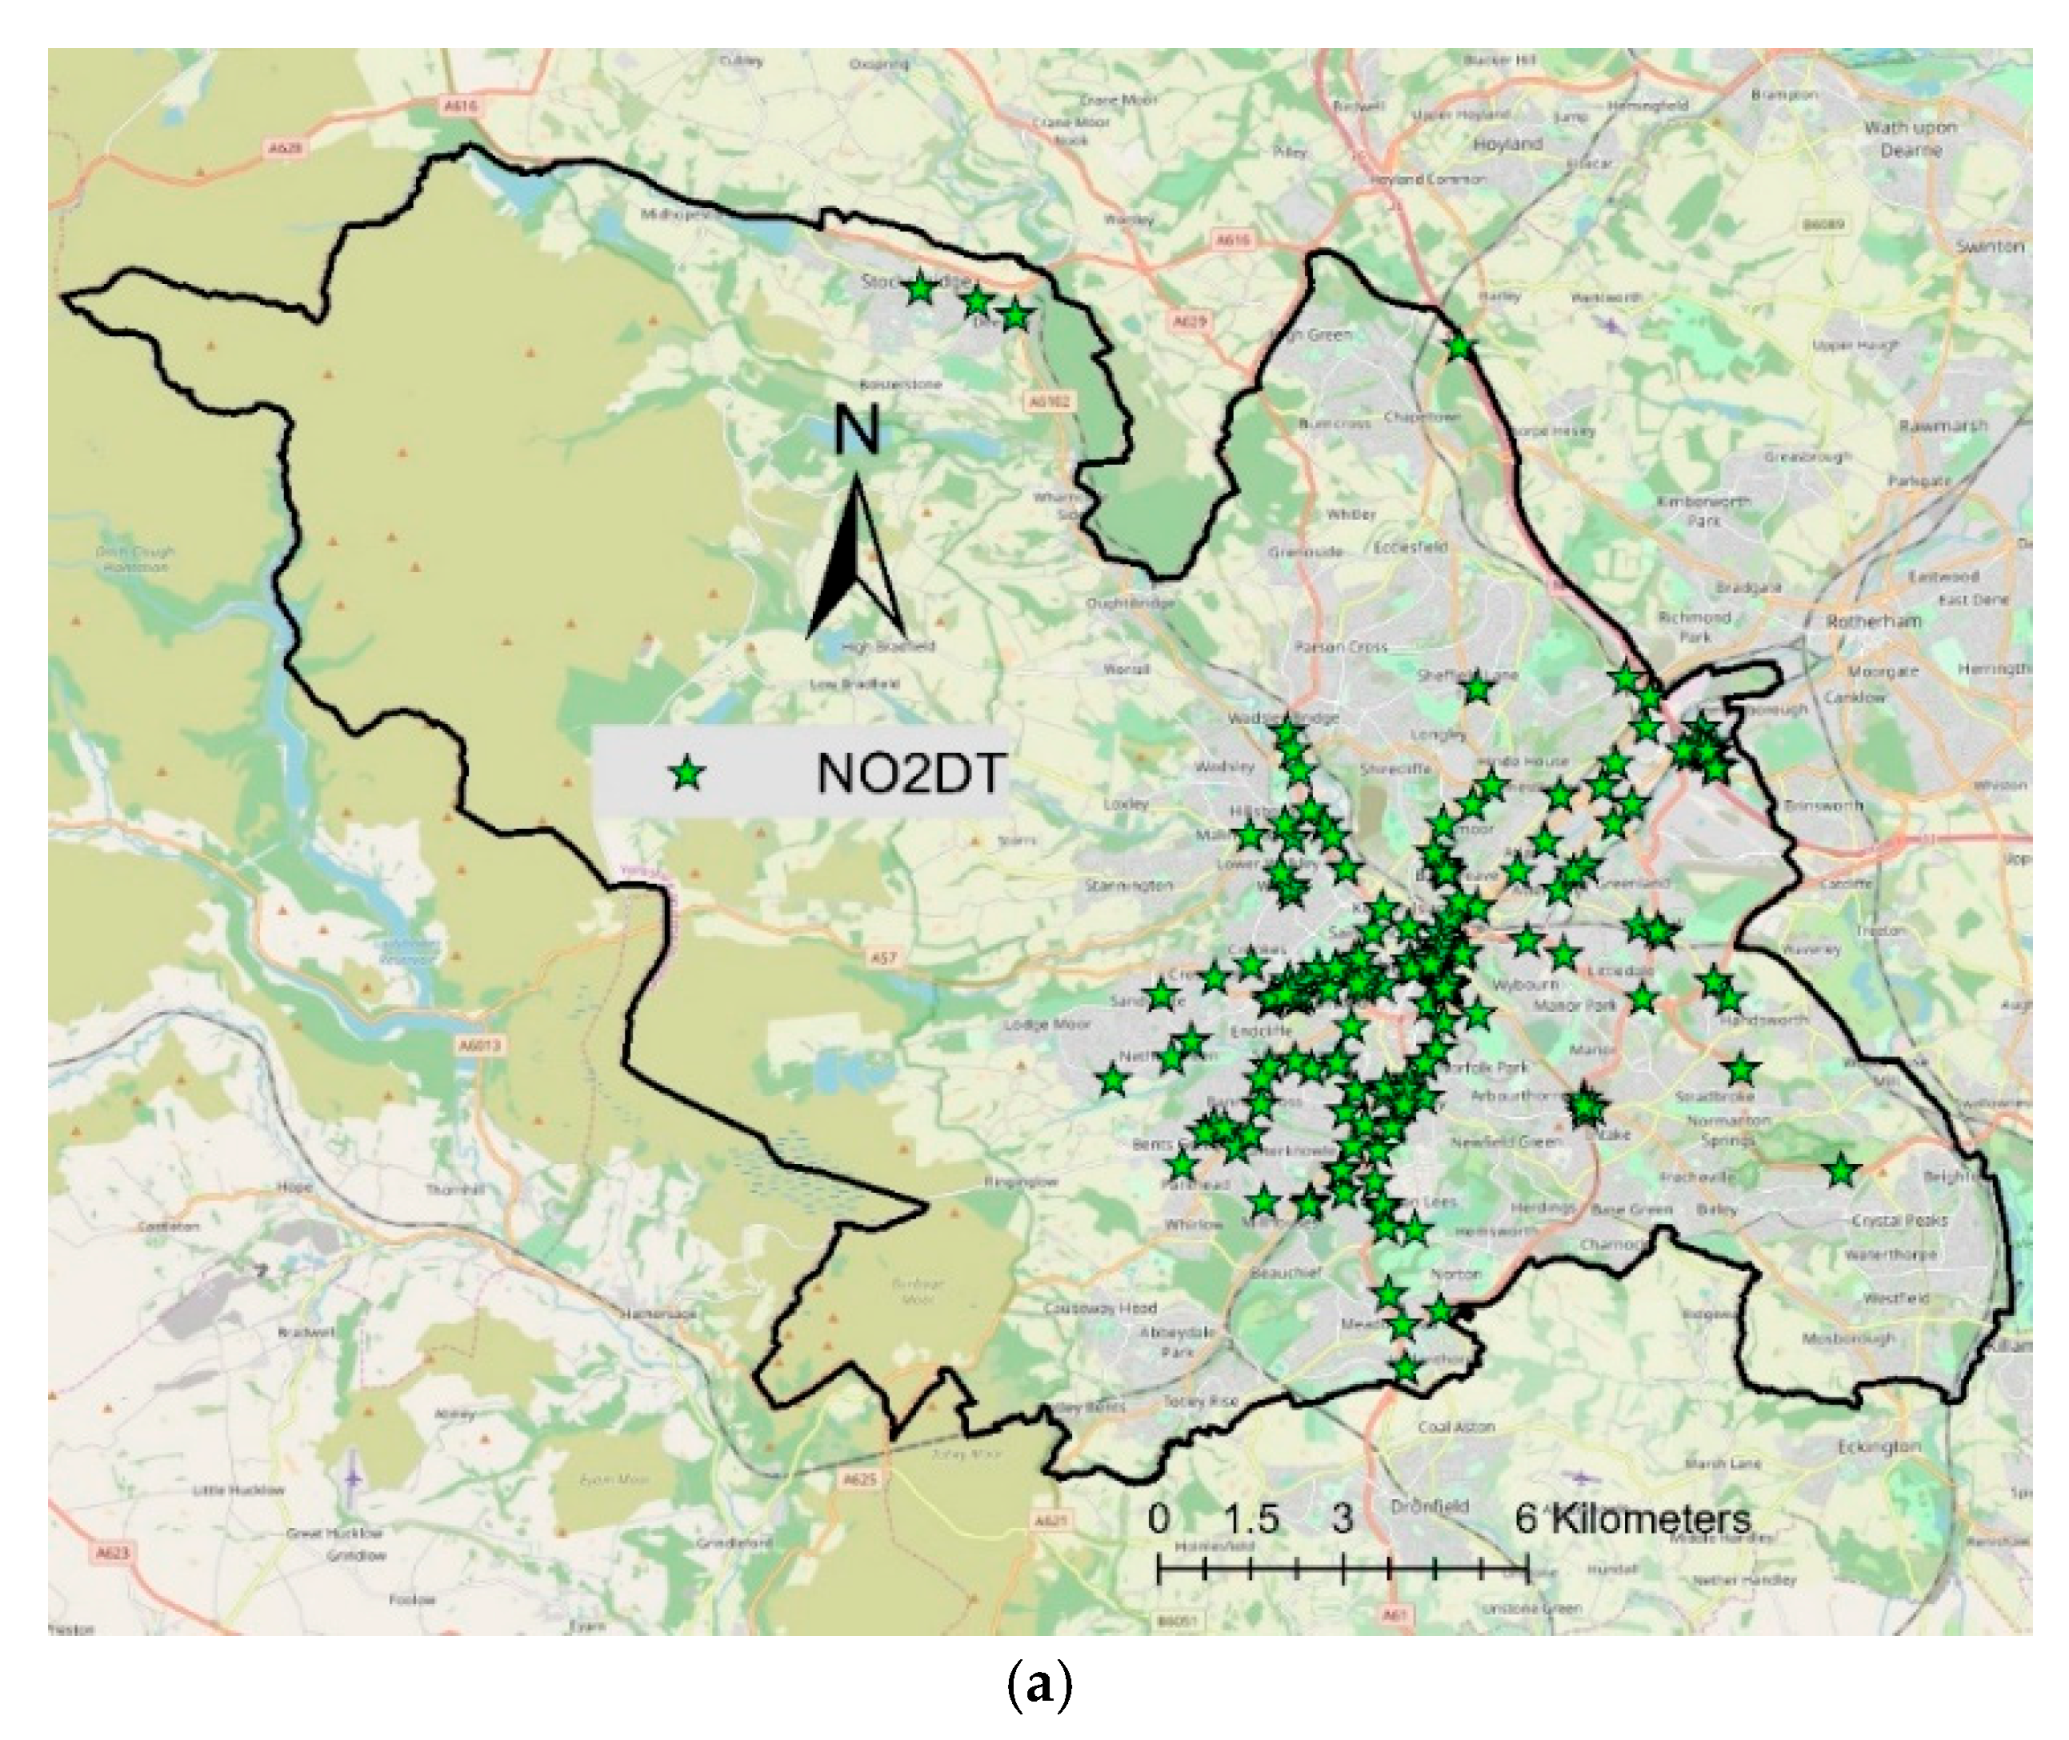
Small-scale spatial variability in NO2 concentrations is analysed with the help of pollution maps. Maps of NO2 estimated by the Airviro dispersion model and land use regression (LUR) model are fused with measured NO2 concentrations from low-cost sensors (LCS), reference sensors and diffusion tubes. In this study, geostatistical universal kriging was employed for fusing (integrating) model estimations with measured NO2 concentrations. The results showed that the data fusion approach was capable of estimating realistic NO2 concentration maps that inherited spatial patterns of the pollutant from the model estimations and adjusted the modelled values using the measured concentrations. Maps produced by the fusion of NO2-LCS with NO2-LUR produced better results, with r-value 0.96 and RMSE 9.09. Data fusion adds value to both measured and estimated concentrations: the measured data are improved by predicting spatiotemporal gaps, whereas the modelled data are improved by constraining them with observed data. Hotspots of NO2 were shown in the city centre, eastern parts of the city towards the motorway (M1) and on some major roads. Air quality standards were exceeded at several locations in Sheffield, where annual mean NO2 levels were higher than 40 µg/m3. Road traffic was considered to be the dominant emission source of NO2 in Sheffield.
Keywords: nitrogen dioxide; spatial variability; urban air quality; data fusion; dispersion modelling; land use regression; Sheffield nitrogen dioxide; spatial variability; urban air quality; data fusion; dispersion modelling; land use regression; Sheffield