Article

Assessing the Sensitivity of Main Crop Yields to Climate Change Impacts in China

State Key Laboratory of Earth Surface Processes and Resource Ecology, Faculty of Geographical Science, Beijing Normal University, Beijing 100875, China
*
Author to whom correspondence should be addressed.
Atmosphere 2021, 12(2), 172; https://doi.org/10.3390/atmos12020172
Submission received: 5 November 2020 / Revised: 25 January 2021 / Accepted: 25 January 2021 / Published: 28 January 2021
(This article belongs to the Special Issue Climate Change and Agrometeorological Time Series)

Abstract

:
Quantitatively assessing the spatial divergence of the sensitivity of crop yield to climate change is of great significance for reducing the climate change risk to food production. We use socio-economic and climatic data from 1981 to 2015 to examine how climate variability led to variation in yield, as simulated by an economy–climate model (C-D-C). The sensitivity of crop yield to the impact of climate change refers to the change in yield caused by changing climatic factors under the condition of constant non-climatic factors. An ‘output elasticity of comprehensive climate factor (CCF)’ approach determines the sensitivity, using the yields per hectare for grain, rice, wheat and maize in China’s main grain-producing areas as a case study. The results show that the CCF has a negative trend at a rate of −0.84/(10a) in the North region, while a positive trend of 0.79/(10a) is observed for the South region. Climate change promotes the ensemble increase in yields, and the contribution of agricultural labor force and total mechanical power to yields are greater, indicating that the yield in major grain-producing areas mainly depends on labor resources and the level of mechanization. However, the sensitivities to climate change of different crop yields to climate change present obvious regional differences: the sensitivity to climate change of the yield per hectare for maize in the North region was stronger than that in the South region. Therefore, the increase in the yield per hectare for maize in the North region due to the positive impacts of climate change was greater than that in the South region. In contrast, the sensitivity to climate change of the yield per hectare for rice in the South region was stronger than that in the North region. Furthermore, the sensitivity to climate change of maize per hectare yield was stronger than that of rice and wheat in the North region, and that of rice was the highest of the three crop yields in the South region. Finally, the economy–climate sensitivity zones of different crops were determined by the output elasticity of the CCF to help adapt to climate change and prevent food production risks.

1. Introduction

While the issue of food security is currently receiving a lot of attention and more detailed research on the topic is being carried out, the study of the impacts of climate change on food production has always been of importance. The occurrence of historical climate change and predicted future climate change affect food security through increasing temperature, precipitation variation and increased frequencies of extreme events [1,2,3]. The variations in climatic conditions suitable for the growth and development of crops will become more pronounced in the future [4,5]. Facing the severe challenge of global warming, the number of catastrophic agrometeorological disasters will increase [6,7], the risks of climate change on food production will increase [8,9], and it will become more difficult to guarantee food security [10,11]. The assessment of climate change impact is an important link and foundation of the assessment of climate change risk [12,13,14]. Understanding the sensitivities of different varieties of crop yields to the impacts of historical climate change is essential for scientifically and rationally assessing climate change impacts and appropriately instituting measures to prevent climate change risks.
Sensitivity assessment and quantitative analysis of food production affected by climate change are important considerations to adapt food production to climate change and achieve sustainable agricultural development. Scholars have used different models to study the impacts of changes in key regional climatic indicators on main crop yields. For example, the crop model was used to analyze the impact of changes in temperature and precipitation in different regions on the future main crop yields (e.g., wheat and maize) [15,16,17]; the Ricardian model was used to analyze the sensitivity of different crop yields to marginal changes in response to different climatic factors [18,19,20]; the Computable General Equilibrium model (CGE) was used to analyze the impacts of climate change in different regions on the economic costs of food production [21]; and the “meteorological output” model [22] was used to separate crop output into three parts—technical output, meteorological output, and random output—and to evaluate the impacts of meteorological factor fluctuations on output variations [23,24]. Studies on the impacts of climate change on food production based on these models are limited as only single and independent climatic factors are evaluated, and the interaction between climatic factors and agricultural economic factors is not considered. In fact, the impact of climate change on food production is a complex nonlinear system that is affected by many factors, and it is necessary to integrate economic and climatological theories for cross-study [25,26]. In view of this, Chou et al. combined climatic factors with economic factors to construct an economy–climate model (C-D-C) [27,28]. Compared with other economic models that study the impacts of climate change [29], the C-D-C model can not only reveal the nonlinear relationship between economic factors and natural factors for food production but also quantitatively analyze the impact of changes in climatic factors on changes in food production from a socioeconomic perspective. The model has been widely used and improved in many fields and studies [30,31,32] and reveals the advantages of comprehensively considering the nonlinear relationship between economic and natural factors, and the long-term trend of climatic factors.
Rice, wheat, and maize are the three main crops in China; China is the largest producer of rice and wheat and the second largest producer of maize in the world [33,34]. Stably increasing the yield of the three main crops is not only related to national economic development and social stability [35], but is also the core of ensuring food security in China and the world [36]. Here we constructed a comprehensive climate factor (CCF) to reveal the ensemble information of different climatic elements and introduce it into the model as a climatic indicator. We also analyzed the output elasticity variations of the main crop yields as a result of climate change and economic factors in the past 35 years using the C-D-C model and assessed the sensitivities of crop yields to climate change impacts and their spatial distribution.

2. Materials and Methods

2.1. Division of Main Grain-Producing Areas

This paper took China’s main grain-producing areas as the research area. The main grain-producing areas are the core of grain-production areas in China, and they are important for ensuring national food security [37,38,39]. Based on the eight grain-producing areas in China [40], we selected 13 provinces as the main grain-producing areas, with annual average grain production concentrations exceeding 3% (Figure 1a), annual average grain yields accounting for 72.2% of the country’s total, and crop sown areas accounting for 68.3% nationally. This showed that these provinces could represent the main force in national food production, and their production directly affected the overall level of national food production. At the same time, we divided the 13 provinces into two major regions, the North and South regions, based on the geographical division principle of the Qinling–Huaihe River (Figure 1b). Moreover, the division roughly matched the climatic zone divisions of China. The North region was located in a temperate monsoon climate zone, and the South region was located in a subtropical monsoon climate zone [32]. The North region included the Heilongjiang, Jilin, Liaoning, Hebei, Shandong and Henan provinces, and the South region included the Anhui, Jiangsu, Jiangxi, Hubei, Hunan, Guangdong and Sichuan provinces.

2.2. Data Sources and Preprocessing

The meteorological observation data of 417 stations included the monthly precipitation (unit: mm), mean air temperature (unit: °C) and sunshine hours (unit: hour) in China’s grain-producing areas [40] during the growing season (April–September) from 1981 to 2015. These data were obtained from the Climate Dataset of the China Meteorological Data Service Center (http://data.cma.cn) and the China Meteorological Administration. The mean temperature data were given in Kelvin (K) units. The data of each province were given as the arithmetic average of the station data from April to September in each province, and the data for large regions were provided as the weighted mean of the area of the administrative region of all provinces in the region.
The agricultural economic data were obtained from the National Bureau of Statistics (http://www.bjstats.gov.cn) and the “Statistical Yearbook” of provinces. The data were based on the province and included the rural labor force (unit: ten thousand people), the sown area of total grain, rice, wheat, maize (unit: 1000 hectares), agricultural fertilizer (unit: 10,000 tons), disaster area (unit: 1000 hectares), total power of agricultural machinery (unit: 10,000 kW), and the yields per hectare for grain, rice, wheat and maize (unit: 10,000 tons) from 1981 to 2015. Among them, the yield per hectare (or sown area) for grain includes the total yields (or total sown area) of different crops such as rice, wheat, soybeans and maize. The sown area of different crops and disaster area should be calculated in 10,000 hectares, and the per unit area yield should be calculated in 10,000 kg/10,000 ha. Since economic data were statistical data and it was not possible to use them directly, they were pre-processed to make the data credible, reasonable and consistent. Therefore, we used the three-point moving average method to preprocess economic and climatic data.

2.3. Methods

We first used the principal component analysis method to include multiple climate factors in the comprehensive climate factor (CCF) index. The CCF was then introduced into the economy–climate model (C-D-C) to simulate the regional changes in the output elasticity of crop yield as a result of climate change. Finally, the sensitivity of crop yield to climate change impact was evaluated according to the output elasticity index of the comprehensive climate factor. The specific methods and indicators are as follows:

2.3.1. Principal Component Analysis Method

The principal component analysis method (PCA) is a dimensionality reduction statistical method that can combine multiple indicators to yield a comprehensive indicator in such a way [41,42] so that the comprehensive indicator reflects as much of the information of the individual indicators as possible. The specific calculation steps are as follows [43,44]:
Step 1: Calculate the correlation coefficient matrix (or covariance matrix) of variable X:
R   =   ( r i j ) p n ,
Step 2: Calculate the eigenvalue ( λ i ( i = 1 , 2 , · · · ,   p ) ) of R and its corresponding eigenvector ( e i ( i = 1 , 2 , · · · ,   p ) ) by the maximum variance method and the least square method.
Step 3: Calculate the contribution rate and cumulative contribution rate of the principal component Y.
Step 4: Calculate the principal component load:
v i j = p ( z i , x j ) = λ i e i ,
Step 5: Calculate the principal component Y = VX.

2.3.2. Economy–Climate Model (C-D-C)

The Cobb–Douglas production function (C-D model) is an economic model based on economic theory. It has mainly been used for economic analysis of the contribution of factor input to output in the agricultural production process. Since then, other economists have continued to make modifications and improvements, and found that the C-D production function model was more suitable than other functional forms to describe the process of grain input and output [27]. Chou et al. introduced a variable climate factor into it and developed an economic–climate model (C-D-C) [27]. This model has been empirically tested and can evaluate, analyze and predict the impact of climate change on China’s grain production in a general manner. According to the status of China’s food production and the availability of statistical data, we introduced five agricultural economic factors—the sown area of crops, agricultural labor, agricultural fertilizer, disaster area and total power of agricultural machinery—into the C-D-C model together with the comprehensive climate factor (Formula (3)). To facilitate parameter estimation, the logarithm of the parameters in Formula (3) were used to linearize the model (Formula (4)). Then the output elasticity values of μ , γ , β 1 , β 2 , β 3 , β 4 and were calculated using the multiple regression method. In Formulas (3) and (4), Y is the yield per unit area for grain, rice, wheat or maize. X 1 ,   X 2 ,   X 3 ,   X 4 ,   and   X 5 are the agricultural labor force, the sown area of crop, agricultural fertilizer, power of agricultural machinery, and disaster area, respectively. β 1 ,   β 2 ,     β 3 ,     β 4   and   β 5 are the output elasticities corresponding to X 1 ,   X 2 ,   X 3 ,   X 4 ,   and   X 5 , respectively. μ represents the sum of other factors affecting crop yield except for economic and climatic factors. N c = X 1 β 1 · · · μ represents the sum of the effects of non-climatic factors on yield. γ is the output elasticity of the comprehensive climate factor; for every 1% increase in the comprehensive climate factor under the condition of constant non-climatic factors, the yield will increase by γ %.
Y = ( X 1 X 2 ) β 1 X 2 β 2 ( X 3 X 2 ) β 3 ( X 4 X 2 ) β 4 X 5 β 5 C γ μ = N c C γ ,
l n Y = β 1 ln ( X 1 X 2 ) + β 2 l n X 2 + β 3 ln ( X 3 X 2 ) + β 4 ln ( X 4 X 2 ) + β 5 l n X 5 + γ l n C + l n μ ,

2.4. Evaluation Indicators

2.4.1. Comprehensive Climate Factor (CCF) Indicator

During the growth and development stages of crops, they are subject to the common influence of different climatic factors (such as temperature, precipitation and sunshine hours). Based on this, we tried to integrate three key climatic factors (temperature, precipitation, and sunshine hours) into a comprehensive climate factor to explore how the yield respond to the combined effect of the three different climatic factors. Temperature, precipitation and sunshine hours had significant impacts on the growth and development of crops [45,46], and they were also the main climatic factors that were generally believed to affect yield changes in most regions [47,48,49]. Based on this, we selected temperature, precipitation and sunshine hours to construct a Comprehensive Climate Factor (CCF) using the principal component analysis method and introduced it into the C-D-C model. In previous studies [40], we have used the principal component analysis method to combine multiple climatic factors (e.g., temperature, precipitation) into a Comprehensive Climate Factor (Formula (5)). Here, CCF is the comprehensive climate factor (dimensionless), n is the number of climate factor variables, x is the climate factor variable, and a is the weight corresponding to the climate factor variable x. For example, we combined the temperature (T), precipitation (P) and sunshine hours (S) to construct a comprehensive climate factor, which is shown in Formula (6). CCF reveals the ensemble variation of different climatic factors and reflects the combined characteristics of climate change. When CCF is a positive value, this indicated that climate change has a positive trend. When CCF is a negative value, this indicated that climate change has a negative trend.
CCF = i = 1 n ( a n x n ) ,
CCF   =   a 1 × T   +   a 2 × P   +   a 3 × S ,  

2.4.2. Climate Output Elasticity

The sensitivity of crop yields to the impact of climate change refers to the change in yield caused by the change in the climatic factors under the condition of constant non-climatic factors. It was directly expressed by the output elasticity γ of the comprehensive climate factor in the C-D-C model. We also referred the output elasticity of the comprehensive climate factor as the climate output elasticity. The climate output elasticity was the output elasticity of the climatic factors that influence changes in food production—for every 1% increase in the comprehensive climate factor under the condition of constant non-climatic factors, grain yield will increase by γ %. The larger the value, the greater the sensitivity of food production to climate change.

3. Results

3.1. Characteristics of the Comprehensive Climate Factor

3.1.1. Simulation of the Comprehensive Climate Factor

The overall effect which was revealed by a new comprehensive climatic factor deserves specific attention, considering the simplification of parameters and the improvement of accuracy in the model. Here, we selected three climatic factors—temperature, precipitation and sunshine hours—to construct a comprehensive climate factor (CCF). Firstly, the calculation of the regional CCF equation. Based on the previous research method [40], we calculated the regional CCF equation using the mean temperature, precipitation, and sunshine hours of the six grain-producing areas. According to the results of the variance ratios of the first two principal components, we weighted the first two principal components to construct a comprehensive climate factor of the six areas (Table 1). Secondly, the CCF value of the province was calculated. In fact, each province was affected by regional climate change. We adopted the ensemble idea and calculated the CCF value of provinces within the area range using the regional CCF equation. For example, the time series values of mean temperature, precipitation, and sunshine hours in Jilin province were introduced into the CCF equation of Northeast China, and the CCF value of Jilin province was then calculated. The CCF values of other provinces can be obtained in the same way. The CCF time series values of 13 provinces are in Appendix A Table A1.

3.1.2. Characteristics of the Comprehensive Climate Factor

The comprehensive climate factor can reflect the information of temperature, precipitation and sunshine hours. The CCF showed a negative trend at a rate of −0.84/(10a) during the growing season from 1981 to 2015 in the North region (Figure 2a), reflecting the characteristics of increasing temperature (at a rate of 0.3 °C/(10a)) (Figure 2a-1), decreasing precipitation (at a rate of −1.1 mm/(10a)) (Figure 2a-2) and decreasing sunshine hours (at a rate of −5.0 h/(10a)) (Figure 2a-3). The CCF showed a weak positive trend at a rate of 0.79/(10a) in the South region (Figure 2b), reflecting the characteristics of increasing temperature (at a rate of 0.3 °C/(10a)) (Figure 2b-1), increasing precipitation (at a rate of 0.7 mm/(10a)) (Figure 2b-2) and decreasing sunshine hours (at a rate of −2.4 h/(10a)) (Figure 2b-3).

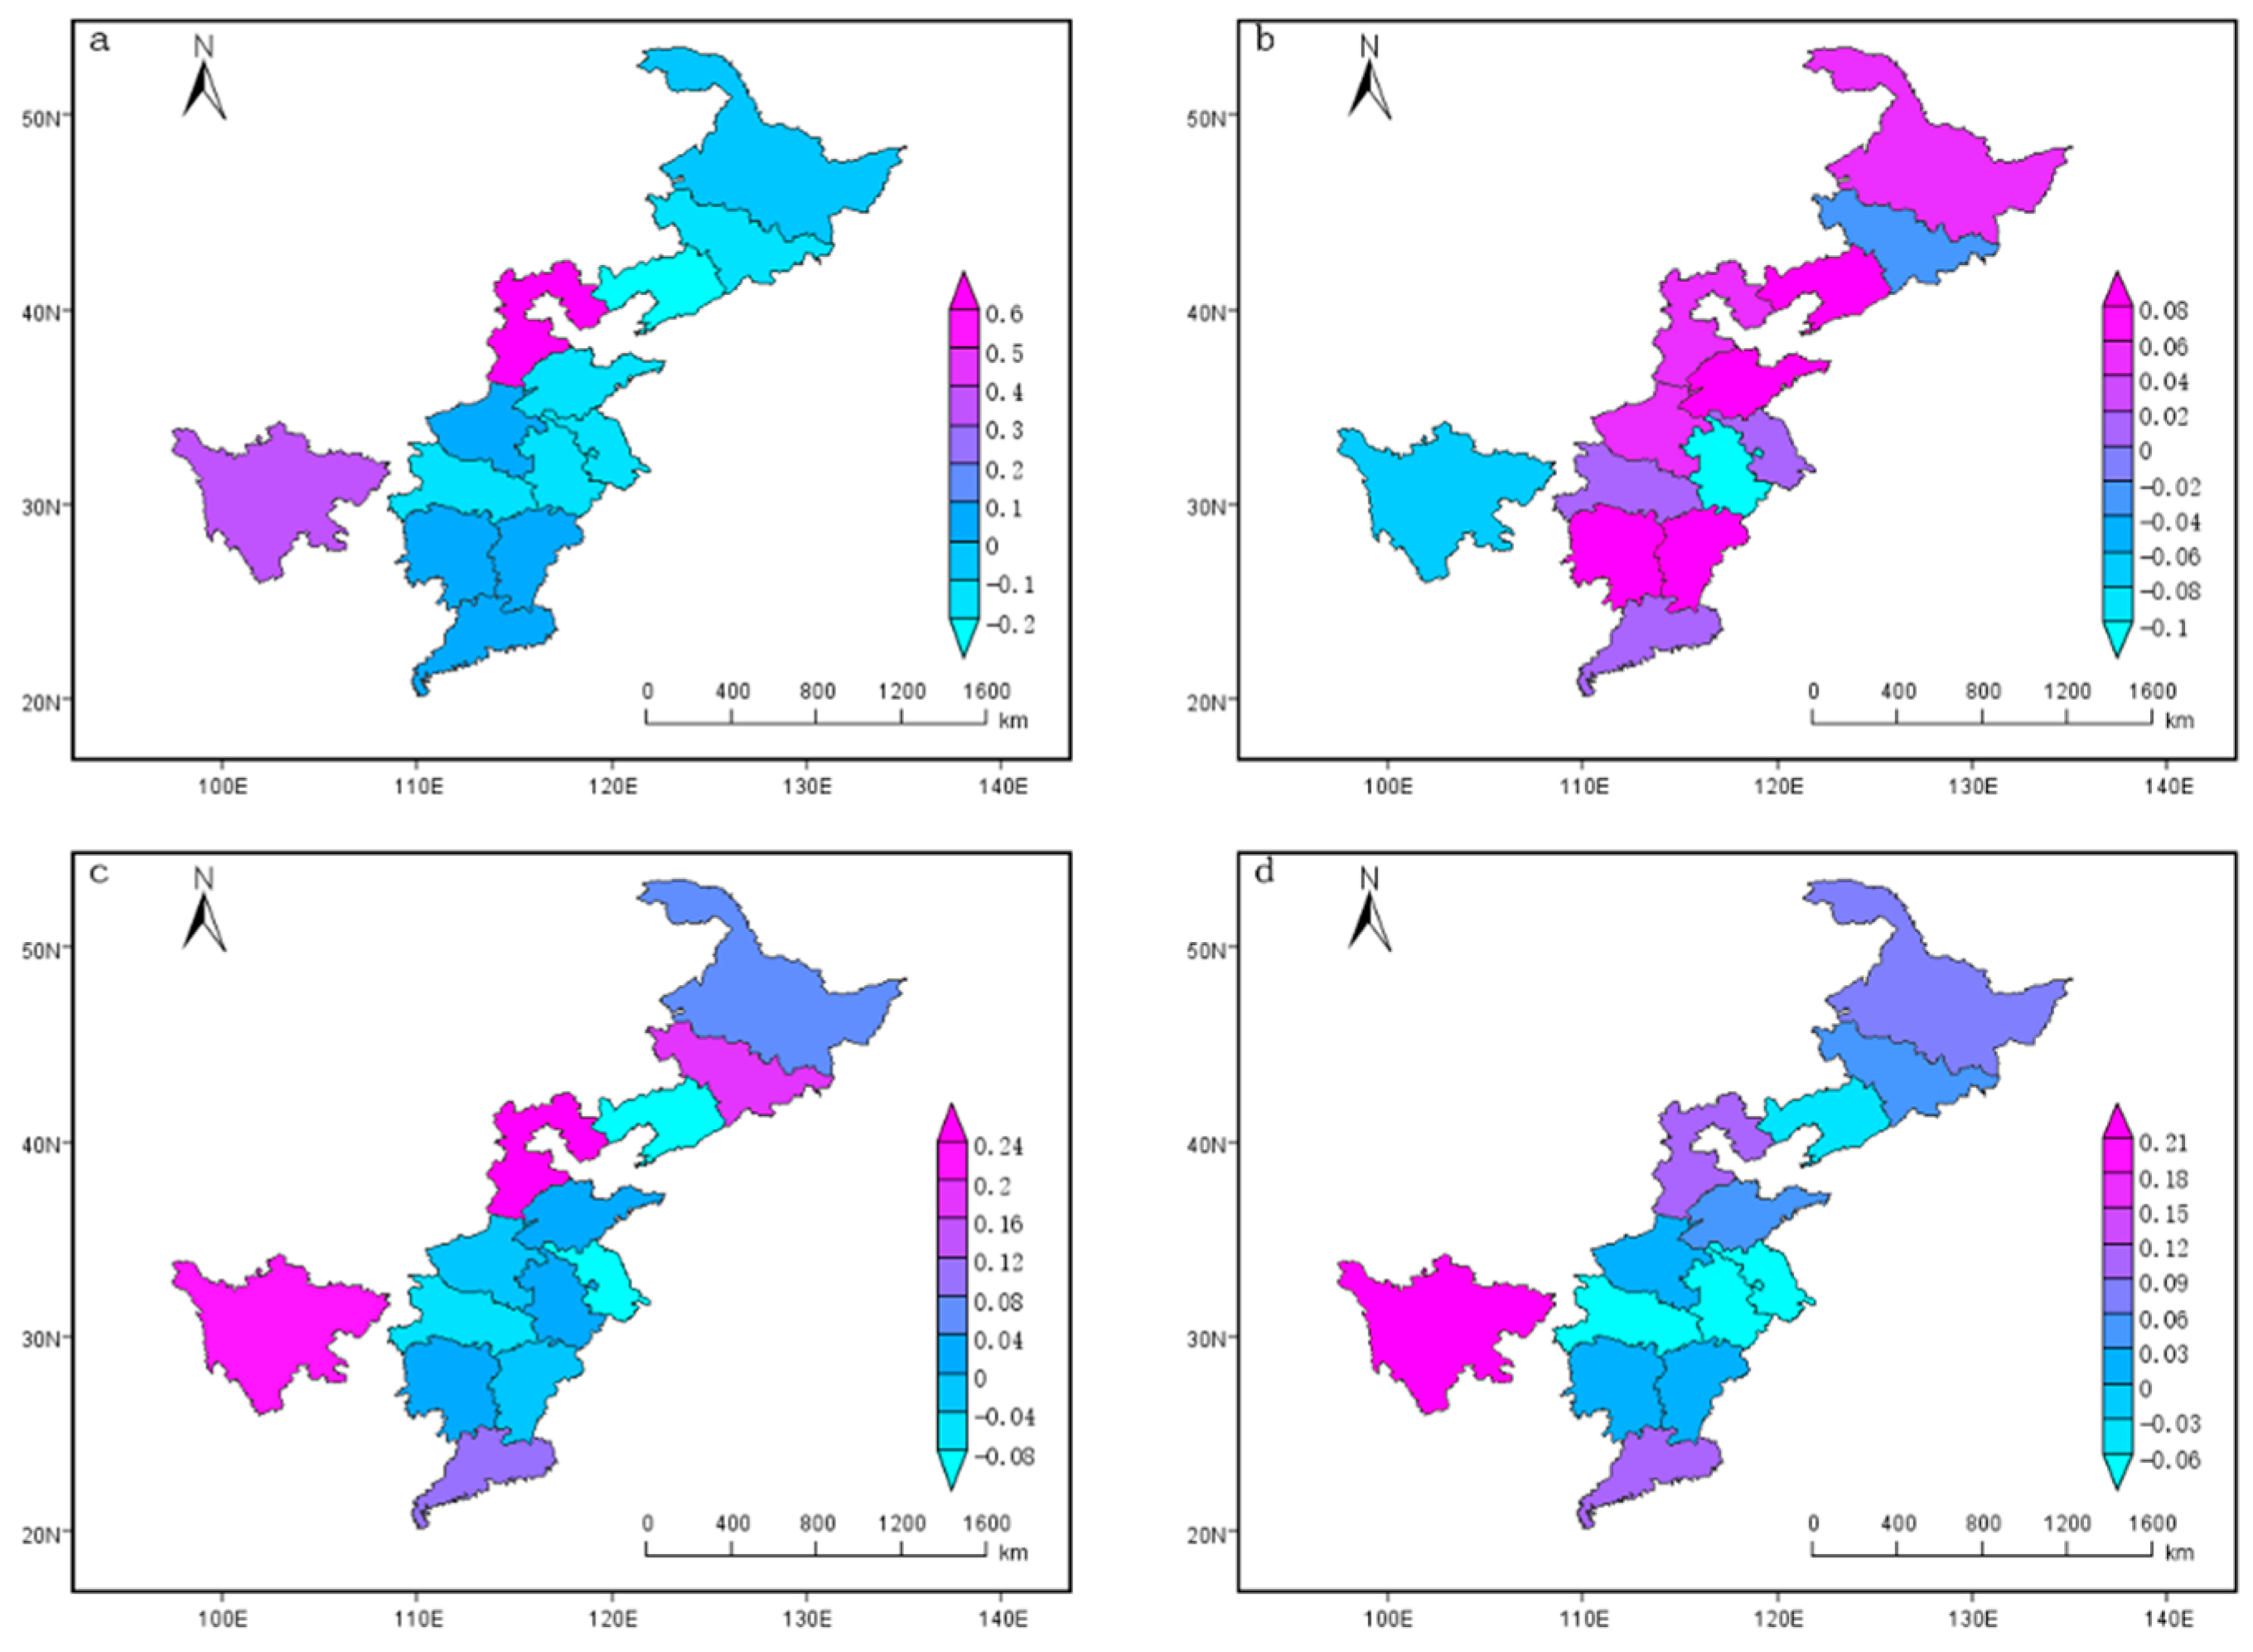
3.2. Regional Sensitivity of Different Crop Yields to Climate Change

The output elasticity of the comprehensive climate factor in the C-D-C model reflects the sensitivity of crop yield to climate change. The larger the absolute value of the output elasticity, the more sensitive the grain yield is to climate change, and vice versa. We introduced agricultural economic factors and a comprehensive climate factor into the C-D-C model to simulate the output elasticity of different input elements in the production process of different crops (Table 2). This was to reveal the contribution of different economic and climatic factors to the variations of yield per unit area of different crops. From the results of the correlation coefficient R 2 of the model in Table 2, it can be seen that the C-D-C model had a relatively good fit when simulating changes in the yields of different crops. Besides, most of the climate output elasticities were relatively small, which may be due to the existence of the statistical data we collected and deviations that we ascertained. Furthermore, the smaller climate impact in the model is due to the fact that we use China’s main grain-producing areas as the research area, and we use large-scale data sets. This data make the significant information interact and cancel each other out through the model, making the result less satisfactory. This is a problem caused by the large-scale big data effect.

3.2.1. The Yield per Hectare for Rice

The climate output elasticities were both positive in the North and South regions, which showed that climate change promoted an increase in rice yield. Moreover, the climate output elasticity of the rice yield in the South region was greater than that in the North region, reflecting that the sensitivity to climate change of rice yield in the South region was stronger than that in the North region.
Under the condition that other factors remained unchanged, for every 10% increase in the CCF, the yield per hectare for rice increased by 0.59% over the North region, and by 1.04% in the South region. Among them, the climate output elasticity of the North region passed the 10% significance level test. The main reason for these changes may be that climate warming has pushed the boundaries of the planting system in the South region northward, expanding the planting area of rice. This was particularly conducive to the increase in rice production observed in Northeast China, such as in Heilongjiang province [50,51].
For non-climatic factors, the rice sown area in the North region had the greatest impact on rice yield and passed the 5% significance level test, followed by agricultural fertilizer. The agricultural fertilizer in the South region had the greatest impact on rice yield and passed the 10% significance level test. Under the condition that other factors remained unchanged, for every 10% increase in the rice sown area, the yield increased by 15.3% in the North region. For every 10% increase in the agricultural fertilizer input, the yield increased by 14.31% in the North region, and by 12.73% in the South region.

3.2.2. The Yield per Hectare for Wheat

The climate output elasticity had a negative value in the South region during the 1981–2015 growing season, but it failed the significance level test. However, the climate output elasticity in the North region was positive and passed the 5% significance level test, and climate change promoted an increase in wheat yield. Under the condition that other factors remained the same, for every 10% increase in the CCF, the yield decreased by 0.07% in the South region, while yield increased by 0.56% in the North region.
Farmers can increase wheat yield by increasing the wheat sown area inputs in the North and South regions and both passed the 5% significance level test. Wheat sown area had the greatest impact on wheat yield. Under the condition that other factors remained unchanged, for every 10% increase in the wheat sown area, the yield increased by 25.34% in the North region, and by 14.33% in the South region.

3.2.3. The Yield per Hectare for Maize

The climate output elasticities both had positive values and both passed the 5% significance level test, which showed that climate change promoted an ensemble increase in maize yield in the North and South regions. In addition, the climate output elasticity of the maize yield in the North region was greater than that in the South region, reflecting that the sensitivity of the maize yield to climate change in the North region was stronger than that in the South region. When other non-climatic factors remained unchanged, for every 10% increase in the CCF, the yield increased by 0.75% in the North region, and by 0.61% in the South region. Maize is a thermophilic crop and has certain temperature and moisture conditions requirements. The positive changes in the CCF in the South region were manifested by increasing temperature and precipitation, which provided sufficient heat and water for maize planting. For the North region, climate warming reduced the impact of low-temperature damage or frost on local maize and thus increased maize production.
Regarding non-climatic factors, the agricultural fertilizer in the North and South region had a significant impact on maize yield and both passed the 10% significance level test. Under the condition that other factors remained unchanged, for every 10% increase in the agricultural fertilizer, the yield increased by 9.77% in the North region, and by 6.06% in the South region.

3.2.4. The Yield per Hectare for Grain

The climate output elasticities of the North and South regions both had positive values and both passed the significance level test, indicating that climate change promoted an ensemble increase in grain yield in the North and South regions. Moreover, the climate output elasticity in the South region was greater than that in the North region, reflecting that the grain yield in the South region was more sensitive to climate change than that in the North region. When other non-climatic factors remained unchanged, for every 10% increase in the CCF, the yield increased by 0.55% in the North region, and by 0.67% in the South region. The main reason for this increase may be that: global warming has improved the heat resources in the North region and reduced the damage caused by agricultural natural disasters (e.g., low temperature and frost damage). Moreover, after the 1990s, gradual improvements in agricultural production, such as the strengthening of agricultural infrastructure construction, increase in agricultural subsidy support policies, and continued agricultural technological development, increased the enthusiasm of farmers to grow food production in the North region. Based on these findings, the total grain yield per unit area in the North region has increased rapidly, particularly in Northeast China. However, the increases in temperature and precipitation in the South region might increase the impact of agricultural natural disasters, such as those caused by high temperature, heat damage, and summer drought. In addition, the rapid development of industry in the South region has reduced the crop planting area, and the rural labor force has been continuously diminishing, which has accelerated the decrease in grain yields in the South region. At the same time, adjustments and upgrades to the agricultural structure have been relatively slow and have not allowed the South region to effectively address climate change, resulting in a slow increase in total grain yields per unit area.
For non-climatic factors, the agricultural fertilizer and total power of agricultural machinery had the greatest impact on the grain yield and passed the 5% or 10% significance level test, indicating that the yield mainly depended on the level of mechanization in the North and South regions. Under the condition that other factors remained unchanged, for every 10% increase in the agricultural fertilizer, the yield increased by 10.99% in the North region, and by 9.95% in the South region. For every 10% increase in the total power of agricultural machinery, the yield increased by 4.85% in the North region, and by 6.54% in the South region.

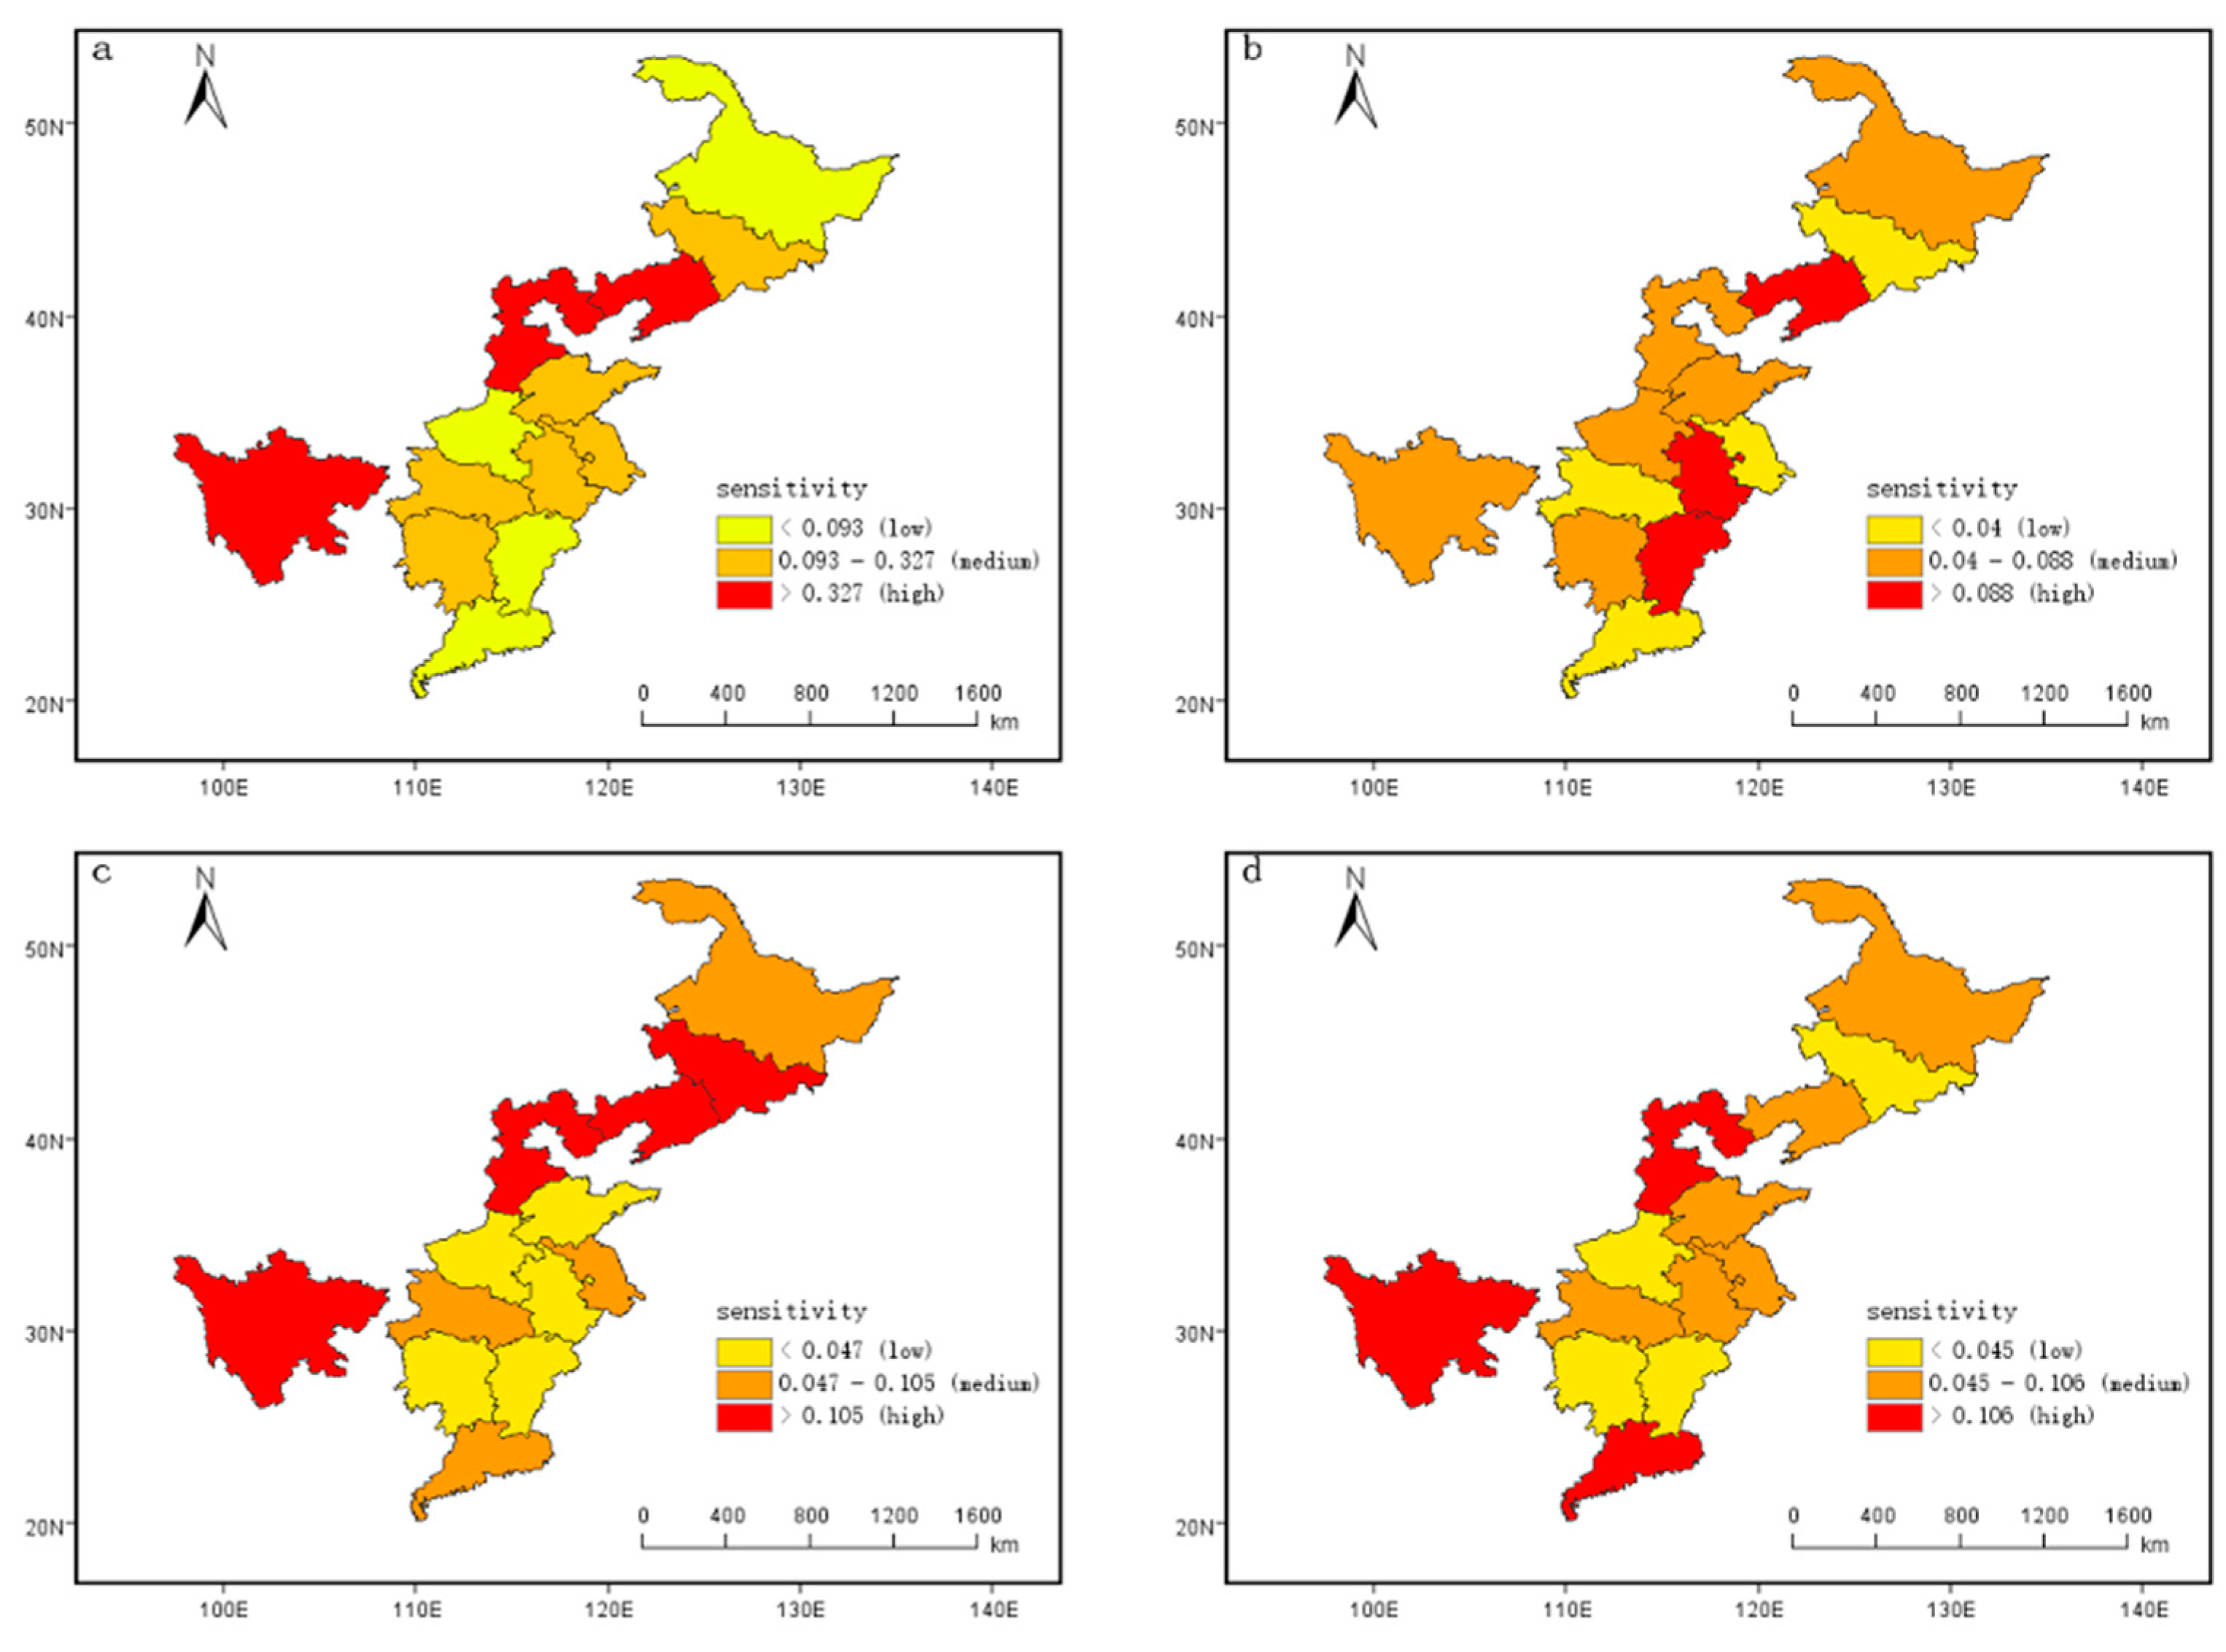
3.3. Division of Economy–Climate Sensitivity Zones

As mentioned above, there were obvious regional differences in the sensitivities of the three main crop yields to climate change in the North and South regions. To further understand the spatial distribution of sensitivities and explore the sensitive zoning of crop yields affected by climate change, provincial administrative regions were taken as the research unit, and the climate output elasticities of 13 provinces in China’s main grain-producing areas were simulated using the C-D-C model. There were obvious differences in the spatial distribution of the climate output elasticity of the three main crop yields (Figure 3).
The climate output elasticity not only considered the comprehensive influence of natural factors and socioeconomic factors but also reflected the relationship between climate change input factors and crop yields from the perspective of food economic benefits. The absolute value reflected the sensitivity of food production to climate change. On the basis of Figure 3, the economy–climate sensitivity zones corresponding to different crops were divided according to the division threshold standards of different crops. The zoning threshold was determined by the climate output elasticity according to the “mean-standard deviation” method [52,53].
For different crops, there were obvious differences in the sensitivity of crop yields to climate change in different regions. High-sensitivity regions for rice yield per unit area included Liaoning Hebei and Sichuan provinces; medium-sensitivity regions included Jilin, Shandong, Anhui, Jiangsu, Hubei and Hunan provinces; low-sensitivity regions included Heilongjiang, Henan, Jiangxi and Guangdong provinces (Figure 4a). The high-sensitivity regions for wheat yield per unit area were Liaoning, Jiangsu and Jiangxi provinces; medium-sensitivity regions were Heilongjiang, Hebei, Shandong, Henan, Hunan and Sichuan provinces; low-sensitivity regions were Jilin, Anhui, Hubei and Guangdong provinces (Figure 4b). The high-sensitivity regions for maize yield per unit area were Jilin, Liaoning, Hebei and Sichuan provinces; medium-sensitivity regions were Heilongjiang, Anhui, Hunan and Guangdong provinces; low-sensitivity regions were Shandong, Henan, Jiangsu, Jiangxi and Hunan provinces (Figure 4c). The high-sensitivity regions of grain yield per unit area were Hebei, Guangdong and Sichuan provinces; medium-sensitivity regions were Heilongjiang, Liaoning, Shandong, Anhui, Jiangsu and Hubei provinces; low-sensitivity regions were Jilin, Henan, Hunan and Jiangxi provinces (Figure 4d).

4. Discussion

Combining economics and climate change science to conduct interdisciplinary scientific research is an important and valuable direction. The 2018 Nobel Prize in Economics was awarded to American economists William D. Nordhaus and Paul M. Romer for their outstanding contribution to innovation, climate, and economic growth. The contributions of Romer and Nordhaus focused on methodology and together provided a basic perspective on the cause and effect of future research on technological innovation and climate change. Although they did not give a conclusive answer to the issue, their research has brought us one step closer to answering the issue of how to achieve sustainable global economic development. As the Royal Swedish Academy of Sciences stated in the press release, at its heart, economics dealt with the management of scarce resources. Nature dictated the main constraints on economic growth and our knowledge determined how well we dealt with these constraints [54]. Studying and exploring China’s food security from the perspective of the intersection of economics and climate change science requires the use of economic theories and natural scientific research methods as tools. Economic research adopts a different method from that of natural science. If we want to combine the scientific research of two different thinking frameworks and conceptual categories, we cannot stick to pure quantitative relationships.
The economy–climate model is a functional relationship in which economic factors and climate factors interact and influence each other. It combines economic theory, economic reality, and climate change research results, and was used to analyze the economic impact of climate change on food production from a cross-field perspective. It also used multiple economic factors and climate factors as explanatory variables to analyze the impact of climate change on food production. On the one hand, we believe that if economic factors and climate factors are equally considered to explain the impact on food production, then, for a sector that can be controlled by humans, the impact of climate is small compared to the economic impact. The economic–climate model is simulated in this way. This is also the case with the research results of this paper. This research was based on the economy–climate model (C-D-C model) that combined climatic and economic factors to analyze their impacts on yields. The simulation results of the model showed that climatic factors had less impact on yield than economic factors. On the other hand, if the effects of climate factors are to be analyzed separately, the quantitative results of their effects will inevitably be relatively large, but this is not in line with reality, because it is impossible to separate the two influencing factors, climate and economy, in actual changes in food production. They interact and influence food production. Based on this, we chose the economy–climate model to analyze the effect of climate change on food production under the combined effect of economic and climatic factors, and how changes in food production respond to changes in climate factors. This is of great significance to the research on the prevention of climate change risks in food production in reality.
Under the co-action and interaction of economic and climatic factors in food production, the contribution of climatic factors is much smaller than that of economic factors. However, in reality, crop growth is closely related to the natural environment and climate change, and it is necessary to analyze the impact of climate change on crop yields. Under the combined action of climatic factors and economic factors, even if the impact of climate change is relatively small, it still exists. According to our research results, we found that there were regional differences in the spatial distribution of crop yields in response to climate change. This is necessary to explore the law of spatial differentiation by distinguishing differences through grade division.
Comparing the conclusions drawn from the model analysis with the results of the literature research, most of the previous studies have conducted independent impact assessments through changes in a single climatic factor or changes in multiple climatic factors. For example, Xiong et al. (2013) [55] inferred that China’s past climate change (temperature and precipitation) had increased the yields for rice by roughly 2.5%, but reduced yields for wheat by about approximately −5%. Lu et al. (2019) [31] found that changes in temperature and precipitation were beneficial to rice production in Northeast China. The output elasticity of temperature was 0.32, and the output elasticity of precipitation was 0.01. The simulated results of the model vary across these studies, mainly depending on the methods of evaluation, data used, areas and periods of assessment, etc. Although the yield and climatic data used in this study are aggregated from province and observation values, which are different from previous studies, our analysis agrees with some of the previous studies. Compared to the yields in 1981–2015, we estimate that comprehensive climate change has a positive impact on the yield of major crops in the North and South regions, but it harms the yield of wheat in the South region, which roughly matches the estimation of Xiong et al. [55] and Lu et al. [31].
There are some issues relating to this work that needed further discussion and improvement. Firstly, the comprehensive climate factor reveals the ensemble information of multiple climatic factors, and the impact of their changes on yield highlights the combined effects of different climatic factors on yield changes. However, we only used the PCA method to construct a linear comprehensive climate factor equation. In the future, we should consider adding higher-order terms of climate factors to PCA analysis to improve the precision and accuracy of CCF [56,57]. Moreover, climate warming will increase the frequency of extreme weather and climate events, and the adverse effects of extreme events on food production will become more obvious—a further climate change factor that should be considered. Crop yields are affected by many factors—agricultural policies, farmers’ behavior, market operation scale, and natural environment, etc. Due to the difficulty in obtaining data for some factors, we did not consider the influences of policy and market scale factors.
Secondly, during the growth and development of crops, April–September was a period of severe climate change, and it was also a common period of growth and development for most crops. For unification and calculation convenience, we uniformly defined April–September as the growing season as the research period. It was necessary and meaningful to analyze the combined impact of climate change from April to September on different crop yields. In addition, mathematically, the input factors in the model must be positive. Economically speaking, climate change factors must be regarded as input factors for food production. The parameter C in the model must be positive. Based on this, the climate change factors we chose were the temperature, precipitation and sunshine hours during the growing season (April–September). Obviously, these three factors all meet the requirements of the model’s mathematical formula and input factors.
At last, the economic–climate model (C-D-C) has limitations and uncertainties. It reveals the relationship between input and output for food production and economic and climatic factors from an economic benefit perspective. Furthermore, it is different to a crop model that explains the causes and mechanisms behind changes in food production from the perspective of crop growth mechanisms [29]. We improved the selection of the climatic factor index (C) in the model and extended the application of the model in the field of climate change impact assessment in China’s main grain-producing areas.

5. Conclusions

We introduced a comprehensive climate factor and agricultural economic factors (i.e., labor, sown area, machinery, fertilizer) into the C-D-C model, quantitatively evaluated the sensitivity of yields for rice, wheat, maize, and grain according to the CCF and economic factors, and used CCF to divide the economy–climate sensitivity zones. The results showed that under the background of climate change, the CCF trend for the North region was negative and a weak positive trend in the CCF was observed for the South region. Therefore, the impacts of climate change and economic factors on yields had obvious regional differences. The main conclusions are as follows:
(1)
Climate change promoted an ensemble increase in grain yield in the North and South regions, but the sensitivities of different crop yields to climate change were different. Climate change was conducive to an increase in the yields for rice and maize in the North and South regions. Among them, the sensitivity of the yield for maize in the North region to climate change was stronger than that in the South region, while the sensitivity of the yield for rice in the South region was stronger.
(2)
The sensitivities of yields in different regions to climate change had differences in crop varieties. In the North region, climate change increased the yields for the three main crops. Maize yield had the highest sensitivity to the effects of climate change. In the South region, climate change led to increases in the yields for rice and maize, and the rice yield was more sensitive to climate change.
(3)
Climate change factors are the main constraints for food production, but they have a relatively little impact on yields, and other economic factors account for a large proportion.
(4)
Although climate change has little impact on crop yields, it is indispensable. Therefore, under the constraints of other economic factors, to focus on the research on the impact of climate change factors, we can divide the main grain-producing areas into sensitive regions for climate change response according to the output elasticity of climate factor changes.
(5)
According to the climate output elasticity for each province, they were divided into three levels of economy–climate sensitivity zones (i.e., high, medium and low sensitivity). Among them, high-sensitivity regions to climate change in terms of the grain yield were located in Hebei, Guangdong and Sichuan provinces. High-sensitivity regions in terms of rice yield were Liaoning, Hebei and Sichuan provinces. High-sensitivity regions in terms of wheat yield were Liaoning, Jiangsu and Jiangxi provinces. High-sensitivity regions in terms of maize yield were Jilin, Liaoning, Hebei and Sichuan provinces.
According to the above research results, to better adapt to future climate change and reduce climate change risks on grain production in China’s main grain-producing areas, the construction of the climate information forecasting and prevention system needs to be strengthened. Only in this way can it help farmers take effective defensive measures to mitigate the adverse effects of climate change. The construction of agricultural infrastructure needs to be strengthened so that the ability of agriculture to address climate change and the levels of disaster reduction and prevention can be continuously improved. According to the regional differences in the sensitivity of crop yields to the impacts of climate change, the planting structure and layout of crops and improved planting varieties need to be reasonably adjusted to adapt to climate change and increase yields. In addition, in the context of this new period and era, if China wants to embark on a road to establishing food security in its own way, it must strictly observe the protection of 120 million hectares of cultivated land to steadily improve the capacity of main crop production.

Author Contributions

Methodology, software, conceptualization, writing—original draft preparation, Y.X.; investigation and data curation, F.Y. and M.S.; formal analysis, W.Z. and J.L.; validation, resources, writing—review and editing, supervision, project administration, and funding acquisition, J.C. All authors have read and agreed to the published version of the manuscript.

Funding

This research was funded by the National Key Research and Development Program of China, grant number 2018YFC1509003, and 2016YFA0602703; the National Natural Science Foundation of China (42075167).

Acknowledgments

The authors are thankful to the anonymous reviewers for the constructive comments.

Conflicts of Interest

The authors declare no conflict of interest.

Appendix A

Table A1. Comprehensive climate factor values (dimensionless) of the 13 provinces in China’s main grain-producing areas (1981–2015 growing season).
YearHeilongjiangJilinLiaoningHebeiShandongHenanAnhuiJiangsuJiangxiHubeiHunanGuangdongSichuan
1981 297.08299.71301.19359.20336.06249.64343.94342.07277.56259.56268.73467.87263.76
1982 294.56296.46299.97358.10334.27260.39346.26342.37278.37274.58276.95415.17259.02
1983 298.45301.89304.38354.93332.19258.80352.19344.89292.71283.01277.38414.06260.21
1984 298.12298.81303.06355.29333.52265.13348.83344.81287.14267.36271.26453.40262.05
1985 297.53301.80309.78352.82339.82255.35343.87344.86273.40264.71264.18433.12262.42
1986 294.76303.05305.23363.56342.02247.07344.19344.92272.21266.01269.55425.46256.63
1987 296.83300.34302.66364.11343.14253.14349.23347.48276.89272.49273.26415.47260.94
1988 297.55298.76302.61354.07338.58251.33343.23340.99279.55266.80275.78413.48259.90
1989 294.01298.33298.20356.52321.55253.86347.56343.89284.53276.38275.01394.15260.55
1990 297.96301.57305.20354.59356.44256.24344.68348.41277.70264.92270.93390.35261.34
1991 298.13299.75303.08359.04335.86254.80357.29354.28268.63276.00269.98366.07259.67
1992 295.22298.96300.42351.82336.02252.09340.73341.93277.32261.29269.45440.80257.03
1993 297.46298.36301.16352.22335.23250.66344.64344.22289.30268.80281.88500.13260.42
1994 298.93303.08307.99362.38349.26253.83342.96340.43293.29264.71284.04484.78253.46
1995 294.33301.16306.95353.36342.94254.58345.19341.80293.38267.97280.30421.16258.22
1996 296.33299.20304.57350.18330.29259.60348.71343.21280.25276.36279.86415.91256.61
1997 296.49297.57300.24354.16346.94244.56342.16340.88290.97260.97274.62495.14254.37
1998 299.61303.65306.94350.89338.88264.75349.97346.87289.64278.99281.16427.31266.38
1999 293.50297.29299.37348.90334.87250.85349.93344.30303.12270.29293.04405.31261.96
2000 295.39299.47299.04355.33334.32265.39346.17345.69278.27269.57273.21427.03260.59
2001 292.93297.64301.85352.80338.94246.82339.33340.74279.48254.89269.55555.05260.36
2002 296.32298.81299.26342.99328.64254.74347.12341.84294.28272.63293.55443.96256.11
2003 298.87299.49302.81340.06325.59265.59349.61346.54274.71271.92272.50403.73262.14
2004 294.13298.22303.67350.11342.31260.73345.97341.88278.49272.36278.00378.18259.65
2005 297.38304.42306.48351.31337.67262.67349.34348.78281.30272.12270.34460.14260.95
2006 296.36298.95302.47340.15327.16256.98346.14346.00287.31262.09274.17477.58252.30
2007 293.38299.08302.65347.93333.34259.25347.02347.45272.85271.24273.10416.63257.80
2008 295.52300.50303.78343.50327.37259.35347.67345.34278.15273.56271.36511.67259.22
2009 297.72298.03300.45352.95329.20256.82346.35345.97273.89267.53270.04407.56259.06
2010 296.16304.36308.87345.52325.77264.11347.44344.58297.35276.07287.26465.04261.06
2011 295.10297.95303.06349.26326.14254.76346.26346.70274.06262.83263.23368.39255.32
2012 298.99302.54306.76352.27329.93254.09346.05342.75291.84265.53281.12417.68263.03
2013 300.19302.59304.48345.39339.38252.31347.29343.30275.67272.24273.68483.35262.74
2014 298.72298.62298.99344.06325.34256.69347.35345.89289.18268.71279.68431.76262.25
2015 297.74299.37300.29347.19328.61255.74349.10351.57293.25268.62279.57436.99261.10

References

  1. Jianping, H.; Yuhong, Y.; Shaowu, W.; Jifen, C. An analogue-dynamical long-range numerical weather prediction system incorporating historical evolution. Q. J. R. Meteorol. Soc. 1993, 119, 547–565. [Google Scholar] [CrossRef]
  2. FAO. The Future of Food and Agriculture: Alternative Pathways to 2050; Food and Agriculture Organization of the United Nations: Rome, Italy, 2018; 228p, Available online: http://www.fao.org/3/CA1553EN/ca1553en.pdf (accessed on 27 January 2021).
  3. Mbow, C.; Rosenzweig, C.; Barioni, L.G.; Benton, T.G.; Herrero, M.; Krishnapillai, M.; Liwenga, E.; Pradhan, P.; Rivera-Ferre, M.G.; Sapkota, T.; et al. Food Security. In Climate Change and Land: An IPCC Special Report on Climate Change, Desertification, Land Degradation, Sustainable Land Management, Food Security, and Greenhouse Gas Fluxes in Terrestrial Ecosystems; IPCC: Geneva, Switzerland, 2019. [Google Scholar]
  4. Tao, F.; Zhang, Z.; Xiao, D.; Zhang, S.; Rötter, R.P.; Shi, W.; Zhang, H. Responses of wheat growth and yield to climate change in different climate zones of China, 1981–2009. Agric. For. Meteorol. 2014, 189, 91–104. [Google Scholar] [CrossRef]
  5. Liu, Y.; Chen, Q.; Ge, Q.; Dai, J.; Qin, Y.; Dai, L.; Chen, J. Modelling the impacts of climate change and crop management on phenological trends of spring and winter wheat in China. Agric. For. Meteorol. 2018, 248, 518–526. [Google Scholar] [CrossRef]
  6. Battisti, D.S.; Naylor, R.L. Historical Warnings of Future Food Insecurity with Unprecedented Seasonal Heat. Science 2009, 323, 240–244. [Google Scholar] [CrossRef] [Green Version]
  7. Hussain, A.; Rasul, G.; Mahapatra, B.; Tuladhar, S. Household food security in the face of climate change in the Hindu-Kush Himalayan region. Food Secur. 2016, 8, 921–937. [Google Scholar] [CrossRef] [Green Version]
  8. Piao, S.; Ciais, P.; Huang, Y.; Shen, Z.; Peng, S.; Li, J.; Fang, J. The impacts of climate change on water resources and agriculture in China. Nature 2010, 467, 43–51. [Google Scholar] [CrossRef]
  9. Masson-Delmotte, V.; Zhai, P.; Pörtner, H.-O.; Roberts, D.; Skea, J.; Shukla, P.R.; Pirani, A.; Moufouma-Okia, W.; Péan, C.; Pidcock, R.; et al. Summary for Policymakers. In Global Warming of 1.5 °C an IPCC Special Report on the Impacts of Global Warming of 1.5 °C Above Pre-Industrial Levels and Related Global Greenhouse Gas Emission Pathways, in the Context of Strengthening the Global Response to the Threat of Climate Change; IPCC: Geneva, Switzerland, 2018. [Google Scholar]
  10. Farbotko, C.; Lazrus, H. The first climate refugees? Contesting global narratives of climate change in Tuvalu. Glob. Environ. Chang. Hum. Policy Dimens. 2012, 22, 382–390. [Google Scholar] [CrossRef] [Green Version]
  11. Iizumi, T.; Shiogama, H.; Imada, Y.; Hanasaki, N.; Takikawa, H.; Nishimori, M. Crop production losses associated with anthropogenic climate change for 1981-2010 compared with preindustrial levels. Int. J. Climatol. 2018, 38, 5405–5417. [Google Scholar] [CrossRef] [Green Version]
  12. Wu, S.H.; Gao, J.B.; Deng, H.Y.; Liu, L.L.; Pan, T. Climate change risk and methodology for its quantitative assessment. Prog. Geogr. 2018, 37, 28–35. [Google Scholar]
  13. Impacts, adaptation, and vulnerability. Part a: Global and sectoral aspects. In Field Contribution of Working Group II to the Fifth Assessment Report of the Intergovernmental Panel on Climate Change; Field, C.B.; Barros, V.R.; Dokken, D.J.; Mach, K.J.; Mastrandrea, M.D.; Bilir, T.E.; Chatterjee, M.; Ebi, K.L.; Estrada, Y.O.; Genova, R.C.; et al. (Eds.) IPCC: Geneva, Switzerland; Cambridge University Press: Cambridge, UK, 2014. [Google Scholar]
  14. Dong, Z.Q.; Pan, Z.; An, P.; Zhang, J.T.; Zhang, J.; Pan, Y.; Huang, L.; Zhao, H.; Han, G.; Wu, D.; et al. A quantitative method for risk assessment of agriculture due to climate change. Theor. Appl. Climatol. 2018, 131, 653–659. [Google Scholar] [CrossRef]
  15. Rosenzweig, C.; Tubiello, F.N. Effects of changes in minimum and maximum temperature on wheat yields in the central US—A simulation study. Agric. For. Meteorol. 1996, 80, 215–230. [Google Scholar] [CrossRef]
  16. Araya, A.; Hoogenboom, G.; Luedeling, E.; Hadgu, M.K.; Kisekka, I.; Martorano, G.L. Assessment of maize growth and yield using crop models under present and future climate in southwestern Ethiopia. Agric. For. Meteorol. 2015, 214, 252–265. [Google Scholar] [CrossRef]
  17. Saddique, Q.; Khan, M.I.; Habib ur Rahman, M.; Jiatun, X.; Waseem, M.; Gaiser, T.; Mohsin Waqas, M.; Ahmad, I.; Chong, L.; Cai, H. Effects of Elevated Air Temperature and CO2 on Maize Production and Water Use Efficiency under Future Climate Change Scenarios in Shaanxi Province, China. Atmosphere 2020, 11, 843. [Google Scholar] [CrossRef]
  18. Mendelsohn, R.; Nordhaus, W.; Shaw, D. Climate impacts on aggregate farm value: Accounting for adaptation. Agric. For. Meteorol. 1996, 80, 55–66. [Google Scholar] [CrossRef]
  19. Liu, H.; Li, X.B.; Fischer, G.; Sun, L.X. Study on the impacts of climate change on China’s agriculture. Clim. Chang. 2004, 65, 125–148. [Google Scholar] [CrossRef]
  20. Gbetibouo, G.A.; Hassan, R.M. Measuring the economic impact of climate change on major South African field crops: A Ricardian approach. Glob. Planet. Chang. 2005, 47, 143–152. [Google Scholar] [CrossRef]
  21. Huang, D.L.; Li, X.M.; Ju, S.P. Research on the Impact of Climate Change on China’s Food Production, Consumption and Economic Growth——Based on China’s Agricultural General Equilibrium Model. Chin. Agric. Sci. Bull. 2016, 32, 165–176. [Google Scholar]
  22. Wang, F.T. Lecture Seven, Forecast of Agricultural Meteorological Output (Part 1). Meteorological 1986, 10, 5. [Google Scholar]
  23. Fang, X.Q.; Wang, Y.; Xu, T.; Yun, Y.R. Contribution of Climate Warming to Rice Yield in Heilongjiang Province. Acta Geogr. Sin. 2004, 59, 820–828. [Google Scholar]
  24. Fang, S.B. Exploration of method for discrimination between trend crop yield and climatic fluctuant yield. J. Nat. Disasters 2011, 20, 13–18. [Google Scholar]
  25. Chou, J.M.; Feng, G.L.; Dong, W.J.; Ye, D.Z.; Chen, H.Z. A New Approach the Economy Evaluation of Influence on CHina Agriculture by Climate Change. Clim. Environ. Res. 2004, 9, 361–368. [Google Scholar]
  26. Zhou, G.S. Research Prospect on Impact of Climate Change on Agricultural Production in China. Meteorol. Environ. Sci. 2015, 38, 15. [Google Scholar] [CrossRef]
  27. Chou, J.M.; Ye, D.Z. Assessing the Effect of Climate Changes on Grains yields with a New Economy-Climate model. Chin. Sci. Bull. 2006, 11, 347–353. [Google Scholar] [CrossRef]
  28. Dong, W.J.; Chou, J.M.; Feng, G.L. A new economic assessment index for the impact of climate change on grain yield. Adv. Atmos. Sci. 2007, 24, 336–342. [Google Scholar] [CrossRef]
  29. Yuqing, F.; Jieming, C.; Wenjie, D. Impact and its assessment methods of climate change on the economic system of China. Adv. Meteorol. Sci. Technol. 2013, 2, 8. [Google Scholar] [CrossRef]
  30. Zhou, S.D.; Zhou, W.K.; Zhu, H.G.; Wang, C.X.; Wang, Y. Impact of Climate Change on Agriculture and its Countermeasures. J. Najing Agric. Univ. (Soc. Sci. Ed.) 2010, 10, 6. [Google Scholar] [CrossRef]
  31. Lu, S.B.; Bai, X.; Li, W.; Wang, N. Impacts of climate change on water resources and grain production. Technol. Forecast. Soc. Chang. 2019, 143, 76–84. [Google Scholar] [CrossRef]
  32. Sun, M.Y.; Chou, J.M.; Xu, Y.; Yang, F.; Li, J.N. Study on the thresholds of grain production risk from climate change in China’s main grain-producing areas. Phys. Chem. Earthparts A/B/C 2020, 116, 102837. [Google Scholar] [CrossRef]
  33. Chen, H.Z.; Zhu, D.F. Overview of Global Rice Production and Rice Farming Ecosystem. Hybrid Rice 2003, 18, 1–4. [Google Scholar]
  34. Zhao, G.C.; Chang, X.H.; Wang, D.M.; Tao, Z.Q.; Wang, Y.J.; Yang, Y.S.; Zhu, Y.J. General Situation and Development of Wheat Production. Gen. Situat. Dev. Wheat Prod. 2018, 4, 7. [Google Scholar] [CrossRef]
  35. Xiong, W.; Yang, J.; Wu, W.; Huang, D.; Cao, Y. Sensitivity and vulnerability of China’s rice production to observed climate change. Acta Ecol. Sin. 2013, 33, 509–518. [Google Scholar] [CrossRef]
  36. Peng, S. Reflection on China’s Rice Production Strategies during the Transition Period. Sci. Sin. Vitae 2014, 44, 845–850. [Google Scholar] [CrossRef]
  37. Liu, Y.S.; Zhai, R.X. Spatial-temporal Pattern Changes and Optimal Strategy of Grain Production in China since 1990s. Areal Res. Dev. 2009, 28, 6. [Google Scholar] [CrossRef]
  38. Han, R.; Zheng, D.; Dai, E.; Wu, S.; Zhao, M. Response of Production Potential to Climate Fluctuation in Major Grain Regions of China. Resour. Sci. 2014, 36, 2611–2623. [Google Scholar]
  39. Chou, J.M.; Xu, Y.; Dong, W.J.; Xian, T.; Wang, Z. Research on the variation characteristics of climatic elements from April to September in China’s main grain-producing areas. Theor. Appl. Climatol. 2019, 137, 3197–3207. [Google Scholar] [CrossRef] [Green Version]
  40. Chou, J.M.; Xu, Y.; Dong, W.J.; Xian, T.; Xu, H.; Wang, Z. Comprehensive climate factor characteristics and quantitative analysis of their impacts on grain yields in China’s grain-producing areas. Heliyon 2019, 5, 11. [Google Scholar] [CrossRef] [Green Version]
  41. Brunetti, M.; Maugeri, M.; Monti, F.; Nannia, T. Temperature and precipitation variability in Italy in the last two centuries from homogenised instrumental time series. Int. J. Climatol. 2006, 26, 345–381. [Google Scholar] [CrossRef]
  42. Wei, F.Y. Modern Climate Statistics Diagnosis and Prediction Technology, 2nd ed.; Meteorological Press: Hong Kong, China, 2007. [Google Scholar]
  43. Zhao, H.X. Brief Analysis of Principal Component Analysis Method. Sci. Technol. Inf. 2009, 2, 1. [Google Scholar] [CrossRef]
  44. Huang, J.Y. Meteorological Statistical Analysis and Forecasting Methods, 3rd ed.; Meteorological Press: Beijing, China, 2014. [Google Scholar]
  45. Yin, P.H.; Fang, X.Q.; Zhang, X.Z.; Qi, F.Q. Identification of the Susceptible Regions to Climate Change Impact on Grain Yield per Unit Area in China. Acta Geograph. Sin. 2010, 65, 515–524. [Google Scholar]
  46. Huang, W.; Deng, X.Z.; He, S.J.; Lin, Y.Z. An Econometric Analysis on the Impacts of Climatic Change on Grain Production at Counties of China. Prog. Geogr. 2010, 29, 677–683. [Google Scholar]
  47. Ma, Z.; Fu, C. Basic facts of drought in northern China from 1951 to 2004. Chin. Sci. Bull. 2006, 51, 2429–2439. [Google Scholar] [CrossRef]
  48. Osborne, T.M.; Wheeler, T.R. Evidence for a climate signal in trends of global crop yield variability over the past 50 years. Environ. Res. Lett. 2013, 8, 9. [Google Scholar] [CrossRef]
  49. Ray, D.K.; Gerber, J.S.; MacDonald, G.K.; West, P.C. Climate variation explains a third of global crop yield variability. Nat. Commun. 2015, 6, 9. [Google Scholar] [CrossRef] [PubMed] [Green Version]
  50. Quan, C.; Jing, Y.; Tan, K. Progress in Research of Impacts of Climate Change on Yield of Three Major Grain Crops. Chin. Agric. Sci. Bull. 2013, 29, 361–367. [Google Scholar]
  51. Wang, P.; Zhang, Z.; Song, X.; Chen, Y.; Wei, X.; Shi, P.J.; Tao, F.L. Temperature variations and rice yields in China: Historical contributions and future trends. Clim. Chang. 2014, 124, 777–789. [Google Scholar] [CrossRef]
  52. Chen, S.L.; Wang, T.X. A comparative study on the equidistant method and the mean standard deviation method in defining urban heat islands. J. Geo-Inf. Sci. 2012, 11, 145–150. [Google Scholar]
  53. Peng, J.H.; Yang, M.; Lu, Q.; Hu, S.A. Maize drought grade division and meteorological yield evaluation method. Environ. Sci. Technol. 2012, s2, 3. [Google Scholar]
  54. The Sveriges Riksbank Prize in Economic Sciences in Memory of Alfred Nobel 2018. Available online: https://www.nobelprize.org/prizes/economic-sciences/2018/prize-announcement/ (accessed on 27 January 2021).
  55. Xiong, W.; Holman, I.P.; You, L.Z.; Yang, J.; Wu, W.B. Impacts of observed growing-season warming trends since 1980 on crop yields in China. Reg Environ. Chang. 2014, 14, 7–16. [Google Scholar] [CrossRef]
  56. Gammans, M.; Mérel, P.; Ortizbobea, A. Negative impacts of climate change on cereal yields: Statistical evidence from France. Environ. Res. Lett. 2017, 12, 054007. [Google Scholar] [CrossRef]
  57. Schlenker, W.; Roberts, M.J. Nonlinear temperature effects indicate severe damages to U.S. crop yields under climate change. Proc. Natl. Acad. Sci. USA 2009, 106, 15594–15598. [Google Scholar] [CrossRef] [Green Version]
Figure 1. Distribution of annual average grain concentration (a) and main grain-producing areas in China (b). (a) Green bars indicate that the grain concentration is more than 1.0%, and blue bars indicate that the grain concentration is less than 1.0% [40]. (b) The light yellow areas belong to the North region, and the blue areas belong to the South region.
Atmosphere 12 00172 g001
Figure 2. Anomalous variations of different climatic factors in the North and South regions during the growing season from 1981 to 2015. CCF is the comprehensive climate factor, T is the mean temperature, and P is the precipitation, S is the sunshine hours. The red dashed line is a linear trend line.
Atmosphere 12 00172 g002
Figure 3. Climate output elasticities of different crop yields in China’s main grain-producing areas (1981–2015 growing season). (ad) The spatial distribution of the climatic output elasticity of rice, wheat, maize and total grain per unit area in provinces, respectively.
Atmosphere 12 00172 g003
Figure 4. Economy–climate sensitivity zone divisions of different crop yields in China’s main grain-producing areas (1981–2015 growing season). (ad) The changes in the yields per hectare for rice, wheat, maize and grain to changes in comprehensive climate factor from 1981 to 2015 in China’s main grain-producing areas. Low, medium, and high refer to the degree to which the sensitivity of yield changes to climate change are low, medium, and high.
Atmosphere 12 00172 g004
Table 1. Comprehensive climatic factor equations by principal component analysis (PCA) for China’s grain-producing areas (1981–2015 growing season).
AreaV1%V2%Comprehensive Climate Factor Equation
Northeast China85.3\C = 1.037 × T + 0.123 × P − 0.053 × S
North China74.025.9C = 0.820 × T + 0.220 × P + 0.400 × S
East China99.87\C = 1.054 × T + 0.173 × P + 0.057 × S
South China95.4\C = −0.044 × T + 1.468 × P + 0.649 × S
Central China79.120.9C = 0.820 × T + 0.250 × P − 0.050 × S
Southwest China77.422.5C = 0.800 × T + 0.270 × P − 0.040 × S
V1% and V2% represent the variance contribution rates of the principal components. The variance ratios of the first principal component in Northeast China, East China and South China exceed 85%, and only the first principal component is needed to construct the regional comprehensive climate factor (CCF). The cumulative variance ratios of the first two principal components in the remaining areas exceed 85%, and the first two principal components are weighted to construct the regional CCF. T, P, S, C are the mean temperature (unit: K), precipitation (unit: mm), sunshine hours (unit: hour) and comprehensive climate factor (dimensionless). Northeast China includes Heilongjiang, Liaoning, and Jilin provinces; North China includes Hebei, Shanxi, and Shandong provinces; East China includes Jiangsu, Zhejiang, and Anhui provinces; South China includes Guangdong and Fujian provinces; Central China includes Henan, Hubei, Hunan, and Jiangxi provinces; Southwest China includes Sichuan, Yunnan, Chongqin, Guizhou provinces, and Guangxi Zhuang Autonomous Region.
Table 2. Output elasticities corresponding to various input factors of different crop yields simulated based on the economy–climate (C-D-C) model.
Output ElasticityGrain YieldRice YieldWheat YieldMaize Yield
North RegionSouth RegionNorth RegionSouth RegionNorth RegionSouth RegionNorth RegionSouth Region
β 1 0.412 *0.344 *1.1010.801 *1.2690.765 *0.7 *0.725 *
β 2 0.275 *0.207 *1.53 **0.448 *2.534 *1.433 *0.7650.709
β 3 1.099 **0.995 **1.431 ***1.273 *1.3611.429 *0.977 *0.606 *
β 4 0.4850.654 *1.1140.742 *1.5080.9790.646 **0.333 *
β 5 −0.205 **−0.118 *−0.244−0.091−0.172−0.173−0.307 *−0.091
γ0.055 **0.067 **0.059 *0.1040.056 *−0.0070.075 **0.061 **
R 2 0.970.9520.8270.9310.9130.9160.8920.928
Yield refers to the per unit area yield. β 1 is the output elasticity of rural labor per unit area, β 2 is the output elasticity of the sown area of crop, β 3 is the output elasticity of agricultural fertilizer per unit area, β 4 is the output elasticity of total power of agricultural machinery per unit area, β 5 is the output elasticity of disaster area, γ is the output elasticity of comprehensive climate factor, and R 2 is the correlation coefficient. ***, **, and *, respectively, show that the impact is significant at the levels of 1%, 5%, and 10%.
Publisher’s Note: MDPI stays neutral with regard to jurisdictional claims in published maps and institutional affiliations.

