Abstract
We investigated the effects of wet deposition on secondary inorganic aerosols (SIAs) in urban areas by coupling the wet deposition module with the three-dimensional computational fluid dynamics atmospheric chemistry model (CFD-Chem). We developed a wet deposition model for the microscale model by improving on the global modeling initiative scheme. We evaluated the model by comparing it to the observed washout ratio from the total wet deposition. The simulated washout ratio calculated using the wet scavenging coefficient (WSC) based on the theoretical calculation is six times lower than that observed, suggesting that the wet deposition amount of SIAs from below-cloud scavenging might be underestimated. When we applied the WSC based on field measurements, the washout ratio was much improved; however, it was slightly overestimated compared to the observed rate. Therefore, we estimated the optimal WSC for SIAs in the urban area using a linear regression approach. We conducted a model using the wet deposition of SIAs in a megacity to understand the effects of wet deposition on the SIA concentration using estimated optimal WSCs. The simulated results indicate that washout processes decrease the surface aerosol concentration, showing that reductions in the average surface concentrations from washout processes were from 7.1% to 11.2%. The simulation results suggest that washout processes can reduce the particulate matter concentration in urban areas, indicating that washout processes should be considered in the microscale model, although the modeling domain can only simulate washout processes.
1. Introduction
Particulate matter (PM) with a diameter of 1 micron or less (PM1) in urban areas is a serious issue because of its negative effects on the human respiratory system and the reduction of atmospheric visibility [1]. Secondary inorganic aerosols (SIAs), including sulfate, nitrate, and ammonium, are major components of PM1 [2,3,4]. Moreover, SIAs make up 30% of the total PM1 on clean days, which increases to more than 50% on severely polluted days in urban areas [5,6]. Therefore, understanding and examining SIAs are essential for human health and atmospheric environments, especially in contaminated metropolitan areas.
The SIAs are removed using two deposition processes: dry and wet deposition. Previous studies have reported that SIA’s wet deposition fluxes are higher than those of dry deposition in Japan, the USA, and Europe due to their high water solubility [7,8,9]. Therefore, wet deposition processes are essential for understanding the fate of SIAs.
The computational fluid dynamics (CFD) model is widely used to examine pollutant concentrations in urban areas because it can simulate turbulence from the complex structures of buildings and the dispersion of pollutants following the turbulence. Early studies using CFD models focused on atmospheric flows and the transport of passive pollutants [10,11,12,13]. However, recent studies have been extended to analyze the reactive aerosol behavior, including SIA behavior, using the coupled CFD-chemistry (CFD-Chem) model [14,15]. However, no study has considered wet deposition processes in CFD modeling due to the limitations in fine-scale modeling. The domain size of fine-scale modeling generally does not include the height of the cloud base. Therefore, the CFD model cannot simulate the cloud amount and precipitation rate, resulting in the absence of hydroprocesses, including wet deposition processes. State-of-the-art studies of urban air quality based on CFD modeling have only focused on clear days. However, global- and regional-scale chemical transport models include wet deposition processes to determine the SIA level [3,16]. Therefore, wet deposition processes should be included in the model to examine SIA concentrations properly in urban areas.
Therefore, this study aims to develop the capability of the coupled CFD-chemistry model to account for wet deposition processes in its analysis. Then, we applied our model to realistic cases to examine the effect of wet deposition on SIA in urban areas.
2. Model Description
2.1. General Model Description
We use the CFD-Chem model, which was based on the work by Kim et al. [15]. This model assumes a three-dimensional, nonrotating, nonhydrostatic, and incompressible airflow system [10] with a Reynolds-averaged Navier–Stokes equation system. The k-ε turbulence closure scheme was used for turbulent parameterization based on the renormalization group theory proposed by Yakhot et al. [17].
The chemical scheme consists of 140 species and 393 reactions, among which 61 reactions are photochemical reactions. The chemical computations were performed using a RODAS-3 (four-stage, order 3, stiffly accurate) solver with a self-adjusting internal time step [18] as part of the kinetics preprocessor [19,20].
The CFD model calculates aerosol concentrations using a chemical aerosol oxidation scheme and a thermodynamic equilibrium model. The module calculates sulfate, nitrate, ammonium, black carbon, and organic carbon concentrations. For sulfate aerosol formation, the CFD model only accounts for the gas-phase oxidation of SO2 by OH because it does not have an atmospheric physics module that simulates hydrometeors, such as clouds and rain.
Nitrate and ammonium aerosols were calculated by partitioning the total ammonia and nitric acid between the gas and aerosol phases. The ISORROPIA-II model was used as a thermodynamic equilibrium model for aerosol partitioning [21,22]. The ISORROPIA-II model calculates the thermodynamic equilibrium of a K+-Ca2+-Mg2+-NH4+-Na+-SO42−-NO3−-Cl−-H2O aerosol system from the NH3, HNO3, and SO42− concentrations. The model also includes the production of HNO3 via heterogeneous chemistry between aerosols and gases following the work by Jacob [23].
The CFD model transports 65 chemical tracers, including the aerosols and their precursors, using a finite volume method [24]. Radical species with very short chemical lifetimes are not transported. The detailed model structure typically follows the work by Kim et al. [15].
2.2. Model Set-Up
We conducted two simulations to evaluate a wet deposition scheme and examine the effect of wet deposition in urban areas. The first case is a simulation with an idealized column model simulation that compares the observed campaign in Beijing to estimate and evaluate the optimum wet scavenging coefficient (WSC) [25]. In this case, we focused on the ratio of below-cloud scavenging to whole wet deposition by comparing the ratio between the washout and rainout processes under nine different precipitation conditions observed by Xu et al. [25]. We only turned on the transport and wet deposition processes without chemical processes, emissions, and dry deposition with a fixed initial aerosol concentration to focus on the ratio between rainout and washout. We used the observed precipitation rates and cloud-based heights for each event, as presented by Xu et al. [25]. We used the daily averaged cloud top heights in Beijing from the Modern-Era Retrospective Analysis for Research and Applications, Version 2 (MERRA-2) reanalysis dataset [26]. Meteorology variables, such as temperature, humidity, and wind speed, are also daily averaged data from the MERRA-2. The initial and boundary concentrations at the surface were also derived from the observed concentrations by Xu et al. [25]. The weight coefficients for the vertical distribution of SIAs were based on GEOS-Chem simulations that show a vertical profile, similar to those by Xu et al. [25] (Figure 1). The averaged surface concentration of aerosol, cloud height, below-cloud WSC, and precipitation rates for each case are summarized in Table 1. The vertical grid sizes of the model are identical to the MERRA-2 reanalysis dataset (Table 2).
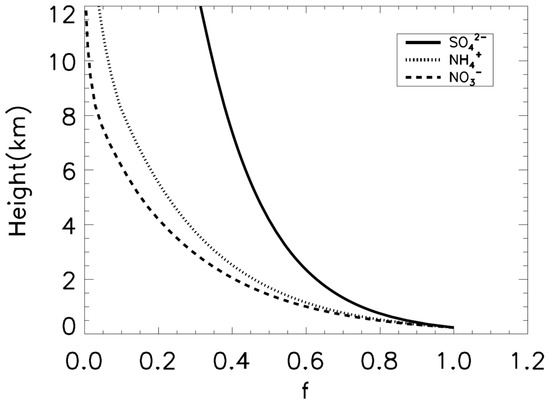
Figure 1.
Weight coefficients for the vertical distributions from GEOS-Chem under 12 km. The solid black line represents SO42−. The dotted black line is NH4+, and the dashed black line denotes NO3−.

Table 1.
Simulation conditions in the nine observed cases. Surface concentrations of secondary inorganic aerosols (SIAs) for initial and boundary conditions, below-cloud scavenging coefficient, cloud base height, and precipitation intensity are obtained from Xu et al. [25]. Cloud top height, relative humidity, wind speed, and wind direction are from Modern-Era Retrospective Analysis for Research and Applications, Version 2 (MERRA-2).

Table 2.
Vertical grids of MERRA-2 and the computational fluid dynamics atmospheric chemistry model (CFD-Chem).
The second case was a realistic urban simulation case. We simulated the aerosol concentrations in Bulgwang-Dong, Eunpyeong-Gu, Seoul, Korea using the CFD-Chem model to investigate the influence of wet deposition on SIAs in a megacity. We reproduced the geometry of Bulgwang-Dong from geographic information system (GIS) data, as illustrated in Figure 2. The simulated domain size is 800 m × 800 m × 350 m, and grid points are 80, 80, and 70 in the x-, y-, and z-directions. The grid intervals in the x-, y-, and z-directions are uniform with a dx = 10 m, dy = 10 m, and dz = 5 m. On 1 July 2015, we assessed aerosol concentrations for a heavy rainfall case to examine the effects of wet deposition. We conducted a 2-h simulation (20:00 LST–22:00 LST); the first hour was for the model spin-up, and the results for the last hour were used in our analysis. The dynamic and chemical time steps were 1 and 30 s, respectively.
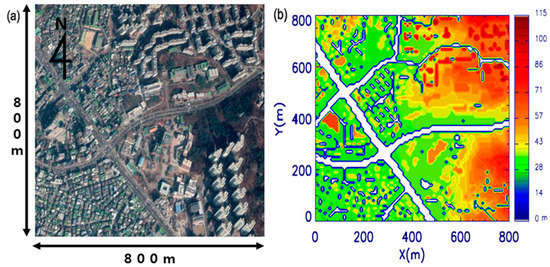
Figure 2.
(a) Satellite observed map and (b) surface heights in the computational fluid dynamics (CFD) model domain for a realistic urban simulation case. The white area in (b) is the road. Map obtained from Google Earth.
Wet deposition processes were also performed every 30 s. In this case, we only considered washout processes because the simulation domain was below the cloud area. We used the observed precipitation rate from the Automatic Weather Station operated by the Korea Meteorological Administration. The precipitation rate was 22.1 mm h−1. The initial and boundary conditions, including temperature, horizontal wind components, turbulent kinetic energy, and pollutants concentration, were gathered from the Weather Research and Forecasting (WRF) model version 3.8.1 [27] and the Community Multiscale Air Quality (CMAQ) model version 4.7.1 [28].
The WRF and CMAQ simulations have three nested domains with horizontal grid sizes of 27, 9, and 3 km. The anthropogenic pollutant emission in the CMAQ is ascertained from the sparse matrix operator kernel emissions modeling system (SMOKE) [29] through the emissions of the Clean Air Policy Support System inventory [30]. The biogenic pollutant emissions are produced using the model of emissions of gases and aerosols from nature (MEGAN) [31]. The detailed simulation conditions for WRF and CMAQ are presented in Table 3.

Table 3.
Weather and boundary conditions for simulation at 2100 LST on 1 July 2016, from the Weather Research and Forecasting (WRF) and Community Multiscale Air Quality (CMAQ) models.
Emissions for the CFD-Chem model are from the source object-based model for emissions, which defines the emission objects of buildings, roads, and vegetation in the metropolitan area based on detailed GIS database information and assigns object information, such as location, size, use, road type, and area, to each object [32]. Vehicle emissions are allocated spatially on roads, and the point source emissions are allocated on buildings within the CFD model domain. Table 4 summarizes the emission amount within the model domain. The CO and NO emissions were higher than those of other chemical species due to the high contribution of vehicular emissions in Seoul.

Table 4.
Total emissions in the domain used in the coupled computational fluid dynamics (CFD)-chemistry model simulations for the realistic case. Units are kilograms per hour (kg h−1).
3. Wet Deposition
3.1. Development of Wet Deposition Processes
We coupled a wet deposition module based on the global modeling initiative by Jacob (2000) to the CFD model. This scheme distinguishes between convective and stratiform precipitation. We assumed that all precipitation production was stratiform precipitation. Since convective precipitation has considerable variability in a short time within a narrow grid, it is difficult to apply the precipitation data at the mesoscale model to the urban-scale CFD model. Moreover, our simulation aims to reproduce the aerosol concentrations in a megacity in the mid-latitudes where stratiform precipitation is more prominent than convective precipitation [33].
Wet deposition processes consist of two main processes: rainout and washout. Rainout and washout are first-order losses applied to precipitating columns. Rainout is in-cloud scavenging from the precipitation of cloud droplets or ice crystals. Rainout processes are only applied in the cloud, and washout processes are calculated below the cloud. We do not consider re-evaporation because the CFD model cannot tell the difference in precipitation rate within the domain.
Thirty-five species are affected by wet deposition processes. Wet deposition processes treat chemical species differently based on the diameter of the aerosol. Detailed treatments are explained in the latter part of this section. The wet deposition of gaseous species is calculated following Henry’s law constant; however, HNO3 is treated as an aerosol because HNO3 has high water solubility [34].
Rainout is applied to all grids, which newly generates precipitation in the cloud. When converted to precipitation by a cloud condensate, all hydrophilic aerosols are deposited directly and incorporated into the cloud condensate. The rainout process can be calculated as follows:
Here, Fi is the fraction of a soluble species in the grid scavenged by rainout over the time step (Δt). In addition, f is the horizontal areal fraction of the grid generating precipitation, and ki is a first-order loss rainout rate constant. The units for Δt and ki are seconds and per second, respectively.
In the stratified cloud form, the f and k values are calculated using Equations (2) and (3):
where Q (cm3 water cm−3 air s−1) represents the rate of new precipitation formation within the grid. In addition, ftop is the f value at the top of the grid, and kmin is the minimum value of k, which is regarded as 1 × 10⁻⁴ s−1. The condensate content L + W (liquid + ice) is gathered from the meteorological model or entered as L + W = 1.5 × 10⁻⁶ cm3 water cm−3 air. If the precipitation area f is greater than this, the precipitation is larger. Therefore, f is the max value and is represented by Equation (2).
In-cloud scavenging (rainout) efficiently removes aerosols serving as cloud condensation nuclei or ice nuclei. In warm (liquid) and mixed-phase clouds (T ≥ 258 K), we assume 100% incorporation of hydrophilic aerosols in the cloud droplets followed by efficient scavenging when liquid water is converted to precipitation.
The washout process is calculated in the area under the cloud in the model. The washout process is applied to all grids in the area under the cloud. Here, we used the power law, which was suggested by Feng et al. [35,36]. The parameterization of the washout fraction (Fi) in the grid is as follows:
where P is the grid-scale precipitation rate through the bottom of the grid, and f is the horizontal areal fraction of the grid that is precipitating. Moreover, a and b are the WSCs. The units of P and a are cm s−1 and s−1, respectively.
Feng et al. [35,36] suggested WSCs for rain (T ≥ 268 K) as a = 2.36 × 10⁻⁷ and b = 0.61 for the accumulation mode aerosols and a = 2.11 × 10⁻⁴ and b = 0.79 for coarse mode aerosols. They also proposed WSCs for snow (T < 268 K) as a = 7.78 × 10⁻⁶ and b = 0.96 for accumulation mode aerosols and a = 4.36 × 10⁻⁴ and b = 0.96 for coarse mode aerosols.
3.2. Estimation of Optimal Values of WSC for Below-Cloud Scavenging
We evaluated the washout process of the coupled CFD-Chem model and compared it against the case observed by Xu et al. [25]. Xu et al. [25] observed the washout and rainout ratios from the total wet deposition of SIAs (sulfate, nitrate, and ammonium) in Beijing under nine different precipitation conditions.
Figure 3 displays the observed and simulated washout ratios of SIAs from the total wet deposition in the nine cases. Washout ratios of SIAs were 34% to 79% from the total wet deposition, and the average washout ratio was 55.4% in the observation. These results reveal that wet deposition amounts from washout have a comparable magnitude to that for rainout in the observations. The observed results also suggest that washout ratios are different depending on the chemical species, as 55%, 61%, and 50% are the average washout ratios for sulfate, nitrate, and ammonium, respectively [25]. A previous study also concluded that aerosol concentrations are an important factor for washout ratios because ratios for high concentration cases are higher than those for low concentration cases [25]. These results imply that below-cloud WSCs in urban areas might be higher than those of the rural or global average.
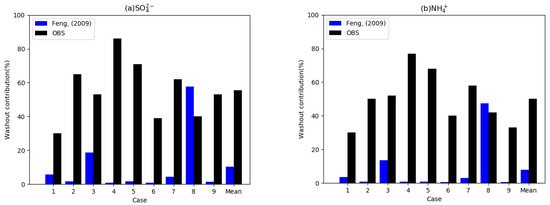
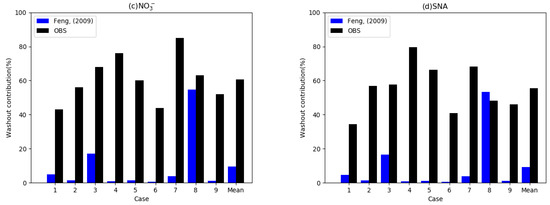
Figure 3.
Observed washout contribution (%) from the total wet deposition flux for nine cases observed by Xu et al. [25] (black bars) and simulated washout contribution with wet scavenging coefficients suggested by Feng [35,36] (blue bars). Each figure denotes (a) washout contributions of SO42−, (b) NH4+, (c) NO3−, and (d) the average of the three species.
We conducted the CFD-Chem model as a column model with WSCs based on the work by Feng et al. [35,36]. The blue bars in Figure 3 indicate the washout contributions of the model with WSCs from Feng et al. [35,36]. The mean simulated washout ratio from the total wet deposition for the nine cases was 9.3%, which is six times lower than that observed (55.4%). The simulated washout contributions of SIAs were lower than 6% except for Cases 3 and 8 among the nine cases, indicating that wet depositions of SIAs mostly occur in the rainout processes in the model. These results suggest that washout amounts in urban areas might be underestimated in the model.
We found that simulated washout ratios are primarily affected by meteorological conditions, especially for the cloud base height and thickness. For example, the cloud base height in Case 8 exhibits an enormous washout contribution in the simulation, as the cloud base height is 26 times longer than the cloud thickness. In contrast, we cannot find a clear relationship between the simulated washout ratio and SIA concentrations that are different from those observed. Considering that most estimations of WSCs for below-cloud scavenging are based on the global average, the WSCs in an urban area might be underestimated. Moreover, Xu et al. [25] insisted that WSCs for below-cloud scavenging based on theoretical estimations are much lower than those from field observations, especially for washout processes. Therefore, we concluded that the model underestimates washout amounts in an urban area.
We conducted new simulations on nine cases using WSCs suggested by Xu et al. [25] to investigate the effect of WSC changes on washout contributions. The WSC values used in this study, including the WSCs suggested by Xu et al. [25], are summarized in Table 5. The range of the b parameters (exponential constant of WSCs) is similar to that for the WSCs from Feng et al. [35,36], from 0.52 to 0.80, whereas the a parameters are 1000 times larger than those by Feng et al. [35,36]. Figure 4 displays the simulated washout contributions with the WSCs by Xu et al. [25]. The average simulated value is 71%, which is eight times higher than the constant from Feng et al. [35,36]. Previous studies based on measurements also suggest that washout contributes over 50% in urban areas [25,37,38,39]. Therefore, simulated washout contributions are improved by changing the WSCs.

Table 5.
Wet scavenging coefficient (WSC) values used in this study for simulations.
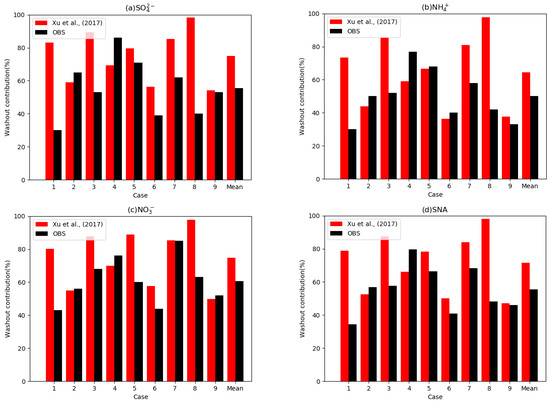
Figure 4.
Observed washout contributions (%) from the total wet deposition flux for the nine cases observed by Xu et al. [25] (black bars) and simulated washout contributions (%) with the wet scavenging coefficients suggested by Xu et al. [25] (red bars). Each figure denotes (a) the washout contributions of SO42−, (b) NH4+, (c) NO3−, and (d) the average of the three species.
We found that the simulated washout ratio was also affected by the cloud base height and thickness. Figure 5 depicts the scatterplots between the washout contributions and precipitation intensity (mm/h), cloud thickness (km), and cloud base height (km) in the simulation. Precipitation negatively correlates with the washout contribution, which indicates that precipitation is positively correlated with the rainout contributions. This outcome is consistent with the results from a previous study [25]. The washout contributions tend to decrease as the cloud thickness increases. A thicker cloud corresponds to a larger rainout area; therefore, washout contributions correspondingly decrease. Washout contribution strongly correlates with the cloud base height with a coefficient of determination of 0.9, indicating that the most important meteorological variable in the model is the base cloud height. This result is consistent with a previous study on wet deposition that used the model according to the height and thickness of clouds [40]. However, this simulation did not reproduce dependency between the wet deposition amount and concentration. These results imply that the model has significant uncertainty resulting from the variability in meteorological conditions due to its limitations in parameterization, although we applied observation-based WSCs. Moreover, the low influence of concentration on the washout ratio indicates that we should use different WSCs for below-cloud scavenging in urban and rural areas.
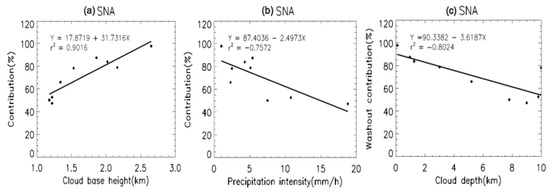
Figure 5.
Scatterplots of the simulated washout contribution (%) from the total wet deposition flux against (a) the cloud base height (km), (b) precipitation intensity (mm h−1), and (c) cloud depth (km). Washout contribution is calculated using the mean washout contribution of secondary inorganic aerosols. The solid lines indicate regression lines of the linear least-squares fitting.
We also found that the mean of the simulated washout ratio was 16% higher than that observed, indicating that the simulated washout might have been overestimated. Therefore, we concluded that the optimal values of WSCs exist between the WSCs from Feng et al. [35,36] and Xu et al. [25]. To deduce the optimal WSCs, we investigated the WSCs of previous studies using field measurements, controlled experiments, and theoretical calculations (Table 6). We found that the range of parameter a was 1.17 × 10⁻⁷ to 4.0 × 10⁻⁴, showing a large discrepancy. Previous studies also suggested that parameter a has a clear difference resulting from the variability in species because the mean diameters of sulfate, nitrate, and ammonium aerosols are different. However, the range of parameter b is 0.52 to 0.9, and no significant differences exist between the studies. Therefore, we assumed parameter b to be 0.71 for all accumulation mode aerosols, which is the median of all parameters for b.

Table 6.
Wet scavenging coefficient (WSC) values investigated in previous studies on WSC = aPb by particle size (D) and method.
We estimated the optimal value for parameter a using a linear relationship between parameter a and the washout contribution in the model. Figure 6 indicates scatterplots between parameter a and the washout contribution in the model for sulfate, nitrate, and ammonium. Parameter a exhibits a clear linear relationship with the washout contribution for all SIAs in the model. We applied the 55%, 61%, and 50% washout contribution in the linear regression equation for sulfate, nitrate, and ammonium, respectively. The optimal values for a were 1.42 × 10⁻⁵, 3.17 × 10⁻⁵, and 2.01 × 10⁻⁵ for sulfate, nitrate, and ammonium, respectively. These values are 1000 times larger than those from Feng et al. [35,36] and two times smaller than those from Xu et al. [25]. The estimated value of a is the largest for nitrate, because the nitrate particles are larger than the other two species [37,41].
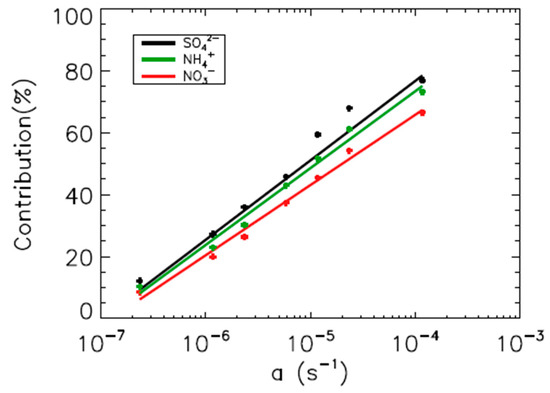
Figure 6.
Scatter plots between the washout contribution of SO42− (solid black line and dots), NH4+ (solid green line and dots), and NO3− (solid red line and dots) from the total wet deposition flux and the a parameter in WSC = aPb. The solid lines are regression lines of the linear least-squares fitting.
4. Influence of Wet Deposition on Secondary Inorganic Aerosols in an Urban Area
We investigated the influence of wet deposition on SIA in an urban area using WSCs from Feng et al. [35,36] and the estimated optimal values in this study. We used the CFD-Chem model to investigate the effect of wet deposition on SIA in a megacity. Figure 7 presents the surface concentration of SIAs with and without wet deposition processes. The aerosol sulfate concentrations do not exhibit evident spatial variation, indicating that the primary emission and secondary production of sulfate are limited in the domain. However, nitrate and ammonium concentrations represent high concentrations in the northern part of the domain, suggesting a relatively high secondary production influence in urban areas.
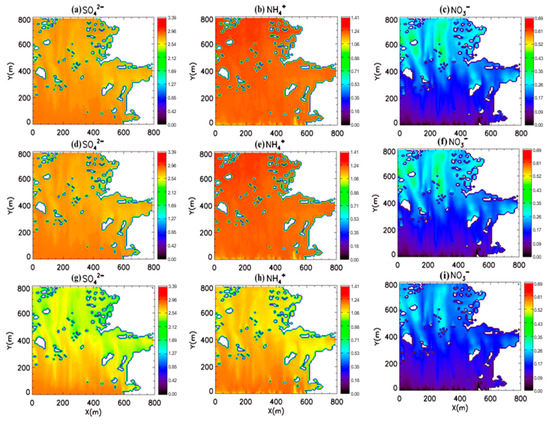
Figure 7.
Surface concentrations of secondary inorganic aerosol with and without washout processes in Eunpyeong-Gu, Seoul, Korea. Figures in the upper panel display surface concentrations of (a) SO42−, (b) NH4+, and (c) NO3− without washout processes. Figures in the middle and lower panels indicate the surface concentrations of SO42−, NH4+, and NO3− with washout processes using the wet scavenging coefficients (WSCs) by Feng [35,36] ((d), (e), and (f), respectively) and using the optimal estimated WSCs in this study ((g), (h), and (i), respectively). Units are μm−3.
When we simulated the concentrations with wet deposition using WSCs from Feng et al. [35,36], the simulated SIA concentrations did not demonstrate clear differences from those without wet deposition, suggesting that washout processes have a limited effect on aerosol concentrations in urban areas, despite cases of heavy rainfall (22.1 mm h−1). The concentration differences between the two cases are less than 1% for each species (Figure 7). However, the observed washout fraction based on a field campaign suggests that washout processes reduce the surface SIA concentrations in urban areas [25,37,38,39].
The simulated SIA concentrations with the optimal WSCs were lower than those without wet deposition processes. The average surface concentration differences between simulations with and without washout processes are 0.19 µg m−3, 0.08 µg m−3, and 0.03 µg m−3 for sulfate, nitrate, and ammonium, respectively. The reductions in the average surface concentrations from washout processes are from 7.2% to 12.1%, indicating that washout processes decrease the surface aerosol concentrations, as previous studies have noted.
Figure 8a–c presents the reduction rate of the surface concentration due to wet deposition processes with optimal WSCs. The effect of wet deposition on nitrate aerosol is the largest due to having the largest parameter a. The reduction rate is the lowest in the upwind region. It gradually increases in the downwind region for all species because the residence time of aerosols in the upwind region is shorter than that of the downwind region in the simulation. The mean and maximum concentration reduction rates of SIAs are 8.4% and 24%, respectively.
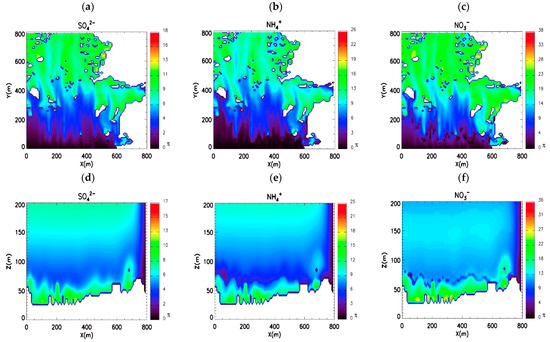
Figure 8.
Reduction rate (%) of secondary inorganic aerosol (SIA) concentration owing to washout processes. Reduction rate of (a) sulfate, (b) ammonium, and (c) nitrate at the surface. Meridionally averaged reduction rate of (d) sulfate, (e) ammonium, and (f) nitrate in the x-z plane.
Figure 8d–f displays the vertical distribution of the decreasing SIA concentration rate due to wet deposition processes. The decreasing rate is the highest near-surface region because wind flow is stagnant near the surface due to the complex terrain and urban area buildings. A previous study suggests that wet deposition is greater in areas where the atmosphere is stagnant due to increased aerosol residence time [48]. The present results suggest that washout processes can affect aerosol concentrations at the pedestrian level. Therefore, the microscale model should consider washout processes to reproduce a realistic distribution of aerosol concentration.
Figure 9 represents the flux of wet deposition of SIAs. We found that distributions of wet deposition flux are different depending on the chemical species. The sulfate aerosol flux of wet deposition is largest in the upwind area, which is the opposite of the reduction rate due to the washout. It might be because the inflow concentration is the highest, and the secondary production of sulfate aerosol is weak in the domain. For nitrate aerosol, the flux is high over the northern part of the domain. The flow is stagnant, implying that nitrate aerosol is actively produced by a chemical reaction inside of the domain. However, the deposition amount of nitrate is less than that of the other two species, because the mean concentration of nitrate is lower than that of other species. The wet deposition flux of ammonium aerosol exhibits a mixed pattern between that of sulfate and nitrate aerosol. Thus, the ammonium aerosol exists as both ammonium sulfate and ammonium nitrate aerosol.
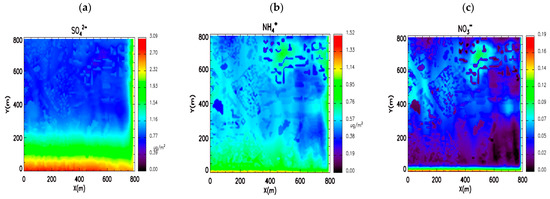
Figure 9.
Wet deposition flux of (a) sulfate, (b) ammonium, and (c) nitrate due to washout processes. Units are µg m−2.
We conducted three additional sensitivity simulations to examine the effect of wind direction change on the reduction rate of the surface concentration due to wet deposition processes. Figure 10 displays the reduction ratio following the wind direction. All simulations consistently indicate that the highest reduction ratio occurs in the downwind region. The lowest reduction ratio occurs in upwind regions similar to those of the southern wind case due to the tracers’ residence time. The spatial pattern of sensitivity simulations differs following the wind direction; however, the average reduction rates do not exhibit apparent differences, at 7.1% to 11.2% (Table 7). Our results suggest that washout processes can reduce the PM concentration by up to 11% in the urban area, indicating that washout processes should be considered in the microscale model, although the modeling domain can only simulate washout processes.
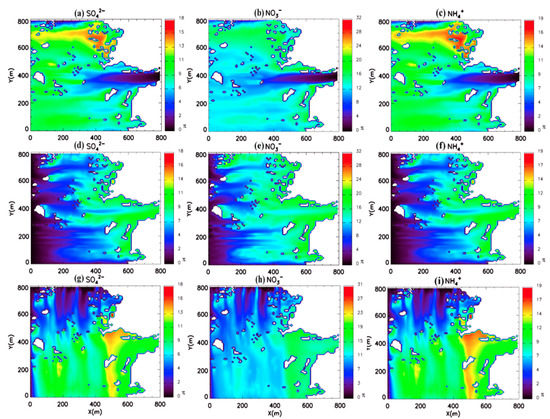
Figure 10.
Reduction rate (%) of surface secondary inorganic aerosol (SIA) concentration in different wind direction cases. The surface reduction rates of (a) sulfate, (b) ammonium, and (c) nitrate in the east wind case. Surface reduction rates of (d) sulfate, (e) ammonium, and (f) nitrate in the west wind case. Surface reduction rates of (g) sulfate, (h) ammonium, and (i) nitrate in the north wind case.

Table 7.
Maximum and average concentration reduction ratio (%) depending on wind direction by species.
5. Conclusions
Wet deposition significantly affects the aerosol concentration because it more efficiently removes aerosol than dry deposition. However, no study has previously considered wet deposition processes in microscale urban air quality modeling due to its limitation in terms of the absence of hydrometeor processes and the small domain size. Recent studies based on an observed campaign have suggested that precipitation could drive a change in SIA concentration in urban areas. Therefore, to examine the SIA concentration properly in urban areas, wet deposition processes should be included in the model. Here, we developed and applied a wet deposition scheme for SIA concentrations to identify the effects of wet deposition on SIAs in urban areas by coupling wet deposition modules to the existing three-dimensional coupled chemistry CFD model.
We applied wet deposition processes to the CFD model using a global modeling initiative wet deposition scheme. We evaluated the model by investigating the concentration of the washout amount from the total wet deposition amount in the model under the idealized case. We found that the simulated washout contribution was six times lower than that observed when the WSC based on the theoretical calculation was applied in the washout processes. These results suggest that the model underestimates washout amounts in urban areas.
We additionally conducted a model using WSCs based on field measurement in a megacity. The average simulated washout ratio is 71%, which is eight times higher than the results of previous simulations, indicating that simulated washout contributions are improved by changing the WSCs from field observations. We also found that the simulated washout ratio is affected by the cloud base height and cloud thickness, whereas simulation does not reproduce the relationship between the wet deposition amount and concentration, showing substantial differences against the observations. These results imply that the model still has considerable uncertainty in following meteorological conditions due to parameterization limitations, although we applied observation-based WSCs. Moreover, the low influence of the concentration on the washout ratio indicates that we should use different WSCs of below-cloud scavenging between urban and rural areas. Moreover, when the observation-based WSC was applied, it was 16% higher than that observed. We deduced the optimal WSCs for the megacity area using a linear regression approach.
Then, we conducted a model with wet deposition of SIAs in a megacity to understand the effect of wet deposition on SIA concentration. The simulated results indicate that washout processes decrease the surface aerosol concentration, as previous studies have noted, showing from 7.1% to 11.2% reductions in the average surface concentrations from washout processes. The simulation results suggest that washout processes can reduce the PM concentration in urban areas, indicating that washout processes should be considered in the microscale model, although the modeling domain only can simulate washout processes.
Author Contributions
Conceptualization, M.J.K.; Formal analysis, Methodology, Visualization, K.D.K.; Investigation, Data curation, K.D.K., and S.L.; Software, J.-J.K., S.-H.L., and K.D.K., Resources, D.L., J.-B.L., and J.-Y.C.; Visualization, K.D.K.; Writing—original draft, K.D.K., M.J.K.; Writing—review and editing, K.D.K., S.L., J.-J.K., S.-H.L., D.L., J.-B.L., J.-Y.C., and M.J.K. All authors have read and agreed to the published version of the manuscript.
Funding
This work was supported by a grant from the National Institute of Environment Research (NIER), funded by the Ministry of Environment (MOE) of the Republic of Korea (ex: NIER-2020-01-02-061) as well as the National Research Foundation of Korea (NRF) grant funded by the Korea government (MSIT) (No. NRF-2020R1C1C1008898).
Institutional Review Board Statement
Not applicable.
Informed Consent Statement
Not applicable.
Data Availability Statement
The data presented in this study are available on request from the corresponding author.
Conflicts of Interest
The authors declare no conflict of interest.
References
- Seinfeld, J.H.; Pandis, S.N. Atmospheric Chemistry and Physics: From Air Pollution to Climate Change; John Wiley & Sons: New York, NY, USA, 2016. [Google Scholar]
- Bressi, M.; Sciare, J.; Ghersi, V.; Bonnaire, N.; Nicolas, J.B.; Petit, J.-E.; Moukhtar, S.; Rosso, A.; Mihalopoulos, N.; Féron, A. A One-Year Comprehensive Chemical Characterisation of Fine Aerosol (PM 2.5) at Urban, Suburban and Rural Background Sites in the Region of Paris (France). Atmos. Chem. Phys. 2013, 13, 7825–7844. [Google Scholar] [CrossRef]
- Textor, C.; Schulz, M.; Guibert, S.; Kinne, S.; Balkanski, Y.; Bauer, S.E.; Berntsen, T.; Berglen, T.F.; Boucher, O.; Chin, M. Analysis and Quantification of the Diversities of Aerosol Life Cycles within AeroCom. Atmos. Chem. Phys. 2006, 6, 1777–1813. [Google Scholar] [CrossRef]
- Zhang, Q.; Jimenez, J.L.; Canagaratna, M.R.; Allan, J.D.; Coe, H.; Ulbrich, I.; Alfarra, M.R.; Takami, A.; Middlebrook, A.M.; Sun, Y.L. Ubiquity and Dominance of Oxygenated Species in Organic Aerosols in Anthropogenically-Influenced Northern Hemisphere Midlatitudes. Geophys. Res. Lett. 2007, 34. [Google Scholar] [CrossRef]
- Sun, Y.; Wang, Z.; Fu, P.; Jiang, Q.; Yang, T.; Li, J.; Ge, X. The Impact of Relative Humidity on Aerosol Composition and Evolution Processes during Wintertime in Beijing, China. Atmos. Environ. 2013, 77, 927–934. [Google Scholar] [CrossRef]
- Sun, Y.; Jiang, Q.; Wang, Z.; Fu, P.; Li, J.; Yang, T.; Yin, Y. Investigation of the Sources and Evolution Processes of Severe Haze Pollution in Beijing in January 2013. J. Geophys. Res. Atmos. 2014, 119, 4380–4398. [Google Scholar] [CrossRef]
- Network Center for EANET. Data Report on the Acid Deposition in the East Asian Region 2000–2018. Available online: https://monitoring.eanet.asia/document/public/index (accessed on 28 January 2021).
- Rodhe, H.; Dentener, F.; Schulz, M. The Global Distribution of Acidifying Wet Deposition. Environ. Sci. Technol. 2002, 36, 4382–4388. [Google Scholar] [CrossRef]
- Poor, N.; Pribble, R.; Greening, H. Direct Wet and Dry Deposition of Ammonia, Nitric Acid, Ammonium and Nitrate to the Tampa Bay Estuary, FL, USA. Atmos. Environ. 2001, 35, 3947–3955. [Google Scholar] [CrossRef]
- Kim, J.-J.; Baik, J.-J. A Numerical Study of the Effects of Ambient Wind Direction on Flow and Dispersion in Urban Street Canyons Using the RNG k–ε Turbulence Model. Atmos. Environ. 2004, 38, 3039–3048. [Google Scholar] [CrossRef]
- Baik, J.-J.; Kim, J.-J.; Fernando, H.J. A CFD Model for Simulating Urban Flow and Dispersion. J. Appl. Meteorol. 2003, 42, 1636–1648. [Google Scholar] [CrossRef]
- Li, X.-X.; Liu, C.-H.; Leung, D.Y.; Lam, K.M. Recent Progress in CFD Modelling of Wind Field and Pollutant Transport in Street Canyons. Atmos. Environ. 2006, 40, 5640–5658. [Google Scholar] [CrossRef]
- Nikolova, I.; Janssen, S.; Vos, P.; Vrancken, K.; Mishra, V.; Berghmans, P. Dispersion Modelling of Traffic Induced Ultrafine Particles in a Street Canyon in Antwerp, Belgium and Comparison with Observations. Sci. Total Environ. 2011, 412, 336–343. [Google Scholar] [CrossRef] [PubMed]
- Kim, M.J. Sensitivity of Nitrate Aerosol Production to Vehicular Emissions in an Urban Street. Atmosphere 2019, 10, 212. [Google Scholar] [CrossRef]
- Kim, M.J.; Park, R.J.; Kim, J.-J.; Park, S.H.; Chang, L.-S.; Lee, D.-G.; Choi, J.-Y. Computational Fluid Dynamics Simulation of Reactive Fine Particulate Matter in a Street Canyon. Atmos. Environ. 2019, 209, 54–66. [Google Scholar] [CrossRef]
- Dentener, F.; Drevet, J.; Lamarque, J.-F.; Bey, I.; Eickhout, B.; Fiore, A.M.; Hauglustaine, D.; Horowitz, L.W.; Krol, M.; Kulshrestha, U.C. Nitrogen and Sulfur Deposition on Regional and Global Scales: A Multimodel Evaluation. Glob. Biogeochem. Cycles 2006, 20. [Google Scholar] [CrossRef]
- Yakhot, V.; Smith, L.M. The Renormalization Group, the ɛ-Expansion and Derivation of Turbulence Models. J. Sci. Comput. 1992, 7, 35–61. [Google Scholar] [CrossRef]
- Hairer, E.; Wanner, G. Rosenbrock methods. In Solving Ordinary Differential Equations II; Springer: Berlin/Heidelberg, Germany, 2002; pp. 407–425. [Google Scholar]
- Eller, P.; Singh, K.; Sandu, A.; Bowman, K.; Henze, D.K.; Lee, M. Implementation and Evaluation of an Array of Chemical Solvers in a Global Chemical Transport Model. Geophys. Model. Dev. 2009, 2, 1–7. [Google Scholar]
- Sandu, A.; Sander, R. Simulating Chemical Systems in Fortran90 and Matlab with the Kinetic PreProcessor KPP-2.1. Atmos. Chem. Phys. 2006, 6, 187–195. [Google Scholar] [CrossRef]
- Fountoukis, C.; Nenes, A. ISORROPIA II: A Computationally Efficient Thermodynamic Equilibrium Model for K+-Ca2+-Mg2+-NH4+-Na+-SO4 2-NO3-Cl-H2O Aerosols. Atmos. Chem. Phys. 2007, 7, 4639–4659. [Google Scholar] [CrossRef]
- Nenes, A.; Pandis, S.N.; Pilinis, C. ISORROPIA: A New Thermodynamic Equilibrium Model for Multiphase Multicomponent Inorganic Aerosols. Aquat. Geochem. 1998, 4, 123–152. [Google Scholar] [CrossRef]
- Jacob, D.J. Heterogeneous Chemistry and Tropospheric Ozone. Atmos. Environ. 2000, 34, 2131–2159. [Google Scholar] [CrossRef]
- Patankar, S. Numerical Heat Transfer and Fluid Flow; CRC Press: New York, NY, USA, 1980. [Google Scholar]
- Xu, D.; Ge, B.; Wang, Z.; Sun, Y.; Chen, Y.; Ji, D.; Yang, T.; Ma, Z.; Cheng, N.; Hao, J. Below-Cloud Wet Scavenging of Soluble Inorganic Ions by Rain in Beijing during the Summer of 2014. Environ. Pollut. 2017, 230, 963–973. [Google Scholar] [CrossRef] [PubMed]
- Gelaro, R.; McCarty, W.; Suárez, M.J.; Todling, R.; Molod, A.; Takacs, L.; Randles, C.A.; Darmenov, A.; Bosilovich, M.G.; Reichle, R. The Modern-Era Retrospective Analysis for Research and Applications, Version 2 (MERRA-2). J. Clim. 2017, 30, 5419–5454. [Google Scholar] [CrossRef] [PubMed]
- Powers, J.G.; Klemp, J.B.; Skamarock, W.C.; Davis, C.A.; Dudhia, J.; Gill, D.O.; Coen, J.L.; Gochis, D.J.; Ahmadov, R.; Peckham, S.E. The Weather Research and Forecasting Model: Overview, System Efforts, and Future Directions. Bull. Am. Meteorol. Soc. 2017, 98, 1717–1737. [Google Scholar] [CrossRef]
- Byun, D.; Schere, K.L. Review of the Governing Equations, Computational Algorithms, and Other Components of the Models-3 Community Multiscale Air Quality (CMAQ) Modeling System. Appl. Mech. Rev. Mar. 2006, 59, 51–77. [Google Scholar] [CrossRef]
- Houyoux, M.; Vukovich, J.; Brandmeyer, J.E.; Seppanen, C.; Holland, A. Sparse Matrix Operator Kernel Emissions Modeling System-SMOKE User Manual; Environmental Programs; MCNC-North Carolina Supercomputing Center: Research Triangle Park, NC, USA, 2000. [Google Scholar]
- Lee, D.-G.; Lee, Y.-M.; Jang, K.-W.; Yoo, C.; Kang, K.-H.; Lee, J.-H.; Jung, S.-W.; Park, J.-M.; Lee, S.-B.; Han, J.-S. Korean National Emissions Inventory System and 2007 Air Pollutant Emissions. Asian J. Atmos. Environ. 2011, 5, 278–291. [Google Scholar] [CrossRef]
- Guenther, A.; Karl, T.; Harley, P.; Wiedinmyer, C.; Palmer, P.I.; Geron, C. Estimates of Global Terrestrial Isoprene Emissions Using MEGAN (Model of Emissions of Gases and Aerosols from Nature). Atmos. Chem. Phys. 2006, 6, 3181–3210. [Google Scholar] [CrossRef]
- Woo, J.; Lee, J.-H.; Lee, S.-H. Source Object-Based Model for Emissions (SOME): A Novel Emission Processing Approach for Multi-Scale Air-Quality Modeling. AGUFM 2018, 2018, A23M-3081. [Google Scholar]
- Gao, J.; Tang, G.; Hong, Y. Similarities and Improvements of GPM Dual-Frequency Precipitation Radar (DPR) upon TRMM Precipitation Radar (PR) in Global Precipitation Rate Estimation, Type Classification and Vertical Profiling. Remote Sens. 2017, 9, 1142. [Google Scholar] [CrossRef]
- Levine, S.Z.; Schwartz, S.E. In-Cloud and below-Cloud Scavenging of Nitric Acid Vapor. Atmos. Environ. 1982, 16, 1725–1734. [Google Scholar] [CrossRef]
- Feng, J. A 3-Mode Parameterization of below-Cloud Scavenging of Aerosols for Use in Atmospheric Dispersion Models. Atmos. Environ. 2007, 41, 6808–6822. [Google Scholar] [CrossRef]
- Feng, J. A Size-Resolved Model for below-Cloud Scavenging of Aerosols by Snowfall. J. Geophys. Res. Atmos. 2009, 114. [Google Scholar] [CrossRef]
- Ge, B.; Wang, Z.; Gbaguidi, A.E.; Zhang, Q. Source Identification of Acid Rain Arising over Northeast China: Observed Evidence and Model Simulation. Aerosol. Air Qual. Res. 2015, 16, 1366–1377. [Google Scholar] [CrossRef]
- Aikawa, M.; Kajino, M.; Hiraki, T.; Mukai, H. The Contribution of Site to Washout and Rainout: Precipitation Chemistry Based on Sample Analysis from 0.5 Mm Precipitation Increments and Numerical Simulation. Atmos. Environ. 2014, 95, 165–174. [Google Scholar] [CrossRef]
- Bertrand, G.; Celle-Jeanton, H.; Laj, P.; Rangognio, J.; Chazot, G. Rainfall Chemistry: Long Range Transport versus below-cloud Scavenging. A Two-Year Study at an Inland Station (Opme, France). J. Atmos. Chem. 2008, 60, 253–271. [Google Scholar] [CrossRef]
- Wiegand, F.; Pereira, F.N.; Teixeira, E.C. Study on Wet Scavenging of Atmospheric Pollutants in South Brazil. Atmos. Environ. 2011, 45, 4770–4776. [Google Scholar] [CrossRef]
- Aikawa, M.; Hiraki, T. Washout/Rainout Contribution in Wet Deposition Estimated by 0.5 Mm Precipitation Sampling/Analysis. Atmos. Environ. 2009, 43, 4935–4939. [Google Scholar] [CrossRef]
- Jylhä, K. Empirical Scavenging Coefficients of Radioactive Substances Released from Chernobyl. Atmos. Environ. Part A Gen. Top. 1991, 25, 263–270. [Google Scholar] [CrossRef]
- Okita, T.; Hara, H.; Fukuzaki, N. Measurements of Atmospheric SO2 and SO42−, and Determination of the Wet Scavenging Coefficient of Sulfate Aerosols for the Winter Monsoon Season over the Sea of Japan. Atmos. Environ. 1996, 30, 3733–3739. [Google Scholar] [CrossRef]
- Scott, B.C. Theoretical Estimates of the Scavenging Coefficient for Soluble Aerosol Particles as a Function of Precipitation Type, Rate and Altitude. Atmos. Environ. 1982, 16, 1753–1762. [Google Scholar] [CrossRef]
- Sparmacher, H.; Fülber, K.; Bonka, H. Below-Cloud Scavenging of Aerosol Particles: Particle-Bound Radionuclides—Experimental. Atmos Environ. Part A Gen. Top. 1993, 27, 605–618. [Google Scholar] [CrossRef]
- Andronache, C. Estimated Variability of Below-Cloud Aerosol Removal by Rainfall for Observed Aerosol Size Distributions. Atmos. Chem. Phys. 2003, 3, 131–143. [Google Scholar] [CrossRef]
- Wang, X.; Zhang, L.; Moran, M.D. Bulk or Modal Parameterizations for Below-Cloud Scavenging of Fine, Coarse, and Giant Particles by Both Rain and Snow. J. Adv. Model. Earth Syst. 2014, 6, 1301–1310. [Google Scholar] [CrossRef]
- Yang, L.; Pandithurai, G.; Chate, D.M.; Rao, P.S.P.; Waghmare, V.; Iyer, U. Evidence of Precedent Wind Role on Controlling PM1 Wet Scavenging of Aerosols during Monsoon Rain Events. Atmos. Environ. 2019, 201, 265–277. [Google Scholar] [CrossRef]
Publisher’s Note: MDPI stays neutral with regard to jurisdictional claims in published maps and institutional affiliations. |
© 2021 by the authors. Licensee MDPI, Basel, Switzerland. This article is an open access article distributed under the terms and conditions of the Creative Commons Attribution (CC BY) license (http://creativecommons.org/licenses/by/4.0/).