Article

On the Relationship of a Low-Level Jet and the Formation of a Heavy-Rainfall-Producing Mesoscale Vortex over the Yangtze River Basin

1
International Center for Climate and Environment Sciences, Institute of Atmospheric Physics, Chinese Academy of Sciences, Beijing 100029, China
2
Laboratory of Cloud–Precipitation Physics and Severe Storms, Institute of Atmospheric Physics, Chinese Academy of Sciences, Beijing 100029, China
3
University of Chinese Academy of Sciences, Beijing 100049, China
4
State Grid Xinjiang Electric Power Co., Ltd., Urumqi 830002, China
5
Beijing Gold Wind Smart Energy Co., Ltd., Beijing 100174, China
*
Author to whom correspondence should be addressed.
Atmosphere 2021, 12(2), 156; https://doi.org/10.3390/atmos12020156
Submission received: 12 December 2020 / Revised: 17 January 2021 / Accepted: 22 January 2021 / Published: 26 January 2021
(This article belongs to the Special Issue Characteristics of Coastal Low Level Wind Jet)

Abstract

:
Dabie vortices (DBVs) are a type of heavy-rainfall-producing mesoscale vortices that appear with a high frequency around the Dabie Mountain over the Yangtze River Basin. For a long time, scholars have found that DBVs tend to form when a low-level jet (LLJ) appears in their neighboring regions. However, the underlying mechanisms of this phenomenon still remain vague. This study furthers the understanding of this type of event by conducting detailed analyses on a long-lived eastward-moving DBV that caused a severe flood in the 2020 summer. It is found that the LLJ in this event was belonged to a nocturnal LLJ type, with its maximum/minimum appeared around 2100/0600 UTC. The diurnal cycle of LLJ affected precipitation and intensity of the DBV notably: As the LLJ intensified, vortex’s precipitation and intensity both enhanced, and vice versa. The LLJ exerted two effects on the DBV’s formation that are opposite to each other. The more important effect is that the LLJ caused intense lower-level convergence around its northern terminus. This convergence directly produced cyclonic vorticity through vertical stretching, which dominates the DBV’s formation and enhances the convection-related upward cyclonic vorticity transport that acted as another favorable factor. The less important effect is that (i) the LLJ induced import of anticyclonic vorticity into the vortex’s central region, which decelerated the DBV’s formation; and (ii) the LLJ-related to strong ascending motions tilted horizontal vorticity into negative vertical vorticity, which reduced the growth rate of cyclonic vorticity.

1. Introduction

Heavy rainfall is one of the most severe natural disasters in China [1], and the Yangtze River Basin (YRB) is one of the three main rain belts in China [2]. In normal years, the YRB experiences a series of heavy rainfall episodes (HREs) during the warm season [3], which result in huge economic losses and heavy casualties, such as the famous floods of 1951, 1998, and 2020 [4]. Mesoscale vortices (MVs) are a type of vortices with a horizontal scale of 2–2000 km, which are one of the most common weather systems all over the world [5,6,7]. For the YRB, there are mainly two MV sources [8], one is around the Sichuan Basin, and the other is around the Dabie Mountain. The MVs originated from these two sources are found to be an important reason for the HREs over the YRB [9,10,11].
Statistical studies [12,13,14,15] had confirmed that there were two main types of heavy-rainfall-producing MVs that formed over the YRB: One was generated around the Sichuan Basin and was named the southwest vortex (SWV), and the other was generated around the Dabie Mountain and was referred to as the Dabie vortex (DBV). A detailed comparison between SWVs and DBVs based on a 14-year statistic [16] showed that on average, both types of MVs had a high occurrence frequency; whereas, the latter featured a faster moving speed, a heavier precipitation intensity, and a larger probability of inducing lightning. This means that the DBV may cause more severe disasters than those of SWVs. Due to this, great efforts have been made to further the understanding of DBVs’ evolution. For example, Dong and Zhao [17] investigated five DBVs embedded in the Meiyu front and found that a couple of upper-level westerly jet and low-level jet (LLJ) was a favorable condition for the development of these vortices. Sun et al. [18] and Fu et al. [19] investigated the formation mechanisms of two heavy-rainfall-producing DBVs. They found that the vorticity production (due to convergence) and the vorticity transport (due to convection) were dominant factors for the vortices’ generation. Li et al. [20] conducted a convection-permitting simulation and various diagnoses on a northeastward-moving DBV in July 2016. Their results showed that the interaction of this DBV with a middle-level cyclone enhanced its intensity and precipitation. It should be noted that there is a common feature for the studies mentioned above, i.e., an LLJ was remarkable during the formation period of the DBVs [7,17,18,19]. This feature has also been confirmed as significant by a 14-year statistic [16] and a semi-idealized simulation of DBV [20]. Although the LLJ exerted important effects on generating DBVs, thus far, how the variation of an LLJ affects a DBV’s formation still remains vague. For this reason, the primary purpose of the present study is (i) to show the relationship between DBV’s formation and LLJ’s variation, and (ii) to reveal the mechanisms of how LLJ affects DBV’s formation, based on a heavy-rainfall-producing MV that caused a severe flood over the YRB in 2020.
The remaining of the paper is structured as follows: Section 2 presents the data and method, Section 3 shows variations of the DBV and LLJ, Section 4 discusses the DBV’s formation in detail, and finally, a conclusion and discussion are reached in Section 5.

2. Data and Method

The European Centre for Medium-Range Weather Forecasts (ECMWF) ERA5 reanalysis data [21] of a temporal resolution of hourly and a spatial resolution of 0.25° × 0.25° was used for analysis and vorticity budget in this study. Station observational 6-h accumulated precipitation (http://www.nmic.cn/) was used to investigate the precipitation associated with the DBV.
According to Green’s theorem, a surface integral of vorticity within an area equals the velocity circulation along the boundary line of the area. This means that the area mean vorticity is an effective indicator of MV, as the velocity circulation can describe an MV effectively [20,22]. Therefore, this study employed the area-averaged vorticity budget (which can determine key factors for the vorticity variation) to investigate the formation mechanisms of the DBV. Its expression [22] is as follow:
ζ t = k · ( V h p × h ω ) ( ζ + f ) h · V h V h · h ζ ω ζ p β v + D ( ζ ) TIL STR HAV VAV BT RES
where ζ is the relative vorticity, k is the unit vector in the zenith direction, Vh and ω are the horizontal wind vector (subscript “h” indicates the horizontal component), and vertical velocity in p (pressure) coordinate, respectively; f is the Coriolis parameter and β = f y . Terms TIL and STR represent vorticity production/extinction, due to tilting and stretching, respectively; terms HAV and VAV stand for horizontal and vertical transport of vorticity, respectively; term BT shows the “β effect” (i.e., advection of the planetary vorticity), and term RES indicates the residual effect due mainly to friction and sub-grid processes. Define term TOT = HAV + VAV + TIL + BT + STR, which represent the total effect of all right-hand-side terms except for RES. All the derivatives in Equation (1) are calculated using the central difference method on the ERA5 grid.

3. Overview of the Event

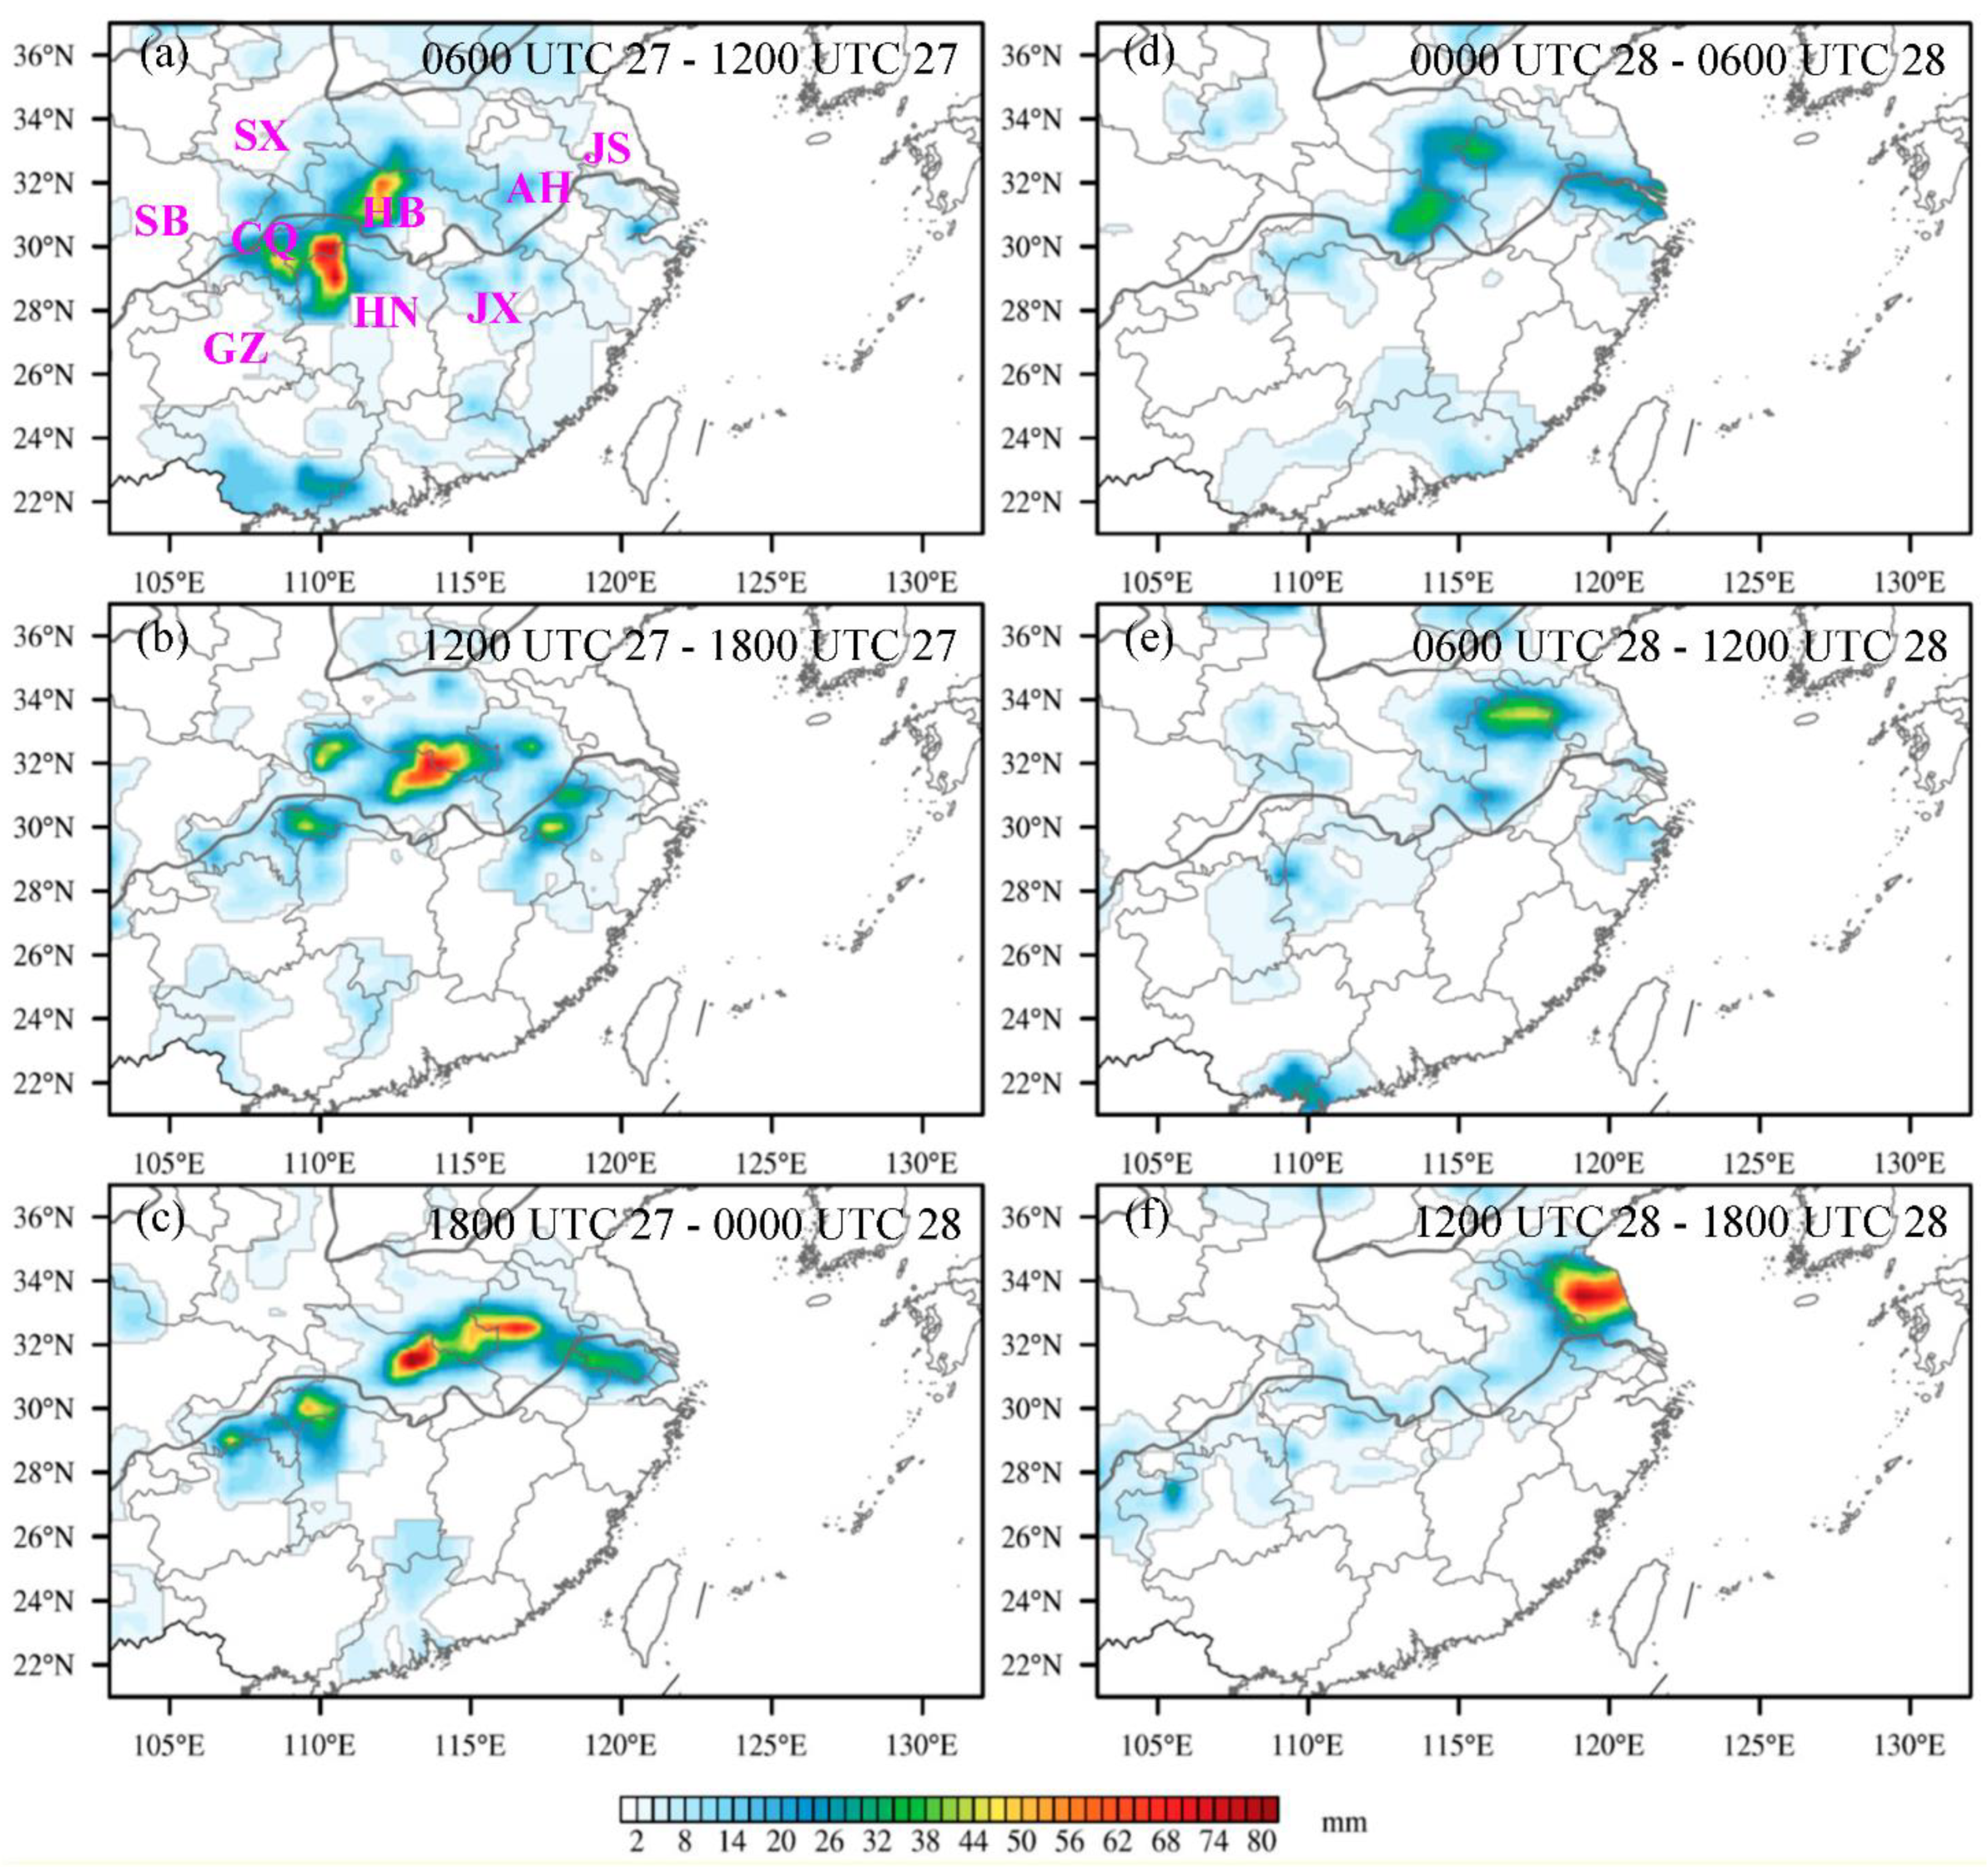
In the 2020 summer, the YRB experienced numerous severe HREs that rendered catastrophic floods [23]. For some regions in the lower reaches (e.g., Hubei, Jiangxi), accumulated precipitation exceeded the same period of 1998, which made 2020, the severest flood year in the past 60 years [4]. From 28 June to 2 July, a long-lived DBV formed east of the Sichuan Basin (Figure 1), moved eastward, and caused a series of heavy precipitation along its track (Figure 2), which resulted in a serious flood in the YRB. This vortex was selected for detailed analyses in this study.

3.1. Variation of the Dabie Vortex

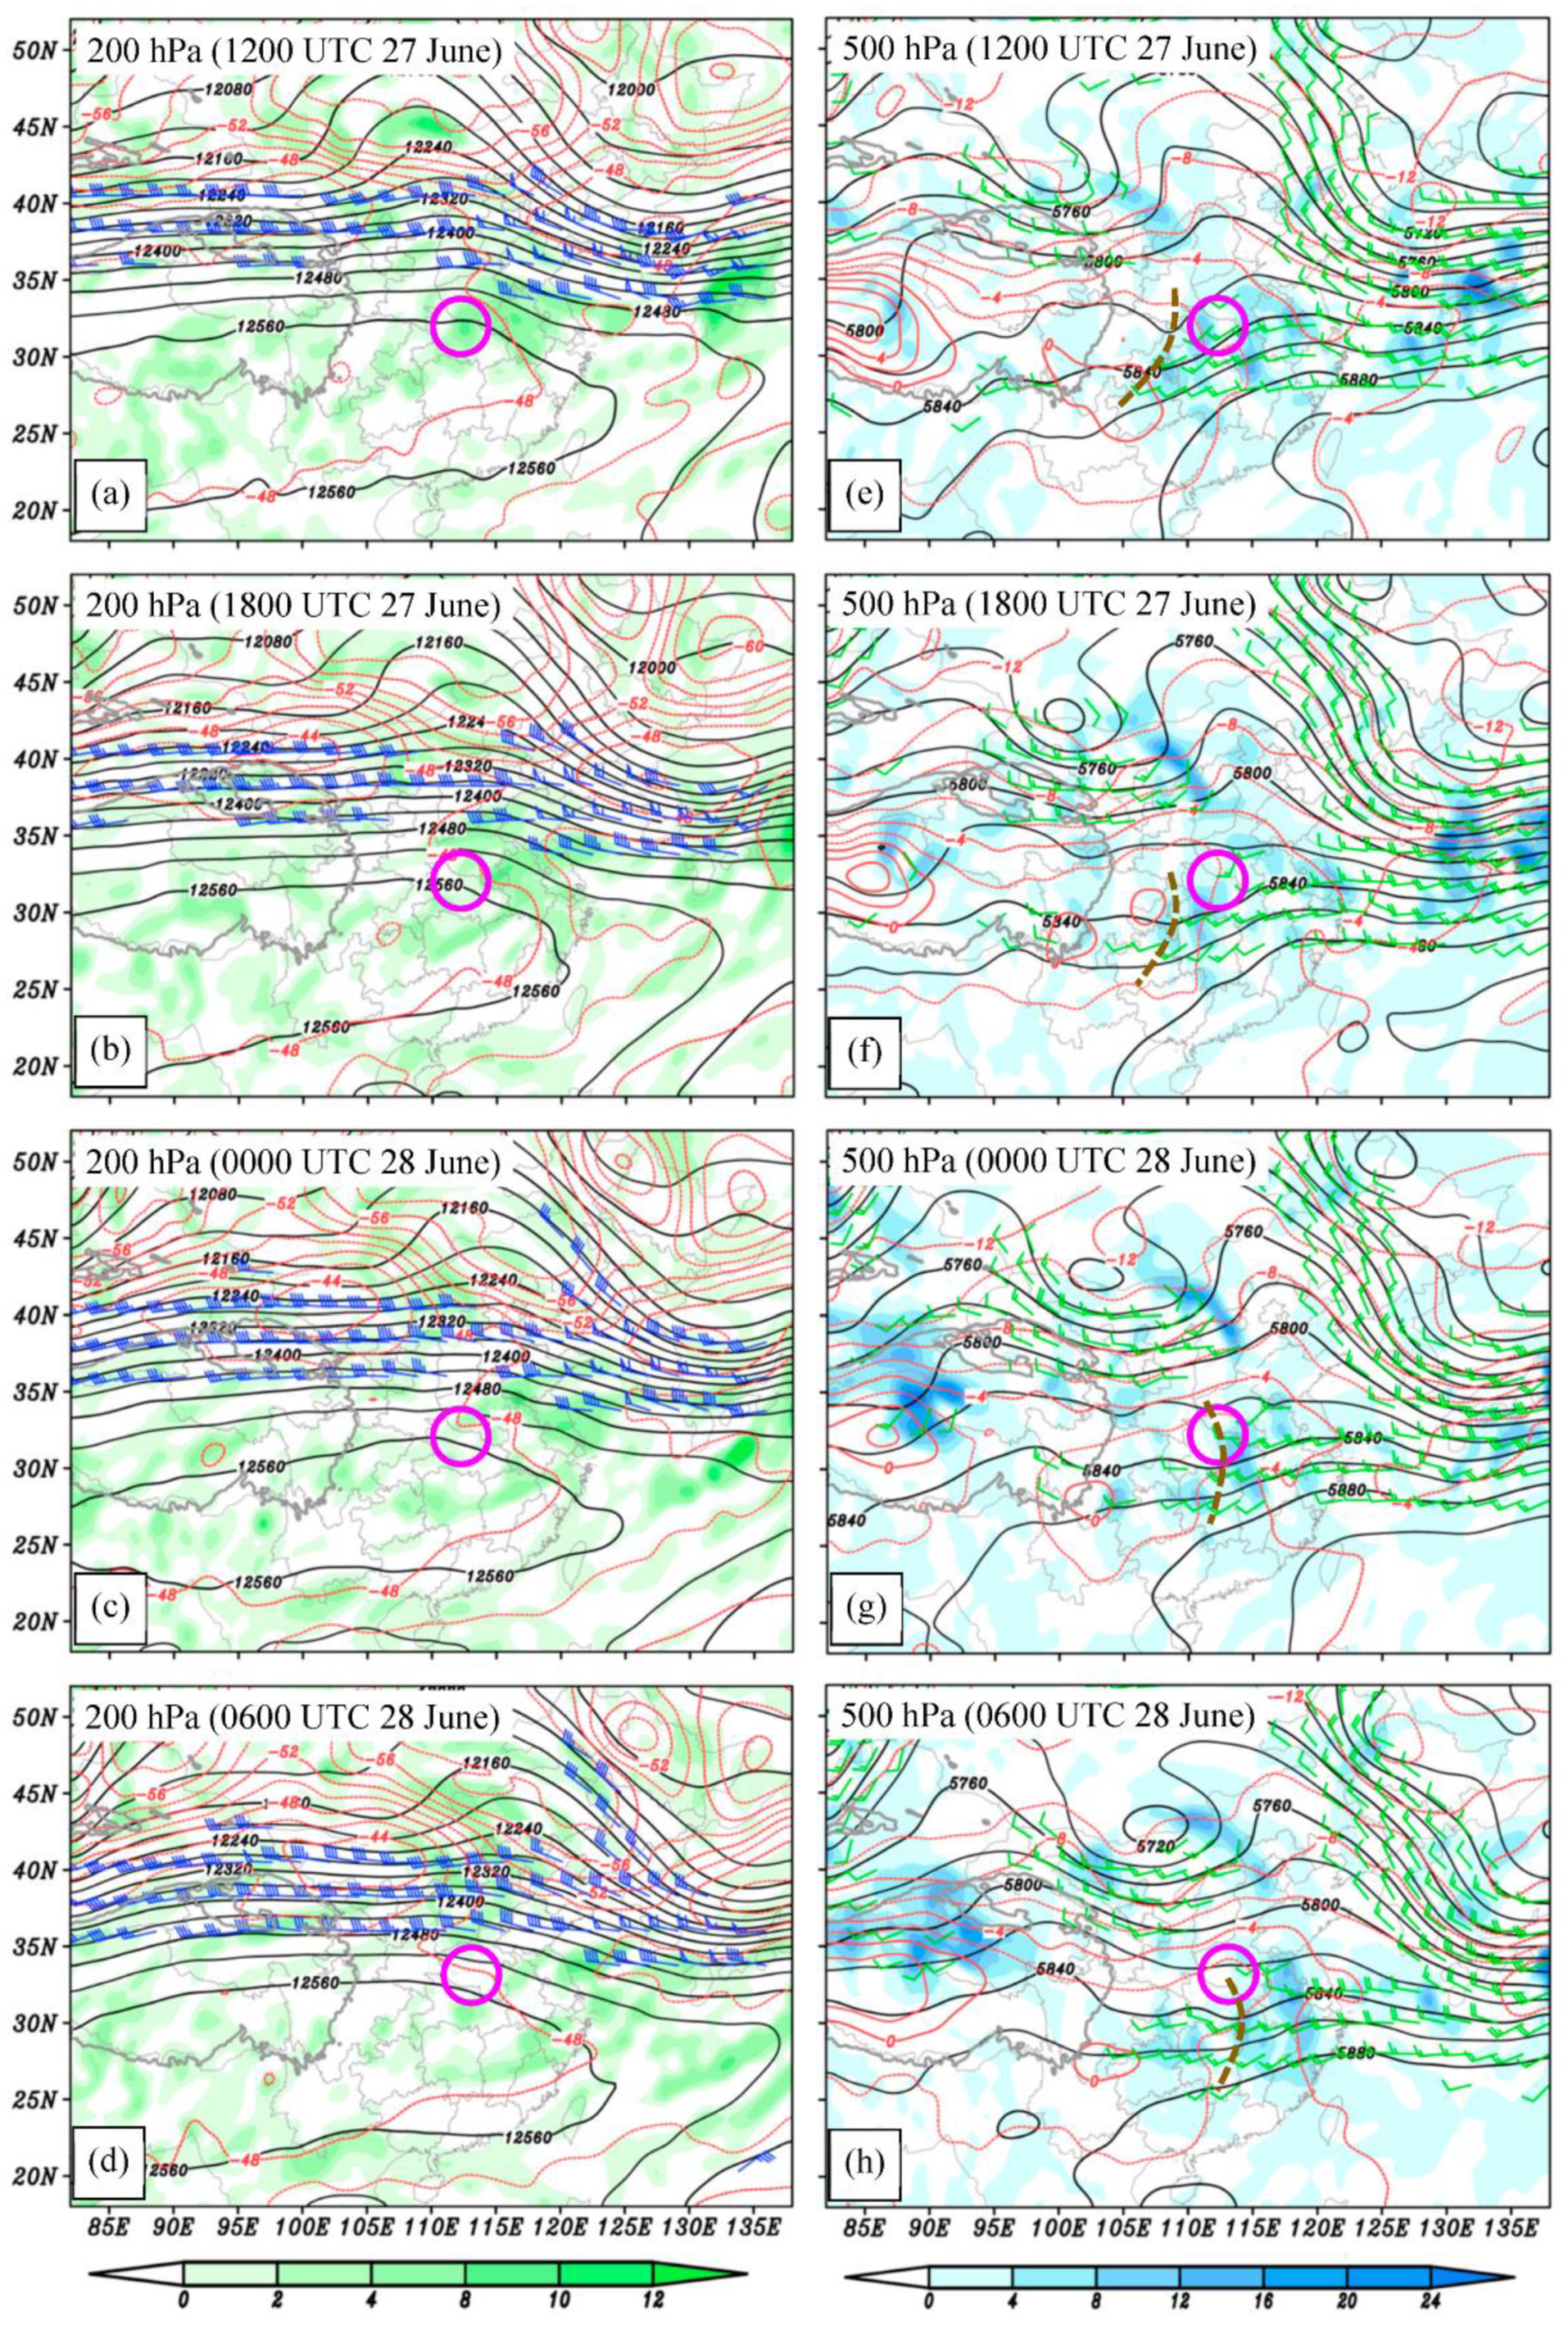
Before 0000 UTC 28 June 2020, Hubei Province and the eastern section of Sichuan Basin were controlled by notable upper-level divergence (Figure 3a,b) that was located south of an upper-level jet (35–40 ºN) and northeast of the South Asian high. Upper-level divergence favored ascending motions at lower levels. In the middle troposphere, this region was governed by strong warm advection ahead of a shortwave (Figure 3e,f). According to quasi-geostrophic omega equation [24], warm advection contributed to ascending motions in this area. In the lower troposphere, an SWV maintained quasi-stationary behavior within the Sichuan Basin (Figure 1a,b), east of which a lower-level shear line enhanced with time (reflected by the growing cyclonic vorticity). During this stage, HREs appeared in Hubei Province (Figure 2a,b), with their centers of 6-h accumulated precipitation exceeding 100 mm.
At 0000 UTC 28 June 2020, the DBV formed (Figure 1c), whereas the SWV dissipated in the meanwhile. Within 6 h after the DBV’s formation, the vortex maintained a quasi-stationary behavior (Figure 1c–e) as the middle-level steering flow was weak around the vortex (Figure 3g,h). In this period, heavy precipitation mainly appeared in the eastern section of the DBV (Figure 2d), but its intensity was weaker than that before DBV’s formation. From 0600 UTC 28 to 0000 UTC 29 June 2020, under relatively strong middle-level westerly steering flow (not shown), the vortex moved eastward, enlarged in the area (reflected by the outmost closed streamline), enhanced in intensity (reflected by cyclonic vorticity) (Figure 1f–j) and precipitation (Figure 2e,f). A 6-h accumulated rainfall center of above 100 mm appeared in Jiangsu Province during this period, which caused a severe flood. It should be noted that from 0000 UTC 28 to 0000 UTC 29 June 2020 the vortex was mainly maintained on land.
From 0000 UTC 29 June 2020 on, the DBV began to move northeastward into the sea (Figure 1k). Over the sea, the vortex enlarged notably in its size and kept intensifying until 1200 UTC 30 June 2020 (Figure 1m), and then it weakened gradually (Figure 1n), which rendered its final dissipation at 0900 UTC 02 July 2020 (Figure 1o). Overall, the DBV lasted for ~102 h and moved ~10° in latitude and 28° in longitude (Figure 1). Considered that the mean life span of DBV is ~36 h [16], the vortex in this study belonged to a long-lived type.

3.2. Variation of the Low-Level Jet

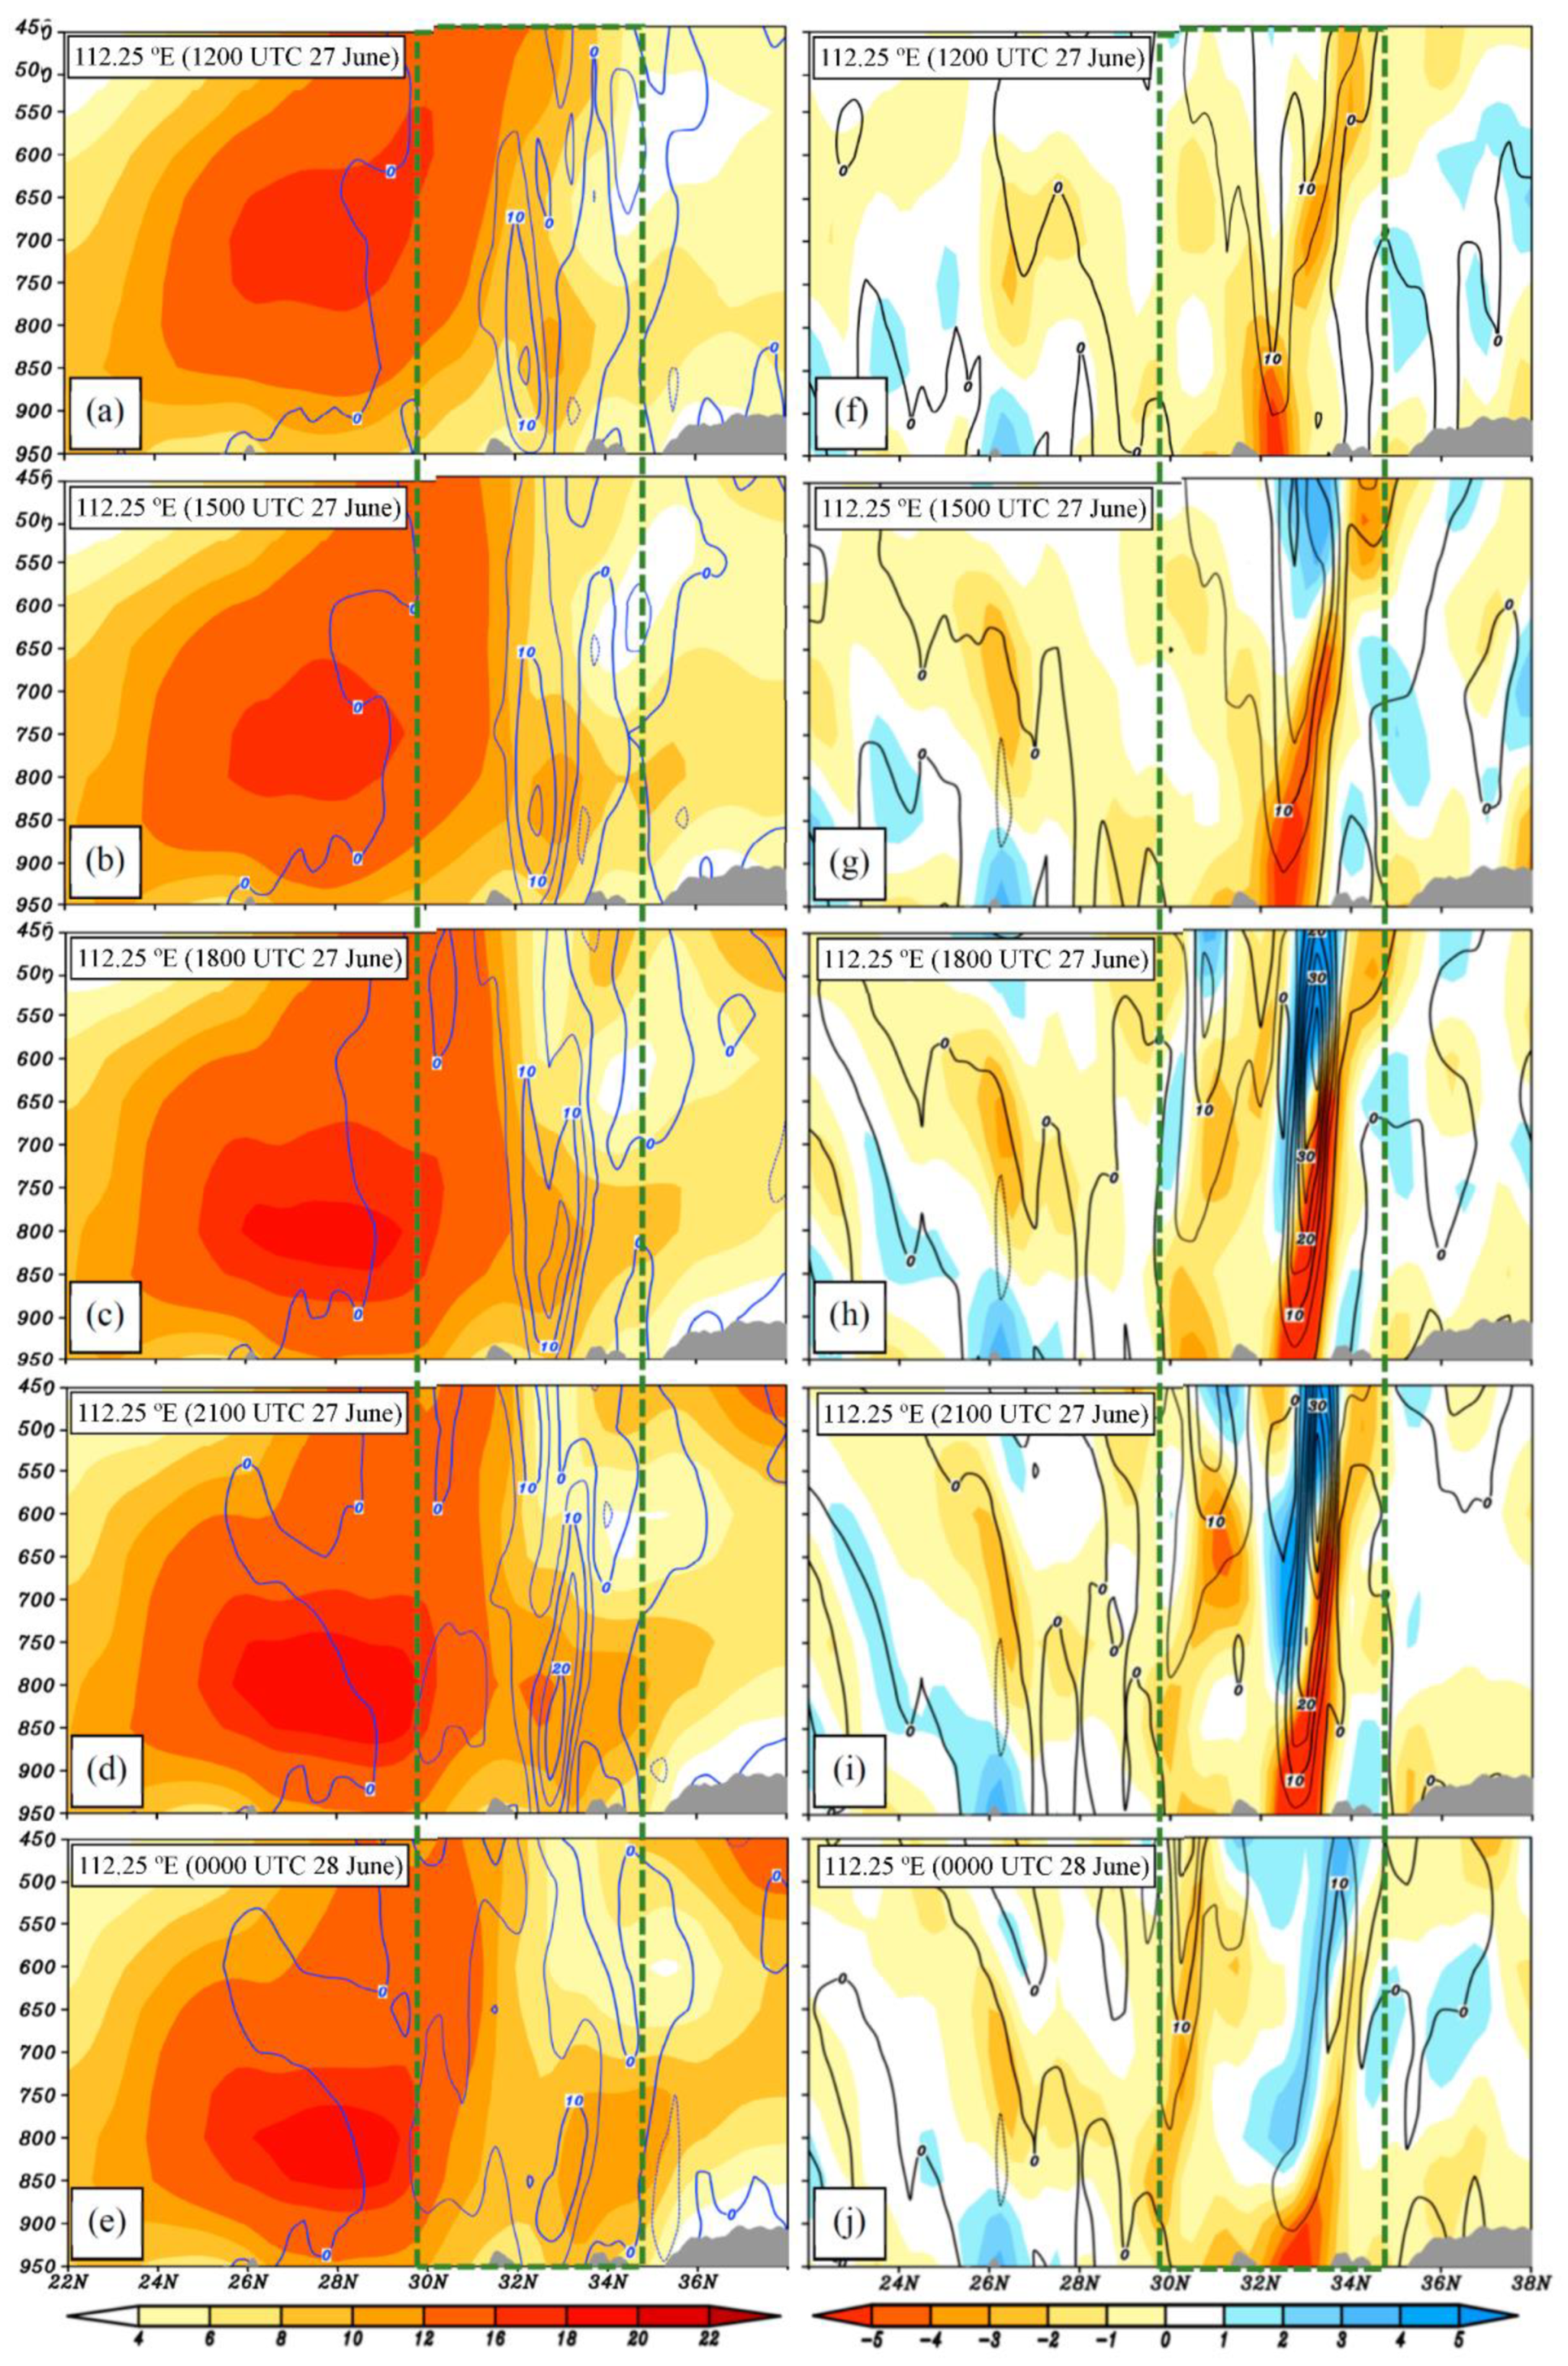
From 0600 UTC to 1500 UTC 26 June 2020, a southwesterly LLJ [25] appeared in the region west of 117° E and south of 28° N (not shown). This LLJ enlarged in the area gradually with time, and by around 1800 UTC 26 June 2020, its northern terminus stretched northward across 28° N (in the meanwhile, an SWV formed within the Sichuan Basin). Then, it continued intensifying until around 2100 UTC 26 June 2020, when it reached the largest area (not shown). After this, the LLJ began to shrink in area, and reached its minimum area at 0600 UTC 27 June 2020. From 0600 UTC to 2100 UTC 27 June 2020, the LLJ developed again (Figure 1a,b and Figure 4a,d). The diurnal variation of the LLJ indicates that it is a nocturnal LLJ [26]. Cross-sections of the LLJ (Figure 4a–e) show that its maximum wind speed center was mainly located below 600 hPa. The intensity of the LLJ also showed diurnal variational features, with the maximum intensity appeared at around 2100 UTC 27 June 2020 (Figure 4d), when its area reached the maximum.
As Figure 1a,b show, enhancement of the LLJ favored intensification of a lower-level shear line east of the Sichuan Basin, which finally contributed to the DBV’s formation. The vortex formed at 0000 UTC 28 June 2020, ~3 h after the LLJ reached its maximum area and intensity (Figure 1c and Figure 4d,e). From 0000 UTC to 0900 UTC 28 June 2020, as the LLJ weakened, the DBV weakened both in central cyclonic vorticity (Figure 1c–f) and precipitation (Figure 2c–e). Then, from 0900 UTC to 2100 UTC 28 June 2020, as the LLJ intensified, the DBV enhanced in intensity and enlarged in the area again (Figure 1f–j). From 0000 UTC 29 June 2020 on, the vortex moved eastward into the sea (Figure 1j–n). After the DBV entered the sea, the LLJ south of it reduced notably both in range and intensity, whereas, wind speed east of the vortex intensified rapidly, due to its merging with the strong wind band west of an anticyclone that was located east of the DBV (not shown).

4. Formation of the Dabie Vortex

To analyze the formation of the DBV, this study specified a (5° latitude × 6° longitude) rectangle (black boxes in Figure 1) to focus on the central region of the vortex [20,27]. This box is named as the key region (KR) of the DBV, which was defined according to the temporal mean size of the vortex. A sensitivity test showed that the calculation results based on the KR were insensitive to relatively small changes (±0.5°) to its boundary lines (not shown). Since the period of 1200 UTC 27-0000 UTC 28 June 2020 featured the rapidest enhancement of LLJ south of the DBV and the largest increasing rate of cyclonic vorticity within the KR before the vortex formation, this period was defined as the formation stage of the DBV.

4.1. Variations of Conditions around the KR of the Dabie Vortex

For the areas south of the KR, as the LLJ enhanced from 1200 UTC to 2100 UTC 27 June 2020, a maximum wind speed center of exceeding 18 m s−1 appeared in the layer of 750–850 hPa, around 26–30° N (Figure 4a–d). The formation of this maximum wind speed center was mainly due to the rapid increase of southerly wind (black lines in Figure 5a,d), and the enhancement of westerly wind was also favorable. In the meanwhile, convergence in this layer and region also intensified (Figure 4f–i), whereas, the vertical motions and vorticity kept weak. From 2100 UTC 27 to 0000 UTC 28 June 2020 (when the DBV formed), the maximum wind speed center weakened (Figure 4d,e), mainly due to the weakening of the southerly wind (Figure 5e). In contrast, the westerly wind was enhanced in this period, with a center of above 16 m s−1 appeared.
For the areas within the KR, from 1200 UTC to 2100 UTC 27 June 2020, the wind speed increased rapidly (Figure 4a–d), and as the LLJ reached its maximum intensity at 2100 UTC 27 June 2020, a new maximum wind speed center of above 12 m s−1 appeared around 800 hPa (Figure 4d). The formation of this maximum wind speed center was mainly due to the enhancement of westerly wind (blue lines in Figure 5a–d), which was not directly related to the LLJ. During this period, a strong positive vorticity column (below 600 hPa) maintained around 33° N and intensified rapidly with time, which was corresponded to the formation process of the DBV. Associated with the enhancing strong positive vorticity column, ascending motions, lower-layer convergence (according to Figure 4f–j and Figure 5a–e, the intense convergence was located around the northern terminus of the strong LLJ-related southerly wind), and upper-layer divergence were getting stronger with time (Figure 4f–i). North of this vorticity column, negative vorticity appeared and weakened with time (Figure 4a–d), which also contributed to the DBV’s formation. From 2100 UTC 27 to 0000 UTC 28 June 2020 (when the DBV formed), the maximum wind speed center disappeared (Figure 4d,e), mainly due to the weakening of the southerly wind (black lines in Figure 5d,e). In the meanwhile, the strong positive vorticity column weakened notably (Figure 4d,e), and its associated ascending motions, lower-layer convergence, and upper-layer divergence all reduced notably in intensity (Figure 4i,j). In contrast, north and south of the strong vorticity column, negative vorticity vanished, and positive vorticity became dominant (Figure 4d–e). This means that the distribution of positive vorticity became more uniform as the DBV formed.

4.2. Vorticity Budget on the Formation of the Dabie Vortex

Based on Equation (1), each term of the vorticity budget was first calculated and then averaged within the DBV’s KR. Before analyses, an evaluation of the balance of the equation was conducted. The results indicate that the ratio of the left-hand-side term (i.e., the local time derivative) to the term TOT was between 0.72 and 0.91, with a mean value of 0.81 (not shown). This means that after neglecting the term RES (which mainly includes the friction-related effects, calculation errors, and sub-grid processes), the balance of the equation is good (i.e., the budget results are reliable), and thus, the vorticity budget results can be used for further analyses.
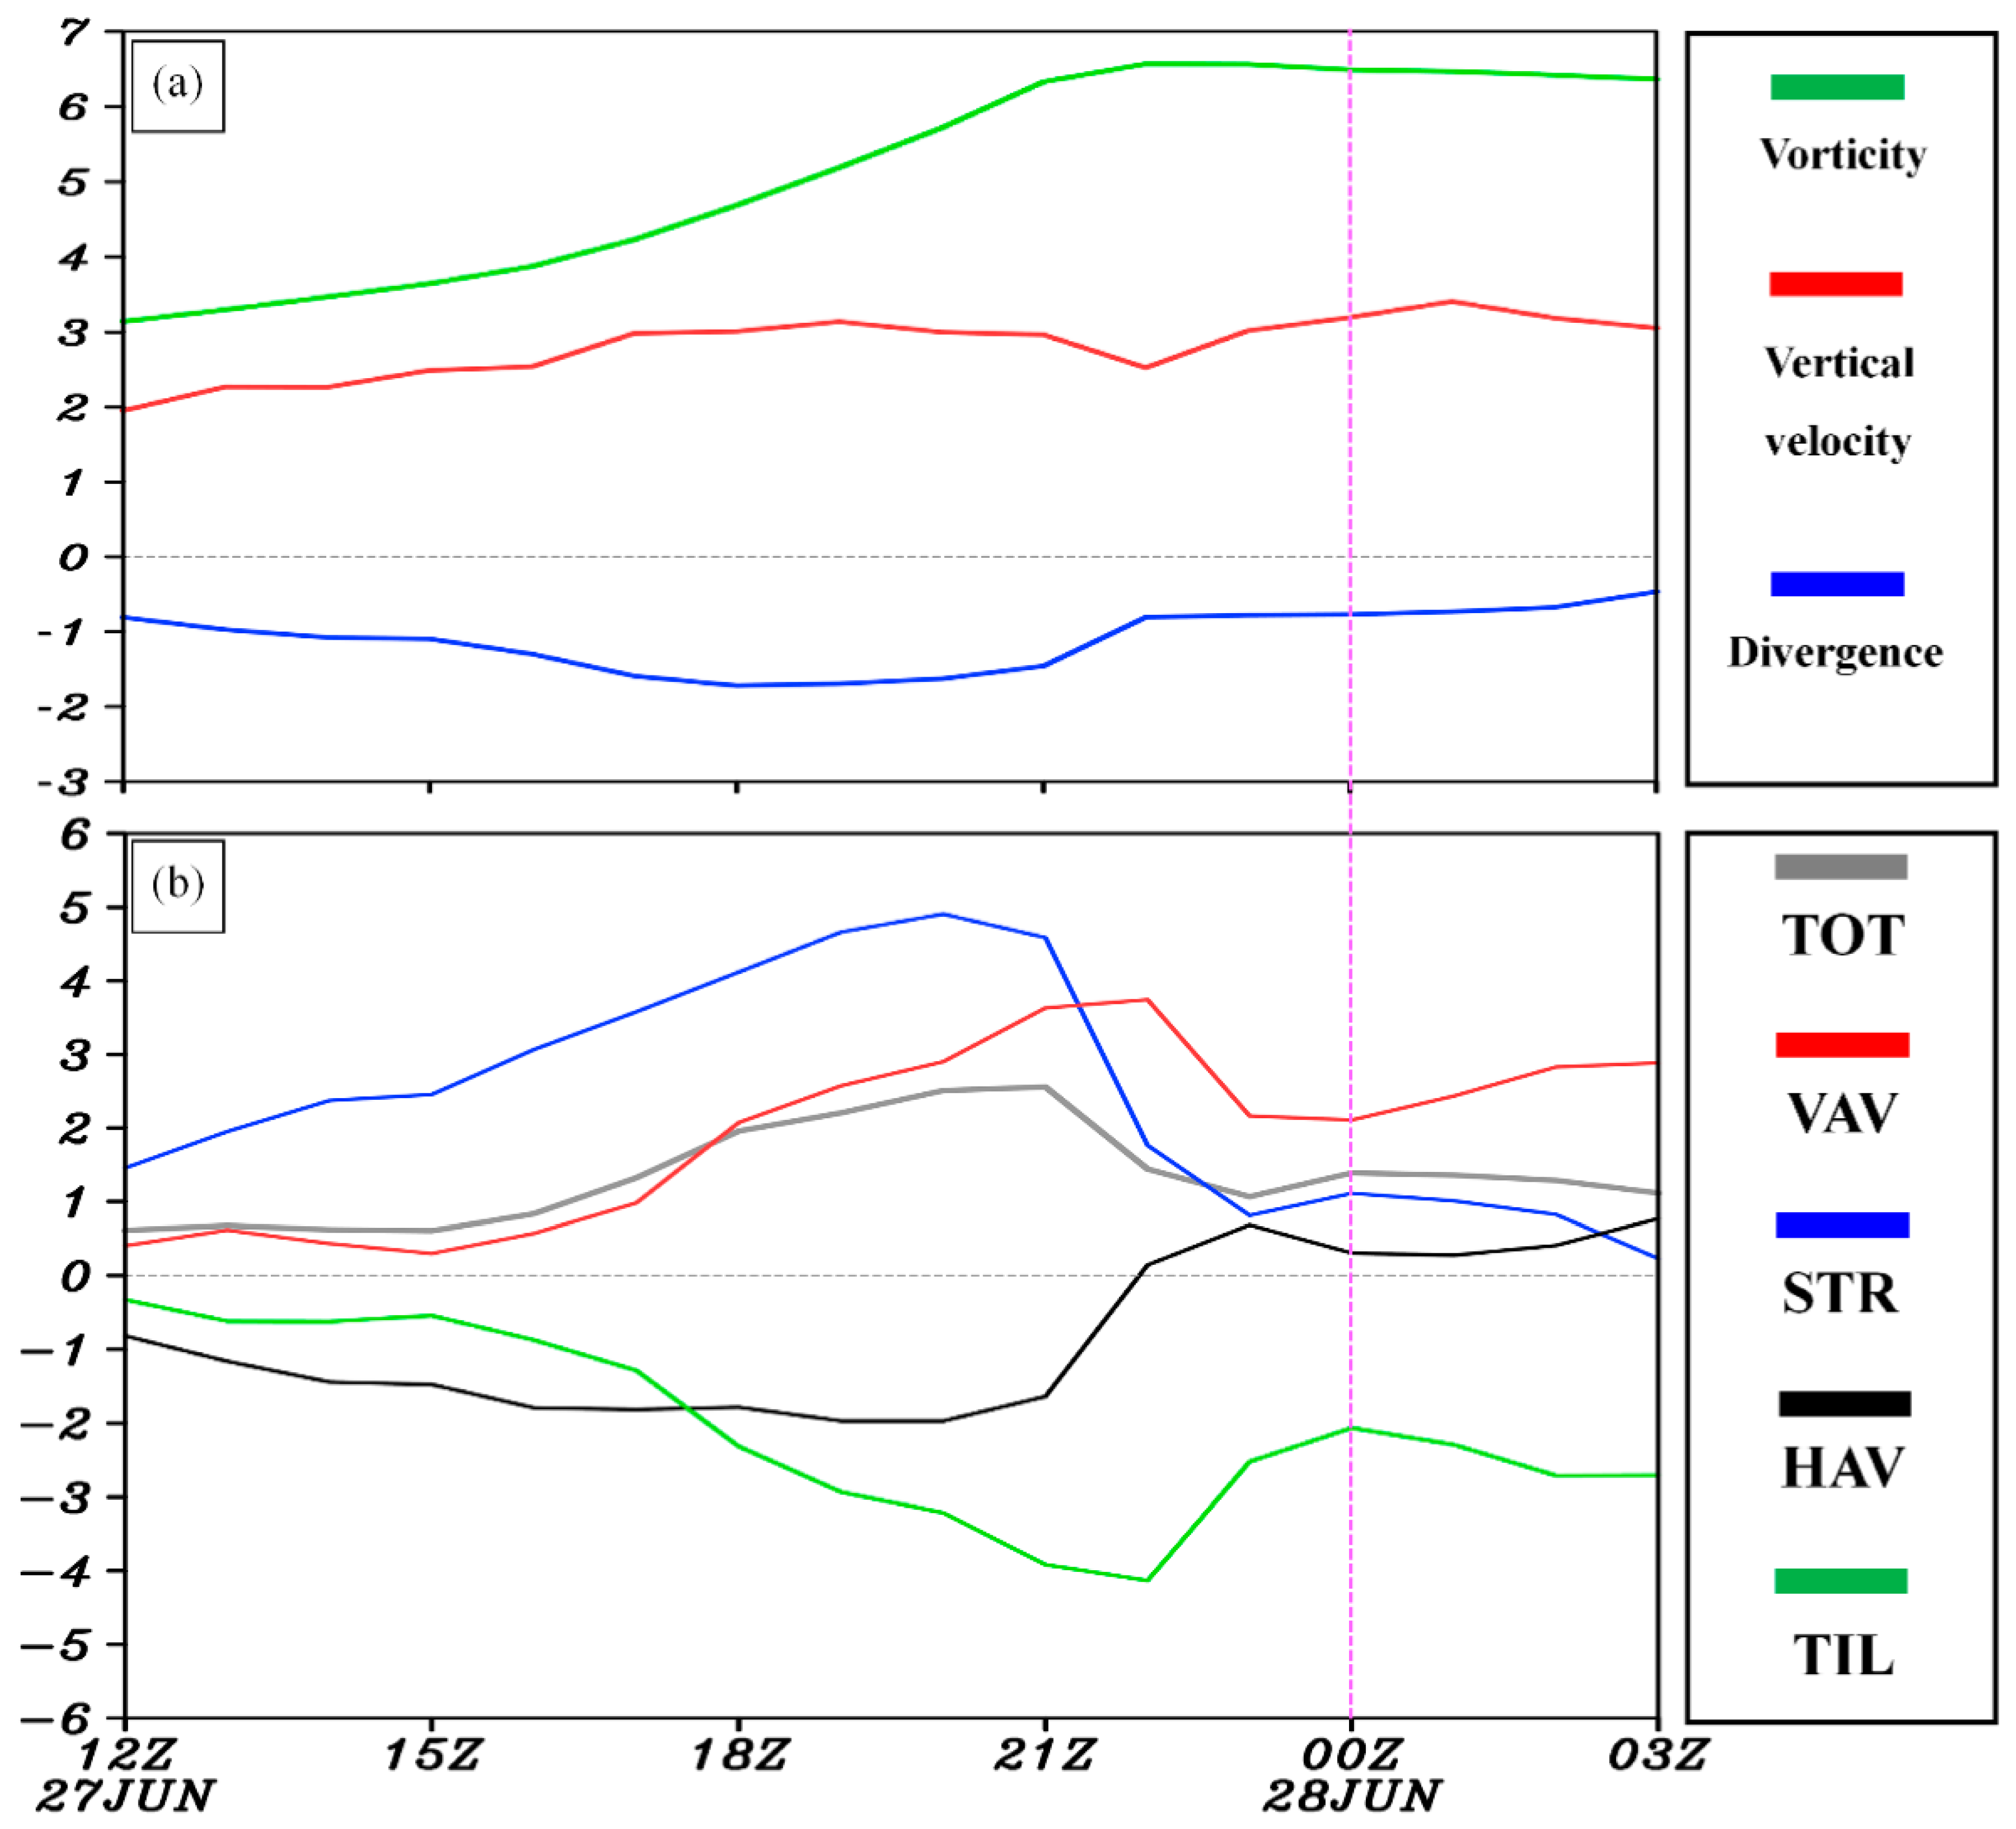
As Figure 6a shows, during the formation stage of the DBV, within its KR, cyclonic vorticity at 850 hPa ([16], this is the central level of DBV) experienced rapid increase, which can also be reflected by the notably positive TOT in Figure 6b. From the zonally averaged cross-section (Figure 7a–e), it can be found that the distribution of TOT was inhomogeneous. A strong positive TOT center appeared within 32–34 ºN around 850 hPa (875–825 hPa), which was corresponded to the strong positive vorticity center there (Figure 4a–e). Comparison among each vorticity budget term shows that strong convergence (Figure 4f–j) related to STR (Figure 5a–e) was the dominant factor (this is consistent with the overall features, shown in Figure 6b). The strong convergence was mainly due to the LLJ-related southerly wind that crossed the southern boundary of the DBV’s KR and the easterly wind that crossed the eastern boundary (Figure 5a–e). Strong ascending motion-related VAV (Figure 8a–e) was another favorable factor for the appearance of the positive TOT, which mainly transported cyclonic vorticity generated below 850 hPa upward. As Figure 6b shows, before 2100 UTC 27 June 2020, STR had a larger contribution than VAV; then, as ascending motions within the KR grew more intense, their relative importance reversed.
Overall, during the formation stage, HAV mainly acted to reduce cyclonic vorticity within the DBV’s KR (Figure 6b), which decelerated the DBV’s formation. As Figure 4a–e show, around 850 hPa (875–825 hPa), south of the KR, anticyclonic vorticity was dominant, whereas, within the KR, cyclonic vorticity was dominant. In the meanwhile, the LLJ-related southerly wind controlled the regions around the southern boundary of the KR (Figure 9a–e). This configuration means that the southerly wind transported anticyclonic vorticity south of the KR into it through its southern boundary, which rendered a negative HAV. Another notable negative HAV appeared around the eastern boundary of the KR (Figure 9f–j), mainly due to the export transport of cyclonic vorticity from the KR across its eastern boundary by the westerly wind. Compared to HAV, TIL showed an overall stronger effect on decelerating the DBV’s formation (Figure 6b). From Figure 7a–e, it can be seen that within the vortex’s KR, TIL was distributed unevenly. In general, positive TIL (around 850 hPa) tended to appear in areas with negative TOT, whereas, negative TIL tended to appear in areas with positive TOT. This means that TIL tended to reduce the amplitude of vorticity’s variation.

5. Conclusions and Discussion

A series of previous studies had confirmed that a DBV tended to form when an LLJ appeared around it. In this study, a long-lived eastward-moving DBV that caused a severe flood over the YRB in the 2020 summer was selected to understand the relationship between DBV’s evolution and LLJ’s variation, as well as the mechanisms of how LLJ affects DBV’s formation. It is found that in this event, the LLJ was belonged to a nocturnal LLJ type, as it showed a notable diurnal cycle, with its maximum appeared around 2100 UTC (local time is 0500) and minimum occurred around 0600 UTC (local time is 1400), respectively. The DBV did not form at the time when the LLJ reached maximum range and intensity; instead, it was generated ~3 h after the LLJ’s maximum. Diurnal cycle of LLJ affected both precipitation and intensity of the DBV. Overall, as the LLJ intensified, vortex’s precipitation and intensity both enhanced, and vice versa. Moreover, over the land, the DBV showed a closer relation to the LLJ than when the vortex was over the sea.
During the DBV’s formation stage, the LLJ played a dominant role. On the one hand, it caused intense lower-level convergence around its northern terminus, located within the vortex’ KR. This convergence (i) directly produced cyclonic vorticity (i.e., STR), which dominated the vorticity increase within the KR, and (ii) it enhanced the ascending motions, which contributed to the upward cyclonic vorticity transport. This vertical transport acted as the second dominant factor for the DBV’s formation. On the other hand, (i) the LLJ induced import of anticyclonic vorticity into the KR through its southern boundary, which decelerated the DBV’s formation; and (ii) the LLJ-related to strong ascending motions tilted horizontal vorticity into negative vertical vorticity, which reduced the growth rate of cyclonic vorticity within the KR. Overall the positive effect of LLJ was stronger than its negative effect, which applied a net favorable effect on the DBV’s formation.
It should be noted that the results of this study were derived from a single event. Although this can be regarded as a representative for similar events, we do not know how many proportions it can represent. Nor do we know whether there are other completely different relations between LLJs and DBVs. Therefore, in the future, more LLJs and DBVs should be investigated, which will render a more comprehensive understanding of this type of event.

Author Contributions

Conceptualization, S.-M.F. and H.T.; methodology, S.-M.F.; software, H.T.; validation, Y.L., H.M. and J.-H.S.; formal analysis, S.-M.F.; investigation, S.-M.F.; resources, H.T.; data curation, Y.L.; writing—original draft preparation, S.-M.F.; writing—review and editing, Y.L.; visualization, H.T.; supervision, H.M.; project administration, J.-H.S.; funding acquisition, S.-M.F. All authors have read and agreed to the published version of the manuscript.

Funding

This research was funded by the Science and Technology Foundation of State Grid Corporation of China (Grant No. 5200-202016243A-0-0-00).

Institutional Review Board Statement

Not applicable.

Informed Consent Statement

Not applicable.

Data Availability Statement

The ECMWF ERA5 reanalysis dataset used in this study are openly available in Copernicus Climate Change Service Climate Data Store at https://cds.climate.copernicus.eu/cdsapp#!/home, reference number [21].

Acknowledgments

The author would like to thank ECMWF for providing the ERA5 reanalysis data (https://www.ecmwf.int/en/forecasts/datasets/reanalysis-datasets/era5). This work was supported by the Science and Technology Foundation of State Grid Corporation of China (grant No. 5200-202016243A-0-0-00).

Conflicts of Interest

The authors declare no conflict of interest.

References

  1. Wu, J.D.; Fu, Y.; Zhang, J.; Li, N. Meteorological disaster trend analysis in China: 1949–2013. J. Nat. Resour. 2014, 29, 1520–1530. (In Chinese) [Google Scholar]
  2. Tao, S.Y. Rainstorms in China; Science Press: Beijing, China, 1980; p. 225. (In Chinese) [Google Scholar]
  3. Zhao, S.X.; Tao, Z.Y.; Sun, J.H.; Bei, N.F. Study on Mechanism of Formation and Development of Heavy Rainfalls on Meiyu Front in Yangtze River; China Meteorological Press: Beijing, China, 2004; p. 282. (In Chinese) [Google Scholar]
  4. Wei, K.; Ouyang, C.; Duan, H.; Li, Y.; Chen, M.; Ma, J.; An, H.; Zhou, S. Reflections on the catastrophic 2020 Yangtze River basin flooding in southern china. Innovation 2020, 1, 100038. [Google Scholar] [CrossRef]
  5. Kuo, Y.H.; Cheng, L.S.; Bao, J.W. Numerical simulation of the 1981 Sichuan flood. Part 1: Evolution of a mesoscale southwest vortex. Mon. Weather Rev. 1988, 116, 2481–2504. [Google Scholar] [CrossRef] [Green Version]
  6. Wang, Q.W.; Tan, Z.M. Multi-scale topographic control of southwest vortex formation in Tibetan Plateau region in an idealized simulation. J. Geophys. Res. Atmos. 2014, 119, 11543–11561. [Google Scholar] [CrossRef]
  7. Fu, S.M.; Yu, F.; Wang, D.H.; Xia, R.D. A comparison of two kinds of eastward-moving mesoscale vortices during the mei-yu period of 2010. Sci China Earth Sci. 2013, 56, 282–300. [Google Scholar] [CrossRef]
  8. Fu, S.M.; Li, W.L.; Sun, J.H.; Zhang, Y.C. Universal evolution mechanisms and energy conversion characteristics of long-lived mesoscale vortices over the Sichuan Basin. Atmos. Sci. Lett. 2015, 16, 127–134. [Google Scholar] [CrossRef]
  9. Sun, J.H.; Wei, J.; Fu, S.M.; Zhang, Y.C.; Wang, H.J. The multi-scale physical model for persistent heavy rainfall events in the Yangtze-Huaihe River Valley. Chin. J. Atmos. Sci. 2018, 42, 741–754. (In Chinese) [Google Scholar]
  10. Feng, X.B. The Evolution of Rainfall Distribution and Environmental Impact on Landfalling Tropical Cyclones over China. Master’s Thesis, Nanjing University, Nanjing, China, 2019; 58p. (In Chinese). [Google Scholar]
  11. Luo, Y.L.; Sun, J.S.; Li, Y.; Xia, R.; Du, Y.; Yang, S.; Zhang, Y.; Chen, J.; Dai, K.; Shen, X.; et al. Science and prediction of heavy rainfall over China: Research progress since the reform and opening-up of new China. J. Meteorol. Res. 2020, 34, 427–459. [Google Scholar] [CrossRef]
  12. Lu, J.H. Generality of the Southwest Vortex; China Meteorological Press: Beijing, China, 1986. (In Chinese) [Google Scholar]
  13. Gu, W.L. The Statistical Analysis and Simulation Research of Mesoscale Vortex along the Meiyu Front over the Lower Reach of Yangtze River in China. Master’s Thesis, Nanjing University of Information Science and Technology, Nanjing, China, 2008; 77p. (In Chinese). [Google Scholar]
  14. Yang, Y.M.; Gu, W.L.; Zhao, R.L.; Liu, J. The statistical analysis of low vortex during Meiyu season in the lower reaches of the Yangtze. J. Appl. Meteorol. Sci. 2010, 21, 11–18. (In Chinese) [Google Scholar]
  15. Zhang, J.P.; Fu, S.M.; Sun, J.H.; Shen, X.Y.; Zhang, Y.C. A statistical and compositional study on the two types of mesoscale vortices over the Yangtze River basin. Clim. Environ. Res. 2015, 20, 319–336. [Google Scholar]
  16. Fu, S.M.; Zhang, J.P.; Sun, J.H.; Zhao, T.B. Composite analysis of long-lived mesoscale vortices over the middle reaches of the Yangtze River valley: Octant features and evolution mechanisms. J. Clim. 2016, 29, 761–781. [Google Scholar] [CrossRef]
  17. Dong, P.M.; Zhao, S.X. A diagnostic study of mesoscale lows (disturbances) on Meiyu front and associated heavy rainfall. Chin. J. Atmos. Sci. 2004, 28, 876–891. (In Chinese) [Google Scholar]
  18. Sun, J.H.; Zhao, S.X.; Xu, G.K.; Meng, Q.T. Study on a mesoscale convective vortex causing heavy rainfall during the mei-yu season in 2003. Adv. Atmos. Sci. 2010, 27, 1193–1209. [Google Scholar] [CrossRef]
  19. Li, W.L.; Xia, R.D.; Sun, J.H.; Fu, S.M.; Chen, B.F.; Tian, F.Y. Layer-wise formation mechanisms of an entire-troposphere-thick extratropical cyclone that induces a record-breaking catastrophic rainstorm in Beijing. J. Geophys. Res. Atmos. 2019, 124, 10567–10591. [Google Scholar] [CrossRef]
  20. Fu, S.M.; Sun, J.H.; Luo, Y.L.; Zhang, Y.C. Formation of long-lived summertime mesoscale vortices over central east China: Semi-idealized simulations based on a 14-year vortex statistic. J. Atmos. Sci. 2017, 74, 3955–3979. [Google Scholar] [CrossRef]
  21. Hans, H.; Bill, B.; Paul, B.; Shoji, H.; Jeankmol, T. The ERA5 global reanalysis. Quart. J. R. Meteorol. Soc. 2020, 146, 1999–2049. [Google Scholar]
  22. Kirk, J.R. Comparing the dynamical development of two mesoscale convective vortices. Mon. Weather Rev. 2003, 131, 862–890. [Google Scholar] [CrossRef]
  23. Liu, B.Q.; Yan, Y.H.; Zhu, C.W.; Ma, S.M.; Li, J.Y. Record breaking Meiyu rainfall around Yangtze River in 2020 regulated by the subseasonal phase transition of North Atlantic Oscillation. Geopys. Res. Lett. 2020, 47, e2020GL090342. [Google Scholar] [CrossRef]
  24. Holton, J.R. An Introduction to Dynamic Meteorology; Academic Press: San Diego, CA, USA, 2004. [Google Scholar]
  25. Du, Y.; Chen, G.X. Climatology of low-level jets and their impact on rainfall over southern China during early-summer rainy season. J. Clim. 2019, 32, 8813–8833. [Google Scholar] [CrossRef]
  26. He, M.Y.; Liu, H.B.; Wang, B.; Zhang, D.L. A modeling study of a low-level jet along the Yun-Gui Plateau in South China. J. Appl. Meteorol. Climatol. 2016, 55, 41–60. [Google Scholar] [CrossRef]
  27. Fu, S.M.; Zhang, J.P.; Tang, H.; Jiang, L.Z.; Sun, J.H. A new mesoscale-vortex identification metric: Restricted vorticity and its application. Environ. Res. Lett. 2020, 15, 124053. [Google Scholar] [CrossRef]
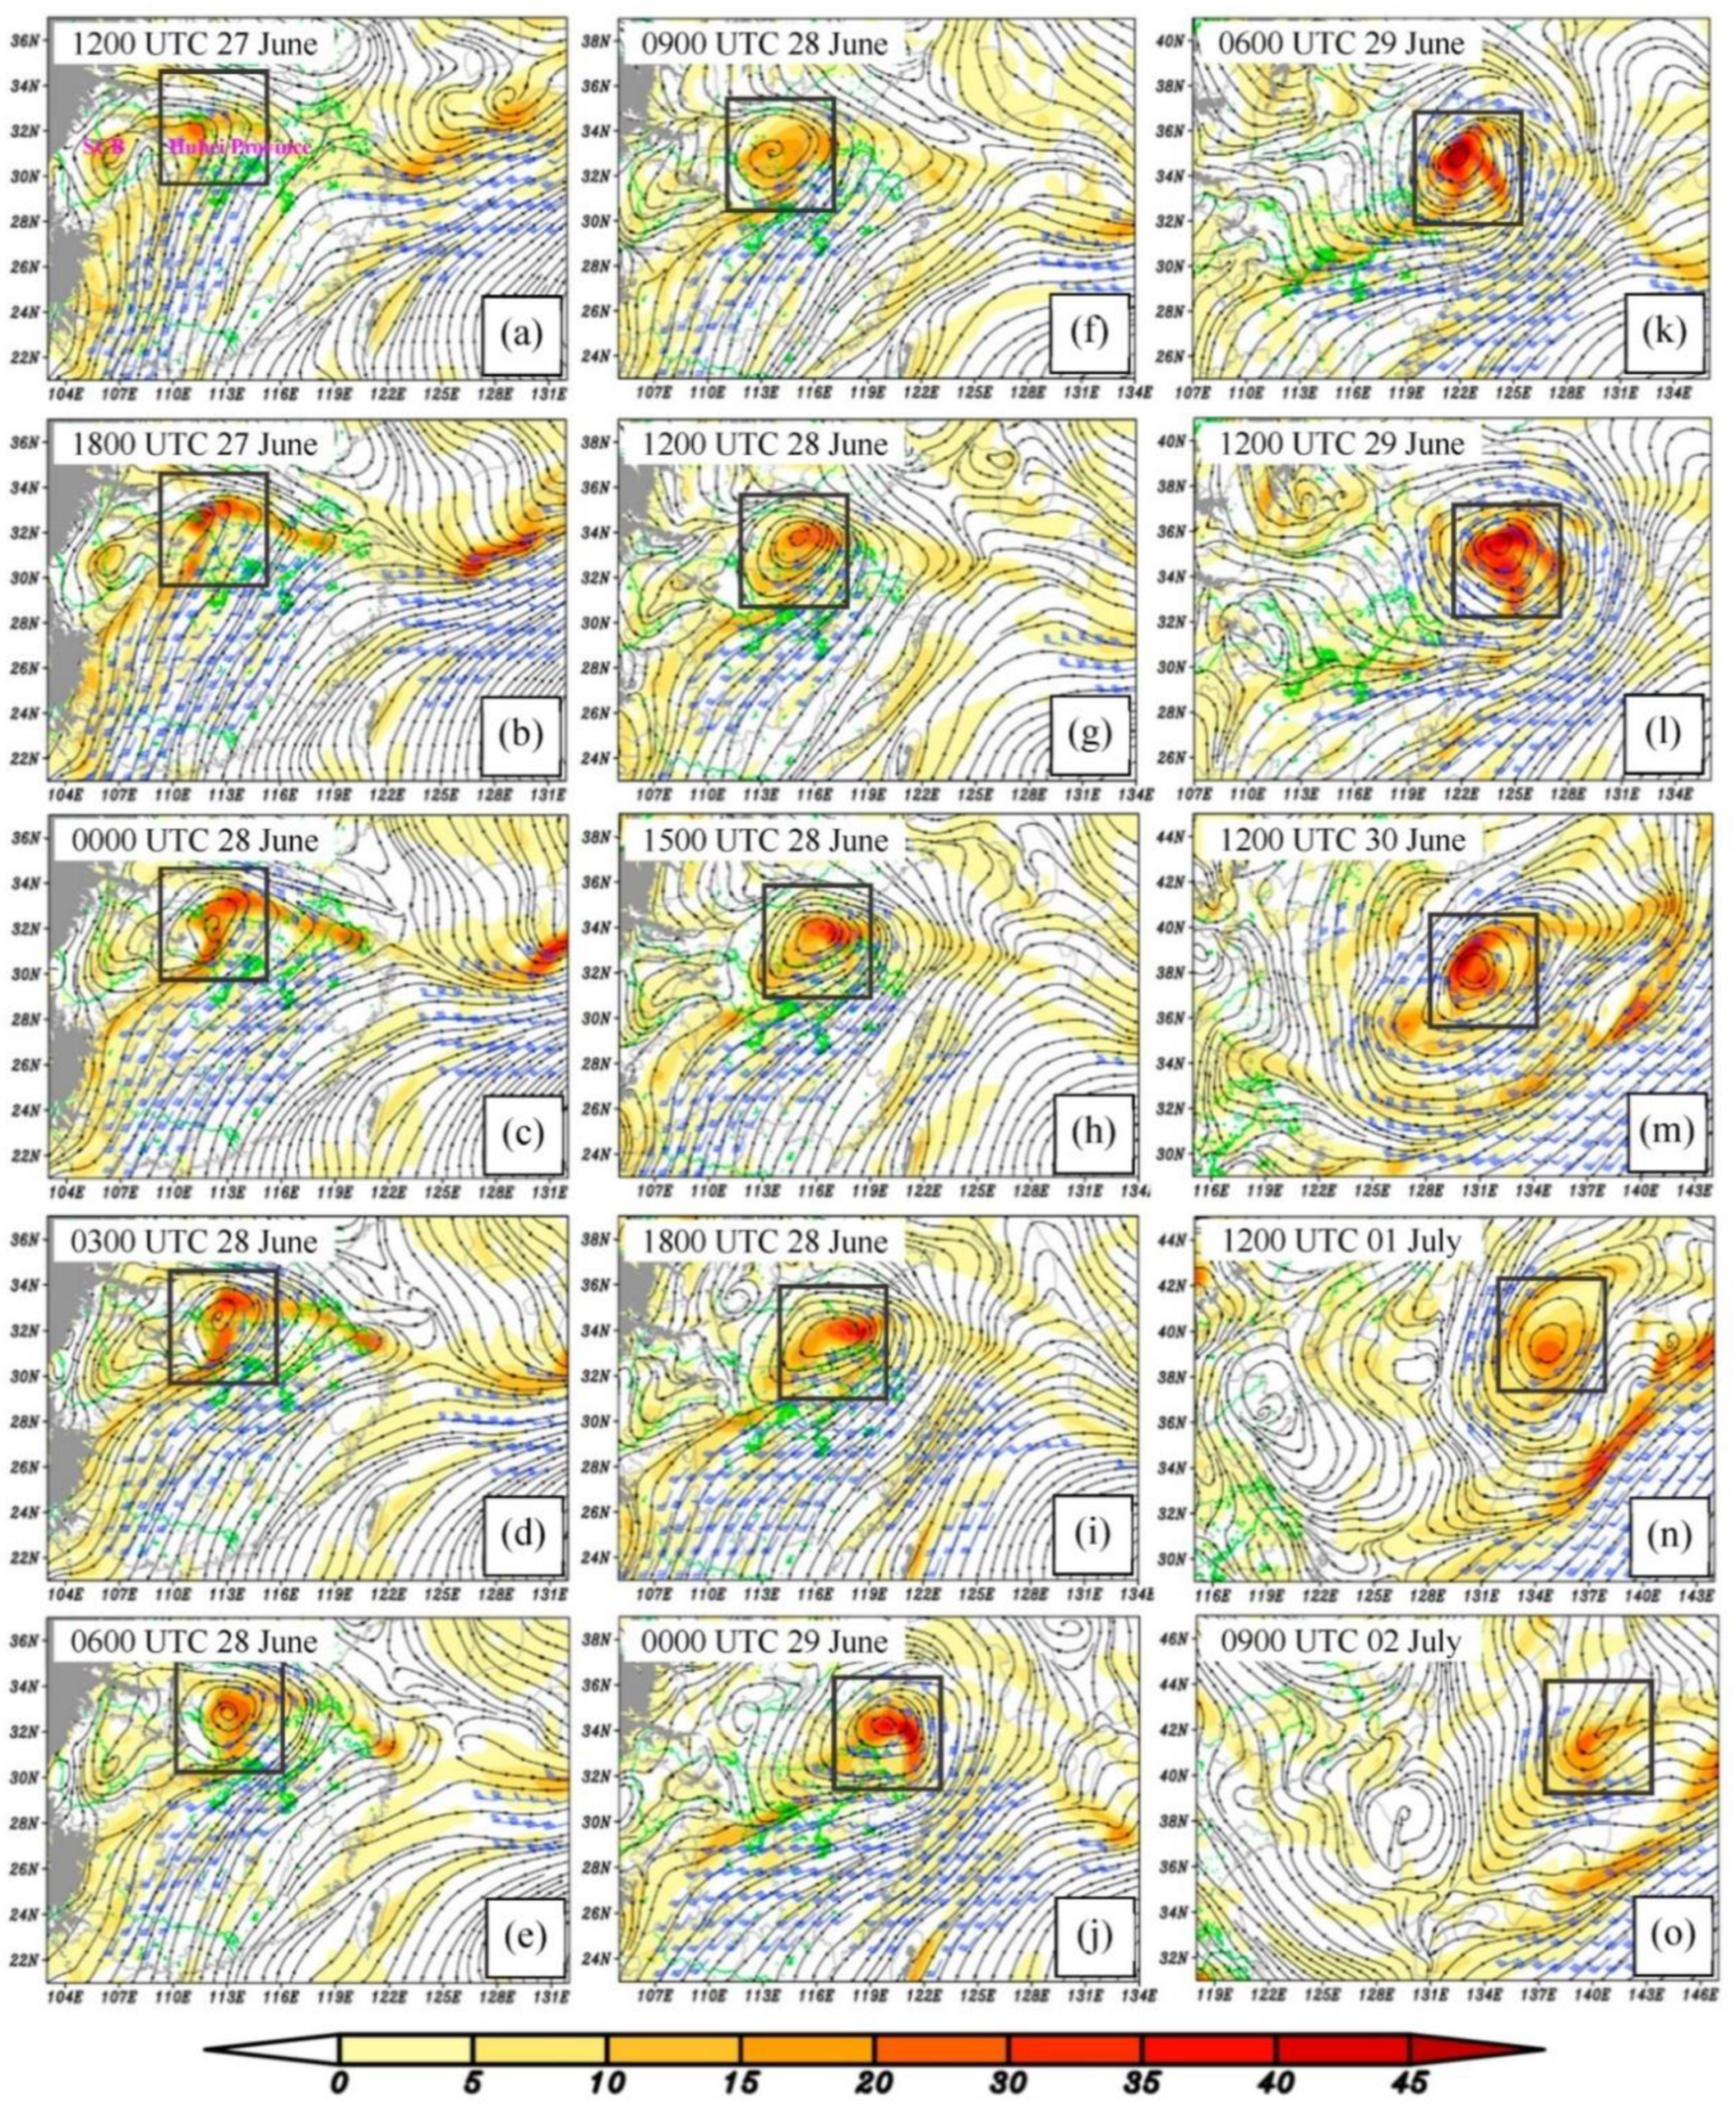
Figure 1. The 850-hPa stream field, vorticity (shading, units: 10−5 s−1), and wind with speed above 12 m s−1 (a full bar represents 4 m s−1), where the grey shading outlines the terrain above 1500 m, and the black rectangles mark the central region of the mesoscale vortex. SCB = Sichuan Basin.
Atmosphere 12 00156 g001
Figure 2. Observed 6-h accumulated precipitation (shading, units: mm). SB = Sichuan Basin, SX = Shanxi Province, CQ = Chongqing, GZ = Guizhou Province, HB = Hubei Province, HN = Hunan Province, JX = Jiangxi Province, AH = Anhui Province, JS = Jiangsu Province.
Atmosphere 12 00156 g002
Figure 3. Panels (ad) show the 200-hPa divergence (shading, units: 10−5 s−1), wind with speed above 35 m s−1 (a full bar represents 10 m s−1), temperature (red lines, units: °C), and geopotential height (black lines, units: gpm). Panels (eh) illustrate the 500-hPa temperature advection ( V · T ) (shading, units: 10−5 K s−1), wind with speed above 10 m s−1 (a full bar represents 10 m s−1), temperature (red lines, units: °C), and geopotential height (black lines, units: gpm). The purple circles mark the location of the mesoscale vortex.
Atmosphere 12 00156 g003
Figure 4. Panels (ae) show the zonally (from 109.25° E to 115.25° E) averaged wind speed (shading, units: m s−1), and vorticity (blue lines, units: 10−5 s−1). Panels (fj) illustrate the zonally (from 109.25° E to 115.25° E) averaged divergence (shading, units: 10−5 s−1) and vertical velocity (black lines, units: cm s−1). Grey shading shows the terrain, and the green dashed lines mark the central location of the mesoscale vortex. Y labels in all figures are pressure (units: hPa).
Atmosphere 12 00156 g004
Figure 5. Panels (ae) show the zonally (from 109.25° E to 115.25° E) averaged term STR (shading, units: 10−9 s−2), zonal wind (blue lines, units: m s−1), and meridional wind (black lines, units: m s−1). Grey shading shows the terrain, and the green dashed lines mark the central location of the mesoscale vortex. Y labels in all figures are pressure (units: hPa).
Atmosphere 12 00156 g005
Figure 6. Panel (a) shows the central region averaged vorticity (units: 10−5 s−1), divergence (units: 10−5 s−1), and vertical velocity (units: cm s−1) at 850 hPa. Panel (b) shows the central region averaged vorticity budget terms (units: 10−9 s−2) at 850 hPa. The grey dashed lines mark the value of “0”, and the purple dashed lines mark the time when the mesoscale vortex formed. Y labels indicate the values of the variables on the right side.
Atmosphere 12 00156 g006
Figure 7. Panels (ae) show the zonally (from 109.25° E to 115.25° E) averaged term TIL (shading, units: 10−9 s−2), and term TOT (blue lines, units: 10−9 s−2). Grey shading shows the terrain, and the green dashed lines mark the central location of the mesoscale vortex. Y labels in all figures are pressure (units: hPa).
Atmosphere 12 00156 g007
Figure 8. Panels (ae) show the zonally (from 109.25° E to 115.25° E) averaged term VAV (shading, units: 10−9 s−2), and vertical velocity (blue lines, units: cm s−1). Grey shading shows the terrain, and the green dashed lines mark the central location of the mesoscale vortex. Y labels in all figures are pressure (units: hPa).
Atmosphere 12 00156 g008
Figure 9. Panels (ae) show the zonally (from 109.25° E to 115.25° E) averaged term HAV (shading, units: 10−9 s−2), zonal wind (blue lines, units: m s−1), and meridional wind (black lines, units: m s−1). Panels (fj) illustrate the meridionally (from 29.75° N to 34.75° N) averaged term HAV (shading, units: 10−9 s−2), zonal wind (blue lines, units: m s−1), and meridional wind (black lines, units: m s−1). Grey shading shows the terrain, and the green dashed lines mark the central location of the mesoscale vortex. Y labels in all figures are pressure (units: hPa).
Atmosphere 12 00156 g009
Publisher’s Note: MDPI stays neutral with regard to jurisdictional claims in published maps and institutional affiliations.