Abstract
Understanding the variability of surface air temperature (SAT) over the Tibetan Plateau (TP) and its precursory signals is of great benefit to climate change adaptation and socioeconomic development. This study explores the precursory signals of summer SATs over the TP in oceanic and land boundary conditions. The results show that the summer eastern TP SAT is significantly correlated with three precursors in April: the high-latitude North Atlantic sea surface temperature (SST), the northern Indian Ocean SST, and the Indian soil moisture (SM). The April SST anomalies (SSTAs) in the high-latitude North Atlantic can exert a cross-season impact on the summer SAT over the TP through two processes. The SSTAs in the high-latitude North Atlantic maintain from April to summer and modulate atmospheric circulation over the eastern TP through exciting a downstream wave train during summer, and finally modulate the summer SAT over the eastern TP. In addition to the above process, the April SSTAs in the high-latitude North Atlantic may remotely regulate simultaneous SM in the Indian subcontinent through stimulating a downstream wave train pattern. Through a persistent SM–precipitation interaction, the April Indian SM anomaly can affect the local precipitation and associated condensation heating anomalies during the ensuing summer, which forces an anomalous cyclone–anticyclone pattern around the TP and accordingly affects the summer SAT over the eastern TP. Additionally, the SSTAs in the northern Indian Ocean can persist from April to summer and adjust the intensity and location of the western North Pacific subtropical high through the Kelvin-wave-induced Ekman divergence during summer, eventually affecting the summer eastern TP SAT. The three precursory signals, which synergistically contribute to the variability of the summer eastern TP SAT, can be applied in predicting the summer SAT over the eastern TP.
1. Introduction
The Tibetan Plateau (TP), situated in subtropical eastern Eurasia, is the highest plateau in the world. The TP generally acts as a heat sink in winter but an elevated atmospheric heat source during summer [1,2,3,4,5]. Summer surface air temperature (SAT) anomalies over the TP have an important influence on local agriculture, livestock husbandry, water resources, and ecological environment [6,7,8,9]. Recent studies have revealed that during summer, the thermal anomaly of the TP can modulate atmospheric circulation and associated climate variability not only over downstream East Asia and the Pacific [10,11,12,13,14] but also over upstream Europe and African regions [15,16,17,18], manifesting a very large-scale impact on climate variability. Therefore, the anomalous SAT-related heating in the TP may also affect the variability of climate over broader areas besides local and direct impacts. Clearly, understanding the variability of summer SAT over the TP and its precursory signals and potential mechanisms is of great importance to socioeconomic development over local and even larger regions.
Sea surface temperature anomalies (SSTAs) in several key ocean areas are the important factors affecting the variability of the SAT over the TP. Moreover, SSTAs have longer persistence/memory and can, therefore, be considered as the sources of the TP SAT predictability. Wang et al. [19] argued that the SSTAs in the western Pacific Warm Pool can regulate the annual mean and minimum SATs over the TP through modulating the tropical easterly and subtropical westerly jet. The variability of the western Pacific SST is one of the most important sources of skill for the prediction of SATs over the TP and western China [20]. The spring SSTAs in the Indian Ocean are closely related to precipitation and thermal conditions over the TP during the subsequent summer [21]. Through exciting a downstream Rossby wave train, the North Atlantic tripolar SSTA mode affects the TP heating during spring [4]. However, the effect of the SSTAs in the Atlantic Ocean on the summer SAT over the TP remains unclear. Wang et al. [22] suggested that the SSTA and its coupled SAT anomalies in the Atlantic Ocean can persist from the preceding winter to ensuing summer, stimulate a zonal wave train extending from the Atlantic to Eurasia, and eventually cause atmospheric circulation and associated SAT anomalies over eastern China. Gao et al. [23] indicated the influences of the Atlantic Ocean on the summer precipitation over the southeastern TP. Although the Atlantic precursory signal of the summer SAT over the TP is not directly explored, these studies propose a possibility that the SSTAs in the Atlantic Ocean may maintain from the preceding seasons to summer and eventually affect the summer SAT over the TP.
In addition to the SSTA signals, land thermal condition-related signals have attracted attention in recent years. Generally, soil moisture (SM) has a good persistence/memory from several weeks to months and is therefore considered as an important precursory signal for climate prediction in some areas [24,25,26,27]. For instance, the spring SM anomaly in the TP has a time-lagged effect on the East Asian monsoon during early summer [28]. Can the summer SAT over the TP be modulated by SM signals in some specific regions during the preceding seasons? This issue deserves further investigation.
Based on the aforementioned previous studies, the present study focuses on the variability of summer SAT anomalies over the TP. Meanwhile, the precursory signals, which are responsible for the summer SAT anomalies over the TP, are explored in oceanic and land boundary conditions, especially, in the Atlantic and Indian Oceans and the Indian subcontinent.
2. Data and Methods
This study used daily observational SATs at 117 stations in the TP (above 3000 m) of the latest version (V3) of surface climatological daily dataset, which is compiled by the China National Meteorological Information Center. The study also used monthly mean pressure-level geopotential height, U- and V-wind, and vertical velocity (omega) data, which are obtained from the National Centers for Environmental Prediction (NCEP)–National Center for Atmospheric Research (NCAR) reanalysis dataset [29]. The monthly mean precipitation on 2.5° × 2.5° grids is obtained from the Climate prediction center (CPC) Merged Analysis of Precipitation (CMAP) [30]. We also used monthly mean soil moisture on 0.75° × 0.75° grids of ERA-Interim reanalysis [31] of the European Center for Medium-Range Weather Forecasts. The National Oceanic and Atmospheric Administration (NOAA) extended reconstructed SST version 4 [32] was also used. The above data are all extracted from 1981 to 2019.
Under the background of global warming, SATs over the TP show a significantly increasing trend [33,34]. The present study primarily focuses on the interannual variability of summer SATs over the TP and its precursory signals, rather than the linear trend. Therefore, we removed linear trends from all data used in this study.
An empirical orthogonal function (EOF) [35,36] was used to acquire the dominant mode of summer SAT variation over the TP. A linear fitting method was applied to show the independent effect of one factor after removing the variation of the other factor [37]. Specifically, for the two time series X1 and X2, the X2-related variation (called X1′) of X1 can be obtained through a linear fitting method, in which the variation of X1 is regarded as a dependent variable and the variation of X2 as an independent variable. The residual of the linear fitting (i.e., the difference X1 minus X1′) can be used to reflect the individual variation of X1 independent of X2 [38].
Correlation, composite, and regression methods were used in this study. Unless otherwise stated, the statistical significance was evaluated using Student’s t-test. We used stepwise linear regressions to construct a statistical prediction model of the dominant mode of summer SAT anomalies over the TP, in which the regression coefficients are obtained by ordinary least squares. Referring to Gao et al. [39], the correlation coefficients between the observation and prediction were used to represent the skills of statistical prediction models. Since the autocorrelation of time series may result in spurious correlation and invalid regression, the impacts of autocorrelation on the correlations between each precursory signals and summer TP SAT, as well as prediction models based on multiple precursory signals were examined using a Durbin–Watson (D-W) test [40,41]. The result indicates that the precursory-TP SAT correlations and the prediction models are not significantly affected by autocorrelation (specific values omitted).
3. Results
3.1. Variability of Summer SATs over the TP and Associated Atmospheric Circulation Anomalies
We performed an EOF analysis of summer SAT anomalies over the TP during the period 1981–2019, in which the linear trends of SATs at all stations were removed (Figure 1a). The leading EOF mode (EOF1), which accounts for 37% of the total variance, shows a homogenous variation over almost the whole TP, except for several scattered opposite-sign SAT anomalies appearing along the southern flank of the TP. Since there are very few stations over the western TP, this study focuses on the variability of the summer SAT over the eastern TP rather than over the western TP, even though the summer SAT over the western TP also shows a same-sign variability with the eastern TP. The SATs from 74 stations in the eastern TP region (30° N–40° N, 90° E–103° E) are averaged as the eastern TP SAT index. The eastern TP index bears a very significant similarity with the principal component (PC1) of EOF1, with a correlation coefficient of 0.98. This high correlation implies that the variability of the eastern TP SAT index can also reflect well that of the dominant mode of summer SATs over the TP.
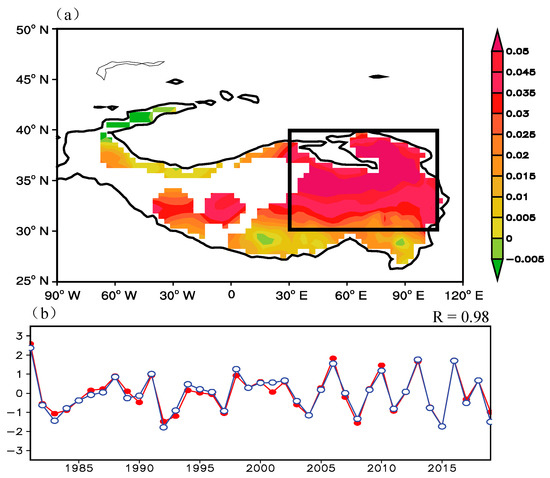
Figure 1.
(a) The first mode (EOF1) of summer surface air temperature (SAT) anomalies over the Tibetan Plateau (TP) during the period 1981–2019, in which the linear trends in the SATs were removed. The black box denotes the eastern TP region (30° N–40° N, 90° E–103° E). (b) Standardized time series of the summer TP SAT (red line) and PC1 (blue line) indices.
Summer geopotential height anomalies regressed upon the summer eastern TP SAT index show that corresponding to a higher eastern TP SAT index, significantly positive anomalies appear over the eastern TP, in the upper (200 hPa; Figure 2a) and middle (500 hPa; Figure 2b) troposphere (Figure 2). This signifies that a deep high-pressure anomaly governs the eastern TP and facilities higher SATs over the eastern TP during summer, and vice versa.
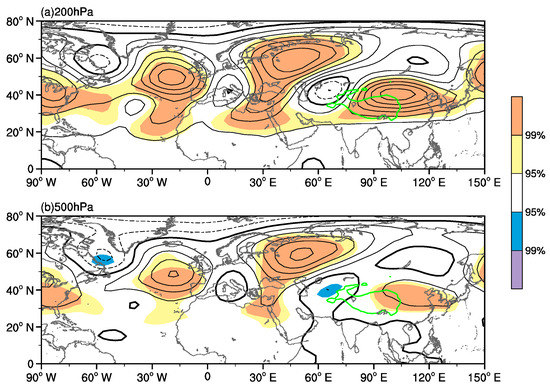
Figure 2.
(a) Summer 200-hPa geopotential height anomalies (units: gpm) obtained by regression on the summer eastern TP SAT index for the period 1981–2019. (b) As in (a) but for 500-hPa. The green contours indicate areas >2500 m altitude, showing the TP (the same below). Contours are drawn every 4 gpm. The bold black line is zero. The solid and dash lines denote positive and negative values, respectively. Shadings denote geopotential height anomalies significant at the 95% and 99% confidence levels as shown by the color bars.
3.2. Precursory Signals Contributing to the SAT Anomalies over the Eastern TP
3.2.1. The Effect of Soil Moisture Anomalies in the Indian Subcontinent and the Effect of SSTAs in the North Indian
Since SM is one of the most important precursory signals for climate prediction in several areas [24,25,26,27], we first analyze the possible contribution of preceding SM anomalies to the summer SAT anomalies over the eastern TP. Figure 3a presents the correlation between the summer eastern TP SAT index and SM during the preceding April. Significantly negative correlations appear in the Indian continent. The area-mean SM averaged over the Indian region (23° N–33° N, 68° E–80° E and 17° N–23° N, 75° E–85° E) is referred to as the Indian SM index. The April Indian SM index is closely related to the summer eastern TP SAT index during the period 1981–2019, with a correlation coefficient of −0.48, significant at the 99% confidence level (Figure 3b). However, there is no significant correlation between the summer eastern TP SAT index and soil moisture in the Indian subcontinent during the earlier month (i.e., March; not shown), implying the Indian SM signal can only be traced to the preceding April.
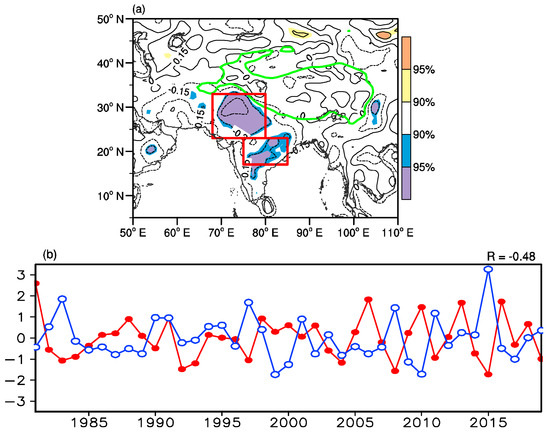
Figure 3.
(a) Distribution of correlation coefficients between the summer eastern TP SAT index and April soil moisture (SM) during the period 1981–2019. Red boxes represent the Indian region (23° N–33° N, 68° E–80° E; 17° N–23° N, 75° E–85° E), which is the key region to define the Indian SM index. Contours are drawn every 0.15. The solid and dash lines denote positive and negative values, respectively. Shadings denote the correlation significant at the 90% and 95% confidence levels as shown by the color bars. (b) Standardized time series of the summer eastern TP SAT (red line) and April Indian SM index (blue line).
Through increasing the humidity of boundary layer air, the higher SM can enhance the convective available potential energy and accordingly facilitate local convection and rainfall [42,43,44]. In turn, higher rainfall can result in higher SM during the ensuing period. Owing to, at least partly, this persistent SM–rainfall interaction, more rainfall appears to the southwest of the TP during summer corresponding to a higher April Indian SM index (Figure 4a). Associated with more rainfall to the southwest of the TP, a stronger condensation heating stimulates an anomalous anticyclone to the west of the TP and an anomalous cyclone around the eastern TP in the upper-tropospheric level (Figure 4b), which is supported by Wu et al. [45] who have revealed the effect of condensation heating on such an upper-tropospheric anticyclone–cyclone pattern through theoretical analysis and numerical simulation [45,46]. Corresponding to the higher (lower) Indian SM during April and associated more (less) rainfall over northern India during the ensuing summer, an anomalous cyclone (anticyclone) appears over the eastern TP, tending to decrease (increase) the summer SAT over the eastern TP. The abovementioned processes can, to some extent, explain the significantly negative correlation between the April Indian SM and the summer eastern TP SAT.
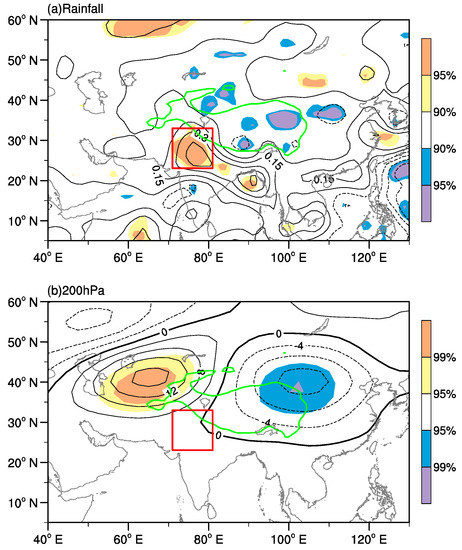
Figure 4.
(a) Summer rainfall anomalies (units: mm) obtained by regression on the preceding April Indian SM index for the period 1981–2019. Contours are drawn every 0.15 mm. (b) As in (a) but for 200-hPa geopotential heights anomalies. Contours are drawn every 4 gpm. The solid and dash lines denote positive and negative values, respectively. The bold black line in (b) is zero. The red box (23° N–32° N, 70° E–80° E) indicates the location of anomalous rainfall. Shadings in (a) denote rainfall anomalies significant at the 90% and 95% confidence levels. Shadings in (b) denote geopotential height anomalies significant at the 95% and 99% confidence levels.
The variability of SSTs in the Indian Ocean has a remarkable impact on the Indian summer monsoon circulation and related rainfall [47,48]. Therefore, we wonder whether the SSTAs in the Indian Ocean can modulate rainfall and associated SM over the Indian subcontinent during April and continue to affect Indian rainfall during the subsequent summer. In other words, the Indian April SM–summer rainfall relationship may not be a real physical link but only a result of the cross-season persistent effect of the SSTAs in the Indian Ocean. If so, the April Indian SM cannot be considered as a precursory signal of the summer eastern TP SAT. Clearly, the effect of the SSTAs should be investigated.
To be consistent with the time of the Indian SM signal, we explore the SST signals in April. The correlation between the summer eastern TP SAT index and April SSTs shows significantly positive correlations in the northern Indian Ocean and high-latitude Atlantic Ocean (Figure 5). According to Figure 5, the Indian Ocean SST index is defined as the area-mean SSTs averaged over the northern Indian Ocean region (0°–25° N, 50°E–75° E and 3°N–17° N, 75°E–110° E). The correlation analysis further indicates that the April Indian SM index is independent of the Indian Ocean SST index, with a very low correlation coefficient (−0.07). This low correlation reveals that the Indian SM may not be affected by the SSTAs in the northern Indian Ocean during April, which further confirms the importance of the April Indian SM as a precursory signal of the summer SAT over the eastern TP.
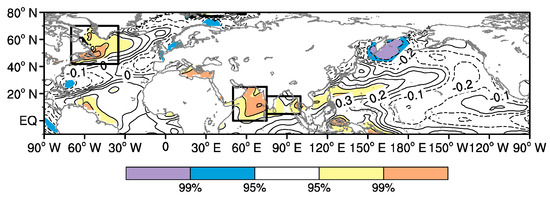
Figure 5.
Distribution of correlation coefficients between the summer eastern TP SAT index and preceding April sea surface temperature (SST) during the period 1981–2019. The black boxes from left to right represent the high-latitude North Atlantic (70° W–40° W, 42° N–70° N) and northern Indian Ocean (0° N–25° N, 50° E–75° E and 3° N–17° N, 75° E–110° E) regions, respectively. Contours are drawn every 0.1. The solid and dash lines denote positive and negative values, respectively. Shadings denote the SSTAs significant at the 95% and 99% confidence levels as shown by the color bars.
The summer SSTAs regressed upon the April Indian Ocean SST index show significant and positive anomalies over the Indian Ocean and the western North Pacific (Figure 6a), which indicates the SSTAs in the northern Indian Ocean have a strong persistence from April to summer. The SSTAs in the Indian Ocean can modulate the western North Pacific subtropical high through the mechanism of the Kelvin wave-induced Ekman divergence [49]. In response to the warmer SSTAs over the tropical Indian Ocean, a warm Kelvin wave is emanated and accompanied with divergence and anticyclone anomalies over the subtropical western North Pacific as a result of pressure gradient and Ekman pumping. Therefore, the western North Pacific subtropical high can be enhanced by the Kelvin-wave-induced Ekman Divergence [49,50]. The 500-hPa geopotential height anomalies regressed upon the April Indian Ocean SST index (Figure 6b) show that high-pressure anomalies extend westwards from the western Pacific to the eastern TP, reflecting a stronger and farther-westward western North Pacific subtropical high in correspondence to warmer SSTAs in the Indian Ocean maintaining from April to summer. The high-pressure anomalies extending westwards to the eastern TP may contribute to higher SATs over the eastern TP during summer. As a result of the above mechanism, the April Indian Ocean SST index is closely correlated with the summer eastern TP SAT index, with a correlation coefficient of 0.46 for the period 1981–2019, significant at the 99% confidence level.
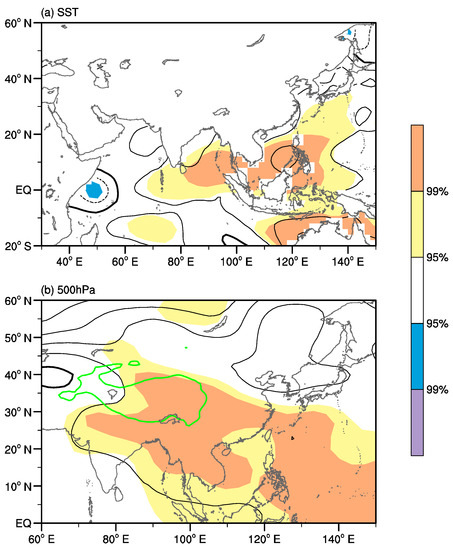
Figure 6.
(a) Summer sea surface temperature anomalies (SSTAs) (units: °C) obtained by regression on the preceding April Indian Ocean SST index for the period 1981–2019. Contours are drawn every 0.1 °C. (b) As in (a) but for 500-hPa geopotential height anomalies (units: gpm). Contours are drawn every 4 gpm. The bold black line is zero. The solid and dash lines denote positive and negative values, respectively. Shadings denote anomalies significant at the 95% and 99% confidence levels as shown by the color bars.
3.2.2. The Effect of SSTAs in the High-Latitude North Atlantic
As shown in Figure 5, significant and positive correlations also appear over the high-latitude North Atlantic. According to this Atlantic key region in Figure 5, the area-mean SSTs averaged over the high-latitude North Atlantic (70° W–40° W, 42° N–70° N) is defined as the high-latitude North Atlantic SST index. The April high-latitude North Atlantic SST index is closely correlated with the summer eastern TP SAT index, with a correlation coefficient of 0.66, significant at the 99.9% confidence level. This implies that the April SSTAs in the high-latitude North Atlantic is remarkably linked with the summer SATs over the eastern TP. Next, we attempt to explore the potential mechanism of the effect of the preceding SSTAs in the high-latitude North Atlantic.
The correlation coefficient between the April and ensuing summer high-latitude North Atlantic SST indices is 0.59, significant at the 99.9% confidence level. This indicates that the SSTAs in the high-latitude North Atlantic can persist from April to summer. Summer zonal–vertical circulation and geopotential height anomalies along 60° N obtained by regression on the April high-latitude North Atlantic SST index are displayed in Figure 7a, which indicates the effect of persistent SSTAs in the high-latitude North Atlantic. Corresponding to the warm SSTAs in the high-latitude North Atlantic, an anomalous upward flow appears between 60° W and 40° W and then turns and moves eastwards and ultimately descends around 10° W, causing a deep high-pressure anomaly between 40° W and 0°, to the west of the British Isles. This high-pressure anomaly can also be detected in the summer 200-hPa geopotential height anomalies regressed upon the April high-latitude North Atlantic SST index (Figure 7b). This implies that the warmer SSTs in the high-latitude North Atlantic can force the positive anomaly of geopotential height over the northern Atlantic, centered around 20° W, 50° N, to the west of the British Isles. Meanwhile, an anomalous wave train pattern occurs downstream across Eurasia, from the northern Atlantic to the eastern TP, with significantly positive anomalies appearing over the eastern TP (Figure 7b). This wave train pattern clearly resembles Figure 2a, providing a favorable circulation background for the higher SATs over the eastern TP.
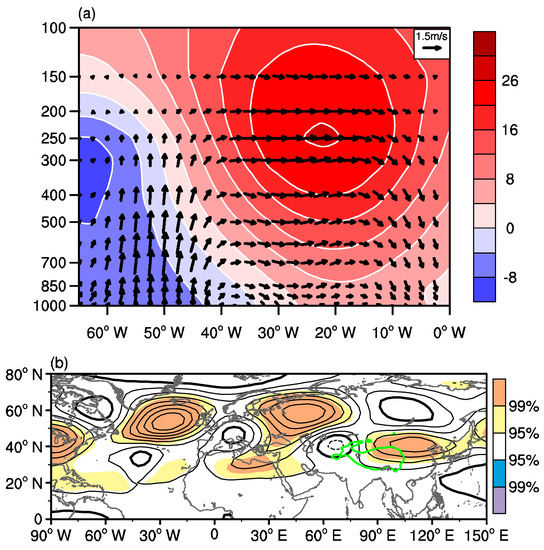
Figure 7.
(a) Summer geopotential height (units: gpm; contours and shading) and the zonal–vertical circulation (black vectors) anomalies along 60° N obtained by regression on the April high-latitude North Atlantic SST index for the period 1981–2019. (b) Summer 200-hPa geopotential height anomalies (units: gpm) regressed upon the April high-latitude North Atlantic SST index. Contours are drawn every 4 gpm. The bold black line is zero. The solid and dash lines denote positive and negative values, respectively. Shadings denote geopotential height anomalies significant at the 95% and 99% confidence levels as shown by the color bars.
In summary, the SSTAs in the high-latitude North Atlantic may persist from April to summer and lead to the geopotential height anomaly over the northern Atlantic, and consequently modulate the downstream atmospheric circulation anomalies over the eastern TP through exciting the downstream wave train across Eurasia, eventually contributing to the SAT anomalies over the eastern TP.
3.2.3. Independent Contributions of SSTAs in the High-Latitude North Atlantic and SM Anomalies in the Indian Subcontinent and Their Interaction
The April high-latitude North Atlantic SST and Indian SM indices seem to be not independent of each other. The correlation coefficient between the two indices is −0.44 during the period 1981–2019, significant at the 99% confidence level. The April geopotential height anomalies regressed upon the simultaneous high-latitude North Atlantic SST index show a wave train pattern from the high-latitude northwestern Atlantic to the Indian subcontinent via North Africa and the Arabian Peninsula, with a significantly positive anomaly around the Indian subcontinent (Figure 8). The high-pressure anomaly over the Indian subcontinent may suppress local precipitation and therefore result in negative SM anomalies in situ. That is, the high-latitude North Atlantic SSTAs seem to be able to affect the simultaneous Indian SM through stimulating a wave train pattern. Through this wave train pattern, atmospheric circulation around the Indian subcontinent is remotely modulated by the SSTAs in the high-latitude North Atlantic during April. As a result, the high-latitude North Atlantic SST index is significantly and negatively correlated with the Indian SM index during April.
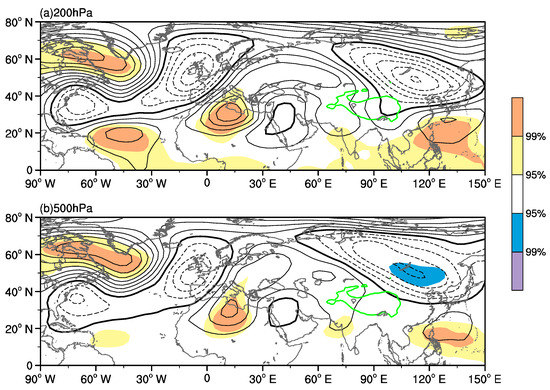
Figure 8.
(a) April 200-hPa geopotential height anomalies (units: gpm) obtained by regression on the simultaneous high-latitude North Atlantic SST index for the period 1981–2019. (b) As in (a) but for the 500-hPa level. Contours are drawn every 4 gpm. The bold black line is zero. The solid and dash lines denote positive and negative values, respectively. Shadings denote geopotential height anomalies significant at the 95% and 99% confidence levels as shown by the color bars.
The SSTAs in the high-latitude North Atlantic may modulate the variability of the summer eastern TP SAT through the persistence of the SSTA signal, which is revealed in Section 3.2.2. Since the April Indian SM can affect the eastern TP SATs during the subsequent summer (see Section 3.2.1), the close link between the high-latitude North Atlantic SST and Indian SM indices imply that the SSTAs in the high-latitude North Atlantic may modulate the variability of the summer eastern TP SAT through the “bridge” effect of the Indian SM. Namely, the April SSTAs in the high-latitude North Atlantic may contribute to the variability of the summer SAT over the eastern TP in the above two manners (i.e., the “memory” of both sea and land signals).
Next, we further demonstrate the independent contributions of the two manners to the summer SAT anomalies over the eastern TP. One is the situation when the “bridge” effect of the April Indian SM is absent. Following Hu et al. [37] (see Section 2), we obtained the April individual high-latitude North Atlantic SST index after removing the effect of the Indian SM. Summer 200-hPa geopotential height anomalies regressed upon the April individual high-latitude North Atlantic SST index (Figure 9a) shows that although the wave train pattern across Eurasia still exists, the positive geopotential height anomaly over the eastern TP is clearly weaker and shows lower significance than Figure 7b. Correspondingly, the correlation coefficient of the summer eastern TP SAT index with the April individual high-latitude North Atlantic SST index is 0.50, lower than that (0.66) with the original high-latitude North Atlantic SST index. These results further imply that the April Indian SM plays a role in bridging the April high-latitude North Atlantic SST and the summer SAT over the eastern TP, since the cross-season North Atlantic SST-eastern TP SAT relationship becomes weaker when the “bridge” effect of the Indian SM is eliminated.
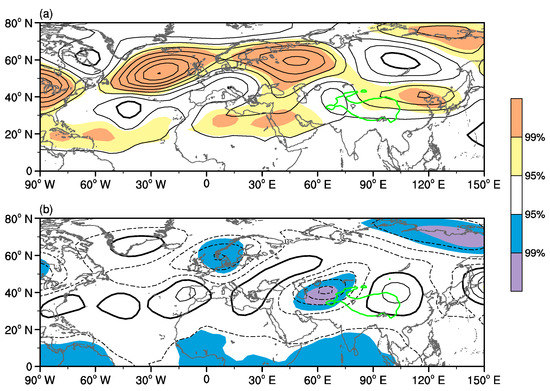
Figure 9.
(a) Summer 200-hPa geopotential height anomalies (units: gpm) obtained by regression on the April individual high-latitude North Atlantic SST index after removing the variability of the April Indian SM index for the period 1981–2019. (b) As in (a) but for regression on the April individual Indian SM index after removing the variability of the high-latitude North Atlantic SST index, in which the April individual Indian SM index is multiplied by −1 for ease of comparison with (a). Contours are drawn every 4 gpm. The bold black line is zero, solid and dash lines denote positive and negative values, respectively. Shadings denote geopotential height anomalies significant at the 95% and 99% confidence levels as shown by the color bars.
The other is the situation when the effect of the Indian SM is retained but the effect of high-latitude North Atlantic SSTAs is removed. Similarly, Figure 9b presents the summer 200-hPa geopotential height anomalies regressed upon the April individual Indian SM index after removing the effect of high-latitude North Atlantic SSTAs. For ease of comparison with Figure 9a, the April individual Indian SM index is multiplied by −1, which reflects the geopotential height anomalies modulated by the lower Indian SM (Figure 9b). An anomalous upper-tropospheric cyclone–anticyclone pattern appears around the northern TP, which, to some extent, resembles Figure 4b, but with opposite sign. This indicates a result of the anomalous SM and following rainfall-related condensation heating [45,46] (see the explanation in Section 3.2.1). However, the significance of the high-pressure anomaly over the eastern TP is pronouncedly weaker after excluding the effect of high-latitude North Atlantic SSTAs (Figure 9b). This suggests that the Indian SM itself is not sufficient to exert a great impact on the atmospheric circulation and associated SAT anomalies over the eastern TP, but acts as a crucial “bridge” linking the April SSTAs in the high-latitude North Atlantic and the summer SATs over the eastern TP.
3.3. Joint Effect of Three Precursory Signals
Based on the statistical and physical links of the summer SAT over the eastern TP with the preceding April Indian SM, high-latitude North Atlantic SST, and Indian Ocean SST indices, we established a physical-empirical model (i.e., Equation (1)) for the period 1981–2019.
in which ITPSAT, IHASST, IIOSST, and IISM represent the stimulated summer eastern TP SAT, preceding April high-latitude North Atlantic SST, Indian Ocean SST, and Indian SM indices, respectively. The right terms of Equation (1) can reflect the joint effect of the three precursory factors with different weights. As such, the right terms are referred to as the joint effect index.
ITPSAT = 0.470IHASST + 0.338IIOSST − 0.251IISM,
The summer 200- and 500-hPa geopotential height anomalies regressed upon the preceding April joint effect index show a clearer Rossby wave train, with a more significantly positive geopotential height anomaly over the eastern TP (Figure 10). The more significant anomaly can, to a greater extent, regulate the variability of the eastern TP SAT during summer. Therefore, the stimulated summer eastern TP SAT index based on the three precursory signals is tightly correlated with the observational one, with a correlation coefficient of 0.77, exceeding the 99.9% confidence level. The aforementioned results also support the importance of the preceding April Indian SM, high-latitude North Atlantic and Indian Ocean SSTAs in modulating the variability of the summer SAT over the eastern TP.
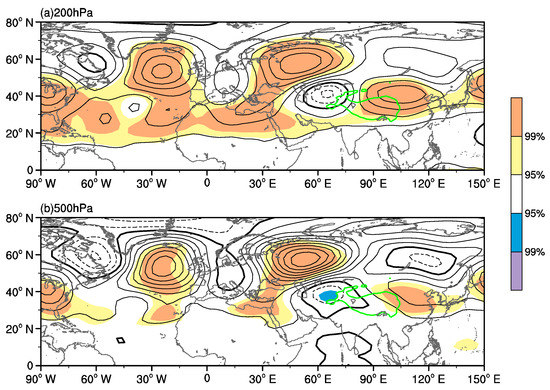
Figure 10.
(a) Summer 200-hPa geopotential height anomalies (units: gpm) obtained by regression on the preceding April joint effect index. (b) As in (a) but for the 500-hPa level. Contours are drawn every 4 gpm in (a) and 2 gpm in (b). The bold black line is zero. The solid and dash lines denote positive and negative values, respectively. Shadings denote geopotential height anomalies significant at the 95% and 99% confidence levels as shown by the color bars.
The CMAP precipitation is updated more timely than the ERA-interim soil moisture, thus the former is more suitable for the prediction of the summer SATs over the eastern TP. As such, we further performed the correlation analysis between the summer eastern TP SAT index and April precipitation (not shown). The correlation shows that the summer eastern TP SAT index is closely related to the April precipitation over the northern Indian region (26° N–33° N, 68° E–82° E), generally consistent with the key region of the April SM anomalies. The Indian precipitation index, defined as the area-mean precipitation averaged over the above northern Indian region, is tightly correlated with the Indian SM index during April for the period 1981–2019, with a correlation coefficient of 0.65, significant at the 99.9% confidence level. This high correlation shows that the precipitation and SM are generally coupled with each other, which implies the reliability of the SM data and also indicates that the Indian precipitation index can reflect well the variability of the Indian SM. The correlation coefficient between the April Indian precipitation and summer eastern TP SAT indices is −0.47, significant at the 99% confidence level. As such, the April Indian precipitation index can replace the Indian SM index in the original statistical model of the summer eastern TP SAT (Equation (1)). That is, the new physics-based prediction model can be constructed using the April high-latitude North Atlantic SST, Indian Ocean SST, and Indian precipitation indices. Here we chose 1981–2010 as a training period to establish this prediction model as follows.
where IIP represents the April Indian precipitation index. There is a high correlation of 0.78 between the simulated and observed eastern TP SAT indices during the training period 1981–2010, significant at the 99.9% confidence level (Figure 11). Additionally, this model can be applied in predicting the summer eastern TP SAT during 2011–2019. This prediction for the period 2011–2019 does not include “future” information. The correlation coefficient between the predicted and observed summer eastern TP SAT indices during the prediction period 2011–2019 is up to 0.88, significant at the 99% confidence level (Figure 11). We can also choose a slightly shorter period as the training period (1981–2005) to establish this prediction model. When choosing this shorter training period, the prediction model still shows a good skill. The above results show that this physics-based model can effectively predict the summer SAT over the eastern TP.
ITPSAT = 0.466IHASST + 0.297IIOSST − 0.308IIP − 0.071,
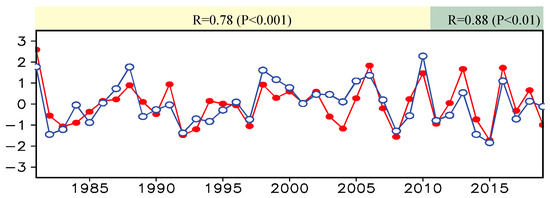
Figure 11.
Normalized time series of the summer observational (red line) and simulated/predicted (blue line) eastern TP SAT indices. The correlation coefficient is 0.78 and 0.88 for the training period 1981–2010 and the prediction period 2011–2019, respectively.
4. Summary and Discussion
This study investigates the variability of the summer SAT over the TP and its precursory signals in the Atlantic and Indian Oceans and the Indian subcontinent. The result shows that the variability of the summer eastern TP SAT can reflect well that of the simultaneous dominant mode of SATs over the entire TP. The summer eastern TP SAT index is significantly correlated with three precursors in April. They are the April high-latitude North Atlantic SST, the northern Indian Ocean SST, and the Indian SM. The correlation coefficients between the summer eastern TP SAT index and the above three precursors are 0.66, 0.46, and −0.48, respectively, all exceeding the 99% confidence level.
The physical processes linking the abovementioned three precursory sea–land signals and the summer eastern TP SAT are summarized in Figure 12. The April SSTAs in the high-latitude North Atlantic seem to affect the eastern TP SAT during the ensuing summer through the following two cross-season processes. On the one hand, the SSTAs in the high-latitude North Atlantic maintain from April to summer and modulate the atmospheric circulation anomaly over the eastern TP through exciting a downstream wave train during summer and finally result in the summer SAT anomaly over the eastern TP. On the other hand, the high-latitude North Atlantic SSTAs seem to be able to affect the Indian SM through stimulating a downstream wave train pattern during April. Through the persistent SM–rainfall interaction, the April Indian SM causes the rainfall anomaly to the southwest of the TP during summer. Accompanying this summer rainfall anomaly, an anomalous condensation heating stimulates an anomalous anticyclone–cyclone pattern around the TP and consequently modulates the variability of the summer SAT over the eastern TP. In addition, the SSTAs in the northern Indian Ocean can persist from April to summer and adjust the intensity and location of the western North Pacific subtropical high through the Kelvin-wave-induced Ekman divergence during summer, and therefore affect the summer SAT over the eastern TP. The preceding April high-latitude North Atlantic and Indian Ocean SSTAs and Indian SM jointly modulate the variability of the summer SATs over the eastern TP.
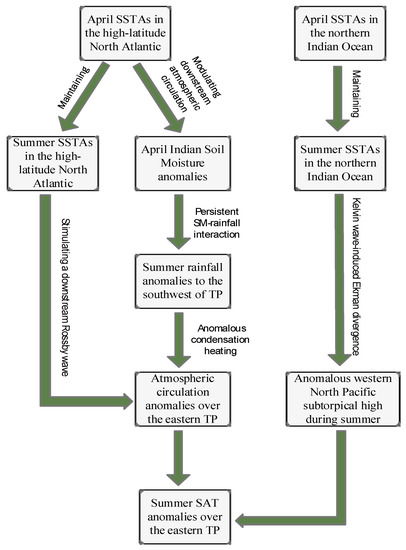
Figure 12.
Schematic diagram summarizing the processes linking the summer eastern TP SAT and the precursory sea–land signals.
The present study focuses on the effect of the boundary conditions of the Atlantic and Indian Oceans and the Indian subcontinent on the summer SAT over the eastern TP. The correlation between the summer TP SAT and SSTs during the preceding winter for the period 1981–2019 shows that there is no significant correlation in the tropical central-eastern Pacific Ocean (figure omitted). This implies that the ENSO signal in the preceding winter does not seem to contribute to the variation of the summer TP SAT. Nevertheless, the variation of the summer eastern TP SAT may also be modulated by and interact with other oceanic external forcing factors, such as the Arctic sea ice and SSTs. Moreover, the thermal forcing of the TP, which may be related to local SAT anomalies, in turn, exert important influences on SSTAs in some areas of the Pacific and Indian Oceans [51,52,53]. The TP thermal anomaly may result in an asymmetrical response of the East Asian summer monsoon to the quadrennial oscillation of global SSTAs through the TP thermal feedback [54]. That is, the prediction of the summer eastern TP SAT involves complex air–sea interaction processes. The individual effects of these factors, and their joint effect in conjunction with the three factors that we found in this study, should be investigated in future research.
Author Contributions
Conceptualization, data curation, supervision, G.L.; writing—original draft preparation, H.W. and G.L.; visualization, H.W., K.H. writing—review and editing, H.W. and S.W.; funding acquisition, G.L. All authors have read and agreed to the published version of the manuscript.
Funding
This research was funded by the National Key Research and Development Program of China (Grant 2018YFC1505706), the Strategic Priority Research Program of the Chinese Academy of Sciences (Grant XDA20100300), the Second Tibetan Plateau Scientific Expedition and Research (STEP) program (Grant 2019QZKK0105), the Science and Technology Development Fund of CAMS (Grant 2019KJ022) and the Basic Research Fund of CAMS (Grant 2019Z008).
Institutional Review Board Statement
Not applicable.
Informed Consent Statement
Not applicable.
Data Availability Statement
Data sharing is not applicable to this article.
Acknowledgments
The authors acknowledge the China National Meteorological Information Center for providing the daily observational SAT data (http://data.cma.cn/data/cdcdetail/dataCode/SURF_CLI_CHN_MUL_DAY_V3.0.html), the National Oceanic and Atmospheric Administration (NOAA) for providing NCEP-1 data (https://psl.noaa.gov/data/gridded/data.ncep.reanalysis.html), CMAP data (https://rda.ucar.edu/datasets/ds728.1) and SST V4 data (https://psl.noaa.gov/data/grided/data.noaa.ersst.v4.html). The authors also acknowledge the European Centre for Medium-Range Weather Forecasts (ECMWF) for providing the SM data (https://apps.ecmwf.int/datasets/data/interim-full-daily/levtype=sfc/).
Conflicts of Interest
The authors declare no conflict of interest.
References
- Flohn, H. Large-scale aspects of the “summer monsoon” in south and east Asia. J. Meteorol. Soc. Jpn. 1957, 35, 180–186. [Google Scholar] [CrossRef]
- Yeh, T.; Gao, Y. Meteorology of the Qinghai-Xizang (Tibet) Plateau; Science Press: Beijing, China, 1979. (In Chinese) [Google Scholar]
- Yeh, T.; Lo, S.; Chu, P. On the heat balance and circulation structure in troposphere over Tibetan Plateau. Acta Meteorol. Sin. 1957, 28, 108–121. (In Chinese) [Google Scholar]
- Cui, Y.; Duan, A.; Liu, Y.; Wu, G. Interannual variability of the spring atmospheric heat source over the Tibetan Plateau forced by the North Atlantic SSTA. Clim. Dyn. 2015, 45, 1617–1634. [Google Scholar] [CrossRef]
- Wu, G.; Liu, Y.; He, B.; Bao, Q.; Duan, A.; Jin, F.-F. Thermal Controls on the Asian Summer Monsoon. Sci. Rep. 2012, 2. [Google Scholar] [CrossRef] [PubMed]
- Peng, S.; Chen, A.; Xu, L.; Cao, C.; Fang, J.; Myneni, R.B.; Pinzon, J.E.; Tucker, C.J.; Piao, S. Recent change of vegetation growth trend in China. Environ. Res. Lett. 2011, 6. [Google Scholar] [CrossRef]
- Cui, X.; Graf, H.-F. Recent land cover changes on the Tibetan Plateau: A review. Clim. Change 2009, 94, 47–61. [Google Scholar] [CrossRef]
- Zhu, L.; Xie, M.; Wu, Y. Quantitative analysis of lake area variations and the influence factors from 1971 to 2004 in the Nam Co basin of the Tibetan Plateau. Chin. Sci. Bull. 2010, 55, 1294–1303. [Google Scholar] [CrossRef]
- Cheng, G.; Wu, T. Responses of permafrost to climate change and their environmental significance, Qinghai-Tibet Plateau. J. Geophys. Res. Earth Surf. 2007, 112. [Google Scholar] [CrossRef]
- Duan, A.M.; Wu, G.X. Role of the Tibetan Plateau thermal forcing in the summer climate patterns over subtropical Asia. Clim. Dyn. 2005, 24, 793–807. [Google Scholar] [CrossRef]
- Duan, A.; Wang, M.; Lei, Y.; Cui, Y. Trends in Summer Rainfall over China Associated with the Tibetan Plateau Sensible Heat Source during 1980–2008. J. Clim. 2013, 26, 261–275. [Google Scholar] [CrossRef]
- Liu, G.; Zhao, P.; Chen, J. Possible Effect of the Thermal Condition of the Tibetan Plateau on the Interannual Variability of the Summer Asian-Pacific Oscillation. J. Clim. 2017, 30, 9965–9977. [Google Scholar] [CrossRef]
- Liu, G.; Zhao, P.; Chen, J.; Yang, S. Preceding Factors of Summer Asian-Pacific Oscillation and the Physical Mechanism for Their Potential Influences. J. Clim. 2015, 28, 2531–2543. [Google Scholar] [CrossRef]
- Wu, G.; Zhuo, H.; Wang, Z.; Liu, Y. Two types of summertime heating over the Asian large-scale orography and excitation of potential-vorticity forcing I. Over Tibetan Plateau. Sci. China Earth Sci. 2016, 59, 1996–2008. [Google Scholar] [CrossRef]
- Lu, M.; Yang, S.; Li, Z.; He, B.; He, S.; Wang, Z. Possible effect of the Tibetan Plateau on the “upstream” climate over West Asia, North Africa, South Europe and the North Atlantic. Clim. Dyn. 2018, 51, 1485–1498. [Google Scholar] [CrossRef]
- Chen, J.; Yue, X.; Liu, G.; Nan, S. Relationship between the thermal condition of the Tibetan Plateau and precipitation over the region from eastern Ukraine to North Caucasus during summer. Theor. Appl. Climatol. 2020, 142, 1379–1395. [Google Scholar] [CrossRef]
- Nan, S.; Zhao, P.; Chen, J. Variability of summertime Tibetan tropospheric temperature and associated precipitation anomalies over the central-eastern Sahel. Clim. Dyn. 2019, 52, 1819–1835. [Google Scholar] [CrossRef]
- Nan, S.; Zhao, P.; Chen, J.; Liu, G. Links between the thermal condition of the Tibetan Plateau in summer and atmospheric circulation and climate anomalies over the Eurasian continent. Atmos. Res. 2021, 247, 105212. [Google Scholar] [CrossRef]
- Wang, C.; Yu, L.; Huang, B. The Impact of Warm Pool SST and General Circulation on Increased Temperature over the Tibetan Plateau. Adv. Atmos. Sci. 2012, 29, 274–284. [Google Scholar] [CrossRef]
- Li, C.; Lu, R.; Bett, P.E.; Scaife, A.A.; Martin, N. Skillful Seasonal Forecasts of Summer Surface Air Temperature in Western China by Global Seasonal Forecast System Version 5. Adv. Atmos. Sci. 2018, 35, 955–964. [Google Scholar] [CrossRef]
- Ji, C.; Zhang, Y.; Cheng, Q.; Li, Y.; Jiang, T.; Liang, X.S. On the relationship between the early spring Indian Ocean’s sea surface temperature (SST) and the Tibetan Plateau atmospheric heat source in summer. Glob. Planet. Chang. 2018, 164, 1–10. [Google Scholar] [CrossRef]
- Wang, H.; Liu, G.; Chen, J. Contribution of the tropical western Atlantic thermal conditions during the preceding winter to summer temperature anomalies over the lower reaches of the Yangtze River basin-Jiangnan region. Int. J. Climatol. 2017, 37, 4631–4642. [Google Scholar] [CrossRef]
- Ya, G.; Huijun, W.; Shuanglin, L. Influences of the Atlantic Ocean on the summer precipitation of the southeastern Tibetan Plateau. J. Geophys. Res. Atmos. 2013, 118, 3534–3544. [Google Scholar] [CrossRef]
- Entin, J.K.; Robock, A.; Vinnikov, K.Y.; Hollinger, S.E.; Liu, S.X.; Namkhai, A. Temporal and spatial scales of observed soil moisture variations in the extratropics. J. Geophys. Res. Atmos. 2000, 105, 11865–11877. [Google Scholar] [CrossRef]
- Koster, R.D.; Suarez, M.J. Soil moisture memory in climate models. J. Hydrometeorol. 2001, 2, 558–570. [Google Scholar] [CrossRef]
- Douville, H.; Conil, S.; Tyteca, S.; Voldoire, A. Soil moisture memory and West African monsoon predictability: Artefact or reality? Clim. Dyn. 2007, 28, 723–742. [Google Scholar] [CrossRef]
- Moon, S.; Ha, K.-J. Early Indian Summer Monsoon Onset Driven by Low Soil Moisture in the Iranian Desert. Geophys. Res. Lett. 2019, 46, 10568–10577. [Google Scholar] [CrossRef]
- Chow, K.C.; Chan, J.C.L.; Shi, X.; Liu, Y.; Ding, Y. Time-lagged effects of spring Tibetan Plateau soil moisture on the monsoon over China in early summer. Int. J. Climatol. 2008, 28, 55–67. [Google Scholar] [CrossRef]
- Kalnay, E.; Kanamitsu, M.; Kistler, R.; Collins, W.; Deaven, D.; Gandin, L.; Iredell, M.; Saha, S.; White, G.; Woollen, J.; et al. The NCEP/NCAR 40-Year Reanalysis Project. Bull. Am. Meteorol. Soc. 1996, 77, 437–472. [Google Scholar] [CrossRef]
- Xie, P.; Arkin, P.A. Global Precipitation: A 17-Year Monthly Analysis Based on Gauge Observations, Satellite Estimates, and Numerical Model Outputs. Bull. Am. Meteorol. Soc. 1997, 78, 2539–2558. [Google Scholar] [CrossRef]
- Dee, D.P.; Uppala, S.M.; Simmons, A.J.; Berrisford, P.; Poli, P.; Kobayashi, S.; Andrae, U.; Balmaseda, M.A.; Balsamo, G.; Bauer, P.; et al. The ERA-Interim reanalysis: Configuration and performance of the data assimilation system. Q. J. R. Meteorol. Soc. 2011, 137, 553–597. [Google Scholar] [CrossRef]
- Huang, B.; Thorne, P.W.; Smith, T.M.; Liu, W.; Lawrimore, J.; Banzon, V.F.; Zhang, H.-M.; Peterson, T.C.; Menne, M. Further Exploring and Quantifying Uncertainties for Extended Reconstructed Sea Surface Temperature (ERSST) Version 4 (v4). J. Clim. 2016, 29, 3119–3142. [Google Scholar] [CrossRef]
- Oku, Y.; Ishikawa, H.; Haginoya, S.; Ma, Y. Recent trends in land surface temperature on the Tibetan Plateau. J. Clim. 2006, 19, 2995–3003. [Google Scholar] [CrossRef]
- Xu, Y.; Knudby, A.; Ho, H.C.; Shen, Y.; Liu, Y. Warming over the Tibetan Plateau in the last 55 years based on area-weighted average temperature. Reg. Environ. Change 2017, 17, 2339–2347. [Google Scholar] [CrossRef]
- Obukhov, A. Statistically homogeneous fields on a sphere. Uspethi Mat. Nauk. 1947, 2, 196–198. [Google Scholar]
- Kundu, P.K.; Allen, J.S. Some Three-Dimensional Characteristics of Low-Frequency Current Fluctuations near the Oregon Coast. J. Phys. Oceanogr. 1976, 6, 181–199. [Google Scholar] [CrossRef]
- Hu, M.; Gong, D.; Wang, L.; Zhou, T. Possible influence of January–March Arctic Oscillation on the convection of tropical North Pacific and North Atlantic. Acta Meteorol. Sin. 2012, 70, 479–491. (In Chinese) [Google Scholar]
- Yue, X.; Liu, G.; Chen, J.; Zhou, C. Synergistic regulation of the interdecadal variability in summer precipitation over the Tianshan mountains by sea surface temperature anomalies in the high-latitude Northwest Atlantic Ocean and the Mediterranean Sea. Atmos. Res. 2020, 233. [Google Scholar] [CrossRef]
- Gao, M.; Wang, B.; Yang, J.; Dong, W. Are Peak Summer Sultry Heat Wave Days over the Yangtze–Huaihe River Basin Predictable? J. Clim. 2018, 31, 2185–2196. [Google Scholar] [CrossRef]
- Durbin, J.; Watson, G.S. Testing for serial correlation in least squares regression. III. Biometrika 1971, 58, 1–19. [Google Scholar] [CrossRef]
- Tao, J.; Zhang, X.; Tao, J.; Shen, Q. The Checking and Removing of the Autocorrelation in Climatic Time Series. J. Appl. Meteoro. Sci. 2008, 19, 47–52. (In Chinese) [Google Scholar]
- Betts, A.K.; Ball, J.H.; Beljaars, A.C.M.; Miller, M.J.; Viterbo, P.A. The land surface-atmosphere interaction: A review based on observational and global modeling perspectives. J. Geophys. Res. Atmos. 1996, 101, 7209–7225. [Google Scholar] [CrossRef]
- Schär, C.; Lüthi, D.; Beyerle, U.; Heise, E. The Soil–Precipitation Feedback: A Process Study with a Regional Climate Model. J. Clim. 1999, 12, 722–741. [Google Scholar] [CrossRef]
- Eltahir, E.A.B. A Soil Moisture–Rainfall Feedback Mechanism: 1. Theory and observations. Water Resour. Res. 1998, 34, 765–776. [Google Scholar] [CrossRef]
- Wu, G.; Liu, Y.; Liu, P. The effect of spatially nonuniform heating on the formation and variation of subtropical high part I: Scale analysis. Acta Meteorol. Sin. 1999, 57, 257–263. (In Chinese) [Google Scholar]
- Liu, Y.; Wu, G.; Liu, H.; Liu, P. The effect of spatially nonuniform heating on the formation and variation of subtropical high part II: Condensation latent heat heating and South Asia high and West Pacific subtropical high. Acta Meteorol. Sin. 1999, 57, 525–538. (In Chinese) [Google Scholar]
- Boschat, G.; Terray, P.; Masson, S. Interannual relationships between Indian Summer Monsoon and Indo-Pacific coupled modes of variability during recent decades. Clim. Dyn. 2011, 37, 1019–1043. [Google Scholar] [CrossRef]
- Boschat, G.; Terray, P.; Masson, S. Robustness of SST teleconnections and precursory patterns associated with the Indian summer monsoon. Clim. Dyn. 2012, 38, 2143–2165. [Google Scholar] [CrossRef]
- Xie, S.-P.; Hu, K.; Hafner, J.; Tokinaga, H.; Du, Y.; Huang, G.; Sampe, T. Indian Ocean Capacitor Effect on Indo–Western Pacific Climate during the Summer following El Niño. J. Clim. 2009, 22, 730–747. [Google Scholar] [CrossRef]
- Wu, B.; Zhou, T.; Li, T. Seasonally Evolving Dominant Interannual Variability Modes of East Asian Climate. J. Clim. 2009, 22, 2992–3005. [Google Scholar] [CrossRef]
- Zhao, P.; Xu, X.; Chen, F.; Guo, X.; Zheng, X.; Liu, L.; Hong, Y.; Li, Y.; La, Z.; Peng, H.; et al. The third atmospheric scientific experiment for understanding the earth-atmosphere coupled system over the Tibetan Plateau and its effect. Bull. Am. Meteorol. Soc. 2018, 99, 757–776. [Google Scholar] [CrossRef]
- Fallah, B.; Cubasch, U.; Proemmel, K.; Sodoudi, S. A numerical model study on the behaviour of Asian summer monsoon and AMOC due to orographic forcing of Tibetan Plateau. Clim. Dyn. 2016, 47, 1485–1495. [Google Scholar] [CrossRef]
- Duan, A.; Sun, R.; He, J. Impact of surface sensible heating over the Tibetan Plateau on the western Pacific subtropical high: A land-air-sea interaction perspective. Adv. Atmos. Sci. 2017, 34, 157–168. [Google Scholar] [CrossRef]
- Liu, S.; Wu, Q.; Schroeder, S.R.; Yao, Y.; Zhang, Y.; Wu, T.; Wang, L.; Hu, H. Near-Global Atmospheric Responses to Observed Springtime Tibetan Plateau Snow Anomalies. J. Clim. 2020, 33, 1691–1706. [Google Scholar] [CrossRef]
Publisher’s Note: MDPI stays neutral with regard to jurisdictional claims in published maps and institutional affiliations. |
© 2021 by the authors. Licensee MDPI, Basel, Switzerland. This article is an open access article distributed under the terms and conditions of the Creative Commons Attribution (CC BY) license (http://creativecommons.org/licenses/by/4.0/).