Article

Multi-Annual Changes in Heat Stress Occurrence and Its Circulation Conditions in the Polish–Saxon Border Region

by
Bartłomiej Miszuk
Institute of Meteorology and Water Management—National Research Institute, Parkowa 30, 51-616 Wrocław, Poland
Atmosphere 2021, 12(2), 163; https://doi.org/10.3390/atmos12020163
Submission received: 23 December 2020 / Revised: 19 January 2021 / Accepted: 25 January 2021 / Published: 27 January 2021
(This article belongs to the Special Issue Temperature Extremes and Atmospheric Circulation)

Abstract

:
Heat stress is one of the most critical factors affecting human life. In Central Europe, its influence is noticeable, especially in the Polish–Saxon region, which is a very popular tourist region also inhabited by a high number of elders. The main goal of this paper was to assess multi-annual changes in heat stress occurring in the region, considering the frequency of heat days, the UTCI (Universal Thermal Climate Index), and circulation conditions. The research showed that all the thermal and biothermal indices in this region significantly increased during 1971–2019 in the lowlands, the mountain foreland, and the lower mountain zone. In terms of the UTCI, a negative trend for cold stress frequency was noticed in the entire region in favor of an increase in a tendency toward thermoneutral conditions and heat stress. This concerns especially strong and very strong heat stress (UTCI > 32 °C), in which positive trends were observed for most of the stations located in the lower hypsometric zones. The results also showed that heat stress mainly occurs on days with anticyclonic circulation. Analysis of selected cases of heat waves in the 21st century indicated that the lower hypsometric zones are characterized by a very high UTCI, while the summit zone is free from heat stress occurrence.

1. Introduction

Heat stress is one of the most characteristic weather features affecting human life.
High air temperature, humidity, low wind speed, and the influence of solar conditions increase the intensity of the heat load on the human organism, which consequently results in a high risk for health. In terms of thermal conditions, an increase in air temperature values has been observed over the past decades, especially, in recent years. According to the WMO (World Meteorological Organization) report [1], the period of 2015–2018 was the warmest in the history of measurements. Taking into consideration the 2015–2019 five-year period, the mean global air temperature was 1.7 °C higher if compared to the pre-industrial era and 0.3 °C higher than for 2011–2015. Before this period, from the last decades of the 19th century to 2006–2015, the mean air temperature of the world increased from 1.38 °C to 1.68 °C [2]. The rising air temperature in moderate latitudes is often related to intensification of heat stress and its negative impact on the human organism. Studies concerning problems of temporal variability of heat stress showed that the frequency of such weather conditions in Europe had significantly increased [3,4,5,6,7,8,9,10,11,12,13]. Such a growing tendency is contributed by frequent heat waves that have been recorded multiple times over the past two decades. One of the most extreme heat periods occurred during the summer of 2003 [14,15,16,17], 2006 [18,19,20,21,22], 2015 [23,24,25,26,27,28], 2018 [29,30,31,32], and 2019 [33,34,35]. All these heat-related weather types contributed to intensification of mortality during these summer seasons [4,13,20,25,26,36,37,38,39,40]. More than 70,000 additional deaths were noticed in Western Europe during the summer of 2003 [39]. In some regions of Germany, the mortality in August 2003 and July 2015 exceeded the normal rate by 70% and 56%, respectively [25]. In the case of the 2006 heat wave in Poland, the mortality rate growth varied from 33% to 115%, depending on the region [41]. As a result of extreme heat weather occurrence over the past decades, 25% of the most significant disasters in the world during 1996–2015 were considered to be related to heat waves [42].
Heat stress is determined by particular types of atmospheric circulation. During the mentioned summer seasons, the highest values of air temperature in Central Europe were usually noticed under anticyclonic types of weather and advection of tropical and continental polar air masses from the south and the east [43]. Research on the impact of circulation conditions on heat stress in Central Europe showed that advection of warm air masses from these directions is generated by high-pressure systems located in the northern, eastern, or southeastern regions of the continent [43,44,45,46]. Such situations contributed to heat wave development, including the episodes of 2003, 2015, and 2018 [14,15,31].
The high impact of heat-related weather on the human organism is noticeable in the case of the universal thermal climate index (UTCI), which is currently a widely used biometeorological tool. The index was used in the assessment of biothermal conditions of various European states [4,47,48,49,50], including Central Europe: Germany, Czechia, and Poland [46,51,52,53,54,55,56,57]. The research showed that in the case of days characterized by very high air temperature, the UTCI in the lowlands can be higher than 40 °C, which significantly exceeds the critical value (32 °C) for mortality related to cardiovascular issues [4,43,55]. During the extreme heat wave in 2006, an increase in the mortality rate in Poland for people with cardiovascular diseases amounted to 55–220%, while for the elders, it varied from 41% to 134% [41]. The analysis carried out in Germany indicated that such high UTCI values (exceeding 32 °C) can be mainly recorded during the southern anticyclonic circulation [57].
In this case, the Polish–Saxon border area, including southwest Poland and southeast Germany, is a specific region that is inhabited by a high number (>50%) of people aged over 65 years. The region is a very popular destination for tourists and bathers. The Sudety Mountains and the Zittau Mountains, located in the south of the region, make this area attractive from the tourism perspective, while health resorts (Jonsdorf, Świeradów-Zdrój, Cieplice-Zdrój) encourage persons with health problems. Thus, the region is inhabited or visited by a high number of people who are vulnerable to heat stress impact. The studies devoted to climate conditions of this region [58,59,60] indicated a statistically significant rising trend in the mean annual and maximum air temperature in 1971–2010, reaching 1.0–1.2 °C and 0.9–1.4 °C, respectively. Simultaneously, analysis of biometeorological conditions showed that the areas located lower down in the region were characterized by a high frequency of heat stress during the summertime [60,61].
Therefore, the main goal of this paper was to examine multi-annual changes in heat stress occurrence in the Polish–Saxon border region in 1971–2019, with a consideration of atmospheric circulation conditions. An evaluation of changes in the heat stress frequency was carried out using the index of heat days and the biothermal index of UTCI. Furthermore, analysis of the course of air temperature and the UTCI for selected several-day periods of the summer seasons of 2006 and 2015 was conducted in order to present how extreme biothermal conditions correspond to the synoptic situation. The results of the study can be used as valuable data for local health resorts. They can also be a source of information for tourists visiting the region.

2. Materials and Methods

The evaluation of heat stress was carried out for the Polish–Saxon region. In the case of Poland, this included areas located in the western part of Lower Silesia, west from Bóbr, Kaczawa, and Odra Rivers. In Germany, the area of east Saxony, limited by Elbe River from the west, was taken into consideration (Figure 1). The German and Polish parts of the region are separated from each other by the Lusatian Neisse River, which forms a border between Poland and Germany. A significant geographical variability characterizes the region. Lowlands mainly cover the northern part, while the mountain foreland and mountains are predominant in the south. The highest parts of the region are the Sudety Mountains and the Zittau Mountains, located in the very south and forming a border with Czechia.
The analysis was based on meteorological data for 1971–2019 collected from both Polish and German meteorological stations located in the considered region and the surroundings. Meteorological records from three Polish (Legnica, Jelenia Góra, and Śnieżka Mountain) and three German (Cottbus, Dresden, and Görlitz) stations were taken into account. The stations represented various geographical regions and altitudes (Table 1). Cottbus and Legnica were located in the lowlands, while Dresden and Görlitz corresponded to the mountain foreland. The highest-located Polish stations—Jelenia Góra and Śnieżka Mountain—represented the lower zone and the summits of the Sudety Mountains.
The collected meteorological data included both daily and 12:00 UTC records from the Institute of Meteorology and Water Management—National Research Institute (IMGW-PIB) and the German Weather Service (DWD). The daily data concerned values of the maximum air temperature, whereas the records from 12:00 UTC included information on air temperature, relative humidity, wind speed, and cloudiness. Furthermore, data related to the sun angle were also used in order to evaluate the radiation factor. In addition, records from the main synoptic terms (0:00, 3:00, 6:00, 9:00, 12:00, 15:00, 18:00, and 21:00 UTC) were also considered for the purposes of the daily course of air temperature and the UTCI during selected heat wave periods.
Based on the daily data, the annual number of heat days (Tmax > 30 °C) for 1971–2019 was calculated for each station. Considering the results, the multi-annual course of this index was examined in the context of its tendency and intensity of changes. Furthermore, the trend was evaluated in terms of statistical significance (at the level of 0.05) using linear regression analysis. The results were also verified using the Mann–Kendall test and Sen’s method. Correlation between the frequency of heat days and circulation types was calculated using Pearson’s correlation coefficient.
Evaluation of heat stress was also carried out using the biometeorological universal thermal climate index (UTCI), which considers a vast range of physiological aspects. The index is based on multi-node models, mainly on Fiala’s model [62], and has been described in detail in papers devoted to its principles [63,64]. According to the UTCI, biothermal conditions are classified into 10 categories, ranging from extreme cold stress to extreme heat stress (Table 2). The UTCI was calculated using BioKlima software (version 2.6) [65]. Mean annual values of the index were evaluated in terms of their multi-annual changes, including examination of statistical significance. Furthermore, the frequency of particular thermal stress categories was also assessed for each year, followed by evaluation of their changes in 1971–2019.
In the case of the selected heat wave episodes, courses of air temperature and the UTCI were presented. They were aimed to assess changes in heat stress classes during several-day heat waves. To examine the impact of baric conditions on heat stress occurrence, the analysis was accompanied by synoptic characteristics, including synoptic charts for sea-level pressure and higher zones of the troposphere (isobaric levels of 850, 500, and 300 hPa).
In terms of evaluation of the results from the circulation perspective, the classification of atmospheric circulation developed by H. Ojrzyńska [66,67,68] was used. This classification was carried out for the region of the Sudety Mountains and their surroundings, including southwest Poland, southeast Germany, and east Czechia. According to the principles, the classification informs about vorticity (C-cyclonic, A-anticyclonic) and the direction of advection: NE, northeast (1–90°); SE, southeast (91–180°); SW, southwest (181–270°); NW, northwest (271–360°); and XX, indeterminate direction. The criteria for the classification were based on gridded meteorological data (2.5° × 2.5° spatial resolution, 24 h temporal resolution) from NCEP/NCAR (National Centers for Environmental Prediction/National Center for Atmospheric Research) re-analysis. Using the spline function, the data were interpolated to a spatial resolution of 5 km × 5 km. To determine the circulation type for each day, a prevailing type was calculated by applying the mode function for all the 5 km × 5 km grid cells [67]. The direction of advection was evaluated based on the wind direction from the 700 hPa isobaric level for a wind speed higher than 2 m/s. If it was lower or when no prevailing wind direction was observed, the XX circulation type was considered. Vorticity types were determined based on geopotential values from the 850 hPa isobaric level.
Daily data on circulation types were used for the purposes of this paper. Based on these records, analysis of circulation conditions in the context of the frequency of heat days and selected UTCI categories was carried out. The data concerning circulation were obtained directly from the author of the classification and included information for 1971–2018 [68]. Therefore, the multi-annual course of thermal and biothermal conditions was presented for 1971–2019, while analysis of circulation conditions and their impact on the selected indices concerned the 1971–2018 period.

3. Results

3.1. Heat Days

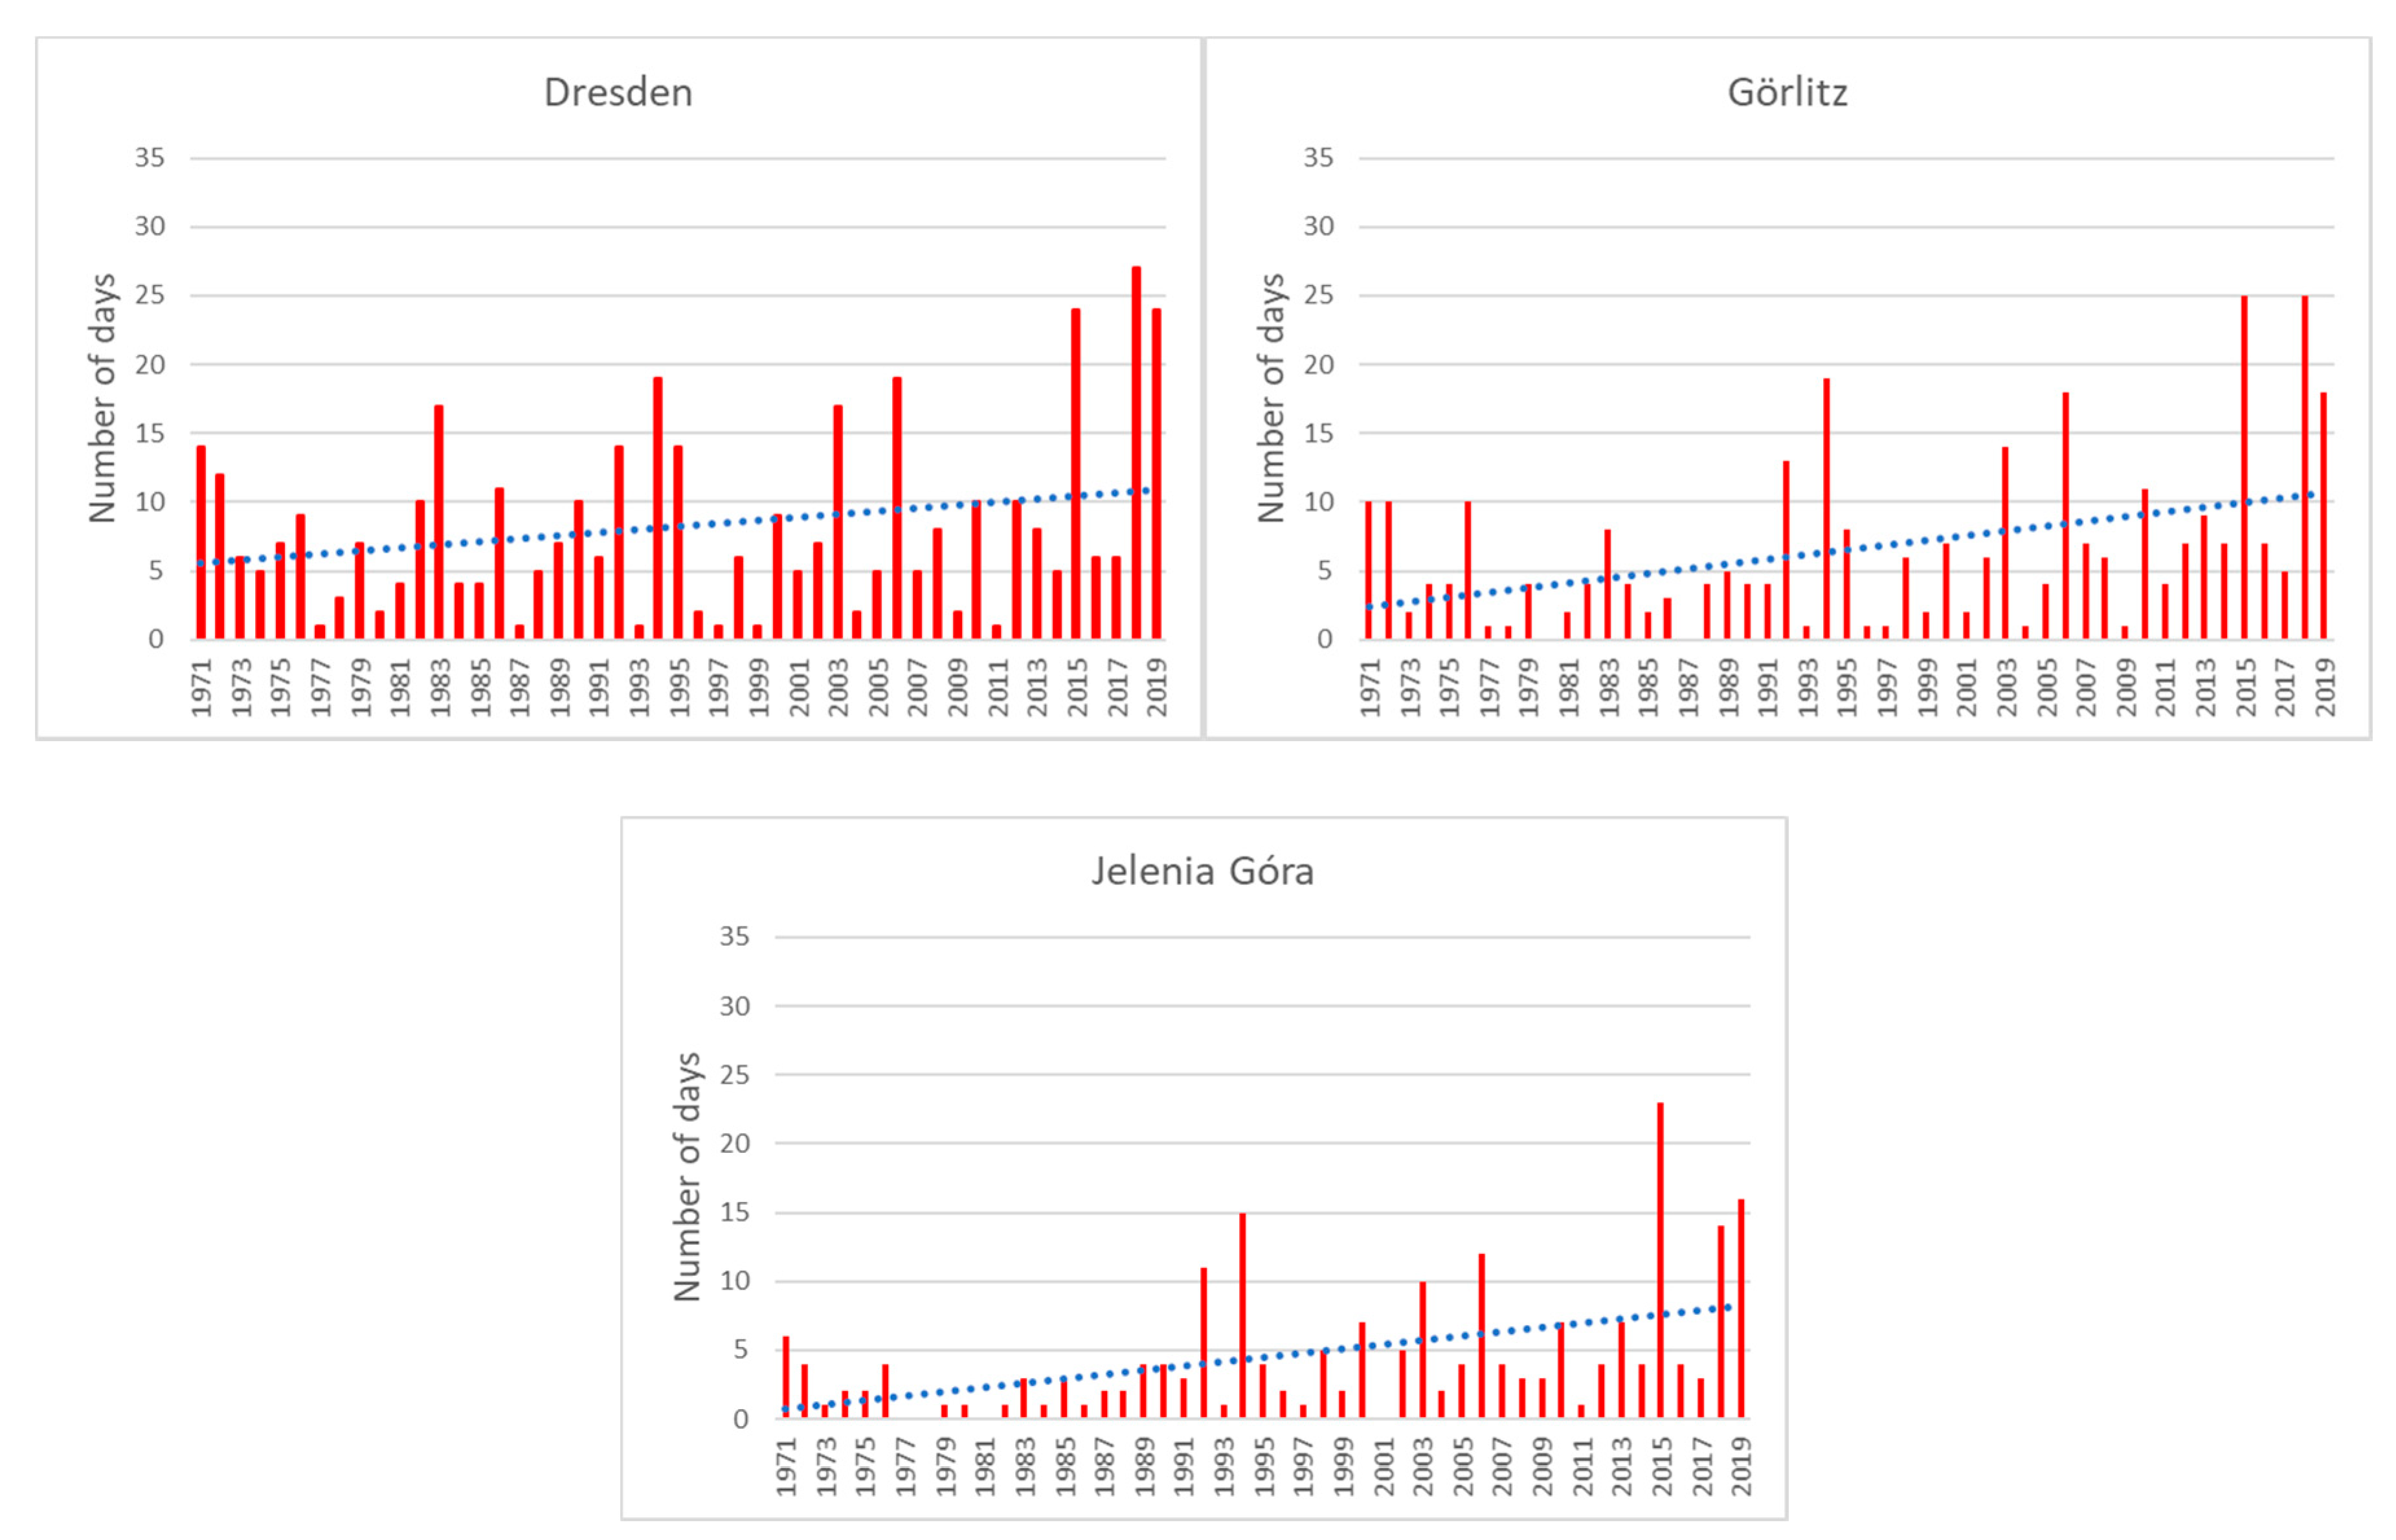
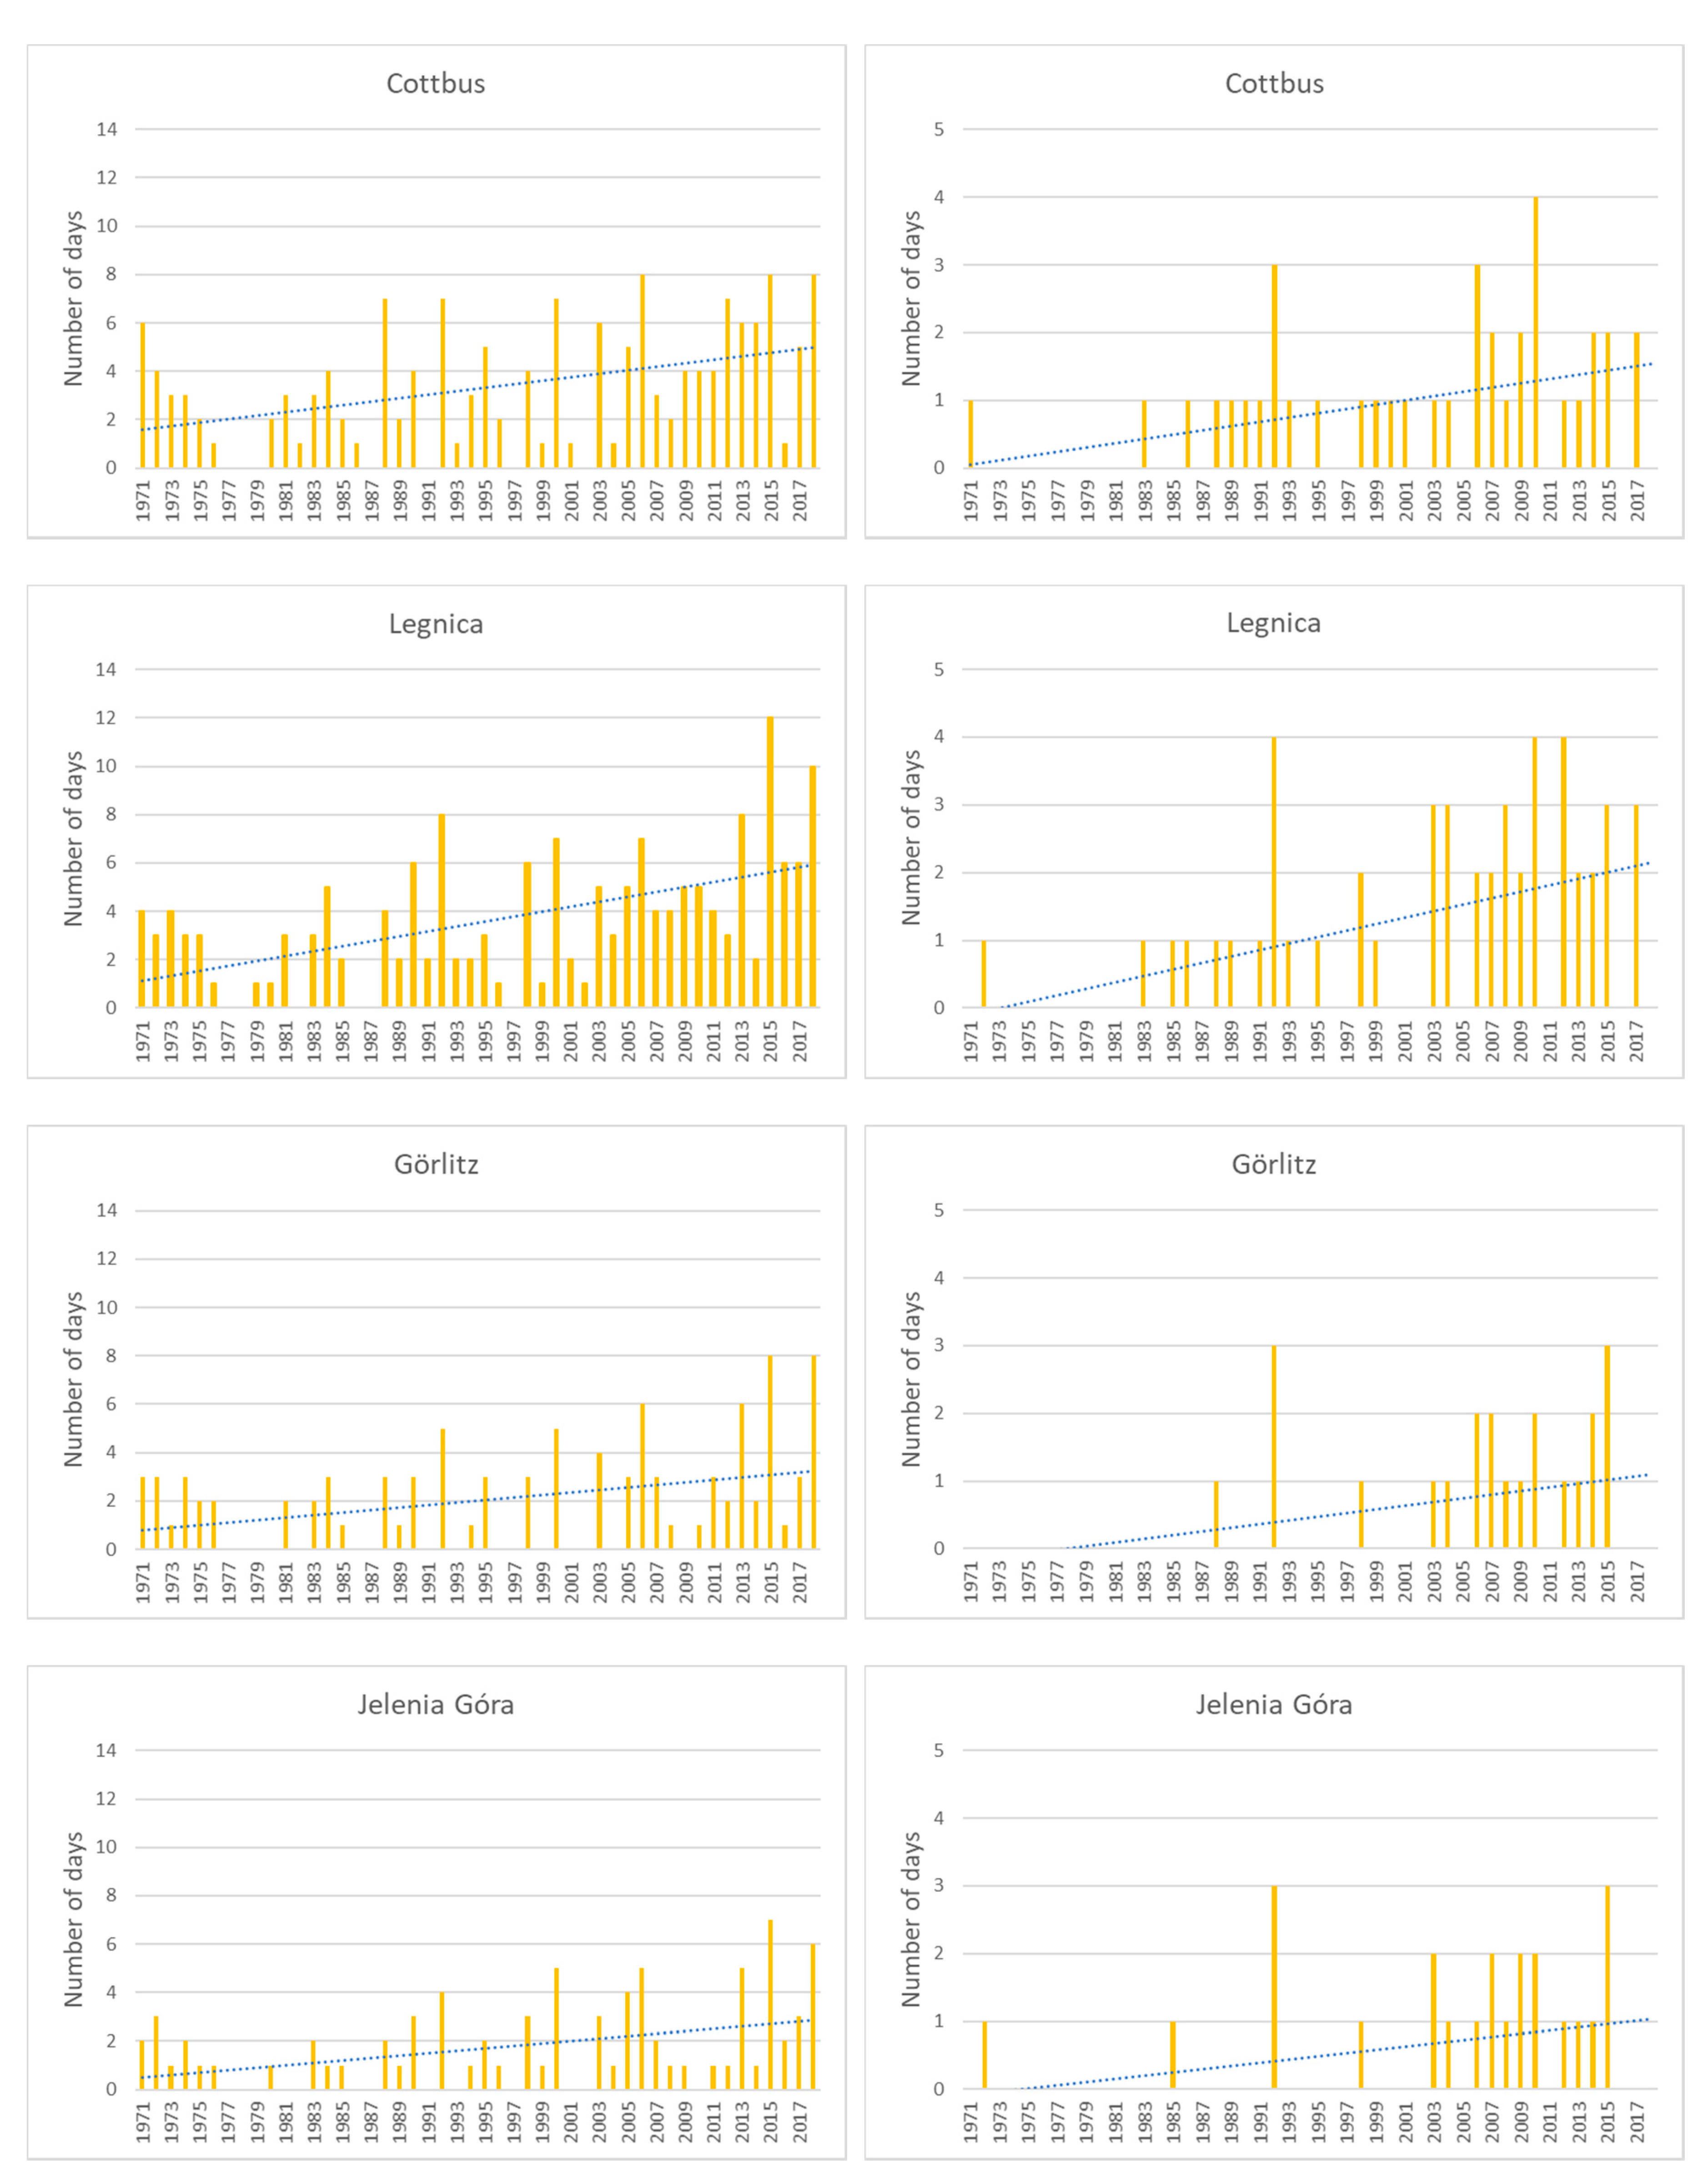
Changes in the mean air temperature over the past decades were reflected in the positive trend in the maximum air temperature and consequently caused an increase in the frequency of weather conditions defined as heat days (Tmax > 30 °C). The mean annual number of such days in 1971–2019 was mainly determined by altitude. In the case of the considered stations, the frequency varied from more than 4 days in Jelenia Góra to just above 12 days in Cottbus (Table 3). In the summit zone of the mountains represented by Śnieżka Mountain, heat days did not occur at all in the entire multi-annual period due to a low air temperature, high wind speed, and high cloudiness. In this case, a very high number of days with fog (over 300 days a year) should be emphasized. This significantly affects the radiation factor, humidity, and thermal conditions. Considering the regions located in the lowlands or in the mountain foreland, the number of such days considerably increased in 1971–2019 (Figure 2). The statistical significance of the trend, at the level of 0.05, was noticed for four stations (Cottbus, Legnica, Görlitz, and Jelenia Góra). The most dynamic changes were observed in Cottbus and Legnica, which are the lowest-located stations. In this case, the increase exceeded the rate of 2 days per decade. The remaining stations were characterized by changes ranging from just above 1 day per decade to 1 day per 6 years. The significantly rising trend for the annual number of heat days was mainly caused by their high frequency in the 21st century, especially in 2015–2019. In Cottbus, during the summer seasons of 2018 and 2019, air temperature exceeded 30 °C on 32 and 30 days, which was the highest annual frequency in the region for the entire multi-annual period. In 2015, the number of heat days at the considered stations varied from 23 in Jelenia Góra to 30 in Legnica. The statistical significance of the trends in heat days was also confirmed using the Mann–Kendall test.

3.2. Universal Thermal Climate Index (UTCI)

An increase in air temperature and the frequency of weather types related to heat stress in the discussed period also caused changes in the UTCI. In 1971–2019, the positive and statistically significant trend in mean annual values of the UTCI (for 12:00 UTC) was recorded for all of the stations except Dresden. The growth rate per decade was equal to 0.37 °C in Legnica, 0.45 °C in Jelenia Góra, and 0.52 °C in Cottbus. The most noticeable changes occurred in Görlitz and on Śnieżka Mountain, where the increase in the UTCI exceeded 0.8 °C per decade. As a result, noticeable changes in UTCI values in the multi-annual period contributed to changes in the frequency of particular categories of thermal stress.
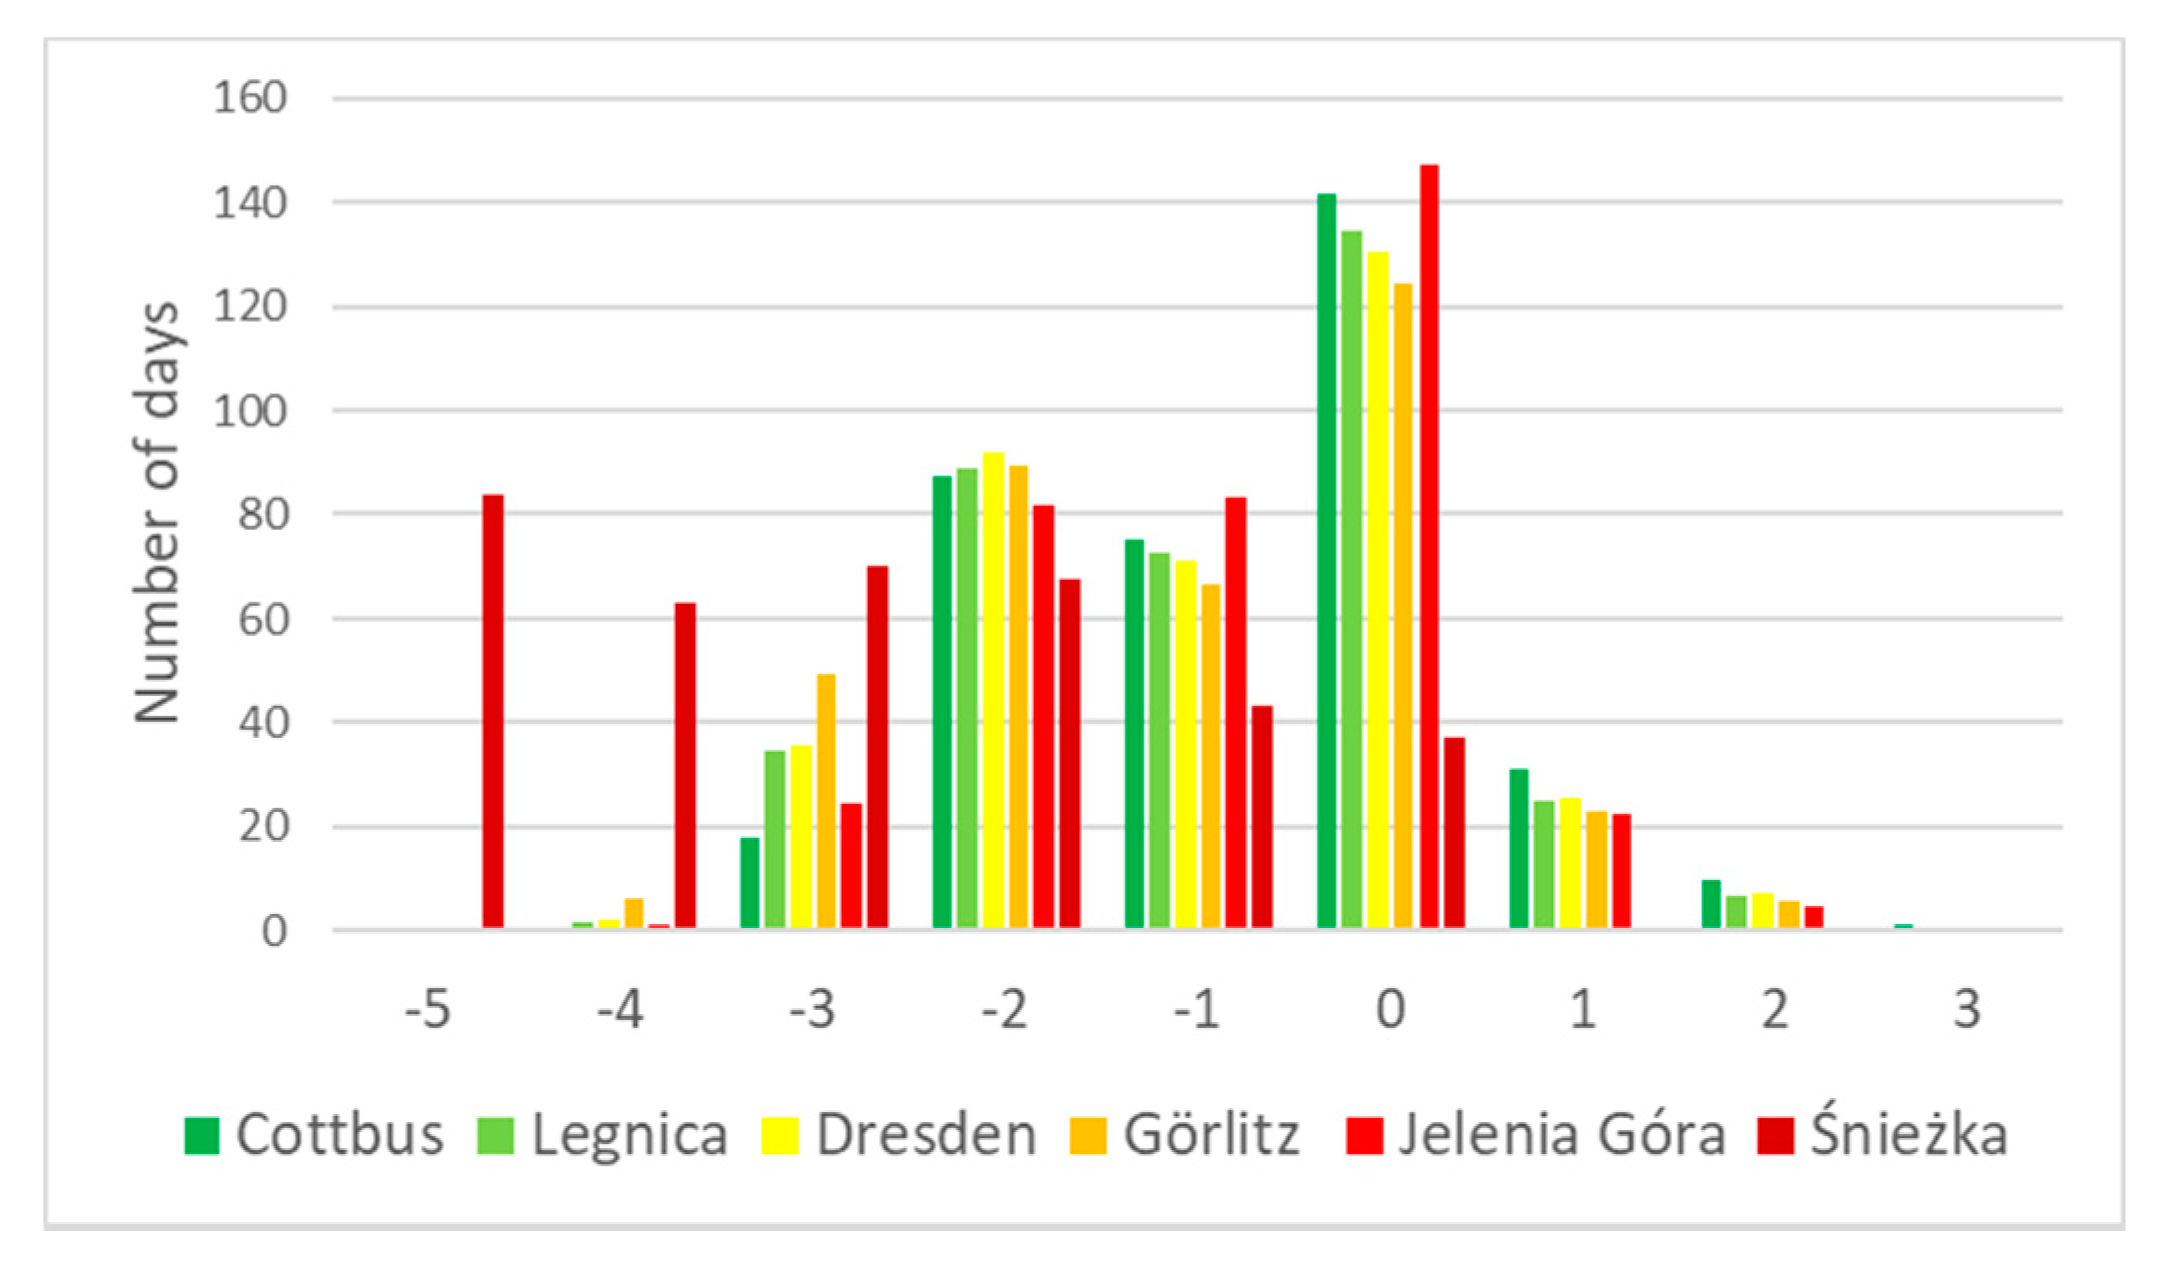
The mean annual number of the days with categories of thermal stress was determined by the location of the considered stations (Figure 3). In the lowlands, mountain foreland, and lower mountain zone, the category of no thermal stress was predominant and occurred on 124–147 days annually, mainly in the warm half-year. In the case of heat stress, its frequency decreases with increasing altitude. The annual number of days with moderate heat stress varied from 22 days in Jelenia Góra to 31 days in Cottbus, whereas the frequency of strong heat stress amounted to 5–10 days a year. The category of very strong heat stress usually occurred on 1 day a year in Cottbus, while in Legnica, Dresden, and Görlitz, it was twice or three times lower. In Jelenia Góra, this class of heat stress occurred occasionally. The highest intensity of heat stress was observed in the summer season, especially in August. It should also be emphasized that no extreme heat stress category was noticed in the region in the discussed period.
Considering the most intensive heat stress classes (strong and very strong heat stress), they occurred only in the warm half-year, mainly in the summer months (Table 4). Strong heat stress could be observed in the May–September period (in Cottbus, also occasionally in April), with the highest frequency in July and August. In this case, the mean frequency of strong heat stress varied from less than 2 days a month in Jelenia Góra to 3–4 days in Cottbus. In terms of very strong heat stress, it was noticed in the summer months only.
Different conditions characterize the summits represented by Śnieżka Mountain. In this case, cold stress was predominant throughout the year, including a very high frequency of extreme cold stress. A noticeably lower occurrence of the no thermal stress category was noticed if compared to the lower hypsometric zones. In the case of heat stress, the class of moderate heat stress was only observed in 1971–2019. Days with this type of weather occurred on Śnieżka Mountain with a frequency of 1 day per 5 years. No strong or very strong heat stress was recorded during the entire multi-annual period.
The most characteristic issue in terms of multi-annual changes in UTCI categories was a negative tendency of cold stress and rising trends in heat stress categories. Considering the stations located lower down, a decreasing and statistically significant trend in very strong and strong cold stress was observed in Cottbus, Görlitz, and Jelenia Góra (Table 4). In this case, the rate of decrease in strong cold stress amounted to 2–5 days per decade. It also reached 1 day per 6 years (Görlitz) for very strong cold stress. The negative trend in the most intensive cold stress categories was also noticed on Śnieżka Mountain. The most noticeable changes in 1971–2019 occurred for the extreme-cold-stress class. The changes were characterized by a statistically significant decreasing trend and a rate of more than 4 days per decade. In cases of moderate and slight cold stress, an increasing tendency was noticed. The trend in slight cold stress was characterized by statistical significance and an increasing rate reaching 2 days per decade.
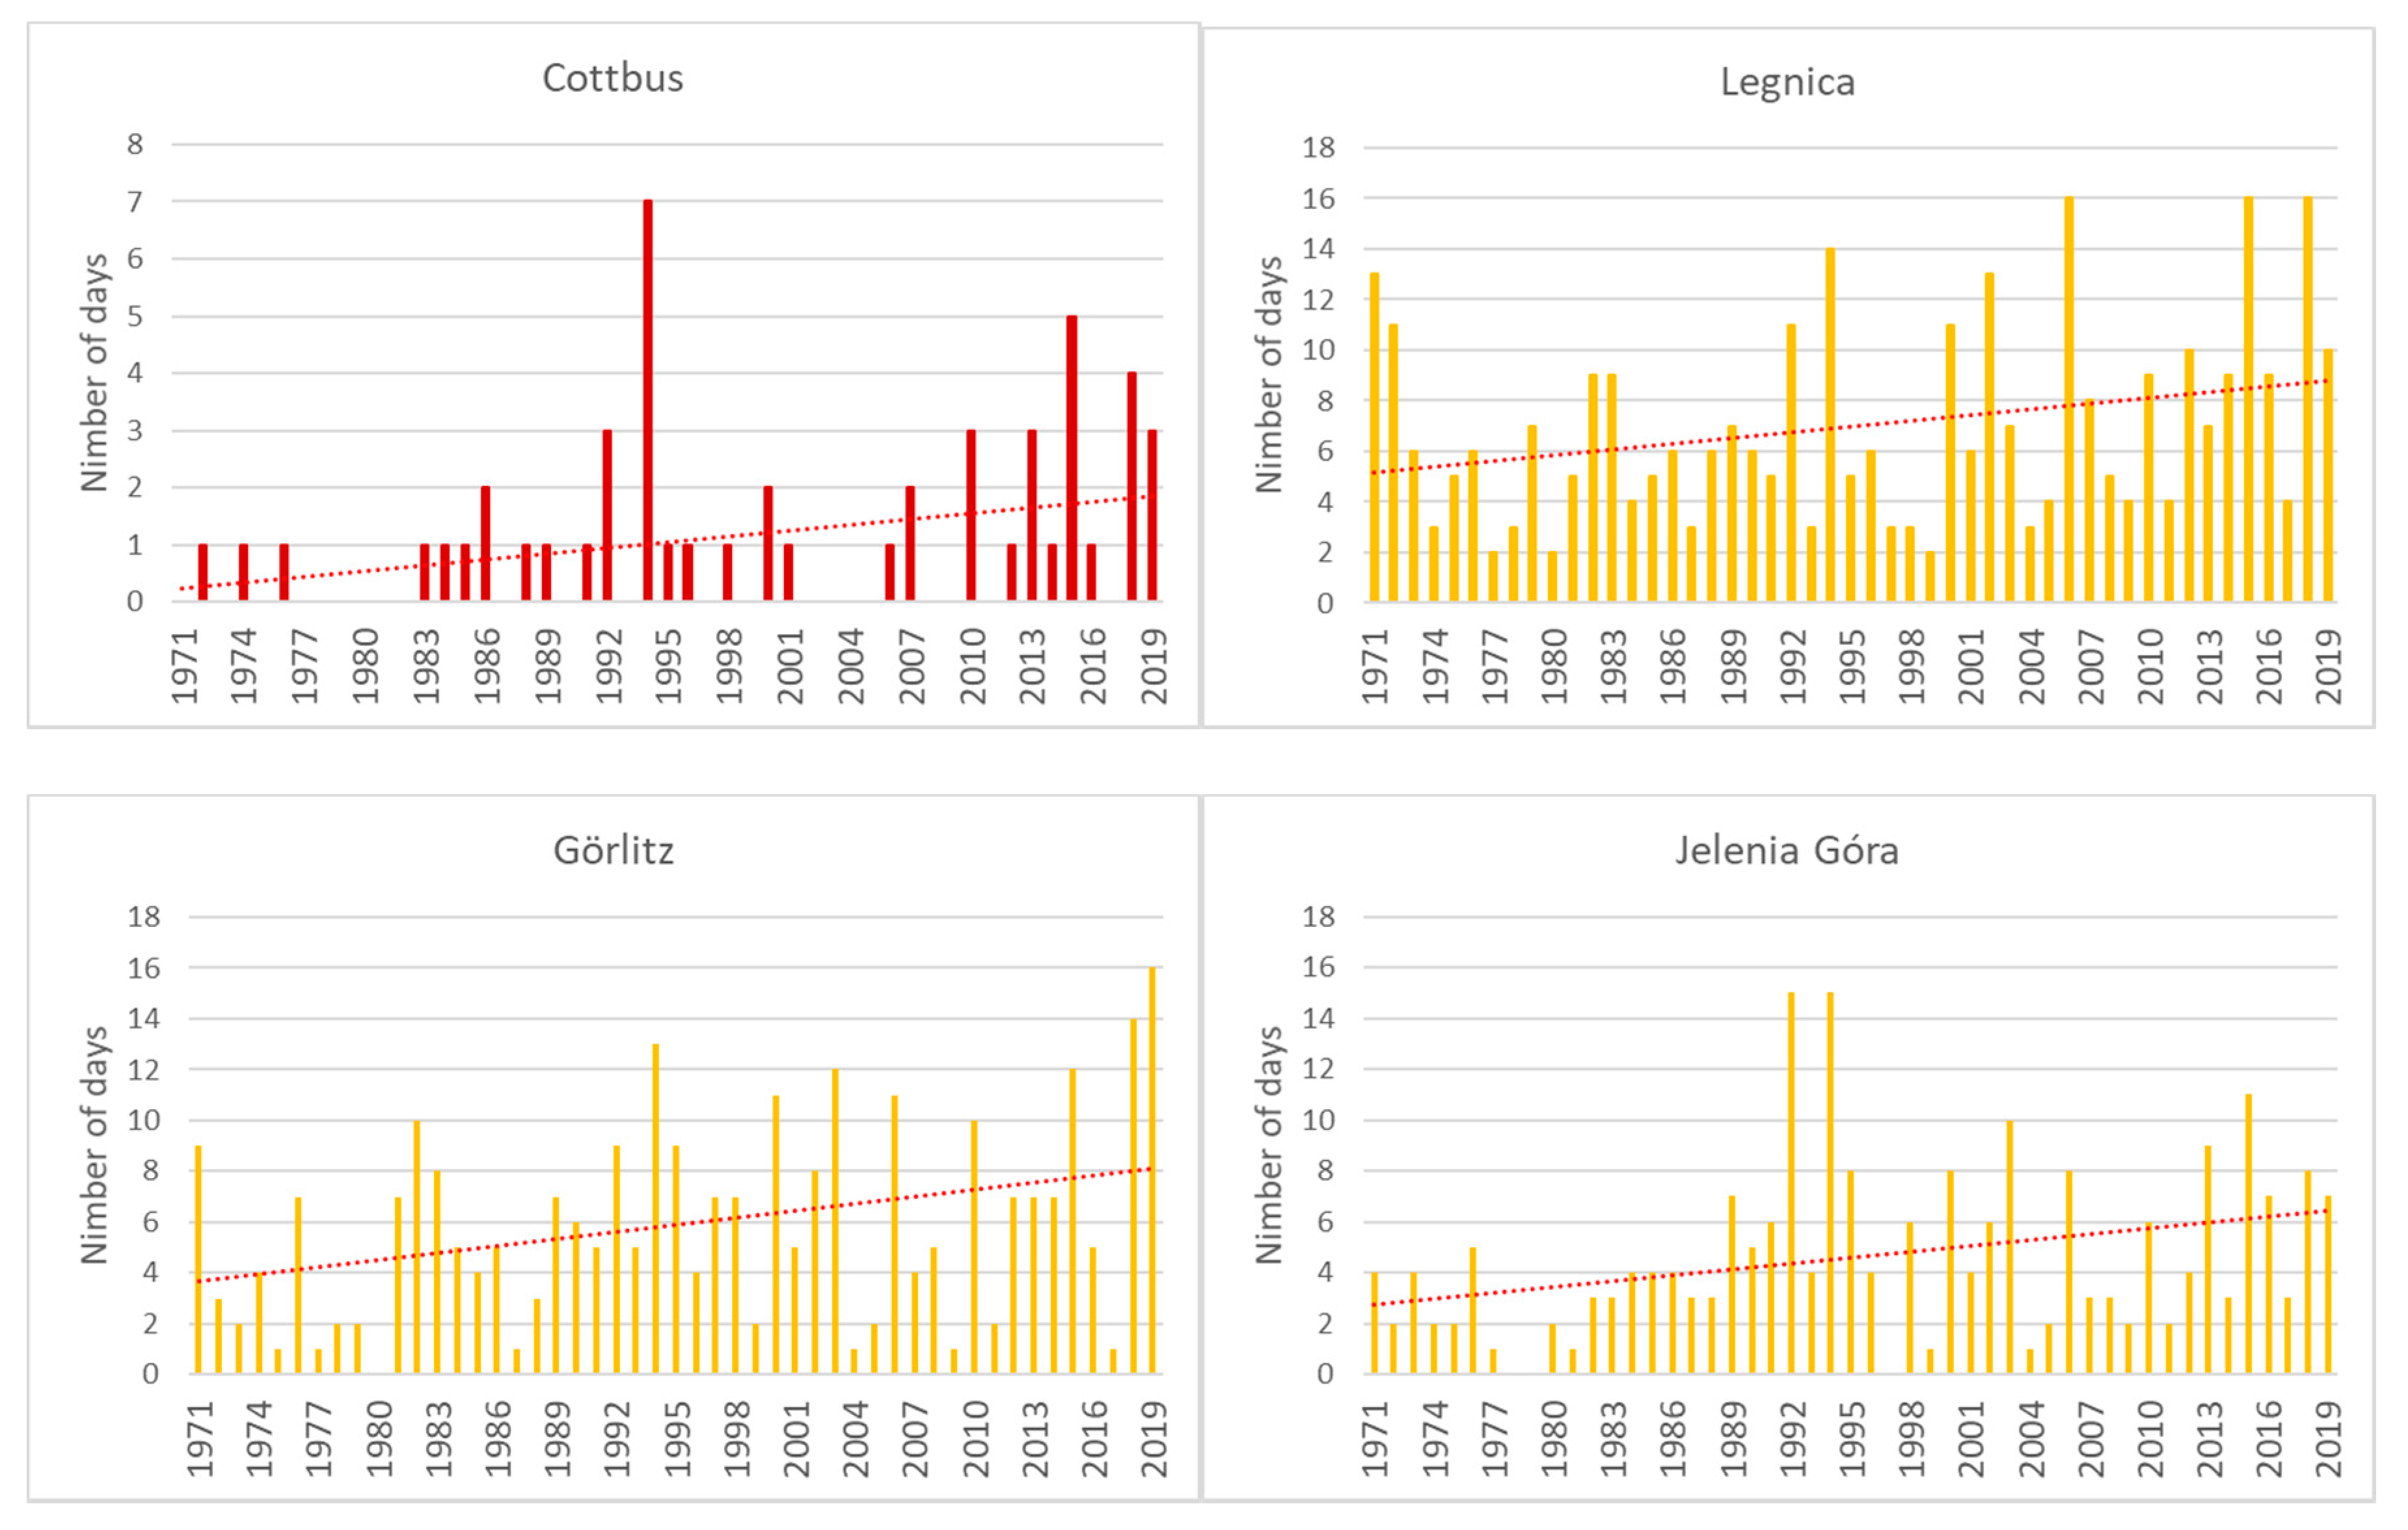
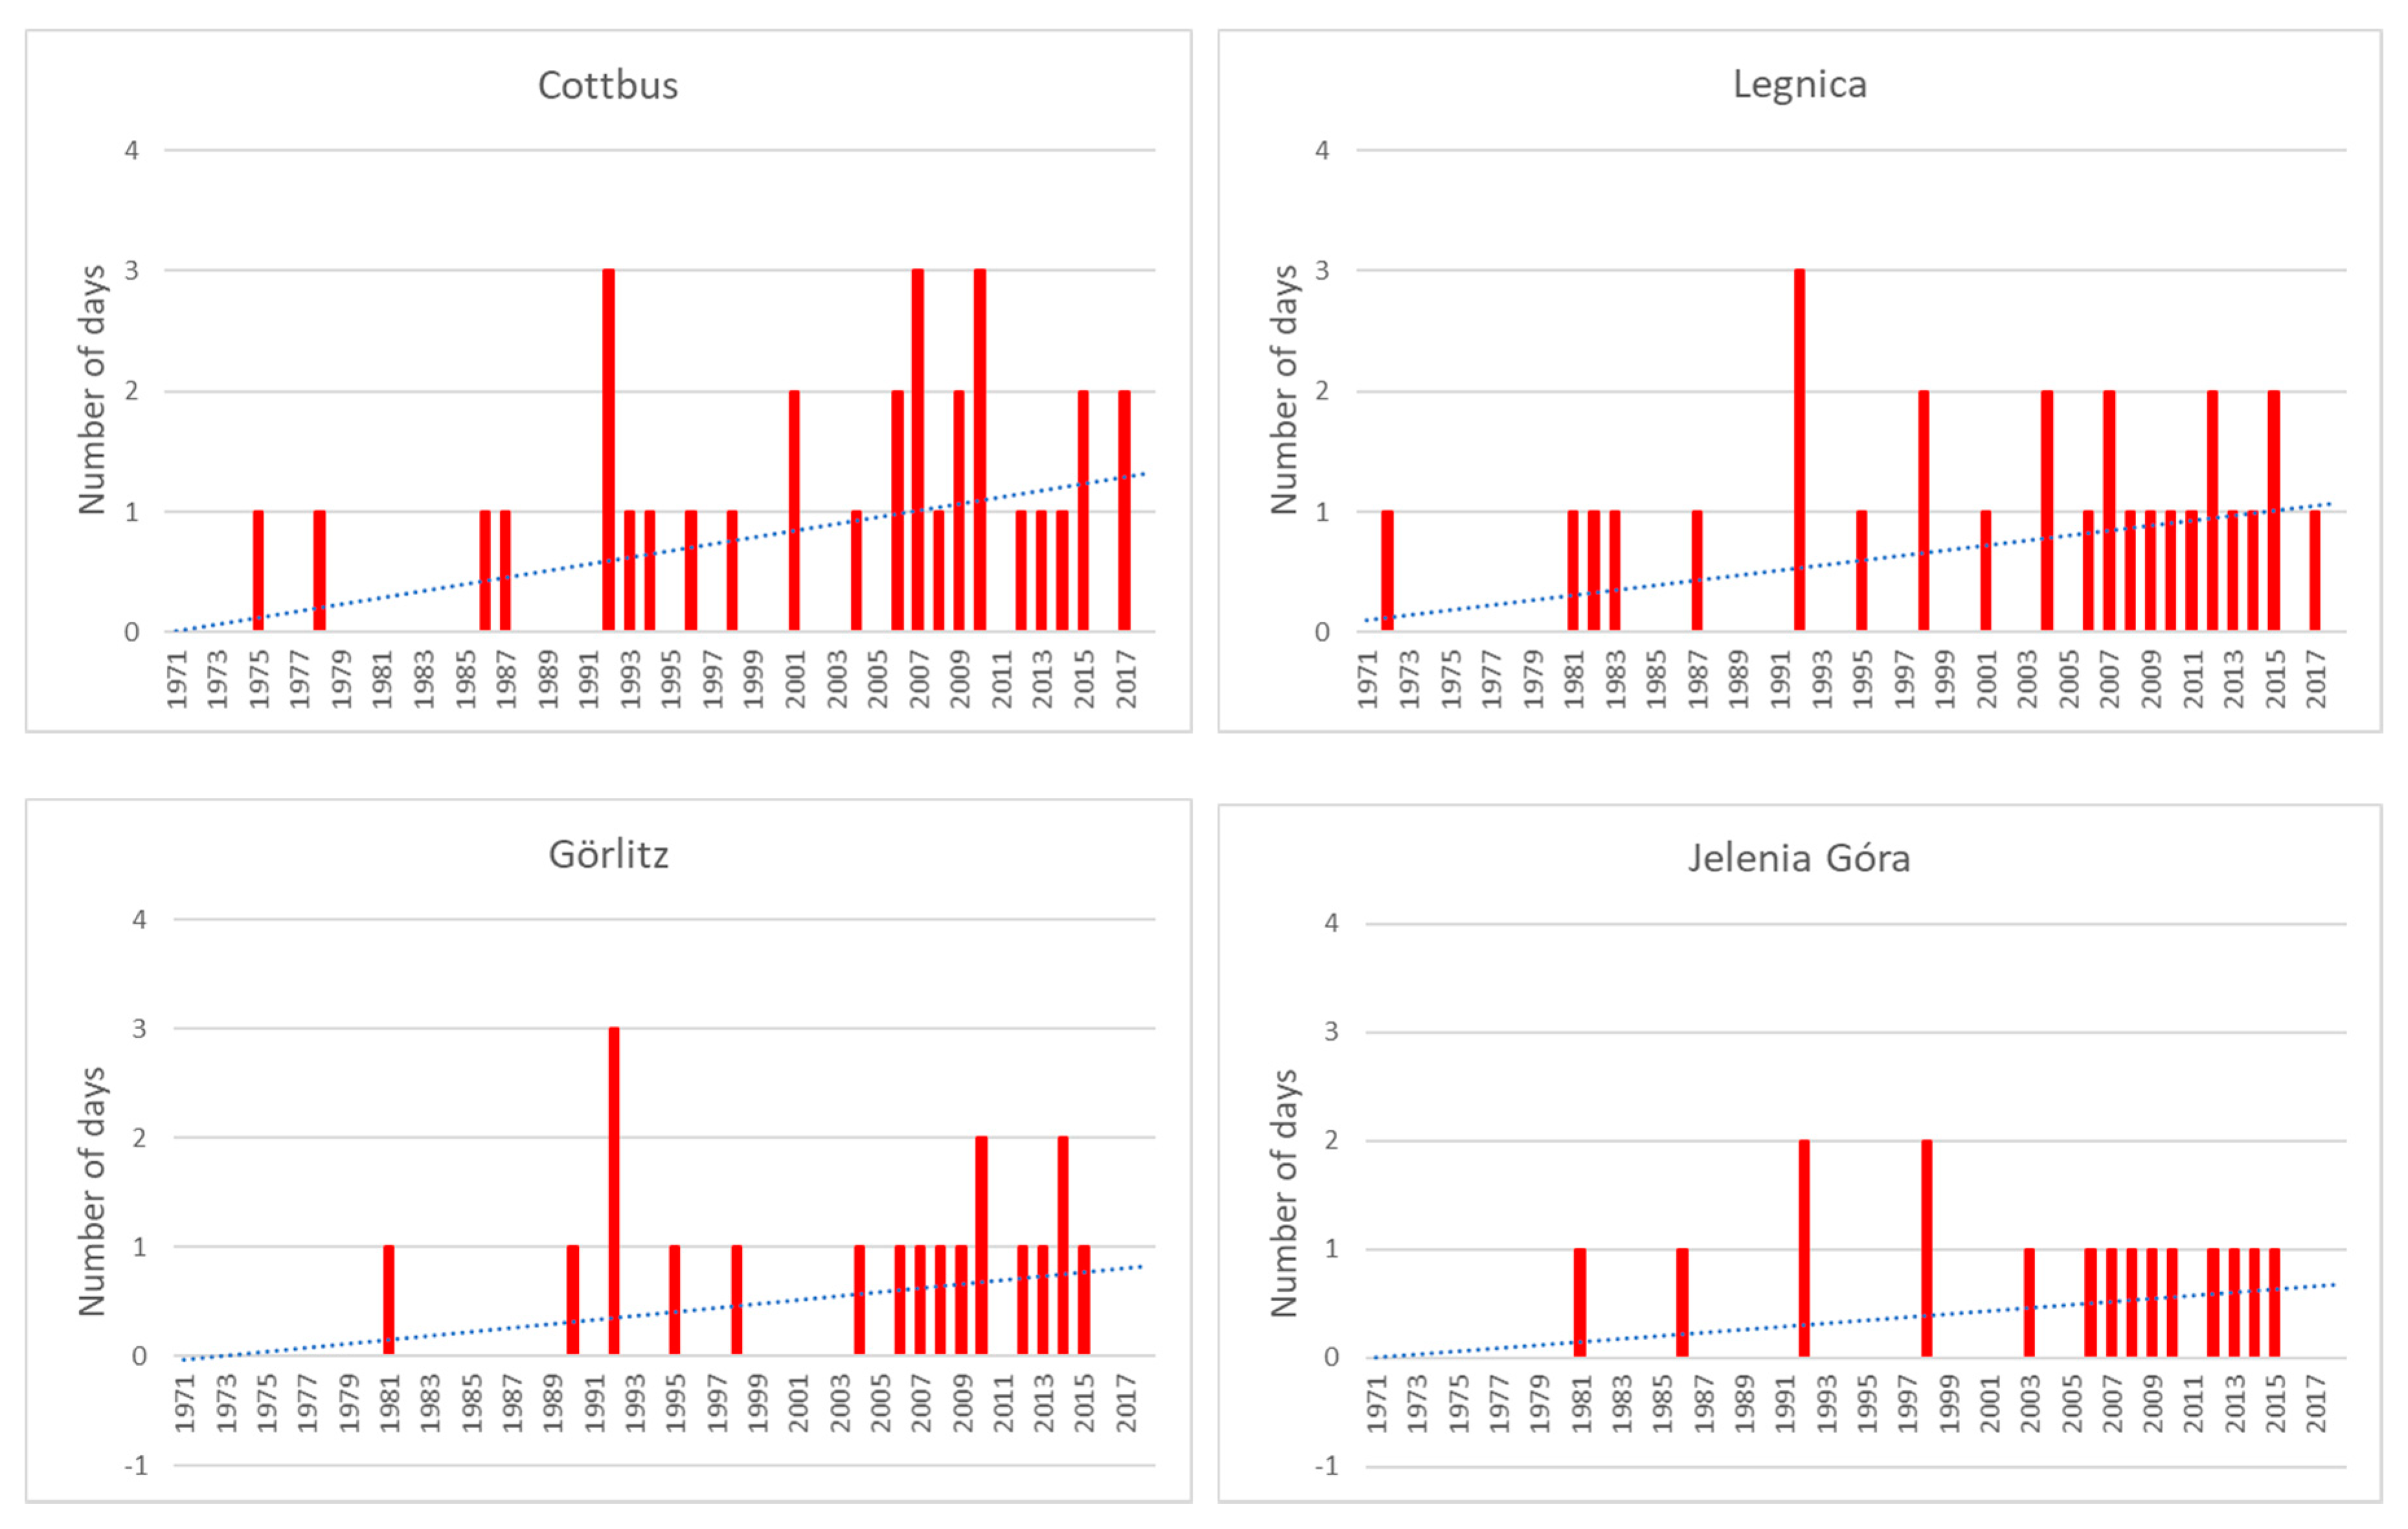
In cases of no-thermal-stress and heat-stress classes, an increasing tendency was observed for almost the entire region. The trend in the frequency of no thermal stress was statistically significant for four stations. It was characterized by a growth rate per decade varying from 2 days on Śnieżka Mountain, 3 days in Legnica and Jelenia Góra, and almost 6 days in Görlitz. In terms of heat stress, statistical significance was found for strong heat stress for the stations of Legnica, Görlitz, and Jelenia Góra. In 1971–2019, the frequency of this category increased by about 1 day per 11 years in Görlitz, 1 day per 13 years in Jelenia Góra, and 1 day per 14 days in Legnica. An increasing and statistically significant trend was also noticed for the category of very strong heat stress in Cottbus (Table 5 and Figure 4).
The results presented above were in most cases confirmed by the Mann–Kendall test. Some differences occurred in Legnica, where the test indicated statistical significance (at the level of 0.05) for the very strong cold stress category. On the other hand, a weaker level of significance was noticed for the class of strong heat stress (at the level of 0.1).
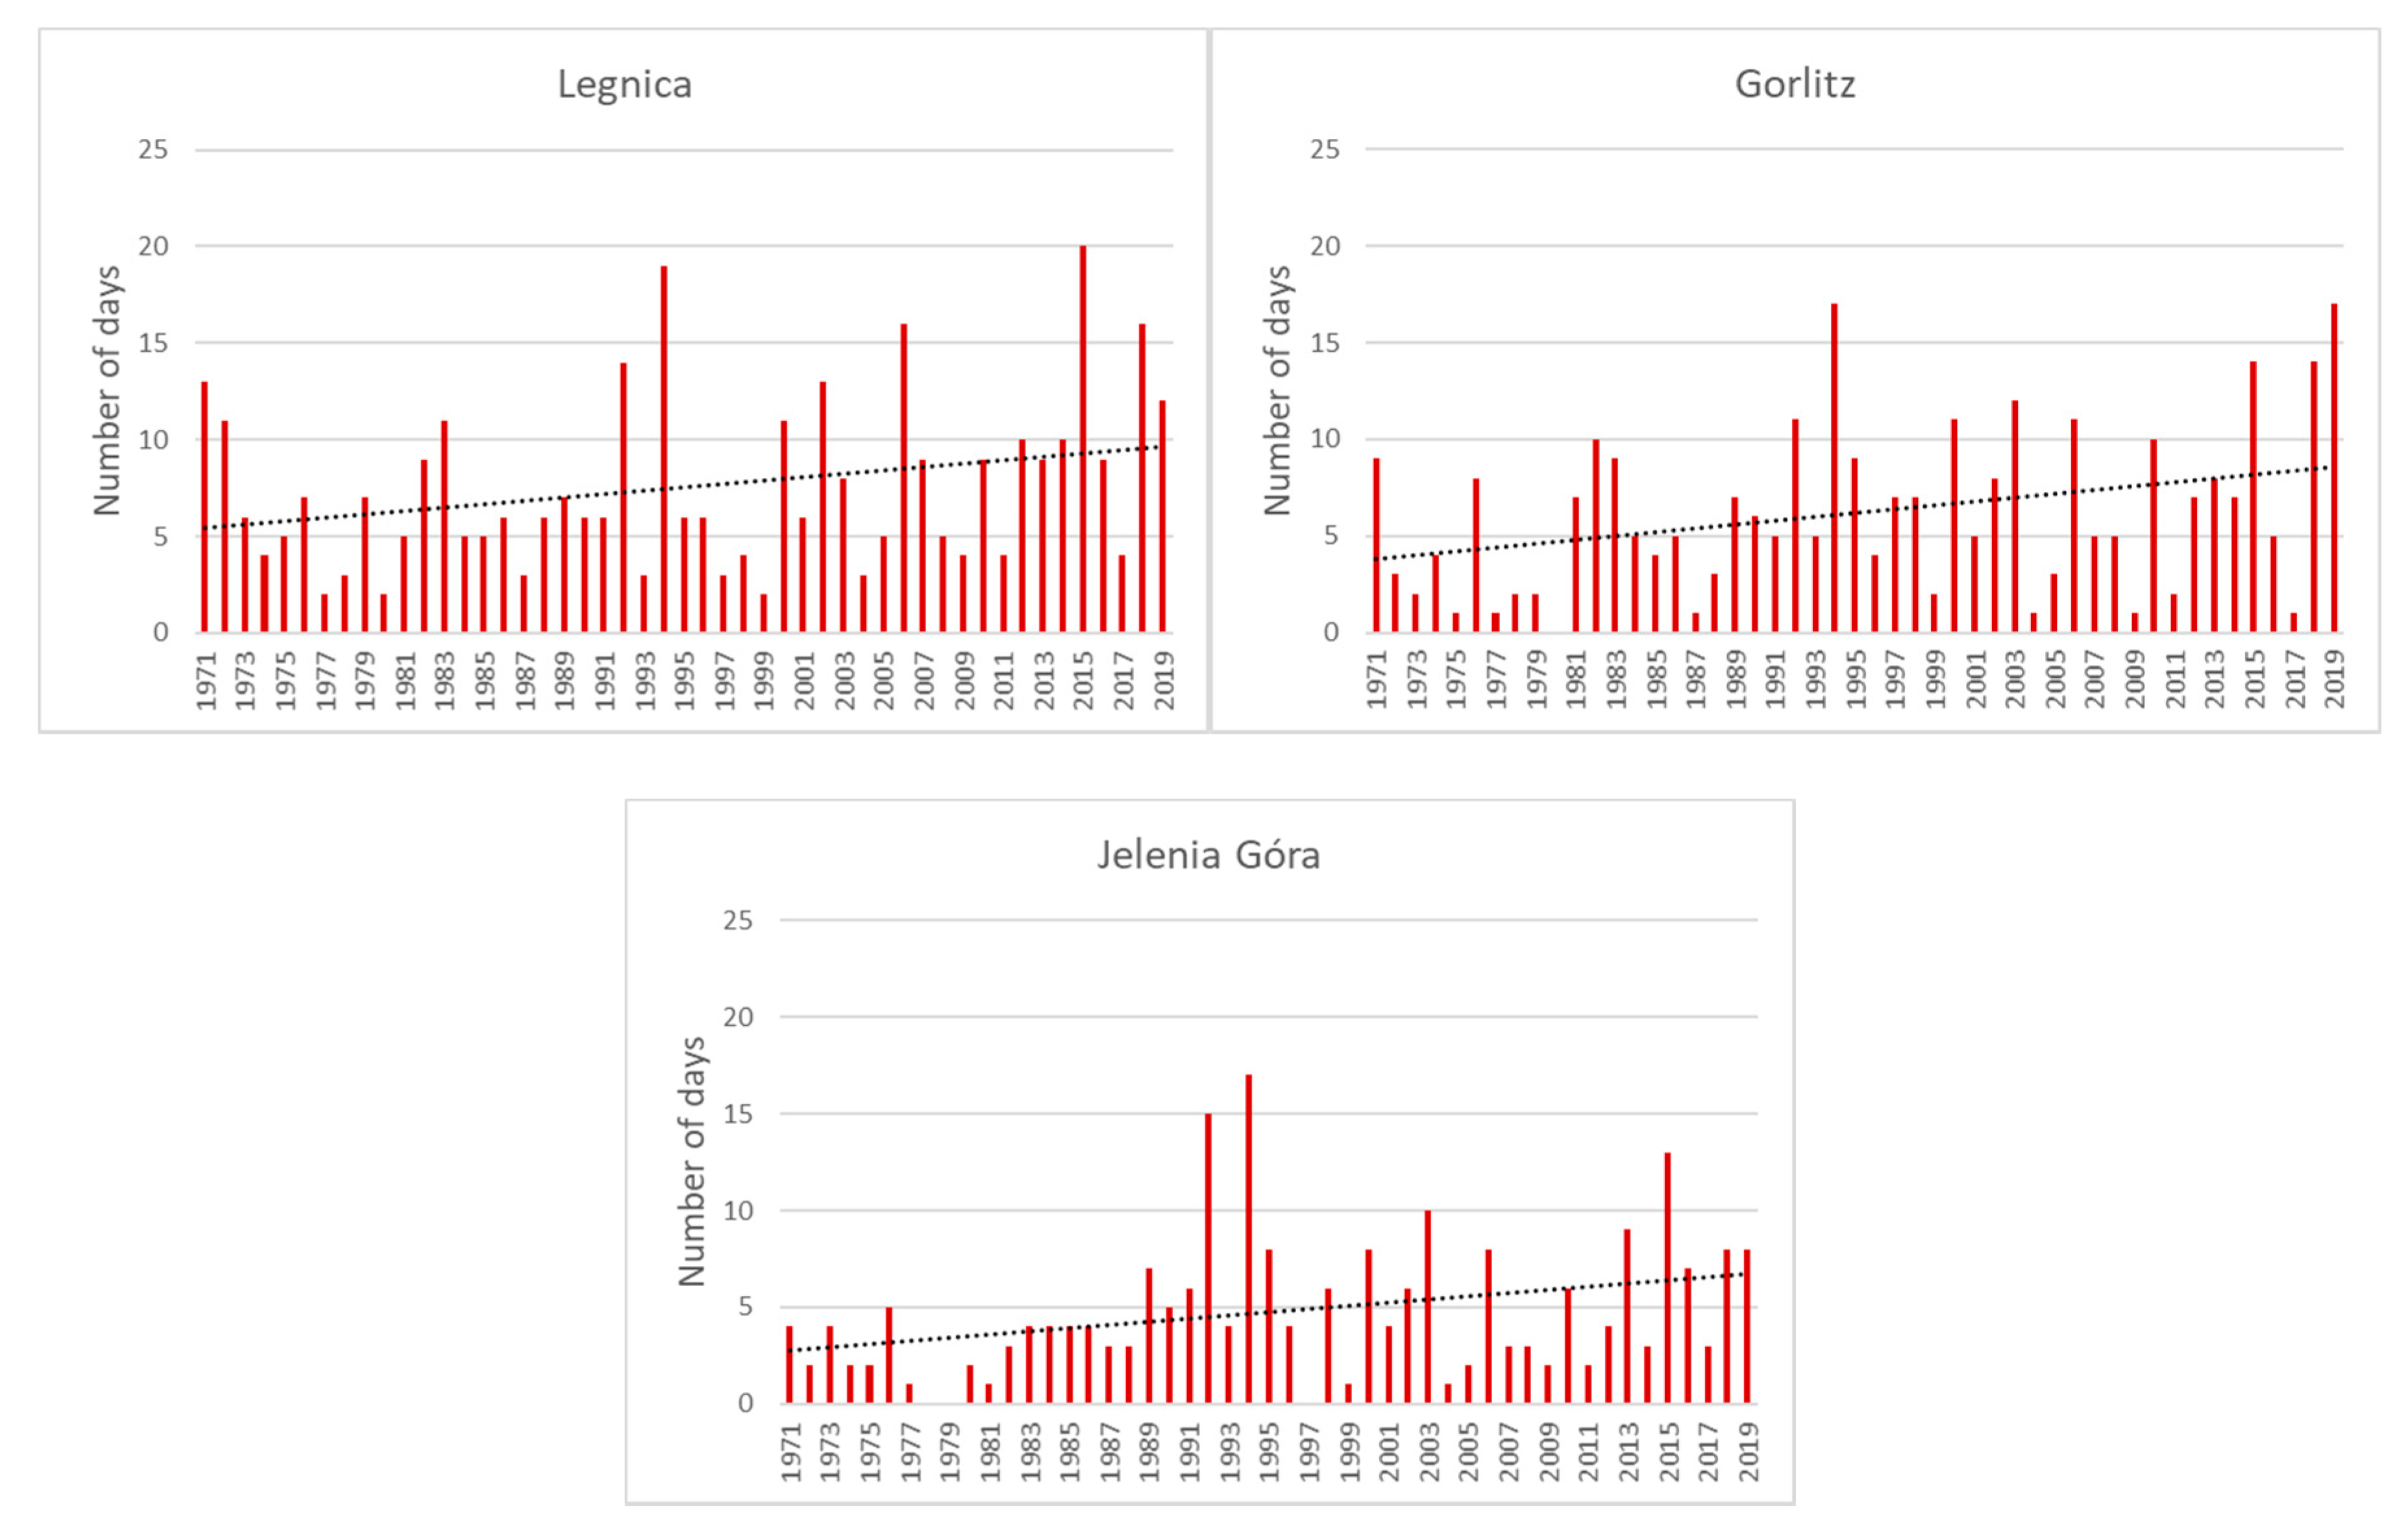
In the context of health issues, the most harmful heat stress occurs when the UTCI exceeds 32 °C, which corresponds to strong, very strong, and extreme heat stress categories. Taking into consideration the combined frequency of strong and very strong heat stress (no extreme heat stress was observed in the region), an increasing tendency was noticed for 1971–2019 for all the stations representing the lower hypsometric zones. Three of them (Legnica, Görlitz, and Jelenia Góra) were characterized by statistical significance (Figure 5). The most dynamic changes occurred in the mountain foreland (Görlitz) when the number of such days increased by almost 1 day per decade. In the case of the lowlands (Legnica) and the lower mountain zone (Jelenia Góra), the rate was about 1 day per 11 years. In terms of the Mann–Kendall test, the trend for Legnica was characterized by statistical significance at the level of 0.1.
Most of the strong and very strong heat cases were noticed during the heat waves of 1992, 1994, 2003, 2006, 2015, 2018, and 2019. During these periods, the frequency of such stress categories varied from 8–17 days in Jelenia Góra (mountain foreland) to 18–28 days in Cottbus (lowlands) (Table 6).

3.3. Circulation Conditions

Considering circulation conditions in the summer seasons (June–August) of 1971–2018, anticyclonic types were predominant. According to Ojrzyńska’s classification [68], anticyclonic southwest circulation (SW-A) occurred on 31% of the days, while the frequency of anticyclonic northeast (NE-A) and anticyclonic northwest (NW-A) circulation was 23% and 16%, respectively. The frequency of the anticyclonic southeast (SE-A) circulation reached 3%. Regarding cyclonic circulation, the southwest (SW-C) type was the most frequent (12%), whereas the northeast (NE-C), southeast (SE-C), and northwest (NW-C) circulation occurred on 5%, 4%, and 3% of the days, respectively. The remaining days were characterized by undetermined types of circulation (XX-A and XX-C).
In terms of the relationship between the frequency of particular types of circulation and the annual number of days with heat stress (heat days and days with UTCI corresponding to strong or very strong heat stress categories) in the summer seasons of 1971–2018, no significant correlation was usually noticed (Table 7). The strongest correlation was observed for the NE-A and SW-C circulation types for some of the stations located in the lowlands and the mountain foreland. In the case of NE-A, statistical significance was found for both heat days (Cottbus, Dresden, and Görlitz) and days with UTCI > 32 °C (Cottbus and Dresden). This shows that heat stress conditions can often accompany anticyclonic eastern circulation connected with advection of warm continental polar air masses. On the other hand, a negative correlation was observed for SW-C. In this case, all the stations were characterized by statistical significance for both indices, with the highest correlation in the mountain foreland (Dresden and Görlitz). The negative correlation results from the fact that heat stress conditions are often noticed under anticyclonic types of circulation, more rarely occurring during cyclonic weather. Statistical significance in the discussed region was also observed for NW-C (heat days) and SE-A (UTCI > 32 °C) in Legnica and XX-A (UTCI > 32 °C) in Dresden (Table 7).
Heat stress in the discussed period was the most frequent during SW-A and NE-A circulation (Table 8 and Table 9). More than 55% of heat days and days with UTCI > 32 °C were noticed under one of these two types of circulation. A relatively high frequency was also observed for other types of anticyclonic circulation: NW-A, SE-A, and XX-A. Heat stress occurred less frequently under the presence of cyclonic types of circulations. In this case, the southern circulation was responsible for most of the heat stress cases in the entire region. This concerned especially the SW-C type, which was related to 7–11% of heat days and 6–8% of days with the UTCI exceeding 32 °C. A little lower frequency was noticed for SE-C (4–8% and 4–6%, respectively). The remaining types of cyclonic circulation occurred more rarely. Heat stress under NE-C circulation was noticed during 1–4% of days, while NW-C and XX-C types were characterized by the lowest heat stress frequency.
One of the most characteristic features in terms of circulation conditions and heat stress occurrence in the region was a high frequency of heat days and days with UTCI > 32 °C in Jelenia Góra and Legnica during SW-A and SW-C circulation. For both considered indices, the percentage of such days was noticeably higher than for the other stations. This concerned especially the anticyclonic type. In this case, the frequency of heat days and days with UTCI > 32 °C was even more than 10% higher than for the German stations. Such a situation might have been caused by fohn winds, which are a significant factor affecting thermal conditions in the Sudetes Mountains and the regions located north of them. They are usually noticed during SW circulation when air masses are crossing the main ridge of the Sudetes Mountains (stretched NW to SE). The effect of fohn winds is mainly observed in the lower zones of the Sudetes Mountains but can also be noticeable in the lowlands of Lower Silesia [69].
The structure of heat stress occurrence is different when considering the percentage of days with heat stress among the total number of days with a given type of circulation (Table 10). In the summer seasons (June–August), the SE-A type was characterized by a very high frequency of days with heat stress, corresponding to 11–27% for heat days and 14–26% for days with UTCI > 32 °C. In both cases, the number of such days was the highest in the lowest hypsometric zones. A very high percentage of heat stress conditions was also observed for the XX-A type. In Cottbus, about 30% of the days with the XX-A type were characterized by a heat stress presence. Such weather conditions were usually related to a high-pressure system with its center located over the discussed area. Nevertheless, these types of circulation (SE-A and XX-A) occurred rarely in the discussed period. Consequently, despite a high percentage of days with heat stress, these two types of circulation were characterized by a relatively low frequency of heat stress in the summer seasons of 1971–2018 (Table 8 and Table 9).
Considering temporal variability of the number of heat days under selected types of circulation, the most significant changes were noticed for the southern circulation, especially SW-A and SW-C. All the stations were characterized by an increasing trend, while statistical significance was found for four of them: Cottbus, Legnica, Görlitz, and Jelenia Góra (Table 11 and Figure 6). The annual number of heat days rose the most intensively in the lowlands. A rate of increase for SW-A was equal to 1 day per 14 years in Cottbus and 1 day per decade in Legnica. In the case of the stations located in the mountain foreland (Görlitz) and lower mountain zone (Jelenia Góra), the heat days frequency increased by about 1 day per 20 years. A lower rate was noticed for Dresden, where the course of an annual number of heat days under SW-A circulation was nearly considered as statistically significant (at the level of 0.051). The trends were also statistically significant with a consideration of the Mann–Kendall test. In this case, the only exception was Görlitz, where the trend in the number of heat days under SW-A circulation was characterized by statistical significance at the level of 0.1.
The number of days with heat stress under the SW-A type at the stations mentioned above was characterized by a rising tendency despite the negative correlation (without statistical significance) between the frequency of days with SW-A and the number of heat days and days with UTCI > 32 °C in the summer seasons of 1971–2018. Such a situation was contributed by the fact that the frequency of days with SW-A rose much faster than for these two indices. The rate of increase in SW-A circulation was equal to 2 days per 7 years and was significantly higher than the rate of changes in the number of heat days and days with UTCI > 32 °C (during SW-A circulation and for the entire June–August period as well).
Days with SW-C in 1971–2018 occurred more rarely than SW-A. Therefore, less intensive changes were observed for this type of circulation. Similarly to SW-A, the stations located in the lowlands were characterized by the highest rates, varying from 1 day per 32 years in Cottbus to 1 day per 21 years in Legnica. In Görlitz and Jelenia Góra, the annual number of heat days in the whole 1971–2018 period under SW-C circulation increased by about 1 day. It should be emphasized that a high number of heat days during both SW-A and SW-C circulation types in the recent years was mainly observed in 2015 when it varied within 7–12 days for SW-A and 3–4 days for SW-C (Figure 7). Besides SW-A and SW-C types, increasing and statistically significant trends were also noticed for NE-A (Görlitz) and SE-C (Cottbus, Görlitz).
In terms of strong and very strong heat stress according to the UTCI, changes in 1971–2018 were less significant than for the index of heat days. The most intensive increase was observed for SW-A and SW-C circulation. However, statistical significance was noticed only for the latter type (Table 12). The rates of growth amounted to below/above 1 day for the entire multi-annual period. Comparable to the heat days, the highest increase was noticed in the lowlands. Cottbus was characterized by a growth rate almost twice as high as in Jelenia Góra. In 1971–2018, days with UTCI > 32 °C during SW-C circulation were often noticed in the past 15 years, while in the first two decades they mainly occurred in individual years (Figure 7). The trends in the frequency of days with strong and very strong heat stress for the other circulation types were usually not considered as statistically significant, except for slightly rising trends for SE-C in Cottbus and XX-C in Jelenia Góra.

3.4. Case Study of 18–28 July 2006 and 2–5 July 2015 Heat Waves

Significant cases of heat waves were recorded in the summer seasons of 2006 and 2015. To show how synoptic conditions affected thermal and biothermal conditions, courses of air temperature and UTCI were presented for 18–28 July 2006 and 2–5 July 2015.
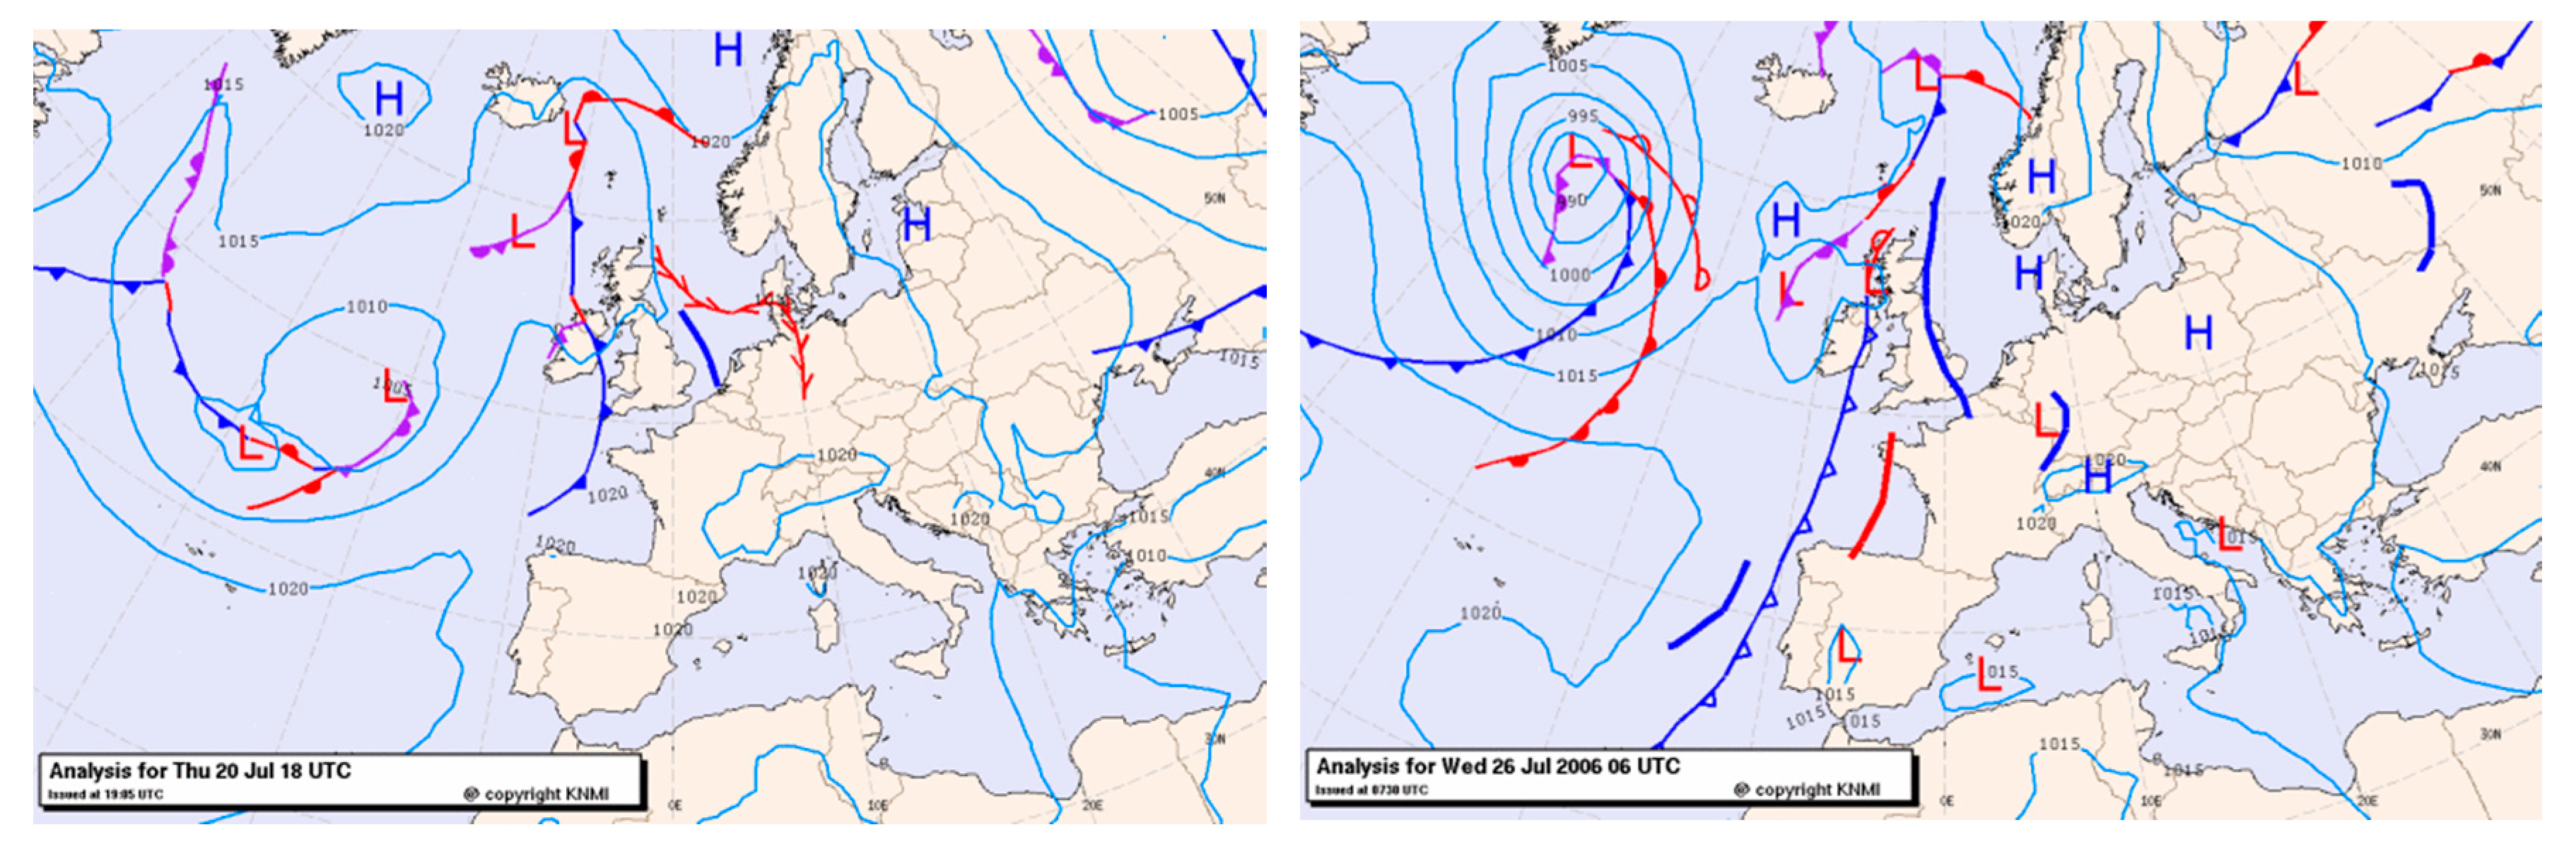
On 18–20 July 2006, the Polish–Saxon border region was under the influence of a vast high-pressure area that stretched from the Norwegian Sea to Central Europe and that was moving eastward (Figure 8). Advection of tropical air masses was observed in the discussed area. On the following days, the center of the high-pressure area moved east of Poland. Weather conditions were affected by the low-pressure area, with convergence zones moving over the region. On 25 July, a high-pressure system started to develop over Central Europe and subsequently was moving toward the Norwegian Sea. Tropical air masses were still observed over the region. After the discussed period, low-pressure areas with atmospheric fronts developed in West Europe. They caused advection of maritime polar air masses, which consequently ended the heat period.
In the upper zones of the troposphere, at the levels between 300 and 850 hPa, the region was within a high-pressure ridge that stretched from northwest Africa to Central Europe. Advection of tropical air masses toward West and Central Europe was observed at the western edge of the ridge. From 21 July, minor low-pressure troughs began to move eastward within the ridge. Subsequently, a stable high-pressure ridge developed on 27 July over West Europe and started to move eastward. The Polish–Saxon border region was under the influence of tropical air masses. In the case of isotherms at the 850 hPa isobaric level, air temperature on the first days of the heat wave episode was equal to 15–17 °C, while on 21 July it reached even 20 °C. In the final stage of the period, it dropped to 15 °C due to advection of cooler air masses. According to Ojrzyńska’s classification, SW-A was predominant on 20–24 July, while the NW-A, NE-A, and XX-A types were noticed on the other days.
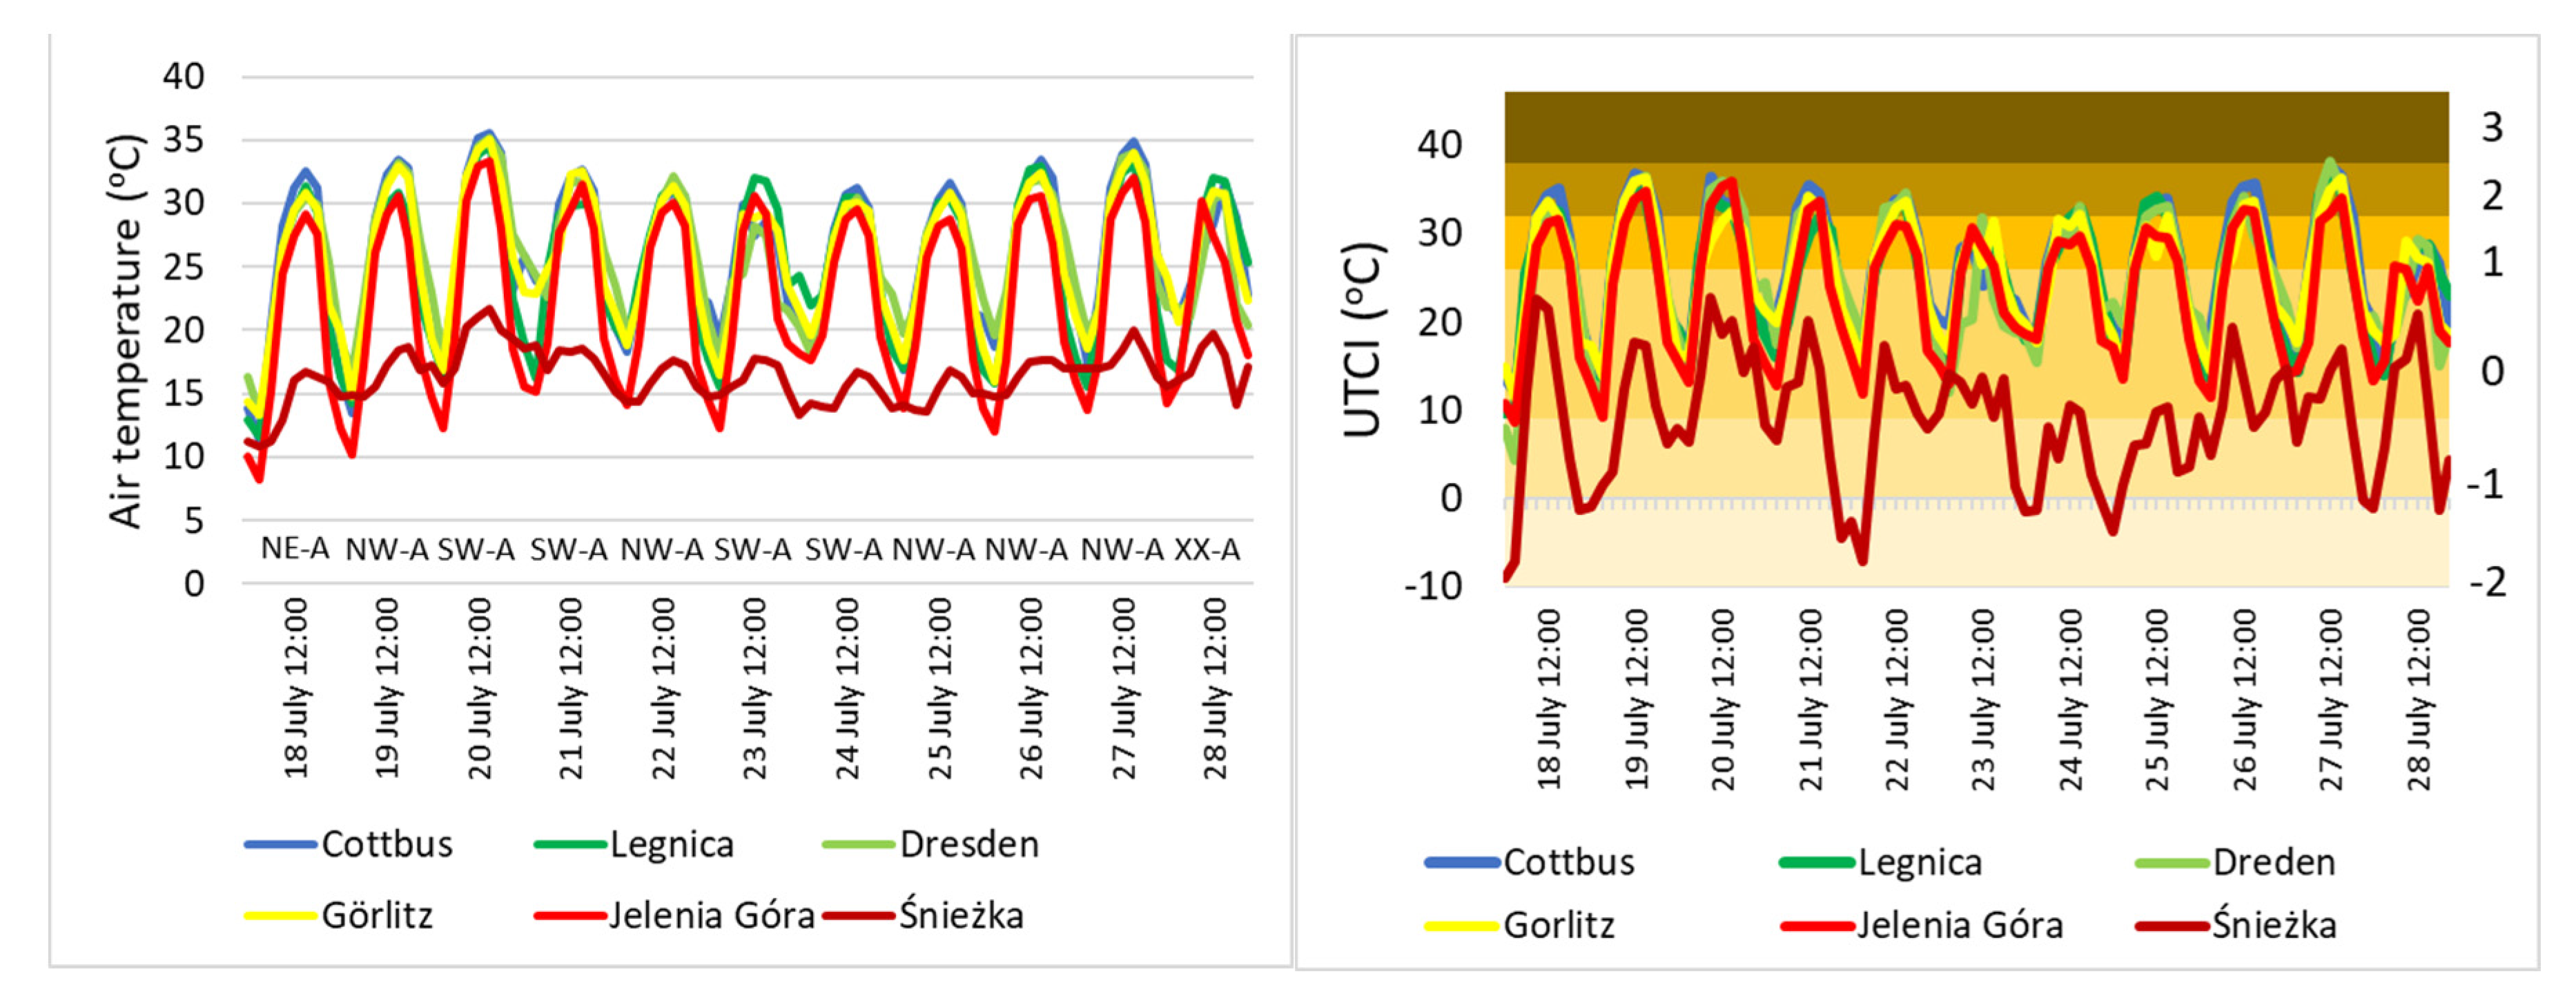
As a result of the synoptic situation on 18–28 July 2006, air temperature at the stations representing the lower hypsometric zones usually exceeded 30 °C, occasionally reaching beyond 35 °C (Figure 9). Significantly lower values, mainly below 20 °C during the daytime, were recorded on Śnieżka Mountain. The course of air temperature in the discussed period in the summit zone was typical for a convex terrain form and was characterized by low daily amplitudes.
Such thermal conditions contributed to the structure of thermal stress in terms of the UTCI. In lower hypsometric zones, the maximum UTCI values usually exceeded 32 °C, classifying biothermal conditions as strong heat stress. On 27 July, they even corresponded to very strong heat stress (UTCI > 38 °C) at some of the stations located lower down. The minimum UTCI, observed during the nighttime, was adequate for the no thermal stress category. On the summits, biothermal conditions were usually classified as no thermal stress during the daytime, while at night, they dropped below 9 °C (slight cold stress) or even 0 °C (moderate cold stress).
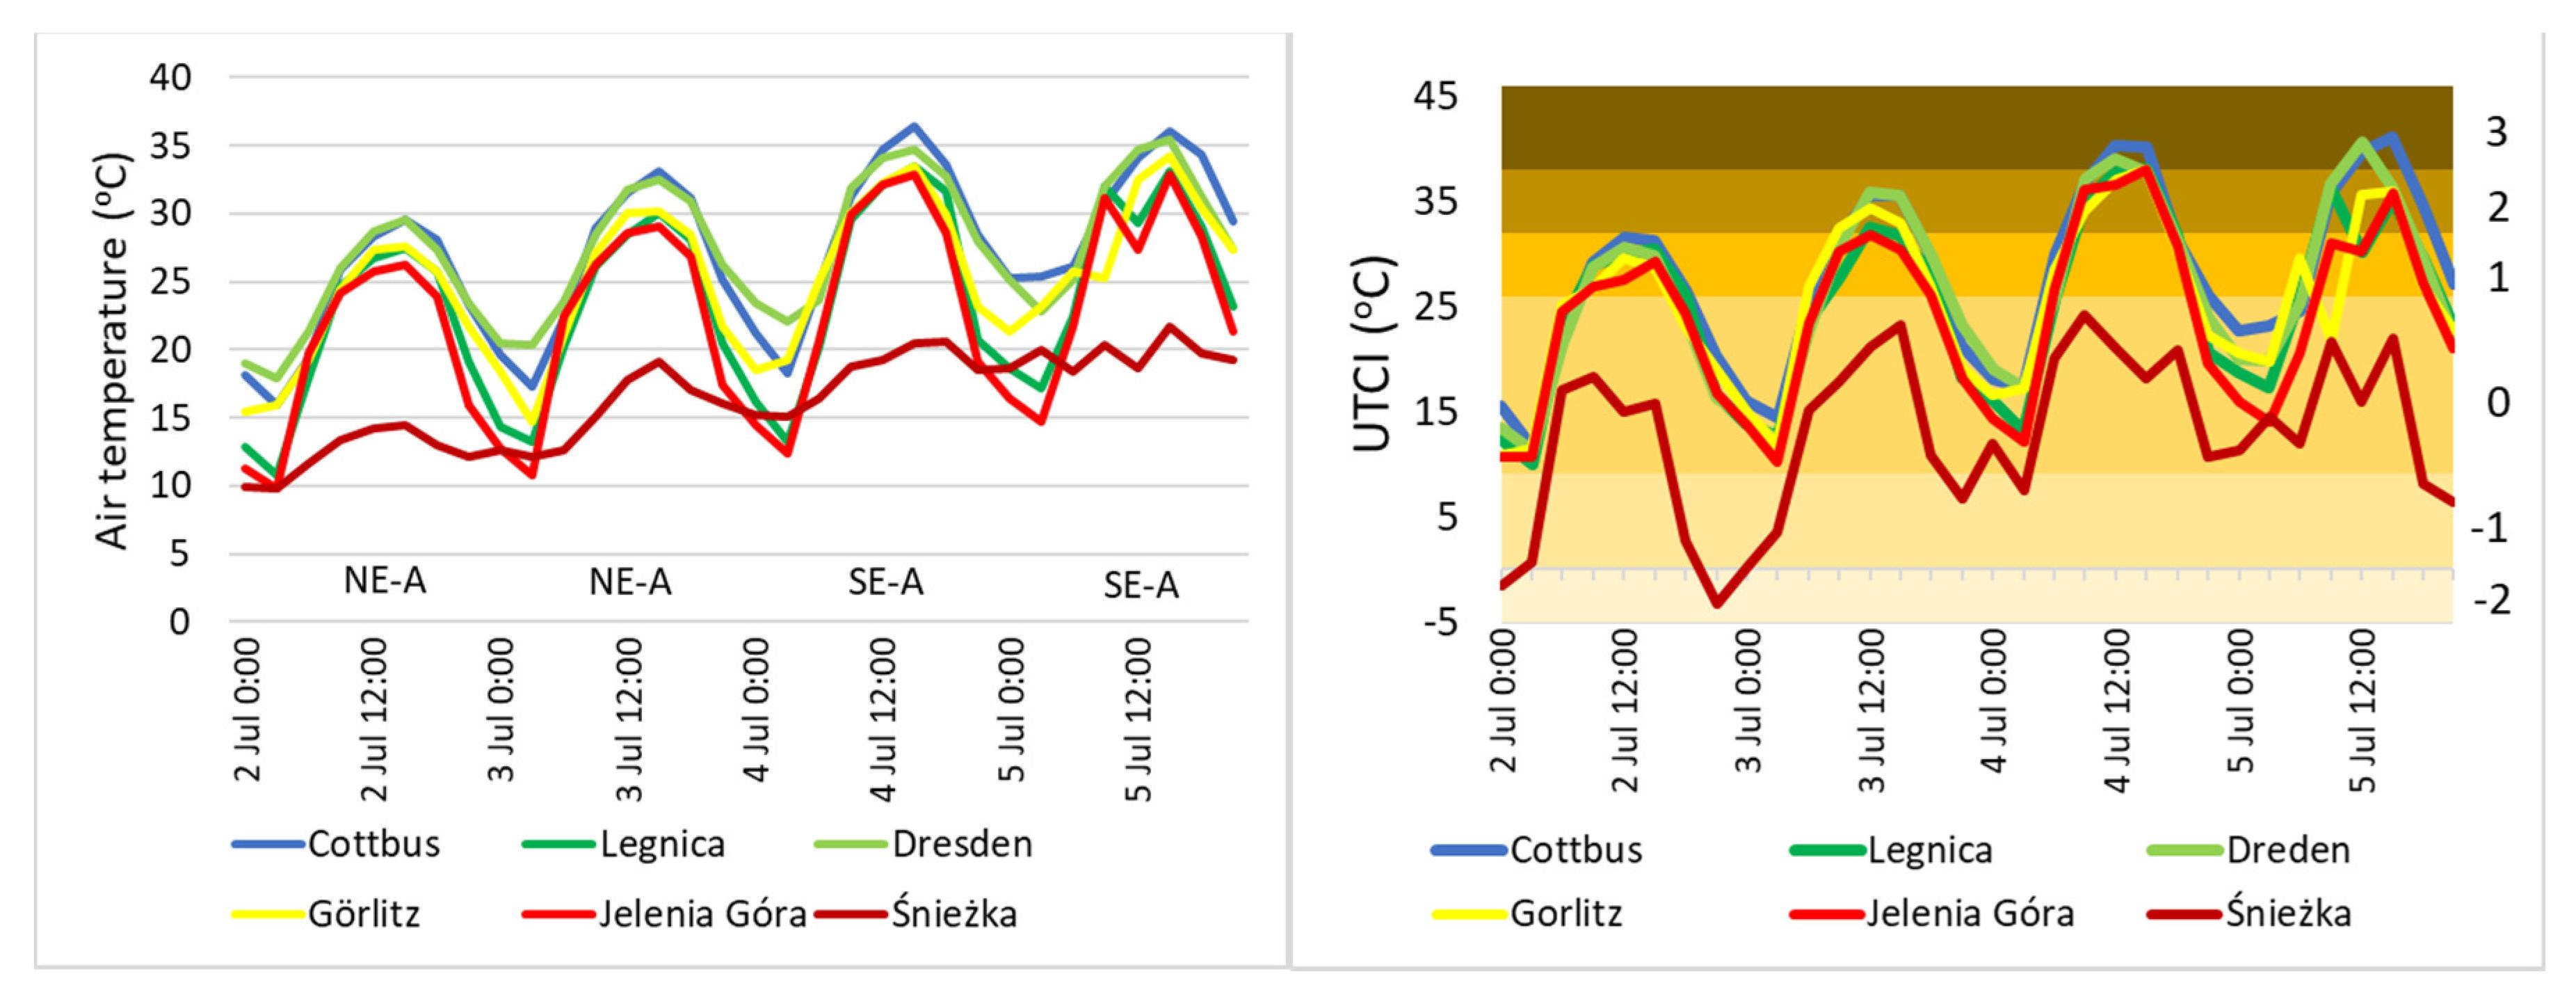
In the case of the heat wave of 2–5 July 2015, a high-pressure system developed over the south Baltic Sea at the beginning of this period. In the following days (till 4 July), it slowly moved toward Lithuania, Belarus, and Ukraine, gradually getting weaker (Figure 10). Such baric conditions contributed to the occurrence of dry and warm continental polar air masses in the Polish–Saxon region. Meanwhile, advection of tropical air masses, connected with a low-pressure trough from the Atlantic Ocean, was observed in West Europe. As the trough started to move eastward, the tropical masses advected over the Polish–Saxon border region on 4 July. Subsequently, a cold front related to the low-pressure system from Scandinavia caused advection of cold maritime polar air masses, which resulted in a decrease in air temperature values.
At the upper levels of the troposphere, including the baric surface of 300 hPa, the Polish–Saxon region was affected by a high-pressure ridge that covered the area from the western Mediterranean Sea to the Baltic region. Initially, on 2–3 July, a high-pressure system developed in the lower troposphere (up to 700 hPa level) whose range was similar to the high-pressure system for the sea-level baric field. On the following days, the high-pressure system at the 700 hPa level moved to the southeast. Because of advection of tropical air masses, high values of air temperature were observed at the level of 850 hPa—an isotherm of 20 °C was noticed on 4–5 July. In terms of the considered classification of the circulation, the types for the first days were classified as NE-A, while the final stage of the heat wave was related to SE-A circulation.
Air temperature in the lowlands and the mountain foreland was characterized by very high values, which exceeded as much as 35 °C on the two final days (Figure 11). Similar to the previously discussed period, the course of air temperature in Jelenia Góra was characterized by lower values for both daytime and nocturnal hours in comparison to the lowlands and the mountain foreland. In the case of Śnieżka Mountain, the air temperature was significantly lower and reached just beyond 20 °C during the daytime.
Considering biothermal conditions, heat stress in the lower hypsometric zones was more intensive than for the 2006 heat wave. The UTCI usually corresponded to the class of strong heat stress. The highest intensity of thermal stress was noticed on the last two days. At some of the stations, the UTCI exceeded 38 °C or even 40 °C, which was equivalent to the very strong heat stress category. Meanwhile, the UTCI on Śnieżka Mountain did not reach the boundary value for the heat stress class and corresponded to the no thermal stress class for these two days. Such a situation on the summits was caused by a relatively low air temperature and a wind speed higher than about 2 m/s compared to the lowland stations.

4. Discussion and Conclusions

The results of the study indicated that changes in the indices related to heat stress are a severe issue in the discussed area. The rising tendency of the thermal and biothermal indices shows that this problem can intensify in the following years. The research confirmed the tendency in the heat stress frequency carried out for the previous periods for the regions of Poland and Germany [3,5,8,9,12,70,71,72]. In most cases, the results were confirmed using the Mann–Kendall test and Sen’s method. Positive and statistically significant trends for annual heat day frequency in 1971–2019 were noticed for the lowlands, mountain foreland, and lower mountain zone. The highest increase was observed in the 21st century, which confirms the previous results carried out for Germany [12] and Poland [5,70,73,74]. The lowlands were characterized by the most dynamic changes, exceeding 2 days per decade, which was more than twice as high as in the selected regions of Germany [12] and Poland [73,74]. On the other hand, a rate of increase in the mountain foreland (Jelenia Góra) was lower than that for 1966–2006 in the foothills of the Tatra Mountains (Zakopane) [71]. On the summits, heat days did not occur at all, which makes this region similar to the highest parts of the Tatra Mountains [71].
In terms of the UTCI, a statistically significant rising trend was noticed for all the hypsometric zones, with the rate of increase reaching 0.4–0.8 °C per decade. Similar values were observed for some areas representing the Baltic Sea region, where the rates varied at 0.6–0.9 °C per decade [75]. In Budapest, Hungary, the mean annual UTCI in 1961–2010 rose at a rate of 0.4 °C per decade [47]. Such a tendency contributed to changes in the structure of UTCI categories. In 1971–2019, a decreasing trend was observed for most of the cold stress classes in favor of the rising number of days with thermoneutral conditions and heat stress. Weather situations with a UTCI higher than 32 °C, considered as harmful for people with cardiovascular diseases [4,43,55] and limiting urban tourism [76], occurred on 1–3% of the days in the lower hypsometric zones. A similar number of days was noticed in the lowlands of the western Lower Silesia [76], whereas in the Baltic Sea region, their annual frequency did not reach 1% [44,45]. Similar to the Polish–Saxon region, very strong heat stress in the Baltic Sea region and in the other provinces of Poland was noticed sporadically, while extreme heat stress did not occur at all [44,45,77,78]. Nevertheless, the UTCI can locally exceed the value of 46 °C in the urban areas of the region in weather with very high air temperature, low wind speed, and intensive radiation [79]. In terms of multi-annual changes in heat stress, the intensity of increase in the frequency of the strong heat stress category in the lowlands was similar to that observed for Warsaw in 1966–2015 [46]. Simultaneously, the rate was also lower than in the Baltic Sea region and in southeast Poland, where it reached 2 or more days per decade [44,45,46]. Increasing trends for heat stress were also noticed in the southern part of Germany, where the frequency of days with a UTCI higher than 32 °C increased by about 50% [57]. A rising tendency of heat stress categories was also observed in some regions of Romania [80,81]. In the case of the mountains of the Polish–Saxon border area, the research confirmed that strong or very strong heat stress categories appear only in the lower hypsometric zones, while the summits are free from their occurrence [61,78].
Atmospheric circulation plays a very significant role in the context of heat stress. Analysis of heat days and days with UTCI > 32 °C showed that they occur most frequently during anticyclonic circulation, in particular under NE-A and SW-A types, according to Ojrzyńska’s classification. The first type is mainly related to advection of continental polar air masses from the east. In this case, heat stress occurrence is associated with a high-pressure system, located over the Norwegian Sea, Scandinavia, or the Baltic Sea, that generates advection of dry and warm air masses [44,45,46,82,83]. The second type concerns advection of tropical air masses from the south and is related to a high-pressure area located in eastern or southeastern Europe [43,44,45,46,82,83]. Predominance of the SW circulation type in the context of days with the UTCI exceeding 32 °C was also confirmed for the entire region of Germany [57]. The SE-A and XX-A types were characterized by the highest percentage of days with heat stress in the summer. In the case of SE-A, weather conditions with UTCI > 32 °C can occur on 14–25% of days; however, their percentage in the total number of days with heat stress conditions is relatively low. A similar situation was observed in Germany, where the total frequency of days with UTCI > 32 °C for SW circulation was higher than for SE circulation in spite of the very high percentage of such days noticed for the SE type [57].
The heat waves of 2006 and 2015, as presented above, were examples that heat stress in the discussed area can be influenced by different circulation types. The case of 2006 was partly related to SW-A circulation, while the episode of 2–5 July 2015 was initially caused by NE-A type. In both cases, high air temperature contributed to the increase in the UTCI, which in the lowlands and mountain foreland can exceed 32 °C (strong heat stress), 38 °C (very strong heat stress), or even 40 °C. Such values are typical for the most extreme thermal periods noticed in the lowlands of Lower Silesia [32,77], the lower zones of the Sudetes Mountains [56], and the lower regions of Czechia [51]. The heat wave of 2–5 July 2015 also showed that the extremity of thermal and biothermal conditions in the lower hypsometric zones was comparable to the heat wave in August 2015 [23,24,25,26,27,28,32,78]. During both heat waves, none of the heat stress categories was noticed on the summits. This confirms the results of the previous studies that the highest mountain zones of the Sudetes Mountains are free from heat stress occurrence, even during the most extreme heat waves [28,32,78]. In the case of synoptic conditions during the heat wave episodes of 2006 and 2015, the main factor contributing to their occurrence were high-pressure systems located north or east from Poland. Such conditions were also confirmed in the studies concerning heat waves in Central Europe [5,9,12,43,44,45,46]. Similar to the heat waves discussed in the study, a high-pressure system located over the Baltic Sea and Eastern Europe contributed to extreme thermal conditions during the heat waves in July/August 1994 and August 2015 [9]. Considering baric conditions in the higher atmospheric levels in July 2006 and 2015, the isolines at the 500 hPa level were bent northward, which was also noticed during the heat waves of 1994, 2003, and August 2015 in Poland [9] and Germany [12]. Such a situation was related to the occurrence of warm air masses over the discussed region. In the case of the 850 hPa isobaric level, the isotherm of 20 °C was observed on some days during the 2006 and 2015 heat waves, while the mean multi-annual value for the summer seasons of 1966–2015 in this region varied at 8–10 °C [12].
Increasing trends in heat stress frequency, especially for SW-A and SW-C circulation, indicate that the frequency of heat stress during the southern circulation can additionally arise in the future. The analysis concerning projections of the UTCI simulates a further increase in the index in the following decades [57,84], including the Polish–Saxon border area [61]. Such a tendency can contribute to worsening weather conditions in the lower hypsometric zones in the context of the impact of thermal stress on the inhabitants (especially the elderly) as well as on tourists and bathers visiting the region. Therefore, it is necessary to undertake additional actions focused on the evaluation of the relationship between heat stress and atmospheric circulation aspects. The results presented in the paper can be taken into consideration in further research on the heat stress problem in the region of Central Europe.

Funding

This research received no external funding.

Institutional Review Board Statement

Not applicable.

Informed Consent Statement

Not applicable.

Data Availability Statement

The data presented in this study are available on request from the corresponding author. The data are not publicly available due to internal company regulations.

Conflicts of Interest

The authors declare no conflict of interest.

References

  1. WMO. The Global Climate 2015–2019. World Meteorological Organization. 2019. Available online: https://library.wmo.int/ (accessed on 19 November 2020).
  2. IPCC. Climate Change and Land. An IPCC Special Report on Climate Change, Desertification, Land Degradation, Sustainable Land Management, Food Security, and Greenhouse Gas Fluxes in Terrestrial Ecosystems. International Panel on Climate Change. 2019. Available online: https://www.ipcc.ch/srccl/ (accessed on 19 November 2020).
  3. Twardosz, R.; Kossowska-Cezak, U. Exceptionally hot summers in Central and Eastern Europe (1951–2010). Theor. Appl. Climatol. 2013, 112, 617–628. [Google Scholar] [CrossRef] [Green Version]
  4. Di Napoli, C.; Pappenberger, F.; Cloke, H.L. Assessing heat-related health risk in Europe via the Universal Thermal Climate Index (UTCI). Int. J. Biometeorol. 2018, 62, 1155–1165. [Google Scholar] [CrossRef] [PubMed] [Green Version]
  5. Tomczyk, A.M.; Bednorz, E. Heat waves in Central Europe and tropospheric anomalies of temperature and geopotential heights. Int. J. Climatol. 2019, 39, 4189–4205. [Google Scholar] [CrossRef]
  6. Russo, S.; Sillmann, J.; Fischer, E.M. Top ten European heat waves since 1950 and their occurrence in the coming decades. Environ. Res. Lett. 2015, 10, 124003. [Google Scholar] [CrossRef]
  7. Stefanon, M.; D’Andrea, F.; Drobinski, F. Heat wave classification over Europe and the Mediterranean region. Environ. Res. Lett. 2012, 7, 014023. [Google Scholar] [CrossRef]
  8. Wibig, J. Heat waves in Poland in the period 1951–2015: Trends, patterns and driving factors. Meteorol. Hydrol. Water Manag. 2018, 6, 37–45. [Google Scholar] [CrossRef]
  9. Tomczyk, A.M.; Bednorz, E.; Półrolniczak, M.; Kolendowicz, L. Strong heat and cold waves in Poland in relation with the large-scale atmospheric circulation. Theor. Appl. Climatol. 2018, 137, 1909–1923. [Google Scholar] [CrossRef] [Green Version]
  10. Della-Marta, P.M.; Beniston, M. Summer Heat Waves in Western Europe, Their Past Change and Future Projections. In Climate Variability and Extremes during the Past 100 Years; Brönnimann, S., Luterbacher, J., Ewen, T., Diaz, H.F., Eds.; Springer: Dordrecht, The Netherlands, 2008; Volume 33, pp. 235–250. [Google Scholar]
  11. Dankers, R.; Hiederer, R. Extreme Temperatures and Precipitation in Europe: Analysis of a High-Resolution Climate Change Scenario; Office for Official Publications of the European Communities: Luxembourg, 2008; p. 66. [Google Scholar]
  12. Tomczyk, A.M.; Sulikowska, A. Heat waves in lowland Germany and their circulation-related conditions. Meteorol. Atmos. Phys. 2017, 130, 1–17. [Google Scholar] [CrossRef]
  13. Zacharias, S.; Koppe, C.; Mücke, H.-G. Climate Change Effects on Heat Waves and Future Heat Wave-Associated IHD Mortality in Germany. Climate 2015, 3, 100–117. [Google Scholar] [CrossRef] [Green Version]
  14. Black, E.; Blackburn, M.; Harrison, G.; Hoskins, B.; Methven, J. Factors contributing to the summer 2003 European heat wave. Weather 2004, 59, 217–223. [Google Scholar] [CrossRef]
  15. Garcia-Herrera, R.; Diaz, J.; Trigo, R.M.; Luterbacher, J.; Fischer, E.M. A review of the European summer heat wave of 2003. Crit. Rev. Environ. Sci. Technol. 2010, 40, 267–300. [Google Scholar] [CrossRef]
  16. Poumadere, M.; Mays, C.; Blong, R.J.; Le Mer, S. The 2003 Heat Wave in France: Dangerous Climate Change Here and Now. Risk Anal. 2006, 25, 1483–1494. [Google Scholar] [CrossRef] [PubMed]
  17. De Bono, A.; Giuliani, G.; Kluser, S.; Peduzzi, P. Impacts of Summer 2003 Heat Wave in Europe. Environment Alert Bulletin, UNEP. 2004. Available online: https://www.unisdr.org (accessed on 19 November 2020).
  18. Rebetez, M.; Dupond, O.; Gailard, M.G. An analysis of the July 2006 heat wave extent in Europe compared to the record year of 2003. Theor. Appl. Climatol. 2009, 95, 1–7. [Google Scholar] [CrossRef] [Green Version]
  19. Chiriaco, M.; Bastin, S.; Yiou, P.; Haeffelin, M.; Dupont, J.-C.; Stéfanon, M. European heat wave in July 2006: Observations and modeling showing how local processes amplify conducive large-scale conditions. Geophys. Res. Lett. 2014, 41, 5644–5652. [Google Scholar] [CrossRef] [Green Version]
  20. Morignat, E.; Perrin, J.-B.; Gay, E.; Vinard, J.-L. Assessment of the Impact of the 2003 and 2006 Heat Waves on Cattle Mortality in France. PLoS ONE 2014, 9, 1–8. [Google Scholar] [CrossRef]
  21. Overcenco, A.V.; Potopová, V. Summer Heat Episodes in Central and Eastern Europe: Czech Republic and Republic of Moldova case. Conference: Bioklima 2010. 2010. Available online: https://www.researchgate.net/publication/236005181 (accessed on 11 December 2020).
  22. Potopová, V.; Türkott, L. Poisson Modelling of the Heat Waves and Tropical Days in the Czech Republic. 2009. Available online: https://www.researchgate.net/profile/Vera_Potopova/publication (accessed on 11 December 2020).
  23. Sulikowska, A.; Wypych, A.; Woszczek, I. Fale upałów latem 2015 roku i ich uwarunkowania cyrkulacyjne (The 2015 summer heat waves in Poland and their synoptic background). Badania Fizjograficzne VII Seria A Geografia Fizyczna 2016, 67, 205–223. [Google Scholar]
  24. Hoy, A.; Hänsel, S.; Skalak, P.; Ustrnul, Z.; Bochnicek, O. The extreme European summer of 2015 in a long-term perspective. Int. J. Climatol. 2017, 37, 943–962. [Google Scholar] [CrossRef]
  25. Muthers, S.; Laschewski, G.; Matzarakis, A. The summers 2003 and 2015 in South-West Germany: Heat waves and heat-related mortality in the context of climate change. Atmosphere 2017, 8, 224. Available online: https://www.mdpi.com/2073-4433/8/11/224 (accessed on 20 November 2020). [CrossRef] [Green Version]
  26. Urban, A.; Hanzlikova, H.; Kysely, J.; Plavcova, E. Impacts of the 2015 Heat Waves on Mortality in the Czech Republic—A Comparison with Previous Heat Waves. Int. J. Environ. Res. Public Health 2017, 14, 1562. Available online: https://www.mdpi.com/1660-4601/14/12/1562 (accessed on 20 November 2020). [CrossRef] [Green Version]
  27. Dong, B.; Sutton, R.; Shaffrey, L.; Wilcox, L. The 2015 European Heat Wave, in Explaining Extremes of 2015 from a Climate Perspective. Bull. Am. Meteorol. Soc. 2016, 97, 57–62. [Google Scholar] [CrossRef]
  28. Krzyżewska, A.; Wereski, S.; Demczuk, P. Biometeorological conditions during an extreme heat wave event in Poland in August 2015. Weather 2019. [Google Scholar] [CrossRef]
  29. Kornhuber, K.; Ospray, S.; Coumou, D.; Petri, S.; Petoukhov, V.; Rahmstorf, S.; Gray, L. Extreme weather events in early summer 2018 connected by a recurrent hemispheric wave-7 pattern. Environ. Res. Lett. 2019, 14, 054002. [Google Scholar] [CrossRef]
  30. Rösner, B.; Imme, B.; van Heerwaarden, C.C.; Weerts, A.; Hazeleger, W.; Bissoli, P.; Trachte, K. The long heat wave and drought in Europe in 2018. In: State of the Climate in 2018. Bull. Am. Meteorol. Soc. 2019, 100, 222–223. [Google Scholar]
  31. Tomczyk, A.M.; Bednorz, E. The extreme year-analysis of thermal conditions in Poland in 2018. Theor. Appl. Climatol. 2020, 139, 251–260. [Google Scholar] [CrossRef] [Green Version]
  32. Miszuk, B. Intensity of heat stress in 2015 and 2018 summer seasons in the region of the Lower Silesia (Poland). Misc. Geogr. 2020, 24, 3. Available online: https://content.sciendo.com (accessed on 20 November 2020).
  33. Xu, P.; Wang, L.; Liu, Y.; Chen, W.; Huang, P. The record-breaking heat wave of June 2019 in Central Europe. Atmos. Sci. Lett. 2020, 21, 1–7. [Google Scholar] [CrossRef] [Green Version]
  34. Zhao, W.; Zhao, N.; Chen, S. The Record-Breaking High Temperature over Europe in June of 2019. Atmosphere 2020, 11, 524. [Google Scholar] [CrossRef]
  35. Twardosz, R.; Wałach, P. Niezwykle ciepła pogoda w czerwcu 2019 roku w Polsce i jej przyczyny cyrkulacyjne (Unusually hot June 2019 in Poland and its circulation related causes). Przegl. Geofiz. 2020. Available online: http://ptgeof.imgw.pl/?strona=5,19 (accessed on 23 November 2020).
  36. Ragettli, M.S.; Schindler, C.; Röösli, M. Excess mortality during the warm summer of 2015 in Switzerland. Swiss. Med. Wkly. 2017, 146, 14379. [Google Scholar]
  37. Zaninović, K.; Matzarakis, A. Impact of heat waves on mortality in Croatia. Int. J. Biometeorol. 2014, 58, 1135–1145. [Google Scholar] [CrossRef]
  38. Gabriel, K.; Endlicher, W. Urban and rural mortality rates during heat waves in Berlin and Brandenburg, Germany. Environ. Pollut. 2011, 159, 2044–2050. [Google Scholar] [CrossRef]
  39. Robine, J.M.; Cheung, S.L.; Le Roy, S.; Van Oyen, H.; Griffiths, C.E.; Michel, J.-P.; Herrmann, F.R. Death toll exceeded 70,000 in Europe during the summer of 2003. Comptes Rendus Biol. 2008, 331, 171–178. [Google Scholar] [CrossRef] [PubMed]
  40. Vyberci, D.; Svec, M.; Fasko, P.; Savinova, H.; Trizna, M.; Micietova, E. The effects of the 1996–2012 summer heat events on human mortality in Slovakia. Morav. Geogr. Rep. 2015, 23, 58–70. [Google Scholar]
  41. Graczyk, D.; Kundzewicz, Z.W.; Choryński, A.; Førland, E.J.; Pińskwar, I.; Szwed, M. Heat-related mortality during hot summers in Polish cities. Theor. Appl. Climatol. 2019, 136, 1259–1273. [Google Scholar] [CrossRef] [Green Version]
  42. Martinez-Austria, P.; Bandala, E.R. Heat Waves: Health Effects, Observed Trends and Climate Change. In Extreme Weather; Sallis, J., Ed.; Books on Demand: Norderstedt, Germany, 2018; pp. 107–123. [Google Scholar]
  43. Plavcová, E.; Kyselý, J. Overly persistent circulation in climate models contributes to overestimated frequency and duration of heat waves and cold spells. Clim. Dyn. 2016, 46, 2805–2820. [Google Scholar] [CrossRef]
  44. Półrolniczak, M.; Szyga, K.; Koelndowicz, L. Bioclimate of the chosen cities in the Polish Baltic Coast based on Universal Thermal Climate Index. Acta Geogr. Lodz. 2016, 104, 147–161. [Google Scholar]
  45. Kolendowicz, L.; Połrolniczak, M.; Szyga-Pluta, K.; Bednorz, E. Human-biometeorological conditions in the southern Baltic coast based on the universal thermal climate index (UTCI). Theor. Appl. Climatol. 2018, 134, 363–379. [Google Scholar] [CrossRef] [Green Version]
  46. Tomczyk, A.M.; Owczarek, M. Occurrence of strong and very strong heat stress in Poland and its circulation conditions. Theor. Appl. Climatol. 2020, 139, 893–905. [Google Scholar] [CrossRef] [Green Version]
  47. Nemeth, A. Changing thermal bioclimate in some Hungarian cities. Acta Climatol. Chorol. Univ. Szeged. 2011, 44–45, 93–101. [Google Scholar]
  48. Bleta, A.; Nastos, P.T.; Matzarakis, A. Assessment of bioclimatic conditions on Crete Island, Greece. Reg. Environ. Chang. 2014, 14, 1967–1981. [Google Scholar] [CrossRef]
  49. Pecelj, M.; Đorđević, A.; Pecelj, M.R.; Pecelj-Purković, J.; Filipović, D.; Šećerov, V. Biothermal conditions on Mt. Zlatibor based on thermophysiological indices. Arch. Biol. Sci. 2017, 69, 455–461. [Google Scholar] [CrossRef]
  50. Morabito, M.; Crisci, A.; Messeri, A.; Capecchi, V.; Modesti, P.A.; Gensini, G.F.; Orlandini, S. Environmental temperature and thermal indices: What is the most effective predictor of heat-related mortality in different geographical contexts? Sci. World J. 2014, 2014, 961750. [Google Scholar] [CrossRef]
  51. Novak, M. Use of the UTCI in the Czech Republic. Geogr. Pol. 2013, 86, 21–28. [Google Scholar] [CrossRef]
  52. Urban, A.; Kisely, J. Comparison of UTCI with other thermal indices in the assessment of heat and cold effects on cardiovascular mortality in the Czech Republic. Int. J. Environ. Res. Public Health 2014, 11, 952–967. [Google Scholar] [CrossRef] [PubMed] [Green Version]
  53. Matzarakis, A.; Muthers, S.; Rutz, F. Application and comparison of UTCI and PET in temperate climate conditions. Finisterra 2014, 49, 21–31. [Google Scholar] [CrossRef]
  54. Błażejczyk, K.; Kunert, A. Bioklimatyczne Uwarunkowania Rekreacji i Turystyki w Polsce (Bioclimatic Principles of Recreation and Tourism in Poland); Polish Academy of Sciences S. Leszczycki Institute of Geography and Spatial Organization: Warsaw, Poland, 2011; p. 365. [Google Scholar]
  55. Błażejczyk, A.; Błażejczyk, K.; Baranowski, J.; Kuchcik, M. Heat stress mortality and desired adaptation responses of healthcare system in Poland. Int. J. Biometeorol. 2018, 62, 307–318. [Google Scholar] [CrossRef] [PubMed]
  56. Kuchcik, M.; Błażejczyk, K.; Szmyd, J.; Milewski, P.; Błażejczyk, A.; Baranowski, J. Potencjał Leczniczy Klimatu Polski (The Therapeutic Potential of the Polish Climate); IGIPZ PAN, Wydawnictwo Akademickie Sedno: Warsaw, Poland, 2013; pp. 1–272. [Google Scholar]
  57. Brecht, B.M.; Schädler, G.; Schipper, J.W. UTCI climatology and its future change in Germany—An RCM ensemble approach. Meteorol. Z. 2020, 29, 97–116. [Google Scholar] [CrossRef]
  58. Lünich, K.; Pluntke, T.; Prasser, M. (Eds.) Lausitzer Neiße—Charakteristik und Klima der Region (Lausitzer Neisse—Characteristics and Climate of the Region); Sachsisches Landesamt fur Umwelt, Landwirtschaft und Geologie: Dresden, Germany, 2014; p. 75. [Google Scholar]
  59. Pluntke, T.; Schwarzak, S.; Kuhn, K.; Lünich, K.; Adynkiewicz-Piragas, M.; Otop, I.; Miszuk, B. Climate analysis as a basis for a sustainable water management at the Lusatian Neisse. Meteorol. Hydrol. Water Manag. 2014, 4, 3–11. [Google Scholar] [CrossRef]
  60. Mehler, S.; Völlings, A.; Flügel, I.; Szymanowski, M.; Błaś, M.; Sobik, M.; Migała, K.; Werner, M.; Kryza, M.; Miszuk, B.; et al. Zmiany Klimatu w Regionie Granicznym Polski i Saksonii (Climate Changes in the Polish-Saxon Border Region); Sächsisches Landesamt für Umwelt, Landwirtschaft und Geologie: Dresden, Germany, 2014; p. 80. [Google Scholar]
  61. Miszuk, B.; Otop, I.; Strońska, M.; Schwarzak, S.; Surke, M. Tourism-climate conditions and their future development in the Polish-Saxon border area. Meteorol. Z. 2016, 25, 421–434. [Google Scholar] [CrossRef]
  62. Fiala, D.; Lomas, K.J.; Stohrer, M. Computer prediction of human thermoregulatory and temperature responses to a wide range of environmental conditions. Int. J. Biometeorol. 2001, 45, 143–159. [Google Scholar] [CrossRef]
  63. Jendtritzky, G.; de Dear, R.; Havenith, G. UTCI—Why another thermal index? Int. J. Biometeorol. 2012, 56, 421–428. [Google Scholar] [CrossRef] [PubMed] [Green Version]
  64. Błażejczyk, K.; Broede, P.; Fiala, D.; Havenith, G.; Holmer, I.; Jendritzky, G.; Kampmann, B. UTCI—New index for assessment of heat stress in man. Przegl. Geogr. 2010, 82, 49–71. [Google Scholar]
  65. Błażejczyk, K.; Błażejczyk, M. Bioklima2.6, Software Package. 2010. Available online: https://www.igipz.pan.pl/Bioklima-zgik.html (accessed on 23 November 2020).
  66. Ojrzyńska, H. Cyrkulacyjne Uwarunkowania Przestrzennego Rozkładu Temperatury Powietrza w Terenie Zróżnicowanym Morfologicznie na Przykładzie Sudetów (Circulation Conditionings of Air Temperature Spatial Differentiation in Morphologically Diverse area with the Use of an Example of the Western Sudeten); Rozprawy Naukowe Instytutu Geografii i Rozwoju Regionalnego Uniwersytetu Wrocławskiego: Wrocław, Poland, 2015; p. 228. [Google Scholar]
  67. Ojrzyńska, H.; Bilińska, D.; Werner, M.; Kryza, M.; Malkiewicz, M. The influence of atmospheric circulation conditions on Betula and Alnus pollen concentrations in Wrocław, Poland. Aerobiologia 2020, 36, 261–276. [Google Scholar] [CrossRef] [Green Version]
  68. Ojrzyńska, H. Calendar of circulation types for 1971–2018. Obtained Directly from the Author. Unpublished work.
  69. Kwiatkowski, J. Zasięg fenów sudeckich i ich wpływ na mezoklimat regionów południowo-zachodniej i środkowej Polski (The range of Sudetic fohn winds and their influence on the mesoclimate of southwest and central Poland). Przegl. Geofiz. 1975, 20, 15–30. [Google Scholar]
  70. Koźmiński, C.; Michalska, B. Zmienność liczby dni zimnych, chłodnych, ciepłych, gorących i upalnych w Polsce w okresie kwiecień–wrzesień (Variability in the numbers of cold, cool, warm, hot, and very hot days in Poland in the April–September period). Przegl. Geogr. 2011, 83, 91–107. [Google Scholar] [CrossRef]
  71. Żmudzka, E. Changes of thermal conditions in the Polish Tatra Mountains. Landf. Anal. 2009, 10, 140–146. [Google Scholar]
  72. Kundzewicz, Z.W.; Huang, S. Seasonal temperature extremes in Potsdam. Acta Geophys. 2010, 58, 1115–1133. [Google Scholar] [CrossRef]
  73. Owczarek, M.; Filipiak, J. Contemporary changes of thermal conditions in Poland, 1951–2015. Bull. Geogr. Phys. Geogr. 2016, 10, 31–50. [Google Scholar] [CrossRef] [Green Version]
  74. Wibig, J.; Podstawczyńska, A.; Rzepa, M.; Piotrowski, P. Heat waves in Poland—frequency, trends and relationships with atmospheric circulation. Geogr. Pol. 2009, 82, 33–45. [Google Scholar] [CrossRef]
  75. Kažys, J.; Malūnavičiūtė, I. The evaluation of summer beaching conditions on the Baltic Sea coast using the UTCI index. Int. J. Clim. Chang. Impacts Resp. 2015, 7, 41–59. [Google Scholar] [CrossRef]
  76. Scott, D.; Lemieux, C. Weather and climate information for tourism. Procedia Environ. Sci. 2010, 1, 146–183. [Google Scholar] [CrossRef] [Green Version]
  77. Bryś, K.; Ojrzyńska, H. Stimulating qualities of biometeorological conditions in Wrocław. Acta Geogr. Lodz. Folia Geogr. Phys. 2016, 104, 193–200. [Google Scholar]
  78. Krzyżewska, A.; Wereski, S.; Dobek, M. Summer UTCI Variability in Poland in the Twenty-First Century. Int. J. Biometeorol., Special Issue: UTCI—10 Years of Applications. 2020. Available online: https://link.springer.com/article/10.1007/s00484-020-01965-2 (accessed on 11 December 2020).
  79. Milewski, P. Application of the UTCI to the local bioclimate of Poland’s Ziemia Kłodzka region. Geogr. Pol. 2013, 86, 47–54. [Google Scholar] [CrossRef] [Green Version]
  80. Banc, S.; Croitoru, A.-E.; David, A.N.; Scripcă, A.-S. Changes Detected in Five Bioclimatic Indices in Large Romanian Cities over the Period 1961–2016. Atmosphere 2020, 11, 819. [Google Scholar] [CrossRef]
  81. Dobrinescu, A.; Busuioc, A.; Birsan, M.V.; Dumitrescu, A.; Orzan, A. Changes in thermal discomfort indices in Romania and their connection with large-scale mechanisms. Clim. Res. 2015, 64, 213–226. [Google Scholar] [CrossRef]
  82. Owczarek, M. The influence of large-scale factors on the heat load on human beings in Poland in the summer months. Theor. Appl. Climatol. 2018, 137, 855–869. [Google Scholar] [CrossRef]
  83. Bartoszek, K.; Wereski, S.; Krzyżewska, A.; Dobek, M. The influence of atmospheric circulation on bioclimatic conditions in Lublin (Poland). Bull. Geogr. Phys. Geogr. Ser. 2017, 12, 41–49. [Google Scholar] [CrossRef] [Green Version]
  84. Błażejczyk, K.; Idzikowska, D.; Błażejczyk, A. Forecast changes for heat and cold stress in Warsaw in the 21st century, and their possible influence on mortality risk. Pap. Glob. Chang. 2013, 20, 47–62. [Google Scholar] [CrossRef]
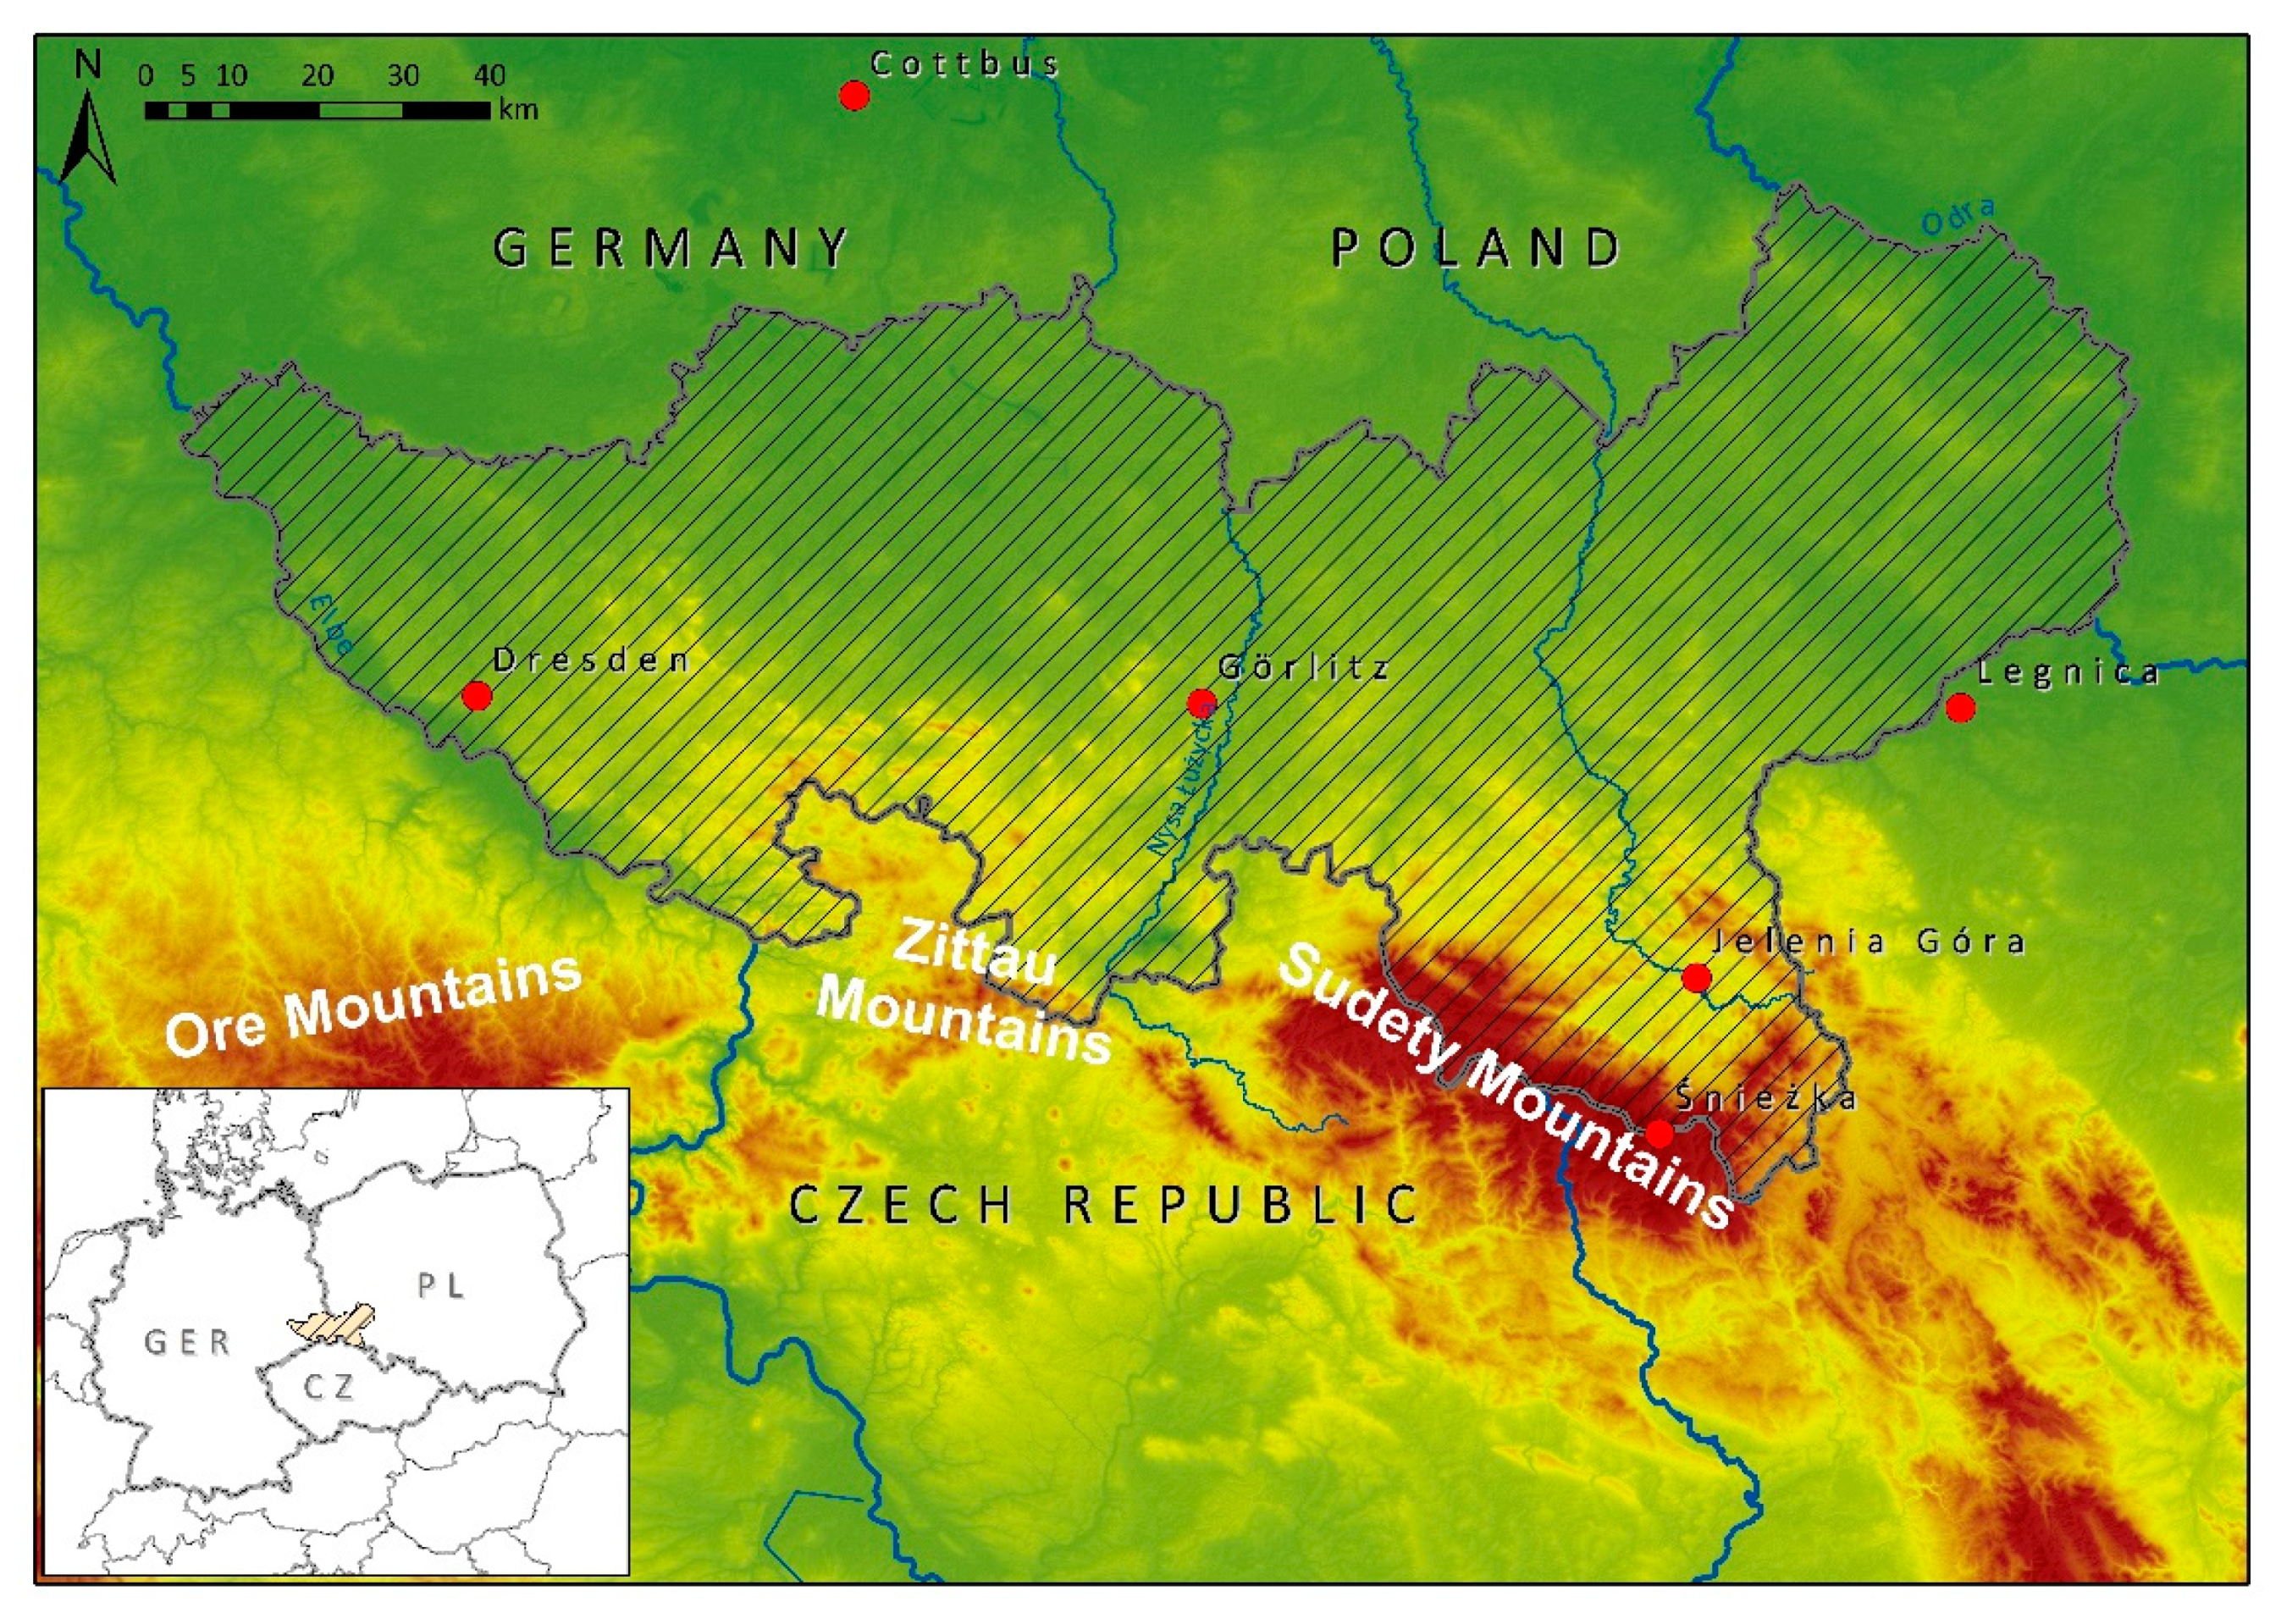
Figure 1. Meteorological stations in the Polish–Saxon border region and its surroundings.
Atmosphere 12 00163 g001
Figure 2. Annual number of and linear trend in heat days (Tmax > 30 °C) at selected meteorological stations in the Polish–Saxon region in 1971–2019.
Atmosphere 12 00163 g002aAtmosphere 12 00163 g002b
Figure 3. Mean annual number of days with particular UTCI (Universal Thermal Climate Index) categories for 12:00 UTC in the Polish–Saxon border region in 1971–2019 (UTCI categories: extreme cold stress (−5), very strong cold stress (−4), strong cold stress (−3), moderate cold stress (−2), slight cold stress (−1), no thermal stress (0), moderate heat stress (1), strong heat stress (2), and very strong heat stress (3)).
Atmosphere 12 00163 g003
Figure 4. Annual number of days with very strong (Cottbus) and strong heat stress (Legnica, Görlitz, and Jelenia Góra), according to the UTCI, in 1971–2019, based on 12:00 UTC data.
Atmosphere 12 00163 g004
Figure 5. Annual number of and linear trend in days with strong and very strong heat stress (UTCI > 32 °C) in Legnica, Görlitz, and Jelenia Góra in 1971–2019, based on 12:00 UTC data.
Atmosphere 12 00163 g005
Figure 6. Changes in the frequency of and linear trend in the annual number of heat days during SW-A (left) and SW-C (right) circulation types in 1971–2018 in the Polish–Saxon border region.
Atmosphere 12 00163 g006
Figure 7. Changes in the frequency of and linear trend in the annual number of days with UTCI > 32 °C (for 12:00 UTC) during SW-C circulation in 1971–2018 in the Polish–Saxon border region.
Atmosphere 12 00163 g007
Figure 8. Synoptic situation over Europe on 20 July 2006 (left) and 26 July 2006 (right) (source: www.knmi.nl)
Atmosphere 12 00163 g008
Figure 9. Course of air temperature (left) and UTCI (right) on 18–28 July 2006 in the Polish–Saxon border region (UTCI categories: moderate cold stress (−2), slight cold stress (−1), no thermal stress (0), moderate heat stress (1), strong heat stress (2), and very strong heat stress (3)).
Atmosphere 12 00163 g009
Figure 10. Synoptic situation over Europe on July 2, 2015 (left) and July, 4 2015 (right) (source: www.knmi.nl).
Atmosphere 12 00163 g010
Figure 11. Course of air temperature (left) and the UTCI (right) on 2–5 July 2015 in the Polish–Saxon border region (UTCI categories: moderate cold stress (−2), slight cold stress (−1), no thermal stress (0), moderate heat stress (1), strong heat stress (2), and very strong heat stress (3)).
Atmosphere 12 00163 g011
Table 1. German and Polish meteorological stations in the Polish–Saxon border area (with increasing altitude).
StationLocationRegionLatitudeLongitudeAltitude (m)
CottbusGermanyLowlands51°78′14°32′69
LegnicaPolandLowlands51°11′16°12′122
DresdenGermanyMountain foreland51°13′13°75′227
GörlitzGermanyMountain foreland51°16′14°95′238
Jelenia GóraPolandLower mountain zone50°54′15°47′342
Śnieżka MountainPolandSummit zone50°44′15°44′1603
Table 2. Stress category according to the UTCI (Universal Thermal Climate Index) [64].
Stress CategoryUTCI (°C)
Extreme heat stressabove 46
Very strong heat stress38 to 46
Strong heat stress32 to 38
Moderate heat stress26 to 32
No thermal stress9 to 26
Slight cold stress0 to 9
Moderate cold stress−13 to 0
Strong cold stress−27 to −13
Very strong cold stress−40 to −27
Extreme cold stressbelow −40
Table 3. Mean and maximum annual number of heat days (Tmax > 30 °C) and the intensity of their changes in 1971–2019 in the Polish–Saxon border region (statistically significant trends marked in bold).
CriteriaCottbusLegnicaDresdenGörlitzJelenia Góra
Mean annual number of heat days12.29.48.26.64.5
Maximum annual number of heat days (year)32
(2019)
30
(2015)
27
(2015)
25
(2015, 2018)
23
(2015)
Change per decade (days)2.412.371.101.671.52
Table 4. Mean number of days with strong and very strong heat stress (SHS and VSHS) according to the UTCI in particular months of 1971–2019 in the Polish–Saxon border region.
StationCategoryIIIIIIIVVVIVIIVIIIIXXXIXII
CottbusSHS...0.00.52.03.73.20.4...
VSHS.....0.20.50.4....
LegnicaSHS....0.21.32.72.50.3...
VSHS.....0.10.30.2....
DresdenSHS....0.21.53.02.40.3...
VSHS.....0.10.30.2....
GörlitzSHS....0.11.32.41.90.1...
VSHS.....0.00.10.1....
Jelenia
Góra
SHS....0.00.81.81.90.2...
VSHS.....0.00.00.1....
Table 5. Changes in frequency (days per decade) of particular categories of thermal stress according to the UTCI (for 12:00 UTC) in the Polish–Saxon border region in 1971–2019 (statistically significant trends marked in green and bold).
Stress Category
According to the UTCI
CottbusLegnicaDresdenGörlitzJelenia GóraŚnieżka Mountain
Extreme cold stress-----−4.5
Very strong cold stress−0.2−0.40.0−1.6−0.6−0.9
Strong cold stress−2.6−0.80.4−5.3−2.3−0.4
Moderate cold stress−0.2−1.31.01.00.21.5
Slight cold stress−1.1−1.6−2.9−1.3−1.52.1
No thermal stress2.13.01.45.82.82.2
Moderate heat stress1.20.2−0.20.60.5-
Strong heat stress0.60.70.20.90.8-
Very strong heat stress0.30.10.20.10.0-
Table 6. Number of days with strong and very strong heat stress (UTCI > 32 °C) in selected years of 1971–2019 in the Polish–Saxon border region.
StationUTCI Category1992199420032006201520182019
CottbusStrong heat stress15211821172115
Very strong heat stress3701543
Total18281822222518
LegnicaStrong heat stress1114716161610
Very strong heat stress3510402
Total1419816201612
DresdenStrong heat stress11131413131711
Very strong heat stress2601412
Total13191414171813
GörlitzStrong heat stress9131211121416
Very strong heat stress2400201
Total11171211141417
Jelenia
Góra
Strong heat stress15151081187
Very strong heat stress0200201
Total15171081388
Table 7. Correlation coefficient between the number of heat days and days with very strong heat stress (UTCI > 32 °C, for 12:00 UTC) and the frequency of particular circulation types in the summer seasons (June–August) of 1971–2018 in the Polish–Saxon border region (statistically significant correlation marked in green and bold).
StationIndexNE-ANE-CNW-ANW-CSE-ASE-CSW-ASW-CXX-AXX-C
CottbusHeat days0.36−0.01−0.12−0.270.250.16−0.15−0.350.23−0.20
UTCI > 320.46−0.10−0.03−0.150.190.05−0.24−0.380.25−0.15
LegnicaHeat days0.15−0.21−0.01−0.340.210.150.07−0.290.12−0.28
UTCI > 320.26−0.13−0.12−0.260.350.22−0.08−0.350.27−0.14
DresdenHeat days0.41−0.180.04−0.210.17−0.05−0.15−0.410.24−0.22
UTCI > 320.49−0.080.06−0.200.17−0.01−0.27−0.460.31−0.28
GörlitzHeat days0.30−0.19−0.02−0.230.220.07−0.04−0.410.21−0.21
UTCI > 320.28−0.150.12−0.060.190.04−0.18−0.400.15−0.16
JeleniaGóraHeat days0.13−0.230.02−0.240.170.100.07−0.310.16−0.24
UTCI > 320.16−0.200.13−0.130.150.07−0.08−0.290.14−0.28
Table 8. Annual frequency of heat days (%) in 1971–2018 under particular types of circulation in the Polish–Saxon border region.
StationNE-ANE-CNW-ANW-CSE-ASE-CSW-ASW-CXX-AXX-CTotal
Cottbus27.53.910.10.58.88.327.76.75.31.2100.0
Legnica19.41.69.80.29.35.738.511.23.21.1100.0
Dresden28.22.414.20.87.74.228.86.65.51.6100.0
Görlitz29.02.310.90.77.94.332.07.35.30.3100.0
Jelenia Góra21.71.07.90.58.45.439.911.33.40.5100.0
Table 9. Annual frequency of days with UTCI > 32 °C (%) for 12:00 UTC in 1971–2018 under particular types of circulation in the Polish–Saxon border region.
StationNE-ANE-CNW-ANW-CSE-ASE-CSW-ASW-CXX-AXX-CTotal
Cottbus33.22.512.30.88.86.122.36.35.92.0100.0
Legnica24.92.89.20.09.25.633.67.85.61.1100.0
Dresden31.03.013.20.09.23.527.25.75.12.2100.0
Görlitz30.82.411.90.38.74.925.26.67.71.4100.0
Jelenia Góra24.70.910.80.410.34.036.87.24.00.9100.0
Table 10. Percentage of heat days and days with UTCI > 32 °C among the total number of days with particular types of circulation for the summer seasons (June–August) of 1971–2018.
StationIndexNE-ANE-CNW-ANW-CSE-ASE-CSW-ASW-CXX-AXX-C
CottbusHeat days21.58.65.52.727.118.910.17.231.015.0
UTCI > 3223.45.65.93.525.811.77.55.628.717.5
LegnicaHeat days11.93.04.10.923.912.811.78.914.910.0
UTCI > 3212.24.33.20.019.48.78.15.018.410.0
DresdenHeat days15.43.95.12.717.47.17.44.921.812.5
UTCI > 3216.24.34.80.020.65.66.63.717.215.0
GörlitzHeat days12.63.03.31.814.86.16.84.116.12.5
UTCI > 3212.53.03.40.914.86.65.13.720.710.0
Jelenia
Góra
Heat days6.20.91.60.911.05.65.74.18.02.5
UTCI > 327.90.92.40.914.24.15.72.99.25.0
Table 11. Rate of changes (days per decade) of the annual number of heat days under particular types of circulation in 1971–2018 in the Polish–Saxon border region (statistically significant trend marked in green and bold).
StationNE-ANE-CNW-ANW-CSE-ASE-CSW-ASW-CXX-AXX-C
Cottbus0.110.020.340.010.060.400.710.310.11−0.02
Legnica0.20−0.030.170.010.010.211.000.470.15−0.01
Dresden0.00−0.010.22−0.02−0.070.070.340.140.12−0.03
Görlitz0.18−0.010.29−0.01−0.040.130.510.270.150.01
Jelenia Góra0.25−0.030.150.010.020.110.490.230.070.01
Table 12. Rate of changes (days per decade) of the annual number of days with UTCI > 32 °C (for 12:00 UTC) under particular types of circulation in 1971–2018 in the Polish–Saxon border region (statistically significant trend marked in green and bold).
StationNE-ANE-CNW-ANW-CSE-ASE-CSW-ASW-CXX-AXX-C
Cottbus−0.02−0.010.210.01−0.060.170.250.270.05−0.06
Legnica0.04−0.040.120.00−0.010.040.350.200.11−0.01
Dresden−0.22−0.010.150.00−0.070.030.210.150.05−0.08
Görlitz0.020.000.20−0.02−0.050.050.230.180.130.01
Jelenia Góra0.23−0.010.120.010.06−0.030.220.140.020.02
Publisher’s Note: MDPI stays neutral with regard to jurisdictional claims in published maps and institutional affiliations.