Abstract
Olive and vine cultivations are two of the most important crops in Europe, yielding high quality and value food products. The climate change over the Balkans may elevate the agroecological pressure for the established crops and shift their cultivations areas. One of the widely-used agroclimatic indices is the growing degree days (GDD) which accumulates the necessary thermal units for the selected crops. Despite the advances on the agroclimatic research, there are few available methods for spatiotemporal estimation of this useful index. So, this research is focused on the construction of simple and reliable equations for the calculation and projection of olive and vine cultivations’ GDD over the Balkans. The models’ input parameters are the time, the altitude, the distance from the seashore, and the latitude. Its assembly is made by the extracted spatial data, combined with the Agri4Cast dataset for the period of 1980 to 2018 incorporating the regional climate change trend. The results indicate that the most influential parameter is the time, followed by the latitude, for both cultivations. According to the projections, as quantified by GDD, a vast sprawl of olive and vine cultivation areas will have been formed to the northern parts of the studied area. To be more precise, the viticulture could expand spatially by 28.8% (of the Balkans area) by 2040, and by 15.1% to 2060, when the olive cultivations’ area could sprawl 23.9% by 2040 and 20.3% by 2060.
1. Introduction
Numerous studies have thoroughly investigated the relation of agriculture and climate, since the atmospheric conditions are one of the most critical crops’ growth factors [1,2,3]. Climate change implications about crops’ productivity are not straightforward. On the other hand, the variation of parameters such as temperature, relative humidity, and precipitation may restrict their growth and productivity [4,5,6,7]. Therefore, the high spatial variability of the climatic parameters drives the necessity of a regionally-focused and crop-specialized research. In order to connect the atmospheric with the agricultural environment in a climatic timescale, a wide variety of agroclimatic indices have been coincided [8,9,10]. Frequently, these indices quantify the thermal environment related to the growing and the phenological stages of the crops, and that is why they are of utmost importance on several scales of the agricultural sector, from yield prediction to policymaking [11,12,13]. One of the most widely-used agroclimatic indexes is the growing degree days (GDD), because it incorporates the air temperature, a common measurement, and an effective atmospheric parameter. The conceptual idea was presented in 1730 when Reaumut introduced the concept of heat units, or thermal time [11]. The accumulated heat was found to be a crucial ecophysiological factor for plants, and plays an important role in the crops’ productivity [14,15,16,17,18]. Moreover, the GDD units’ requirements have been specified for a wide variety of cultivations, considering plants’ physiological characteristics, phenological observations, and growth stages [19,20,21,22]. The GDD can be characterized as a classic bioclimatic index since it is constantly used for more than three decades, because it is easy to calculate, and there is no need of unobtainable parameters, but it is applicable for a wide variety of cultivations [23,24,25,26,27].
The Balkans area is a broad region of Southeastern Europe, on the one hand, with a high food production potential, but, on the other hand, on a firm climate change pressure [28,29,30,31]. The latest related research indicates that this area will face the climate change’s consequences shortly, affecting the spreading and spatial shifting of well-established growing areas of olive trees (Olea europaea L.) and grapevines (Vitis vinifera L.) [32,33,34,35,36,37,38]. The anticipated atmospheric conditions due to the climate change could cause an increase in the air temperature and a decrease of the precipitable water of the Balkans [39]. Moreover, the Balkans is a region that includes former Soviet Bloc countries, such as Bulgaria, Romania, and former Yugoslavia, whose agricultural sector is a transitional condition. So, they are trying to reorientate their agricultural policy, taking into account the current worldwide food market, technological advances, and climate change [39,40].
The advances of agroclimatic research due to computational models and high accuracy datasets yield important results for the near-future atmospheric conditions over the agriculture areas. However, the results are not easily utilized by the agricultural community as an aftermath of their complexity on implementation and interpretation [41,42,43,44]. As global and regional food production is directly affected by climate change consequences, the research community must grow and share accurate and easy-to-use information and tools [42,43,44,45].
The present study aims to develop easy-to-apply mathematic equations for the spatiotemporal estimation of olive tree and vine cultivation’s GDD over the Balkans area. As such, the objectives of this study are threefold: (1) to use a highly accurate atmospheric dataset for the calculation of the GDD for an extended area and period; (2) to form GDD equations which can be used by a wide range of stakeholders (from farmers to scientists) with easy-to-find input parameters; and (3) to develop vine and olive tree GDD spatiotemporal distribution projections for the next decades.
2. Material and Methods
2.1. Study Area and Data
This research is focused on the Balkans area covering the territories of Albania, Bosnia and Herzegovina, Bulgaria, Croatia, Greece, Montenegro, North Macedonia, Romania, Serbia, and Slovenia which are presented in Figure 1. There are two essential criteria that led to the study of the Balkans region. The first is the fact that these countries have a high potential for agricultural productivity, and the other is that they are located in a transitional zone in terms of climatic change.
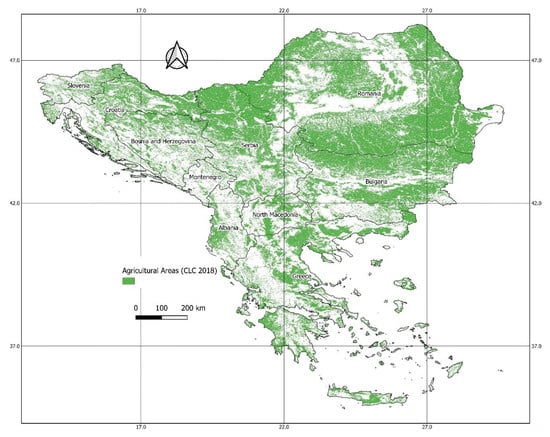
Figure 1.
The study area with the agricultural land use according to Corine land cover classification (2018).
For this research, a part of the gridded dataset produced by MARS-AGRI4CAST [46] was utilized. The dataset contains meteorological parameters from weather stations interpolated on a 25 km × 25 km regular meteorological grid over Europe for a time period from 1980 to 2018, including parameters such as air temperature, relative humidity, wind speed, precipitation, and radiation. The AGRI4CAST dataset is well-documented and widely used for agricultural research because of its accuracy and consistency in a spatiotemporal point of view. Its characteristics are presented in Table 1 [47,48,49]. The spatial and the temporal dimensions of the dataset are capable of incorporating the climatic trends of the selected area [50,51].

Table 1.
Spatial and temporal information about the AGRI4CAST dataset.
Table 2 provides us with some information about the number of grid points inside agricultural areas according to Corine land cover classification nomenclature [52], as a measure of the cultivated land per country. The study area’s sampling points used for this research are 1532, covering every area no matter if it is agricultural or not.
Table 2.
Study area information about the total and agricultural area’s grid points.
So, the initial dataset is exceptionally large, with 24,306,653 rows of measurements with ten variables’ columns.
The altitude information was extracted by a topographical delineation of the study area which is based on a 30-m digital elevation model (DEM) acquired from the Shuttle Radar Topography Mission (SRTM) dataset, provided by the United States Geological Survey (USGS) EROS archive. The SRTM 1 arc-second global elevation data were processed from raw C-radar signals spaced at intervals of 1 arc-second, approximately 30 m, at NASA’s Jet Propulsion Laboratory (JPL). The SRTM mission was formed by using interferometric radar, which compares two radar images or signals taken at slightly different angles. This mission used single-pass interferometry, which acquired two signals at the same time by using two different radar antennas. An antenna located onboard the space shuttle collected one dataset, and the other dataset was collected by an antenna located at the end of a 60-m mast that extended from the shuttle. Differences between the two signals allowed for the calculation of surface elevation [53,54,55]. Moreover, a raster of the latitude and a raster of the Euclidean distance from the seashore were used.
2.2. Methods
It is important to point out that due to the large dataset, all the processes and analyses were carried out using the R-Language, which is suitable for such research [48,56]. More specifically, R v.4.0.3 core scripts and essential packages, such as the “dplyr” [57] for data handling and manipulation, “purrr” [58] and “broom” [59] for the multiple regression modeling, along with the “fst” [60] which is very fast for reading and writing large data frames, were utilized. Additionally, part of the spatial analysis and the mapping procedures were performed with the packages “raster” [61], “rgdal” [62], and “tmap” [63], along with the open-source GIS software, QGIS v2.18.3 [64]. This research’s general workflow is presented in Figure 2, depicting the major datasets, relationships, and tools.
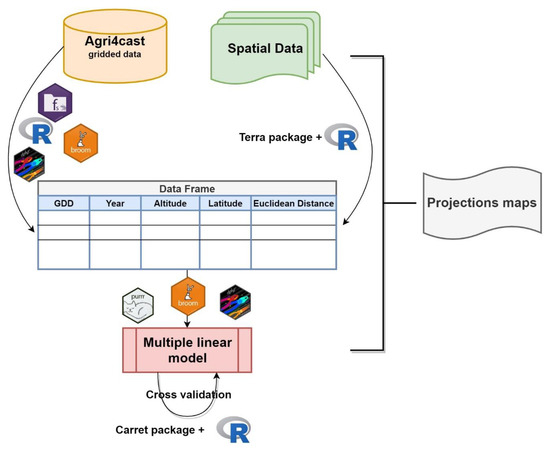
Figure 2.
The general research workflow of the research containing the used R packages.
The whole data handling and analysis process became fully automated via the scripts, except the map drawing, so the method is partially reproducible. The above algorithm will be utilized in future research for estimation of agroclimatic indices focused on different cultivations.
2.2.1. Growing Degree Days
To calculate the growing degree days, the canonical form of the equation was used, which is:
where Tmax is the daily maximum air temperature (°C), Tmin is the daily minimum air temperature (°C), and Tbase is the air temperature threshold below that which the plants’ growth does not progress.
When , the GDD is set equal to 0. Besides, Tbase depends on the biology of the species and the cultivars [16,17]. Also, the period of the year for the accumulation of the GDD depends on the plant’s requirements, and the biological phase was examined. For the examination of the thermal requirements of the olive tree (Olea Europea L.) over the study area, as a threshold, the Tbase = 7 °C was used. Moreover, the necessary heat summation limit, which is relevant for flower structure development, was 700 GDD for the period of January to the end of May [21,65,66]. Accordingly, for the viticulture (Vitis Vinifera L.), we used the Tbase = 10 °C as a threshold for the calculation of GDD units for the period from April to the end of October each year. The required GDD to characterize a climatic region as suitable for this cultivation is 2000 units [67,68].
2.2.2. Multiple Linear Regression and Cross-Validation
The primary scope of this research is the investigation of the climatic potential of the Balkans to establish extended viticulture and olive trees cultivation on a broader area, far beyond the southern coastal regions. To achieve this, the simple and robust method of multiple linear regression was selected. The foremost reason for this choice is the straightforward interpretation of the results and the physical explanation of the input parameters (predictors). Moreover, the equation of this type of analysis can be efficiently utilized to calculate the GDD over a selected point and year. So, the equations can be a useful tool for scientists, farmers, and other professionals. The form of the multiple linear equations is the following (Equation (2)):
where GDD represents the value of the GDD units (dependent variable) at a certain point; b0 is constant, and b1 to b4 are the coefficients of each independent variable from every multiple regression. alt is the altitude (m), lat is the latitude (degrees), dist is the distance from the shoreline (km), and time is the number of the year. So, the equation contains time-invariant factors such as altitude, latitude, and the shoreline distance and the year (time-variant) factor, to achieve spatiotemporal, inter-and extrapolation. In order to assess the accuracy of the regression model, a k(10)-fold cross-validation test using the Caret R package was performed [69].
After the multiple linear regression tests and the formation of the equations, the raster calculations were made to visualize the spatiotemporal projections of the GDD over the Balkans area. To be precise, the maps of the regions which fulfil the criterion of GDD for each cultivation were drawn. The multiple regression approach is essential for studies on the agroclimatic conditions with GDD or other related indices [32,33,70,71].
3. Results and Discussion
The results of this research consist of the output of the multiple linear regression (MLR), which are the equations, their coefficients, and their statistics test. The equations by themselves are useful information to estimate the GDD for each point of the selected area and for every year. On the other hand, the interpretation of their statistics tests and coefficients gives us useful insight into the significance of the predictor’s variables.
Moreover, it was presented a combined map for each cultivation with the spatiotemporal pattern of the areas that accumulate the GDD units above the threshold for viticulture and olive tree cultivation over the Balkans region. This cartographic material is a tool to identify the potential climatic sustainability for the expansion of vineyards and olive growths.
In case of implementation of the following models, altitude is in meters (m), the latitude is in decimal degrees (DD), the distance from the shoreline in kilometers (km), and the time is the year (y).
3.1. Olive Tree Cultivation Multiple Regression Model Results and Spatiotemporal Distribution of the GDD
In total, the multiple linear regression (MLR) model achieved a high R2 score of 0.759, which means that it can predict a wide range of GDD variation (Table 3). The F-statistic of the p-value, which gives the overall significance of the model, was very high. Moreover, p-values indicated a significant correlation between the GDD and each predictor variable. The t value for all the predictors showed that there is a significant association between them and the GDD, since t is always significantly different than zero. According to the coefficients, the time and the distance from the shoreline have a positive influence on GDD when the altitude and latitude have negative. Considering the standardized (scaled) estimates coefficients (in the parentheses), it is evident that the latitude, the distance from the equator, has a high negative impact on GDD increase, followed by the altitude. The predictor with a high positive impact on GDD increment is the time (year) when the positive influence of distance from the shoreline is negligible. Moreover, the time variable represents climate change because it is the only predictor that varies with time. So, the mean added GDD values per year were more than four units. The standard error (std. error) for each predictor variable was low, pinpointing the model’s accuracy. Moreover, the 10-fold cross-validation test yielded an R2 equal to 0.76 and an MAE of 96.89.
Table 3.
Multiple linear regression model coefficients for the growing degree days (GDD) units of the olive tree cultivation.
To illustrate the spatiotemporal distribution of the GDD in the Balkans area according to olive tree requirements for full blooming, the above MLR model for three time periods (2020, 2040, 2060) was implemented. In Figure 3, the light green color for the year 2020 is covering the total area with GDD above the threshold level of 700. The green and dark green colors for the years 2040 and 2060, respectively, are depicting the additional areas with GDD above the level of 700. Moreover, in the map are presented the regions where was established the olive tree cultivation according to Corine land cover in 2018. As it is presented, the GDD in 2020 allows the cultivation of olive tree in the southern part of the Balkans, covering an area from Greece to the northern borders of Bulgaria in the valley of Danube. The only regions which are excluded by this criterion are the higher mountainous areas. At this point, it must be pinpointed that there are several climatic restrictions, such as early or late frosts or extremely high temperatures, that make the cultivation of the olive tree inevitable, which it is not taken into account in this framework. The expansion of the areas which address the criterion of 700 GDD for the year 2040 is negligible in the southern part of the studied area. There is only a small addition in the high-altitude zone. The region where is recorded a broader expansion is in the northern part of the Balkans, especially in Northern Serbia and in the south of Romania. The time projection to the year 2060 indicates a further expansion of areas and fulfils the criterion of 700 GDD to the northern part of the Balkans. So, the zone of olive tree cultivation is covering the northern part of Croatian (and the neighboring part of Slovenia) along with a vast sector in Central Romania.
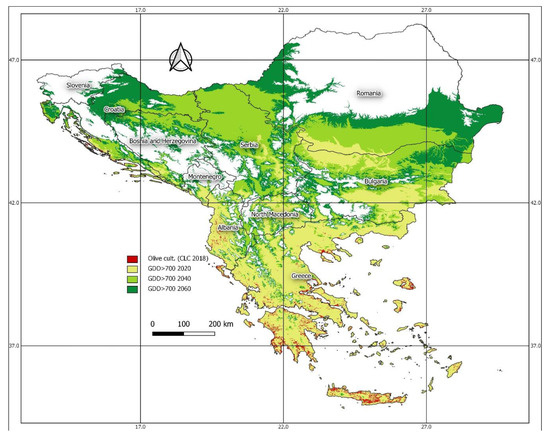
Figure 3.
The existing (2018) olive tree cultivation areas according to Corine land cover, and the areas which potentially accumulate the threshold of 700 GDD units during 2020, 2040, and 2060.
The findings of this study are corroborated to other research regarding olive cultivation in the same area. Fraga et al. [72] indicate the strong latitudinal gradient on the spatiotemporal projection of related parameters, such as growing season start or growing season length. More precisely, they found that growing season can be increased in low-latitude areas. Additionally, Orlandi et al. [73] analyzed the apparent influence of latitude on flowering of olive trees in two Mediterranean regions. Moreover, Tanasijevic et al. [74] found similar spatial expansion of the olive tree cultivation zone to the north, but this research does not include Bulgaria and Romania. Finally, Oteros et al. [75] found that the altitude plays a vital role in the phenological related climatic parameters of the olive trees.
3.2. Viticulture Multiple Regression Model Results and Spatiotemporal Distribution of the GDD
The results of the multiple linear regression model analysis (Table 4) describe a statistically significant relationship between the output variable (GDD) and the predictors, giving an R2 equal to 0.8. Moreover, each predictor has significant statistic correlation with the independent variable. The coefficients of the predictors show a high positive relation of the GDD with the time and a high negative relation with the latitude. Additionally, there is a negative trend of the altitude for the GDD. Finally, the distance from the shoreline has a weak negative influence on GDD variation.
Table 4.
Multiple linear regression model coefficients for the GDD units of the viticulture.
Moreover, the t value indicates clearly that all the selected predictor variables are important for the estimation of GDD over the Balkans area. Finally, the relative standard error (RSE) and the standard error pinpoint the high accuracy of the model. Also, the 10-fold cross-validation indicates an R2 equal to 0.80 with a mean absolute error (MAE) of 176.14.
The following map (Figure 4) illustrates the areas which fulfil the criterion of 2000 GDD for the May to October period. As presented for the year 2020, all the southern part of the Balkans is suitable for viticulture, considering GDD. More specifically, the coastal zone of Albania, Montenegro, Croatia, and Slovenia, along with an extended part of Bulgaria and Southern Romania and the plains of North Macedonia and Serbia are suitable for viticulture.
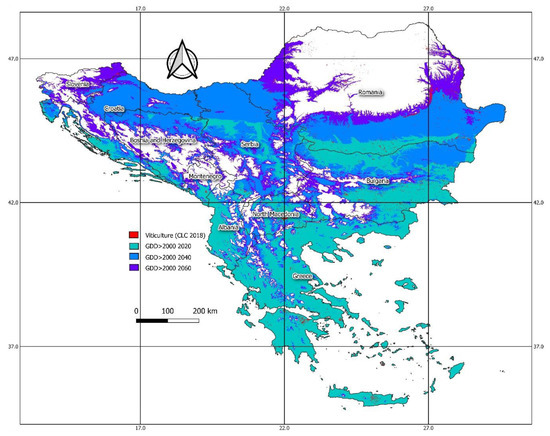
Figure 4.
The existing (2018) viticulture areas according to Corine land cover, and the areas which potentially accumulate the threshold of 2000 GDD units during 2020, 2040, and 2060.
The time projection of GDD for 2040 indicates an extensive expansion of the climatic suitability over the northern part of the study area. There is also an advancement around the mountainous regions of the south. However, the most extended zonal spreading is in North Serbia and Croatia and the northern part of Donau’s basin near the Bulgarian–Romanian borders. In general, the results corroborate recent research, such as Santos et al. [76] and Malheiro et al. [77], indicating the transition of the viticulture zone of the European and, more specifically, the Mediterranean area.
3.3. General Results and Discussion
The analysis of the multiple linear regression models and the spatiotemporal distribution of the GDD for both cultivations closely corroborate published research which estimated the GDD using the same or a similar dataset [5,78,79], but in different timescale [5,70], by climatic models such as CMIP5 and REGCM3 [80,81] for representative concentration pathways, e.g., RegCM4, RCP4.5, RCP8.5, A1B, A2, and B2 [5,35,81,82]. Generally, the results are in clear agreement (quantitatively and qualitatively) with publications focused on the current and future agroclimatic conditions in Europe and, especially, in the studied area [74,79,81,83,84,85,86].
Moreover, as it is presented in Table 5, there is a high potential for olive cultivations and viticulture in terms of GDD. However, there is a broad expansion for both cultivations in 2040. The olive cultivation, according to the findings, may sprawl the next decades to northern areas and higher altitudes. Herein, there is a change of new olive production areas in case the rest of the climatic and aquatic requirements can be fulfilled (e.g., free of frost growing season, adequate water resources). Probably the most interesting finding is the future expansion of the olive zone to the plain areas of Northern Bulgaria and Southern Romania because, in these areas, the agricultural potential is extremely high. In case of successful cultivation of the olive tree in the Northern Balkans, the worldwide map of the olive and olive oil would change. The major expansion of this cultivation (reaching almost 50% in 2040) could be made over the northern areas with low altitude, such as the above-mentioned regions and the plain in Northern Serbia. In the case of viticulture, it may expand covering almost 60% of the Balkans area because of the physiology of the plant, which is inactive during the cold winter period of the year.
Table 5.
The temporal variation of the percentage (%) of the research area, which is suitable for cultivation according to GDD criterion.
So, the thermal threshold of 2000 GDD can be reached in a wide area of the Balkans in the next decades, offering the opportunity of an expansion of the vines far from the Mediterranean seashore.
The presented results (maps and numerical data) can give information about the suitability only from an atmospheric–thermal point of view, which is narrowed to the GDD. So, to form a more realistic image about the ability of vine and olive cultivation, a combination of those results with soil maps and hydrological data, growing seasons estimations could be made. Moreover, there are several restrictions which come from the land’s geomorphological condition (e.g., aspect, slope), and the land use policy of the area. So, the total area which is suitable for each cultivation is a small fraction of the above estimated.
4. Conclusions
According to the results’ analysis and their discussion, it could be inferred that for the next six decades, there is a high potential for olive tree cultivation and viticulture in the northern parts of the Balkans (Northern Bulgaria and Southern Romania), in terms of growing degree days. Moreover, it is estimated that a sprawl to the higher altitudes will give opportunities for new terroirs if the other agroecological factors allow their cultivation. The multiple regression models are simple but effective on the spatiotemporal estimation of GDD units, specialized on vine and olive tree growth requirements. Except for the ability to estimate the thermal bioclimate for the cultivations, the models shed light on the significance of the input parameters on the GDD values. So, the most influential (time-invariant) parameter is the latitude, followed by the altitude, both with a negative trend on the GDD variation. Nonetheless, the time–predictor coefficients prove that the climate change trend is positive and dominant on the GDD variation. This means that the geographic factors have a less-significant influence on the regional cultivations’ status than the climatic trend. Finally, both multiple linear regression equations are accurate and robust, and can be an effective tool for the spatiotemporal estimation of the GDD for the Balkans area.
Author Contributions
Authors contribution described as: (i) I.C. consolidated paper conceptualization, data analysis, algorithm, scripts, and manuscript preparation; (ii) I.P. provided both general and specific data analysis and manuscript preparation; (iii) E.P. provided spatial data analysis and maps preparation, and (iv) P.N. provided conceptualization and manuscript review and editing. All authors have read and agreed to the published version of the manuscript.
Funding
This research received no external funding.
Institutional Review Board Statement
Not applicable.
Informed Consent Statement
Not applicable.
Data Availability Statement
Data sharing is not applicable to this article.
Conflicts of Interest
The authors declare no conflict of interest.
References
- Rosenberg, N.J. Adaptation of agriculture to climate change. Clim. Chang. 1992, 21, 385–405. [Google Scholar] [CrossRef]
- Howden, S.M.; Soussana, J.-F.; Tubiello, F.N.; Chhetri, N.; Dunlop, M.; Meinke, H. Adapting agriculture to climate change. Proc. Nacl. Acad. Sci. USA 2007, 104, 19691–19696. [Google Scholar] [CrossRef] [PubMed]
- Rickards, L.; Howden, S.M. Transformational adaptation: Agriculture and climate change. Crop Pasture Sci. 2012, 63, 240–250. [Google Scholar] [CrossRef]
- Giorgi, F.; Lionello, P. Climate change projections for the Mediterranean region. Glob. Planet. Chang. 2008, 63, 90–104. [Google Scholar] [CrossRef]
- Trnka, M.; Olesen, J.E.; Kersebaum, K.C.; Skjelvåg, A.O.; Eitzinger, J.; Seguin, B.; Peltonen-Sainio, P.; Rötter, R.; Iglesias, A.; Orlandini, S.; et al. Agroclimatic conditions in Europe under climate change. Glob. Chang. Biol. 2011, 17, 2298–2318. [Google Scholar] [CrossRef]
- Nastos, P.T.; Politi, N.; Kapsomenakis, J. Spatial and temporal variability of the Aridity Index in Greece. Atmos. Res. 2013, 119, 140–152. [Google Scholar] [CrossRef]
- Tsiros, I.X.; Nastos, P.; Proutsos, N.D.; Tsaousidis, A. Variability of the aridity index and related drought parameters in Greece using climatological data over the last century (1900–1997). Atmos. Res. 2020, 240, 104914. [Google Scholar] [CrossRef]
- Feng, S.; Hu, Q. Changes in agro-meteorological indicators in the contiguous United States: 1951–2000. Theor. Appl. Clim. 2004, 78, 247–264. [Google Scholar] [CrossRef]
- Terando, A.; Easterling, W.E.; Keller, K.; Easterling, D.R. Observed and Modeled Twentieth-Century Spatial and Temporal Patterns of Selected Agro-Climate Indices in North America. J. Clim. 2012, 25, 473–490. [Google Scholar] [CrossRef]
- Saadi, S.; Todorovic, M.; Tanasijevic, L.; Pereira, L.S.; Pizzigalli, C.; Lionello, P. Climate change and Mediterranean agriculture: Impacts on winter wheat and tomato crop evapotranspiration, irrigation requirements and yield. Agric. Water Manag. 2015, 147, 103–115. [Google Scholar] [CrossRef]
- McMaster, G.S.; Wilhelm, W.W. Growing degree-days: One equation, two interpretations. Agric. For. Meteorol. 1997, 87, 291–300. [Google Scholar] [CrossRef]
- Fernández-Long, M.E.; Müller, G.V.; Beltrán-Przekurat, A.; Scarpati, O.E. Long-term and recent changes in temperature-based agroclimatic indices in Argentina. Int. J. Climatol. 2013, 33, 1673–1686. [Google Scholar] [CrossRef]
- Ballesteros, R.; Ortega, J.F.; Hernandez, D.; del Campo, A.; Moreno, M.A. Combined use of agro-climatic and very high-resolution remote sensing information for crop monitoring. Int. J. Appl. Earth Obs. Geoinf. 2018, 72, 66–75. [Google Scholar] [CrossRef]
- Gilmore, E.C.; Rogers, J.S. Heat Units as a Method of Measuring Maturity in Corn. Agron. J. 1958, 50, 611–615. [Google Scholar] [CrossRef]
- Baskerville, G.L.; Emin, P. Rapid Estimation of Heat Accumulation from Maximum and Minimum Temperatures. Ecology 1969, 50, 514–517. [Google Scholar] [CrossRef]
- Cross, H.Z.; Zuber, M.S. Prediction of Flowering Dates in Maize Based on Different Methods of Estimating Thermal Units1. Agron. J. 1972, 64, 351–355. [Google Scholar] [CrossRef]
- Klepper, B.; Belford, R.K.; Rickman, R.W. Root and Shoot Development in Winter Wheat. Agron. J. 1984, 76, 117–122. [Google Scholar] [CrossRef]
- Anandhi, A. Growing degree days—Ecosystem indicator for changing diurnal temperatures and their impact on corn growth stages in Kansas. Ecol. Indic. 2016, 61, 149–158. [Google Scholar] [CrossRef]
- Yang, S.; Logan, J.; Coffey, D.L. Mathematical formulae for calculating the base temperature for growing degree days. Agric. For. Meteorol. 1995, 74, 61–74. [Google Scholar] [CrossRef]
- Snyder, R.L.; Spano, D.; Cesaraccio, C.; Duce, P. Determining degree-day thresholds from field observations. Int. J. Biometeorol. 1999, 42, 177–182. [Google Scholar] [CrossRef]
- Orlandi, F.; Avolio, E.; Bonofiglio, T.; Federico, S.; Romano, B.; Fornaciari, M. Potential shifts in olive flowering according to climate variations in Southern Italy. Meteorol. Appl. 2013, 20, 497–503. [Google Scholar] [CrossRef]
- Yin, Y.; Deng, H.; Wu, S. Spatial-temporal variations in the thermal growing degree-days and season under climate warming in China during 1960–2011. Int. J. Biometeorol. 2019, 63, 649–658. [Google Scholar] [CrossRef] [PubMed]
- Bates, T.; Jakubowski, R.; Taylor, J.A. Evaluation of the Concord Crop Load Response for Current Commercial Production in New York. Am. J. Enol. Vitic. 2021, 72, 1–11. [Google Scholar] [CrossRef]
- Suresh, K.; Behera, S.K.; Manorama, K.; Mathur, R.K. Phenological Stages and Degree Days of Oil Palm Crosses Grown under Irrigation in Tropical Conditions. Ann. Appl. Biol. 2021, 178, 121–128. [Google Scholar] [CrossRef]
- Koufos, G.C.; Mavromatis, T.; Koundouras, S.; Jones, G.V. Adaptive Capacity of Winegrape Varieties Cultivated in Greece to Climate Change: Current Trends and Future Projections. OENO One 2020, 54, 1201–1219. [Google Scholar] [CrossRef]
- Lewis-Beck, C.; Zhu, Z.; Walker, V.; Hornbuckle, B. Modeling Crop Phenology in the US Corn Belt Using Spatially Referenced SMOS Satellite Data. JABES 2020, 25, 657–675. [Google Scholar] [CrossRef]
- Fatima, Z.; Ahmed, M.; Hussain, M.; Abbas, G.; Ul-Allah, S.; Ahmad, S.; Ahmed, N.; Ali, M.A.; Sarwar, G.; ul Haque, E.; et al. The Fingerprints of Climate Warming on Cereal Crops Phenology and Adaptation Options. Sci. Rep. 2020, 10, 18013. [Google Scholar] [CrossRef]
- Nastos, P.T.; Zerefos, C.S. Spatial and temporal variability of consecutive dry and wet days in Greece. Atmos. Res. 2009, 94, 616–628. [Google Scholar] [CrossRef]
- Bindi, M.; Olesen, J.E. The responses of agriculture in Europe to climate change. Reg Environ. Chang. 2011, 11, 151–158. [Google Scholar] [CrossRef]
- Nastos, P.T.; Kapsomenakis, J. Regional climate model simulations of extreme air temperature in Greece. Abnormal or common records in the future climate? Atmos. Res. 2015, 152, 43–60. [Google Scholar] [CrossRef]
- Georgopoulou, E.; Mirasgedis, S.; Sarafidis, Y.; Vitaliotou, M.; Lalas, D.P.; Theloudis, I.; Giannoulaki, K.-D.; Dimopoulos, D.; Zavras, V. Climate change impacts and adaptation options for the Greek agriculture in 2021–2050: A monetary assessment. Clim. Risk Manag. 2017, 16, 164–182. [Google Scholar] [CrossRef]
- Giorgi, F. Climate change hot-spots. Geophys. Res. Lett. 2006, 33. [Google Scholar] [CrossRef]
- Moriondo, M.; Ferrise, R.; Trombi, G.; Brilli, L.; Dibari, C.; Bindi, M. Modelling olive trees and grapevines in a changing climate. Environ. Model. Softw. 2015, 72, 387–401. [Google Scholar] [CrossRef]
- Paparrizos, S.; Matzarakis, A. Present and future assessment of growing degree days over selected Greek areas with different climate conditions. Meteorol. Atmos. Phys. 2017, 129, 453–467. [Google Scholar] [CrossRef]
- Koufos, G.C.; Mavromatis, T.; Koundouras, S.; Jones, G.V. Response of viticulture-related climatic indices and zoning to historical and future climate conditions in Greece. Int. J. Climatol. 2018, 38, 2097–2111. [Google Scholar] [CrossRef]
- Fraga, H.; Pinto, J.G.; Santos, J.A. Climate change projections for chilling and heat forcing conditions in European vineyards and olive orchards: A multi-model assessment. Clim. Chang. 2019, 152, 179–193. [Google Scholar] [CrossRef]
- Santillán, D.; Iglesias, A.; La Jeunesse, I.; Garrote, L.; Sotes, V. Vineyards in transition: A global assessment of the adaptation needs of grape producing regions under climate change. Sci. Total Environ. 2019, 657, 839–852. [Google Scholar] [CrossRef]
- Alikadic, A.; Pertot, I.; Eccel, E.; Dolci, C.; Zarbo, C.; Caffarra, A.; De Filippi, R.; Furlanello, C. The impact of climate change on grapevine phenology and the influence of altitude: A regional study. Agric. For. Meteorol. 2019, 271, 73–82. [Google Scholar] [CrossRef]
- Olesen, J.E.; Bindi, M. Consequences of Climate Change for European Agricultural Productivity, Land Use and Policy. Eur. J. Agron. 2002, 16, 239–262. [Google Scholar] [CrossRef]
- Ruiz, I.; Almagro, M.; de Jalón, S.G.; del Mar Solà, M.; Sanz, M.J. Assessment of Sustainable Land Management Practices in Mediterranean Rural Regions. J. Environ. Manag. 2020, 276, 111293. [Google Scholar] [CrossRef]
- Streimikis, J.; Baležentis, T. Agricultural sustainability assessment framework integrating sustainable development goals and interlinked priorities of environmental, climate and agriculture policies. Sustain. Dev. 2020, 1. [Google Scholar] [CrossRef]
- Agovino, M.; Casaccia, M.; Ciommi, M.; Ferrara, M.; Marchesano, K. Agriculture, climate change and sustainability: The case of EU-28. Ecol. Indic. 2019, 105, 525–543. [Google Scholar] [CrossRef]
- Cui, X. Climate change and adaptation in agriculture: Evidence from US cropping patterns. J. Environ. Econ. Manag. 2020, 101, 102306. [Google Scholar] [CrossRef]
- Schmidhuber, J.; Tubiello, F.N. Global food security under climate change. Proc. Natl. Acad. Sci. USA 2007, 104, 19703–19708. [Google Scholar] [CrossRef]
- Wheeler, T.; von Braun, J. Climate Change Impacts on Global Food Security. Science 2013, 341, 508–513. [Google Scholar] [CrossRef] [PubMed]
- Biavetti, I.; Karetsos, S.; Ceglar, A.; Toreti, A.; Panagos, P. European meteorological data: Contribution to research, development, and policy support. In Proceedings of the Second International Conference on Remote Sensing and Geoinformation of the Environment (RSCy2014), Paphos, Cyprus, 7–10 April 2014; International Society for Optics and Photonics: Bellingham, WA, USA, 2014; Volume 9229, p. 922907. [Google Scholar]
- Ceglar, A.; Turco, M.; Toreti, A.; Doblas-Reyes, F.J. Linking crop yield anomalies to large-scale atmospheric circulation in Europe. Agric. For. Meteorol. 2017, 240–241, 35–45. [Google Scholar] [CrossRef]
- Korycinska, A.; Baker, R. Exploiting the high-resolution JRC-MARS European climatic dataset for pest risk mapping. EPPO Bull. 2017, 47, 246–254. [Google Scholar] [CrossRef]
- Van der Velde, M.; Biavetti, I.; El-Aydam, M.; Niemeyer, S.; Santini, F.; van den Berg, M. Use and relevance of European Union crop monitoring and yield forecasts. Agric. Syst. 2019, 168, 224–230. [Google Scholar] [CrossRef]
- Bene, C.D.; Marchetti, A.; Francaviglia, R.; Farina, R. Soil organic carbon dynamics in typical durum wheat-based crop rotations of Southern Italy. Ital. J. Agron. 2016, 11, 209–216. [Google Scholar] [CrossRef]
- Bakucs, Z.; Fertő, I.; Vígh, E. Crop Productivity and Climatic Conditions: Evidence from Hungary. Agriculture 2020, 10, 421. [Google Scholar] [CrossRef]
- Büttner, G. CORINE Land Cover and Land Cover Change Products. In Land Use and Land Cover Mapping in Europe; Manakos, I., Braun, M., Eds.; Remote Sensing and Digital Image Processing Series; Springer: Dordrecht, The Netherlands, 2014; pp. 55–74. ISBN 978-94-007-7968-6. [Google Scholar]
- Efthimiou, N.; Psomiadis, E. The Significance of Land Cover Delineation on Soil Erosion Assessment. Environ. Manag. 2018, 62, 383–402. [Google Scholar] [CrossRef] [PubMed]
- Farr, T.G.; Rosen, P.A.; Caro, E.; Crippen, R.; Duren, R.; Hensley, S.; Kobrick, M.; Paller, M.; Rodriguez, E.; Roth, L.; et al. The Shuttle Radar Topography Mission. Rev. Geophys. 2007, 45. [Google Scholar] [CrossRef]
- Sreedevi, P.D.; Owais, S.; Khan, H.H.; Ahmed, S. Morphometric analysis of a watershed of South India using SRTM data and GIS. J. Geol. Soc. India 2009, 73, 543–552. [Google Scholar] [CrossRef]
- Charalampopoulos, I. The R Language as a Tool for Biometeorological Research. Atmosphere 2020, 11, 682. [Google Scholar] [CrossRef]
- Wickham, H.; François, R.; Henry, L.; Müller, K. Dplyr: A Grammar of Data Manipulation. Available online: https://CRAN.R-project.org/package=dplyr (accessed on 25 April 2020).
- Henry, L.; Wickham, H. RStudio Purrr: Functional Programming Tools. Available online: https://CRAN.R-project.org/package=purrr (accessed on 9 November 2020).
- Robinson, D.; Hayes, A. Broom: Convert Statistical Analysis Objects into Tidy Tibbles. Available online: https://CRAN.R-project.org/package=broom (accessed on 5 February 2020).
- Klik, M.; Collet, Y. fst: Lightning Fast Serialisation of Data Frames for R. Available online: https://CRAN.R-project.org/package=fst (accessed on 1 July 2020).
- Hijmans, R.J.; van Etten, J.; Sumner, M.; Cheng, J.; Baston, D.; Bevan, A.; Bivand, R.; Busetto, L.; Canty, M.; Forrest, D.; et al. Raster: Geographic Data Analysis and Modeling. Available online: https://CRAN.R-project.org/package=raster (accessed on 1 July 2020).
- Bivand, R.; Keitt, T.; Rowlingson, B.; Pebesma, E.; Sumner, M.; Hijmans, R.; Rouault, E.; Warmerdam, F.; Ooms, J.; Rundel, C. Rgdal: Bindings for the “Geospatial” Data Abstraction Library. Available online: https://CRAN.R-project.org/package=rgdal (accessed on 1 July 2020).
- Tennekes, M.; Gombin, J.; Jeworutzki, S.; Russell, K.; Zijdeman, R.; Clouse, J.; Lovelace, R.; Nowosad, J.; Muenchow, J. Tmap: Thematic Maps. Available online: https://CRAN.R-project.org/package=tmap (accessed on 1 July 2020).
- QGIS Development Team. QGIS Geographic Information System. Open Source Geospatial Foundation Project. 2013. Available online: https://www.scirp.org/(S(vtj3fa45qm1ean45vvffcz55))/reference/ReferencesPapers.aspx?ReferenceID=1515458 (accessed on 23 January 2021).
- Wang, J.Y. A Critique of the Heat Unit Approach to Plant Response Studies. Ecology 1960, 41, 785–790. [Google Scholar] [CrossRef]
- Orlandi, F.; Bonofiglio, T.; Romano, B.; Fornaciari, M. Qualitative and quantitative aspects of olive production in relation to climate in southern Italy. Sci. Hortic. 2012, 138, 151–158. [Google Scholar] [CrossRef]
- Koufos, G.; Mavromatis, T.; Koundouras, S.; Fyllas, N.M.; Jones, G.V. Viticulture-climate relationships in Greece: The impacts of recent climate trends on harvest date variation. Int. J. Climatol. 2014, 34, 1445–1459. [Google Scholar] [CrossRef]
- Ruml, M.; Vuković, A.; Vujadinović, M.; Djurdjević, V.; Ranković-Vasić, Z.; Atanacković, Z.; Sivčev, B.; Marković, N.; Matijašević, S.; Petrović, N. On the use of regional climate models: Implications of climate change for viticulture in Serbia. Agric. For. Meteorol. 2012, 158–159, 53–62. [Google Scholar] [CrossRef]
- Kuhn, M. Building Predictive Models in R Using the caret Package. J. Stat. Softw. 2008, 28, 1–26. [Google Scholar] [CrossRef]
- Denney, J.O.; McEachern, G.R.; Griffiths, J.F. Modeling the thermal adaptability of the olive (Olea europaea L.) in Texas. Agric. For. Meteorol. 1985, 35, 309–327. [Google Scholar] [CrossRef]
- Tack, J.; Barkley, A.; Nalley, L.L. Effect of warming temperatures on US wheat yields. Proc. Nacl. Acad. Sci. USA 2015, 112, 6931–6936. [Google Scholar] [CrossRef] [PubMed]
- Fraga, H.; Pinto, J.G.; Viola, F.; Santos, J.A. Climate change projections for olive yields in the Mediterranean Basin. Int. J. Climatol. 2020, 40, 769–781. [Google Scholar] [CrossRef]
- Orlandi, F.; Msallem, M.; Bonofiglio, T.; Ben Dhiab, A.; Sgromo, C.; Romano, B.; Fornaciari, M. Relationship between olive flowering and latitude in two Mediterranean countries (Italy and Tunisia). Theor. Appl. Clim. 2010, 102, 265–273. [Google Scholar] [CrossRef]
- Tanasijevic, L.; Todorovic, M.; Pereira, L.S.; Pizzigalli, C.; Lionello, P. Impacts of climate change on olive crop evapotranspiration and irrigation requirements in the Mediterranean region. Agric. Water Manag. 2014, 144, 54–68. [Google Scholar] [CrossRef]
- Oteros, J.; García-Mozo, H.; Vázquez, L.; Mestre, A.; Domínguez-Vilches, E.; Galán, C. Modelling olive phenological response to weather and topography. Agric. Ecosyst. Environ. 2013, 179, 62–68. [Google Scholar] [CrossRef]
- Santos, J.A.; Malheiro, A.C.; Pinto, J.G.; Jones, G.V. Macroclimate and viticultural zoning in Europe: Observed trends and atmospheric forcing. Clim. Res. 2012, 51, 89–103. [Google Scholar] [CrossRef]
- Malheiro, A.C.; Santos, J.A.; Fraga, H.; Pinto, J.G. Climate change scenarios applied to viticultural zoning in Europe. Clim. Res. 2010, 43, 163–177. [Google Scholar] [CrossRef]
- Spinoni, J.; Vogt, J.; Barbosa, P. European degree-day climatologies and trends for the period 1951-2011. Int. J. Climatol. 2015, 35, 25–36. [Google Scholar] [CrossRef]
- Spinoni, J.; Vogt, J.V.; Barbosa, P.; Dosio, A.; McCormick, N.; Bigano, A.; Füssel, H.-M. Changes of heating and cooling degree-days in Europe from 1981 to 2100. Int. J. Climatol. 2018, 38, e191–e208. [Google Scholar] [CrossRef]
- Önol, B.; Semazzi, F.H.M. Regionalization of Climate Change Simulations over the Eastern Mediterranean. J. Clim. 2009, 22, 1944–1961. [Google Scholar] [CrossRef]
- Ruosteenoja, K.; Räisänen, J.; Venäläinen, A.; Kämäräinen, M. Projections for the duration and degree days of the thermal growing season in Europe derived from CMIP5 model output. Int. J. Climatol. 2016, 36, 3039–3055. [Google Scholar] [CrossRef]
- Paparrizos, S.; Matzarakis, A. Present and future responses of growing degree days for Crete Island in Greece. Adv. Sci. Res. 2017, 14, 1–5. [Google Scholar]
- Moore, F.C.; Lobell, D.B. Adaptation potential of European agriculture in response to climate change. Nat. Clim. Chang. 2014, 4, 610–614. [Google Scholar] [CrossRef]
- Moore, F.C.; Lobell, D.B. The fingerprint of climate trends on European crop yields. Proc. Natl. Acad. Sci. USA 2015, 112, 2670–2675. [Google Scholar] [CrossRef] [PubMed]
- Ferrise, R.; Trombi, G.; Moriondo, M.; Bindi, M. Climate Change and Grapevines: A Simulation Study for the Mediterranean Basin*. J. Wine Econ. 2016, 11, 88–104. [Google Scholar] [CrossRef]
- Fraga, H.; García de Cortázar Atauri, I.; Malheiro, A.C.; Santos, J.A. Modelling climate change impacts on viticultural yield, phenology and stress conditions in Europe. Glob. Chang. Biol. 2016, 22, 3774–3788. [Google Scholar] [CrossRef]
Publisher’s Note: MDPI stays neutral with regard to jurisdictional claims in published maps and institutional affiliations. |
© 2021 by the authors. Licensee MDPI, Basel, Switzerland. This article is an open access article distributed under the terms and conditions of the Creative Commons Attribution (CC BY) license (http://creativecommons.org/licenses/by/4.0/).