
Comparison of Volatile Organic Compound Concentrations in Ambient Air among Different Source Areas around Khon Kaen, Thailand

 , ,
, ,
Abstract
:1. Introduction
2. Materials and Methods
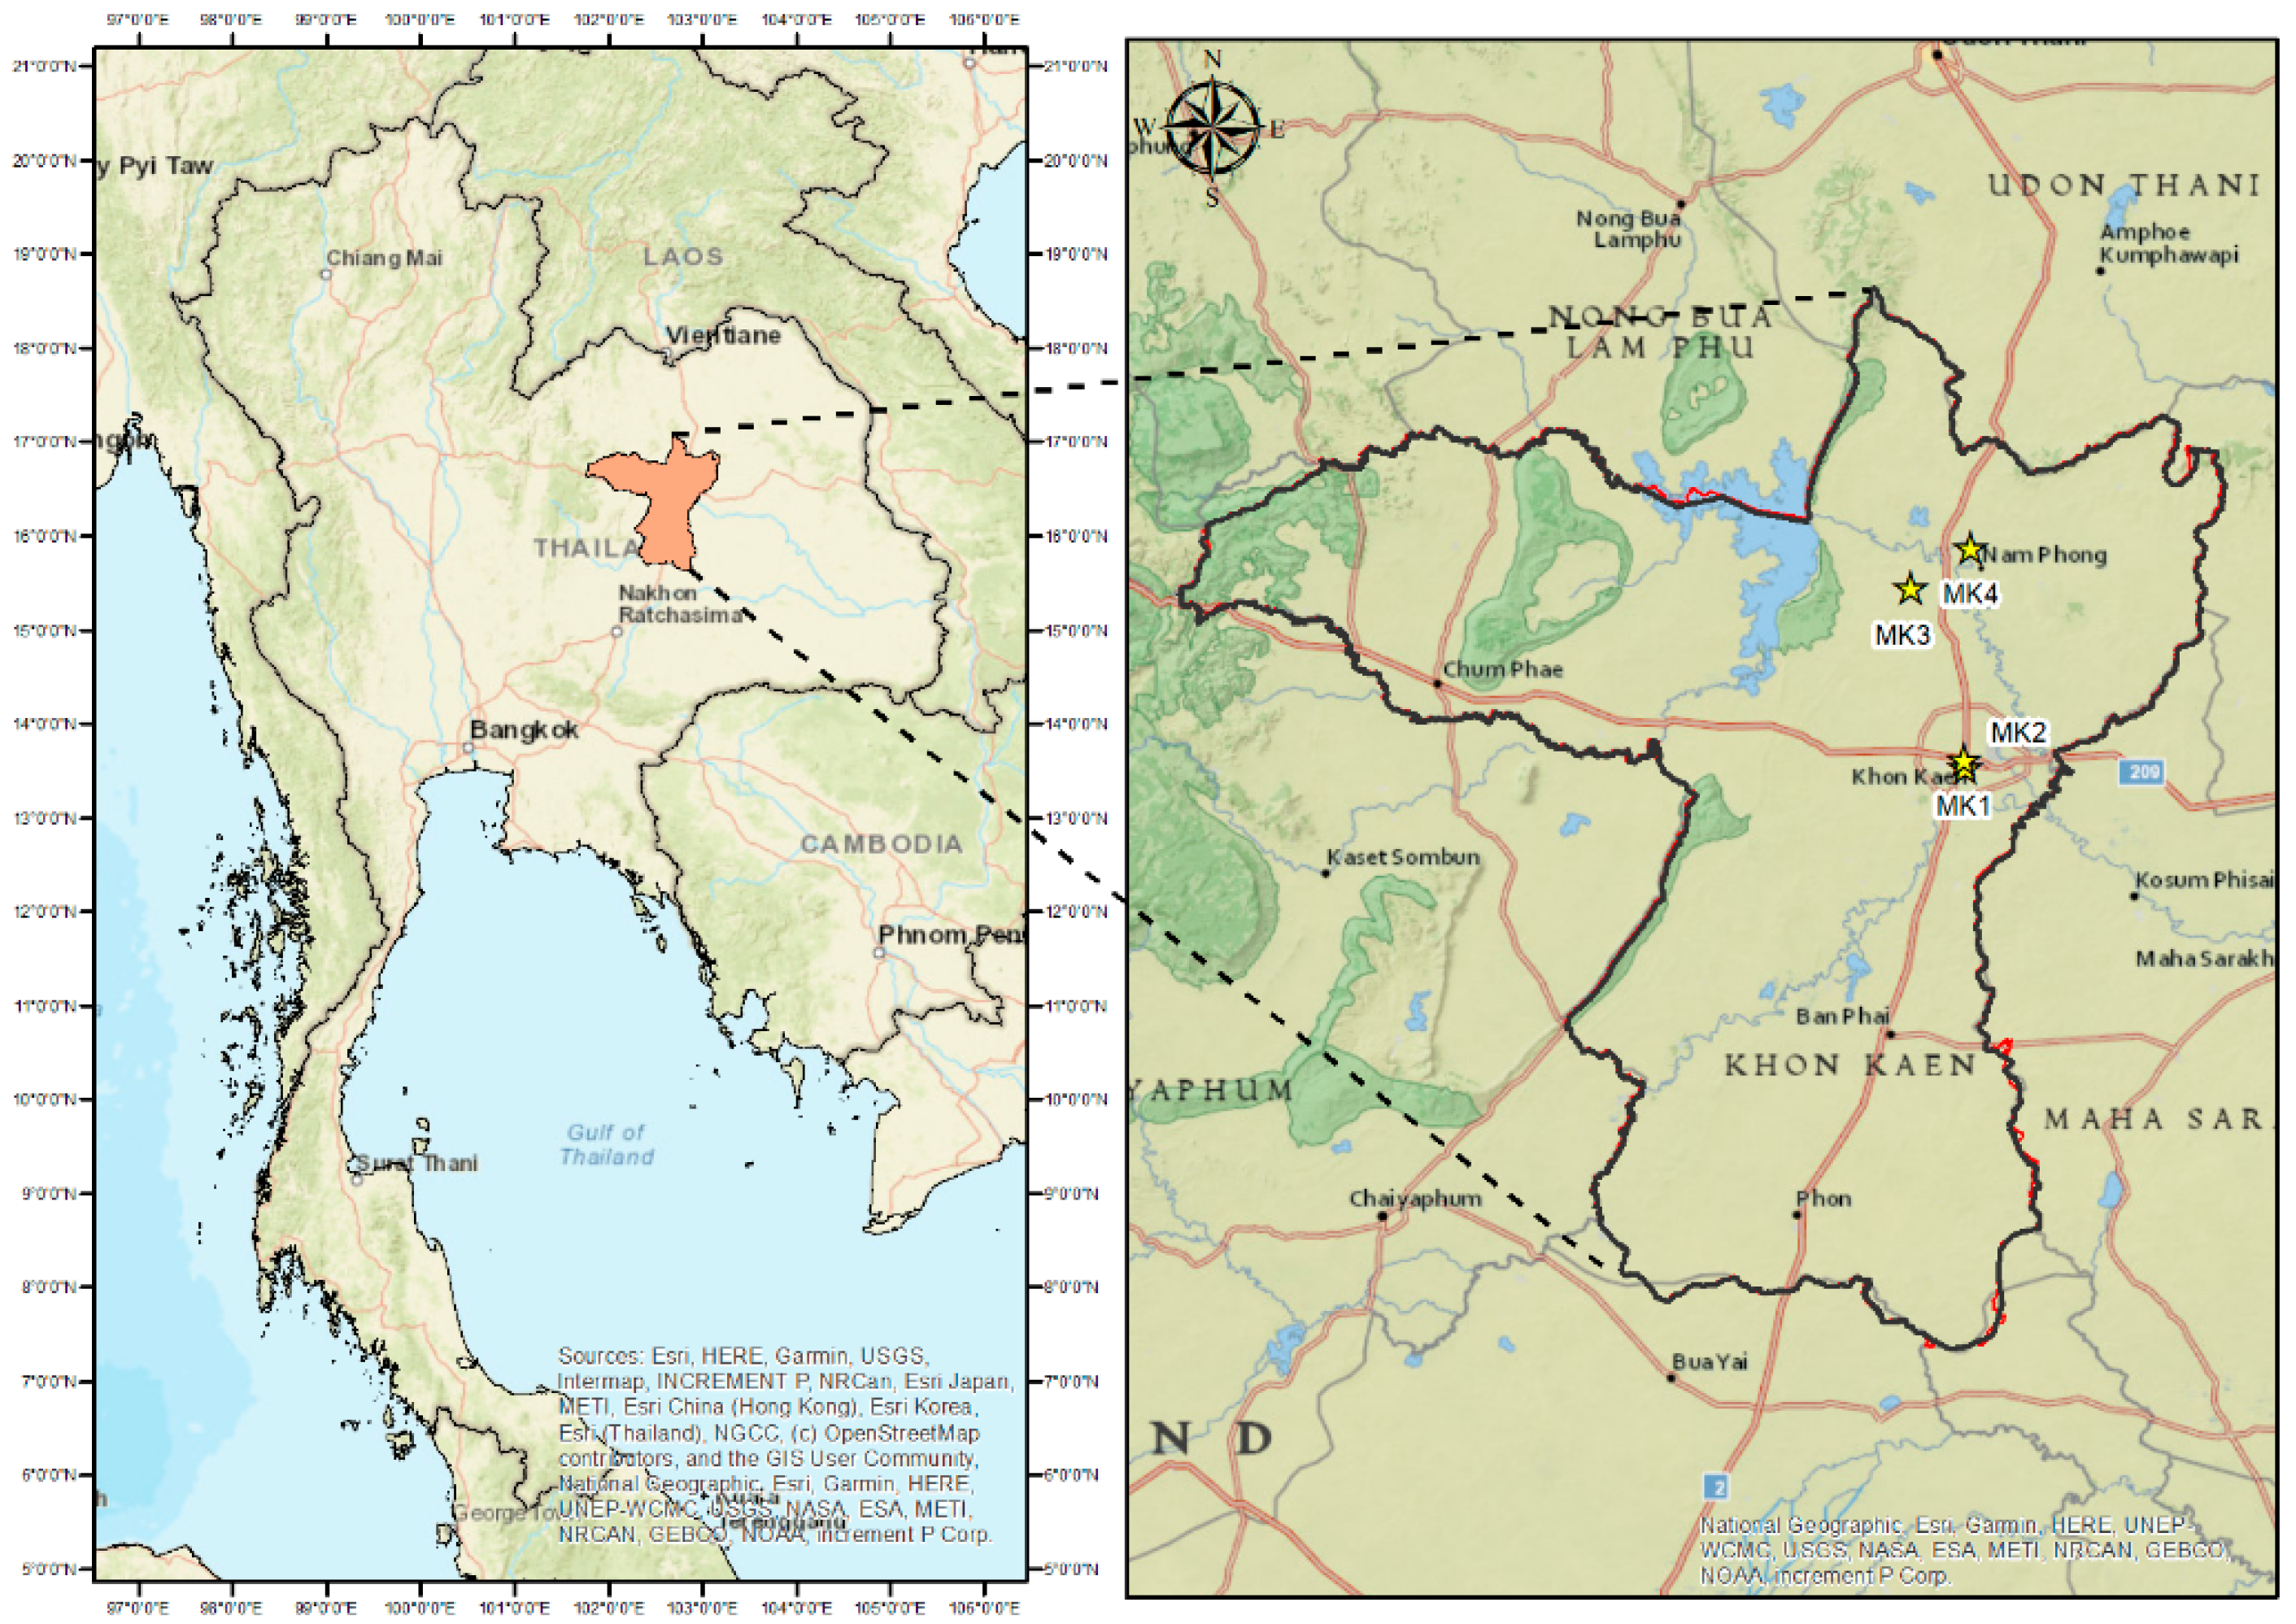
2.1. Monitoring Sites
2.2. Air Sampling and Analysis
2.3. Data Analysis and Quality Control
3. Results and Discussion
3.1. VOC Concentrations in Ambient Air
3.2. Selected Country of Comparison with Other Studies Performed in Asia
3.3. Comparison with Other Studies Performed in Other Continents
4. Conclusions
Author Contributions
Funding
Institutional Review Board Statement
Data Availability Statement
Acknowledgments
Conflicts of Interest
References
- Murray, C.J.L.; Aravkin, A.Y.; Zheng, P.; Abbafati, C.; Abbas, K.M.; Abbasi-Kangevari, M.; Abd-Allah, F.; Abdelalim, A.; Abdollahi, M.; Abdollahpour, I.; et al. Global Burden of 87 Risk Factors in 204 Countries and Territories, 1990-2019: A Systematic Analysis for the Global Burden of Disease Study 2019. Lancet 2020, 396, 1223–1249. [Google Scholar] [CrossRef]
- Fold, N.R.; Allison, M.R.; Wood, B.C.; Thao, P.T.B.; Bonnet, S.; Garivait, S.; Kamens, R.; Pengjan, S. An Assessment of Annual Mortality Attributable to Ambient PM2.5 in Bangkok, Thailand. Int. J. Environ. Res. Public Health 2020, 17, 7298. [Google Scholar] [CrossRef] [PubMed]
- ChooChuay, C.; Pongpiachan, S.; Tipmanee, D.; Suttinun, O.; Deelaman, W.; Wang, Q.; Xing, L.; Li, G.; Han, Y.; Palakun, J.; et al. Impacts of PM2.5 Sources on Variations in Particulate Chemical Compounds in Ambient Air of Bangkok, Thailand. Atmos. Pollut. Res. 2020, 11, 1657–1667. [Google Scholar] [CrossRef]
- Xiang, S.; Liu, J.; Tao, W.; Yi, K.; Xu, J.; Hu, X.; Liu, H.; Wang, Y.; Zhang, Y.; Yang, H.; et al. Control of Both PM2.5 and O3 in Beijing-Tianjin-Hebei and the Surrounding Areas. Atmos. Environ. 2020, 224, 117259. [Google Scholar] [CrossRef]
- Xue, L.K.; Wang, T.; Gao, J.; Ding, A.J.; Zhou, X.H.; Blake, D.R.; Wang, X.F.; Saunders, S.M.; Fan, S.J.; Zuo, H.C.; et al. Ground-Level Ozone in Four Chinese Cities: Precursors, Regional Transport and Heterogeneous Processes. Atmos. Chem. Phys. 2014, 14, 13175–13188. [Google Scholar] [CrossRef] [Green Version]
- Tunsaringkarn, T.; Prueksasit, T.; Morknoy, D.; Semathong, S.; Rungsiyothin, A.; Zapaung, K. Seasonal and Spatial Variation of Ambient Air Volatile Organic Compounds in Pathumwan District, Bangkok, Thailand. J. Health Res. 2015, 29, 135–142. [Google Scholar]
- Algrim, L.B.; Ziemann, P.J. Effect of the Hydroxyl Group on Yields and Composition of Organic Aerosol Formed from OH Radical-Initiated Reactions of Alcohols in the Presence of NOx. ACS Earth Space Chem. 2019, 3, 413–423. [Google Scholar] [CrossRef]
- Holm, S.M.; Balmes, J.R. Systematic Review of Ozone Effects on Human Lung Function, 2013 through 2020. CHEST 2021. [Google Scholar] [CrossRef] [PubMed]
- Rappazzo, K.M.; Nichols, J.L.; Rice, R.B.; Luben, T.J. Ozone Exposure during Early Pregnancy and Preterm Birth: A Systematic Review and Meta-Analysis. Environ. Res. 2021, 198, 111317. [Google Scholar] [CrossRef]
- Sillman, S. The Relation between Ozone, NOx and Hydrocarbons in Urban and Polluted Rural Environments. Atmos. Environ. 1999, 33, 1821–1845. [Google Scholar] [CrossRef]
- Jimenez, J.L.; Canagaratna, M.R.; Donahue, N.M.; Prevot, A.S.H.; Zhang, Q.; Kroll, J.H.; DeCarlo, P.F.; Allan, J.D.; Coe, H.; Ng, N.L.; et al. Evolution of Organic Aerosols in the Atmosphere. Science 2009, 326, 1525–1529. [Google Scholar] [CrossRef]
- Lonati, G.; Giugliano, M.; Butelli, P.; Romele, L.; Tardivo, R. Major Chemical Components of PM2.5 in Milan (Italy). Atmos. Environ. 2005, 39, 1925–1934. [Google Scholar] [CrossRef]
- Turap, Y.; Rekefu, S.; Wang, G.; Talifu, D.; Gao, B.; Aierken, T.; Hao, S.; Wang, X.; Tursun, Y.; Maihemuti, M.; et al. Chemical Characteristics and Source Apportionment of PM2.5 during Winter in the Southern Part of Urumqi, China. Aerosol Air Qual. Res. 2019, 19, 1325–1337. [Google Scholar] [CrossRef] [Green Version]
- Lu, F.; Xu, D.; Cheng, Y.; Dong, S.; Guo, C.; Jiang, X.; Zheng, X. Systematic Review and Meta-Analysis of the Adverse Health Effects of Ambient PM2.5 and PM10 Pollution in the Chinese Population. Environ. Res. 2015, 136, 196–204. [Google Scholar] [CrossRef] [PubMed]
- Li, Z.; Wen, Q.; Zhang, R. Sources, Health Effects and Control Strategies of Indoor Fine Particulate Matter (PM2.5): A Review. Sci. Total Environ. 2017, 586, 610–622. [Google Scholar] [CrossRef] [PubMed]
- Bolden, A.L.; Kwiatkowski, C.F.; Colborn, T. New Look at BTEX: Are Ambient Levels a Problem? Environ. Sci. Technol. 2015, 49, 5261–5276. [Google Scholar] [CrossRef]
- Montero-Montoya, R.; López-Vargas, R.; Arellano-Aguilar, O. Volatile Organic Compounds in Air: Sources, Distribution, Exposure and Associated Illnesses in Children. Ann. Glob. Health 2018, 84, 225–238. [Google Scholar] [CrossRef] [PubMed] [Green Version]
- Hui, L.; Liu, X.; Tan, Q.; Feng, M.; An, J.; Qu, Y.; Zhang, Y.; Deng, Y.; Zhai, R.; Wang, Z. VOC Characteristics, Chemical Reactivity and Sources in Urban Wuhan, Central China. Atmos. Environ. 2020, 224, 117340. [Google Scholar] [CrossRef]
- Fakkaew, N.; Bualert, S.; Thongyen, T.; Rungratanaubon, T. Ozone Formation Potential of Ambient Volatile Organic Compounds at Roadside in Bangkok, Thailand. Appl. Environ. Res. 2021, 43, 14–28. [Google Scholar] [CrossRef]
- Lin, Y.-C.; Chou, F.-C.; Li, Y.-C.; Jhang, S.-R.; Shangdiar, S. Effect of Air Pollutants and Toxic Emissions from Various Mileage of Motorcycles and Aerosol Related Carcinogenicity and Mutagenicity Assessment. J. Hazard. Mater. 2019, 365, 771–777. [Google Scholar] [CrossRef]
- Sahu, L.K.; Tripathi, N.; Yadav, R. Contribution of Biogenic and Photochemical Sources to Ambient VOCs during Winter to Summer Transition at a Semi-Arid Urban Site in India. Environ. Pollut. 2017, 229, 595–606. [Google Scholar] [CrossRef]
- Zheng, C.; Shen, J.; Zhang, Y.; Zhu, X.; Wu, X.; Chen, L.; Gao, X. Atmospheric Emission Characteristics and Control Policies of Anthropogenic VOCs from Industrial Sources in Yangtze River Delta Region, China. Aerosol Air Qual. Res. 2017, 17, 2263–2275. [Google Scholar] [CrossRef]
- Kliengchuay, W.; Worakhunpiset, S.; Limpanont, Y.; Meeyai, A.C.; Tantrakarnapa, K. Influence of the Meteorological Conditions and Some Pollutants on PM10 Concentrations in Lamphun, Thailand. J. Environ. Health Sci. Eng. 2021, 19, 237–249. [Google Scholar] [CrossRef]
- Hosaini, P.-N.; Khan, M.-F.; Musstaffa, I.-H.; Amil, N.; Mohamad, N.; Jaafar, S.-A.; Nadzir, S.-M.; Latif, M.-T. Concentration and source apportionment of volatile organic compounds (VOCs) in the ambient air of Kuala Lumpur, Malaysia. Nat. Hazards 2017, 85, 437–452. [Google Scholar] [CrossRef]
- Pollution Control Department(PCD), Ministry of Natural Resource and Environment. Development of Environmental and Emission Standards of Volatile Organis Compounds (VOCs) in Thailand. Available online: http://infofile.pcd.go.th/air/Report_VOCs.pdf (accessed on 18 October 2021).
- Zhang, L.; Wang, X.; Li, H.; Cheng, N.; Zhang, Y.; Zhang, K.; Li, L. Variations in levels and sources of atmospheric VOCs during the continuous haze and non-haze episodes in the urban area of Beijing: A case study in spring of 2019. Atmoshere 2021, 12, 171. [Google Scholar] [CrossRef]
- Han, L.; Chen, L.; Li, K.; Boa, Z.; Zhao, Y.; Zhang, X.; Azzi, M.; Cen, K. Source apportionment of volatile organic compounds (VOCs) during ozone polluted day in Hangzhou, China. Atmoshere 2019, 10, 780. [Google Scholar] [CrossRef] [Green Version]
- Zhu, Y.; Yang, L.; Chen, J.; Wang, X.; Xue, L.; Sui, X.; Wen, L.; Xu, C.; Yao, L.; Zhang, J.; et al. Characteristics of ambient volatile organic componds and the influence of biomass burning at a ruaral site in North China during summer 2013. Atmos. Environ. 2016, 124, 156–165. [Google Scholar] [CrossRef]
- Hoshi, J.; Amano, S.; Sasaki, Y.; Korenaga, T. Investigation and estimation of emission sources of 54 volatile organic compounds in ambient air in Tokyo. Atmos. Environ. 2008, 42, 2383–2393. [Google Scholar] [CrossRef]
- von Schneidemesser, E.; Monk, P.S.; Plass-Duelmer, C. Global comparison of VOC and CO observation in urban areas. Atmos. Environ. 2010, 44, 5053–5064. [Google Scholar] [CrossRef]
- Warneke, C.; De Gouw, J.A.; Holloway, J.S.; Peischl, J.; Ryerson, T.B.; Atlas, E.; Blake, D.; Trainer, M.; Parrish, D.D. Multiyear trends in volatile organic compounds in Los Angeles, California: Five decades of decreasing emissions. J. Geophys. Res. Atmos. 2012, 117, 1–10. [Google Scholar] [CrossRef]
- Parra, M.A.; Elustondo, D.; Bermejo, R.; Santamaría, J.M. Ambient air levels of volatile organic compounds (VOC) and nitrogen dioxide (NO2) in a medium size city in Northern Spain. Sci. Total Environ. 2009, 407, 999–1009. [Google Scholar] [CrossRef] [PubMed]
- Limi Hanif, N.-M.; Hawari, S.S.; Othman, M.; Abd Hamid, H.-H.; Ahamad, F.; Uning, R.; Gee Ooi, M.-C.; Wahab, I.-A.; Sahani, M.; Latif, M.-T. Ambient volatile organic compounds in tropical environments: Potential sources, composition and impacts—A review. Chemosphere 2021, 285, 131355. [Google Scholar] [CrossRef] [PubMed]
- Xuan, L.; Ma, Y.; Xing, Y.; Meng, Q.; Song, J.; Chen, T.; Wang, H.; Wang, P.; Zhang, Y.; Gao, P. Source, temporal variation and health risk of volatile organic compounds (VOCs) from urban traffic in harbin, China. Environ. Pollut. 2021, 270, 116074. [Google Scholar] [CrossRef]
- Mozaffar, A.; Zhang, Y.-L. Atmoshere volatile organic compounds (VOCs) in China: A Review. Curren Pollut. Rep. 2020, 6, 250–263. [Google Scholar] [CrossRef]
- Liu, N.; Li, X.; Ren, W.; Li, L.; Su, C.; Wang, C. Concentration Characteristics and Photochemical Reactivities of VOCs in Shenyang, China. Atmosphere 2021, 12, 1240. [Google Scholar] [CrossRef]
- Laowagul, W.; Yoshizumi, K. Characteristics of volatile organic compounds with Enforcement of Thai Air Quality Standard in Bankkok, Thailand. Seikatsu Eisei (J. Urban Living Health Assoc.) 2009, 1, 19–32. [Google Scholar] [CrossRef]
- Duffy, B.L.; Nelson, P.F.; Ye, Y.; Weeks, I.A.; Galbally, I.E. Emissions of benzene, toluene, xylene and 1,3-butadiene from a representative portion of the Australian car fleet. Atmos. Environ. 1998, 32, 2693–2704. [Google Scholar] [CrossRef]
- Batterman, S.; Hatzivasilis, G.; Jia, C. Concentrations and emissions of gasoline and other vapors from residential vehicle garages. Atmos. Environ. 2006, 40, 1828–1844. [Google Scholar] [CrossRef]
- Han, X.; Naeher, L.P. A review of traffic-related air pollution exposure assessment studies in the developing world. Environ. Int. 2006, 32, 106–120. [Google Scholar] [CrossRef]
- Na, K. Determination of VOC source signature of vehicle exhaust in a traffic tunnel. J. Environ. Manag. 2006, 81, 392–398. [Google Scholar] [CrossRef]
- Ye, Y.; Galbally, I.E.; Weeks, I.A.; Duffy, B.L.; Nelson, P.F. Evaporation emissions of 1,3-butadiene from petro-fueled motor vehicles. Atmos. Environ. 1998, 32, 2685–2692. [Google Scholar] [CrossRef]
- Tiwari, V.; Hanai, Y.; Masunaga, S. Ambient levels of voltile organic compounds in the vicinity of petrochemical industrial area of Yokohama, Japan. Air Qual. Atmos. Health 2010, 3, 65–75. [Google Scholar] [CrossRef] [PubMed] [Green Version]
- Guan, Y.; Zhang, Y.; Zhang, Y.; Wang, X.; Han, J.; Song, W.; Hou, L.; Duan, E. Pollution Characteristics and key reactive species of volatile organic compounds in Beijing-Tianjin-Hebei area, China. Aerosol Air Qual. Res. 2020, 20, 1886–1897. [Google Scholar] [CrossRef]
- Fanizza, C.; Incoronato, F.; Baiguera, S.; Schiro, R.; Brocco, D. Volatile organic compound levels at one site in Rome urban air. Atmos. Pollut. Res. 2014, 5, 304–314. [Google Scholar] [CrossRef] [Green Version]
- World Health Organization (WHO). Air Quality Guidelines For Europe. Who Regional Publication. European Series; World Health Organization, Regional Office for Europe: Copenhagen, Denmark, 1999. [Google Scholar]
- Ramirez-Gamboa, J.; Paton-Walsh, C.; Galbally, I.; Simmons, J.; Guerette, E.A.; Griffith, A.D.; Chambers, S.D.; Williams, A.G. Seasonal variation of biogenic and anthropogenic VOCs in a semi-urban area near Sydney, Australia. Atmosphere 2021, 12, 47. [Google Scholar] [CrossRef]
- Geddes, J.A.; Murphy, J.G.; Wang, D.K. Long term changes in nitrogen oxides and volatile organic compounds in Toronto and the challenges facing local ozone control. Atmos. Environ. 2009, 43, 3407–3415. [Google Scholar] [CrossRef]
- Barabad, L.M.; Jung, W.; Versoza, M.E.; Lee, Y.I.; Choi, K.; Park, D. Characteristics of particulate matter and volatile organic compound emissions from the combustion of waste vinyl. Int. J. Environ. Res. Public Health 2018, 15, 1390. [Google Scholar] [CrossRef] [Green Version]
- Debevec, C.; Sauvage, S.; Gros, V.; Sciare, J.; Pikridas, M.; Stavroulas, I. Origin and variability in volatile organic compounds observed at an Eastern Mediterranean background site (Cyprus). Atmosperic Chem. Phys. 2017, 17, 11355–11388. [Google Scholar] [CrossRef] [Green Version]
- Ghilarducci, D.P.; Tjeerdema, R.S. Fate and Effects of Acrolein. In Reviews of Environmental Contamination and Toxicology: Continuation of Residue Reviews; Ware, G.W., Ed.; Springer: New York, NY, USA, 1995; pp. 95–146. ISBN 978-1-4612-2550-8. [Google Scholar]
- Zirak, M.R.; Mehri, S.; Karimani, A.; Zeinali, M.; Hayes, A.W.; Karimi, G. Mechanisms behind the Atherothrombotic Effects of Acrolein, a Review. Food Chem. Toxicol. 2019, 129, 38–53. [Google Scholar] [CrossRef]
- Schieweck, A. Very Volatile Organic Compounds (VVOC) as Emissions from Wooden Materials and in Indoor Air of New Prefabricated Wooden Houses. Build. Environ. 2021, 190, 107537. [Google Scholar] [CrossRef]
- Ruprecht, A.A.; de Marco, C.; Saffari, A.; Pozzi, P.; Mazza, R.; Veronese, C.; Angellotti, G.; Munarini, E.; Ogliari, A.C.; Westerdahl, D.; et al. Environmental Pollution and Emission Factors of Electronic Cigarettes, Heat-Not-Burn Tobacco Products, and Conventional Cigarettes. Aerosol Sci. Technol. 2017, 51, 674–684. [Google Scholar] [CrossRef]
- Destaillats, H.; Spaulding, R.S.; Charles, M.J. Ambient Air Measurement of Acrolein and Other Carbonyls at the Oakland-San Francisco Bay Bridge Toll Plaza. Environ. Sci. Technol. 2002, 36, 2227–2235. [Google Scholar] [CrossRef]
- Seaman, V.Y.; Bennett, D.H.; Cahill, T.M. Origin, Occurrence, and Source Emission Rate of Acrolein in Residential Indoor Air. Environ. Sci. Technol. 2007, 41, 6940–6946. [Google Scholar] [CrossRef] [PubMed]
- Seaman, V.Y.; Bennett, D.H.; Cahill, T.M. Indoor Acrolein Emission and Decay Rates Resulting from Domestic Cooking Events. Atmos. Environ. 2009, 43, 6199–6204. [Google Scholar] [CrossRef]
- Liu, X.; Jeffries, H.E.; Sexton, K.G. Hydroxyl Radical and Ozone Initiated Photochemical Reactions of 1,3-Butadiene. Atmos. Environ. 1999, 33, 3005–3022. [Google Scholar] [CrossRef]
- Schieweck, A.; Uhde, E.; Salthammer, T. Determination of Acrolein in Ambient Air and in the Atmosphere of Environmental Test Chambers. Environ. Sci. Process. Impacts 2021, 23, 1729–1746. [Google Scholar] [CrossRef]

| Continent | Country | Sampling Site | Ambient Collection Methods | Techniques of VOC Analyzer Used | Number of Measured VOC | Reference |
|---|---|---|---|---|---|---|
| Asia | Malaysia | Urban | Tedlar air sampling bags with an air pump | GC-MS | 17 | [24] |
| Beijing, China | Urban | - | Airmo VOC online analyzer (GC-866) | 59 | [26] | |
| Hangzhou, China | Urban | Silica SUMMA canisters | GC-MS | 107 | [27] | |
| Dezhou, China | Rural | Stainless steel canisters | GC-MSD/FID | 58 | [28] | |
| Tokyo | Urban | Fused-silica-lined canister | GC-MS | 18 | [29] | |
| Khon Kaen, Thailand | Urban + Rural | Passive canister sampler | GC-FID | 19 | This study | |
| Europe | London, UK | Urban | - | GC-MS | 54 | [30] |
| North America | Los Angeles, USA | Urban | - | PTR-MS, GC-MS | 26 | [31] |
| Pollutant | Khon Kaen Monitoring Station | Urban Market | Rural Industrial | Rural Power Generation |
|---|---|---|---|---|
| Acetaldehyde | NM | 12.30 | 7.79 | 11.07 |
| Acrylonitrile | ND | <0.22 | <0.22 | ND |
| Benzene | 1.2 | 2.75 | 1.85 | 1.73 |
| Benzyl chloride | ND | ND | ND | ND |
| 1,3- Butadiene | ND | 0.40 | 0.18 | 0.18 |
| Bromomethane | ND | 0.54 | 0.47 | 0.54 |
| Carbon tetrachloride | 0.19 | <0.31 | <0.31 | <0.31 |
| Chloroform | 0.05 | <0.24 | <0.24 | ND |
| 1,2-Dibromoethane | ND | ND | ND | ND |
| 1,4-Dichlorobenzene | ND | ND | ND | ND |
| 1,2-Dichloroethane | 0.22 | 0.24 | 0.24 | 0.24 |
| Dichloromethane | 1.10 | 0.49 | 0.49 | 0.42 |
| 1,2-Dichloropropane | ND | 0.28 | 0.46 | <0.23 |
| 1,4-Dioxane | NM | ND | <0.36 | ND |
| 2-Propenal/acrolein | NM | 1.15 | 0.82 | 0.69 |
| Tetrachloroethylene | ND | ND | ND | ND |
| 1,1,2,2-Tetrachloroethane | ND | ND | ND | ND |
| Trichloroethylene | ND | ND | ND | ND |
| Vinyl chloride | ND | <0.13 | <0.13 | ND |
| Pollutant | 24 h Average Standard (μg/m3) | 1-Year Average Standard (μg/m3) | Exceeded 1 |
|---|---|---|---|
| Acetaldehyde | 860 | n/a | |
| Acrylonitrile | 10 | n/a | |
| Benzene | 7.6 | 1.7 | * |
| Benzyl chloride | 12 | n/a | |
| 1,3-Butadiene | 5.3 | 0.33 | * |
| Bromomethane | 190 | n/a | |
| Carbon tetrachloride | 150 | n/a | |
| Chloroform | 57 | 0.43 | |
| 1,2-Dibromoethane | 370 | n/a | |
| 1,4-Dichlorobenzene | 1100 | n/a | |
| 1,2-Dichloroethane | 48 | 0.4 | |
| Dichloromethane | 210 | 22 | |
| 1,2-Dichloropropane | 82 | 4 | |
| 1,4-Dioxane | 860 | n/a | |
| 2-Propenal/acrolein | 0.55 | n/a | ** |
| Tetrachloroethylene | 400 | 200 | |
| 1,1,2,2-Tetrachloroethane | 83 | n/a | |
| Trichloroethylene | 130 | 23 | |
| Vinyl chloride | 20 | 10 |
| Kuala Lumpur, Malaysia [24] | 24-h Average (ppbv) a | Beijing, China [26] | 24-h Average (μg/m3) b | Bangkok, Thailand [37] | 24-h Average (μg/m3) c | Yokohama, Japan [43] | 24-h Average (μg/m3) d |
|---|---|---|---|---|---|---|---|
| Methylene chloride | 295 ± 267 | Acetylene | 3.91 ± 2.65 | Benzene | 8.8 c/3.9 d | Benzene | 2.1 ± 2.7 I/0.7 ± 0.6 C |
| 1,2,4-Trimethylbenzene | 169 ± 103 | Benzene | 4.18 ± 2.17 | 1,3-Butadiene | 0.51 c/0.17 d | Toluene | 5.2 ± 5.7 I/2.2 ± 1.4 C |
| Toluene | 153 ± 83.2 | Toluene | 3.17 ± 2.62 | Chloroform | 0.16 c/0.15 d | Ethylbenzene | 2.9 ± 3.7 I/0.5 ± 0.3 C |
| Methyl methacrylate | 96.5 ± 69.0 | Ethylbenzene | 0.56 ± 0.54 | Dichloromethane | 1.4 c/2.6 d | m,p-Xylene | 2.1 ± 2.3 I/0.6 ± 0.4 C |
| 2-Butanone | 91.5 ± 71.1 | m-Xylene + p-Xylene | 0.59 ± 0.45 | 1,2-Dichloroethane | 0.04 c/0.05 d | o-Xylene | 0.7 ± 0.5 I/0.3 ± 0.2 C |
| Allyl chloride | 74.3 ± 134 | Styrene | 0.62 ± 0.60 | 1,2-Dichloropropane | 0.21 c/0.16 d | m-Ethyltoluene | 0.2 ± 0.1 I/0.2 ± 0.1 C |
| n-Butylbenzene | 54.6 ± 82.9 | o-Xylene | 0.01 ± 0.02 | Tetrachloroethylene | 0.25 c/0.18 d | p-Ethyltoluene | 0.2 ± 0.1 I/0.2 ± 0.1 C |
| Styrene | 51.8 ± 57.6 | i-Propylbenzene | 0.01 ± 0.01 | Trichloroethylene | 0.37 c/0.41 d | o-ethyltoluene | 0.1 ± 0.1 I/0.1 ± 0.1 C |
| p-Xylene | 49.4 ± 29.0 | n-Propylbenzene | 0.34 ± 0.30 | Vinyl chloride | 0.41 c/0.18 d | 1,3,5-Trimethylbenzene | 0.1 ± 0.1 I/0.1 ± 0.1 C |
| 1,3-Dichlorobenzene | 40.5 ± 53.4 | m-Ethyltoluene | 0.04 ± 0.05 | 1,2,4-Trimethylbenzene | 0.3 ± 0.3 I/0.3 ± 0.2 C | ||
| Ethylbenzene | 39.8 ± 39.3 | p-Ethyltoluene | 0.09 ± 0.13 | Trichloroethylene | 0.1 ± 0.1 I/0.1 ± 0.1 C | ||
| n-Propylbenzene | 29.6 ± 38.9 | 1,3,5-Trimethylbenzene | 0.01 ± 0.02 | Tetrachloroethylene | 0.1 ± 0.02 I/0.04 ± 0.03 C | ||
| Benzene | 21.0 ± 15.3 | o-ethyltoluene | 0.11 ± 0.12 | p-Dichlorobenzene | 0.1 ± 0.1 I/0.1 ± 0.1 C | ||
| 1-Chloro-2-methylbenzene | 20.3 ± 32.2 | 1,2,4-Trimethylbenzene | 0.38 ± 0.34 | ||||
| 1,4-Dichlorobenzene | 19.0 ± 41.4 | 1,2,3-Trimethylbenzene | 0.08 ± 0.05 | ||||
| 2-Chlorotoluene | 5.1 ± 10.0 | m-Diethylbenzene | 0.02 ± 0.05 | ||||
| sec-Butylbenzene | 3.2 ± 3.3 | p-Diethylbenzene Naphtalene | 0.03 ± 0.05 0.00 ± 0.00 |
| Rome, Italy [45] | Average (μg/m3) a | Cyprus [50] | 24 h Average (μg/m3) b | Spain [32] | 24 h Average (μg/m3) c |
|---|---|---|---|---|---|
| Benzene | 3.29 ± 1.61 | Ethane | 3.05 | Benzene | 1.33 ± 0.38 s/1.82 ± 1.59 w |
| Toluene | 10.58 ± 8.58 | Ethylene | 0.35 | Toluene | 8.74 ± 3.20 s/12.02 ± 2.73 w |
| Ethyl benzene | 0.43 ± 0.37 | Propane | 2.20 | Tetrachloroethene | 0.43 ± 0.21 s/0.45 ± 0.16 w |
| m,p-Xylene | 6.03 ± 5.04 | Propene | 0.19 | Ethylbenzene | 1.30 ± 0.44 s/1.69 ± 0.50 w |
| o-Xylene | 0.56 ± 0.49 | i-Butane | 0.32 | m,p-Xylene | 2.47 ± 0.95 s/2.65 ± 0.64 w |
| 1,3,5-Trimethylbenzene | 0.44 ± 0.41 | n-Butane | 0.54 | o-Xylene | 1.71 ± 0.60 s/1.52 ± 0.29 w |
| 1,2,4-Trimethylbenzene | 0.25 ± 0.22 | Acetylene | 0.71 | i-Propylbenzene | 0.19 ± 0.05 s/1.01 ± 0.93 w |
| i-Pentane | 0.25 | Bromobenzene | 10.96 ± 2.68 s/1.91 ± 2.15 w | ||
| n-Pentane | 0.21 | Propylbenzene | 0.23 ± 0.07 s/0.73 ± 0.35 w | ||
| Benzene | 0.37 | 1,3,5-Trimethylbenzene | 1.67 ± 0.25 s/1.04 ± 0.54 w | ||
| Toluene | 0.19 | Naphtalene | 0.18 ± 0.15 s/0.11 ± 0.02 w | ||
| Isoprene | 0.13 | ||||
| α-Pinene | 0.33 | ||||
| β-Pinene | 0.34 | ||||
| Monoterpenes | 1.34 | ||||
| Methanol | 3.84 | ||||
| Acetaldehyde Acetone | 0.83 2.72 |
Publisher’s Note: MDPI stays neutral with regard to jurisdictional claims in published maps and institutional affiliations. |
© 2021 by the authors. Licensee MDPI, Basel, Switzerland. This article is an open access article distributed under the terms and conditions of the Creative Commons Attribution (CC BY) license (https://creativecommons.org/licenses/by/4.0/).
Share and Cite
Sakunkoo, P.; Phonphinyo, S.; Maneenin, N.; Jirapornkul, C.; Limmongkon, Y.; Rayubkul, J.; Thongtip, S.; Sangkham, S. Comparison of Volatile Organic Compound Concentrations in Ambient Air among Different Source Areas around Khon Kaen, Thailand. Atmosphere 2021, 12, 1694. https://doi.org/10.3390/atmos12121694
Sakunkoo P, Phonphinyo S, Maneenin N, Jirapornkul C, Limmongkon Y, Rayubkul J, Thongtip S, Sangkham S. Comparison of Volatile Organic Compound Concentrations in Ambient Air among Different Source Areas around Khon Kaen, Thailand. Atmosphere. 2021; 12(12):1694. https://doi.org/10.3390/atmos12121694
Chicago/Turabian StyleSakunkoo, Pornpun, Saksit Phonphinyo, Naowarat Maneenin, Chananya Jirapornkul, Yuparat Limmongkon, Jetnapis Rayubkul, Sakesun Thongtip, and Sarawut Sangkham. 2021. "Comparison of Volatile Organic Compound Concentrations in Ambient Air among Different Source Areas around Khon Kaen, Thailand" Atmosphere 12, no. 12: 1694. https://doi.org/10.3390/atmos12121694
APA StyleSakunkoo, P., Phonphinyo, S., Maneenin, N., Jirapornkul, C., Limmongkon, Y., Rayubkul, J., Thongtip, S., & Sangkham, S. (2021). Comparison of Volatile Organic Compound Concentrations in Ambient Air among Different Source Areas around Khon Kaen, Thailand. Atmosphere, 12(12), 1694. https://doi.org/10.3390/atmos12121694