Article

Effects of Rock Powder Additions to Cattle Slurry on Ammonia and Greenhouse Gas Emissions

1
Center for Development Research, University of Bonn, Genscherallee 3, 53113 Bonn, Germany
2
International Centre for Sustainable Development, Bonn-Rhein-Sieg University of Applied Sciences, Granthamallee 20, 53757 Sankt Augustin, Germany
3
Faculty of Agriculture, Institute of Crop Science and Resource Conservation, University of Bonn, Auf dem Hügel 6, 53121 Bonn, Germany
4
Institute of Agricultural Engineering, University of Bonn, Nussallee 5, 53115 Bonn, Germany
*
Author to whom correspondence should be addressed.
Atmosphere 2021, 12(12), 1652; https://doi.org/10.3390/atmos12121652
Submission received: 10 November 2021 / Revised: 4 December 2021 / Accepted: 7 December 2021 / Published: 9 December 2021

Abstract

:
For several decades, farmers have been mixing rock powders with livestock slurry to reduce its NH3 emissions and increase its nutrient content. However, mixing rock powders with slurry is controversial, and there is currently no scientific evidence for its effects on NH3 and greenhouse gas (GHG) emissions or on changes in its nutrient content due to element release from rock powders. The major aim of this study was therefore to analyse the effects of mixing two commercially established rock powders with cattle slurry on NH3, CO2, N2O and CH4 emissions, and on nutrient release over a course of 46 days. We found that rock powders did not significantly affect CO2 emission rates. NH3 and N2O emission rates did not differ significantly up until the end of the trial, when the emission rates of the rock powder treatments significantly increased for NH3 and significantly decreased for N2O, respectively, which coincided with a reduction of the slurry crust. Cumulative NH3 emissions did not, however, differ significantly between treatments. Unexpected and significant increases in CH4 emission rates occurred for the rock powder treatments. Rock powders increased the macro- and micronutrient content of the slurry. The conflicting results are discussed and future research directions are proposed.

1. Introduction

The livestock sector is a major source of ammonia (NH3) and greenhouse gas (GHG) emissions. Of the total agricultural emissions in the EU in 2017, livestock slurry management contributed the biggest share of the total ammonia (NH3) emissions and around 8% of total methane (CH4) and nitrous oxide (N2O) emissions [1,2]. There is ample evidence of the negative consequences of accumulating GHG emissions in the atmosphere [3,4], whereas NH3 emissions can cause atmospheric deposition of nitrogen (N) resulting in the eutrophication of ecosystems, soil acidification and fine particulate air pollution [5,6,7]. The annual cost of NH3 emissions in the EU are estimated to be USD 18–140 billion, mostly from increased mortality associated with aerosols [8]. There are thus several policies in place to substantially reduce GHG and NH3 emissions from livestock management.
For several decades, numerous methods have been suggested and tested to reduce NH3 emissions from livestock slurry, which can account for losses of up to 90% of the ammonium NH4+-N in the slurry [9]. One suggested method is the addition of nitrogen-adsorbing materials (minerals, charcoal, peat moss etc.) to the slurry [10]. The underlying hypothesis is that the NH4+ in the slurry is adsorbed on the negative charged particle surface of the materials and thereby reduces NH3 volatilization through a decreased concentration of free NH4+. There is evidence for reduced NH3 emissions when mixing various NH4+ binders to slurry, although their agronomic effectiveness is often questionable [10]. Among the potential NH4+ binders are various rock powders [11,12], which have been used by farmers in Germany, Austria and Switzerland for several decades. Besides a reduction of slurry NH3 emissions, providers of rock powders (https://www.biolit-natur.com/de/biolit-story.html, https://www.actimin.nl/ and https://www.schicker-mineral.de/landwirtschaft-accessed on 8 May 2021) claim that their products increase the nutrient content and decrease the floating crust, although no single peer-reviewed study was found that measured such effects.
A limited number of studies measured effects of rock powders mixed with solid livestock manure, with contradictory evidence. The authors of [13,14] reported reduced NH3 emissions of solid cattle manure mixed with rock powders whereas [15] found that mixing basalt with poultry manure slightly increased NH3, which was linked to the basalt-induced pH increase of the manure. Both [11,16] reported retarded NH3 emissions when rock powders were mixed with poultry manure, which did not significantly differ from each other at the end of the experiments. Most of the trials, however, did not measure GHG emissions, which is a common drawback of studies analysing the emission reduction potential of abatement options [17].
Irrespective of the potential to reduce NH3 emission from livestock manure, rock powders are gaining increased agronomic attention since they contain several macro- and micronutrients essential for plant growth and have thus been proposed as low-cost soil amendment [18,19]. This is particularly the case for highly weathered soils in tropical countries, where classical NPK fertilizers are often not affordable or accessible [20,21,22]. Importantly, such tropical soils are depleted in macro- and micronutrients, an escalating agronomic gap which neither classical NPK fertilizers nor liming can currently sufficiently address [23]. In tropical environments, rock powders could play an important role for sustainable agriculture, underpinned by accumulating evidence of their significant effects [19,24,25]. Also, there is a longstanding use of rock powders in organic agriculture and its ongoing expansion increases the demand of suitable nutrient sources that meet the organic grower’s criteria [26]. Moreover, rock powders arise in massive quantities as a problematic by-product of the global mining industry, with estimated igneous quarry fines (<0.063 mm) of 3.3 billion tons per year [27]. Their agricultural recycling could help to resolve a serious disposal challenge and thus promote a circular economy [28]. Particular interest stems from their multi-faceted potential as ‘development minerals’, since domestic re-use and manufacturing of rock waste could have a major impact on the structural economic transformation and poverty alleviation of developing countries [18,29].
However, overall results are contradictory since the central process, rock weathering, is a complex interplay of several factors such as rock type, soil type and plant species [30]. A major limitation of rock powders is their low solubility, which can however be improved by various treatments, among which the mixture with cattle dung and legume straw showed to significantly increase nutrient release [31]. The nutrients from rock powders can be released through organic acids that are produced during organic matter decomposition [31], and also by direct microbiological attack [32,33]. Livestock slurry contains both organic acids and microorganisms [34], and could thus equally enhance rock powder nutrient release. Again, we could not find a single peer-reviewed study that analysed potential effects on nutrient release of rock powders mixed with livestock slurry.
Overall, there are several reasons for examining the effects of rock powder additions to livestock slurry. The claim that rock powders reduce the NH3 emissions of livestock slurry is theoretically possible and contradictory evidence exists for livestock solid manure [11,13,14,16]. Effects on other GHG emissions were not, however, considered before by most of these studies and must be equally addressed. Additionally, enhancing the nutrient release from rock powders via organic materials bears significant potential to improve their agronomic efficiency and would be practical across various farm scales and regions. Finally, a joint analysis of emissions and rock powder nutrient release will likely yield important biogeochemical insights.
The aim of this study was therefore to measure the effects of mixing two commercially available rock powders to cattle slurry on NH3, CO2, CH4 and N2O emissions, and to analyze the nutrient release from the rock powders. Finally, we discuss the usage of rock powders as slurry treatment and recommend future research directions.

2. Materials and Methods

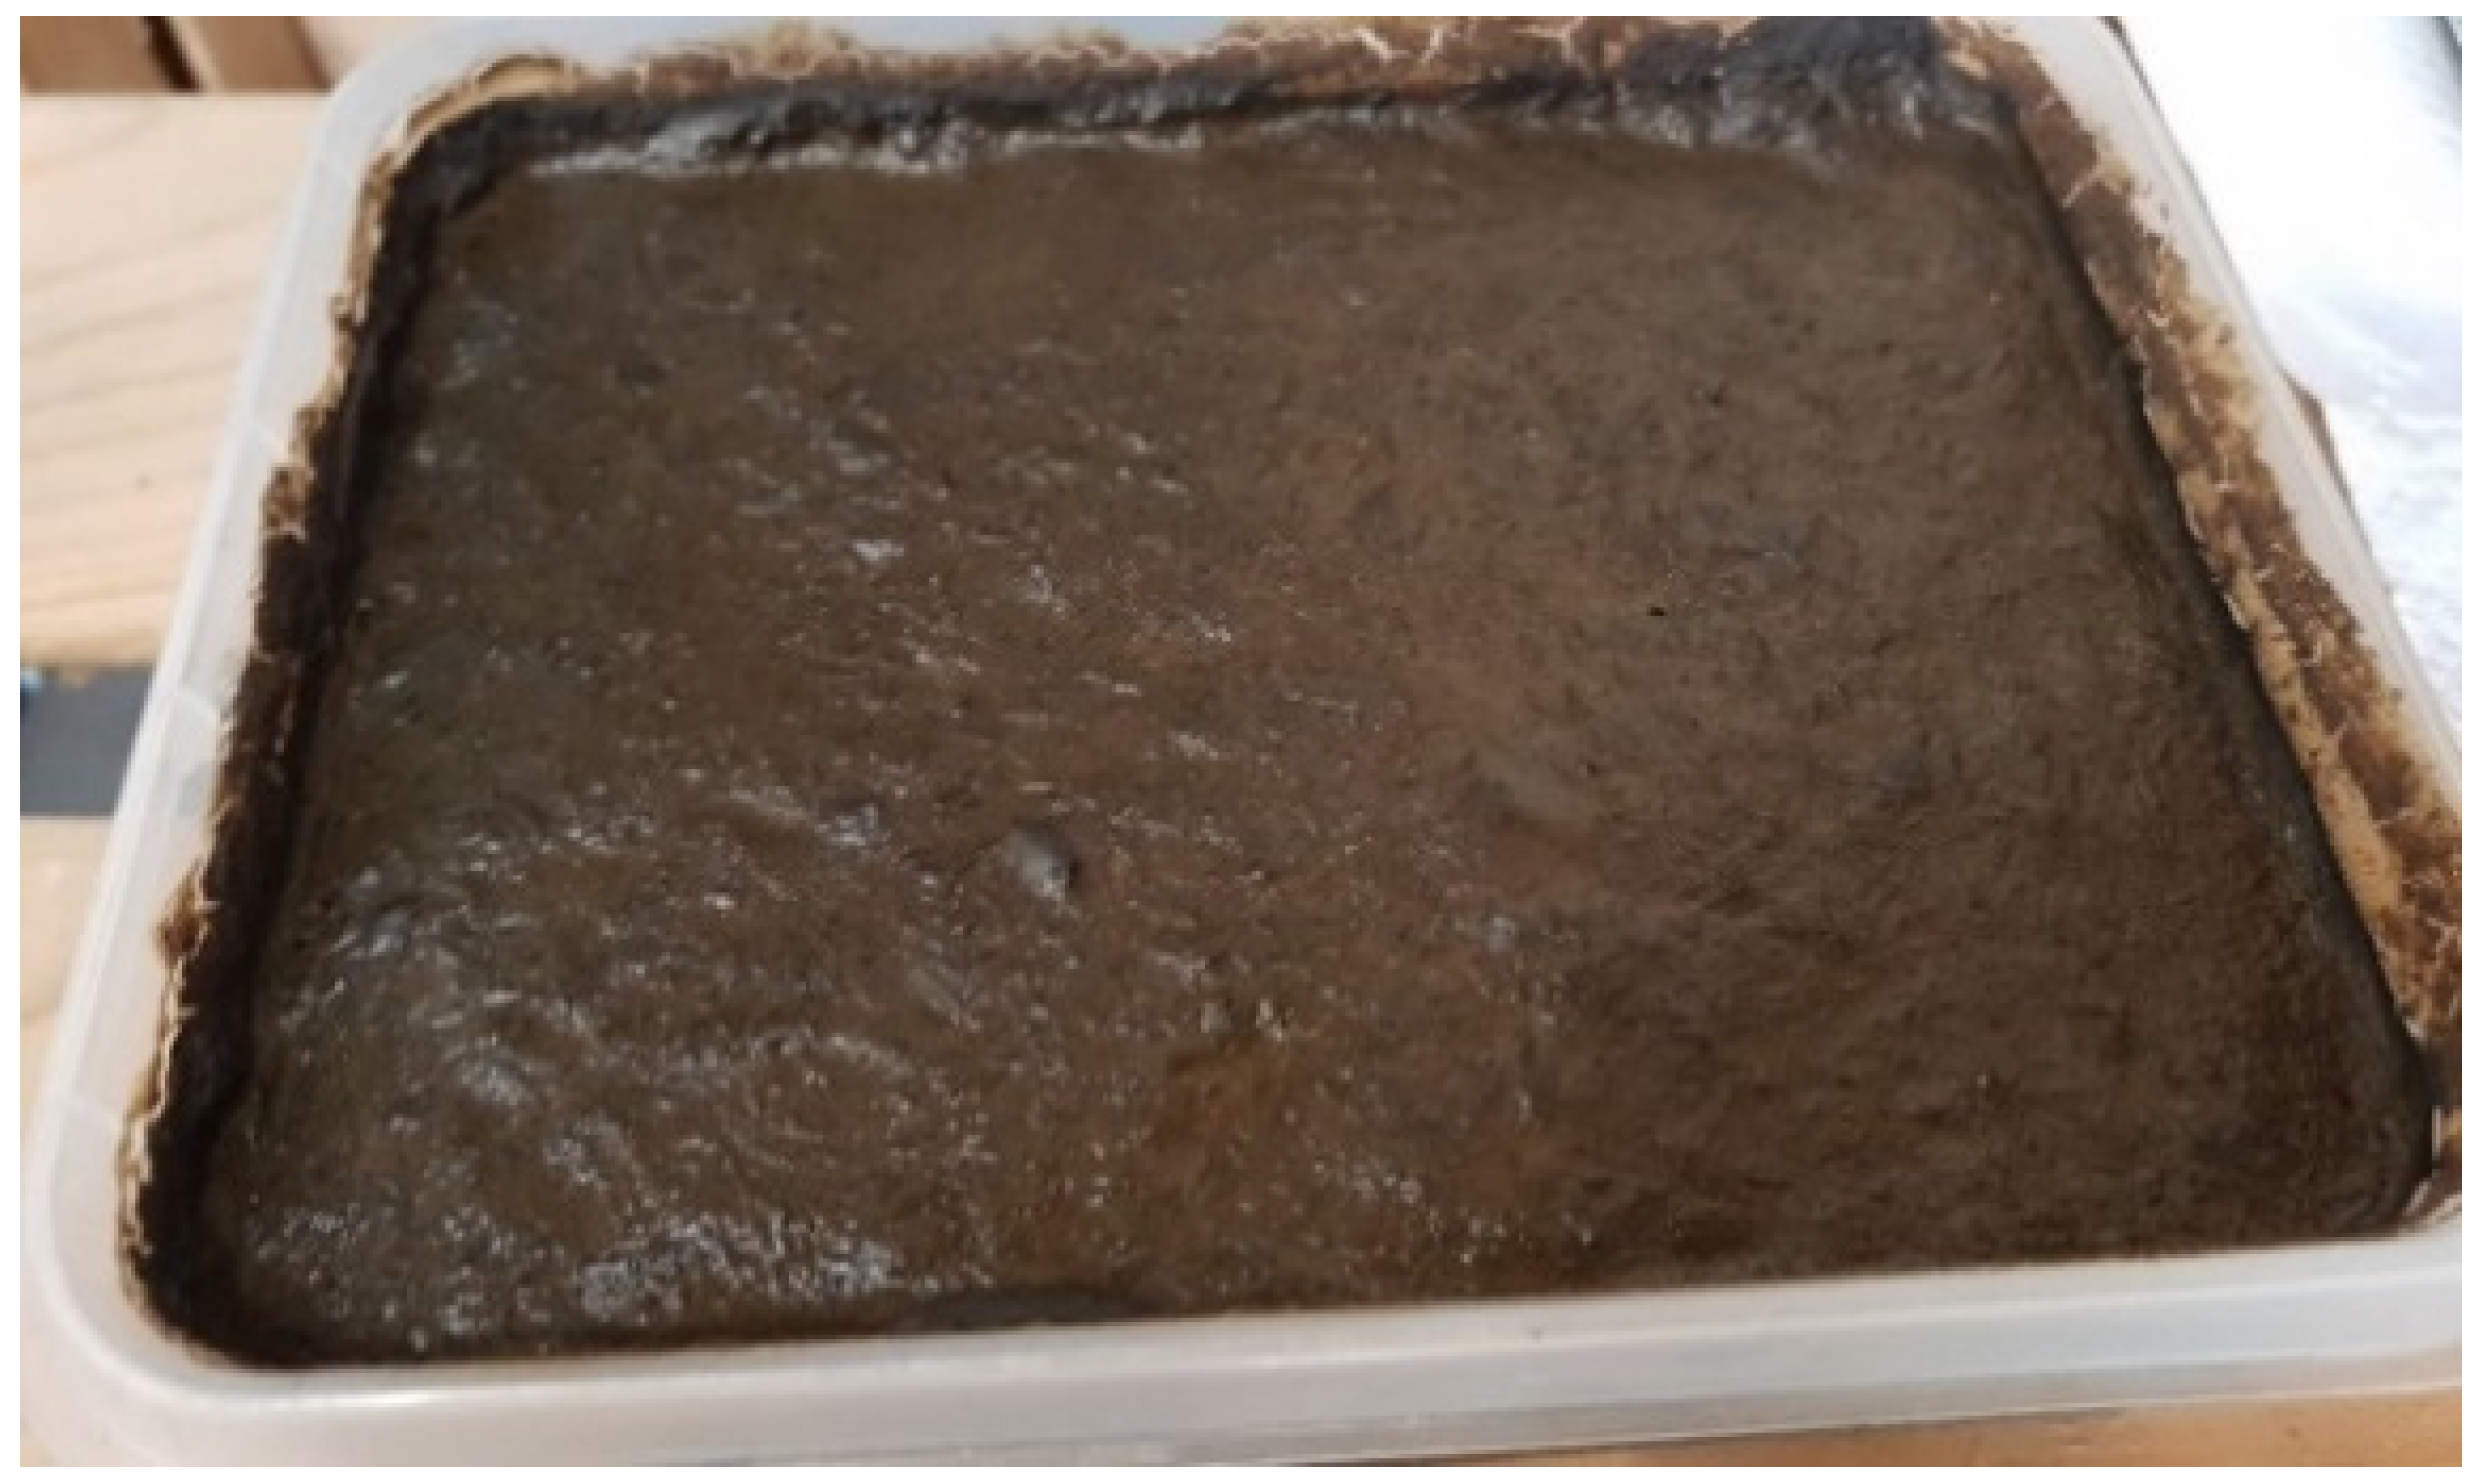
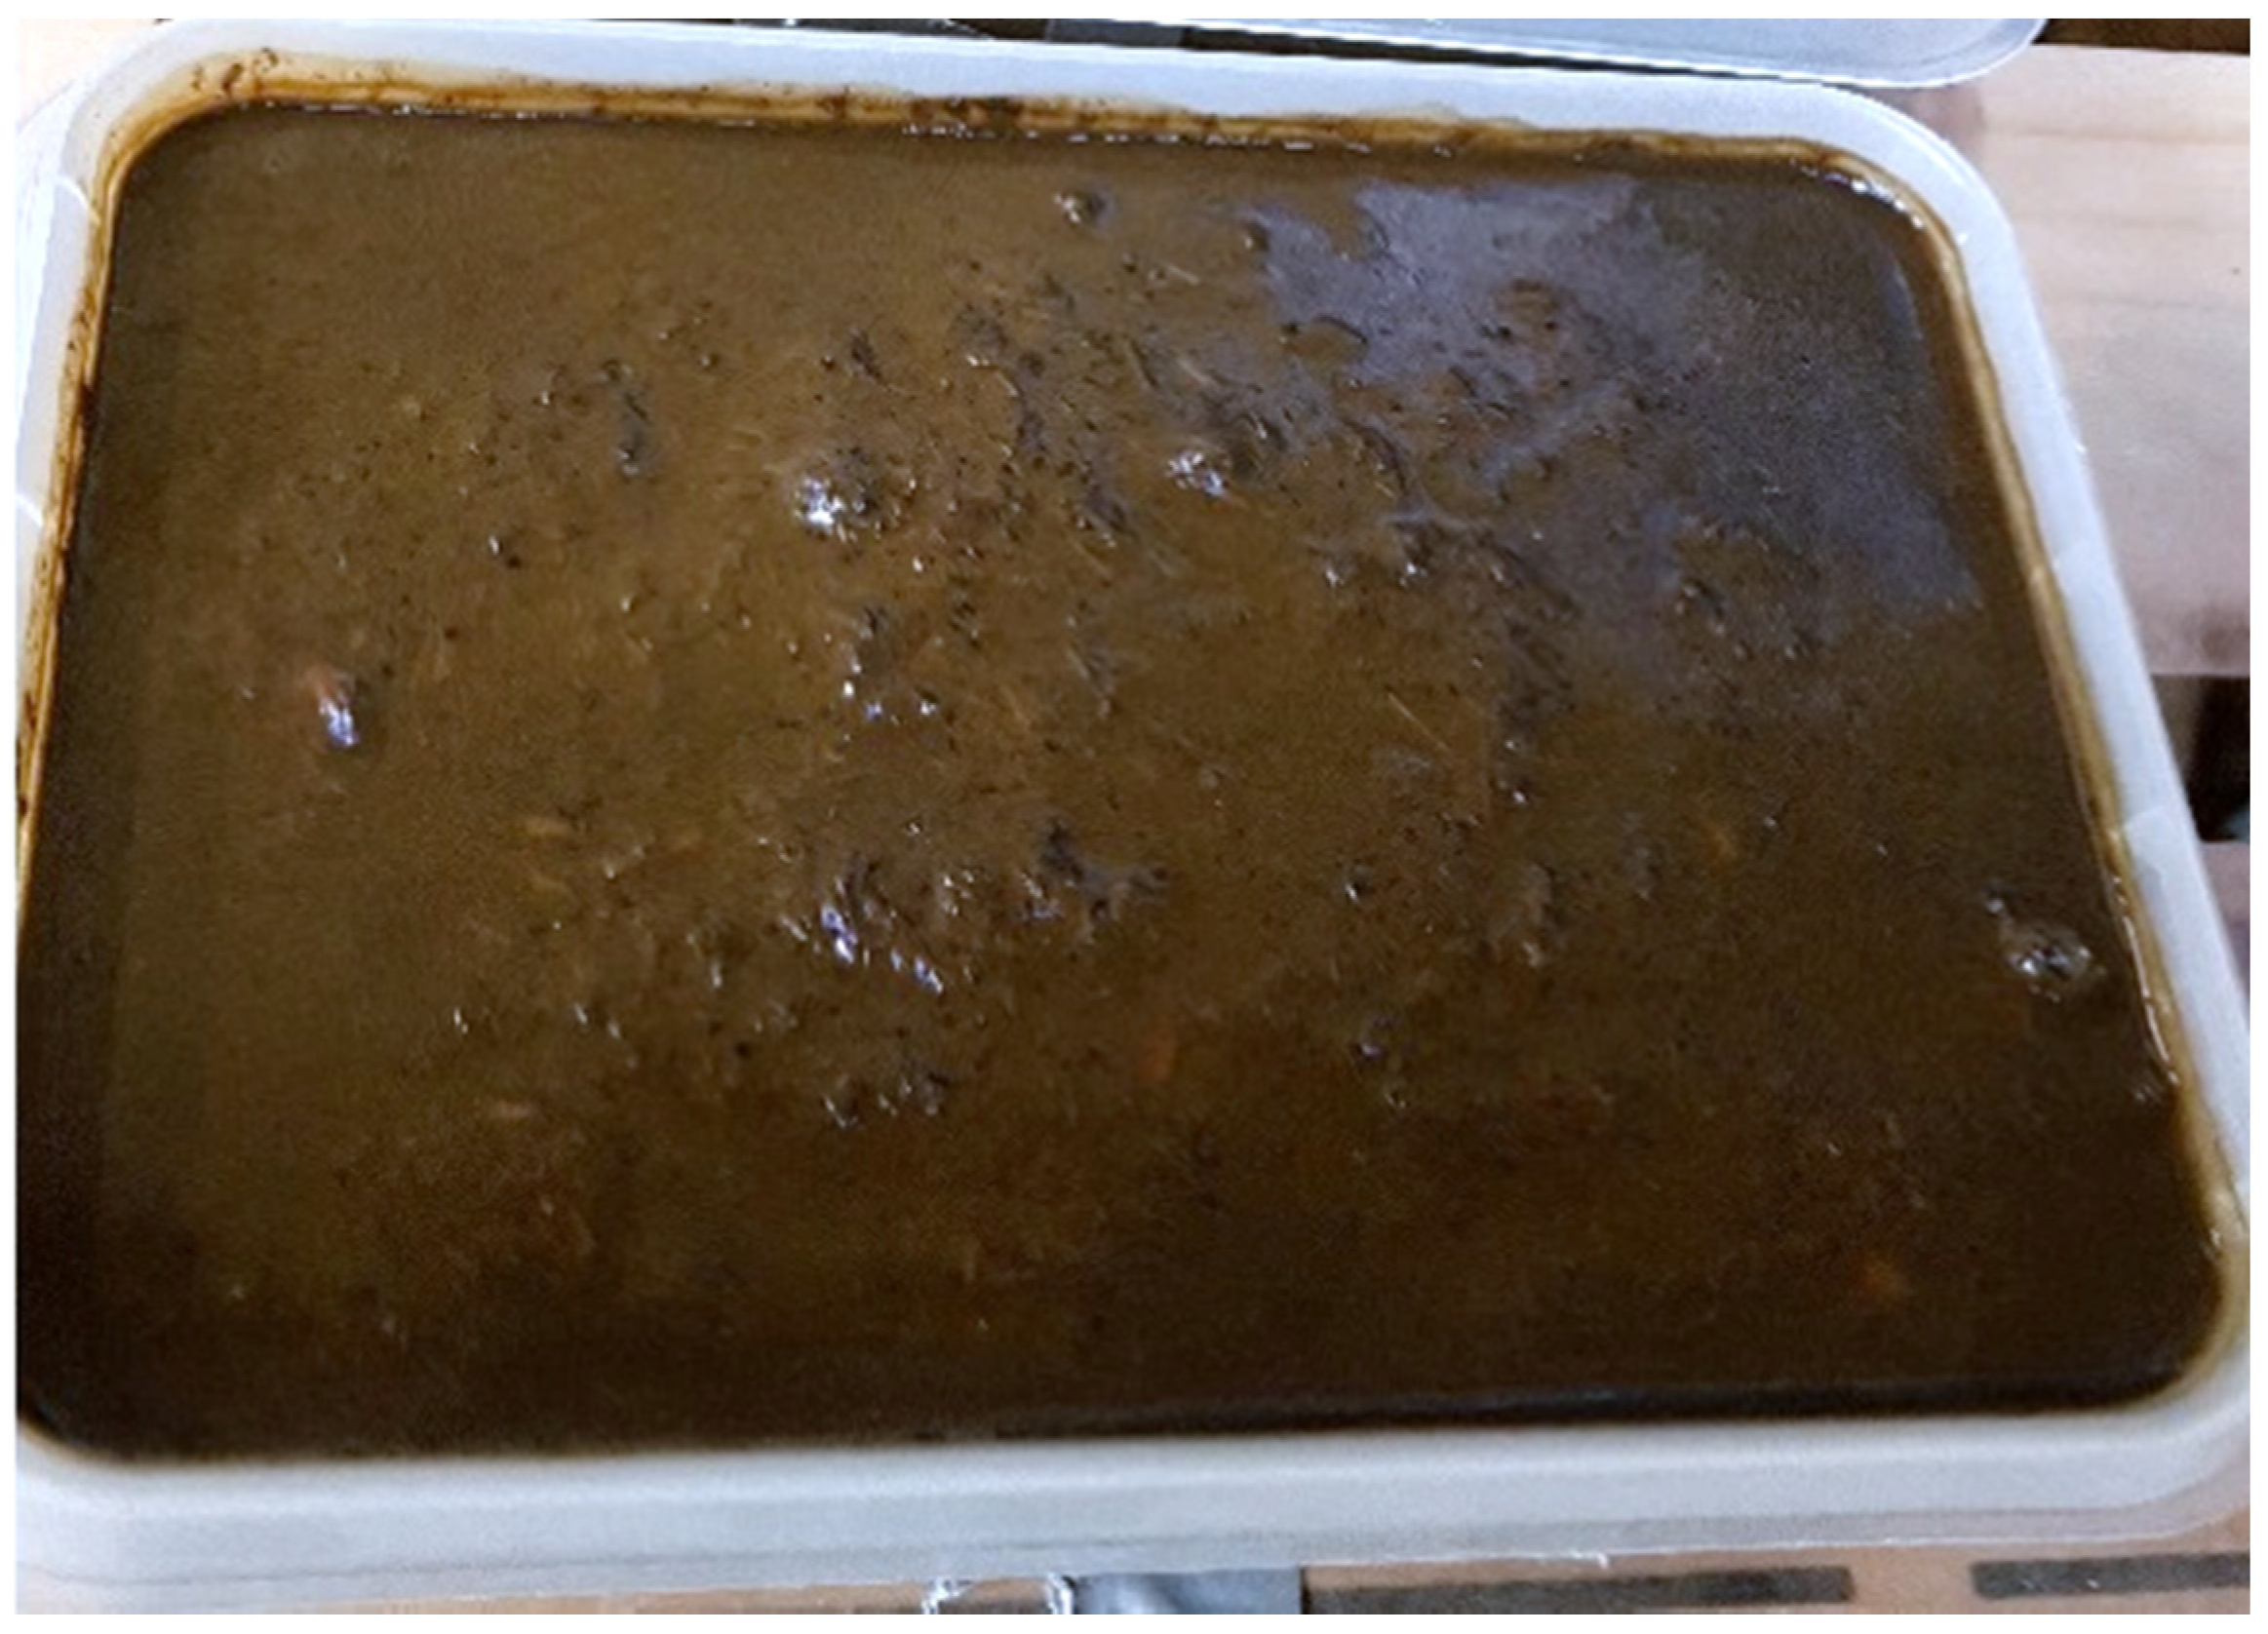
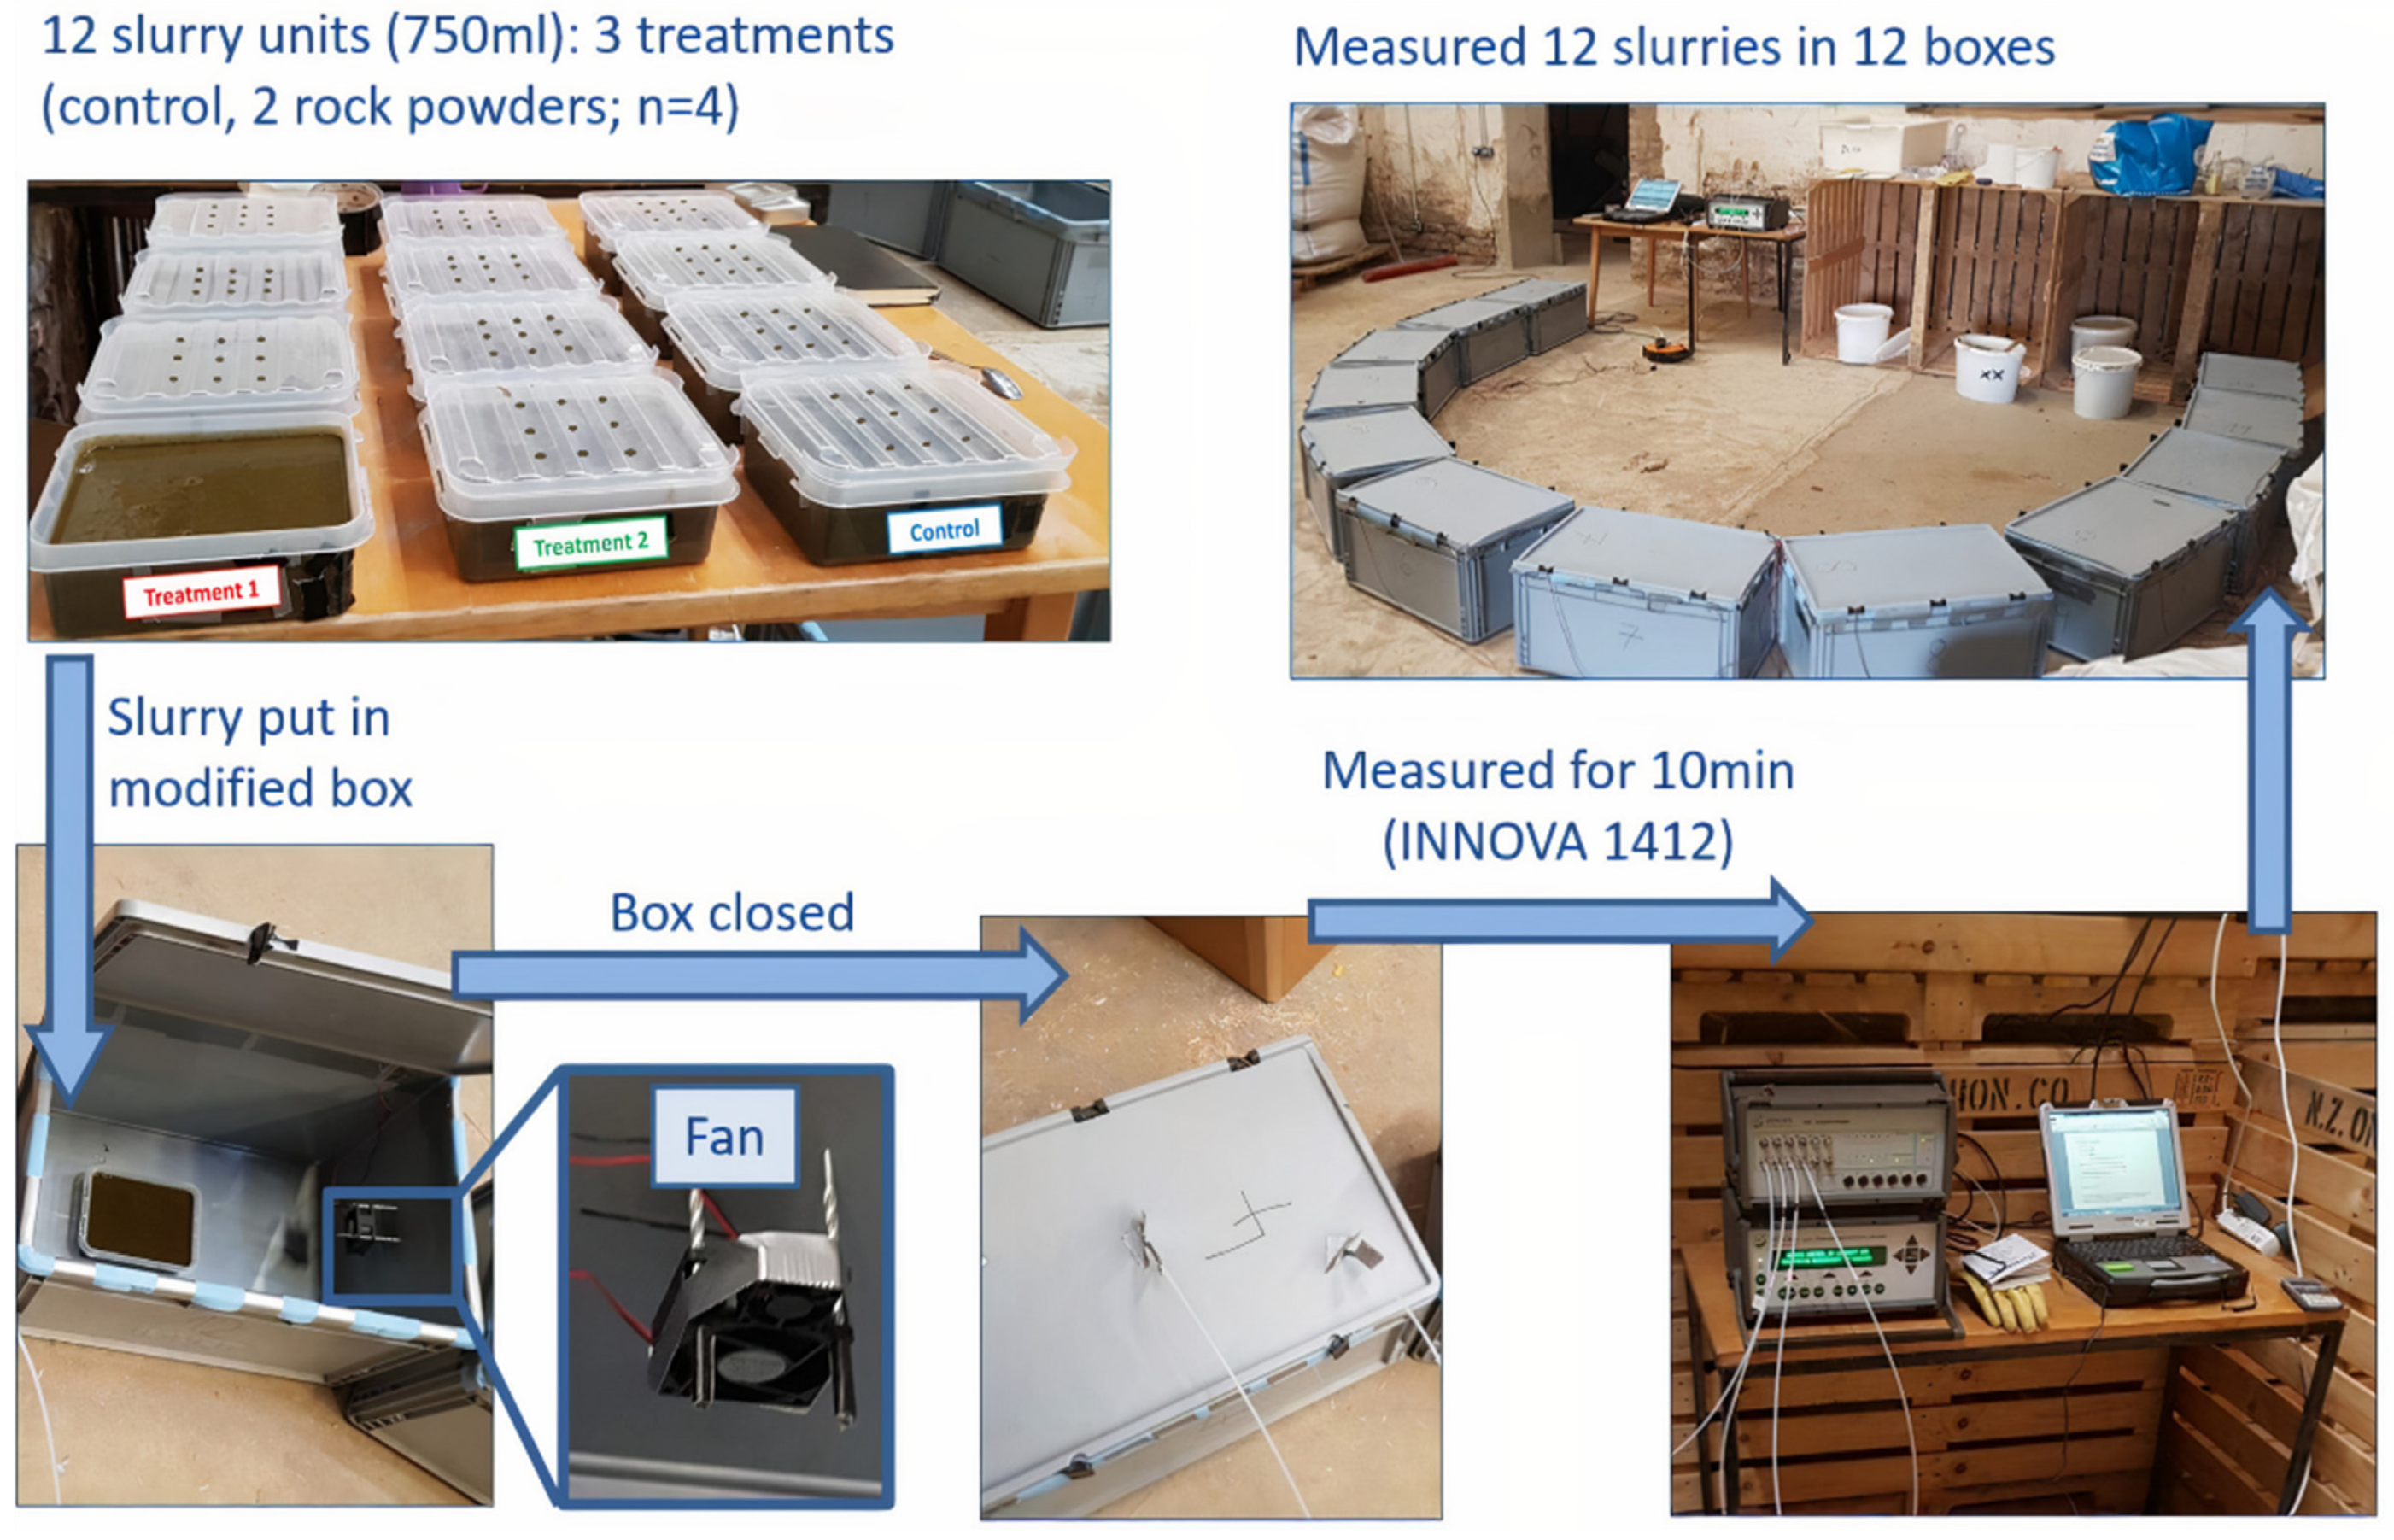
2.1. Description of Slurry Collection, Treatments, and Site

Cattle slurry was obtained on the 21 June 2020 from a conventional farm in Wachtberg-Werthhoven, Germany. In the summer months the animals graze and in the remaining months they are on a diet consisting primarily of maize and grass silage. Before collection, the underground slurry storage in the barn was mixed for 40 min to homogenize the slurry. Then, 100 L of slurry were taken in five 20 L buckets. Immediately after collection, 125 mL slurry samples were taken from each of the five buckets and mixed. From the resulting 625 mL, a 100 mL sample was analyzed for pH, total solids (TS), water content, organic matter, total N, total ammoniacal nitrogen (TAN), macro and micronutrient content. After the emission trial, the four replicates of each treatment were mixed together, from which a sample was analyzed for the same parameters. The analysis of the physiochemical and microbiological properties was carried out by an independent external laboratory (AGROLAB Agrar und Umwelt GmbH, Sarstedt, Germany). The remaining slurry was stored in closed buckets for 5 days at 5 °C in a cooling chamber.
On the 26 June 2020 the treatments were prepared and on the 27 June 2020 the measurements started. The measurements were conducted in the barn of the agricultural campus Klein-Altendorf of the University of Bonn, over a period of 46 days to resemble practical temperature conditions. We tested three treatments with four replicates, resulting in 12 experimental units. The treatments were: control slurry without any additives; slurry with 5% w/w of the rock powder ‘Eifelgold’; and slurry with 5% w/w of the rock powder ‘Biolit’. The rock powders were analysed for total elemental content and mineralogical composition via X-ray fluorescence spectroscopy (XRF) (Axios 3 kW, Malvern PANalytical GmbH, Kassel, Germany) (Table 1). For the pH measurement, rock powder samples were dispersed with sodium pyrophosphate, shaken for 15 min in an end-to-end shaker and left to stand overnight. The soil suspensions were then shaken for 1 min prior to pH measurement [35]. The particle size distribution was measured with the Laser Scattering Particle Size Distribution Analyzer LA-950 (HORIBA, Kyoto, Japan). All measurements were performed at the Institute of Geosciences (Department of Geology) at the University of Bonn. The particle sizes, pH, and elemental composition of the two rock powders are shown in Table 1 and the mineralogical composition is shown in Table 2.
Rock powder providers recommend amounts between 2–3% w/w, but we raised the amounts to 5% w/w to detect possible changes more clearly. For optimal mixing, the rock powder was sprinkled through a sieve (mesh size: 1.5 mm) over the 20 L slurry buckets, while the slurry was simultaneously mixed with a small hand mixer (MultiQuck MQ100; Braun GmbH, Neu-Isenburg, Germany). This process of experimental mixing lasted 1.30 min and followed recommendations by the rock powder providers with the aim to imitate the mixing process in real settings, where the rock powders are blown into the underground slurry tanks while a rotor, typically powered by a tractor, stirs the slurry. Although the slurry was mixed for 40 min in the underground storage prior to collection and farmers generally mix their slurry without rock powder additions, the control slurry was not mixed before the trial start, since the additional 1.30 min mixing was considered part of the overall treatment rock powder.
After mixing, 750 mL slurry were taken from each 20 L bucket and were filled into 1 L plastic vessels (17.5 cm × 13.5 cm × 6 cm height), which were stored on a shaded table in the barn during the measurement period. As in [36,37], the plastic vessels were stored under aerobic conditions. The stored slurry vessels were covered with lids perforated with 12 2 mm-diameter holes, similar to [36]. This action was taken because pre-trials without lids showed that slurry crusts formed after several days and limited longer emission comparisons. In contrast, lids without holes constituted strictly anaerobic conditions and led to no crust formation at all, a gas overpressure and a condensation of water on the slurry surface, resulting in more heterogenous and less comparable emission rates. Thus, perforated lids avoided gas overpressure and water condensation while crusts only started to form after several weeks. This also aimed to better mimic on-farm conditions [36] and to render measurements more comparable. The temperature was measured over the whole course of the experiment inside the barn every 5 min with a datalogger (EASYLOG USB-1, Larasian Ltd., Fordingbridge, England).

2.2. Emission Measurement Design

Emissions were measured with an INNOVA 1412a photoacoustic gas monitor (LumaSense Technologies A/S, Ballerup, Denmark), [13,38] that measures NH3, CO2, CH4 and N2O emissions in real-time once per minute.
The INNOVA measures the gas concentrations in ppm and the detection thresholds of the gases are as follows: 0.2 ppm NH3; 0.03 ppm N2O; 0.4 ppm CH4; and 1.5 ppm CO2. The device was used with the default configurations which relate to standard conditions of 20 °C and 101.325 kPa, and with an automatic chamber flush time and a sample integration time of 5 s. The accuracy of gas measurements is ensured for changing temperatures since the device has an inbuilt mechanism to compensate for temperature fluctuations.
At the beginning of each measurement day, the INNOVA first measured the air in the barn for 15 min to remove residual internal gas concentrations and to attain background air concentrations of all gases. In the same barn, the 12 slurry vessels were stored. During the storage, the slurry vessels were closed with the perforated lids. Before measuring a slurry vessel, the lid was removed and it was left open for 2 min, so that high residual gas concentrations from the headspace could dissipate. After 2 min, the vessel was placed in a box (60 × 40 × 33.5 cm) equipped with a small fan (40 × 40 × 10 mm; air flow rate 13.94 m³/h, manufacturer: WallAir; Reichelsheim, Germany) that provided a homogenous air distribution inside the box (Figure 1). After the slurry vessel was put in the box, the box was closed, the inflow and outflow tubes of the INNOVA were connected to the box and the measurement started immediately thereafter for 10 min. By connecting both inflow and outflow INNOVA tubes to the box, the whole air was circulated within the measurement system. After 10 min, the INNOVA tubes were removed from the box, the box was opened, the slurry vessel was put out, placed on the table again and closed with the lid. Then, the INNOVA measured the barn air for 5 min so that it could attain background air concentration again. Thereafter, the next randomly assigned slurry vessel was measured in the same procedure, but in a new box. Eventually, each slurry vessel was measured in a new and separate box.
In preliminary tests, this design yielded consistent real-time emission analysis, agreeing with [39], who similarly incorporated a fan into measurement chambers.
The emission values obtained by our chamber experiment allow relative comparisons between the treatments. However, since various conditions such as surface to volume ratio differ between laboratory-scale experiments and on farms [38], our values cannot be used to calculate manure storage or field emission rates without further validation.
The slurries were measured for 46 days. Samples were measured every day until day 11, then every second day until day 21, thereafter every 3 days until day 30, and every fourth day for the remaining period. The INNOVA measured the gas concentrations in ppm and the detection thresholds of the gases were 200 ppb for NH3, 30 ppb for N2O, 100 ppb for CH4 and 5100 ppb for CO2.

2.3. Data Analysis

For the data analysis, we converted the emission values (ppm gas L−1) into emission rates (mg−1 gas L−1 h−1). The first of the 10 values of each slurry measurement was discarded due to high fluctuations. Then, to the nine remaining emission values of each gas measurement of each day, regression curves (x-axis: time) were fitted in Microsoft Excel [13,40].
Our measurements were conducted in a closed system in which emissions were affected by an increasing diffusion resistance that reduced emission rates with time. This flattening out of the emissions was in the case of NH3, CO2, and CH4 better depicted through a polynomial regression (polynomial function 2nd order, y = ax² + bx + c) than through a linear regression (linear function, y = ax + b). N2O emissions however were very small and dispersed, and a linear regression fitted better to the values since the polynomial regression often resulted in positive ax² values, implying erroneous exponential emission increases. The b(x) value in the polynomial regression curve of NH3, CO2, and CH4 describes the emission increase in ppm min−1 at time t0, whereas the ax value of the linear regression describes the emission increase in ppm min−1 for N2O. To obtain emission rates, the four b(x) and ax values of each gas measurement were arithmetically averaged for each day, and standard errors were calculated. Then, the obtained ppm gas L−1 min−1 values were transformed into mL−1 gas L−1 h−1. The volume of each box was 80.4 L, so 1 ppm gas min−1 corresponds to 0.0804 mL gas L−1 min−1, and thus 4824 mL gas L−1 h−1. According to the ideal gas law, milliliter values of the respective gas were then converted into milligram, thereby yielding the unit mg−1 gas L−1 h−1 [39].
Although minor emissions likely occurred while the slurry vessels were stored with the perforated lids, overall emission fluxes from the opened slurry vessels were presumably substantially higher. Therefore, cumulative emissions of the gases were calculated by only considering the measurement days (n = 23) and the actual time the slurry vessels were opened (15 min per measurement day). The cumulative gas emissions and the emission rates (on day 5, 10, 15, 24, 38, 42 and 46) were subjected to an analysis of variance (one-way ANOVA), followed by a post-hoc Tukey test to determine the statistical significance between the treatments. For all statistical measurements, a significance level of p < 0.05 was applied and all calculations were conducted with SPSS (version 28.0.0.0 190).
Total greenhouse gas emissions (GHG) expressed as CO2 equivalents were estimated from the CH4 and N2O emissions with the conversion factors of 310 and 21 for N2O and CH4, respectively [41].

3. Results

3.1. Gaseous Emissions

In the following, the results for the NH3, CH4, N2O, and CO2 emission measurements are presented, respectively. The complete measurement dataset can be found in the Supplementary Table S1.

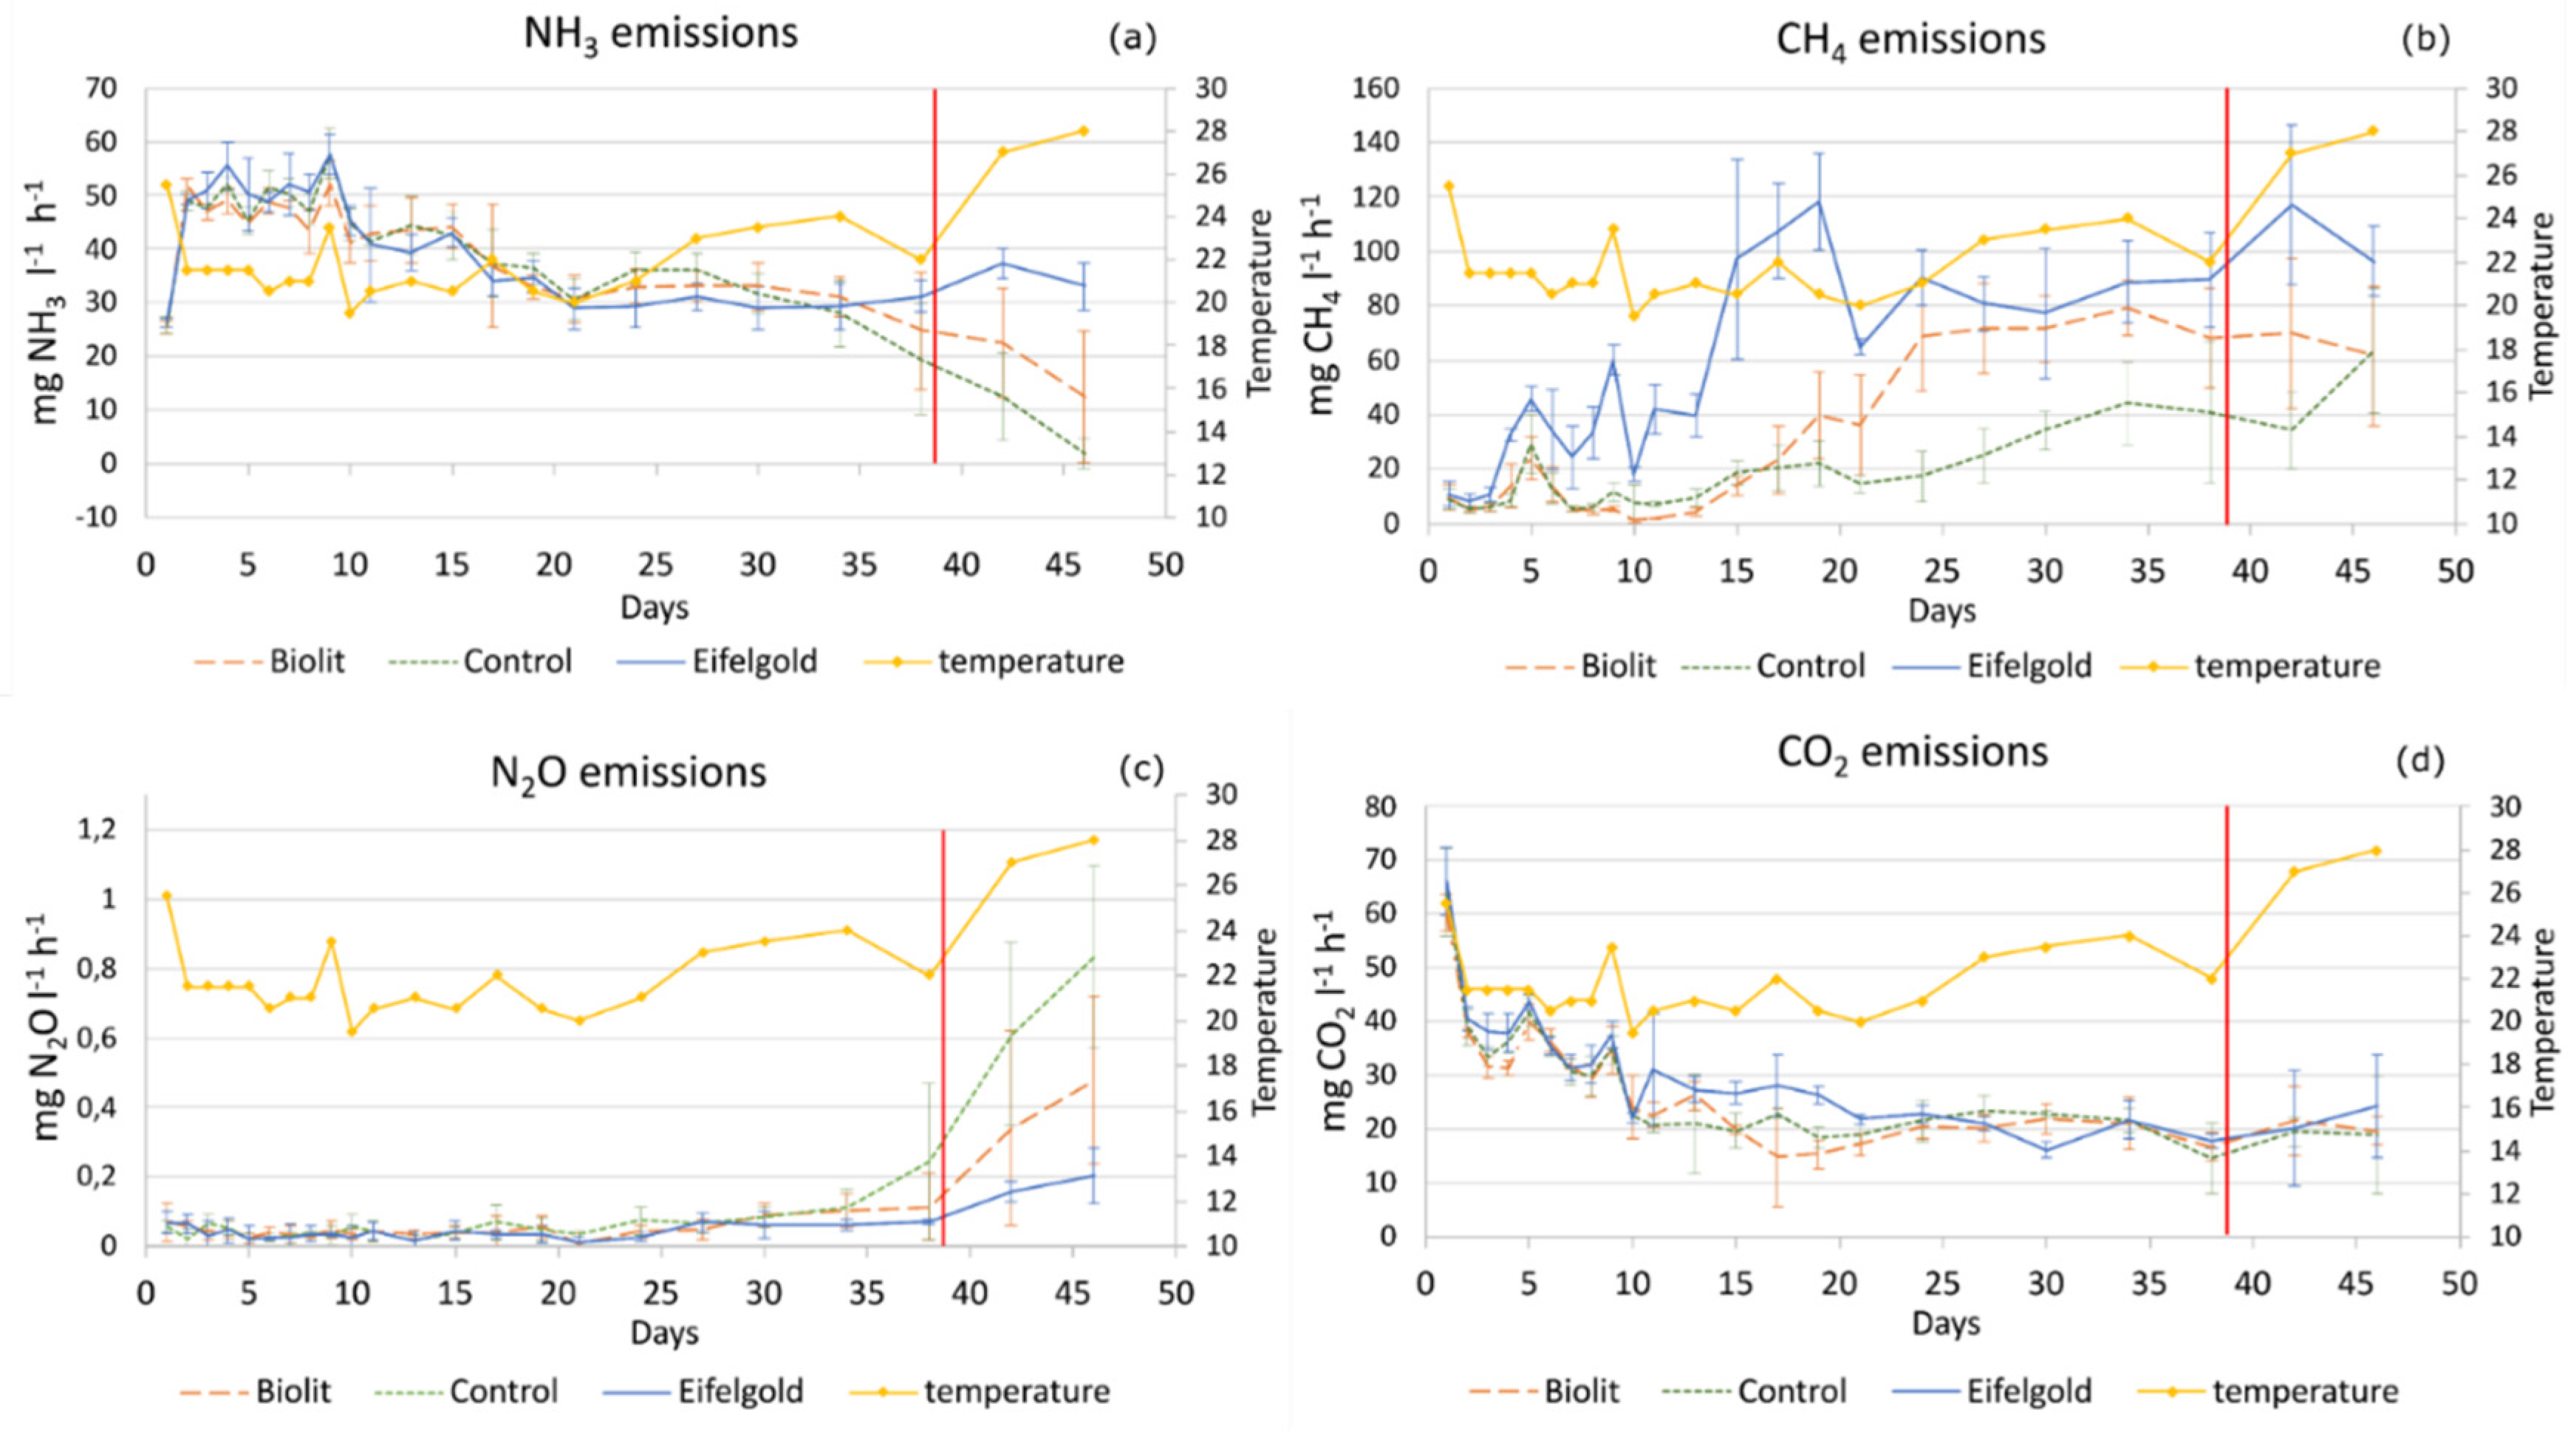
3.1.1. NH3 Emissions

In all three treatments, the NH3 emission rates over 46 days followed a similar course (Figure 2a). The measurement on the first day, which was conducted immediately after the slurry was filled in the vessels, resulted in substantially lower NH3 emissions than for the following days. From the second day onwards, and besides a peak on day 9, emission rates slightly decreased up until day 20, and remained stable up until day 30. For the respective measurements on day 5, 10, 15, 24 and 38, no statistically significant differnces occurred between the treatments. However, on day 42, significant differences occurred between the control and Eifelgold, and on day 46 statistically significant (p < 0.05) differences occurred between Eifelgold and the control, and between Eifelgold and Biolit. This NH3 reduction coincided with the formation of a slight surface crust of the control and Biolit slurry, emerging from day 38. The crust formation was most pronounced for the control slurry (Appendix A Figure A1), followed by the Biolit samples. In contrast, no crust formation occurred for the Eifelgold samples (Appendix A Figure A2). The cumulative NH3 emissions did not differ significantly between the treatments, and yielded 213.16 mg for Biolit, 227.70 mg for the control, and 238.23 mg for Eifelgold (Table 3).
Some coincidence with temperature could be observed, which was most pronounced for the emission peak on day 9. The temperature depicted on the graphs does not correspond to the daily average temperature, but to the average temperature during the respective measurement period (3 h) of all slurry vessels. After 2 weeks, no obvious correlation with the temperature was visible.

3.1.2. CH4 Emissions

For all treatments, CH4 emissions were lower on the first days compared to the remaining measurement period (Figure 2b). We found significant differences in emission rates between the treatments, which were particularly pronounced for the Eifelgold rock powder. Starting from day 4, significant (p < 0.01) differences occurred between Eifelgold and Biolit and Eifelgold and the control for every single day. From day 6 onwards, Eifelgold CH4 emissions doubled compared to the other treatments and peaked on day 19, when emissions rates were on average three times and five times higher than for Biolit and the control, respectively. Emission rates between Biolit and the control showed no statistically significant differences up until day 24. From day 24 onwards, CH4 emissions from Biolit increased and showed statistically non-significant differences to those of Eifelgold. CH4 emissions rates from the control were the lowest over the whole period, gradually started to increase from day 24 onwards, and eventually aligned to CH4 emissions from Biolit and the control. Non-significant differences in emission rates were found between the control and Biolit from day 38 until the end of the measurements, whereas on the last measurement day, there were no statistically significant differences between all treatments. Similar to NH3 and CO2, a slight correlation with temperature could be observed for the Eifelgold emissions on day 9. No influence of the slurry crusts developing from day 34 onwards could be observed. The cumulative CH4 emissions differed significantly for all treatments (p < 0.01), with total emissions being 164.28 mg for Biolit, 106.37 mg for the control, and 326.46 mg for Eifelgold (Table 3).

3.1.3. N2O Emissions

The emission rates for N2O remained low and concentrations in the boxes did not exceed 1 ppm except for some measurements during the last three days (Figure 2c). Accordingly, emission rates for the respective days showed statistically non-significant differences for all treatments up until the day 42. On day 42 and 46, N2O emissions from the control were significantly (p < 0.05) higher than for the Eifelgold treatment, whereas average N2O emissions from Biolit were in between the control and Eifelgold, yet the differences were statistically non-significant. Increases in N2O emissions correlated with the development of the slurry crust. Cumulative N2O emissions were 0.46 mg for Biolit, 0.61 mg for the control, and 0.30 mg for Eifelgold, whereas significant differences occurred between the control and Eifelgold (Table 3). No correlation between N2O emissions and temperature could be observed.

3.1.4. CO2 Emissions

The time course CO2 emission rates over the 46 days was different from that of NH3 (Figure 2d). In contrast to the NH3 emissions, the CO2 emissions peaked on the first day, decreased up until day 10, and then remained stable until the end of the measurements for all treatments. Over the whole measurement period, no statistically significant differences were found for the emission rates between the treatments for any given day. However, the cumulative emissions significantly differed between Eifelgold and Biolit (p < 0.01), and Eifelgold and the control (p < 0.01) (Table 3). The accumulated CO2 emissions were 380.95 mg for Biolit, 408.35 mg for the control, and 450.63 mg for Eifelgold. In contrast to NH3, the crust formation did not reduce CO2 emissions. There was a slight coincidence between the background temperature and CO2 emissions, that was most pronounced within the first 10 days.

3.2. Total Greenhouse Gas Emissions

When emissions were summed up as total greenhouse gas (GHG) emissions, comprising CO2 and CO2 equivalents from CH4 and N2O emissions, Biolit and Eifelgold increased total GHG emissions (+41% and +161%, respectively) in comparison to the control treatment (Table 3). NH3 was not considered since its contribution to total GHG emissions is negligible [42,43].

3.3. Slurry Physicochemical Properties

Physicochemical properties of the slurry before and after the treatment are shown in Table 4. The pH of all slurries increased over the course of the trial and was slightly higher for the two rock powders, with Eifelgold being 0.1 pH unit higher than Biolit. The organic matter content decreased in all slurries in the order Biolit > Eifelgold > control. Besides the reduced slurry crust, the rock powder slurries also appeared to be more liquid and flowable. Total N and NH4+-N after the emission trial were higher for the two rock powders than for the control. All macro- and micronutrients increased in the slurries after the 46 days. All nutrient contents were higher in the rock powder treated slurries, whereas overall nutrient release was higher for ‘Eifelgold’. The major nutrient increases are shortly outlined: Potassium (K) increased by 36% for Eifelgold; magnesium (Mg) increased by more than 200% for both rock powders; calcium (Ca) increased by 72% for Biolit and 103% for Eifelgold; copper (Cu) increased by 39% for Biolit and by 112% for Eifelgold; manganese (Mn) increased by almost 250% for both rock powders; and zinc (Zn) increased by about 25%. For sodium (Na), a drastic increase of 533% occurred for Eifelgold, whereas it increased by 24% through Biolit.

4. Discussion

4.1. NH3 Emissions

Our results do not support the hypothesis that rock powders may reduce NH3 emissions from cattle slurry. On the contrary, for the rock powder treatments NH3 emission rates increased at the end of the trial, which coincided with a reduction in the floating crust. Reduced NH3 emissions through floating crusts has been reported by several other authors [44,45,46]; importantly, however, overall emission differences were small and cumulative emissions did not differ significantly to each other. In the literature, the only significant NH3 reductions with rock powders that we found were by [13,14], who treated solid cattle manure with >8% w/w ‘Eifelgold’, the same rock powder we also tested. However, their measurements only lasted for 3 days after field application. Similarly, reduced NH3 emissions were reported in the first days by [11,16], who measured chicken manure mixed with higher rock powder additions in the range of 12–20% w/w. Importantly, after the initial NH3 reductions with rock powders, they found increased NH3 emissions in the subsequent weeks for the rock powder treated manures, which eventually resulted in non-significant differences between the treatments at the end of the measurement period (120 days for [11] and 29 days for [16]. Although there is longstanding evidence for NH4+ adsorption to rock surfaces [47], there are several potential reasons why no significant NH3 reductions occurred. First, there are rock- and mineral-dependent differences in the adsorption capacities related to cation exchange capacity (CEC) and other specific properties related to structure. For example, the CEC of zeolite (clinoptilonite) can be two orders of magnitude higher than that of an equally fine-grained basalt [15]. Second, there are other cations competing with NH4+ for adsorption sites, particularly K+, for which the amounts in our slurries were four to six times higher than NH4+, thereby likely decreasing adsorption places. This was also reported by [15], who found that basalt powder placed in an exhaust air stream reduced NH3 emissions from manure, whereas it slightly increased emissions when directly mixed with the manure. This was associated with cation competition for adsorption sites and a slight pH increase in the manure [15]. Besides NH4+ adsorption and the effect on pH, additional NH3 emissions could occur in the rock powders slurries due to their higher NH4+ contents, which likely derived from increased organic matter mineralization (see next section).

4.2. CH4, CO2, and N2O Emissions

Unexpected and hitherto unknown increases in CH4 emissions occurred for rock powder treatments. Higher CH4 emissions and stronger decomposition of organic matter suggest increased microbial activity due to the rock powders. Microorganismal growth is often nutrient-limited [48,49,50], and studies that analysed rock powder additions to compost found higher metabolic activity and functional diversity of microorganisms [51]. Accordingly, [52,53] showed that specific minerals attract specific bacterial communities and are thus more than an inert matrix for bacterial growth. This agrees with the recently established ‘mineralosphere’ concept, which suggests that the mineral-specific physicochemical properties and its inorganic nutrient supply support selective microbial colonization [33]. One factor for higher CH4 emissions from ‘Eifelgold’ treatments could have been the substantially higher release of Na, which is known to have effects on methanogenic bacteria [54,55]. Furthermore, emission curves equalized towards the end of the trial. Further research is needed to analyse whether emission curves would further adjust or even decrease for Eifelgold.
In contrast to CH4, CO2 emissions did not differ significantly for the treatments, even though the stronger decomposition of organic matter in the rock powder treated slurries would have suggested a concomitant increase in CO2. Possible reasons for less pronounced differences in CO2 emissions are that CO2 is better buffered than CH4. The bicarbonate buffer system as well as carbonation with other cations like Ca+ and Mg+ can buffer CO2 emissions, whereas such pathways do not exist for CH4 [56,57]. Peaks in CO2 emission on the first day were likely due to the stirring and a concomitant oxygenation, resulting in higher aerobic microbial respiration.
N2O formation requires oxygen and is typically very low in the mostly anoxic slurry [56,58]. However, slurry surface crusts can contain a mosaic of anaerobic and aerobic micro-sites that favour N2O production [38]. This agrees with our findings, where increased N2O emissions correlated with the formation of a slurry crust, and also with earlier studies that found higher N2O emissions when a surface crust was formed [38,46,59].
The mixing of the rock powder treatments before the trial started could have had an additional effect on slurry properties and emissions. However, the slurry used for all treatments was mixed for 40 min with a tractor-powered rotor in the slurry underground storage prior to collection, and so the 1.30 min mixing of the rock powder slurries with a hand-mixer likely did not substantially influence slurry properties and emissions.

4.3. Physicochemical Properties

The slurry pH increase over the experiment was consistent with recent findings by [37] and is related to the decomposition of organic matter and organic acids in the slurry, and the release of CO2 [37,56]. A slightly higher slurry pH was found for the two rock powders than for the control, which was expected due to the H+ buffering capacity of the rock powders [30]. The higher Ca and Mg contents (Table 4) of Eifelgold could be related to the slightly higher pH (‘liming’) effect. The lower organic matter content of the rock powder slurries correlated with their lower crust formation and could potentially be related to increased microbiological activity indicated by the higher CH4 emissions. Despite higher NH3 emissions, and for unknown reasons, total N and NH4+ were higher in the rock powder-treated slurries.
The substantial nutrient release of the rock powders in the slurry is a relevant finding, since their dissolution rates are typically very low and are a major bottleneck to their usage [19,30]. The fine particle size of the rock powders (Table 1), and organic acids and microorganisms in the slurry likely contributed to the high nutrient release [31].
The nutrient release of the rock powders agreed with their mineralogy (Table 2). For the release of elements from a rock powder, not only the content of the respective element is of importance, but particularly the weathering rate of the mineral with which the element is associated [30]. Overall, the higher nutrient release of Eifelgold agreed with its higher content of fast weathering minerals such as Pyroxene, Olivine and Leucite [60,61]. The importance of the mineralogy was particularly evident for sodium (Na), for which the bulk content was higher in Biolit, although the Na release into the slurry was substantially higher in Eifelgold. This likely occurred since Na in Biolit was more associated with the slow-weathering mineral albite (Na-endmember of the plagioclase series), whereas Na in Eifelgold was richer in the mineral anorthite (Ca-endmember of the plagioclase series), which has very high weathering rates [61,62]. Furthermore, traces of Na in Eifelgold could have occurred in the minerals pyroxene and leucite [30], both of which have higher dissolution rates than albite.
Importantly, the low solubility of rock powders compared to synthetic fertilizers is a major bottleneck for their efficiency. The substantial release of nutrients in the slurry could have important implications for future practices, since it constitutes a practical way to improve the rock powder’s solubility, which could be employed across various farming scales and regions. Agreeing with our findings, mixtures with other organic materials such as compost or manure have been shown to equally increase nutrient release from rock powders in [31,51], yet they did not measure NH3 and GHG emissions, which are a crucial aspect for overall sustainability. Furthermore, pasture deficiencies of Na, Mg, Ca, and several micronutrients have been repeatedly reported [63,64,65]. Thus, the increased basic cation and micronutrient contents in the SRP slurry can be agronomically important. Nevertheless, the very high release of Na in the Eifelgold slurry must be further assessed and considered critically.

4.4. Limitations

A statistical analysis of the physiochemical measurements before and after the experiment was not possible since the measurements were conducted without replicates. Furthermore, although our alteration of the standard chamber measurement design yielded reliable relative emission data, future trials should incorporate larger vessels so that the emitting surface to box headspace ratios becomes smaller. Future studies should conduct a more comprehensive macro- and micronutrient analysis of the rock powder-amended slurry, particularly to include other heavy metals and silicon (Si). Si is gaining increased agronomic attention since it can induce a broad spectrum of biotic and abiotic stress resistance in plants [66,67]. Concomitant microbiological measurements of anaerobic bacteria and of methanogens would also be interesting to gain additional insights about biogeochemical interactions.

5. Conclusions

We analysed some of the major and hitherto unexamined claims regarding the mixture of rock powders with cattle slurry and found agronomically and environmentally conflicting results. NH3 and N2O emissions did not differ significantly between the treatments up until the end of the trial, when rock powders led to a practically desired reduction of the floating crust that however coincided with increased NH3 emissions and decreased N2O emissions. We found that rock powders significantly increased previously neglected CH4 emissions while CO2 emissions were unaffected. Macro- and micronutrients were released from the rock powders into the slurry, which could markedly increase their efficiency as a soil amendment. Mixing globally abundant rock powders from the mining industry with organic materials could yield a practical and low-cost multi-nutrient fertilizer, which bears particular potential for tropical countries with highly weathered soils, where commercial fertilizers are often not affordable or accessible. Overall, however, it remains a challenge to conclude whether rock powders should be mixed with slurry, because effects are diverse, and our experiment is, to the best of our knowledge, the first peer-reviewed study in this field. Necessarily, the next steps must be additional studies with various slurries to substantiate or challenge our findings, to inform discussions about slurry treatments, and to better understand the involved biogeochemical mechanisms.
Eventually, slurry management is at the core for overall farm health and must therefore not, regardless of its importance, be reduced to NH3 emission abatement. Therefore, we propose that slurry treatments must be holistically evaluated in a transdisciplinary dialogue between science and farmers.

Supplementary Materials

The following are available online at https://www.mdpi.com/article/10.3390/atmos12121652/s1, Table S1: complete emission measurement.xlsx spreadsheet containing all gas ppm values for each treatment and day.

Author Contributions

P.S.: Conceptualization; data curation; formal analysis; methodology, visualization; investigation; writing—original draft. M.H.: conceptualization; methodology; resources; supervision; writing—review and editing. M.S.: Conceptualization; methodology; data curation; software. T.F.D.: Supervision, writing—review and editing. M.T.: Conceptualization, investigation; methodology; project administration; software; supervision. All authors have read and agreed to the published version of the manuscript.

Funding

This study is funded by the Ministry of Culture and Science of North Rhine-Westphalia, Germany, through the Forschungskolleg “One Health and Urban Transformation”. The funders had no role in study design, data collection and analysis, decision to publish, or preparation of the manuscript.

Institutional Review Board Statement

Not applicable.

Informed Consent Statement

Not applicable.

Data Availability Statement

The original contributions presented in the study are contained within the Article and the supplementary Table S1; further inquiries can be directed to the corresponding author.

Conflicts of Interest

The authors declare no conflict of interest. The funders had no role in the design of the study; in the collection, analyses, or interpretation of data; in the writing of the manuscript, or in the decision to publish the results.

Appendix A

Figure A1. Control slurry at day 42, dried surface crust formation visible.
Atmosphere 12 01652 g0a1
Figure A2. Eifelgold slurry at day 42, surface mostly liquid and no crust formation visible.
Atmosphere 12 01652 g0a2

References

  1. European Commission, DG Climate Action; European Environment Agency. Annual European Union Greenhouse Gas Inventory 1990–2017 and Inventory Report 2019: Submission under the United Nations Framework Convention on Climate Change and the Kyoto Protocol; European Environment Agency: København, Copenhagen, 2019. Available online: https://www.eea.europa.eu/publications/european-union-greenhouse-gas-inventory-2019/at_download/file (accessed on 18 August 2021).
  2. Tista, M.; Gager, M.; Gaisbauer, S.; Ullrich, B. European Union Emission Inventory Report 1990–2017 under the UNECE Convention on Long-Range Transboundary Air Pollution (LRTAP); Publications Office of the European Union: Luxembourg, 2019; ISBN 978-92-9480-078-7. [Google Scholar]
  3. Hoegh-Guldberg, O.; Jacob, D.M.; Taylor, M.; Bindi, S.; Brown, I.; Camilloni, A.; Diedhiou, R.; Djalante, K.L.; Ebi, F. Impacts of 1.5 °C Global Warming on Natural and Human Systems. In Global Warming of 1.5 °C: An IPCC Special Report on the Impacts of Global Warming of 1.5 °C above Pre-Industrial Levels and Related Global Greenhouse Gas Emission Pathways, in the Context of Strengthening the Global Response to the Threat of Climate Change, Sustainable Development, and Efforts to Eradicate Poverty; IPCC: Geneva, Switzerland, 2018. [Google Scholar]
  4. Stocker, T. Climate Change 2013: The Physical Science Basis: Working Group I Contribution to the Fifth Assessment Report of the Intergovernmental Panel on Climate Change; Thomas, F., Ed.; Stocker, Working Group I Co-Chair, University of Bern [and nine others]; Cambridge University Press: New York, NY, USA, 2014. [Google Scholar]
  5. Amon, B.; Kryvoruchko, V.; Amon, T.; Zechmeister-Boltenstern, S. Methane, nitrous oxide and ammonia emissions during storage and after application of dairy cattle slurry and influence of slurry treatment. Agric. Ecosyst. Environ. 2006, 112, 153–162. [Google Scholar] [CrossRef]
  6. Schneidemesser Ev Kutzner, R.; Münster, A.; Staudt, E.; Saar, D. Landwirtschaft, Ammoniak und Luftverschmutzung; IASS Fact Sheet: Berlin, Germany, 2016. [Google Scholar]
  7. Sonneveld, M.P.W.; Schröder, J.J.; Vos JA de Monteny, G.J.; Mosquera, J.; Hol, J.M.G.; Lantinga, E.A.; Verhoeven, F.P.M.; Bouma, J. A whole-farm strategy to reduce environmental impacts of nitrogen. J. Environ. Q. 2008, 37, 186–195. [Google Scholar] [CrossRef] [PubMed]
  8. Paulot, F.; Jacob, D.J.; Pinder, R.W.; Bash, J.O.; Travis, K.; Henze, D.K. Ammonia emissions in the United States, European Union, and China derived by high-resolution inversion of ammonium wet deposition data: Interpretation with a new agricultural emissions inventory (MASAGE_NH3). J. Geophys. Res. Atmos. 2014, 119, 4343–4364. [Google Scholar] [CrossRef]
  9. Clemens, J.; Bergmann, S.; Vandré, R. Reduced ammonia emissions from slurry after self-acidification with organic supplements. Environ. Technol. 2002, 23, 429–435. [Google Scholar] [CrossRef] [PubMed]
  10. Ndegwa, P.M.; Hristov, A.N.; Arogo, J.; Sheffield, R.E. A review of ammonia emission mitigation techniques for concentrated animal feeding operations. Biosyst. Eng. 2008, 100, 453–469. [Google Scholar] [CrossRef]
  11. Kistner-Othmer, M. Einstreu von Steinmehl in Hühnerställe zur Verbesserung des Hofdüngers und der Stallluft. Ph.D. Thesis, Gesamthochschule Kassel, Kassel, Germany, 1989. [Google Scholar]
  12. Snoek, H.; Wülfrath, H. Das Buch vom Steinmehl: Entstehung, Verwendung und Bedeutung im Land- und Gartenbau; Orac: Wien, Austria, 1983; p. 144. [Google Scholar]
  13. Shah, G.A.; Shah, G.M.; Rashid, M.I.; Groot, J.C.J.; Traore, B.; Lantinga, E.A. Bedding additives reduce ammonia emission and improve crop N uptake after soil application of solid cattle manure. J. Environ. Manag. 2018, 209, 195–204. [Google Scholar] [CrossRef]
  14. Shah, G.M.; Shah, G.A.; Groot, J.C.J.; Oenema, O.; Lantinga, E.A. Irrigation and lava meal use reduce ammonia emission and improve N utilization when solid cattle manure is applied to grassland. Agric. Ecosyst. Environ. 2012, 160, 59–65. [Google Scholar] [CrossRef]
  15. Witter, E.; Kirchmann, H. Peat, zeolite and basalt as adsorbents of ammoniacal nitrogen during manure decomposition. Plant Soil 1989, 115, 43–52. [Google Scholar] [CrossRef]
  16. Zaied, H. Untersuchungen zum Einfluß verschiedener Zusätze auf den Rotteverlauf, die Stickstoffdynamik und die Kompostqualität bei der Kompostierung von Reststoffen aus der Legehennenhaltung; Food and Agriculture Organization of the United Nations (FAO): Rome, Italy, 1999. [Google Scholar]
  17. Sajeev, E.P.; Winiwarter, W.; Amon, B. Greenhouse gas and ammonia emissions from different stages of liquid manure management chains: Abatement options and emission interactions. J. Environ. Q. 2018, 47, 30–41. [Google Scholar] [CrossRef] [PubMed] [Green Version]
  18. Manning, D.A.C.; Theodoro, S.H. Enabling food security through use of local rocks and minerals. Extr. Ind. Soc. 2020, 7, 480–487. [Google Scholar] [CrossRef]
  19. Swoboda, P.; Döring, T.F.; Hamer, M. Remineralizing soils? The agricultural usage of silicate rock powders: A review. Sci. Total Environ. 2021, 150976. in press, corrected proof. [Google Scholar] [CrossRef]
  20. Fyfe, W.S.; Leonardos, O.H.; Theodoro, S.H. Sustainable farming with native rocks: The transition without revolution. Ann. Braz. Acad. Sci. 2006, 78, 715–720. [Google Scholar] [CrossRef] [PubMed] [Green Version]
  21. Theodoro, S.H.; Leonardos, O.H. The use of rocks to improve family agriculture in Brazil. An. Da Acad. Bras. De Ciências 2006, 78, 721–730. [Google Scholar] [CrossRef]
  22. Van Straaten, P. Agrogeology: The Use of Rocks for Crops; Enviroquest Ltd.: Cambridge, ON, Canada, 2007; p. 440. [Google Scholar]
  23. Jones, D.L.; Cross, P.; Withers, P.J.A.; DeLuca, T.H.; Robinson, D.A.; Quilliam, R.S.; Harris, I.M.; Chadwick, D.R.; Edwards-Jones, G. REVIEW: Nutrient stripping: The global disparity between food security and soil nutrient stocks. J. Appl. Ecol. 2013, 50, 851–862. [Google Scholar] [CrossRef]
  24. Dalmora, A.C.; Ramos, C.G.; Silva Oliveira, M.L.; Silva Oliveira, L.F.; Homrich Schneider, I.A.; Kautzmann, R.M. Application of andesite rock as a clean source of fertilizer for eucalyptus crop: Evidence of sustainability. J. Cleaner Prod. 2020, 256, 120432. [Google Scholar] [CrossRef]
  25. Leonardos, O.H.; Theodoro, S.H.; Assad, M.L. Remineralization for sustainable agriculture: A tropical perspective from a Brazilian viewpoint. Nutr. Cycl. Agroecosyst. 2000, 56, 3–9. [Google Scholar] [CrossRef]
  26. Abbott, L.K.; Manning, D.A.C. Soil health and related ecosystem services in organic agriculture. SAR 2015, 4, 116. [Google Scholar] [CrossRef]
  27. Renforth, P.; Washbourne, C.-L.; Taylder, J.; Manning, D.A.C. Silicate production and availability for mineral carbonation. Environ. Sci. Technol. 2011, 45, 2035–2041. [Google Scholar] [CrossRef]
  28. Bian, Z.; Miao, X.; Lei, S.; Chen, S.-E.; Wang, W.; Struthers, S. The challenges of reusing mining and mineral-processing wastes. Science 2012, 337, 702–703. [Google Scholar] [CrossRef] [PubMed]
  29. Franks, D.M. Reclaiming the neglected minerals of development. Extr. Ind. Soc. 2020, 7, 453–460. [Google Scholar] [CrossRef]
  30. Harley, A.D.; Gilkes, R.J. Factors influencing the release of plant nutrient elements from silicate rock powders: A geochemical overview. Nutr. Cycl. Agroecosyst. 2000, 56, 11–36. [Google Scholar] [CrossRef]
  31. Basak, B.B.; Sarkar, B.; Naidu, R. Environmentally safe release of plant available potassium and micronutrients from organically amended rock mineral powder. Environ. Geochem. Health 2020, 43, 3273–3286. [Google Scholar] [CrossRef] [PubMed]
  32. Bennett, P.C.; Rogers, J.R.; Choi, W.J. Silicates, Silicate Weathering, and Microbial Ecology. Geomicrobiol. J. 2001, 18, 3–19. [Google Scholar] [CrossRef]
  33. Uroz, S.; Kelly, L.C.; Turpault, M.-P.; Lepleux, C.; Frey-Klett, P. The mineralosphere concept: Mineralogical control of the distribution and function of mineral-associated bacterial communities. Trends Microbiol. 2015, 23, 751–762. [Google Scholar] [CrossRef]
  34. Christensen, M.L.; Sommer, S.G. Manure Characterisation and Inorganic Chemistry 2013. In Animal Manure: Recycling, Treatment, and Management; Jensen, L.S., Christensen, M.L., Sommer, S.G., Schmidt, T., Eds.; John Wiley & Sons Inc.: Chichester, UK, 2013; pp. 41–65. ISBN 9781118676677. [Google Scholar]
  35. Blume, H.-P. Handbuch der Bodenuntersuchung; John Wiley & Sons: Berlin, Germany, 2000; ISBN 978-3-527-19080-5. [Google Scholar]
  36. Kavanagh, I.; Burchill, W.; Healy, M.G.; Fenton, O.; Krol, D.J.; Lanigan, G.J. Mitigation of ammonia and greenhouse gas emissions from stored cattle slurry using acidifiers and chemical amendments. J. Clean. Prod. 2019, 237, 117822. [Google Scholar] [CrossRef]
  37. Overmeyer, V.; Holtkamp, F.; Clemens, J.; Büscher, W.; Trimborn, M. Dynamics of different buffer systems in slurries based on time and temperature of storage and their visualization by a new mathematical tool. Anim. Open Access J. 2020, 10, 724. [Google Scholar] [CrossRef] [PubMed] [Green Version]
  38. Dinuccio, E.; Berg, W.; Balsari, P. Gaseous emissions from the storage of untreated slurries and the fractions obtained after mechanical separation. Atmos. Environ. 2008, 42, 2448–2459. [Google Scholar] [CrossRef] [Green Version]
  39. Parker, D.B.; Casey, K.D.; Todd, R.W.; Waldrip, H.M.; Marek, G.M.; Auvermann, B.W.; Marek, T.H.; Webb, K.; Willis, W.M.; Pemberton, B.; et al. Improved chamber systems for rapid, real-time nitrous oxide emissions from manure and soil. Trans. ASABE 2017, 60, 1235–1258. [Google Scholar] [CrossRef]
  40. Duncan, E.W.; Dell, C.J.; Kleinman, P.J.A.; Beegle, D.B. Nitrous oxide and ammonia emissions from injected and broadcast-applied dairy slurry. J. Environ. Q. 2017, 46, 36–44. [Google Scholar] [CrossRef]
  41. Intergovernmental Panel on Climate Change (IPCC); Organisation for Economic Co-operation and Development (OECD); International Energy Agency (IEA). Revised 1996 IPCC Guidelines for National Greenhouse Gas Inventories; IPCC: Geneva, Switzerland, 1997; Volume 3. [Google Scholar]
  42. Berg, W.; Brunsch, R.; Pazsiczki, I. Greenhouse gas emissions from covered slurry compared with uncovered during storage. Agric. Ecosyst. Environ. 2006, 112, 129–134. [Google Scholar] [CrossRef]
  43. Fangueiro, D.; Coutinho, J.; Chadwick, D.; Moreira, N.; Trindade, H. Effect of cattle slurry separation on greenhouse gas and ammonia emissions during storage. J. Environ. Q. 2008, 37, 2322–2331. [Google Scholar] [CrossRef]
  44. Misselbrook, T.H.; Brookman, S.K.E.; Smith, K.A.; Cumby, T.; Williams, A.G.; McCrory, D.F. Crusting of stored dairy slurry to abate ammonia emissions: Pilot-scale studies. J. Environ. Q. 2005, 34, 411–419. [Google Scholar] [CrossRef] [PubMed]
  45. Smith, K.; Cumby, T.; Lapworth, J.; Misselbrook, T.; Williams, A. Natural crusting of slurry storage as an abatement measure for ammonia emissions on dairy farms. Biosyst. Eng. 2007, 97, 464–471. [Google Scholar] [CrossRef]
  46. Wood, J.D.; Gordon, R.J.; Wagner-Riddle, C.; Dunfield, K.E.; Madani, A. Relationships between dairy slurry total solids, gas emissions, and surface crusts. J. Environ. Q. 2012, 41, 694–704. [Google Scholar] [CrossRef]
  47. Adams, R.S.; Stevenson, F.J. Ammonium Sorption and Release from Rocks and Minerals. Soil Sci. Soci. Am. J. 1964, 28, 345. [Google Scholar] [CrossRef]
  48. Mersi, W.V.; Kuhnert-Finkernagel, R.; Schinner, F. The influence of rock powders on microbial activity of three forest soils. Z. Für Pflanz. Und Bodenkd. 1992, 155, 29–33. [Google Scholar] [CrossRef]
  49. Sparling, G.P.; BG, O.; Vaugha, D. Microbial biomass and activity in soils amended with glucose. Soil Biol. Biochem. 1981, 13, 301–307. [Google Scholar] [CrossRef]
  50. Sterner, R.W.; Elser, J.J.; Vitousek, P.M. Ecological Stoichiometry; Princeton University Press: Princeton, NJ, USA, 2003; p. 464. [Google Scholar]
  51. Li, J.; Mavrodi, D.V.; Dong, Y. Effect of rock dust-amended compost on the soil properties, soil microbial activity, and fruit production in an apple orchard from the Jiangsu province of China. Arch. Agron. Soil Sci. 2020, 16, 1–14. [Google Scholar] [CrossRef]
  52. Carson, J.K.; Rooney, D.; Gleeson, D.B.; Clipson, N. Altering the mineral composition of soil causes a shift in microbial community structure. FEMS Microbiol. Ecol. 2007, 61, 414–423. [Google Scholar] [CrossRef] [PubMed] [Green Version]
  53. Carson, J.K.; Campbell, L.; Rooney, D.; Clipson, N.; Gleeson, D.B. Minerals in soil select distinct bacterial communities in their microhabitats. FEMS Microbiol. Ecol. 2009, 67, 381–388. [Google Scholar] [CrossRef] [PubMed]
  54. Thauer, R.K.; Kaster, A.-K.; Seedorf, H.; Buckel, W.; Hedderich, R. Methanogenic archaea: Ecologically relevant differences in energy conservation. Nature reviews. Microbiology 2008, 6, 579–591. [Google Scholar] [CrossRef]
  55. Perski, H.J.; Schönheit, P.; Thauer, R.K. Sodium dependence of methane formation in methanogenic bacteria. FEBS Lett. 1982, 143, 323–326. [Google Scholar] [CrossRef] [Green Version]
  56. Sommer, S.G.; Jensen, L.S.; Christensen, M.L.; Schmidt, T. Animal Manure Recycling: Treatment and Management; Sommer, S.G., Christensen, M.L., Schmidt, T., Jensen, L.S., Eds.; Wiley: Chichester, UK, 2013. [Google Scholar]
  57. Sommer, S.G.; Husted, S. The chemical buffer system in raw and digested animal slurry. J. Agric. Sci. 1995, 124, 45–53. [Google Scholar] [CrossRef]
  58. Oenema, O.; Bannink, A.; Sommer, S.G.; Velthof, G.L. Gaseous Nitrogen Emissions from Livestock Farming Systems. In Nitrogen in the Environment: Sources, Problems, and Management; Follett, R.F., Hatfield, J.L., Eds.; Elsevier: Amsterdam, The Netherlands, 2001. [Google Scholar]
  59. Sommer, S.G.; Petersen, S.O.; Søgaard, H.T. Greenhouse Gas Emission from Stored Livestock Slurry. J. Environ. Q. 2000, 29, 744–751. [Google Scholar] [CrossRef]
  60. Deer, W.A.; Howie, R.A.; Zussman, J. An Introduction to the Rock-Forming Minerals, 3rd ed.; The Minerological Society: London, UK, 2013; p. 498. [Google Scholar]
  61. Zhang, G.; Kang, J.; Wang, T.; Zhu, C. Review and outlook for agromineral research in agriculture and climate mitigation. Soil Res. 2018, 56, 113. [Google Scholar] [CrossRef]
  62. Palandri, J.L.; Kharaka, Y.K. A Compilation of Rate Parameters of Water-Mineral Interaction Kinetics for Application to Geochemical Bodeling; US Geological Survey: Menlo Park, CA, USA, 2004.
  63. Brennan, R.F.; Penrose, B.; Bell, R.W. Micronutrients limiting pasture production in Australia. Crop Pasture Sci. 2019, 70, 1053. [Google Scholar] [CrossRef]
  64. Dove, H.; Masters, D.G.; Thompson, A.N. New perspectives on the mineral nutrition of livestock grazing cereal and canola crops. Anim. Prod. Sci. 2016, 56, 1350. [Google Scholar] [CrossRef]
  65. Masters, D.G.; Norman, H.C.; Thomas, D.T. Minerals in pastures—Are we meeting the needs of livestock? Crop Pasture Sci. 2019, 70, 1184. [Google Scholar] [CrossRef]
  66. Epstein, E. Silicon: Its manifold roles in plants. Ann. Appl. Biol. 2009, 155, 155–160. [Google Scholar] [CrossRef]
  67. Vicca, S.; Goll, D.S.; Hagens, M.; Hartmann, J.; Janssens, I.A.; Neubeck, A.; Verbruggen, E. Is the climate change mitigation effect of enhanced silicate weathering governed by biological processes? Glob. Change Biol. 2021, 00, 1–16. [Google Scholar] [CrossRef] [PubMed]
Figure 1. Measurement design: The lid (perforation accentuated) was removed from the slurry vessel, which was then put into a box with a fan and measured for 10 min with the INNOVA 1412a. After a 5-min break, in which the INNOVA attained background air concentration again, the next slurry vessel was measured in the next box. All 12 slurries were measured in a separate box according to this procedure.
Atmosphere 12 01652 g001
Figure 2. (a) Average ammonia (NH3), (b) methane (CH4), (c) nitrous oxide (N2O) and (d) carbon dioxide (CO2) emissions of the control slurry and the slurry mixed with the rock powders ‘Biolit’ and ‘Eifelgold’. Temperature values are the median degrees Celsius during each measurement period (3 h) in the barn. The red bar indicates the formation of floating crusts on the slurry surface for the control slurry and to a lesser extent on the ‘Biolit’ slurry from day 38 onwards. Vertical bars represent standard deviation of the mean (n = 4).
Atmosphere 12 01652 g002
Table 1. Particle sizes, pH, and elemental composition of the two rock powders ‘Biolit’ and ‘Eifelgold’.
Major Elements in wt%Trace Elements in ppm
Particle Size (μm)pHSiO2Al2O3Fe2O3MgOCaONa2OK2OP2O5SO3CuZnMn
Biolit10% < 2.3
90% < 79.4
9.957.0714.598.013.993.003.862.910.350.2520831059
Eifelgold10% < 2.3
90% < 77.7
1043.3714.3611.229.0611.063.163.380.510.2152781433
Table 2. Mineralogical composition of the two rock powders ‘Biolit’ and ‘Eifelgold’, all values in wt%.
MineralsBiolitEifelgold
Quartz18.97-
K feldspar13.379.17
Plagioclase43.5013.81
Amphibole2.14-
Pyroxene-44.59
Olivine-7.46
Leucite-10.63
Illite/Muscovite8.743.45
Chlorite10.55-
Iron oxides-10.89
Titanium oxides2.73-
Table 3. Summary of cumulative gaseous losses from the control slurry and from the slurry with additions of the two rock powders ‘Biolit’ and ‘Eifelgold’ expressed as mg gas per liter cattle slurry after 46 days. Total GHG emissions are CO2 plus the CO2-equivalents of CH4 and N20. (n = 4, values in parentheses are standard errors. Treatment means with different letters are significantly different to each other at p < 0.05).
TreatmentGaseous Emissions
NH3CO2CH4N2OTotal GHG
mg L−1mg L−1mg L−1mg L−1mg L−1
Control217.47
(12.34)
408.42b
(12.97)
106.37c
(14.19)
0.615a
(0.091)
2831.79c
(113.06)
Biolit217.99
(4.045)
397.12b
(9.940)
164.28b
(15.44)
0.465b
(0.226)
3390.35b
(159.20)
Eifelgold231.83
(7.666)
445.86a
(8.820)
326.46a
(22.01)
0.302b
(0.080)
7395.28a
(243.49)
Table 4. Summary Physicochemical properties of the slurry before and after the trial.
Before TrialAfter Trial
ControlEifelgoldBiolit
Dry residue (%)7.57.412.211.8
Water content (%)92.592.787.888.2
pH77.47.67.5
Organic matter (kg/cbm)56.350.148.648.1
Total N (kg/m³)3.322.152.562.25
NH4-N (kg/m³)1.750.560.870.712
P2O5 (kg/m³)1.281.451.681.59
K2O (kg/m³)3.934.496.124.57
MgO (kg/m³)0.770.893.162.67
CaO (kg/m³)1.51.733.522.98
S (kg/m³)0.350.390.4220.411
Cu (g m³)1.782.084.432.89
Zn (g/m³)9.8311.514.314.9
Na (g/m³)116146925181
Mn (g/m³)16196766
C/N (kg/m³)9.813.511.012.4
Publisher’s Note: MDPI stays neutral with regard to jurisdictional claims in published maps and institutional affiliations.

