Article

Multi-Scale Object-Based Probabilistic Forecast Evaluation of WRF-Based CAM Ensemble Configurations

School of Meteorology, University of Oklahoma, Norman, OK 73072, USA
*
Author to whom correspondence should be addressed.
Atmosphere 2021, 12(12), 1630; https://doi.org/10.3390/atmos12121630
Submission received: 4 November 2021 / Revised: 29 November 2021 / Accepted: 1 December 2021 / Published: 6 December 2021

Abstract

:
Convection-allowing model (CAM) ensembles contain a distinctive ability to predict convective initiation location, mode, and morphology. Previous studies on CAM ensemble verification have primarily used neighborhood-based methods. A recently introduced object-based probabilistic (OBPROB) framework provides an alternative and novel framework in which to re-evaluate aspects of optimal CAM ensemble design with an emphasis on ensemble storm mode and morphology prediction. Herein, we adopt and extend the OBPROB method in conjunction with a traditional neighborhood-based method to evaluate forecasts of four differently configured 10-member CAM ensembles. The configurations include two single-model/single-physics, a single-model/multi-physics, and a multi-model/multi-physics configuration. Both OBPROB and neighborhood frameworks show that ensembles with more diverse member-to-member designs improve probabilistic forecasts over single-model/single-physics designs through greater sampling of different aspects of forecast uncertainties. Individual case studies are evaluated to reveal the distinct forecast features responsible for the systematic results identified from the different frameworks. Neighborhood verification, even at high reflectivity thresholds, is primarily impacted by mesoscale locations of convective and stratiform precipitation across scales. In contrast, the OBPROB verification explicitly focuses on convective precipitation only and is sensitive to the morphology of similarly located storms.

1. Introduction

Numerical weather prediction (NWP) since the early 2000s has benefitted from advances in computational resources that allow the routine use of high-resolution, convection-allowing models (CAMs) [1,2,3,4,5]. More recently, increasing emphasis has been placed on convection-allowing ensembles (CAEs) rather than deterministic CAM forecasts [6,7,8,9,10,11,12,13,14,15,16,17,18]. For example, [7] demonstrate that simple, accessible post-processed products can improve both the qualitative interpretations and quantitative reliability of CAE high precipitation and severe weather forecasts. The authors of [14] showed that the underdispersion of CAE forecasts can be improved through the incorporation of land surface model (LSM) perturbations and indicated the need for including such perturbations in CAE designs. Furthermore, [17] found that multi-model and multi-physics CAE designs improve forecasts of mesoscale precipitation location, relative to single-model, single-physics designs.
These advances in understanding the impacts of CAE design choices on forecast aspects such as mesoscale precipitation location motivate further consideration of the CAE design impacts on other aspects of the forecast such as storm mode and morphology. Experiments comparing different CAE designs in convective events have previously emphasized spatial coverage through neighborhood-based verification methods (e.g., [6,7,9,17,19,20]) or storm morphology through subjective evaluations (e.g., [21]). Neighborhood-based methods provide an improved framework over traditional gridpoint-based methods, as high amplitude features are considerably less sensitive to spatial displacements [22]. However, the inherent smoothing impact of the neighborhood-based approach, which provides advantages in terms of reduced sensitivity to small scale spatial displacements, also has the impact of losing sensitivity to convective scale features such as precise initiation locations, storm mode, and morphology, which occurs on scales that are smoothed out during neighborhood verification [18,23].
Considering the importance of storm mode for anticipating severe weather in operational forecasting settings, new object-based techniques have been developed to address the need for objective evaluation of CAM forecasts of storm mode and morphology. Object-based frameworks have been documented to alleviate certain limitations of the neighborhood-based framework by retaining convective scale details while providing objective information about forecast aspects of interest in the context of deterministic CAM forecasts [18,24,25,26,27,28,29,30,31,32]. However, ensemble storm morphology forecasts with different CAE configurations have yet to be evaluated directly through such objective verification metrics. A suitable framework for objectively evaluating probabilistic CAE forecasts of storm mode and morphology, denoted as object-based probabilistic (OBPROB) verification, was recently developed and applied in [18]. The OBPROB framework is applied in the present study to evaluate forecasts with different CAE design configurations.
Explicitly forecasted in CAEs, probabilistic forecasts of storm mode and morphology require uncertainty of the physical processes that are closely related to their development [33] to be properly sampled in the ensemble design. Some past studies have relied on lateral boundary condition (LBC) and initial condition (IC) perturbations within a single-model, single-physics ensemble to sample forecast uncertainty and achieve member-to-member spread [8,34,35]. However, many studies verifying CAE forecasts have found that single-physics ensembles still lack aspects of forecast spread needed to more accurately represent forecast uncertainty [11,33,36,37]. To improve ensemble spread, the incorporation of physics parameterization diversity within the ensemble has been found to more adequately distribute latent heating profiles [33] and associated cold pool evolution [11]. Therefore, it is hypothesized that a larger variance of variables connected to predicted storm morphology provided by a multi-physics ensemble design will result in improved storm morphology spread and lead to improved sampling of forecast uncertainty related to these convective scale details.
A second method for maintaining spread in CAE design is related to dynamical core diversity. In a multi-model ensemble, members are comprised of two or more dynamical cores [10,17,38,39,40,41,42]. Similar to a multi-physics design, the use of multiple dynamical cores in a single ensemble forecasting system has been found to be advantageous with respect to single-model ensembles due to better sampling of flow uncertainty [41]. However, the means by which uncertainty is generated is different for multi-model and multi-physics ensembles: multi-model ensembles generate uncertainty through both physics and numerical schemes, whereas multi-physics ensembles grow uncertainty solely through the physics parameterizations [43]. The additional spread from the dynamical core diversity can be desirable in a forecasting context; however, [17] notes that the clustering of forecasts can negatively impact a multi-model ensemble forecast. Translating these findings to a convective scale forecast, it is hypothesized that a multi-model ensemble will improve upon constituent model forecasts of storm morphology due to an increased sampling of uncertainty and better representation of error growth.
The purpose of this study is to objectively evaluate the impacts of ensemble design choices on probabilistic forecasts of convective mode and morphology using a newly extended OBPROB technique. In turn, the further developments to OBPROB are expected to improve its usefulness in operational convective forecasting settings. In furtherance of this purpose, a comparison between the extended OBPROB and neighborhood-based verification is used to highlight the impacts of CAE design on the forecast aspects verified by both of these different methods and provide a more comprehensive evaluation of the CAE designs than either method by itself can provide. A better understanding of ensemble design choices and their impacts on forecasts of storm morphology can be gleaned through such explicit evaluation of both the ensemble storm morphology forecasts via OBPROB and the mesoscale precipitation location forecasts via the neighborhood-based approach.
The rest of the paper is organized as follows. Section 2 describes the OBPROB method in full, including object definition, matching, and probabilities, in addition to an extension to separately evaluate objects of different spatial scale that is introduced in this study. Section 3 describes the ensembles used, ten retrospective case studies, and the verification metrics to be shown in the results. Section 4 describes the results, including objective verification, subjective interpretation, and comparison to neighborhood-based results. Then, the main conclusions are discussed in Section 5.

2. OBPROB Methodology

The OBPROB method described in [18] is adopted herein to assess forecast performance with different CAE designs. The convective mode of modeled storms is essential to severe weather forecasting [44,45,46,47]. An advantage of the OBPROB technique is that information on the convective mode is retained in the objective verification. The OBPROB verification procedure starts with defining objects; then, it moves to matching objects, and it finishes with object probabilities and verification.

2.1. Object Definition

Object definition in this study is similar to the method outlined in [18]. First, a 6 km (two-grid point) Gaussian smoother is applied to ensemble reflectivity fields to reduce grid-scale noise while retaining convective scale features of interest to the storm morphology forecast. Then, objects are defined using a predefined dBZ threshold above which all closed contoured values are outlined. Afterwards, for each object defined, attributes are calculated, including object area, which is the total number of grid points within the object, object longest axis (i.e., length), object aspect ratio (i.e., length divided by width), and object centroid location. The objects that contain an area less than 42 grid points are omitted to remove any objects with an approximate diameter below the effective resolution of the ensemble [18,48] and are unlikely to represent coherent and meaningful storms of interest to severe weather forecasters.

2.2. Object Matching

As in [18], the object matching process follows a simple application of interest functions [26] to define the similarity of object attributes. Figure 1 shows the shape of the interest functions used herein with e-folding values of 200 km for object centroid distance (Figure 1a), 0.33 for object area (shown as 1.0–0.33 since larger ratios indicate larger interest; Figure 1b), and 0.5 for object aspect ratio (Figure 1c). In accordance with subjective interpretation by the author and participants in the HWT (Hazardous Weather Testbed), these parameters have been selected to provide realistic object matching, including a change in the aspect ratio e-folding value from 0.2 (used in [18]) to 0.5 (Figure 1c). Based on two objects’ individual object attribute interest values, a total interest, I, is calculated:
Itotal = fa1fa2fa3.
From Equation (1), as in [18], total interest can be defined as the product of each individual attribute interest value, fa. If a pair of objects’ total interest exceeds that of a predefined threshold, the two objects are considered a match (i.e., they represent a storm that would be interpreted similarly in a forecasting context). Here, we use a matching threshold of 0.35. This value is adjusted from [18], which used a matching threshold of 0.2. This adjustment corresponds to a change from using the difference of object aspect ratios to the ratio of object ratios (similar to how area interest is calculated) based on improved subjective performance with this change found subjectively by the authors.

2.3. Object Probabilities

The OBPROB method assigns object probabilities that concisely represent the uncertainty of all potential storm modes predicted within the ensemble. The step-by-step method follows [18] and consists of the following steps:
  • Compile all forecasted objects into a single array with corresponding probabilities equaling the fraction of members with a matching object.
  • Sort object probabilities in descending order, with ties in probability going toward the object with highest average total interest from the matching object in other members.
  • Plot the highest probability object.
  • Remove the highest probability object, in addition to all associated matching objects from the total array of objects, giving a new, shortened array.
  • Repeat steps 2–4 until no objects remain in the array.
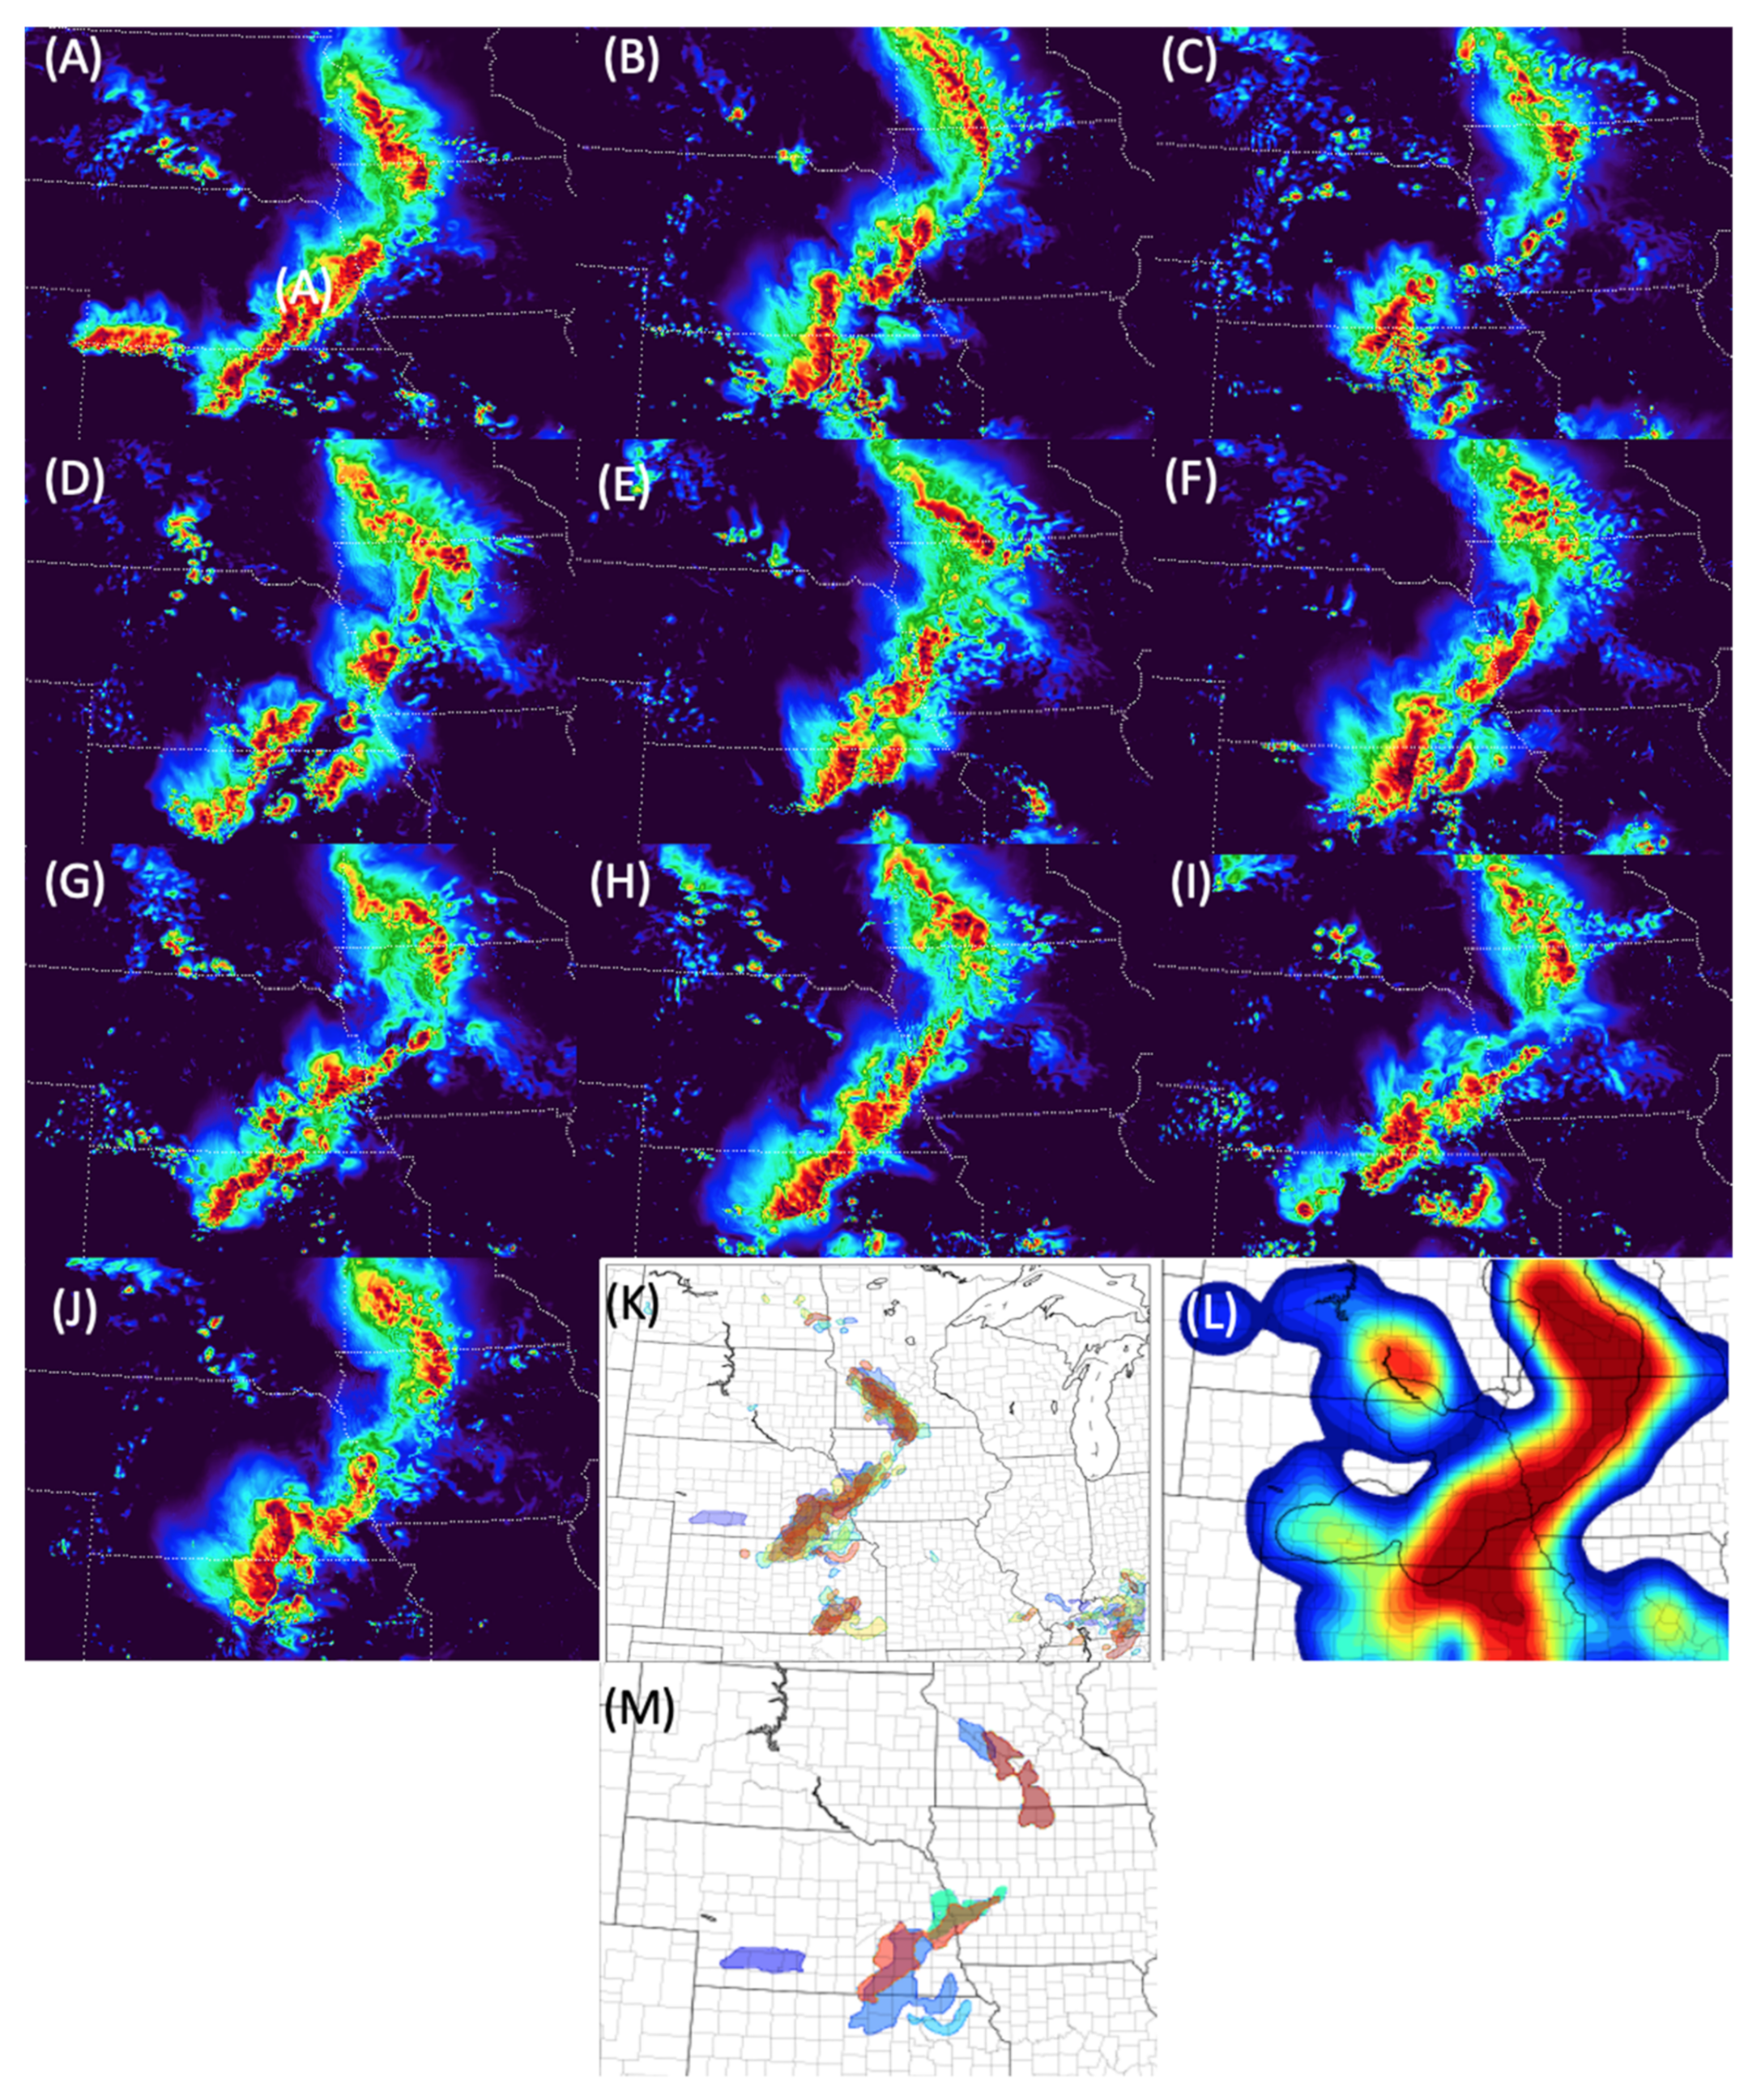
Figure 2L highlights a key limitation of neighborhood-based forecasts resulting from the smoothing of convective scale details, as a singular high probability contour extends from Minnesota through Kansas, while an object-based paintball plot (Figure 2K), which plots a simple overlay of each individual member forecast onto a single plot, more explicitly shows that two separate linear squall lines are forecasted. The OBPROB plot (Figure 2M) can be interpreted similarly to the paintball plot. However, a key difference is the simplicity of the OBPROB plot, since redundant objects are plotted only once (i.e., the 80% probability red object in Nebraska had eight out of 10 members with a matching object, leaving eight objects to be plotted once, as represented by the red Nebraska object). Additionally, Figure 2M shows that the OBPROB plot still retains low probability objects, such as the blue object in western Nebraska. Thus, the OBPROB plot, while accelerating subjective interpretation of explicitly resolved storm morphology ensemble forecasts, can be used for objective verification of the ensemble distribution of storm objects in terms of their mode and morphology.

2.4. New Extensions of OBPROB Method

The OBPROB method described in [18] was also further extended in the present study to include a bias correction component, to filter stratiform objects, and to separately evaluate objects on different spatial scales including single-cell, multi-cell, and mesoscale organized objects (denoted by meso-gamma, meso-beta, and meso-alpha, respectively).
The first innovation in the OBPROB methodology for this study was accounting for model bias in reflectivity fields. Subjective analysis revealed the need to adjust for model reflectivity bias, as certain physics schemes necessitated a method of accounting for the different reflectivity values characteristic of robust convection in different ensemble members. Table 1 details a hypothetical example of the technique used, which is the same method developed and used in [49]. Here, we consider the observation reflectivity distribution, locating the percentile at which 40 dBZ occurs, which is the value that is used to define observation objects in this study. Then, we take the observation reflectivity percentile and apply it to the forecast reflectivity distribution, finding the corresponding forecasted dBZ value at the same percentile. This effective bias correction was performed separately for each forecast hour to account for a diurnal variation of bias and for each model configuration, including separate bias correction for different members with different physics configuration. The end result led to more continuous object matching from member to member, in addition to directly justifiable comparisons to observation objects and their attributes.
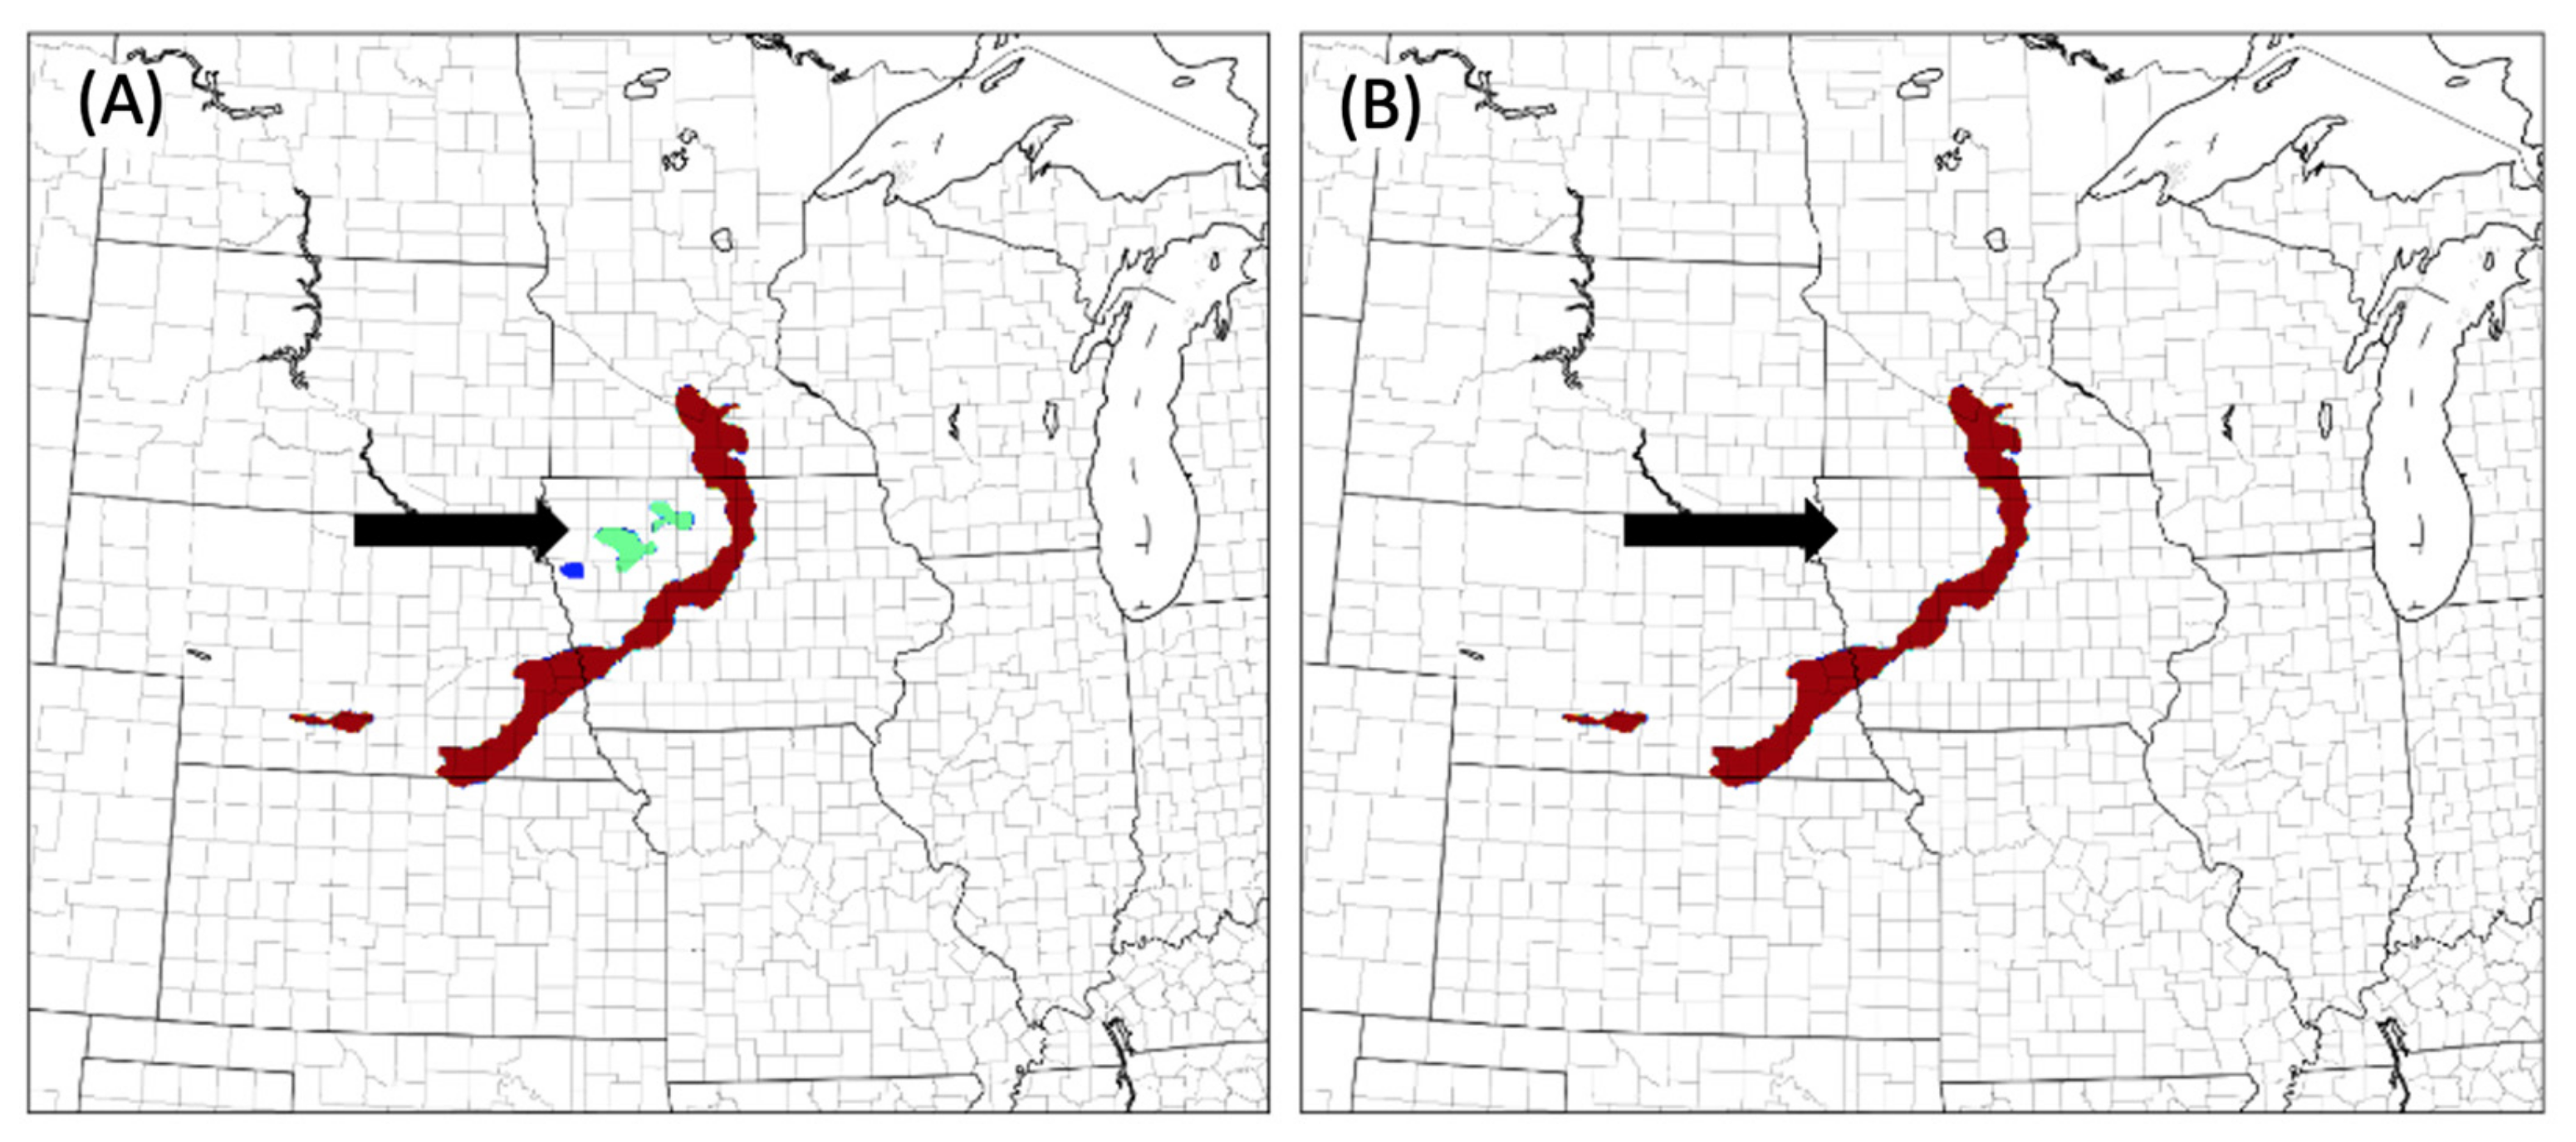
Since this study has a specific focus on verification of storm mode and morphology, the second innovation to the OBPROB method included stratiform observation object filtering. Illustrated in Figure 3, a radar bright band effect was seen to generate observation objects not corresponding to robust convection (Figure 3a). Such objects are filtered out through the use of a 46 dBZ threshold criterion for the 95th percentile of within-object reflectivity. This threshold was determined by evaluating the within-object reflectivity distributions of subjectively categorized convective and stratiform objects. The result allows for a greater focus on verifying convective storm mode and morphology (Figure 3b).
The final innovation in the OBPROB method included the separation of forecast objects based on a convective organization scale (i.e., single-cell, multi-cell, and mesoscale organized). It is expected that attributes such as the spatial location, size, and shape of largely organized convective systems are much more predictable than attributes for discrete, loosely organized convection [50,51,52,53]. Prior works on convective organization [54] suggest there are different dynamical complexities at different convective organization scales. Here, we categorize the scale of organization based on the object longest axis length and choose bounds on three categories to evenly distribute the sample size across the three categories. Category bounds are 45 km (15 grid points) and 75 km (25 grid points), where objects containing a longest horizontal axis less than 45 km are loosely considered as single-cell, between 45 and 75 km are multi-cell, and greater than 75 km are mesoscale organized.
Objects of mesoscale organized convective systems, multi-cell systems, and single-cell systems are verified separately with varying verification techniques appropriate for each scale. Figure 4 illustrates the differing verification methods for each category. For mesoscale organized systems (Figure 4a), the novel OBPROB method is used solely, as some predictability of storm mode and morphology is expected. For smaller, less organized convection (i.e., multi-cellular and single-cellular), object probabilities are returned to grid point space through a Gaussian smoother applied to the OBPROB probabilities for objects in that size category (Figure 4b,c). Both meso-beta and meso-gamma scales use a Gaussian radius of 10 grid points (30 km), which was subjectively shown to best represent realistic probabilities.

3. Experiment Design

3.1. Experiment Description

Four ensemble-to-ensemble comparisons from four different ensembles are conducted to address the impacts that ensemble design has on storm mode and morphology forecasts, as outlined in Table 2 and Table 3. Each ensemble consists of ten members (a control member and nine re-centered EnKF perturbations) initialized from the final EnVar analysis described in [17]. Of the four ensembles listed in Table 2, NMMB and ARW-SP are single-model, single-physics designs. NMMB uses Ferrier–Aligo microphysics [55], Mellor–Yamada–Janjic (MYJ) boundary layer physics [56], and a NOAH land surface model scheme [57]. ARW-SP uses Thompson microphysics [58,59], Mellor–Yamada–Nakanishi–Niino (MYNN) boundary layer physics [60], and the RUC land surface model scheme [61]. ARW-MP is a multi-physics design using four different microphysics schemes, three planetary boundary layer (PBL) schemes, and two land-surface model (LSM) schemes. The four microphysics schemes included in ARW-MP are Thompson, the National Severe Storms Laboratory (NSSL) bulk two-moment scheme [62], the Morrison two-moment scheme [63], and the P3 scheme [64]. ARW-MP PBL parameterizations consist of MYJ, MYNN, and the Yonsei University Scheme (YSU; [65]). Finally, the LSM schemes in ARW-MP are NOAH and RUC. The fourth ensemble, MM (multi-model), is composed of five members from NMMB and ARW-SP. Since MM consists of NMMB and ARW-SP members, corresponding physics parameterizations are different in the NMMB and ARW-SP members of MM.
Each ensemble-to-ensemble comparison, outlined in Table 3, is devised to address the specific impacts that certain ensemble design choices have on storm morphology forecasts. By doing so, information ranging from how specific design choices affect the forecast, to which environments certain designs are most well suited to forecast, can be gleaned. As in [17], all ensembles are verified over ten retrospective case studies from 2015 to 2016 (Table 4). The selected cases make up a diverse set of synoptic scale forcing, geographical location, time of day, and observed storm mode and morphologies, enhancing the robustness of conclusions.
The object-based forecast evaluations are also compared to a neighborhood-based evaluation. Due to this study’s focus on extreme events (i.e., strong convective precipitation), neighborhood maximum ensemble probability (NMEP) is the selected method, as recommended by [20]. Previous studies suggest that optimally addressing model error may rely on a combination of techniques to maintain appropriate ensemble diversity [13,17,66,67]. The use of multiple verification methods allows emphasis on the OBPROB method’s ability to effectively resolve convective scale details and provide unique probabilistic storm morphology information.

3.2. Verification Methods

The verification of object-based and neighborhood-based forecasts is performed in terms of the forecasted composite reflectivity fields. ARW member forecasts are bilinearly interpolated to the NMMB grid to ensure consistency between the separately defined NMMB and ARW domains in the MM ensemble. Observations are obtained from the Multi-Radar Multi-Sensor (MRMS; [68]) composite reflectivity mosaic. Then, observation objects are compared to the OBPROB forecast objects using the same interest functions and total matching thresholds used for object matching within OBPROB. The neighborhood-based verification uses neighborhood radii of four, eight, and sixteen to loosely correspond to the scale-separated OBPROB forecasts.
As described above, the object-based verification is separated by storm organizational scale (i.e., meso-alpha, meso-beta, meso-gamma). Meso-alpha scale object verification is conducted using the Brier score (BS; [69]), while meso-beta and meso-gamma verification is done using the fractions Brier score (FBS; [7,70]). Ensemble-to-ensemble comparisons are reported as 1-BS1/BS2, where BS1 and BS2 are the BS of the two ensembles being compared, effectively making reported values a BSS relative to the ensemble in comparison. Other probabilistic object-based forecast metrics, including resolution, reliability and sharpness, are also used to evaluate the full probability forecast. In addition, for the object-based verification, ensemble object attribute climatologies are directly compared using normalized attribute distributions for the attributes of object area, longest axis length, and aspect ratio.
Similar to meso-beta and meso-gamma objects, neighborhood-based verification uses a Brier skill score (BSS) computed from the FBS:
BSS = 1 − FBS/FBSref.
In Equation (2), the FBS is calculated as a domain-wide mean squared difference of NMEP fields and observed neighborhood probability fields. The FBS of the reference forecast (FBSref) is calculated as a climatological probability of event occurrence averaged over every grid point within the domain. The climatological probability is estimated as the frequency of occurrence across the domain and across all cases considered in this study.
The statistical significance of probabilistic verification for both techniques follows the one-sided permutation resampling method used in [10]. Each mesoscale organized object is treated as a separate event and thus as independent samples themselves. Since each ensemble is forecasting a slightly different set of “events”, permutation resampling at this scale randomly reassigns objects to an ensemble instead of utilizing paired samples. For multi-cell and single-cell objects, subsample subdomains are defined based on observation object locations. Utilization of the previously used e-folding centroid location interest distance for object matching (i.e., 200 km for meso-beta and 150 km for meso-gamma) allows for overlapping subdomains to be deemed correlated and co-joined into one singular subsample. The statistical independence of forecast errors in these regions was confirmed by inspecting the correlation coefficient of randomly selected regions within the same forecast case to reside at or below 0.3, indicating weak correlation. For the neighborhood-based approach, a single daily contingency table sample from each case was used [17,71].

4. Results

4.1. Objective Verification

4.1.1. Object Attribute Distributions

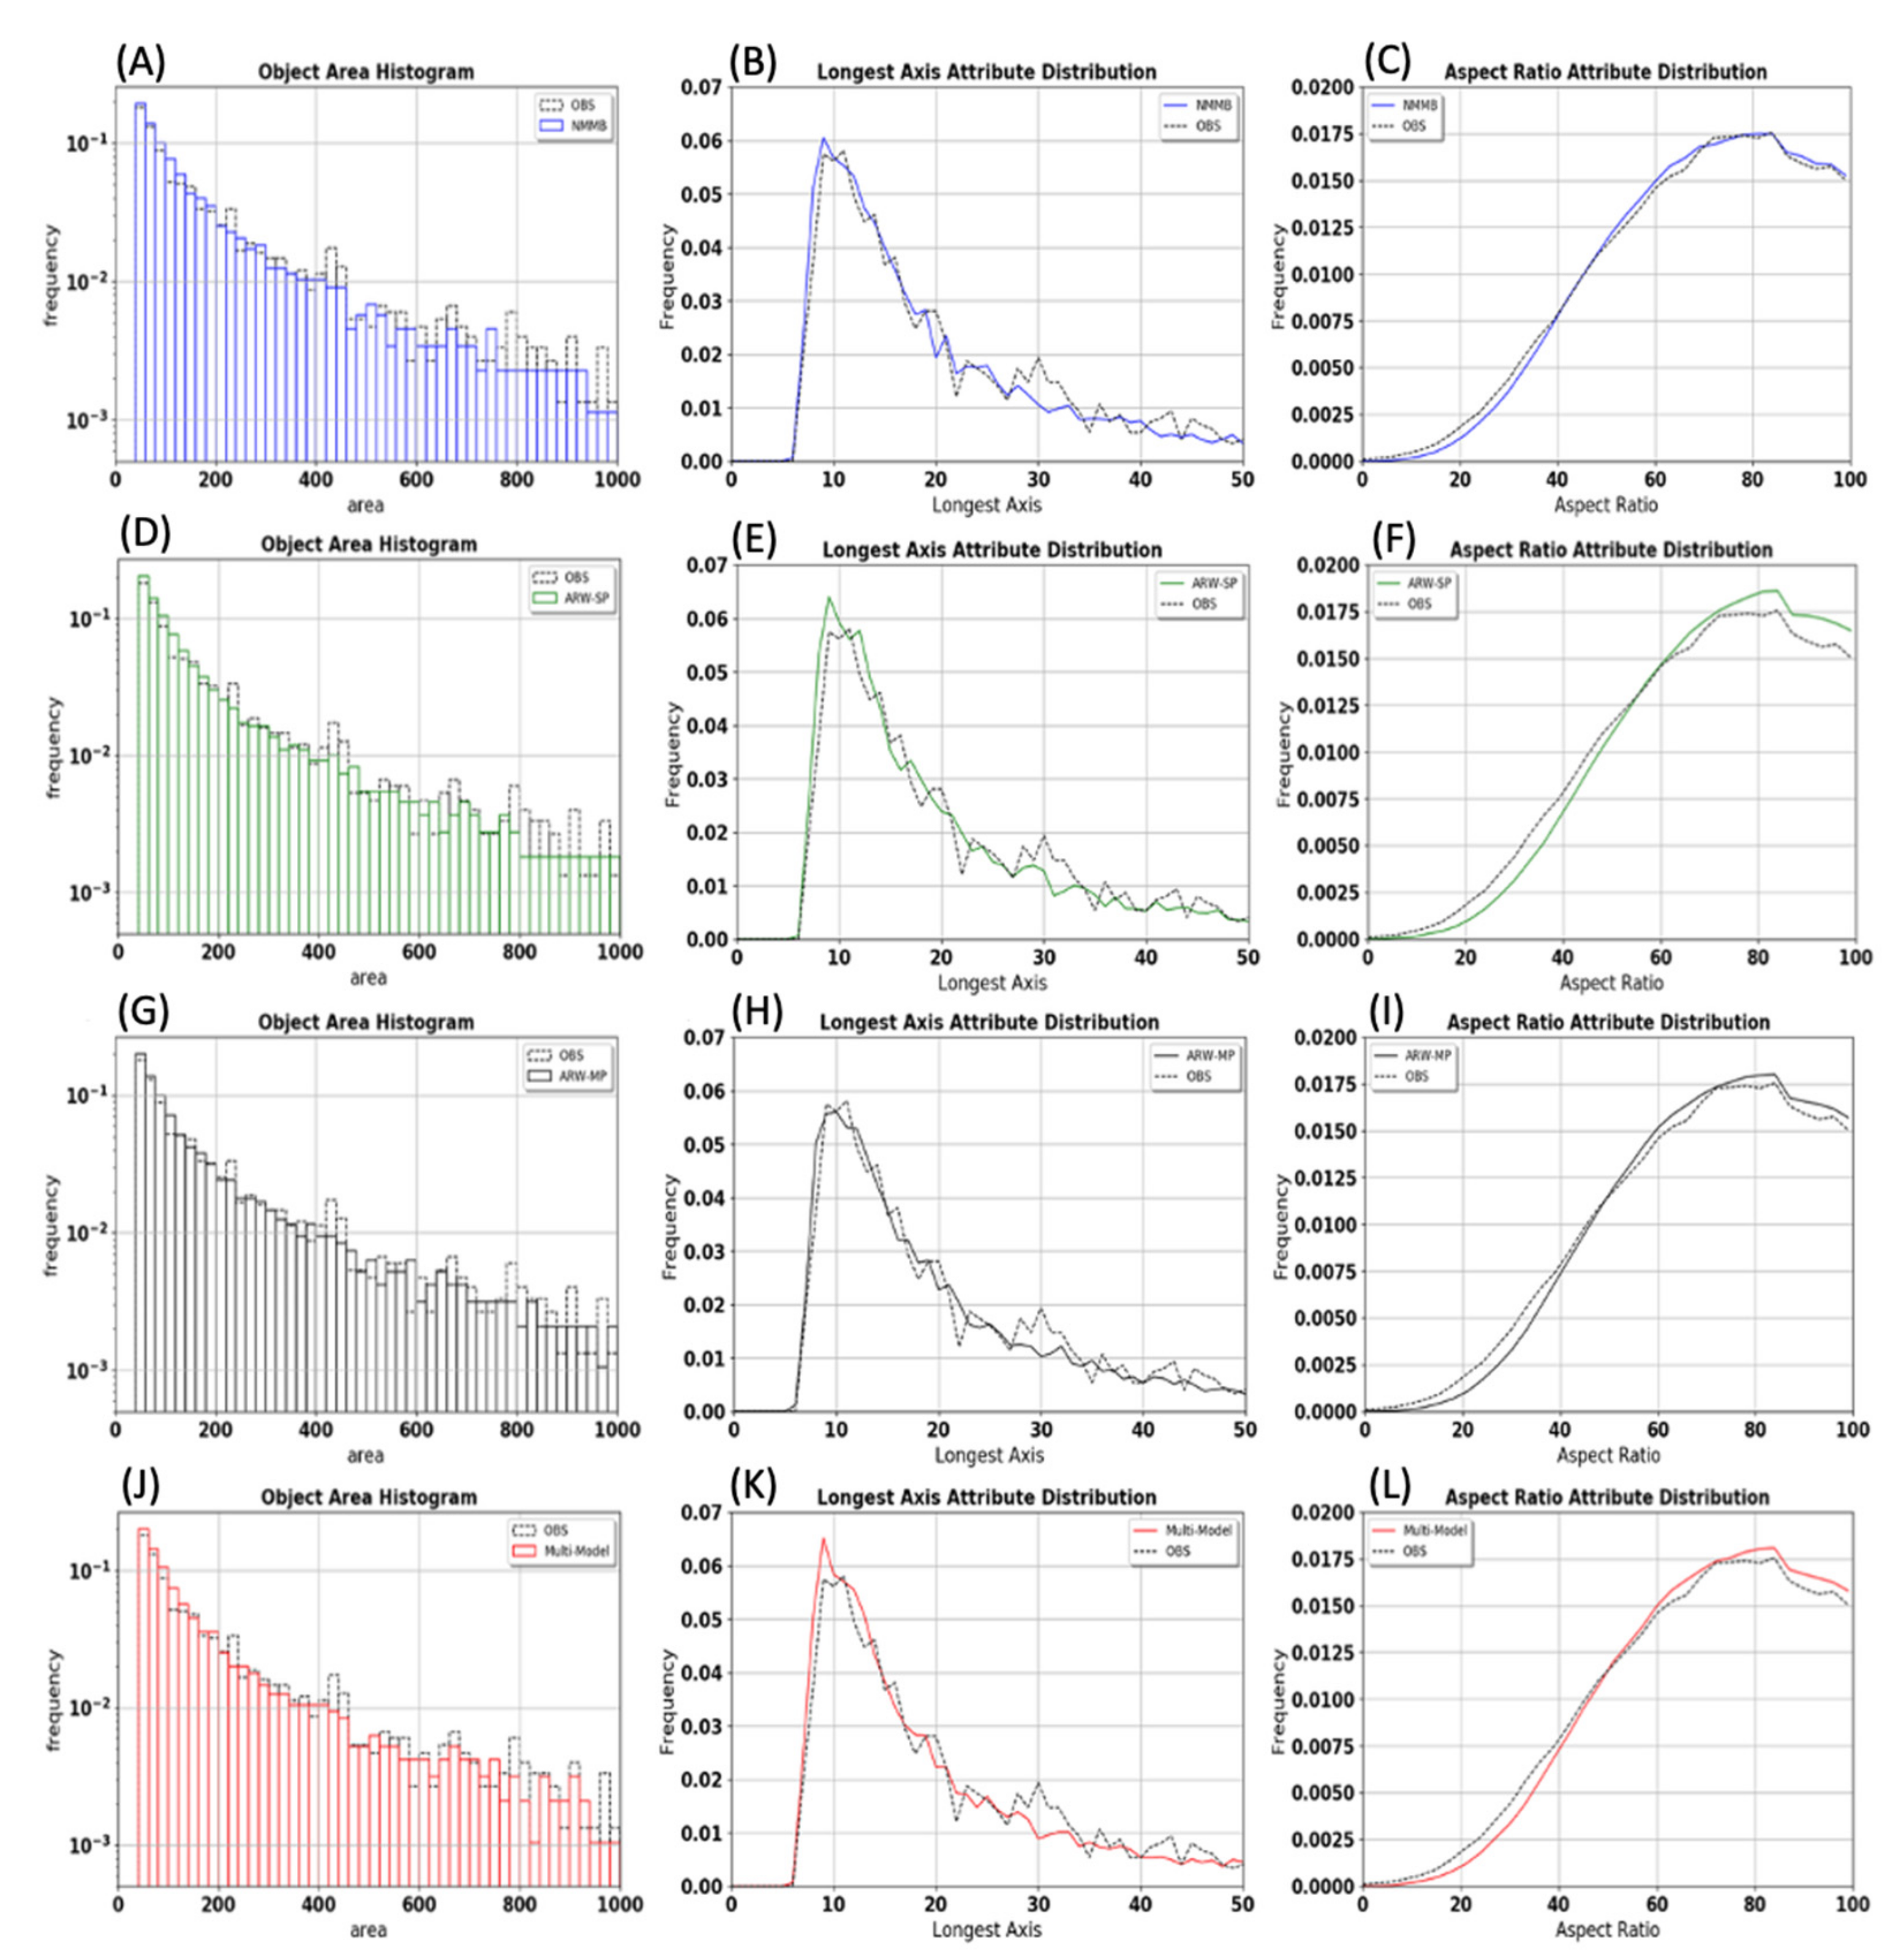
Normalized distributions of each object attribute and every ensemble are shown in Figure 5. Objects are aggregated over every forecast hour and case to reveal systematic differences in object attributes among ensembles and between forecasts and observations. Resampling tests are used to evaluate statistical significance at the 95% confidence level of select differences seen subjectively in Figure 5. Cumulative differences for all objects greater than and less than 300 km for object area are separately compared to 1000 resampled differences where each of the 10 cases were sampled with replacement. Resampling tests reveal that ensemble forecast distributions produce statistically significant differences between forecast and observation attribute distributions. In particular, collective forecast and observation distribution differences on either side of 300 grid points for object area were statistically significantly different. Contrarily, object attribute distribution differences from ensemble to ensemble did not result in statistically significant differences.
All SMSP object attribute plots suggest, in varying levels of clarity, that ARW-SP forecasts additional small, short, circular objects compared to NMMB. For example, the ARW-SP aspect ratio (Figure 5f) shows over-forecasting of larger aspect ratios above ≈0.6 and under-forecasting of smaller aspect ratios below ≈0.6. This is a result of the over-forecasting of small, circular objects for ARW-SP. Based on Figure 5, all other ensemble-to-ensemble comparisons show that the main contrasting qualities between forecasted object attributes are confined to smaller, shorter, circular objects, indicating that ensemble design choices predominantly affect attributes of the smaller scale objects. While the addition of multiple physics parameterizations into the ensemble design improves object forecast distributions, the addition of multiple dynamical cores does not. Additionally, SPMP, MSMM, and MPMM all show ensemble object attribute distributions for larger, mesoscale organized objects are generally similar. Therefore, the probabilistic verification of forecasted storm mode and morphology at large scales is largely independent from systematic object attribute distribution biases.

4.1.2. Probabilistic Verification and Forecast Spread

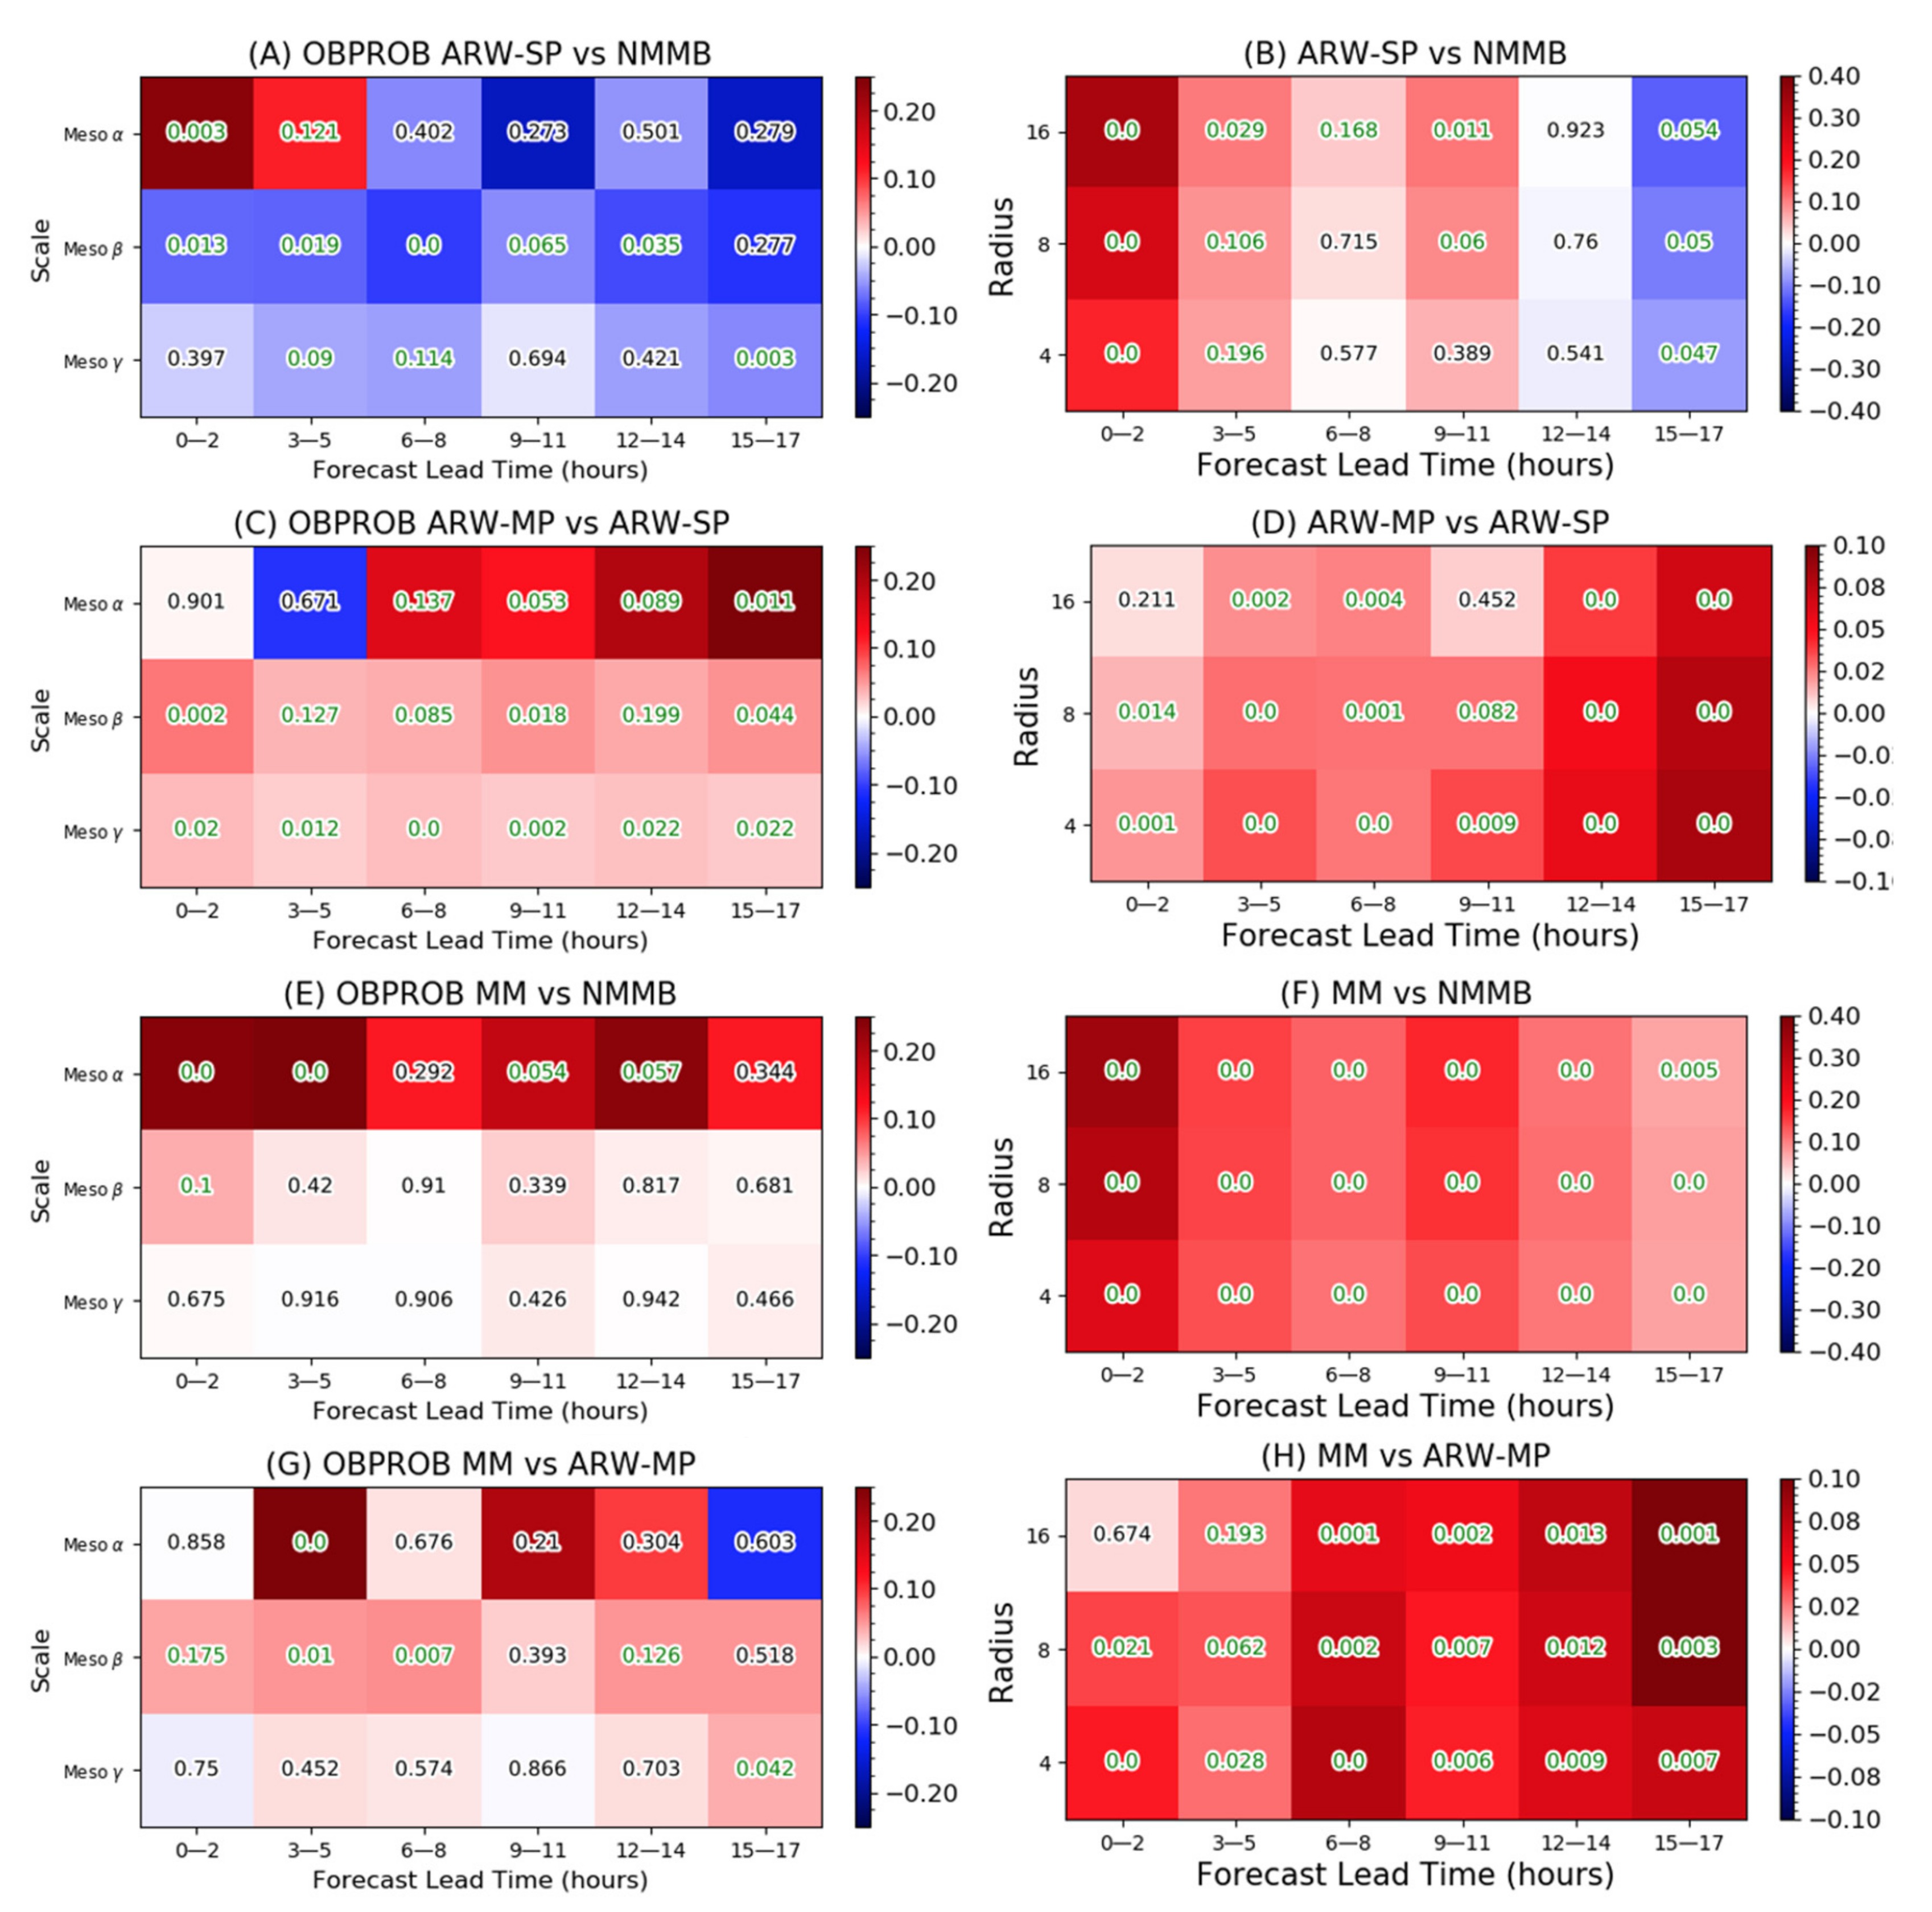
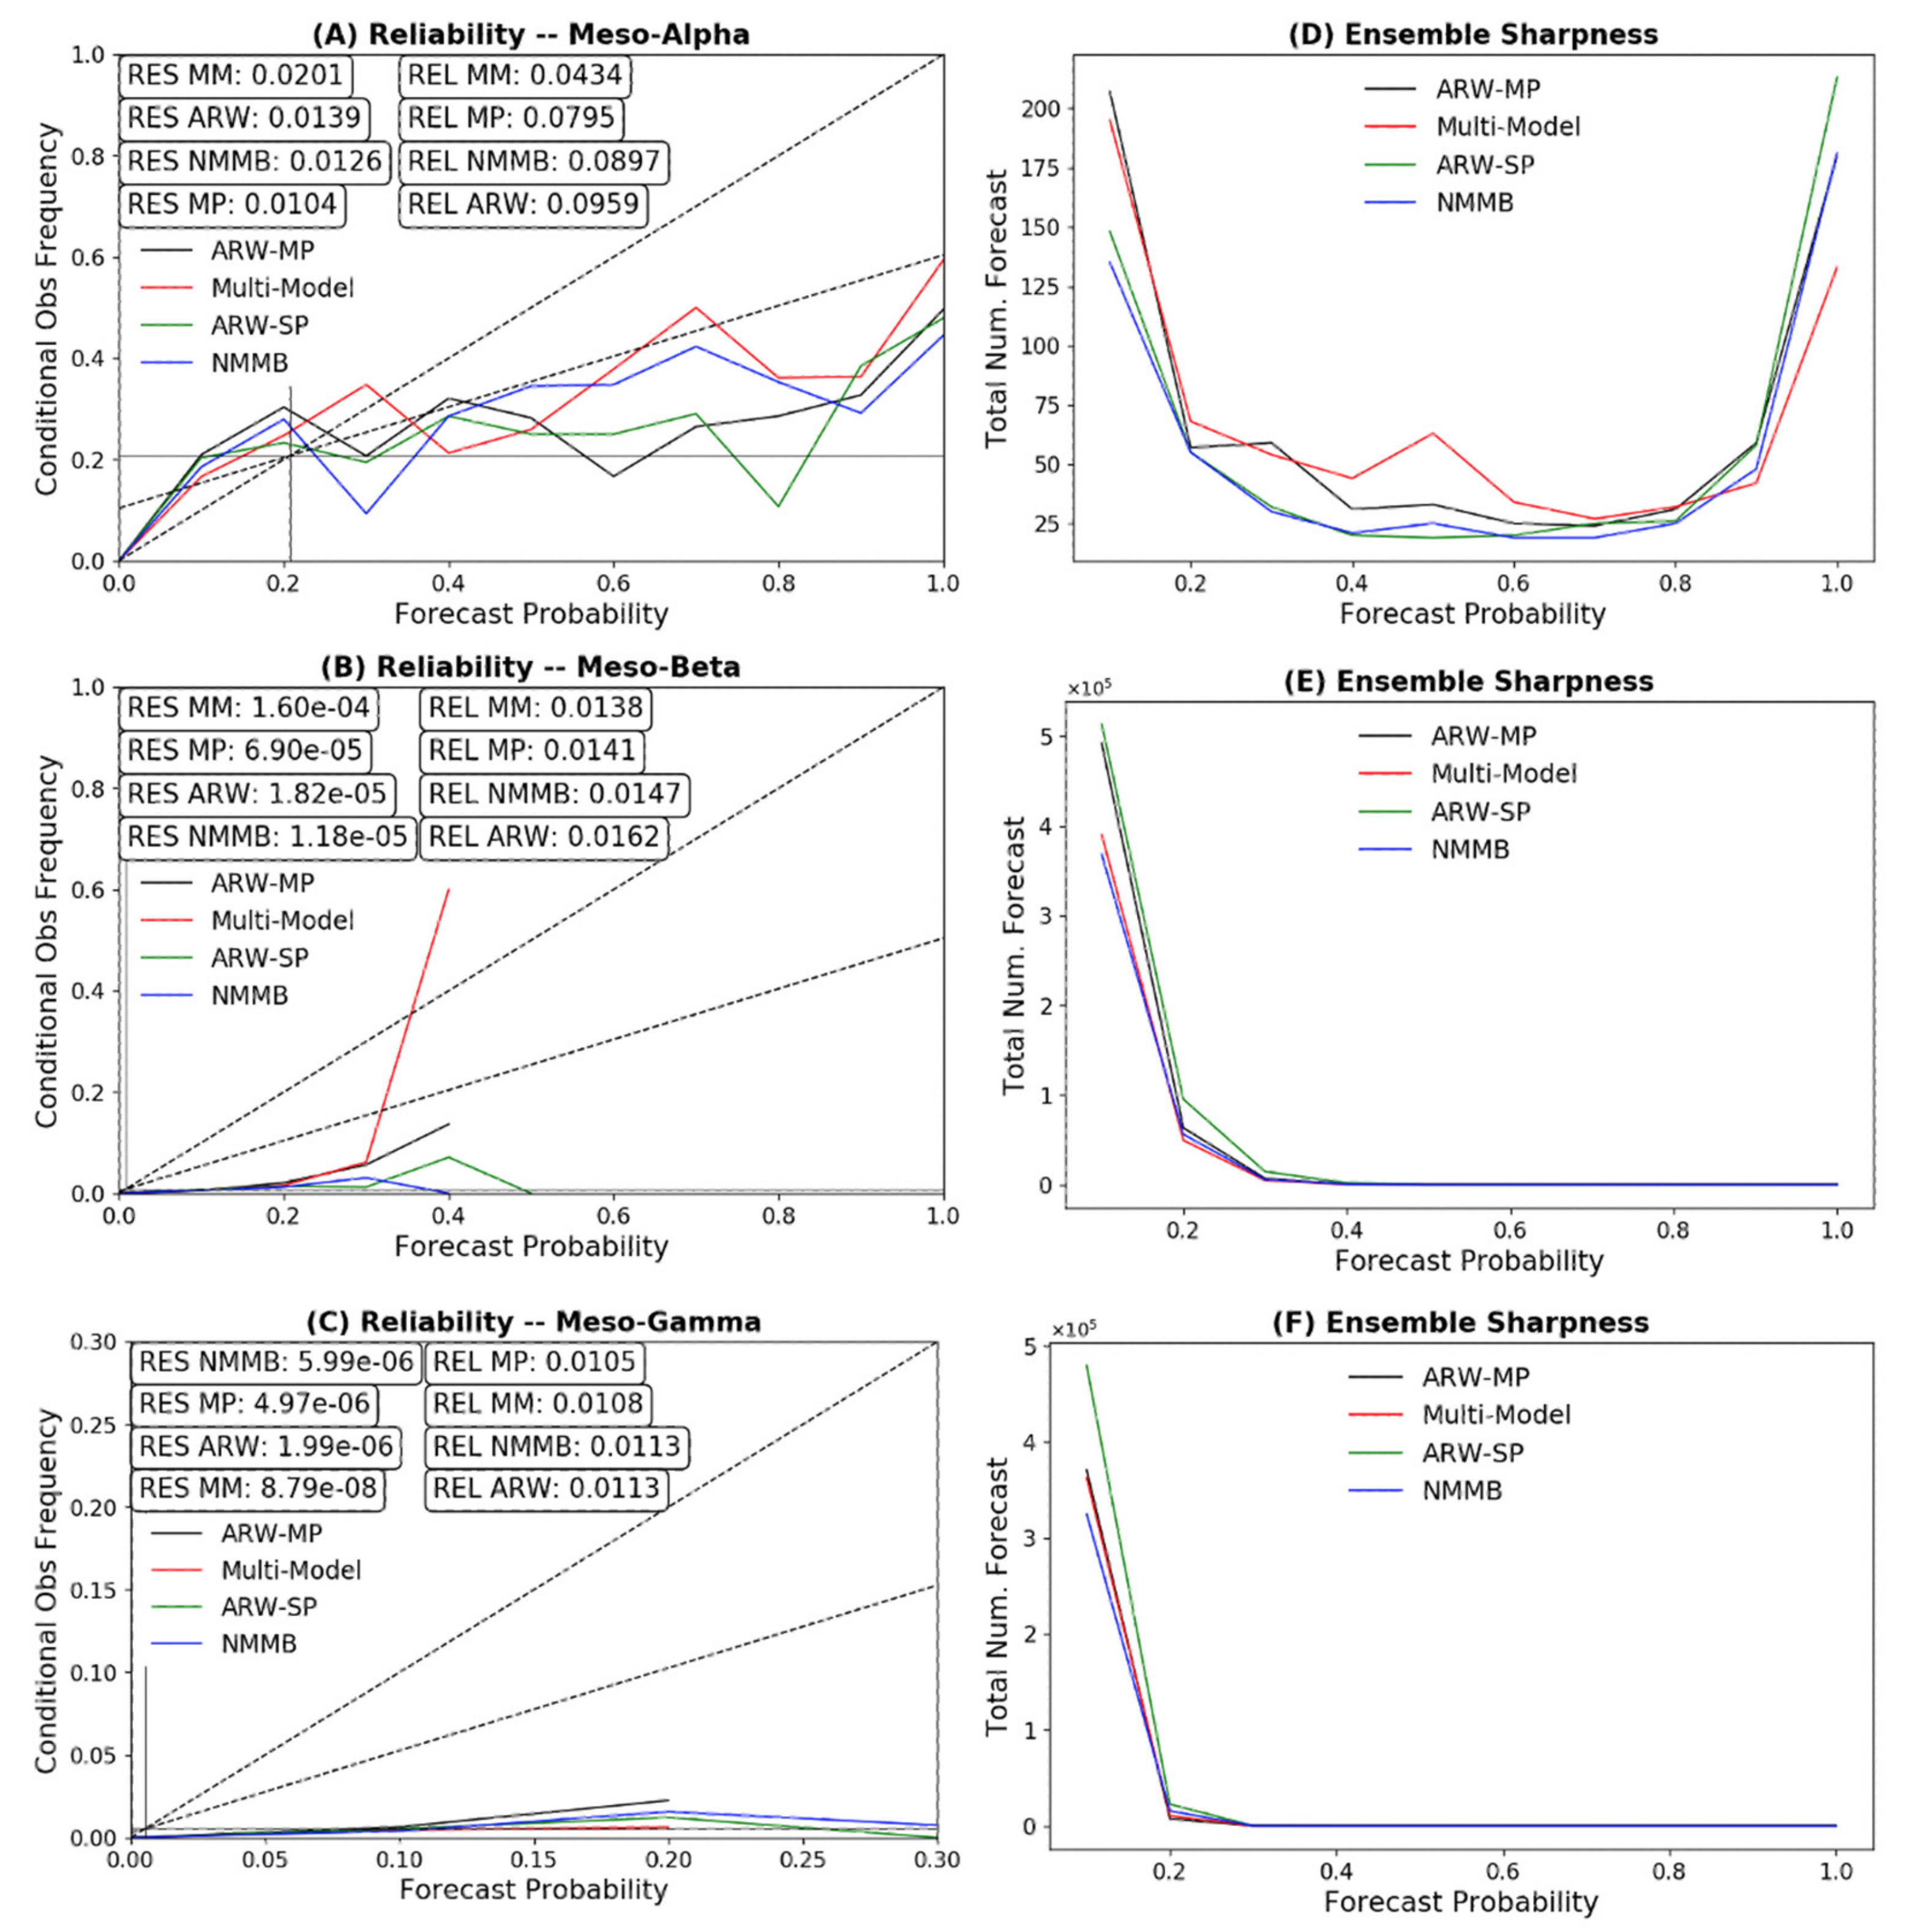
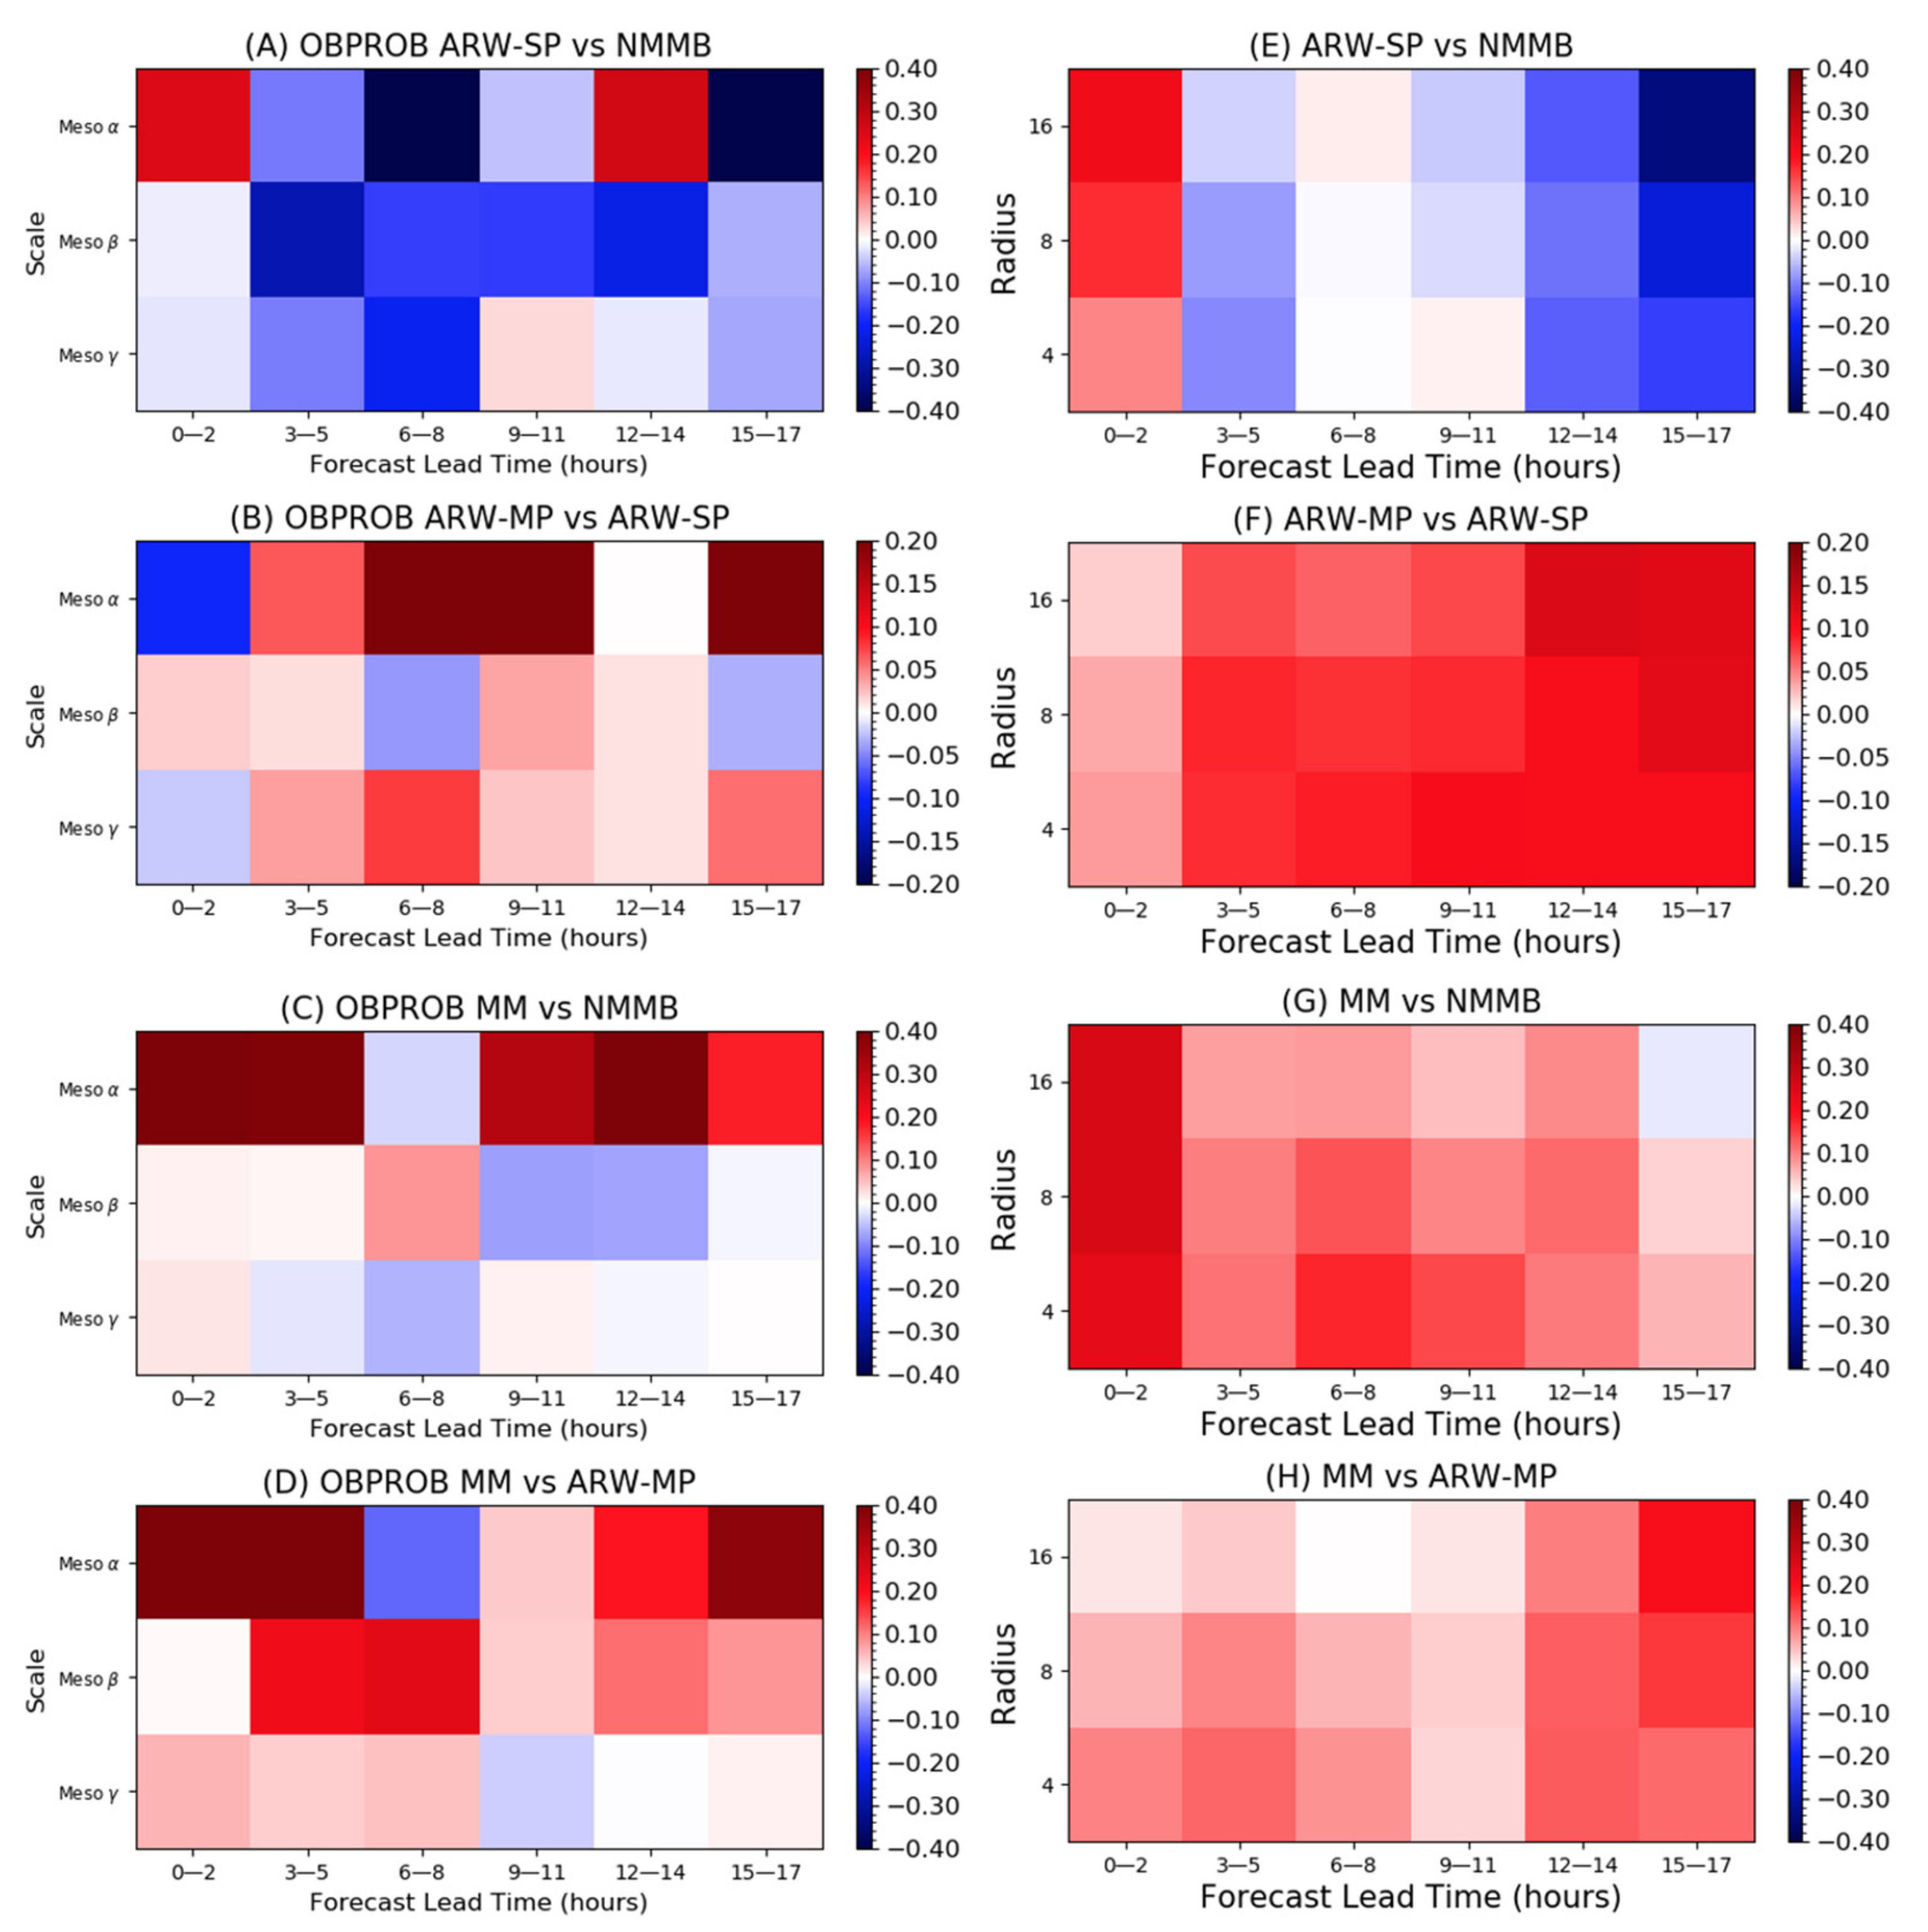
Figure 6 summarizes the OBPROB verification results. Each box in Figure 6 represents a bin of three forecast hours to decrease sampling noise, as the sample sizes per forecast hour are less in the OBPROB object space compared to a typical gridpoint space. Reliability diagrams are also used to indicate the degree to which a forecast can be taken at face value, and the BS resolution component is used to indicate the ability of the forecast to differentiate separate events of varying frequencies of occurrence [72,73,74,75,76]. Perfect reliability occurs when forecast probabilities match the observed frequency. Additionally, sharpness plots show corresponding probability frequencies (counts) that fall into each probability bin in the reliability diagram.
Figure 6a summarizes the results for the SMSP ensembles. For mesoscale organized objects (top row), ARW-SP contains more skillful storm morphology forecasts for the first two forecast bins but worse forecasts thereafter. The greater ARW-SP skill at early lead times is statistically significant (Figure 6a), while the times where NMMB contains better verification are not statistically significant, which is likely due to the limited sample size of objects from 10 forecasts. Object-based reliability diagrams (Figure 7) show that the advantage at early lead times of ARW-SP corresponds to a reduced frequency of high probability objects (Figure 7d), which tend to have relatively poor reliability (Figure 7a). At the multi-cell and single-cell scales, a more uniform result across forecast times shows NMMB to have higher skill. The NMMB advantages at the meso-beta and meso-gamma scales corresponds to better reliability than ARW-SP (Figure 7b,c). The neighborhood-based verification of the SMSP ensembles (Figure 6b) yields similar results as OBPROB at meso-alpha scales, with ARW-SP more skillful at early lead times and NMMB more skillful at late lead times. At smaller convective organization scales (meso-beta and meso-gamma), neighborhood verification largely contrasts with OBPROB, as ARW-SP has greater skill up until late lead times. These results suggest that object-based and neighborhood-based methods are sensitive to separate aspects of the forecast, as will be discussed below.
Figure 6c summarizes the results for the SPMP ensembles. At the meso-alpha scale, ARW-MP generally becomes more skillful as the lead time increases with statistically significant differences after the 6–8 h forecast bin. The improved skill for ARW-MP again corresponds to fewer high (near-100%) probability objects (Figure 7d), which have poor reliability (Figure 7a). Furthermore, the object probabilities are more evenly distributed for the ARW-MP ensemble, which is indicative of improved spread in the storm morphology ensemble forecasts. Similarly, meso-beta and meso-gamma scale verification shows an ARW-MP advantage at all lead times (Figure 6c), which is consistent with both improved reliability and resolution (Figure 7b,c). Neighborhood-based verification shows similar results to OBPROB, with ARW-MP increasing in relative skill as the lead time increases at the meso-alpha scale (Figure 6d) and uniformly greater skill for ARW-MP on meso-beta and meso-gamma scales (Figure 6d). A notable difference between the neighborhood-based and OBPROB verification is associated with the changing of the convective organization scale. For object-based results, ARW-MP shows the most benefit as the scale increases, while neighborhood-based results show that ARW-MP is the most skillful as the scale decreases. The differing verification trends are suggestive of the neighborhood-based method smoothing over convective scale features pertinent to the object-based verification, particularly at large radii.
Figure 6c summarizes the results for the multi-model ensembles. Meso-alpha scale OBPROB forecasts have greater skill with MM than NMMB at all forecast times. Reliability diagrams at the meso-alpha scale (Figure 7a) show greater forecast reliability for MM (red) than NMMB (blue) for all forecast probability bins except 40 and 50%. The peak seen at 50% on the associated sharpness diagram (Figure 7d) indicates that clustering is likely why MM forecasts struggle with intermediate probabilities (i.e., ARW-SP and NMMB members agree upon separate respective convective events). Despite clustering issues, MM still contains the most diverse distribution of forecasts, which is depicted by a more evenly distributed sharpness plot (Figure 7d). At smaller convective organization scales, the results show statistically insignificant probabilistic differences in ensemble performance, except for the first bin at the meso-beta scale. Increased sample sizes from additional cases are likely needed to reveal any impacts of multi-model ensemble design on the smaller scale object-based probabilistic forecast skill. For neighborhood-based verification (Figure 6f) at large radii and convective organization, MM significantly improves over NMMB, with the greatest skill increases also shown at early lead times. For neighborhood radii corresponding to storms organized at multi-cell and single-cell scales, the advantage of MM is statistically significant.
Figure 6g summarizes the results for the MPMM ensembles. At the meso-alpha scale, MM has greater skill than ARW-MP except for the 15–17 h forecast bin. However, only the 3–5 forecast hour bin difference is statistically significant. Reliability diagrams for the meso-alpha scale (Figure 7a) also indicate improved reliability and resolution for MM. Multi-cell objects also were forecasted better by MM than ARW-MP, with statistical significance in four forecast bins. Single-cell object skill differences only show a significant advantage for MM in the 15–17 h forecast bin. Neighborhood-based verification shows uniform and significant skill advantages for MM over ARW-MP, with the exception of the 0–2 forecast hour bin at a radius of 16, (Figure 6h). Furthermore, NMEP verification shows MM successively improving upon ARW-MP forecasts as the lead time increases, with the final forecast bin at a radius of 16 showing the greatest improvement.

4.2. Subjective Evaluation

Subjective evaluation of object-based results is performed to better understand specific physical differences responsible for objective verification discrepancies, with a focus on the meso-alpha scale objects. Such objects are largely responsible for widespread severe weather events and are the most unique aspect of the OBPROB method. A representative case study from 16 May 2015 (hereafter M16) is used for this subjective evaluation. Due to the strong synoptic scale forcing on this case, initial supercellular dryline convection in the southern plains quickly grew upscale into a north–south oriented squall line. Multiple broken convective segments associated with the squall line encompassed a rather expansive region, extending from southern Texas through Iowa and Minnesota, allowing for increased variability among ensemble forecasts. Furthermore, much of the convection was of severe caliber. Official filtered SPC storm reports resulted in 50 tornado reports, 140 wind reports, and 42 hail reports, for a total of 232 severe weather reports.
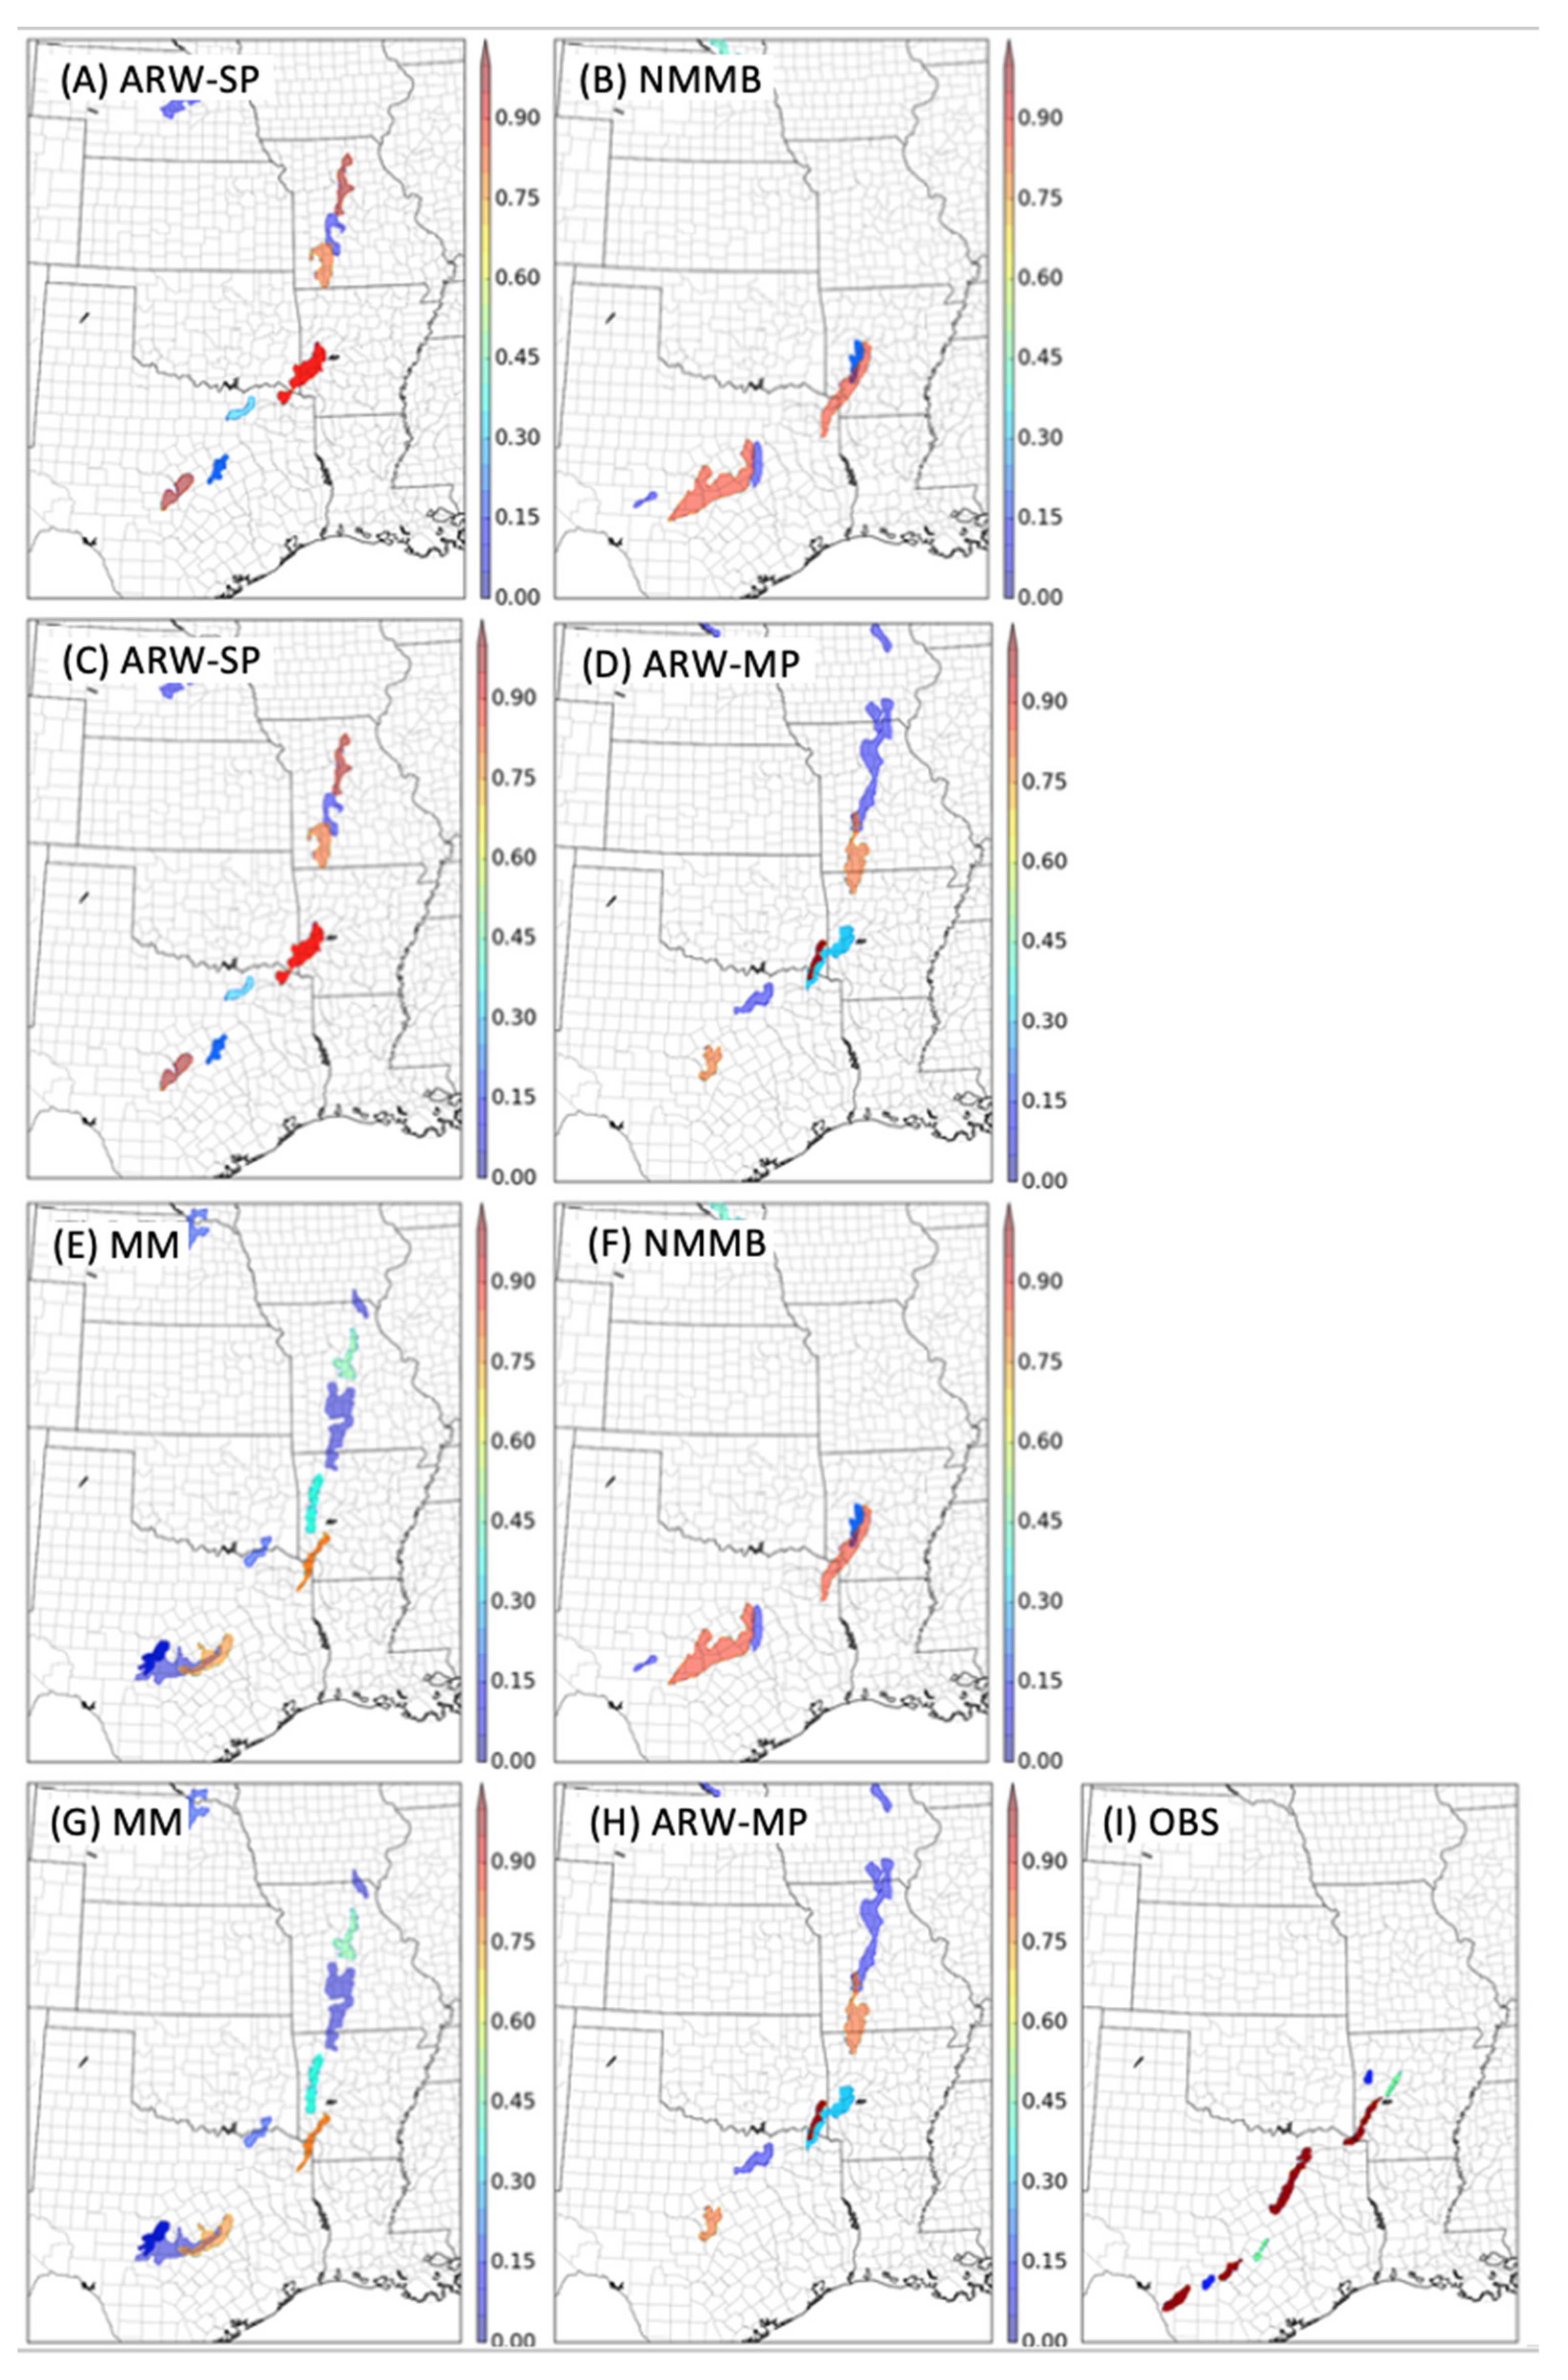
Valid at 11 Z on 17 May 2015, observation objects (Figure 8i) depict multiple broken linear segments in the overarching system. With two meso-alpha scale (maroon) objects in southern Texas, another near the Dallas, Fort Worth area, and a fourth in southwest Arkansas, much of the stronger storms at this analysis time are located in southern portions of the synoptic scale system, while northern segments into Missouri and Iowa have begun to deteriorate if they have not already. Comparisons of the observed storm morphology structure to SMSP ensemble forecasts in Figure 8a (ARW-SP) vs. Figure 8b (NMMB) is consistent with the objective verification for this case (Figure 9). The ARW-SP advantage over NMMB at early forecast times is related to the greater diversity of probabilistic forecast objects with ARW-SP, indicating a better spread of storm mode and morphology in the ARW-SP ensemble. In contrast, NMMB forecasts display over-confidence in storm morphology forecasts in southwest Arkansas and central Texas. ARW-SP does also have some overconfident object probabilities, including extending the strong convective objects into Missouri (Figure 8a) well after these segments decayed in observations (Figure 8i). This over-forecasting of the northern extensions of north–south oriented squall lines is seen consistently in other case studies as well, indicating a systematic ensemble bias in storm morphology.
Corresponding M16 OBPROB plots for ARW-SP and ARW-MP are located in Figure 8c,d, respectively. Justified by the M16 SPMP verification (Figure 9b), physical differences between ARW-SP and ARW-MP for the M16 case (Figure 8c,d) are also representative of the objective results and systematic results described above (Figure 7c). In particular, ARW-MP has better probabilistic forecasts than ARW-SP at middle and late lead times. The ARW-MP advantage is reflected in the single, matching 100% probability object associated with observed convection in Arkansas, and a decrease in probabilities for Texas convection from 100% in ARW-SP to 10% and 70%. Thus, the greater spread in ARW-MP effectively distinguishes which forecast environments provide high confidence in storm mode and morphology from environments providing lower confidence. This difference is also representative of other subjectively evaluated cases (not shown).
Forecast hour 12 of the M16 case (Figure 9c) is representative of the systematic results for MMSM, with MM showing greater skill than NMMB. The MM forecast advantage in the M16 cases (Figure 8e) is related to an increase in the forecast diversity when compared to NMMB forecasts (Figure 8f). The MM forecast not only increases spread compared to NMMB but also decreases the over-confident high probabilities produced by constituent ARW members in northern Missouri and south–central Texas. Therefore, MM effectively adjusts for individual model biases through decreases in probabilities of northern bias objects from ARW while providing forecast spread that is absent in NMMB.
For the MPMM comparison, forecast hours 12–14 in the M16 case are particularly representative of the systematic improvements found at forecast hours 3–5, with MM largely improving upon the skill from ARW-MP. Although occurring at a later time in the M16 case, the M16 case is used to demonstrate this difference in order to minimize the number of cases studies presented in this paper. The M16 case as a whole shows that uncertainty is better sampled in MM than ARW-MP. For example, for south–central Texas convection, MM generates more forecast diversity with three objects of 70, 20, and 10% probability compared to the single, non-matched 70% object in ARW-MP. While the 10% MM object matches to observations instead of the 70% object, the increased member-to-member diversity still results in skill improvement over the ARW-MP forecast for south–central Texas convection. The M16 and other cases revealed that unlike ARW-MP, the highest probability objects in MM are mainly confined to the earliest lead times, indicating a better representation of growth of uncertainty as the forecast lead time increases in MM.

4.3. Comparison to NMEP

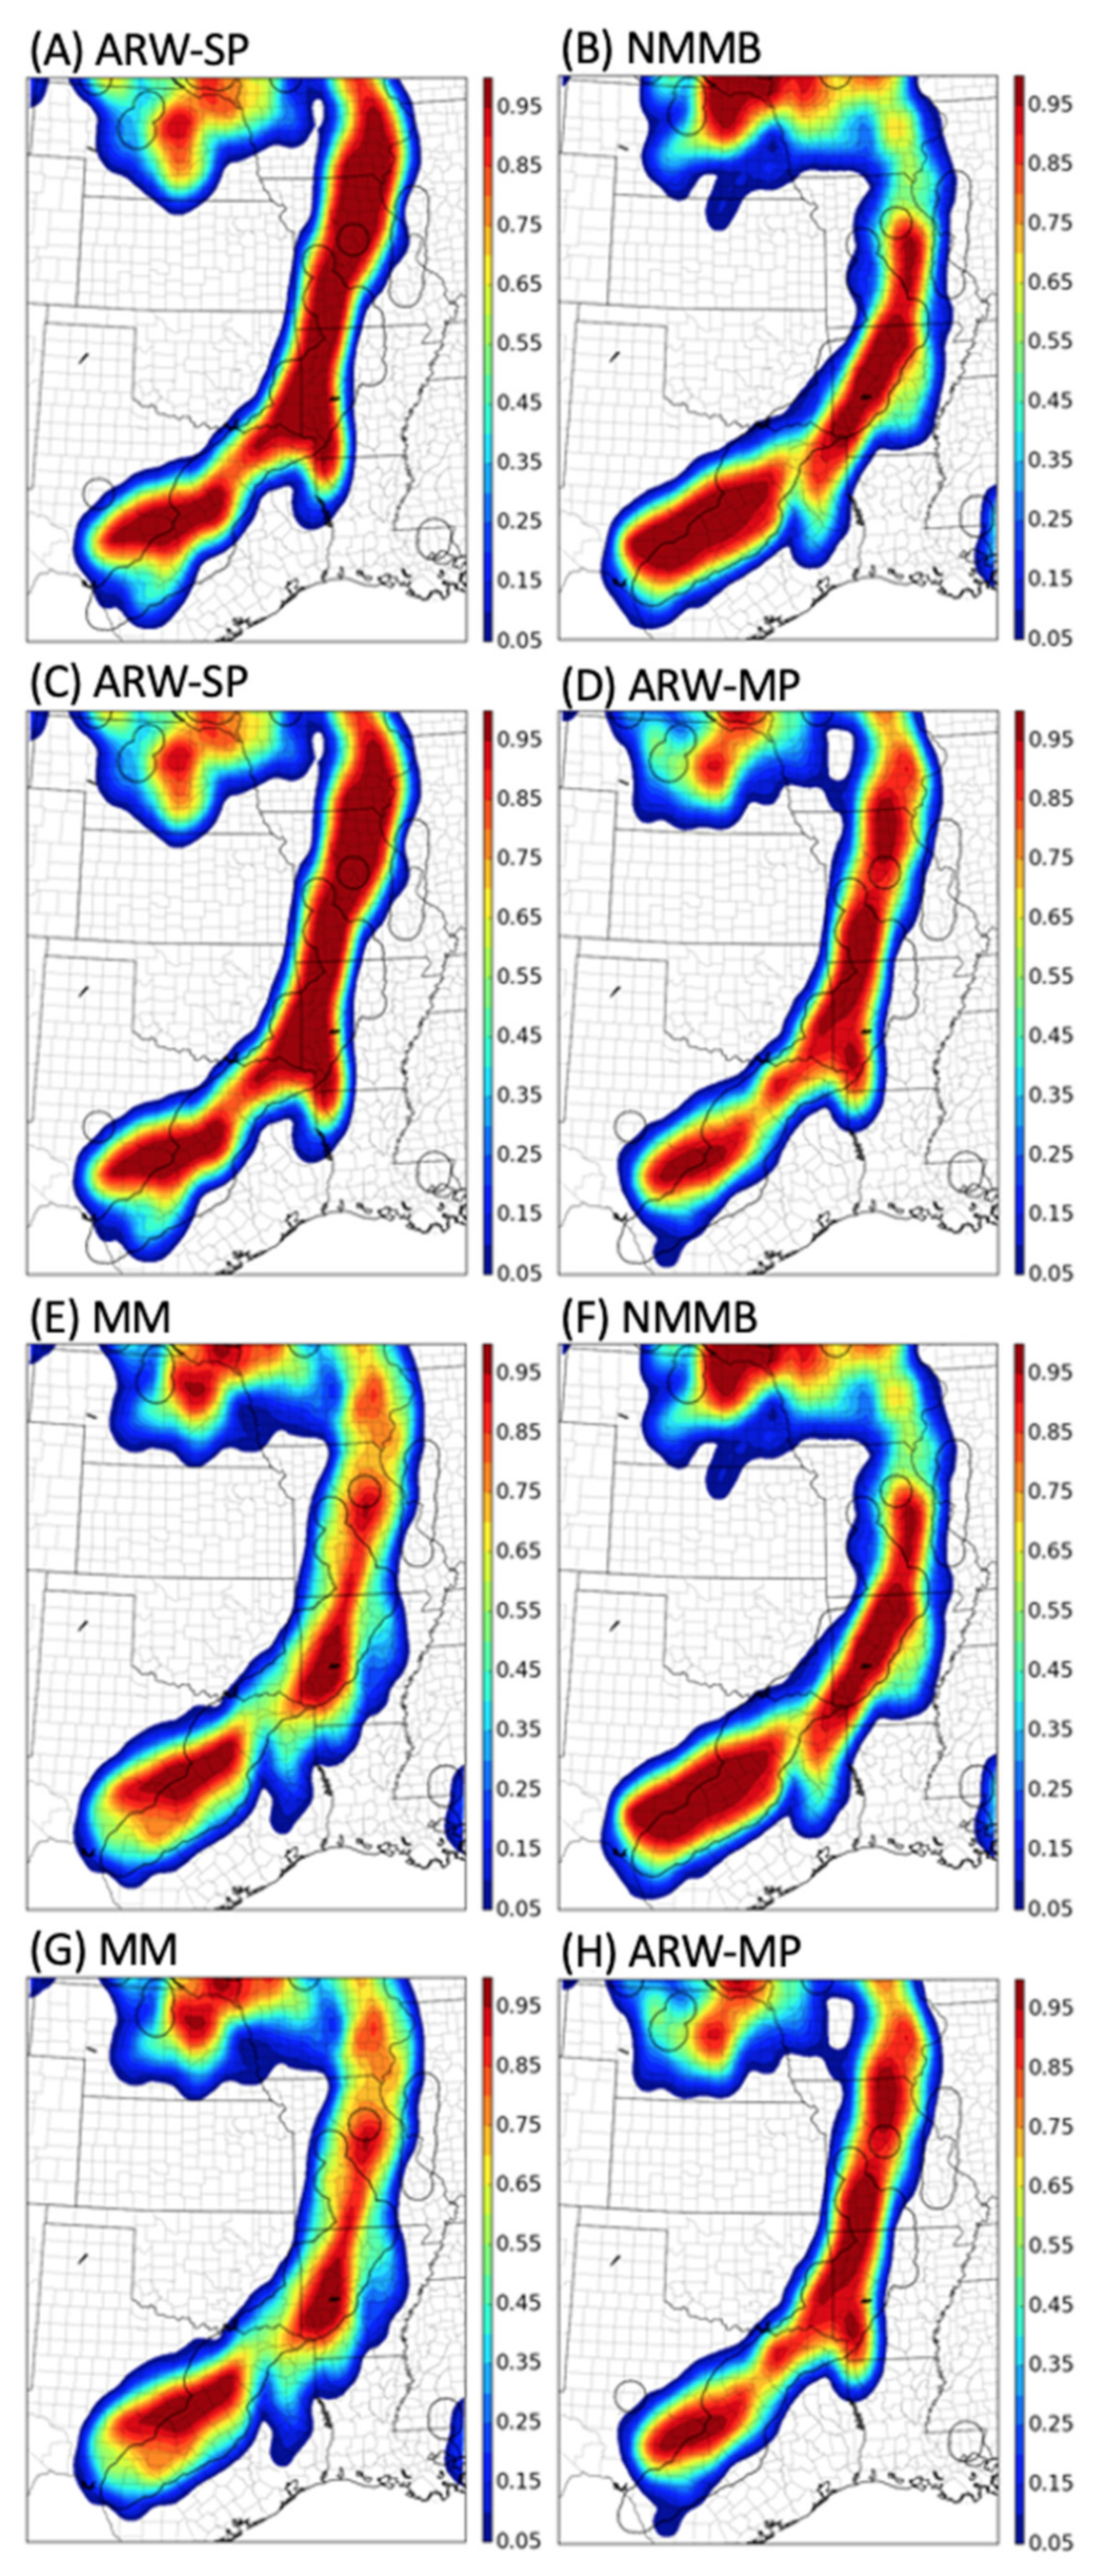
In contrast to the OBPROB result for SMSP (Figure 9a), NMEP verification for the M16 case study shows greater skill for NMMB than ARW-SP (Figure 9e). Subjective evaluation of the NMEP plots for ARW-SP and NMMB (Figure 10a,b) show that the verification differences correspond to the pronounced extension of northward biased probabilities in ARW-SP well into Iowa, leading to poorer NMEP verification than NMMB. This contrasts with northward biased object probabilities that only extend into northern Missouri. Furthermore, the insufficient object-based forecast spread seen for NMMB is not apparent in NMEP results. The different OBPROB and NMEP results for this case are explained by the fact that generally better forecasts of mesoscale precipitation location do not necessarily imply that storm morphology forecasts will also be more skillful.
A prime advantage of object-based techniques is their ability to quantify convective scale features that neighborhood-based methods typically smooth out. The NMEP comparison of ARW-SP and ARW-MP ensembles for the M16 case is shown in Figure 10c,d. For ARW-SP, a high probability contour reaches from central Iowa into northern Texas continuously, indicating no sections of lower probabilities along the way. Contrarily, object-based plots (Figure 8a) of the same forecast indicate multiple objects of varying probability through this region. The fact that NMEP and OBPROB comparisons can give different conclusions about the relative performance of these ensembles for this case further demonstrates the different sensitivity of OBPROB and NMEP. In particular, distinct storm morphologies are smoothed over in NMEP in favor of a focus on mesoscale regions of precipitation rather than storm morphology.
The impacts of separating objects based on convective organization scale versus simply increasing by neighborhood radius can be seen in Figure 10e,f. Verification results from both techniques indicate that MM contains superior storm morphology and mesoscale precipitation location forecasts (Figure 9c,g); however, the agreement in verification is impacted through separate aspects of the forecast. Aside from being hindered from higher probabilities located in Iowa associated with constituent ARW members, MM precipitation forecasts (Figure 10e) are largely comparable from large-scale convective systems in Arkansas and Texas compared to NMMB (Figure 10f). However, after the consideration of probabilities associated with smaller scale convective/stratiform precipitation in Nebraska and South Dakota, it is apparent that the high-probability NMMB forecasts in this region negatively affected the overall verification. Although it may not be a sole reason for the final ensemble performance, the presence of single and multi-cell convection still impacts neighborhood-based forecast verification at large radii. In turn, comparisons between OBPROB and NMEP forecasts show that simple increases in neighborhood radii do not necessarily correlate to an increase in focus on larger convective organization. In other words, the object-based categorizing by spatial scale of organization more cleanly separates forecast differences on different scales than simply adjusting the neighborhood radius.
Analysis of NMEP plots associated with the fourth ensemble-to-ensemble comparison (MPMM) indicate yet another difference between neighborhood and object-based methods. Figure 10g,h illustrate the impact of non-convective stratiform precipitation on the MM vs. ARW-MP verification in NMEP and OBPROB. While observation contours extend into Missouri and Illinois, precipitation in these regions at this time no longer reflects organized convection due to system decay and transition to stratiform precipitation. The influence of stratiform precipitation on NMEP verification bolsters the argument that these verification techniques and their results are complementary and together give a more complete understanding of forecast differences than either method on its own.

5. Discussion and Conclusions

CAEs can provide probabilistic information about forecasted storm mode and morphology through the depiction of convective initiation location and storm evolution. In limited studies, the impacts of CAE design on probabilistic forecast skill have primarily focused on spatial coverage of precipitation through neighborhood-based methods rather than explicit verification of storm morphology. Studies that have evaluated CAE storm morphology forecasts have relied on deterministic forecasts or subjective evaluation rather than objective evaluation of probabilistic storm morphology forecasts. The usefulness of defining optimal ensemble design in terms of predicted storm mode is rooted in the fact that certain storm modes are associated with distinct severe weather threats. Therefore, through better understanding of optimal design, CAEs can become more valuable in convective forecasting settings. To address the impacts that ensemble design has on the forecasted storm mode and morphology, an innovated OBPROB technique is applied to four ensemble-to-ensemble comparisons over 10 retrospective forecast cases. Several innovations of the OBPROB method since [18] are introduced in the present study, including a model bias adjustment based on reflectivity percentiles analysis, the filtering of stratiform observation objects, and the scale separation of objects based on convective organization (i.e., single-cell, multi-cell and mesoscale organized). The classification of objects ensured that the verification process was aligned with the predictability expected at each respective scale.
For the first ensemble-to-ensemble comparison (SMSP), objective and subjective verification suggests that model and physics scheme choices most prominently affect the upscale growth of convective systems. Subjective analysis of OBPROB showed that the statistically significant probabilistic improvements from ARW-SP at early lead times were related to both probabilistic distributions of objects and actual storm morphology forecasts. Compared to ARW-SP, NMMB forecasts had insufficient spread, leading to high probability objects that were not matched to an observed object and thus poorer verification. In terms of storm morphology, NMMB struggled to grow single-cell and multi-cell objects upscale, resulting in a smaller horizontal scale of linear systems compared to ARW-SP observations.
For SPMP forecasts, objective and subjective verification are consistent in that as lead time increases, a multi-physics ensemble design becomes increasingly beneficial. Reinforced by statistically significant probabilistic skill increases from ARW-MP, objective improvements were manifested in ARW-MP member-to-member diversity. With larger spread generated from multiple physics schemes, ARW-MP better distinguished which environments provide high confidence in storm morphology forecasts and which contained larger uncertainty.
The SM versus MM comparison suggests that the greatest benefit of MM is realized at the mesoscale organized scale. Although the addition of multiple dynamical cores improved ensemble reliability and resolution, objective results were highlighted by statistically significant improvements above the 99% confidence level at early lead times. Subjective analysis of the M16 case study demonstrated increased skill that resulted from the relative bias reduction from each constituent model as MM increases forecast spread, lacking in NMMB forecasts while reducing the northern bias associated with ARW members. Thus, MM effectively takes skillful portions from each respective model forecast, leading to increased sampling of initial forecast uncertainties in terms of storm morphology.
A comparison of the probabilistic verification of meso-alpha storm morphology forecasts generated by MM versus ARW-MP was somewhat limited by the sample size, since statistically significant MM advantages were only seen at the 3–5 forecast hour bin. While MM did generally improve reliability and resolution, the clustering of forecasts was one undesirable quality of MM. Subjectively, the skill differences corresponded to a decrease in unmatched high probability objects in MM compared to MP. This reduction showed that MM better samples early lead time forecast uncertainty, but it also demonstrated that MM generates meaningful spread not found from early lead times in ARW-MP. Therefore, the multi-model forecasts better represented how forecast uncertainty and diversity grew during the forecast, with very high probability objects confined mostly to early in the forecast period.
Supplemental to the mesoscale-organized convection, objective verification of multi-cell and single-cell objects was also performed. For SMSP ensembles, NMMB forecasts were more skillful at multi-cell and single-cell scales, suggesting that while NMMB may struggle to grow small-scale objects upscale, the approximate forecasted locations and intensities are better ARW-SP. SPMP ensembles produced pronounced probabilistic differences at multi-cell and single-cell scales, indicating that the addition of multiple physics parameterizations not only improves large-scale storm morphology forecasts but also provides benefits for approximate locations and intensities of multi-cell and single-cell objects. In contrast, aside from the greater reliability from MM, advantages over NMMB were reduced at smaller convective organization scales. In comparison to ARW-MP, MM produced a majority of probabilistic skill improvements at multi-cell and single-cell scales, especially at the meso-beta scale. While superior reliability and resolution were found for MM at the multi-cell scale, the results reversed for single-cell objects as ARW-MP produced forecasts of greater reliability and resolution. For both MMSM and MPMM, additional case studies to enhance statistical significance are needed to effectively discern meaningful differences at the meso-beta and meso-gamma scales.
Optimal methods of sampling the forecast uncertainty will likely require a combination of different strategies within the ensemble design [13,17,66,67]. While the results in the present study were largely consistent with [17], several differences between the OBPROB and NMEP verifications were noted. Subjective analysis bolstered previous studies’ conclusions (e.g., [18,76]), as NMEP probability contours were shown to smooth out convective scale details pertinent to the storm morphology forecast while also including stratiform precipitation features that were de-emphasized in OBPROB. Furthermore, NMEP plots revealed that verification at larger radii were still influenced by forecasts of small-scale convective precipitation, supporting the claim that the OBPROB method is able to separate objects of larger convective organization, and simple increases in neighborhood radii do not necessarily correlate to an increase in focus on larger convective organization.
The main focus of this study was on the verification of convective objects through forecasted reflectivity fields. Other atmospheric variables closely related to the forecasted storm mode such as updraft helicity and the maximum estimated size of hail were not analyzed. With additional cases to account for the decreased sample size as further restrictions are placed on storm objects (e.g., applying minimum threshold to updraft helicity or hail size), future work should focus on partitioning ensemble storm morphology forecasts based on more specific classification of storms (i.e., strongly rotating) and how ensembles depict not only storm mode and morphology but also storm severity. The consideration of additional cases in a long-term CAE may also enhance and reveal additional differences that were not revealed or not statistically significant in the present study.

Author Contributions

Conceptualization, A.W., A.J. and X.W.; methodology, A.W., A.J. and X.W.; software, all authors; validation, all authors; formal analysis, A.W.; investigation, A.W., A.J. and X.W.; resources, X.W. and A.J.; data curation, all authors; writing—original draft preparation, A.W.; writing—review and editing, A.W., A.J. and X.W.; visualization, A.W. and X.W.; supervision, A.J. and X.W.; project administration, A.J. and X.W.; funding acquisition, A.J. and X.W. All authors have read and agreed to the published version of the manuscript.

Funding

This research was funded by NOAA Award NA17OAR4590187.

Data Availability Statement

All WRF forecast data produced during this study has been archived locally and is available upon request to the authors.

Acknowledgments

This study was supported by NOAA Award NA17OAR4590187. The forecast ensembles verified in this study were generated using the Stampede2 machine at Extreme Science and Engineering Discovery Environment (XSEDE), which is supported by the National Science Foundation Grant ACI-1053575. All computational post processing and verification utilized resources provided by the University of Oklahoma (OU) Supercomputing Center for Education and Research (OSCER). The authors are grateful for the helpful comments from two anonymous reviewers.

Conflicts of Interest

The authors declare no conflict of interest.

References

  1. Done, J.; Davis, C.A.; Weisman, M. The next generation of NWP: Explicit forecasts of convection using the weather research and forecasting (WRF) model. Atmos. Sci. Lett. 2004, 5, 110–117. [Google Scholar] [CrossRef]
  2. Kain, J.S.; Weiss, S.J.; Levit, J.J.; Baldwin, M.E.; Bright, D.R. Examination of Convection-Allowing Configurations of the WRF Model for the Prediction of Severe Convective Weather: The SPC/NSSL Spring Program 2004. Weather Forecast. 2006, 21, 167–181. [Google Scholar] [CrossRef] [Green Version]
  3. Kain, J.S.; Weiss, S.J.; Bright, D.R.; Baldwin, M.E.; Levit, J.J.; Carbin, G.W.; Schwartz, C.S.; Weisman, M.L.; Droegemeier, K.K.; Weber, D.B.; et al. Some practical considerations regarding horizontal resolution in the first generation of operational convection-allowing NWP. Weather Forecast. 2008, 23, 931–952. [Google Scholar] [CrossRef]
  4. Weisman, M.L.; Davis, C.; Wang, W.; Manning, K.W.; Klemp, J.B. Experiences with 0–36-h Explicit Convective Forecasts with the WRF-ARW Model. Weather Forecast. 2008, 23, 407–437. [Google Scholar] [CrossRef]
  5. Schwartz, C.S.; Kain, J.S.; Weiss, S.J.; Xue, M.; Bright, D.R.; Kong, F.; Thomas, K.W.; Levit, J.J.; Coniglio, M.C. Next-Day Convection-Allowing WRF Model Guidance: A Second Look at 2-km versus 4-km Grid Spacing. Mon. Weather Rev. 2009, 137, 3351–3372. [Google Scholar] [CrossRef]
  6. Clark, A.J.; Gallus, W.A.; Weisman, M.L. Neighborhood-Based Verification of Precipitation Forecasts from Convection-Allowing NCAR WRF Model Simulations and the Operational NAM. Weather Forecast. 2010, 25, 1495–1509. [Google Scholar] [CrossRef]
  7. Schwartz, C.S.; Kain, J.S.; Weiss, S.J.; Xue, M.; Bright, D.R.; Kong, F.; Thomas, K.W.; Levit, J.J.; Coniglio, M.C.; Wandishin, M.S. Toward Improved Convection-Allowing Ensembles: Model Physics Sensitivities and Optimizing Probabilistic Guidance with Small Ensemble Membership. Weather Forecast. 2010, 25, 263–280. [Google Scholar] [CrossRef]
  8. Schwartz, C.S.; Romine, G.S.; Sobash, R.A.; Fossell, K.R.; Weisman, M.L. NCAR’s Experimental Real-Time Convection-Allowing Ensemble Prediction System. Weather Forecast. 2015, 30, 1645–1654. [Google Scholar] [CrossRef]
  9. Xue, M.; Jung, Y.; Zhang, G. State estimation of convective storms with a two-moment microphysics scheme and an ensemble Kalman filter: Experiments with simulated radar data. Q. J. R. Meteorol. Soc. 2010, 136, 685–700. [Google Scholar] [CrossRef]
  10. Johnson, A.; Wang, X. Verification and Calibration of Neighborhood and Object-Based Probabilistic Precipitation Forecasts from a Multimodel Convection-Allowing Ensemble. Mon. Weather Rev. 2012, 140, 3054–3077. [Google Scholar] [CrossRef]
  11. Johnson, A.; Wang, X. Design and Implementation of a GSI-Based Convection-Allowing Ensemble Data Assimilation and Forecast System for the PECAN Field Experiment. Part I: Optimal Configurations for Nocturnal Convection Prediction Using Retrospective Cases. Weather Forecast. 2017, 32, 289–315. [Google Scholar] [CrossRef]
  12. Duda, J.D.; Wang, X.; Kong, F.; Xue, M. Using Varied Microphysics to Account for Uncertainty in Warm-Season QPF in a Convection-Allowing Ensemble. Mon. Weather Rev. 2014, 142, 2198–2219. [Google Scholar] [CrossRef]
  13. Duda, J.D.; Wang, X.; Kong, F.; Xue, M.; Berner, J. Impact of a Stochastic Kinetic Energy Backscatter Scheme on Warm Season Convection-Allowing Ensemble Forecasts. Mon. Weather Rev. 2016, 144, 1887–1908. [Google Scholar] [CrossRef]
  14. Duda, J.D.; Wang, X.; Xue, M. Sensitivity of Convection-Allowing Forecasts to Land Surface Model Perturbations and Implications for Ensemble Design. Mon. Weather Rev. 2017, 145, 2001–2025. [Google Scholar] [CrossRef]
  15. Romine, G.S.; Schwartz, C.S.; Berner, J.; Fossell, K.R.; Snyder, C.; Anderson, J.L.; Weisman, M.L. Representing Forecast Error in a Convection-Permitting Ensemble System. Mon. Weather Rev. 2014, 142, 4519–4541. [Google Scholar] [CrossRef] [Green Version]
  16. Johnson, A.; Wang, X.; Degelia, S. Design and Implementation of a GSI-Based Convection-Allowing Ensemble-Based Data Assimilation and Forecast System for the PECAN Field Experiment. Part II: Overview and Evaluation of a Real-Time System. Weather Forecast. 2017, 32, 1227–1251. [Google Scholar] [CrossRef]
  17. Gasperoni, N.A.; Wang, X.; Wang, Y. A Comparison of Methods to Sample Model Errors for Convection-Allowing Ensemble Forecasts in the Setting of Multiscale Initial Conditions Produced by the GSI-Based EnVar Assimilation System. Mon. Weather Rev. 2020, 148, 1177–1203. [Google Scholar] [CrossRef]
  18. Johnson, A.; Wang, X.; Wang, Y.; Reinhart, A.; Clark, A.J.; Jirak, I.L. Neighborhood- and Object-Based Probabilistic Verification of the OU MAP Ensemble Forecasts during 2017 and 2018 Hazardous Weather Testbeds. Weather Forecast. 2020, 35, 169–191. [Google Scholar] [CrossRef]
  19. Clark, A.J. Generation of Ensemble Mean Precipitation Forecasts from Convection-Allowing Ensembles. Weather Forecast. 2017, 32, 1569–1583. [Google Scholar] [CrossRef]
  20. Schwartz, C.S.; Sobash, R.A. Generating Probabilistic Forecasts from Convection-Allowing Ensembles Using Neighborhood Approaches: A Review and Recommendations. Mon. Weather Rev. 2017, 145, 3397–3418. [Google Scholar] [CrossRef]
  21. Carlberg, B.R.; Gallus, W.A.; Franz, K.J. A Preliminary Examination of WRF Ensemble Prediction of Convective Mode Evolution. Weather Forecast. 2018, 33, 783–798. [Google Scholar] [CrossRef]
  22. Ebert, E.E. Fuzzy verification of high-resolution gridded forecasts: A review and proposed framework. Meteorol. Appl. 2008, 15, 51–64. [Google Scholar] [CrossRef]
  23. Gilleland, E. Testing Competing Precipitation Forecasts Accurately and Efficiently: The Spatial Prediction Comparison Test. Mon. Weather Rev. 2013, 141, 340–355. [Google Scholar] [CrossRef] [Green Version]
  24. Davis, C.; Brown, B.; Bullock, R. Object-Based Verification of Precipitation Forecasts. Part I: Methodology and Application to Mesoscale Rain Areas. Mon. Weather Rev. 2006, 134, 1772–1784. [Google Scholar] [CrossRef] [Green Version]
  25. Davis, C.; Brown, B.; Bullock, R. Object-Based Verification of Precipitation Forecasts. Part II: Application to Convective Rain Systems. Mon. Weather Rev. 2006, 134, 1785–1795. [Google Scholar] [CrossRef] [Green Version]
  26. Davis, C.A.; Brown, B.G.; Bullock, R.; Halley-Gotway, J. The Method for Object-Based Diagnostic Evaluation (MODE) Applied to Numerical Forecasts from the 2005 NSSL/SPC Spring Program. Weather Forecast. 2009, 24, 1252–1267. [Google Scholar] [CrossRef] [Green Version]
  27. Johnson, A.; Wang, X.; Kong, F.; Xue, M. Hierarchical Cluster Analysis of a Convection-Allowing Ensemble during the Hazardous Weather Testbed 2009 Spring Experiment. Part I: Development of the Object-Oriented Cluster Analysis Method for Precipitation Fields. Mon. Weather Rev. 2011, 139, 3673–3693. [Google Scholar] [CrossRef] [Green Version]
  28. Johnson, A.; Wang, X.; Xue, M.; Kong, F. Hierarchical Cluster Analysis of a Convection-Allowing Ensemble during the Hazardous Weather Testbed 2009 Spring Experiment. Part II: Ensemble Clustering over the Whole Experiment Period. Mon. Weather Rev. 2011, 139, 3694–3710. [Google Scholar] [CrossRef] [Green Version]
  29. Johnson, A.; Wang, X.; Kong, F.; Xue, M. Object-Based Evaluation of the Impact of Horizontal Grid Spacing on Convection-Allowing Forecasts. Mon. Weather Rev. 2013, 141, 3413–3425. [Google Scholar] [CrossRef]
  30. Wolff, J.K.; Harrold, M.; Fowler, T.; Gotway, J.H.; Nance, L.; Brown, B.G. Beyond the Basics: Evaluating Model-Based Precipitation Forecasts Using Traditional, Spatial, and Object-Based Methods. Weather Forecast. 2014, 29, 1451–1472. [Google Scholar] [CrossRef]
  31. Clark, A.J.; Bullock, R.G.; Jensen, T.L.; Xue, M.; Kong, F. Application of Object-Based Time-Domain Diagnostics for Tracking Precipitation Systems in Convection-Allowing Models. Weather Forecast. 2014, 29, 517–542. [Google Scholar] [CrossRef] [Green Version]
  32. Stratman, D.R.; Brewster, K. Sensitivities of 1-km Forecasts of 24 May 2011 Tornadic Supercells to Microphysics Parameterizations. Mon. Weather Rev. 2017, 145, 2697–2721. [Google Scholar] [CrossRef]
  33. Schumacher, R.S.; Clark, A.J. Evaluation of Ensemble Configurations for the Analysis and Prediction of Heavy-Rain-Producing Mesoscale Convective Systems. Mon. Weather Rev. 2014, 142, 4108–4138. [Google Scholar] [CrossRef]
  34. Schwartz, C.S.; Romine, G.S.; Sobash, R.A.; Fossell, K.R.; Weisman, M.L. NCAR’s Real-Time Convection-Allowing Ensemble Project. Bull. Am. Meteorol. Soc. 2019, 100, 321–343. [Google Scholar] [CrossRef]
  35. Gowan, T.M.; Steenburgh, W.J.; Schwartz, C.S. Validation of Mountain Precipitation Forecasts from the Convection-Permitting NCAR Ensemble and Operational Forecast Systems over the Western United States. Weather Forecast. 2018, 33, 739–765. [Google Scholar] [CrossRef]
  36. Duc, L.; Saito, K.; Seko, H. Spatial-temporal fractions verification for high-resolution ensemble forecasts. Tellus A Dyn. Meteorol. Oceanogr. 2013, 65, 18171. [Google Scholar] [CrossRef] [Green Version]
  37. Schwartz, C.S.; Romine, G.S.; Smith, K.R.; Weisman, M.L. Characterizing and Optimizing Precipitation Forecasts from a Convection-Permitting Ensemble Initialized by a Mesoscale Ensemble Kalman Filter. Weather Forecast. 2014, 29, 1295–1318. [Google Scholar] [CrossRef] [Green Version]
  38. Ebert, E.E. Ability of a Poor Man’s Ensemble to Predict the Probability and Distribution of Precipitation. Mon. Weather Rev. 2001, 129, 2461–2480. [Google Scholar] [CrossRef]
  39. Wandishin, M.S.; Mullen, S.L.; Stensrud, D.J.; Brooks, H.E. Evaluation of a Short-Range Multimodel Ensemble System. Mon. Weather Rev. 2001, 129, 729–747. [Google Scholar] [CrossRef] [Green Version]
  40. Eckel, F.A.; Mass, C.F. Aspects of Effective Mesoscale, Short-Range Ensemble Forecasting. Weather Forecast. 2005, 20, 328–350. [Google Scholar] [CrossRef]
  41. Candille, G. The Multiensemble Approach: The NAEFS Example. Mon. Weather Rev. 2009, 137, 1655–1665. [Google Scholar] [CrossRef]
  42. Melhauser, C.; Zhang, F.; Weng, Y.; Jin, Y.; Jin, H.; Zhao, Q. A Multiple-Model Convection-Permitting Ensemble Examination of the Probabilistic Prediction of Tropical Cyclones: Hurricanes Sandy (2012) and Edouard (2014). Weather Forecast. 2017, 32, 665–688. [Google Scholar] [CrossRef] [Green Version]
  43. Du, J.; Berner, J.; Buizza, R.; Charron, M.; Houtekamer, P.; Hou, D.; Jankov, I.; Mu, M.; Wang, X.; Wei, M.; et al. Ensemble Methods for Meteorological Predictions. In Handbook of Hydrometeorological Ensemble Forecasting; Springer: Singapore, 2019; pp. 99–149. [Google Scholar]
  44. Gallus, W.A.; Snook, N.A.; Johnson, E.V. Spring and Summer Severe Weather Reports over the Midwest as a Function of Convective Mode: A Preliminary Study. Weather Forecast. 2008, 23, 101–113. [Google Scholar] [CrossRef] [Green Version]
  45. Duda, J.D.; Gallus, W.A. Spring and Summer Midwestern Severe Weather Reports in Supercells Compared to Other Morphologies. Weather Forecast. 2010, 25, 190–206. [Google Scholar] [CrossRef] [Green Version]
  46. Smith, B.T.; Thompson, R.L.; Grams, J.S.; Broyles, C.; Brooks, H.E. Convective Modes for Significant Severe Thunderstorms in the Contiguous United States. Part I: Storm Classification and Climatology. Weather Forecast. 2012, 27, 1114–1135. [Google Scholar] [CrossRef] [Green Version]
  47. Pettet, C.R.; Johnson, R.H. Airflow and Precipitation Structure of Two Leading Stratiform Mesoscale Convective Systems Determined from Operational Datasets. Weather Forecast. 2003, 18, 685–699. [Google Scholar] [CrossRef] [Green Version]
  48. Skamarock, W.C. Evaluating Mesoscale NWP Models Using Kinetic Energy Spectra. Mon. Weather Rev. 2004, 132, 3019–3032. [Google Scholar] [CrossRef]
  49. Skinner, P.S.; Wheatley, D.M.; Knopfmeier, K.H.; Reinhart, A.E.; Choate, J.J.; Jones, T.A.; Creager, G.J.; Dowell, D.C.; Alexander, C.R.; Ladwig, T.T.; et al. Object-Based Verification of a Prototype Warn-on-Forecast System. Weather Forecast. 2018, 33, 1225–1250. [Google Scholar] [CrossRef]
  50. Zhang, F.; Odins, A.M.; Nielsen-Gammon, J.W. Mesoscale predictability of an extreme warm-season precipitation event. Weather Forecast. 2006, 21, 149–166. [Google Scholar] [CrossRef]
  51. Trentmann, J.; Keil, C.; Salzmann, M.; Barthlott, C.; Bauer, H.-S.; Schwitalla, T.; Lawrence, M.; Leuenberger, D.; Wulfmeyer, V.; Corsmeier, U.; et al. Multi-model simulations of a convective situation in low-mountain terrain in central Europe. Meteorol. Atmos. Phys. 2009, 103, 95–103. [Google Scholar] [CrossRef] [Green Version]
  52. Barthlott, C.; Burtonb, R.; Kirshbaumc, D.; Hanleyc, K.; Richardd, E.; Chaboureaud, J.-P.; Trentmanne, J.; Kerne, B.; Bauerf, H.-S.; Schwitallaf, T.; et al. Initiation of deep convection at marginal instability in an ensemble of mesoscale models: A case-study from COPS. Q. J. R. Meteorol. Soc. 2011, 137, 118–136. [Google Scholar] [CrossRef] [Green Version]
  53. Keil, C.; Heinlein, F.A.; Craig, G. The convective adjustment time-scale as indicator of predictability of convective precipitation. Q. J. R. Meteorol. Soc. 2014, 140, 480–490. [Google Scholar] [CrossRef]
  54. Houze, R.A., Jr. Cloud Dynamics; Academic Press: San Diego, CA, USA, 1993; 573p. [Google Scholar]
  55. Aligo, E.A.; Ferrier, B.; Carley, J. Modified NAM Microphysics for Forecasts of Deep Convective Storms. Mon. Weather Rev. 2018, 146, 4115–4153. [Google Scholar] [CrossRef]
  56. Janjic, Z.I. The step-mountain ETA coordinate model: Further developments of the convection, viscous sublayer, and turbulence closure schemes. Mon. Weather Rev. 1994, 122, 927–945. [Google Scholar] [CrossRef] [Green Version]
  57. Tewari, M.; Chen, F.; Wang, W.; Dudhia, J.; Lemone, M.A.; Mitchell, K.E.; Ek, M.; Gayno, G.; Wegiel, J.W.; Cuenca, R. Implementation and verification 872 of the unified NOAH land surface model. In Proceedings of the WRF Model, 20th Conference on Wea, Analysis and Forecasting/16th Conference on NWP, Seattle, WA, USA, 14 January 2004; pp. 11–15. [Google Scholar]
  58. Thompson, G.; Field, P.R.; Rasmussen, R.M.; Hall, W.D. Explicit Forecasts of Winter Precipitation Using an Improved Bulk Microphysics Scheme. Part II: Implementation of a New Snow Parameterization. Mon. Weather Rev. 2008, 136, 5095–5115. [Google Scholar] [CrossRef]
  59. Thompson, G.; Eidhammer, T. A Study of Aerosol Impacts on Clouds and Precipitation Development in a Large Winter Cyclone. J. Atmos. Sci. 2014, 71, 3636–3658. [Google Scholar] [CrossRef]
  60. Nakanishi, M.; Niino, H. Development of an Improved Turbulence Closure Model for the Atmospheric Boundary Layer. J. Meteorol. Soc. Jpn. 2009, 87, 895–912. [Google Scholar] [CrossRef] [Green Version]
  61. Benjamin, S.G.; Grell, G.A.; Brown, J.M.; Smirnova, T.G.; Bleck, R. Mesoscale Weather Prediction with the RUC Hybrid Isentropic–Terrain-Following Coordinate Model. Mon. Weather Rev. 2004, 132, 473–494. [Google Scholar] [CrossRef]
  62. Mansell, E.R. On Sedimentation and Advection in Multimoment Bulk Microphysics. J. Atmos. Sci. 2010, 67, 3084–3094. [Google Scholar] [CrossRef]
  63. Morrison, H.; Thompson, G.; Tatarskii, V. Impact of Cloud Microphysics on the Development of Trailing Stratiform Precipitation in a Simulated Squall Line: Comparison of One- and Two-Moment Schemes. Mon. Weather Rev. 2009, 137, 991–1007. [Google Scholar] [CrossRef] [Green Version]
  64. Morrison, H.; Milbrandt, J.A. Parameterization of Cloud Microphysics Based on the Prediction of Bulk Ice Particle Properties. Part I: Scheme Description and Idealized Tests. J. Atmos. Sci. 2015, 72, 287–311. [Google Scholar] [CrossRef]
  65. Hong, S.-Y.; Noh, Y.; Dudhia, J. A New Vertical Diffusion Package with an Explicit Treatment of Entrainment Processes. Mon. Weather. Rev. 2006, 134, 2318–2341. [Google Scholar] [CrossRef] [Green Version]
  66. Berner, J.; Ha, S.-Y.; Hacker, J.P.; Fournier, A.; Snyder, C.S. Model Uncertainty in a Mesoscale Ensemble Prediction System: Stochastic versus Multiphysics Representations. Mon. Weather Rev. 2011, 139, 1972–1995. [Google Scholar] [CrossRef] [Green Version]
  67. Jankov, I.; Beck, J.; Wolff, J.; Harrold, M.; Olson, J.B.; Smirnova, T.; Alexander, C.; Berner, J. Stochastically Perturbed Parameterizations in an HRRR-Based Ensemble. Mon. Weather Rev. 2018, 147, 153–173. [Google Scholar] [CrossRef]
  68. Smith, T.M.; Lakshmanan, V.; Stumpf, G.J.; Ortega, K.; Hondl, K.; Cooper, K.; Calhoun, K.; Kingfield, D.; Manross, K.L.; Toomey, R.; et al. Multi-Radar Multi-Sensor (MRMS) Severe Weather and Aviation Products: Initial Operating Capabilities. Bull. Am. Meteorol. Soc. 2016, 97, 1617–1630. [Google Scholar] [CrossRef]
  69. Brier, G.W. Verification of forecasts expressed in terms of probability. Mon. Weather Rev. 1950, 78, 1–3. [Google Scholar] [CrossRef]
  70. Roberts, N.M.; Lean, H.W. Scale-Selective Verification of Rainfall Accumulations from High-Resolution Forecasts of Convective Events. Mon. Weather Rev. 2008, 136, 78–97. [Google Scholar] [CrossRef]
  71. Hamill, T.M. Hypothesis Tests for Evaluating Numerical Precipitation Forecasts. Weather Forecast. 1999, 14, 155–167. [Google Scholar] [CrossRef]
  72. Sanders, F. On Subjective Probability Forecasting. J. Appl. Meteorol. 1963, 2, 191–201. [Google Scholar] [CrossRef] [Green Version]
  73. Murphy, A.H. A Note on the Ranked Probability Score. J. Appl. Meteorol. 1971, 10, 155–156. [Google Scholar] [CrossRef] [Green Version]
  74. Murphy, A.H. A new vector partition of the probability score. J. Appl. Meteorol. 1973, 12, 595–600. [Google Scholar] [CrossRef] [Green Version]
  75. Murphy, A.H. A New Decomposition of the Brier Score: Formulation and Interpretation. Mon. Weather Rev. 1986, 114, 2671–2673. [Google Scholar] [CrossRef] [Green Version]
  76. Stephenson, D.B.; Coelho, C.A.S.; Jolliffe, I.T. Two Extra Components in the Brier Score Decomposition. Weather Forecast. 2008, 23, 752–757. [Google Scholar] [CrossRef] [Green Version]
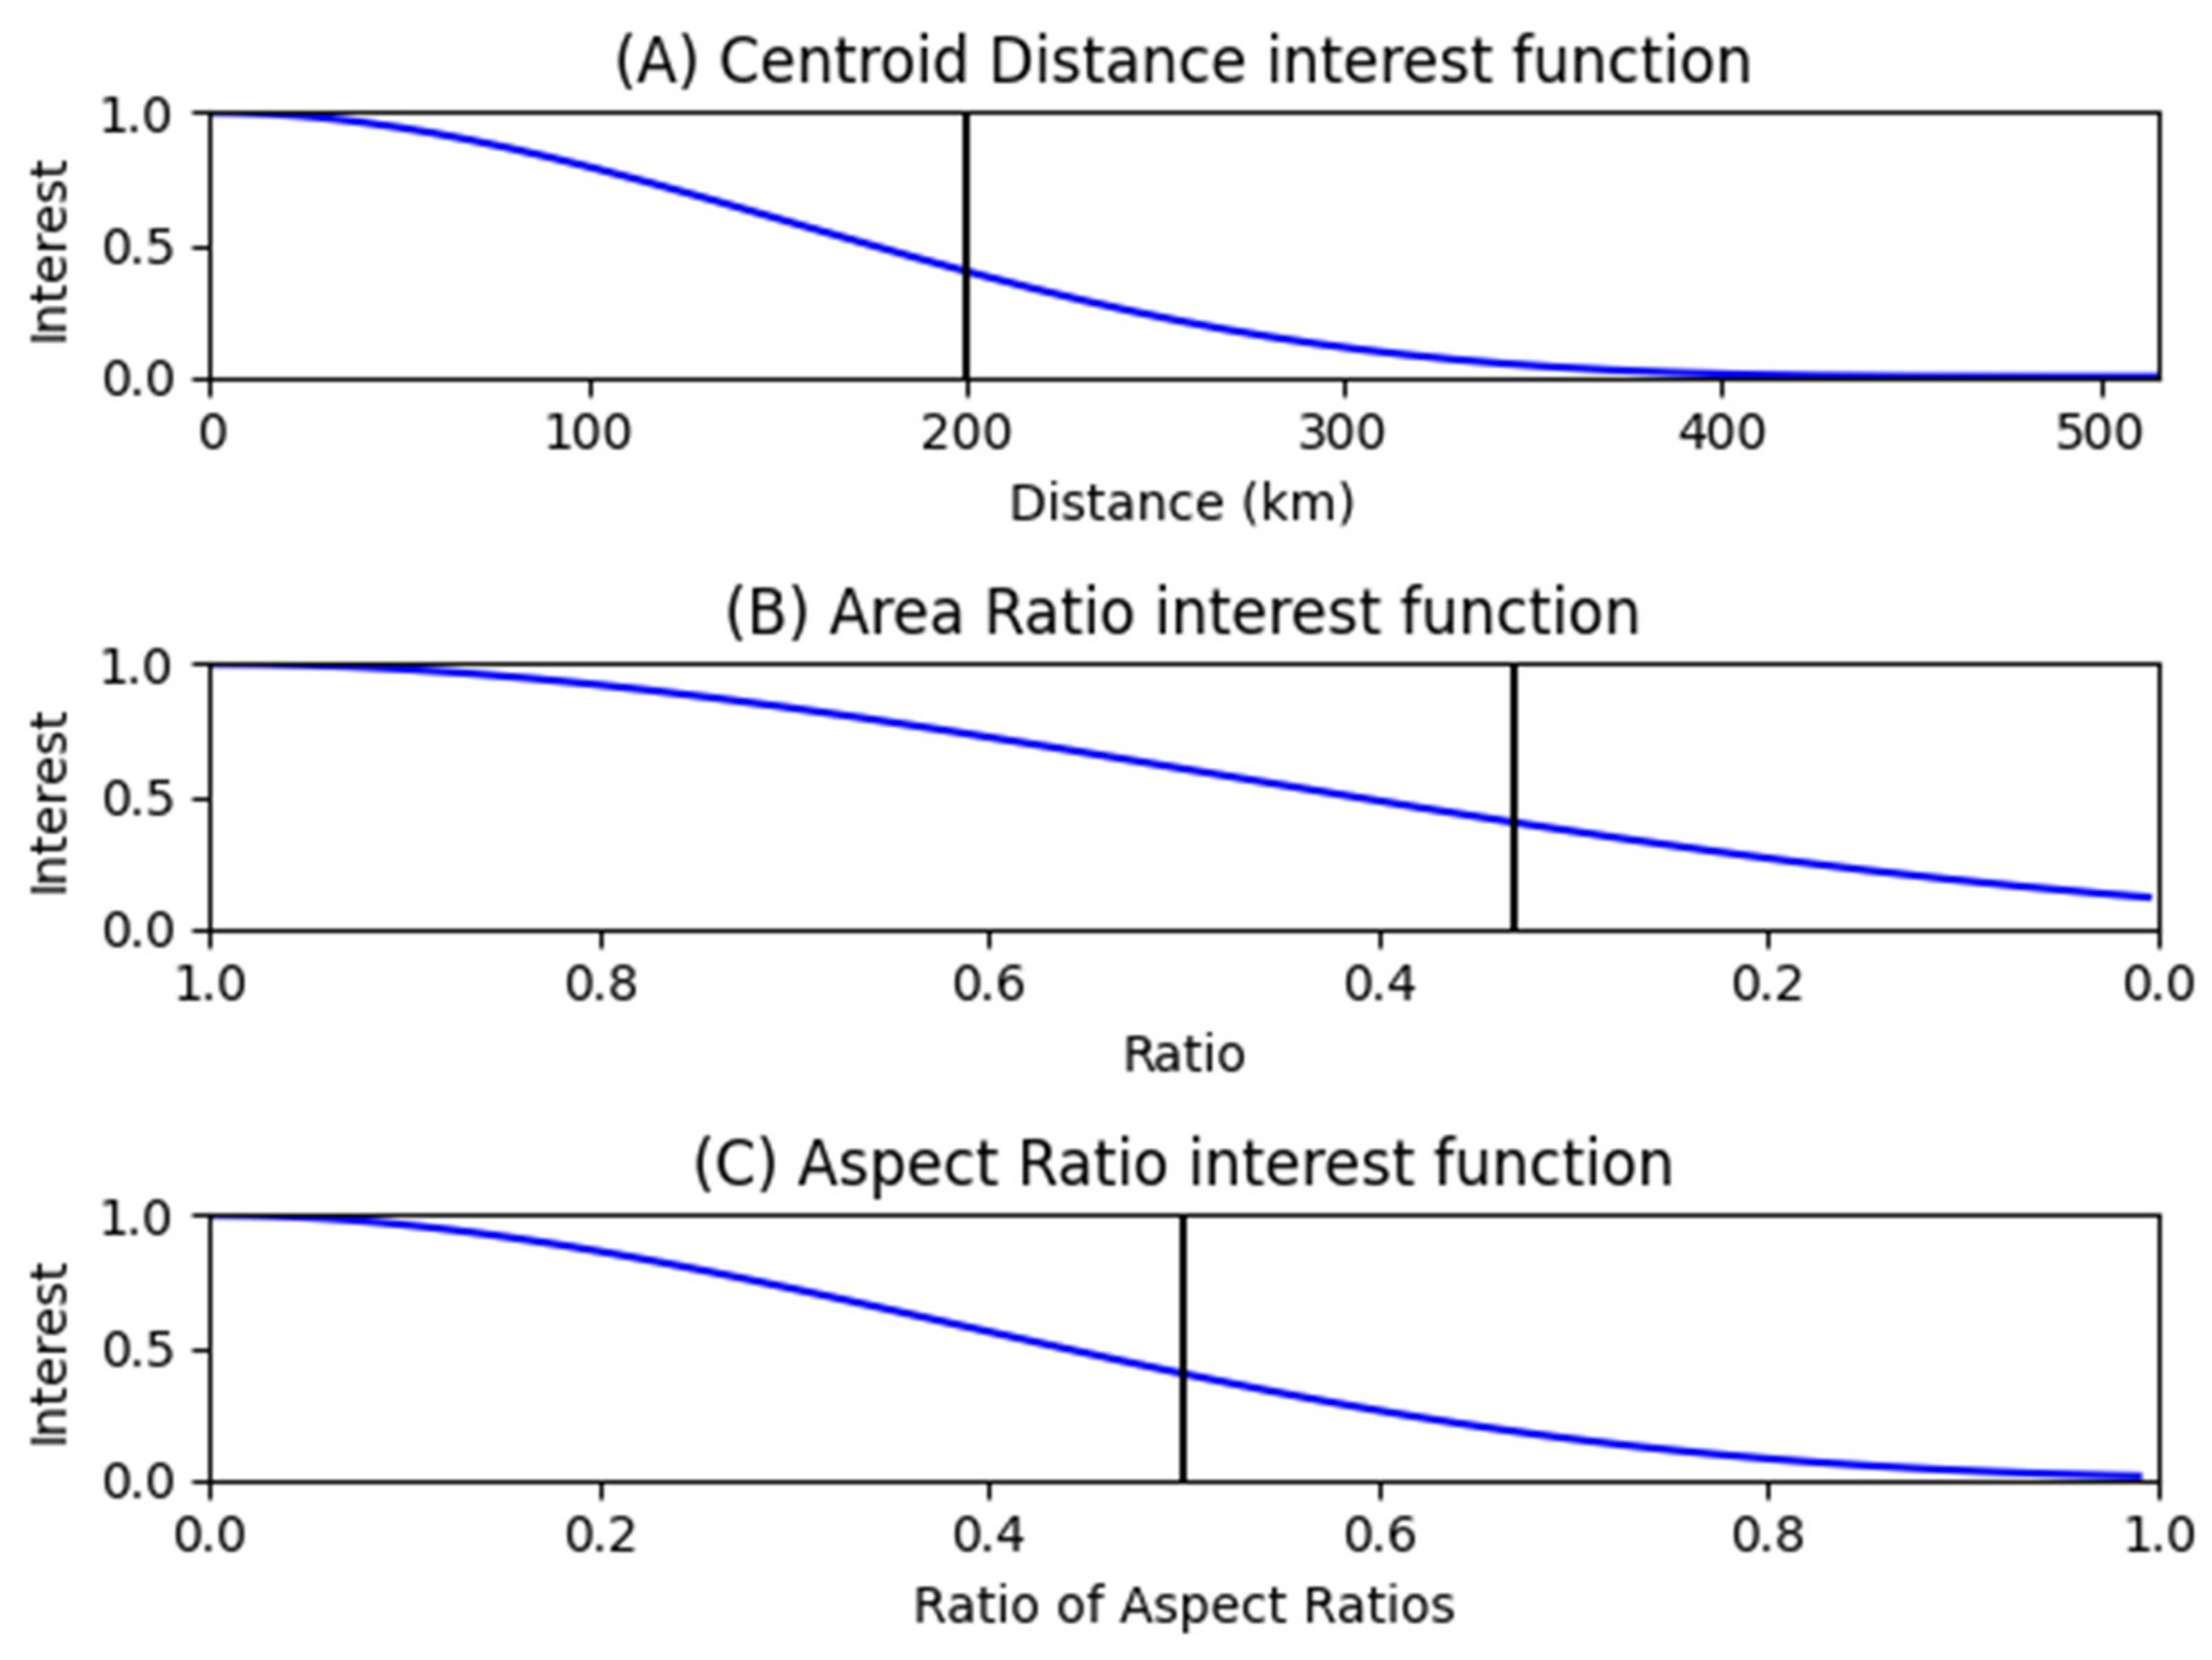
Figure 1. Interest functions to define similarity (i.e., interest) of the (A) centroid location, (B) area, and (C) aspect ratio attributes between two objects. E-folding values are marked by a black line.
Atmosphere 12 01630 g001
Figure 2. (AJ) Ten-member Nonhydrostatic Multiscale Model on the B grid (NMMB) ensemble forecast initialized 00 Z, 7 July 2016, valid at 06 Z 7 July 2016, (K) corresponding paintball, (L) neighborhood maximum ensemble probability (NMEP), and (M) OBPROB plots.
Atmosphere 12 01630 g002
Figure 3. OBPROB observation object plots (A) before stratiform object filtering and (B) after stratiform object filtering. Observation object colors indicate convective scale category. Maroon objects correspond to meso-alpha or mesoscale organized convection, cyan objects represent meso-beta or multi-cell convection, and blue objects signify meso-gamma or single-cell convection.
Atmosphere 12 01630 g003
Figure 4. Plotting examples of (A) meso-alpha (mesoscale organized) objects, (B) meso-beta (multi-cell) objects, and (C) meso-gamma (single-cell) objects. Meso-alpha objects use the OBPROB method, while meso-beta and meso-gamma use a Gaussian smoothed contour plot of object probabilities.
Atmosphere 12 01630 g004
Figure 5. Normalized ensemble object attribute distributions for each ensemble (rows). Left column: Ensemble object area frequency distribution (solid) and observations (black, dashed) binned every 20 gpts. Center column: Ensemble object longest axis frequency distribution rounded to the nearest grid point (solid) and observations (black, dashed). Right column: Ensemble object aspect ratio distribution where each plotted point is averaged with +/− 2 nearest points. Panels show frequency of objects of different areas for (A) NMMB, (D) ARW-SP, (G) ARW-MP, and (J) MM; frequency of objects of different long axis length for (B) NMMB, (E) ARW-SP, (H) ARW-MP, and (K) MM; frequency of objects of different aspect ratios for (C) NMMB, (F) ARW-SP, (I) ARW-MP, and (L) MM.
Atmosphere 12 01630 g005
Figure 6. Left column: Object-based Brier score averaged difference over all cases based on lead time and binned every three forecast hours for (A) SP vs. NMMB, (C) MP vs. SP, (E) MM vs. NMMB, and (G) MM vs. MP. Values shown are subtracted where red indicates added skill and blue indicates negative respective skill for the first ensemble listed in the title. Overlay p-value colors indicate the presence of statistical significance (green) at the 80% confidence level. Right column: Same as the left column except for neighborhood-based results for (B) SP vs. NMMB, (D) MP vs. SP, (F) MM vs. NMMB, and (H) MM vs. MP. Meso-alpha, beta, and gamma correspond to a radius of 16, 8, and 4, respectively.
Atmosphere 12 01630 g006
Figure 7. Reliability diagrams for (A) meso-alpha, (B) meso-beta, and (C) meso-gamma scales and corresponding sharpness plots for (D) meso-alpha, (E) meso-beta, and (F) meso-gamma scales. A “no-skill” line halfway between perfect reliability and the climatological base rate is also plotted for reference. Reliability diagrams for meso-beta and meso-gamma are not full diagrams given the low-probability nature of the contour plots at these scales.
Atmosphere 12 01630 g007
Figure 8. OBPROB plots for ensemble-to-ensemble comparisons from the 16 May 2015 case study, valid at 01 Z. Each ensemble-to-ensemble comparison is organized by column: SMSP (A,B), SPMP (C,D), MMSM (E,F), and MPMM (G,H). Objects with transparency of 1.0 are matched to observations, and objects with 0.5 transparency are not. As in Figure 4, observation plot (I) object colors indicate a convective scale category.
Atmosphere 12 01630 g008
Figure 9. As in Figure 6, except for the 16 May 2015 case study. Statistical significance is not plotted due to data being representative of one case. Left column: Object-based Brier score averaged difference over all cases based on lead time and binned every three forecast hours for (A) SP vs. NMMB, (C) MP vs. SP, (E) MM vs. NMMB, and (G) MM vs. MP. Values shown are subtracted where red indicates added skill and blue indicates negative respective skill for the first ensemble listed in the title. Overlay p-value colors indicate the presence of statistical significance (green) at the 80% confidence level. Right column: Same as the left column except for neighborhood-based results for (B) SP vs. NMMB, (D) MP vs. SP, (F) MM vs. NMMB, and (H) MM vs. MP. Meso-alpha, beta, and gamma correspond to a radius of 16, 8, and 4, respectively.
Atmosphere 12 01630 g009
Figure 10. As in Figure 8, but for NMEP plots with a radius of 16 grid points. Each ensemble-to-ensemble comparison is organized by column: SMSP (A,B), SPMP (C,D), MMSM (E,F), and MPMM (G,H).
Atmosphere 12 01630 g010
Table 1. Demonstration of bias correction procedure. Observed value of 40 dBZ is highlighted in bold to indicate the value selected for object definition.
Observations
% dBZ
Forecasts
% dBZ
1006010070
95509560
90459050
85408545
80358040
75307535
Table 2. Ensembles and their design. The first column shows the name of the ensemble configuration. The second column shows the WRF dynamical core(s) used for that ensemble. The third column shows the member numbers used to identify ensemble members with particular configuration details. The fourth column shows the microphysics parameterization scheme used, the fifth column shows the Planetary Boundary Layer Scheme (PBL) used, and the sixth column shows the Land Surface Model (LSM) used. All ensembles use a model grid spacing of 3 km.
EnsembleDynamical CoreMember NumberMicrophysicsPBLLSM
NMMBNMMB0–9Ferrier–AligoMYJNOAH
ARW-SPARW0–9ThompsonMYNNRUC
MMNMMB0–4Ferrier–AligoMYJNOAH
ARW5–9ThompsonMYNNRUC
ARW-MPARW0ThompsonMYNNRUC
1ThompsonMYJNOAH
2NSSLYSUNOAH
3NSSLMYNNNOAH
4MorrisonMYJNOAH
5P3YSUNOAH
6NSSLMYJNOAH
7MorrisonYSUNOAH
8P3MYNNNOAH
9ThompsonMYNNNOAH
Table 3. Ensemble-to-ensemble comparisons.
Ensemble ComparisonDescription
ARW-SP vs. NMMB (SMSP)Comparing how model and scheme choices impact storm mode and morphology forecasts.
ARW-SP vs. ARW-MP (SPMP)Analyzing the effects of physic scheme diversity on storm mode and morphology forecasts.
MM vs. NMMB (MMSM)Investigating the impacts of model dynamical core diversity on storm mode and morphology forecasts.
ARW-MP vs. MM (MPMM)Examining the relative effects that the model core and physics scheme diversity have on storm mode and morphology forecasts.
Table 4. Ten retrospective case studies from 2015 to 2016 and their storm morphology description. State abbreviations in this table are as follows: TX is Texas, MO is Missouri, KS is Kansas, MS is Mississippi, OH is Ohio, MN is Minnesota, NE is Nebraska, IL is Illinois, SD is South Dakota, IA is Iowa, and Dakotas refers to North and South Dakota.
Case DateInitialization TimeSynoptic ForcingCase Description
16 May 20152300 UTCStrongSingle-cell dryline convection growing upscale into long-lived squall line from TX to MO
25 May 20151300 UTCStrongMulti-cell convection with large upscale growth into bowing squall line in southeast TX
26 June 20150400 UTCWeakNocturnal, bowing MCS, KS to MO; Nocturnal MCS Ohio Valley; ensuing daytime convective initiation
14 July 20151900 UTCStrongSouthward advancing QLCS with associated cold front through decay, MS and OH valley
11 September 20150100 UTCModerateSupercellular convection growing upscale into squall line with advancing cold front
22 May 20162300 UTCModerateIsolated convection becoming outflow dominant QLCS, western TX
17 June 20162000 UTCWeakSouthward advancing squall line with bowing segment, southeastern US
6 July 20160100 UTCWeakSouthward propagating squall line growing in horizontal scale, MN to IL; convective clusters in KS and NE
7 July 20160000 UTCWeakSupercellular convection growing upscale into bowing MCS, SD to MO
10 July 20160400 UTCWeakSingle and multi-cellular convection growing upscale into nocturnal MCS, Dakotas to IA
Publisher’s Note: MDPI stays neutral with regard to jurisdictional claims in published maps and institutional affiliations.