Article

Soil Moisture-Boundary Layer Feedbacks on the Loess Plateau in China Using Radiosonde Data with 1-D Atmospheric Boundary Layer Model

1
Key Laboratory of Land Surface Process and Climate Change in Cold and Arid Regions, Northwest Institute of Eco-Environment and Resources, Chinese Academy of Sciences, Lanzhou 73000, China
2
College of Earth and Planetary Sciences, University of Chinese Academy of Sciences, Beijing 100049, China
3
Pingliang Land Surface Process and Severe Weather Research Station, Pingliang 744000, China
4
Plateau Atmosphere and Environment Key Laboratory of Sichuan Province, School of Atmospheric Sciences, Chengdu University of Information Technology, Chengdu 610200, China
5
State Key Laboratory of Tibetan Plateau Earth System, Resources and Environment, Institute of Tibetan Plateau Research, Chinese Academy of Sciences, Beijing 100085, China
*
Author to whom correspondence should be addressed.
Atmosphere 2021, 12(12), 1619; https://doi.org/10.3390/atmos12121619
Submission received: 30 October 2021 / Revised: 27 November 2021 / Accepted: 2 December 2021 / Published: 4 December 2021
(This article belongs to the Section Biosphere/Hydrosphere/Land–Atmosphere Interactions)

Abstract

:
The Loess Plateau is one land-atmosphere coupling hotspot. Soil moisture has an influence on atmospheric boundary layer development under specific early-morning atmospheric thermodynamic structures. This paper investigates the sensitivity of atmospheric convection to soil moisture conditions over the Loess Plateau in China by using the convective triggering potential (CTP)—humidity index (HIlow) framework. The CTP indicates atmospheric stability and the HIlow indicates atmospheric humidity in the low-level atmosphere. By comparing the model outcomes with the observations, the one-dimensional model achieves realistic daily behavior of the radiation and surface heat fluxes and the mixed layer properties with appropriate modifications. New CTP-HIlow thresholds for soil moisture-atmosphere feedbacks are found in the Loess Plateau area. By applying the new thresholds with long-time scales sounding data, we conclude that negative feedback is dominant in the north and west portion of the Loess Plateau; positive feedback is predominant in the south and east portion. In general, this framework has predictive significance for the impact of soil moisture on precipitation. By using this new CTP-HIlow framework, we can determine under what atmospheric conditions soil moisture can affect the triggering of precipitation and under what atmospheric conditions soil moisture has no influence on the triggering of precipitation.

1. Introduction

The land processes and feedbacks are highly complex due to the substantial heterogeneity of the land cover and its temporal variability. The water stored on land is a crucial variable controlling numerous processes and feedbacks within the climate system [1,2]. The land surface and the atmosphere are closely linked through the exchange of energy and water. It has been recognized that soil moisture plays a vital role in this exchange through its impacts on surface albedo and the partitioning between sensible and latent heat fluxes [3,4,5,6,7,8].
The influences of soil moisture change on temperature and precipitation have been researched in many studies. Among these studies, the effects of soil moisture on the temperature at different temporal scales have been well documented [9,10]. However, significant uncertainties remain in the impacts on precipitation [11,12,13]. Most researches have explored the effects of soil moisture on rainfall using both observations and climate models [14,15,16,17]. However, the results from models and observations have produced inconsistent reports on the degree and even the direction of the feedbacks between the soil moisture condition and subsequent rainfall. Most explorations about soil moisture’s influence on precipitation have focused on moisture recycling [18,19,20]. There has been increasing attention toward indirect soil moisture-precipitation feedbacks, in which the pathway refers to soil moisture’s influence on boundary layer characteristics and the convective initiation.
There are generally two opposite feedbacks involved in the indirect soil moisture-rainfall coupling, i.e., positive and negative feedback. Positive feedback occurs when wet soil enhances the convective available potential energy (CAPE). If the moisture rises to layers of conditional instability, the increased latent heat can improve the likelihood of convective triggering. Negative feedback occurs when high sensible heat flux increases planetary boundary layer growth, enabling penetration of the lifting condensation level and triggering moist convection and subsequent precipitation [21,22].
The couplings between the land surface and the atmosphere were found to be robust in semiarid ecosystems [23]. Model analyses about the sensitivity of temperature and precipitation to the land surface state concluded that the dry-wet transition area was a hotspot of coupling [24,25,26]. Our study focuses on the Loess Plateau region in China, which is the semiarid transition region between humid and arid climate regions. Moreover, Koster et al. [25] also identified this region was located on the hotspots of coupling. Furthermore, the vegetation cover has dramatically increased on the Loess Plateau since 1999 due to China’s Grain for Green project. According to satellite imagery, the vegetation cover on the Loess Plateau area has almost doubled between 1999 and 2013 [27]. Therefore, exploring soil moisture-precipitation feedbacks has potential implications for this region.
Findell [28] used a single boundary layer model to determine the relative influences of soil moisture and entrainment fluxes on convective precipitation. They created the convective triggering potential (CTP) and the low-level humidity index (HIlow) framework to classify atmospheric conditions. They found that the soil moisture condition can trigger or prevent precipitation under certain atmospheric conditions, while the land surface condition was irrelevant under other situations. Ferguson and Wood [29] classified the land-atmosphere couplings using the CTP-HIlow framework and relying on satellite remote sensing. They concluded that the proposed CTP-HIlow subspace was too rigid to be globally applicable. Tuinenburg et al. [22] calculated the CTP-HIlow subspace in India following Findell’s [28] work. They made slight modifications to the one-dimensional boundary layer model and suggested that different CTP-HIlow values should be adopted in India compared to the initial thresholds in the United States.
Our study investigates the CTP-HIlow thresholds based on the single-model results with soundings from the Loess Plateau stations. We try to find differences in the framework values between the Loess Plateau region and other regions and what feedbacks can be expected in this region. By using this predictive CTP-HIlow framework, we can determine under what atmospheric conditions soil moisture can promote or inhibit the triggering of precipitation and under what atmospheric conditions soil moisture has no influence on the triggering of precipitation. Due to the frequent occurrence of extreme weather in recent years, we can use the threshold obtained in the Loess Plateau to further predict the later convective precipitation and we believe that our work is of great significance to predict future precipitation.
The structure of this paper is as follows. The one-dimensional model and the CTP-HIlow framework are introduced in Section 2. The modifications of the one-dimensional model, the data processing methods, and the data used in this study are presented in Section 3. Section 4 shows the evaluation of the slab model over the Loess Plateau by comparing the observations to the model simulation results. The feedback results of this research are presented in Section 5. The last section includes the discussion and the conclusion.

2. One-Dimensional Model and CTP-HIlow Framework

2.1. One-Dimensional Model

This one-dimensional model is mainly about computing the daily variation of the four variables, i.e., soil temperature (Ts), mixed-layer potential temperature (θ), mixed-layer specific humidity (q), and the mixed-layer height (h) [30,31]. To diagnose the boundary layer growth on days with different early-morning atmospheric conditions and dry or wet soil conditions, Findell and Eltahir [32] made some alterations to the original model and built the CTP-HIlow framework. The model runs based on four main assumptions, i.e., the atmospheric boundary layer is ideal for mixing, the overlying air is considered constant, cloud-free, and soil moisture is constant during the simulation [22,32].
The lapse rates of potential temperature and specific humidity were acquired from the early morning sounding measurements to determine the entrainment. Three possible outcomes of each model run: deep convection, shallow convection and no convection. Rain can occur when the CAPE is more than 400 J/kg and the depth of convection is greater than 5 km and these threshold values are appropriate for the mid-latitude continental regions [33]. Hereafter, we use the single model to determine the Loess Plateau area’s atmospherically-controlled and soil moisture-controlled cases. The atmospherically-controlled cases refer to rain in both wet and dry conditions, shallow convection in both soil conditions, and no convection over wet and dry soil conditions. In contrast, soil moisture-controlled cases refer to different outcomes over different soil conditions.

2.2. CTP-HIlow Framework

The CTP is calculated by integrating the area between the environmental temperature and the moist adiabatic profile between 100 mb and 300 mb above the ground surface. It measures atmospheric stability, ruling out convection in stable conditions, as many traditional stability indices do (e.g., Showalter index [34]). HIlow is defined as the sum of the temperature and dewpoint depressions between 50 and 100 mb above the ground surface. This is the humidity index in the lower level of the atmosphere and is designed to determine the possibility of rain for an atmospheric profile. For a more detailed introduction and calculation formulas of CTP-HIlow indicators, the reader is referred to [32].

3. Data and Methods

3.1. Modifications of the One-Dimensional Model
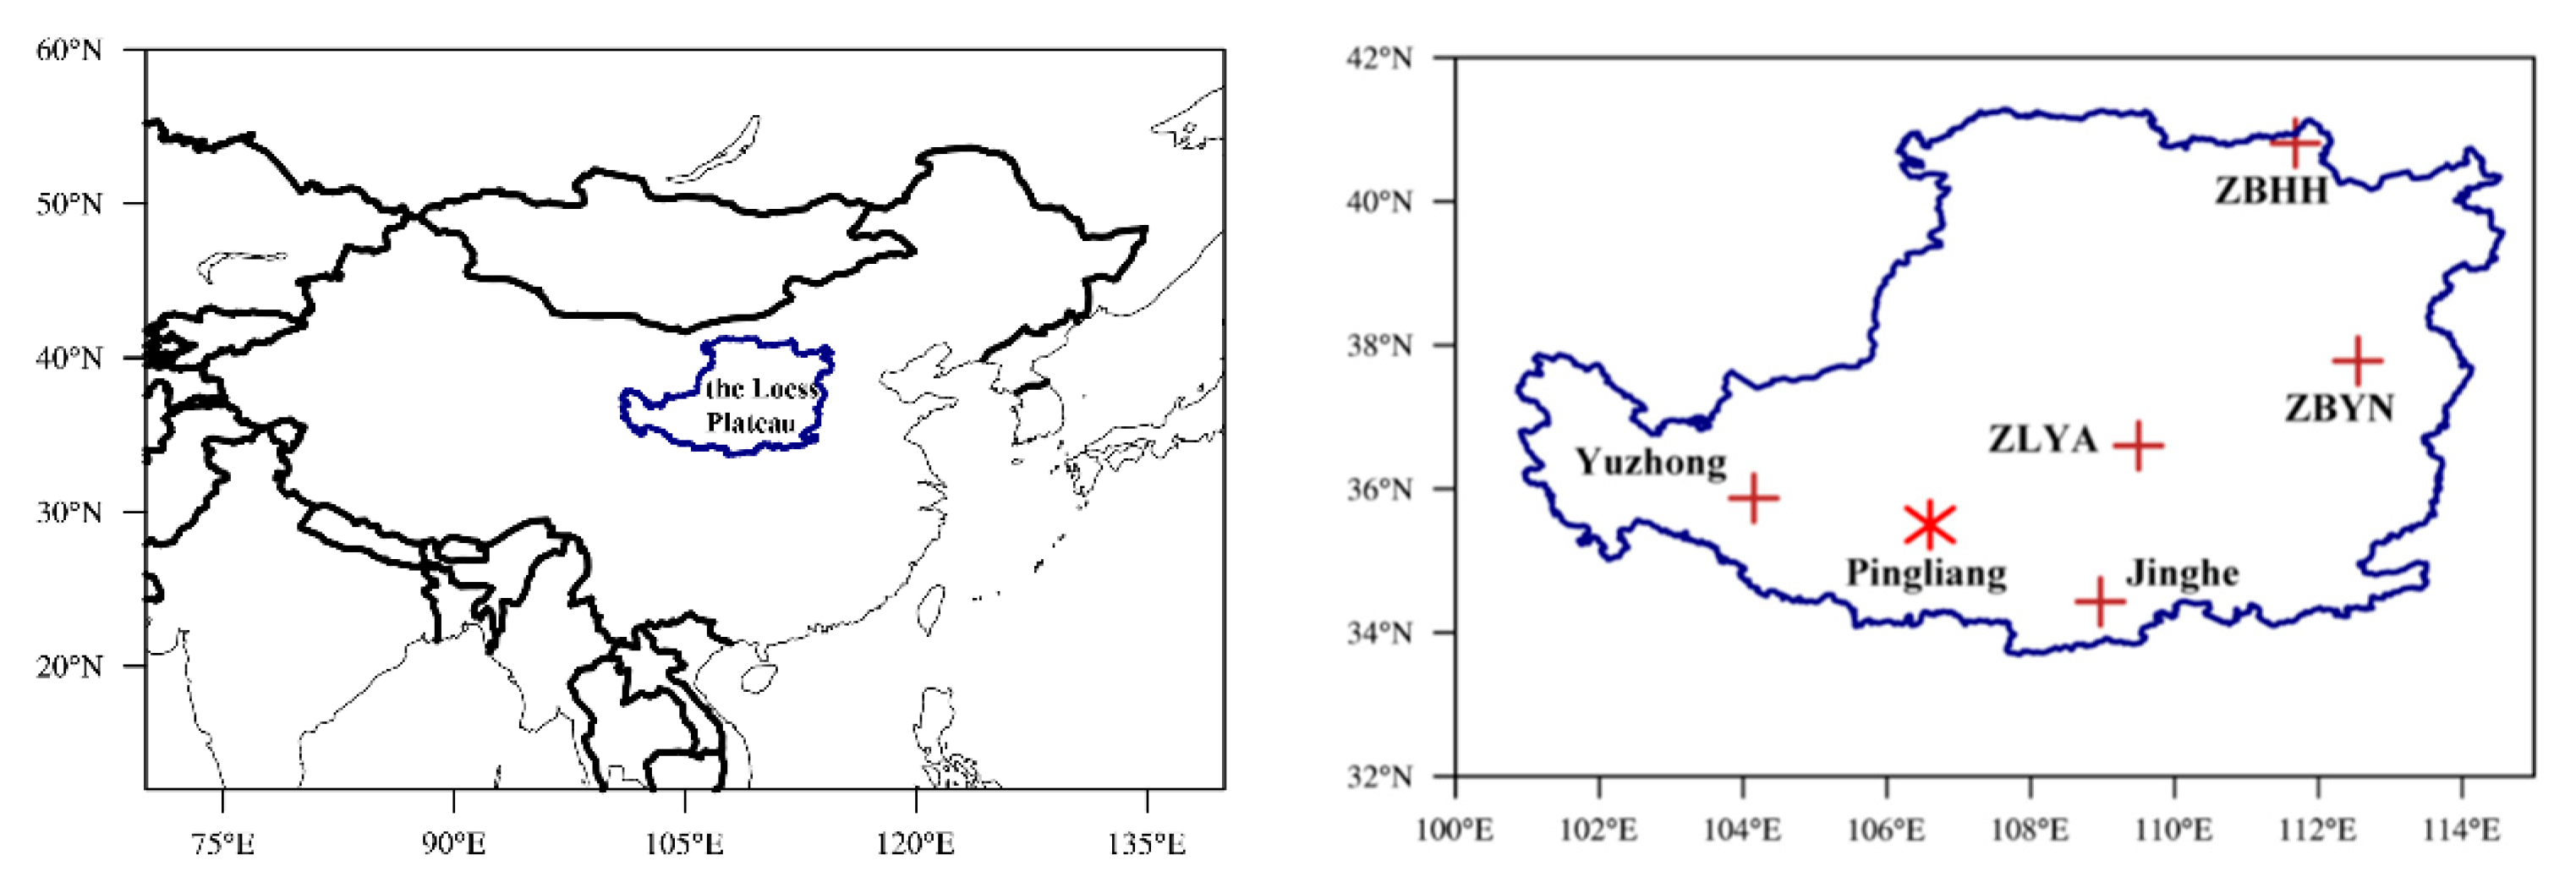
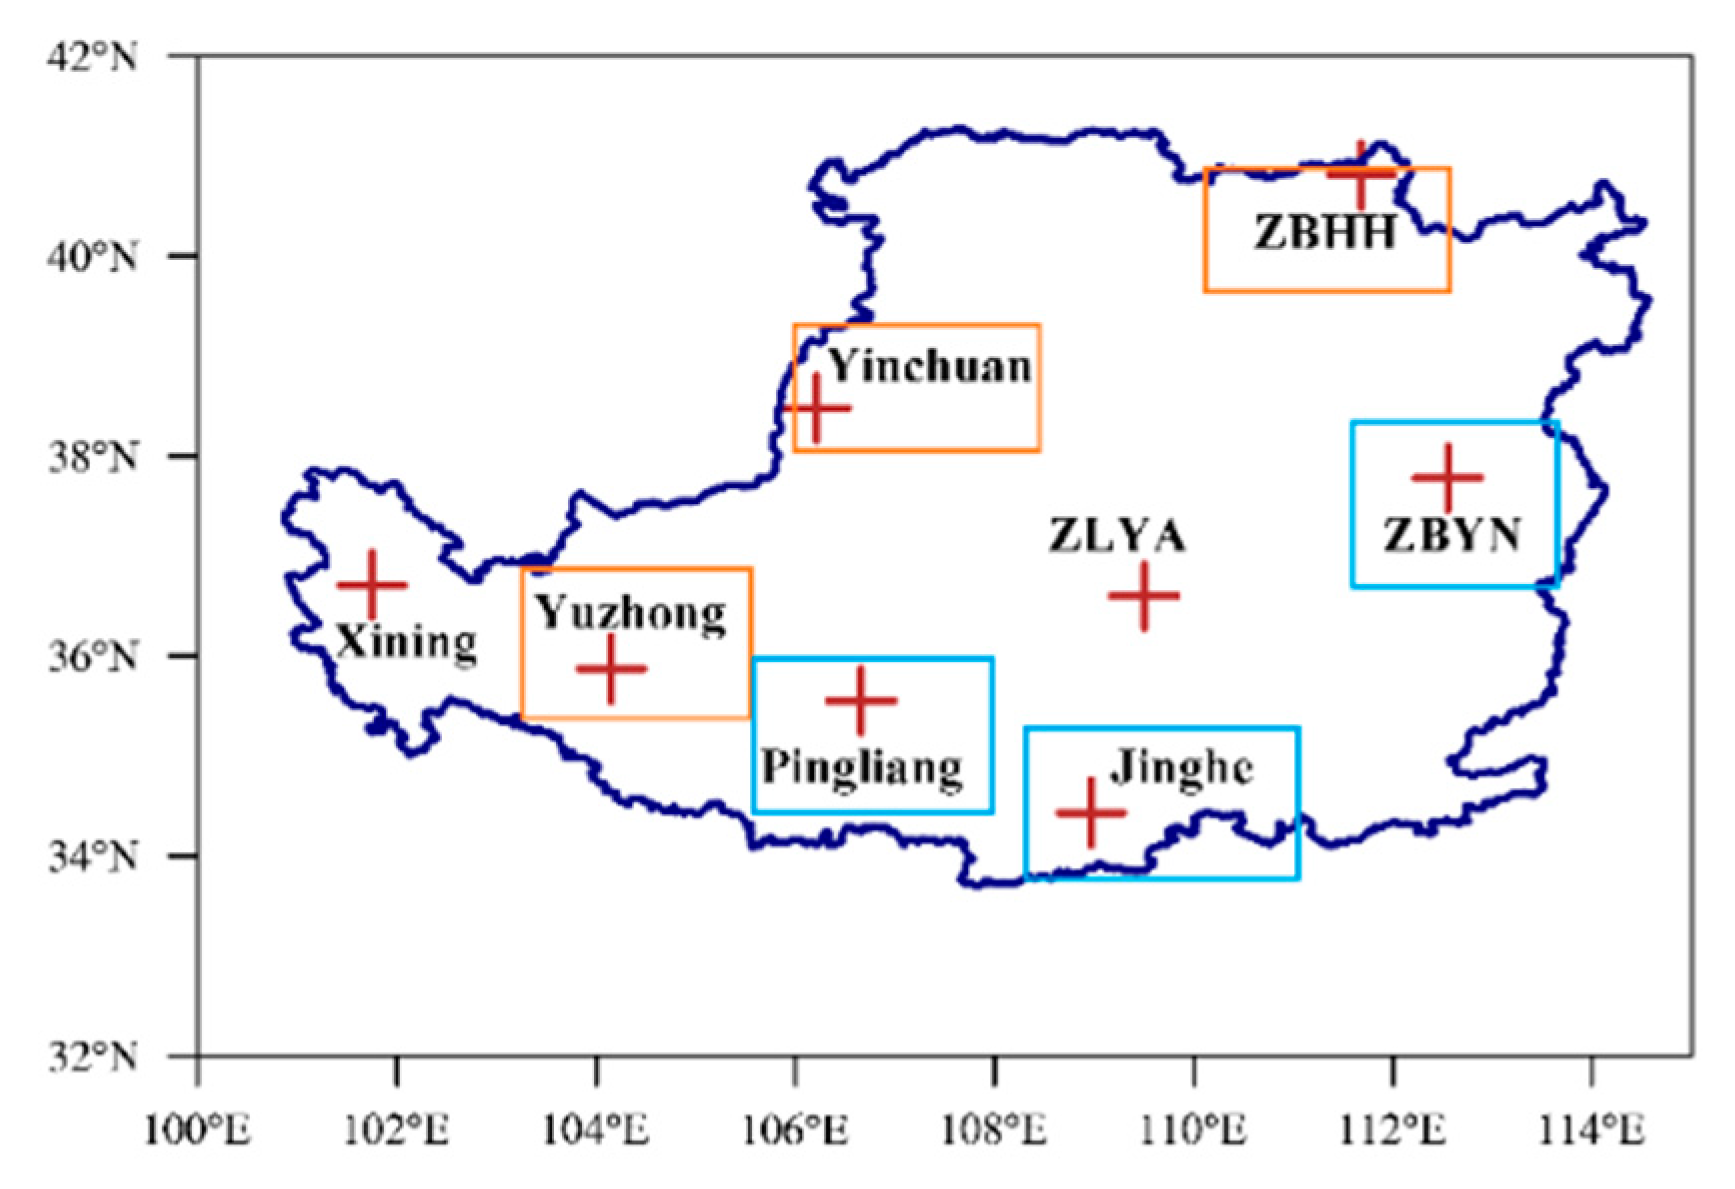
We considered the time scale for the slab model simulation on 12 h, i.e., 8:00 a.m. to 7:00 p.m. local times. The model was initiated by the early morning soundings (0000UTC, 0800 local times) in the Loess Plateau and proceeded until 12 h later or the initiation of free convection.
The observations showed that soil saturation in the Loess Plateau usually changes from 0.1 to 0.6 (Figure 1). An extremely dry and an extremely wet soil saturation were set to 0.1 and 0.8 separately for each sounding on the basis of these changes in this semiarid region. Noted modifications in the slab model were the calculations about the stomatal resistance in the dry and wet soil conditions. Realistic evapotranspiration in different soil conditions could be achieved using a minimum stomatal resistance of about 50 s/m and maximum stomatal resistance of about 2500 s/m [28]. Based on these modifications, the midday Bowen ratio in the model experiments changed from 1.0–2.0 in the extremely dry cases and a range of 0.1–0.2 in the extremely wet cases. Moreover, we determined the incoming solar radiation based on the day of the year and the geographic location of the atmospheric soundings in the present study.

3.2. Data

The observation data used to evaluate the model are from the Pingliang land surface process and severe weather research station (hereafter referred to as Pingliang station) (Figure 2), which belonged to the Chinese Academy of Sciences. Here we select two cloudless days’ data, including the radiation flux, the sensible and latent heat flux, surface temperature data with 30-min intervals, and the radiosonde data at four times (0800, 1100, 1400, 1700 local times). The soil moisture measurements used to judge the soil saturation thresholds are from observations taken in two summers of 2016–2017 in Pingliang station. Furthermore, the sounding data used to initiate the model are from radiosondes launched at 0000 UTC (0800 local times) from five meteorological stations (Figure 2) over the Loess Plateau during the summertime (June, July, August) of 2006–2019. The sounding data used to diagnose the positive and negative feedback distributions in climatic scales are from eight meteorological stations (Figure 3) during the summertime of 1974–2019. These sounding data were acquired from the University of Wyoming (available online at http://weather.uwyo.edu/upperair/sounding.html, accessed on 29 June 2021) [22].

3.3. Data Processing Methods

The soil moisture observations in the summers during 2016–2017 in Pingliang station are taken half-hourly and are volumetric water content data, and we aggregated these half-hourly data into daily time series. Soil moisture can be considered as constant in a diurnal variation. According to the calculation formula: W = θ/θs, where W is the soil saturation, θ is the volumetric water content (m3/m3), and θs is the saturated water content, or the total porosity [35]. In this research, we use the total porosity as 0.515, the calculated value based on observations [36]. As Figure 1 shows, of the total 184 days, the daily soil saturation changes from 0.15 to 0.60. Although these data are from only two summers, it is reasonable to set the extremely dry and highly wet soil saturation to 0.1 and 0.8.
The sounding data used to initiate the model were selected by the following criteria [22,28]:
-
no rain or heavy cloud at the sounding time;
-
no super-adiabatic surface layer present in the sounding;
-
more than 20 vertical levels in the lower 400 hPa of the sounding.
According to the selection criteria stated above, we acquired 537 available soundings from five stations in the summers of 2006–2019 for the Loess Plateau area. Using the new CTP-HIlow thresholds of model outcomes, we further calculated the positive and negative feedback distributions in climatic scales with sounding data from eight meteorological stations (Figure 3) during the summertime of 1974–2019. These data were selected with a less strict criterion, i.e., the sounding with more than 10 layers in the lower 400 hpa [22]. According to this criterion, we acquired a total of 5307 soundings.

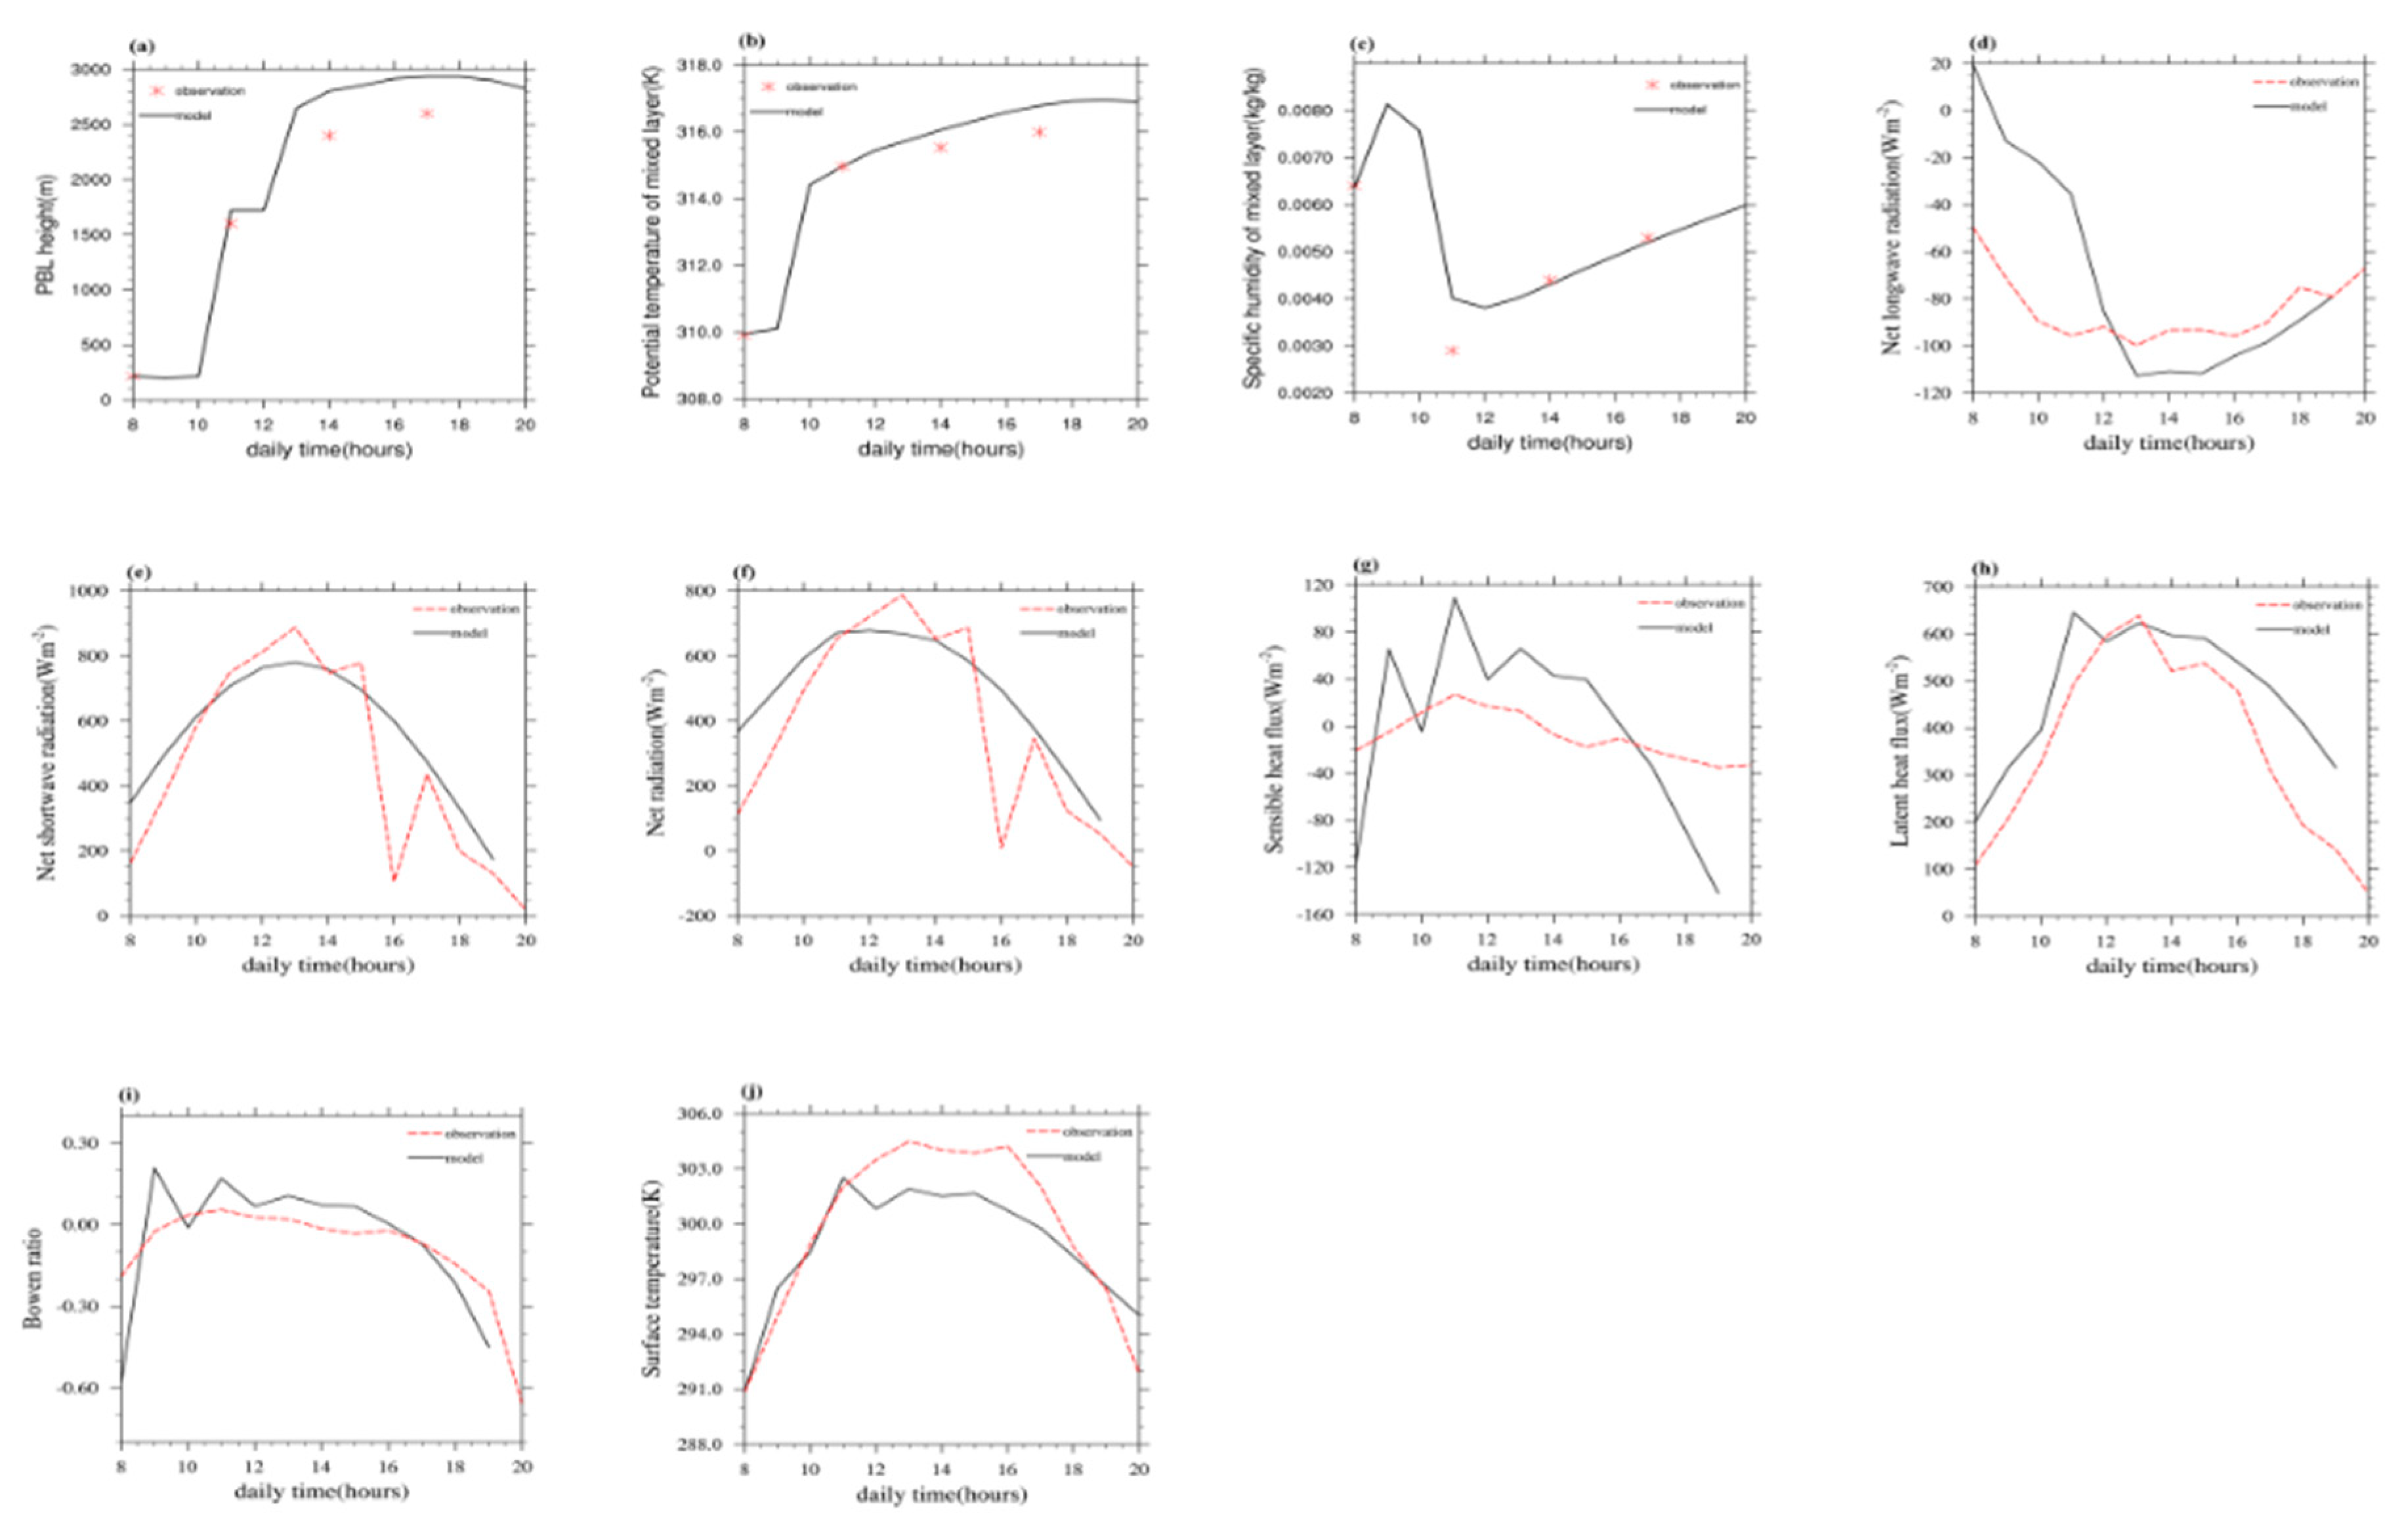
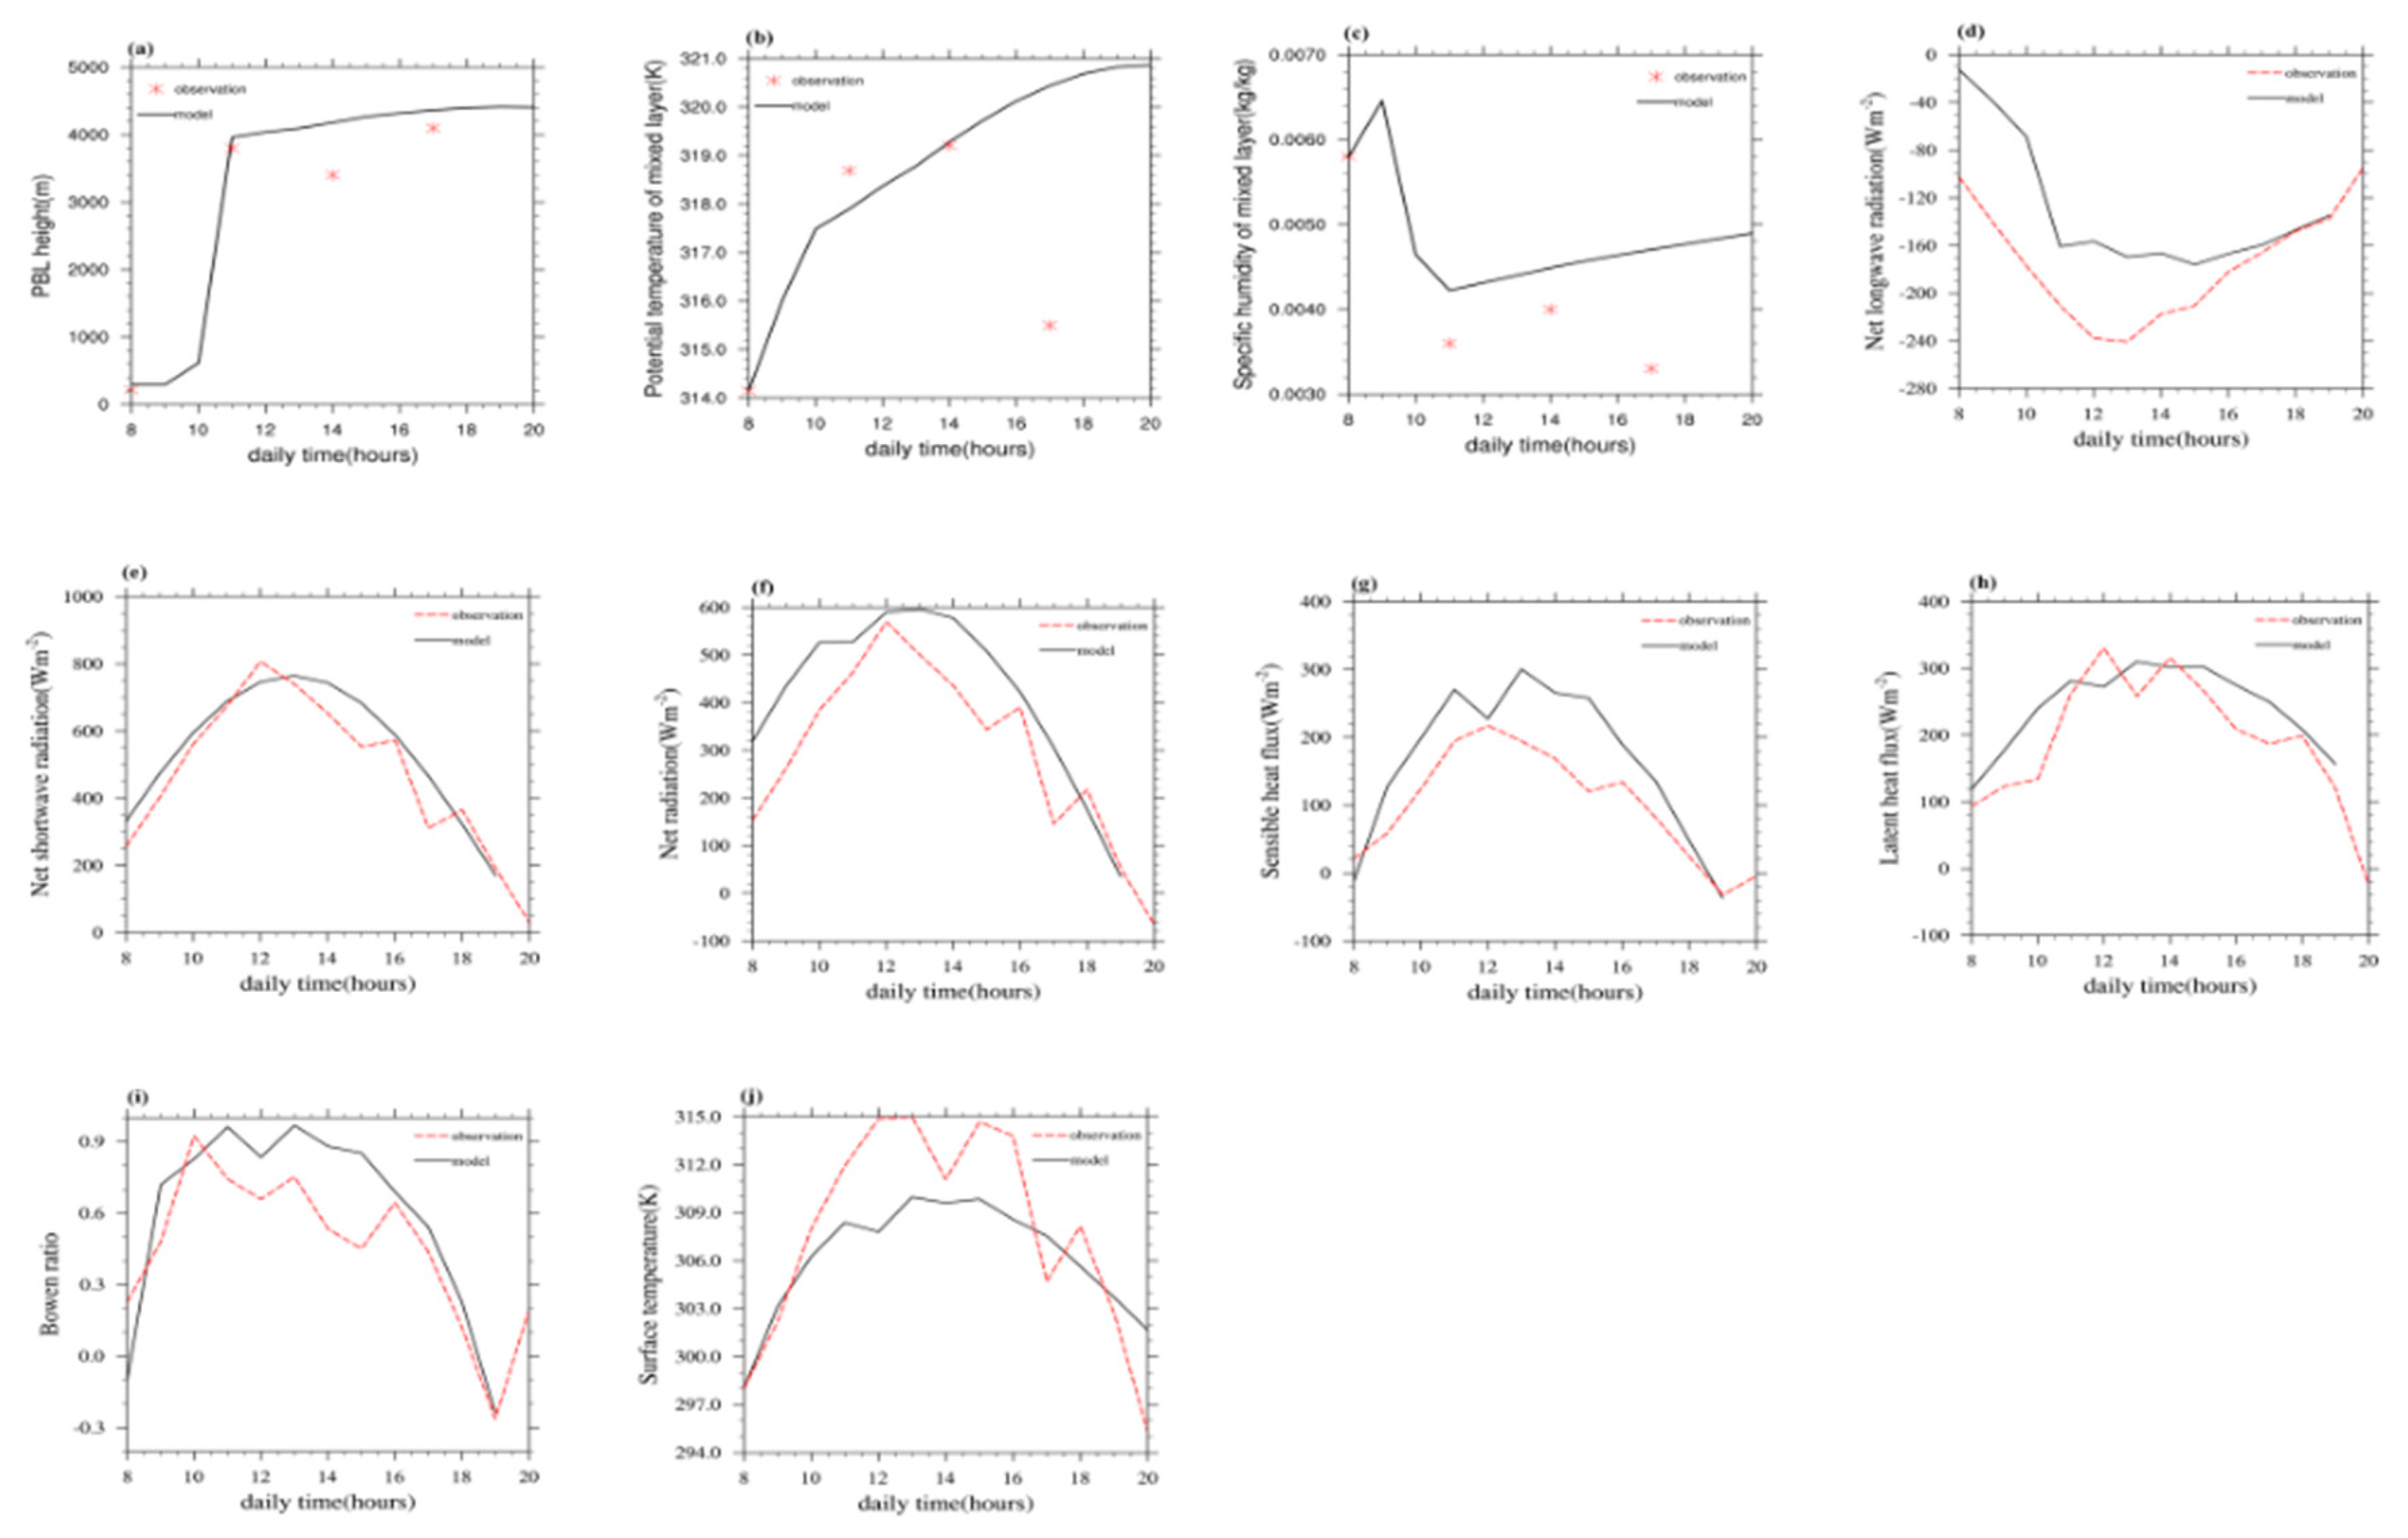
4. Model Verification

To evaluate the model’s performance, we compared the vertical structure of the model with observations as the boundary layer grows up. Here we chose two cloudless days, i.e., 28 June 2016 and 9 July 2017, which included the radiation flux, the sensible and latent heat flux, surface temperature data with 30-min intervals, and radiosonde data at 8, 11, 14, and 17 local times. The simulation results for 28 June 2016 are presented in Figure 4, and the day 9 July 2017 are shown in Figure 5. According to the observed 5-cm depth soil moisture, the model ran with a soil saturation of 0.33 for 28 June 2016 and 0.19 for 9 July 2017. These two examples both show that the observed mixed layer properties fell within the realm of the properties obtained from running the model. The model results in Figure 4a–c matched the observations of the boundary layer height, potential temperature, and specific humidity better than those in Figure 5a–c at the four sounding times. The boundary layer height from both two simulations was slightly over-predicted. In addition, the simulated mixed layer-specific humidity in Figure 5c was much higher than the observed value. Comparing the model results to the hourly measurements, we can conclude that the model has achieved natural daily radiation and eddy heat fluxes. The model results in Figure 4d–i were better than Figure 5d–i. The simulated net longwave radiations in Figure 5d were somewhat more extensive, explaining the slight overestimation of net radiation (Figure 5f). Bowen ratios were all overestimated compared with the observations because of the overestimation of sensible heat fluxes. The surface temperature in Figure 5j seemed to be poorer simulated than Figure 4j, and the simulated values were much lower than the observations.
Overall, the model results and the observations were consistent. As Findell (2001) illustrated, we did not tune the model to replicate observed days since our intent is not to use this model as a predictive tool. Thereby we will use this modified single model in the following work.

5. Results

5.1. Soil Moisture-Atmosphere Feedbacks on the Loess Plateau

Here we show the CTP-HIlow scopes of atmospherically-controlled and soil moisture-controlled cases of the five stations on the Loess Plateau. As shown in Figure 2, the five stations are located in different areas of the Loess Plateau. Station ZBHH is located at a latitude of 40.81° N, on the northeast edge of the Loess Plateau area. The elevation of this station is 1065 m, resulting in a surface pressure of about 880 hPa. A total of 74 available soundings in 2013–2019 were used to initiate the one-dimensional model. Station ZBYN is at a latitude of 37.78° N in Taiyuan, Shanxi Province of China. The elevation and surface pressure of this station are about 779 m and 920 hPa. The 72 soundings with no rainy and no super-adiabatic surface layer used to initiate the model were from 2013–2019. Station ZLYA is located at Yanan, Shaanxi Province of China, with a latitude of 36.6° N. The elevation and surface pressure of this station are about 960 m and 876 hPa, respectively. The 156 available soundings from the summers of 2011–2019 were used to initiate the one-dimensional model. Station Yuzhong is located in Lanzhou, Gansu Province of China, with a latitude of 35.87° N. The elevation and surface pressure of this station are about 1875 m and 806 hPa. In total, 170 available and non-rainy soundings from the summers of 2006–2019 were used to initiate the slab model. Station Jinghe is located in Xian, Shaanxi Province of China, with a latitude of 34.43° N. The elevation and surface pressure of this station are about 411 m and 957 hPa. A total of 65 available and non-rainy soundings from the summers of 2009–2019 were used to initiate the one-dimensional model.
As illustrated in Figure 6a, we can clearly distinguish atmosphere-controlled cases from soil moisture-controlled cases. According to Figure 6b, we summarized that for atmosphere-controlled cases: when HIlow < 10 °C, CTP < 100 J/kg, shallow clouds are present across both soil conditions; when HIlow < 10 °C, CTP > 100 J/kg, there is rain over both soil conditions; and HIlow > 26 °C, any CTP, there is no convection over either soil condition. According to Figure 6c, we concluded that for soil moisture-controlled cases: when 10 °C < HIlow < 16 °C, CTP < 100 J/kg, shallow clouds occur over wet soils; 10 °C < HIlow < 16 °C, 100 < CTP < 240 J/kg, there is a wet soil advantage, i.e., rain or shallow clouds over wet soils only; when 16 °C < HIlow < 26 °C, 100 < CTP < 240 J/kg, there is a transition zone, and any outcome is possible; and 16 °C < HIlow < 26 °C, 240 < CTP < 400 J/kg, there is a dry soil advantage, i.e., rain or shallow clouds over dry soils only.
Figure 7 illustrates the probability distributions of the atmosphere-controlled cases and soil moisture-controlled cases of the model’s outcomes. Of the total 537 soundings, 69.83% were atmosphere-controlled cases, and 30.17% were soil moisture-controlled cases; for atmosphere-controlled cases, 49.53% were both no convection, 18.62% were both shallow convection, and 1.68% cases involved both spots of rain in wet and dry soil conditions (Figure 7a). For the total of 162 soil moisture-controlled cases, rain over dry soils occupied 12.35%, shallow convection over dry soils occupied 43.21%, rain over wet soils occupied 13.58%, and shallow convection over wet soils occupied 30.86% (Figure 7b). In total, positive feedback cases (rain or shallow convection over wet soils) were 44.44%, compared to 55.56% of negative feedback cases (rain or shallow convection over dry soils).

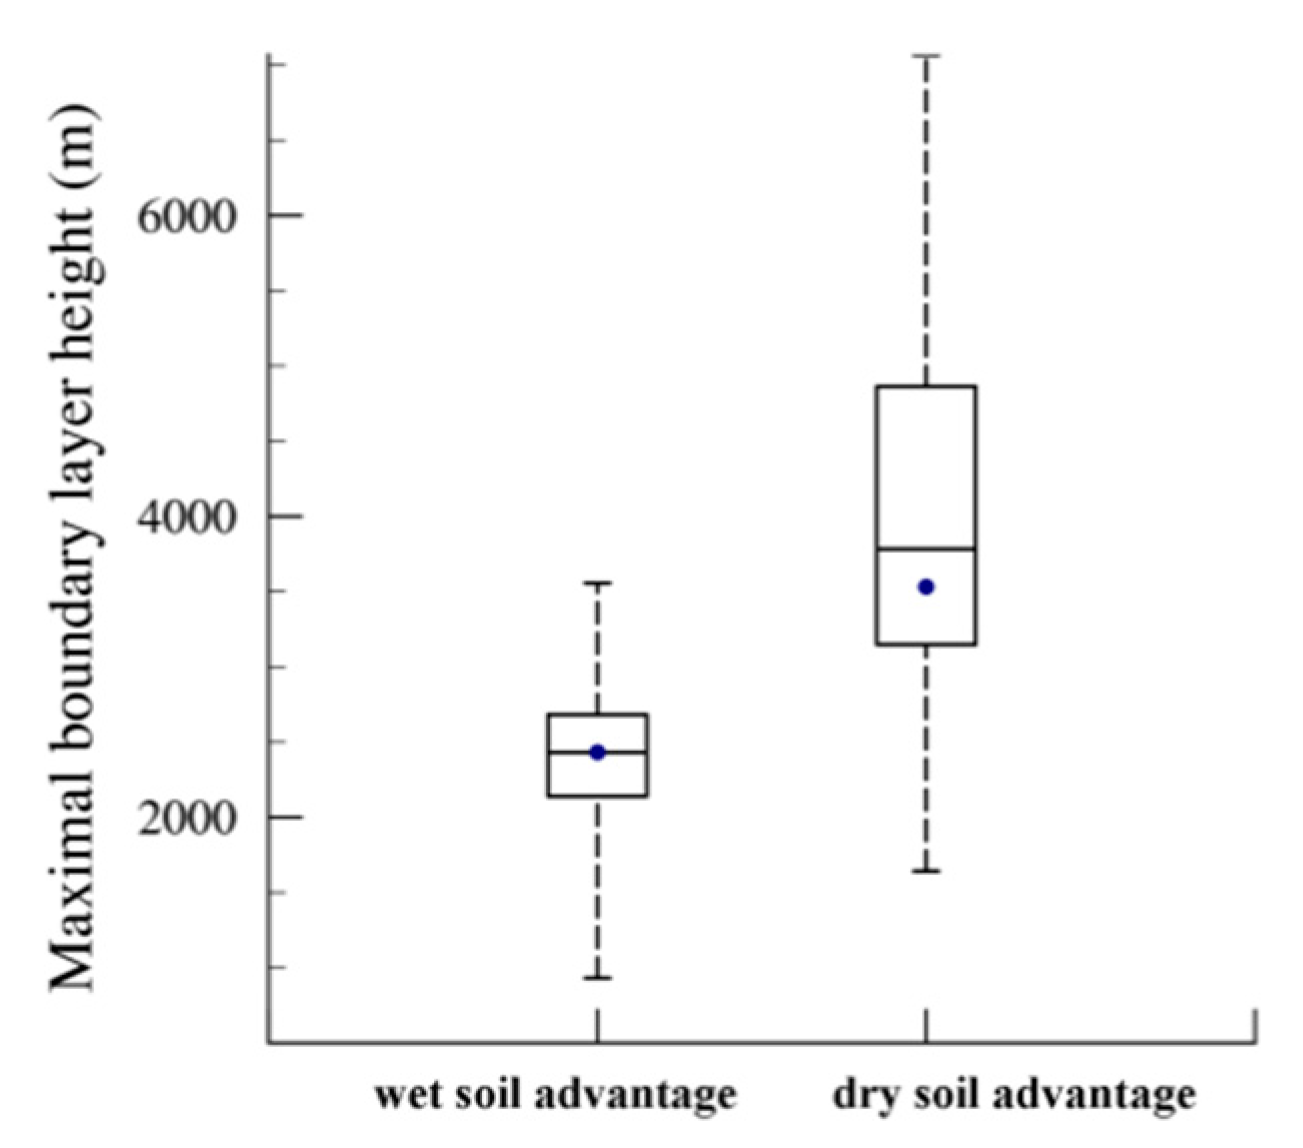
5.2. Distributions of Maximal Boundary Layer Height in Wet and Dry Soils

As shown in Figure 8, the daily maximal boundary layer height in dry soils was much higher than in wet soils. The minimum values, lower quartile, median, upper quartile, and maximum values of the boundary layer height when there were wet soil advantage cases were 931.26 m, 2139.28 m, 2430.83 m, 2681.49 m, and 3556.34 m, respectively. The five values in the dry soil advantage cases were 1641.92 m, 3147.97 m, 3782.4 m, 4863.06 m, and 7067.31 m, respectively. The average maximal boundary layer height values were 2431.86 m in the wet soil advantage cases compared to 3531.52 m in the dry soil advantage cases. These results verified that our model outcomes were reasonable. When the soil was dry, the sensible heat fluxes were high enough to increase the boundary layer height; when the soil was wet, the boundary layer grew more slowly, leading to a lower boundary layer height.

5.3. Atmosphere Background Influences on the Outcomes

Any outcomes are in the scope of the atmospheric background, for example, when the atmosphere is too dry to generate clouds, it is necessary to check the atmospheric condition in these different outcomes. Due to a limitation of the observation, we only checked the humidity and wind influences. Distributions of the near-surface (generally 2–10 m above the ground surface in different stations) specific humidity and wind speed at the initial sounding times are shown in Figure 9 for different model outcomes (i.e., both rain in wet and dry soil conditions, both shallow clouds in wet and dry soil conditions, no rain in either wet or dry soil conditions, rain in dry soil conditions, shallow clouds in dry soil conditions, rain in wet soil conditions, shallow clouds in wet soil conditions).
As is depicted in Figure 9a, the near-surface specific humidity showed different distributions in different model outcomes. In both-rain conditions, the specific humidity was significantly higher than in both-no conditions. In soil moisture-controlled conditions, the specific humidity in the dry soil advantage condition was lower than in the wet soil advantage condition. These humidity distributions were consistent with the HIlow distributions in different model outcomes, as stated above.
The distributions of the near-surface wind speed in Figure 9b suggested low wind speeds at the initial sounding times. Therefore, in the calculations of aerodynamic resistance near the surface, we ignored the changes of wind speed, assuming that the model was permanently neutral, and set the aerodynamic resistance as constant [28]. The work of Findell [28] demonstrated that the three-dimensional wind configuration could enhance or diminish convective triggering. In this work, wind speed is relatively low in most cases, so we omitted the influence of wind and focused on the soil conditions’ impact. Further work needs to be done considering more influences based on detailed field observational experiments.

5.4. Positive and Negative Feedback Distributions in Climate Scales

Based on the above model results, we applied the new CTP-HIlow thresholds (i.e., 10 °C < HIlow < 16 °C, 100 < CTP < 240 J/kg, wet soil advantage; 16 °C < HIlow < 26 °C, 240 < CTP < 400 J/kg, dry soil advantage) to explore the positive and negative feedback distributions in different areas of the Loess Plateau using long time scales sounding data. Due to using less strict criteria than the model’s initial standards, we acquired 5307 soundings from eight meteorological stations (Figure 3) during the summertime of 1974–2019. In addition to the five stations stated above, the other three stations were added. The three stations were Yinchuan, Xining, and Pingliang. Station Yinchuan is at a latitude 38.47° N in Ningxia Hui Autonomous Region of China. The elevation and surface pressure of this station are about 1112 m and 886 hPa. Station Xining is at a latitude of 36.7° N in Qinghai province of China. The height and surface pressure of this station are about 2296 m and 773 hPa. Station Pingliang, which was used to evaluate the model as stated above, is at a latitude of 35.54° N in China’s Gansu province. The elevation and surface pressure of this station are about 1348 m and 865 hPa.
The probability distributions of the wet soil advantage cases and dry soil advantage cases of the model’s outcomes showed some difference from the new CTP-HIlow diagnostic results (Figure 10). For the model’s outcomes (Figure 10a): from station ZBHH, a total of 74 soundings were obtained, and of these 13.51% were wet soil advantage cases, and 17.57% were dry soil advantage cases; from station Jinghe, a total of 65 cases were obtained, and of these 13.85% were wet soil advantage cases, and 18.46% were dry soil advantage cases; from station ZBYN, a total of 72 cases were obtained, and of these 18.06% were positive feedbacks, and 23.61% were negative feedbacks; from station ZLYA, a total of 156 cases were observed, and of these 11.54% were positive feedbacks, and 16.03% were negative feedbacks; and from station Yuzhong, a total of 170 cases were observed, and of these 12.94% were wet soil advantage cases, and 13.53% were dry soil advantage cases. The total percentage of positive feedbacks and negative feedbacks was 13.41% and 16.76%, respectively. It appears that stations ZBHH, Jinghe, ZBYN, ZLYA had more negative feedbacks, and the total percentage indicated that more negative feedbacks existed in the Loess Plateau.
For the new CTP-HIlow diagnostic results which are based on long time scales (Figure 10b): from station ZBHH, a total of 1210 cases were observed, and of these positive feedbacks occupied 7.93%, and negative feedbacks occupied 10.83%; from station Jinghe, a total of 818 cases were observed, and of these positive feedbacks occupied 12.96%, and negative feedbacks occupied 8.80%; from station ZBYN, a total of 916 cases were observed, and of these positive feedbacks occupied 9.72%, and negative feedbacks occupied 7.97%; from station ZLYA, a total of 1160 cases were observed, and of these positive feedbacks occupied 7.07%, negative feedbacks occupied 7.50%; from station Yuzhong, a total of 909 cases were observed, and of these positive feedbacks occupied 6.49%, and negative feedbacks occupied 11.22%; from station Yinchuan, a total of 72 cases were observed, and of these, positive feedbacks occupied 6.94%, and negative feedbacks occupied 8.33%; from station Xining, a total of 85 cases were observed, and of these positive feedbacks occupied 3.53%,and negative feedbacks occupied 3.53%; and from station Pingliang, a total of 137 cases were observed, and of these positive feedbacks occupied 5.11%, and negative feedbacks occupied 4.38%. The total percentage of positive feedbacks and negative feedbacks were 8.42% and 9.04% respectively. Due to the limited amount of data, the probability distributions of station Yinchuan, Xining and Pingliang probably could not represent the climate-scale situation. However, we can still analyze the positive and negative distributions based on the existing results. Station ZBHH, Yinchuan, Yuzhong present much more negative feedbacks; station ZBYN, Jinghe and Pingliang present much more positive feedbacks (Figure 3). As depicted in Figure 3, negative feedback is predominant in the north and west portion of the Loess Plateau; in the south and east portion, positive feedback is predominant.
Considering China’s Grain for Green project, which has been in operation since 1999, the soil moisture in this region has also changed dramatically over the last few decades. In later work, we will further verify the applicability of this study’s results by using precipitation data in the Loess Plateau region.

6. Discussion and Conclusions

In this study, we explored the feedback between soil moisture and atmosphere on the Loess Plateau using the CTP-HIlow framework, which was initiated by Findell and Eltahir [32]. We evaluated the modified one-dimensional model and calculated the new CTP-HIlow thresholds based on the modified slab model’s outcomes. Using the new CTP-HIlow thresholds, we analyzed the probability distributions of positive and negative feedbacks with long-time scales sounding data.
In the original work of Findell [28], in the United States, for atmosphere-controlled cases: when HIlow < 5 °C, CTP < 0 J/kg, shallow clouds occur over both soil conditions; when HIlow < 5 °C, CTP > 0 J/kg, rain occurs over both soil conditions; and when HIlow > 15 °C, any CTP, no convection occurs over either soil condition. For soil moisture-controlled cases: when 5 °C < HIlow < 10 °C, 0 < CTP < 200 J/kg, there is a wet soil advantage, i.e., rain or shallow clouds over wet soils only; when 10 °C < HIlow < 15 °C, 100 < CTP < 200 J/kg, there is a transition zone, and any outcomes possible; and when 10 °C < HIlow < 15 °C, 200 < CTP < 400 J/kg, there is a dry soil advantage, i.e., rain or shallow clouds over dry soils only.
From the work of Tuinenburg et al. [22], who calculated the new CTP-HIlow space in India for positive feedbacks and negative feedbacks, we can learn that: when 7 < HIlow < 12 °C, 0 < CTP < 200 J/kg, positive feedbacks can occur; and when 11 < HIlow < 16 °C, 200 < CTP < 500 J/kg, negative feedbacks can occur.
Comparing our results with the thresholds stated above, we find that the HIlow values are higher in our work. Since the HIlow index represents low-level atmospheric humidity, and our study area is located in the semi-arid area, this result is reasonable and we will apply these new thresholds for our future research work.
Because of the lack of observational data for use in evaluating the realism of model-based land–atmosphere feedback, so far, the regions using a one-dimensional boundary layer model to calculate the CTP-HIlow thresholds are mainly the United States and India. Ferguson and Wood [29] revised the CTP-HIlow classification framework globally using the combinations of methods and data sources with remote sensing data, and they found vast differences among 20 climatic regions and three GLACE coupling hot spots. In recent research work, Wakefield et al. [37] investigated changes in the covariance of soil moisture and the atmospheric low-level thermodynamic profile during seasonal hydrometeorological extremes by using the CTP-HIlow framework in the United States. Bhowmick [38] demonstrated that this framework lacked generality and that solutions were empirically derived based on one-dimensional modelling and observations, which varied from place to place. Therefore, it is very necessary to use our valuable observed radiosonde data on the Loess Plateau for one-dimensional model analysis.
During the model simulation period, the boundary layer sometimes grew up to 400 hPa or even 500hPa above the ground surface. Thereby, we changed the ranges at which the CTP was calculated and found no improvement in classification. Therefore, we did not change the calculation ranges of the CTP and HIlow in this work. Moreover, the wind may enhance or diminish convection, as stated by Findell [28]. However, in this work, we emphasized the heat fluxes’ impacts and ignored the influences of wind. As we discussed, the influences of wind or other factors which can impact the soil moisture-atmosphere feedback need to be researched in the future. The results of this paper are as follows:
(1)
We concluded the new CTP-HIlow thresholds in the Loess Plateau based on the modified slab model. For atmosphere-controlled cases: when HIlow < 10 °C, CTP < 100 J/kg, shallow clouds occur over both soil conditions; when HIlow < 10 °C, CTP > 100 J/kg, rain occurs over both soil conditions; and when HIlow > 26 °C, any CTP, no convection occurs over either soil condition. For soil moisture-controlled cases: when 10 °C < HIlow < 16 °C, CTP < 100 J/kg, shallow clouds occur over wet soils; 10 °C < HIlow < 16 °C, 100 < CTP < 240 J/kg, there is a wet soil advantage, i.e., rain or shallow clouds over wet soils only; when 16 °C < HIlow < 26 °C, 100 < CTP < 240 J/kg, there is a transition zone, and any outcome is possible; and when 16 °C < HIlow < 26 °C, 240 < CTP < 400 J/kg, there is a dry soil advantage, i.e., rain or shallow clouds over dry soils only.
(2)
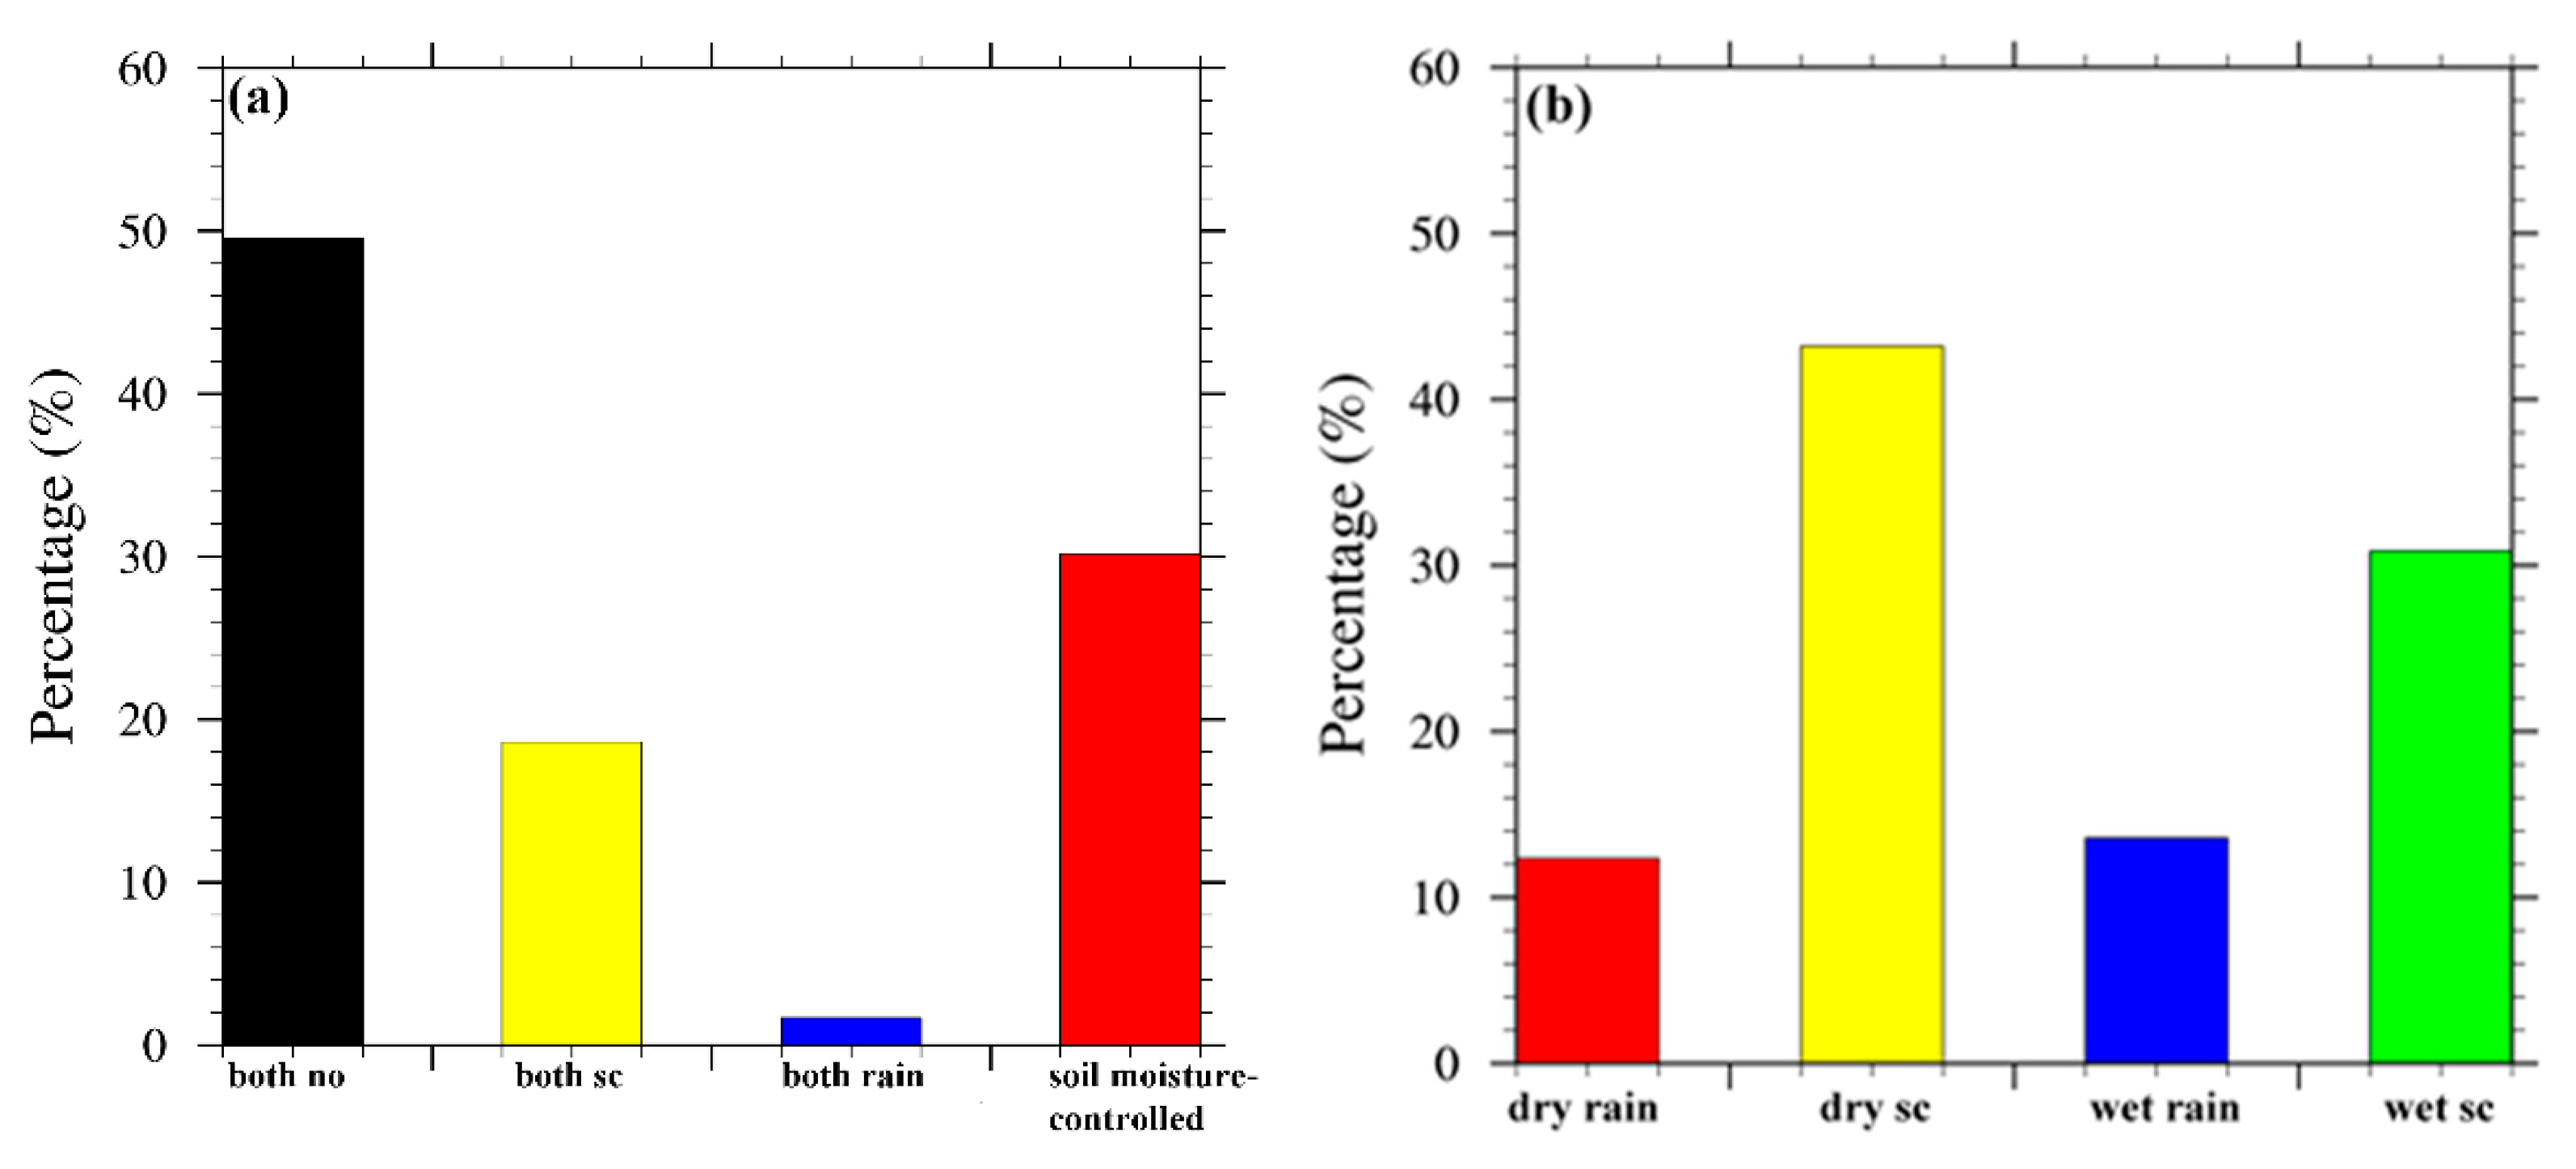
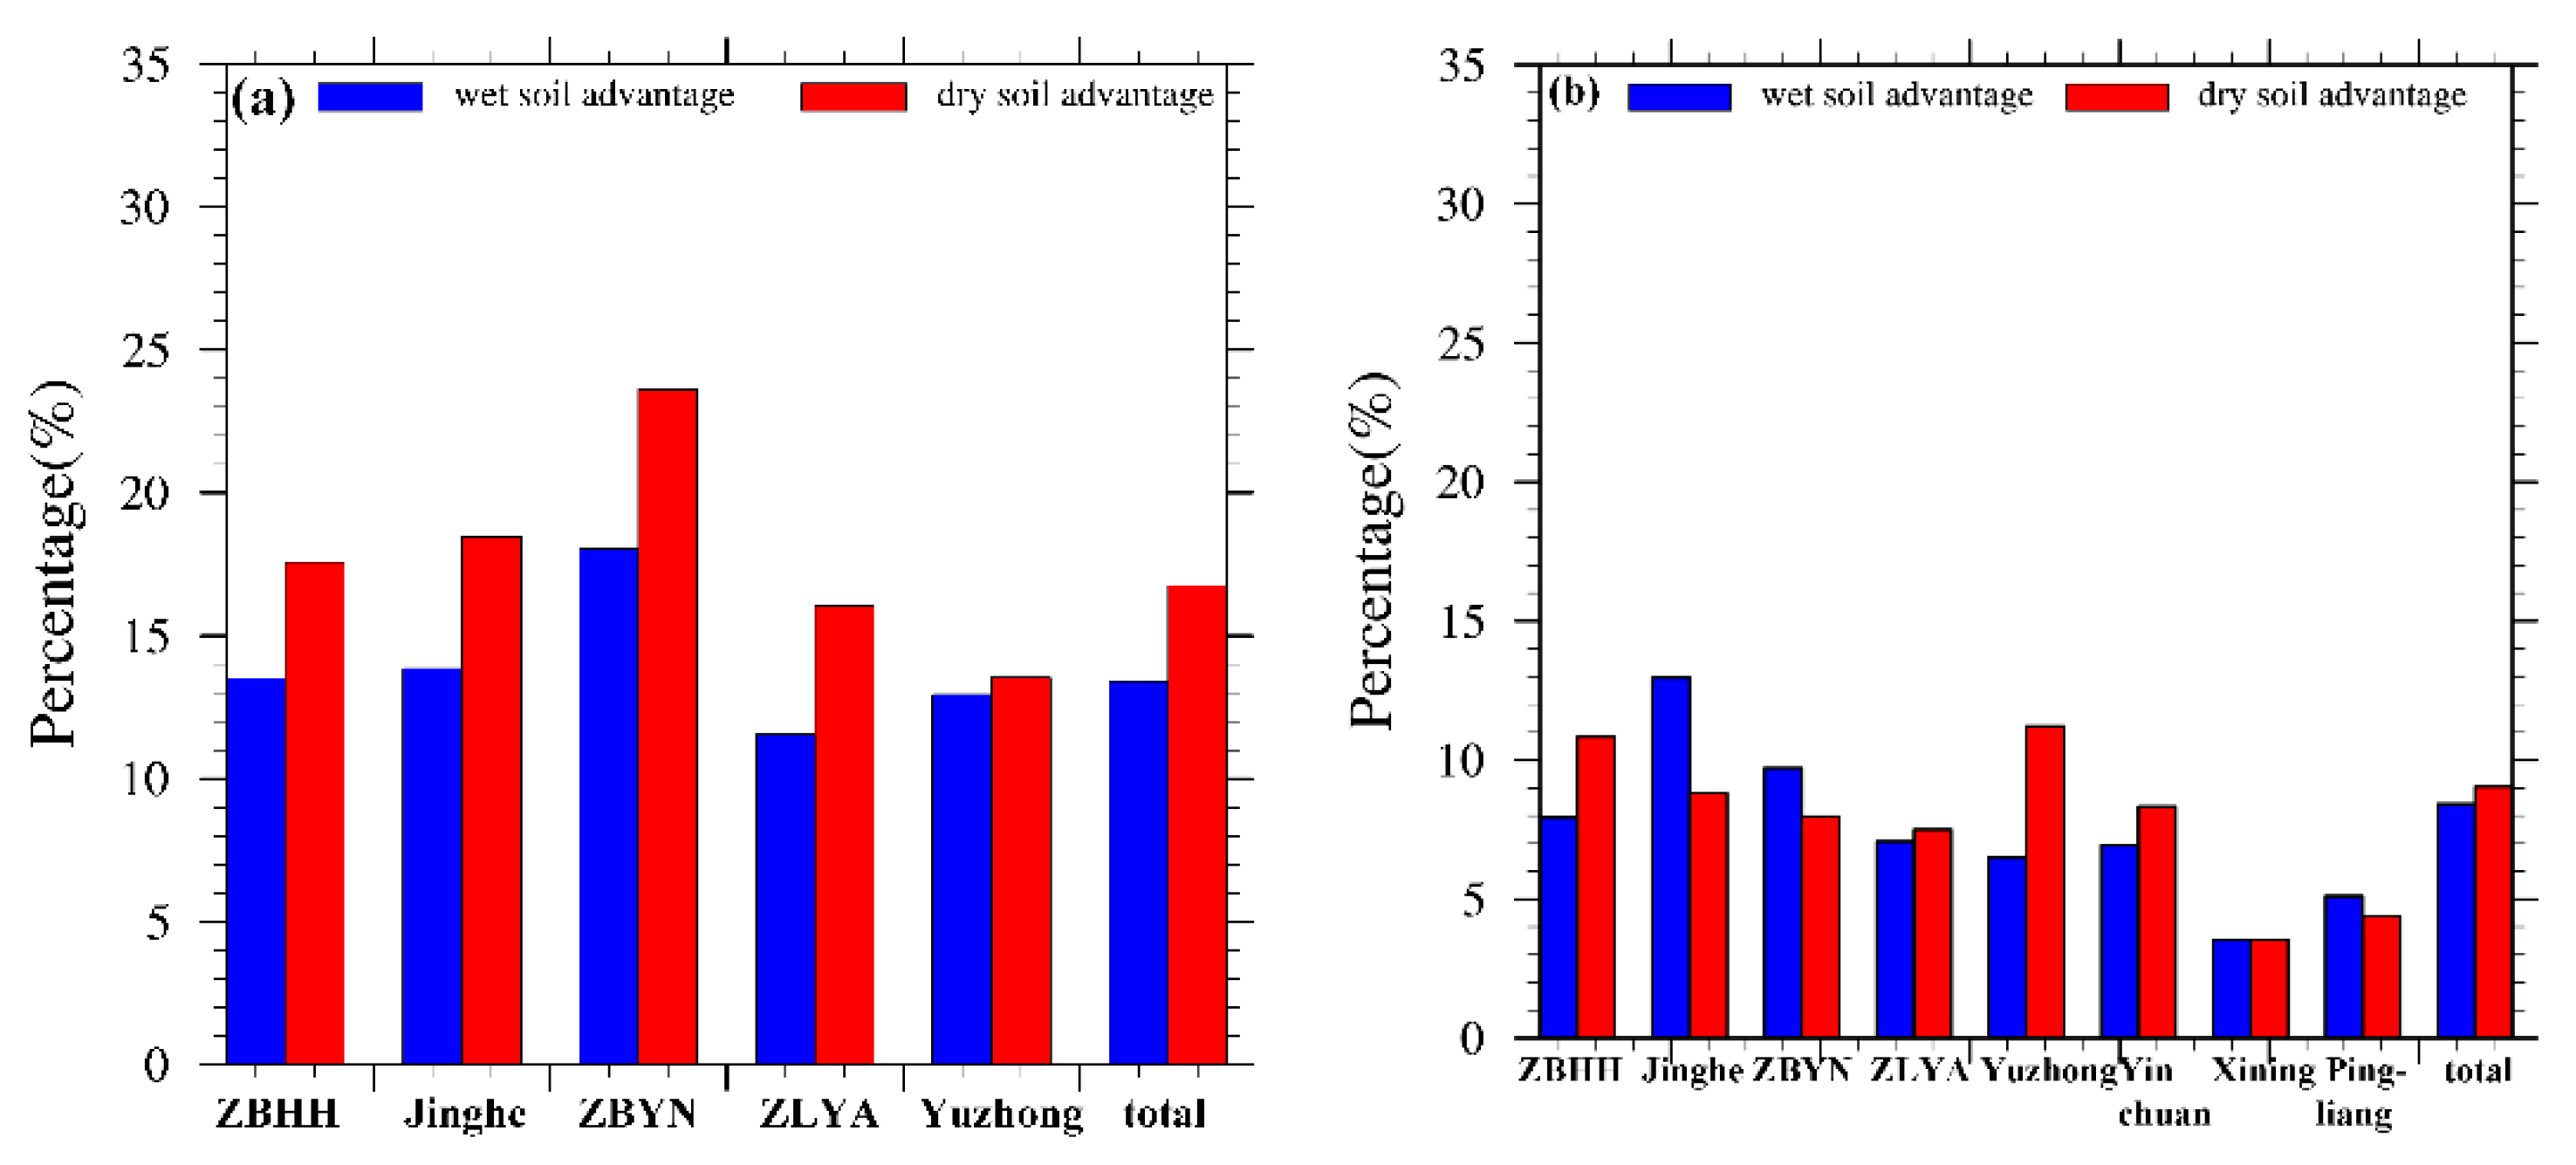
The probability distributions of atmosphere-controlled cases and soil moisture-controlled cases of model outcomes were 69.83% and 30.17%, respectively. The probability distributions of the wet soil advantage cases and dry soil advantage cases of model outcomes showed some difference from the new CTP-HIlow diagnostic results. For model outcomes, it seemed like stations ZBHH, Jinghe, ZBYN, and ZLYA had more negative feedbacks, and the total percentage indicated that more negative feedbacks existed in the Loess Plateau. For new CTP-HIlow diagnostic results, stations ZBHH, Yinchuan, and Yuzhong present much more negative feedbacks; and stations ZBYN, Jinghe and Pingliang present much more positive feedbacks. In total, negative feedback is predominant in the northern and western portion of the Loess Plateau; in the southern and eastern portion, positive feedback is predominant.

Author Contributions

Conceptualization, X.M. and Y.M.; methodology, X.M.; software, Y.M.; validation, Y.M., X.M. and Y.A.; formal analysis, Y.M.; investigation, Y.M. and S.L.; resources, Y.Y. and J.L.; data curation, Y.Y. and J.L.; writing—original draft preparation, X.M. and S.L.; writing—review and editing, X.M. and Y.M.; visualization, Y.M. and J.X.; supervision, X.M. and G.L.; project administration, X.M.; funding acquisition, X.M. All authors have read and agreed to the published version of the manuscript.

Funding

This study was conducted under the auspices of the Chinese National Science Foundation Programs: 91837209, 41822501, 41975014, 42075042; The Science and Technology Research Plan of Gansu Province: 20JR10RA070; the Chinese Academy of Youth Innovation and Promotion, CAS: Y201874; iLEAPs (integrated Land Ecosystem-Atmosphere Processes Study-iLEAPS), and the National Key Research and Development Program of China (2016YFB0501303).

Acknowledgments

Thanks to the University of Wyoming for its open-source radiosonde soundings data.

Conflicts of Interest

The authors declare no conflict of interest.

References

  1. Seneviratne, S.I.; Corti, T.; Davin, E.L.; Hirschi, M.; Jaeger, E.B.; Lehner, I.; Orlowsky, B.; Teuling, A.J. Invetigating soil moisture climate interactions in a changing climate: A review. Earth-Sci. Rev. 2010, 99, 125–161. [Google Scholar] [CrossRef]
  2. Santanello, J.A.; Dirmeyer, P.A.; Ferguson, C.R.; Findell, K.L.; Tawfik, A.B.; Berg, A.; Ek, M.; Gentine, P.; Guillod, B.P.; van Heerwaarden, C.; et al. Land—Atmosphere interactions in the LoCo perspective. Bull. Am. Meteorol. Soc. 2018, 99, 1253–1272. [Google Scholar] [CrossRef]
  3. Shuttleworth, W. The Modellion concept. Rev. Geophy. 1991, 29, 585–606. [Google Scholar] [CrossRef]
  4. Brubaker, K.L.; Entekhabi, D. Analysis of feedback mechanisms in land-atmosphere Interaction. Water Resour. Res. 1996, 32, 1343–1357. [Google Scholar] [CrossRef]
  5. Findell, K.L.; Eltahir EA, B. An analysis of the soil moisture–rainfall feedback, based on direct observations from Illinois. Water Resour. Res. 1997, 33, 725–735. [Google Scholar] [CrossRef]
  6. Nicholson, S.E. Land surface processes and Sahel climate. Rev. Geophy. 2000, 38, 117–139. [Google Scholar] [CrossRef]
  7. Vereecken, H.; Huisman, J.A.; Bogena, H.; Vanderborght, J.; Vrugt, J.A.; Hopmans, J.W. On the value of soil moisture measurements in vadose zone hydrology: A review. Water Resour. Res. 2008, 44, W00D06. [Google Scholar] [CrossRef] [Green Version]
  8. Sanchez-Mejia, Z.M.; Papuga, S.A. Observations of a two-layer soil moisture influence on surface energy dynamics and planetary boundary layer characteristics in a semiarid shrubland. Water Resour. Res. 2014, 50, 306–317. [Google Scholar] [CrossRef]
  9. Li, K.; Zhang, J.; Wu, L. Assessment of soil moisture temperature feedbacks with the CCSM-WRF model system over east Asia. J. Geophys. Res.-Atmos. 2018, 123, 6822–6839. [Google Scholar] [CrossRef]
  10. Yuan, G.; Zhang, L.; Liang, J.; Cao, X.; Guo, Q.; Yang, Z. Impacts of initial soil moisture and vegetation on the diurnal temperature range in arid and semiarid regions in China. J. Geophys. Res.-Atmos. 2017, 122, 11568–11583. [Google Scholar] [CrossRef]
  11. Huang, J.; van den Dool, H.M.; Georgakakos, K.P. Analysis of model-calculated soil moisture over the United States (1931–1993) and applications to long-range temperature forecasts. J. Clim. 1996, 9, 1350–1362. [Google Scholar] [CrossRef] [Green Version]
  12. Bosilovich, M.G.; Chern, J. Simulation of water sources and precipitation recycling for the MacKenzie, Mississippi, and Amazon River basins. J. Hydrometeorol. 2006, 7, 312–329. [Google Scholar] [CrossRef] [Green Version]
  13. Clark, R.T.; Brown, S.J.; Murphy, J.M. Modeling northern hemisphere summer heat extreme changes and their uncertainties using a physics ensemble of climate sensitivity experiments. J. Clim. 2006, 19, 4418–4435. [Google Scholar] [CrossRef]
  14. Namias, J. The annual course of month-to-month persistence in climatic anomalies. Bull. Am. Meteorol. Soc. 1952, 33, 279–285. [Google Scholar] [CrossRef]
  15. Zaitchik, B.F.; Macalady, A.K.; Bonneau, L.R.; Smith, R.B. Europe’s 2003 heat wave: A satellite view of impacts and land-atmosphere feedbacks. Int. J. Climatol. 2006, 26, 743–769. [Google Scholar] [CrossRef]
  16. Welty, J.; Zeng, X. Does soil moisture affect warm season precipitation over the southern Great Plains? Geophys. Res. Lett. 2018, 45, 7866–7873. [Google Scholar] [CrossRef] [Green Version]
  17. Moon, H.; Guillod, B.P.; Gudmundsson, L.; Seneviratne, S.I. Soil moisture effects on afternoon precipitation occurrence in current climate models. Geophys. Res. Lett. 2019, 46, 1861–1869. [Google Scholar] [CrossRef] [Green Version]
  18. Dirmeyer, P.A. The hydrologic feedback pathway for land–climate coupling. J. Hydrometeorol. 2006, 7, 857–867. [Google Scholar] [CrossRef]
  19. Van der Ent, R.J.; Savenije, H.H.G.; Schaefli, B.; Steele-Dunne, S.C. Origin and fate of atmospheric moisture over continents: Origin and fate of atmospheric moisture. Water Resour. Res. 2010, 46, W09525. [Google Scholar] [CrossRef] [Green Version]
  20. Eltahir, A.B.; Bras, R.L. Precipitation recycling. Rev. Geophy. 1996, 34, 367–378. [Google Scholar] [CrossRef]
  21. Chen, L.; Dirmeyer, P.A. Impacts of land-use/land-cover change on afternoon precipitation over North America. J. Clim. 2017, 30, 2121–2140. [Google Scholar] [CrossRef]
  22. Tuinenburg, O.A.; Hutjes, R.W.A.; Jacobs, C.M.J.; Kabat, P. Diagnosis of local land–atmosphere feedbacks in India. J. Clim. 2011, 24, 251–266. [Google Scholar] [CrossRef] [Green Version]
  23. Charney, J.G. Dynamics of deserts and drought in the Sahel. Q. J. R. Meteorol. Soc. 1975, 101, 193–202. [Google Scholar] [CrossRef]
  24. Dirmeyer, P.A. Using a global soil wetness dataset to improve seasonal climate simulation. J. Clim. 2000, 13, 2900–2922. [Google Scholar] [CrossRef]
  25. Koster, R.D.; Sud, Y.C.; Guo, Z.; Dirmeyer, P.A.; Bonan, G.; Oleson, K.W.; Chan, E.; Verseghy, D.; Cox, P.; Davies, H.; et al. GLACE: The Global Land–Atmosphere Coupling Experiment. Part I: Overview. J. Hydrometeorol. 2006, 7, 590–610. [Google Scholar] [CrossRef]
  26. Guo, Z.; Dirmeyer, P.A.; Koster, R.D.; Sud, Y.C.; Bonan, G.; Oleson, K.W.; Chan, E.; Verseghy, D.; Cox, P.; Gordon, C.T.; et al. GLACE: The global land–atmosphere coupling experiment. Part II: Analysis. J. Hydrometeorol. 2006, 7, 611–625. [Google Scholar] [CrossRef]
  27. Chen, Y.; Wang, K.; Lin, Y.; Shi, W.; Song, Y.; He, X. Balancing green and grain trade. Nat. Geosci. 2015, 8, 739–741. [Google Scholar] [CrossRef]
  28. Findell, K.L. Atmospheric Controls on Soil Moisture Boundary Layer Interactions. Ph.D. Thesis, Massachusetts Institute of Technology, Cambridge, MA, USA, 2001; p. 172. [Google Scholar]
  29. Ferguson, C.R.; Wood, E.F. Observed land–atmosphere coupling from satellite remote sensing and reanalysis. J. Hydrometeorol. 2011, 12, 1221–1254. [Google Scholar] [CrossRef]
  30. Kim, C.P.; Entekhabi, D. Feedbacks in the land-surface and mixed-layer energy budgets. Bound. -Layer Meteorol. 1998, 88, 1–21. [Google Scholar] [CrossRef]
  31. Kim, C.P.; Entekhabi, D. Impact of soil heterogeneity in a mixed layer model of the planetary boundary layer. Hydrolog. Sci. J. 1998, 43, 633–658. [Google Scholar] [CrossRef] [Green Version]
  32. Findell, K.L.; Eltahir, E.A.B. Atmospheric controls on soil moisture–boundary layer interactions. Part I: Framework development. J. Hydrometeorol. 2003, 4, 552–569. [Google Scholar] [CrossRef]
  33. Battan, L.J. Radar Observations of the Atmosphere; University of Chicago Press: Chicago, IL, USA, 1973; p. 324. [Google Scholar]
  34. Showalter, A.K. A stability index for thunderstorm forcasting. Bull. Am. Meteorol. Soc. 1953, 34, 250–252. [Google Scholar] [CrossRef] [Green Version]
  35. Clapp, R.B.; Hornberger, G.M. Empirical equations for some soil hydraulic properties. Water Resour. Res. 1978, 14, 601–604. [Google Scholar] [CrossRef] [Green Version]
  36. Chen, X.; Yu, Y.; Chen, J.B.; Zhang, T.T.; Li, Z.C. Study of Estimation of Soil Heat Flux at a Wheat Field in Semi-Arid Area of Loess Plateau. Plateau Meteor. 2014, 33, 1514–1525. [Google Scholar]
  37. Wakefield, R.A.; Basara, J.B.; Furtado, J.C.; Illston, B.G.; Ferguson, C.R.; Klein, P.M. A Modified Framework for Quantifying Land-Atmosphere Covariability during Hydrometeorological and Soil Wetness Extremes in Oklahoma. J. Appl. Meteorol. Climatol. 2019, 58, 1465–1483. [Google Scholar] [CrossRef]
  38. Bhowmick, M. Impact of Soil Moisture Variability on Convective Rainfall Activity over the Indian Sub-Continent. Ph.D. Thesis, The University of Leeds, Leeds, UK, 2016; p. 135. [Google Scholar]
Figure 1. Value distribution of daily soil saturation in two summers (i.e., 184 days) of 2016–2017 at Pingliang station.
Atmosphere 12 01619 g001
Figure 2. Locations of the six stations. Five cross markers indicate stations with only initial sounding data (at 08:00 LT). The star marker indicates Pingliang station with soil moisture, fluxes and radiosonde observations.
Atmosphere 12 01619 g002
Figure 3. Locations of the eight stations with long time scales (1974–2019) sounding data. Blue boxes indicate the majority area of positive feedbacks, and orange boxes indicate the majority area of negative feedbacks.
Atmosphere 12 01619 g003
Figure 4. Verifications of simulated PBL height, potential temperature, specific humidity of mixed layer, net longwave radiation, net shortwave radiation, net radiation, sensible heat flux, latent heat flux, Bowen ratio, and surface temperature against observations using data from 28 June 2016, with soil saturation 0.33. (a): planetary boundary layer height (b): planetary boundary layer potential temperature (c): planetary boundary layer specific humidity (d): net longwave radiation (e): net shortwave radiation (f): net radiation (g): sensible heat flux (h): latent heat flux (i): Bowen ratio (j): surface temperature.
Atmosphere 12 01619 g004
Figure 5. As in Figure 4, but for 9 July 2017, with soil saturation 0.19. (a): planetary boundary layer height (b): planetary boundary layer potential temperature (c): planetary boundary layer specific humidity (d): net longwave radiation (e): net shortwave radiation (f): net radiation (g): sensible heat flux (h): latent heat flux (i): Bowen ratio (j): surface temperature.
Atmosphere 12 01619 g005
Figure 6. The CTP—HIlow distributions of five stations’ model outcomes in the Loess Plateau. Total cases: (a) atmosphere—controlled cases, (b) and soil moisture-controlled cases, (c) SC indicates shallow convection. Black boxes encircle wet soil advantage area and dry soil advantage area.
Atmosphere 12 01619 g006
Figure 7. The probability distributions of atmosphere-controlled cases (a) and soil moisture-controlled cases (b).
Atmosphere 12 01619 g007
Figure 8. Distributions of maximal boundary layer height in wet soil advantage cases and dry soil advantage cases. The upper and lower of the box show upper quartile and lower quartile, and the line inside represents the median. The upper whisker and lower whisker indicate the maximum and the minimum values in the non-abnormal range, respectively. The blue spot is the average.
Atmosphere 12 01619 g008
Figure 9. The distributions of near—surface specific humidity and wind speed at initial sounding times based on different model outcomes. The upper and lower of the box show upper quartile and lower quartile, and the line inside represents the median. The upper whisker and lower whisker indicate the maximum and the minimum values in the non-abnormal range, respectively. (a): near—surface specific humidity (b): near—surface wind speed.
Atmosphere 12 01619 g009
Figure 10. The probability distributions of wet soil advantage cases and dry soil advantage cases of model outcomes (a) and CTP-HIlow diagnostic results (b).
Atmosphere 12 01619 g010
Publisher’s Note: MDPI stays neutral with regard to jurisdictional claims in published maps and institutional affiliations.

