Article

Undiluted Measurement of the Particle Size Distribution of Different Oxygenated Biofuels in a Gasoline-Optimised DISI Engine

by
Tara Larsson
1,*,
Ulf Olofsson
1 and
Anders Christiansen Erlandsson
1,2
1
Department of Machinedesign, KTH, Royal Institute of Technlogy, 11428 Stockholm, Sweden
2
Department of Mechanical Engineering, DTU, Technical University of Denmark, 2800 Copenhagen, Denmark
*
Author to whom correspondence should be addressed.
Atmosphere 2021, 12(11), 1493; https://doi.org/10.3390/atmos12111493
Submission received: 25 September 2021 / Revised: 5 November 2021 / Accepted: 9 November 2021 / Published: 11 November 2021
(This article belongs to the Special Issue Air Quality Impacts of Vehicle Emissions)

Abstract

:
The utilisation of internal combustion engines is one of the main causes of particle emissions in urban areas. As the interest for the utilisation of biofuels increases, it is important to understand their effect on particle number emissions. In this paper, the particle size distribution and the particle number emissions from a gasoline-optimised direct-injected spark-ignited (DISI) engine are investigated. The effects of five different biofuel alternatives on these emissions were evaluated and compared to gasoline. The utilisation of the high-resolution, high-temperature ELPI+ enabled undiluted measurements of the particle size distribution down to 6 nm, without extensive cooling of the engine exhaust. Contrary to other studies, the results show that the particle number emissions for the three measured cut-off sizes (23, 10 and 7 nm) increased with the utilisation of oxygenated biofuels. The results indicate that the decreased volatility and energy density of the alcohols has a more significant impact on the particle formation in a DISI engine than the increased oxygen content of these fuels.

Graphical Abstract

1. Introduction

In urban areas, vehicle traffic can be a major source of aerosol particles, where particles with particle sizes down to 1.3 nm have been detected [1]. Moreover, with the introduction of direct-injected spark-ignited (DISI) engines, the particle emissions from spark-ignited (SI) engines have increased [2]. Since particles may have a severe impact on human respiratory health [3], the European legislation tries to enforce the reduction in particles and other harmful emissions from internal combustion engines (ICEs). For future legislation (Euro 7), guidelines have been presented with suggestions of stricter limits on the current regulated species (both for laboratory and real-driving emissions) and limits on previously unregulated pollutants, including sub-23 nm particles [4,5].
Particle emissions originate both from the pyrolysis of the fuel in fuel-rich areas and lubrication oil [6]. The particles formed from oil contain ash particles which could have a negative effect on after-treatment systems [7]. Researchers have shown that some of the emitted nucleation mode particles from ICEs originate from the lubricating oil [8]. These particles form larger particles together with the soot formed from fuel pyrolysis but still contain metals and other additives found in the oil itself [9].
To reduce the impact of current transport on the climate, increasing the utilisation of biofuels is being promoted. However, it has been shown that biofuels, such as alcohols and ethers, may impact both the particle emissions derived from fuel [6] and cause oil dilution, affecting the oil-derived particles [10].
The research on DISI engines shows that increasing the concentration of oxygenated fuels in the fuel blend increases the number of smaller particles, with particle diameters of around 10 nm. Increased levels of smaller particles have been reported for ethanol blends [11,12,13,14], pure ethanol [15,16], methanol blends [17,18], and butanol blends [19,20].
Anselmi et al. [14] reported decreasing particle number (PN) emissions with increasing levels of ethanol in fuel, but the same trend was not exhibited with increasing levels of butanol. These results are supported by Karavalakis et al. [13], who observed decreased levels of PN emissions with higher concentrations of ethanol, but no clear trend as the iso-butanol concentration was increased. Price et al. [12] reported decreased PN emissions for high-level ethanol blends (E85) but not for high-level methanol blends (M85). In a previous article published by the authors, the level of both particle mass (PM) and PN emissions increased when using pure ethanol as a fuel in a gasoline-optimised DISI engine [21]. The increase in PN was more pronounced at higher loads and lower engine speeds and varied depending on the end of injection (EOI). Therefore, it was concluded that the reduction potential of oxygenated fuels with regard to particle emissions is not straightforward but depends on the fuel injection strategy and combustion conditions, which is supported by Salamanca et al. [22].
In a review conducted by Raza et al. [6], it was stated that injection strategies that promote lower levels of PN emissions at early start of injection (SOI) and increased fuel pressures. An early injection increases the time available for fuel evaporation and mixture preparation, and increased injection pressures increase fuel atomisation, promoting the homogeneity of the fuel/air mixture. However, Lee et al. [23], who investigated a blend of 50% (by volume) ethanol and gasoline in a DISI engine, saw an increased level of impingement at early injection (330° crank angle (CA) before top dead center (bTDC)). The PN emissions decreased as the injection timing was retarded [23]. Furthermore, Bonatesta et al. [24] discussed that very early fuel injection can lead to increased fuel impingement, causing increased rates of particle formation. Moreover, Bonatesta et al. [24] reported that in DISI engines, increased levels of wall and liner impingement were seen at higher loads, increasing particle formation, whereas increasing the engine speeds decreases particle emissions as it increases the evaporation and in-cylinder turbulence, allowing for a better mixture preparation.
This experimental study aims to evaluate the particle emissions of multiple pure biofuel alternatives, and to investigate the effect of fuel properties under different operating conditions. Moreover, since previous studies have reported on the impact of dilution on particle measurements [25,26,27,28], this paper includes a comparison between the undiluted and diluted measurements for all tested fuels. The experiments were conducted on a gasoline-optimised DISI engine. The measurement of particle size distribution was performed using an undiluted measurement setup without the need of extensive cooling of the exhaust to minimise the losses associated with dilution and cooling. The particle number emissions and the particle size distribution for gasoline were compared to five pure biofuel alternatives: methanol, ethanol, n-butanol, iso-butanol and methyl tert-butyl ether (MTBE). Furthermore, an elemental analysis of the particle emissions was performed to evaluate the effect of biofuels on the oil-derived particles.

2. Materials and Methods

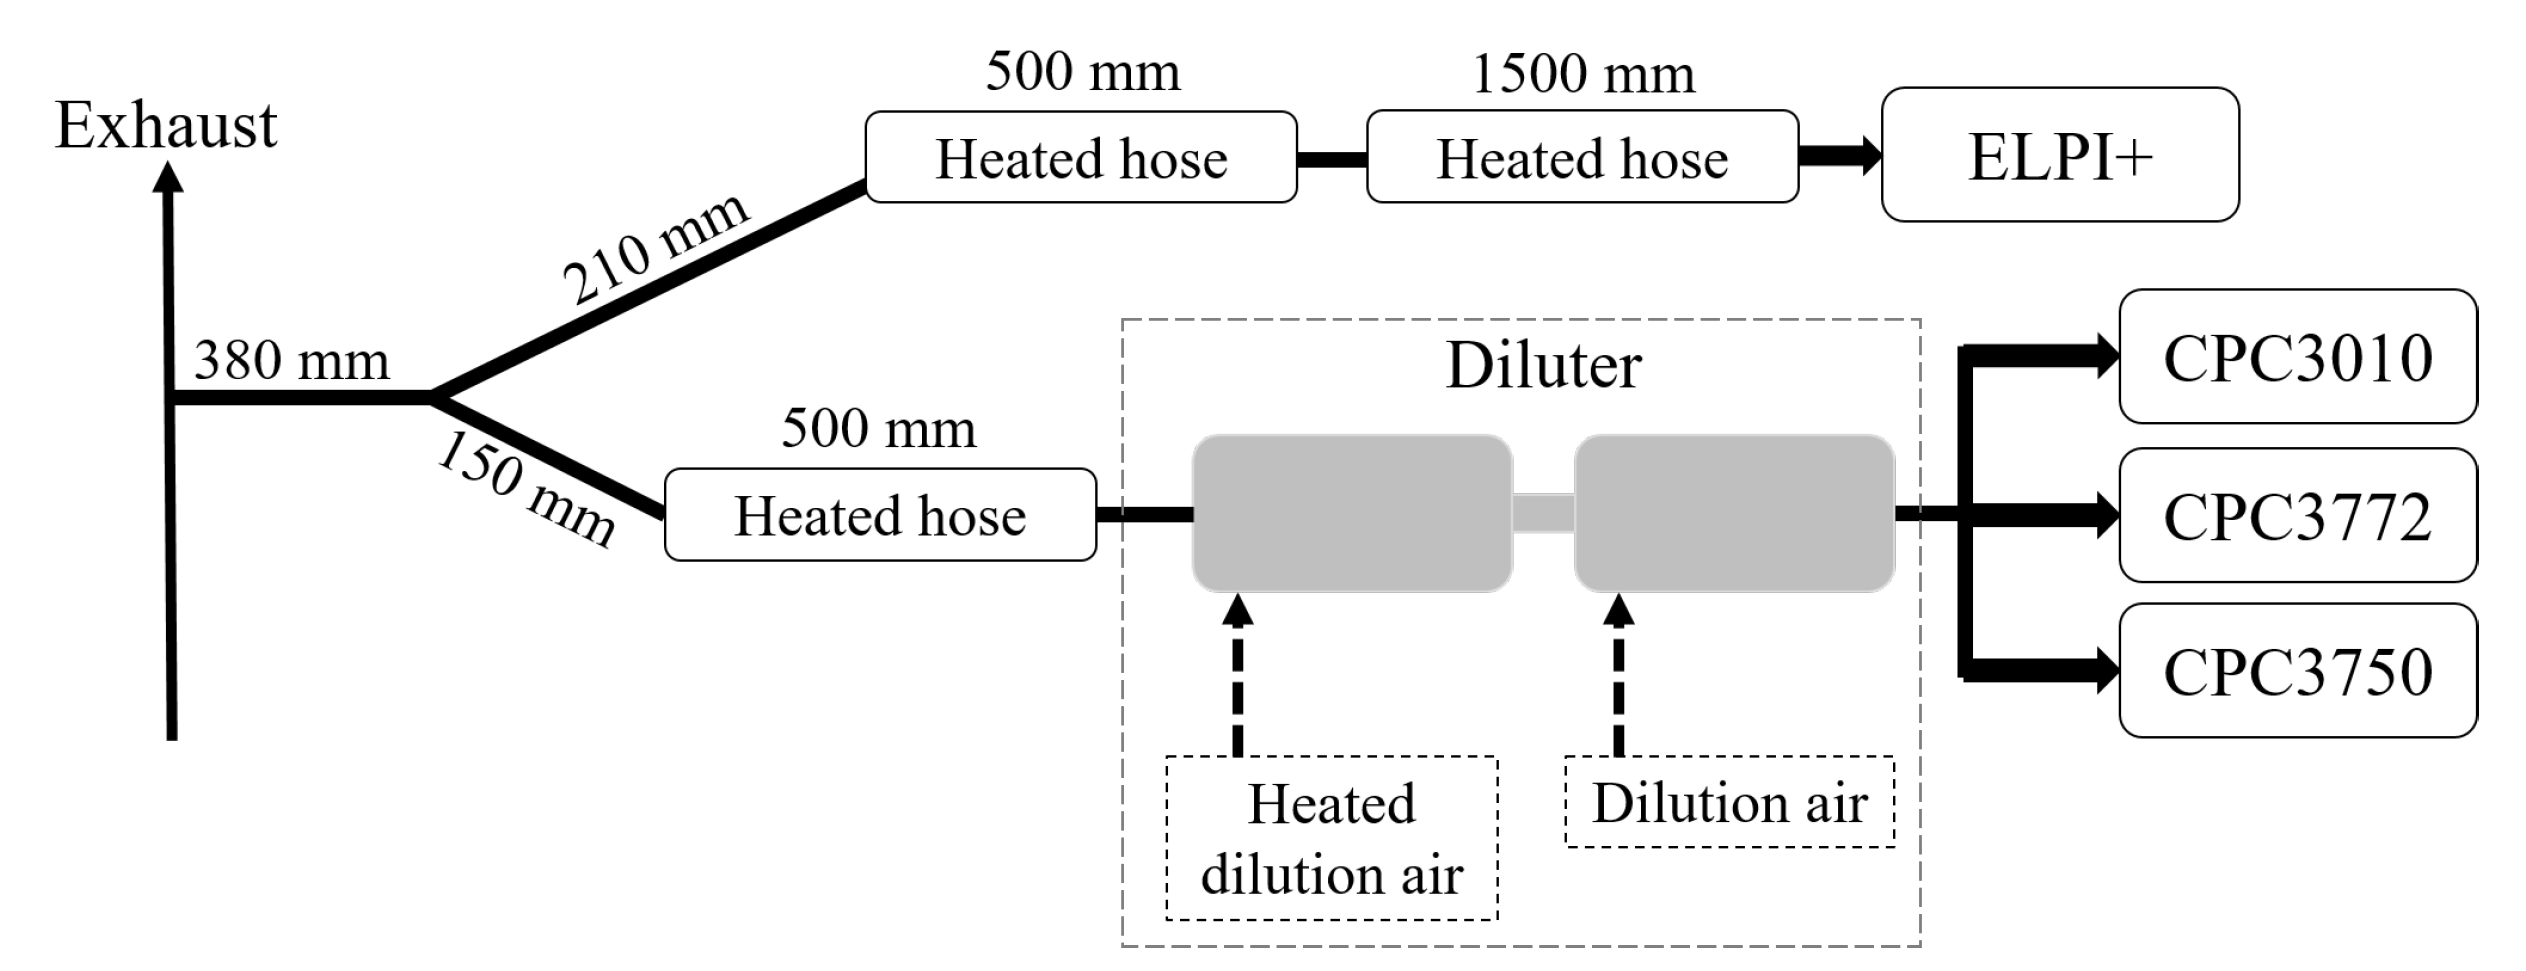
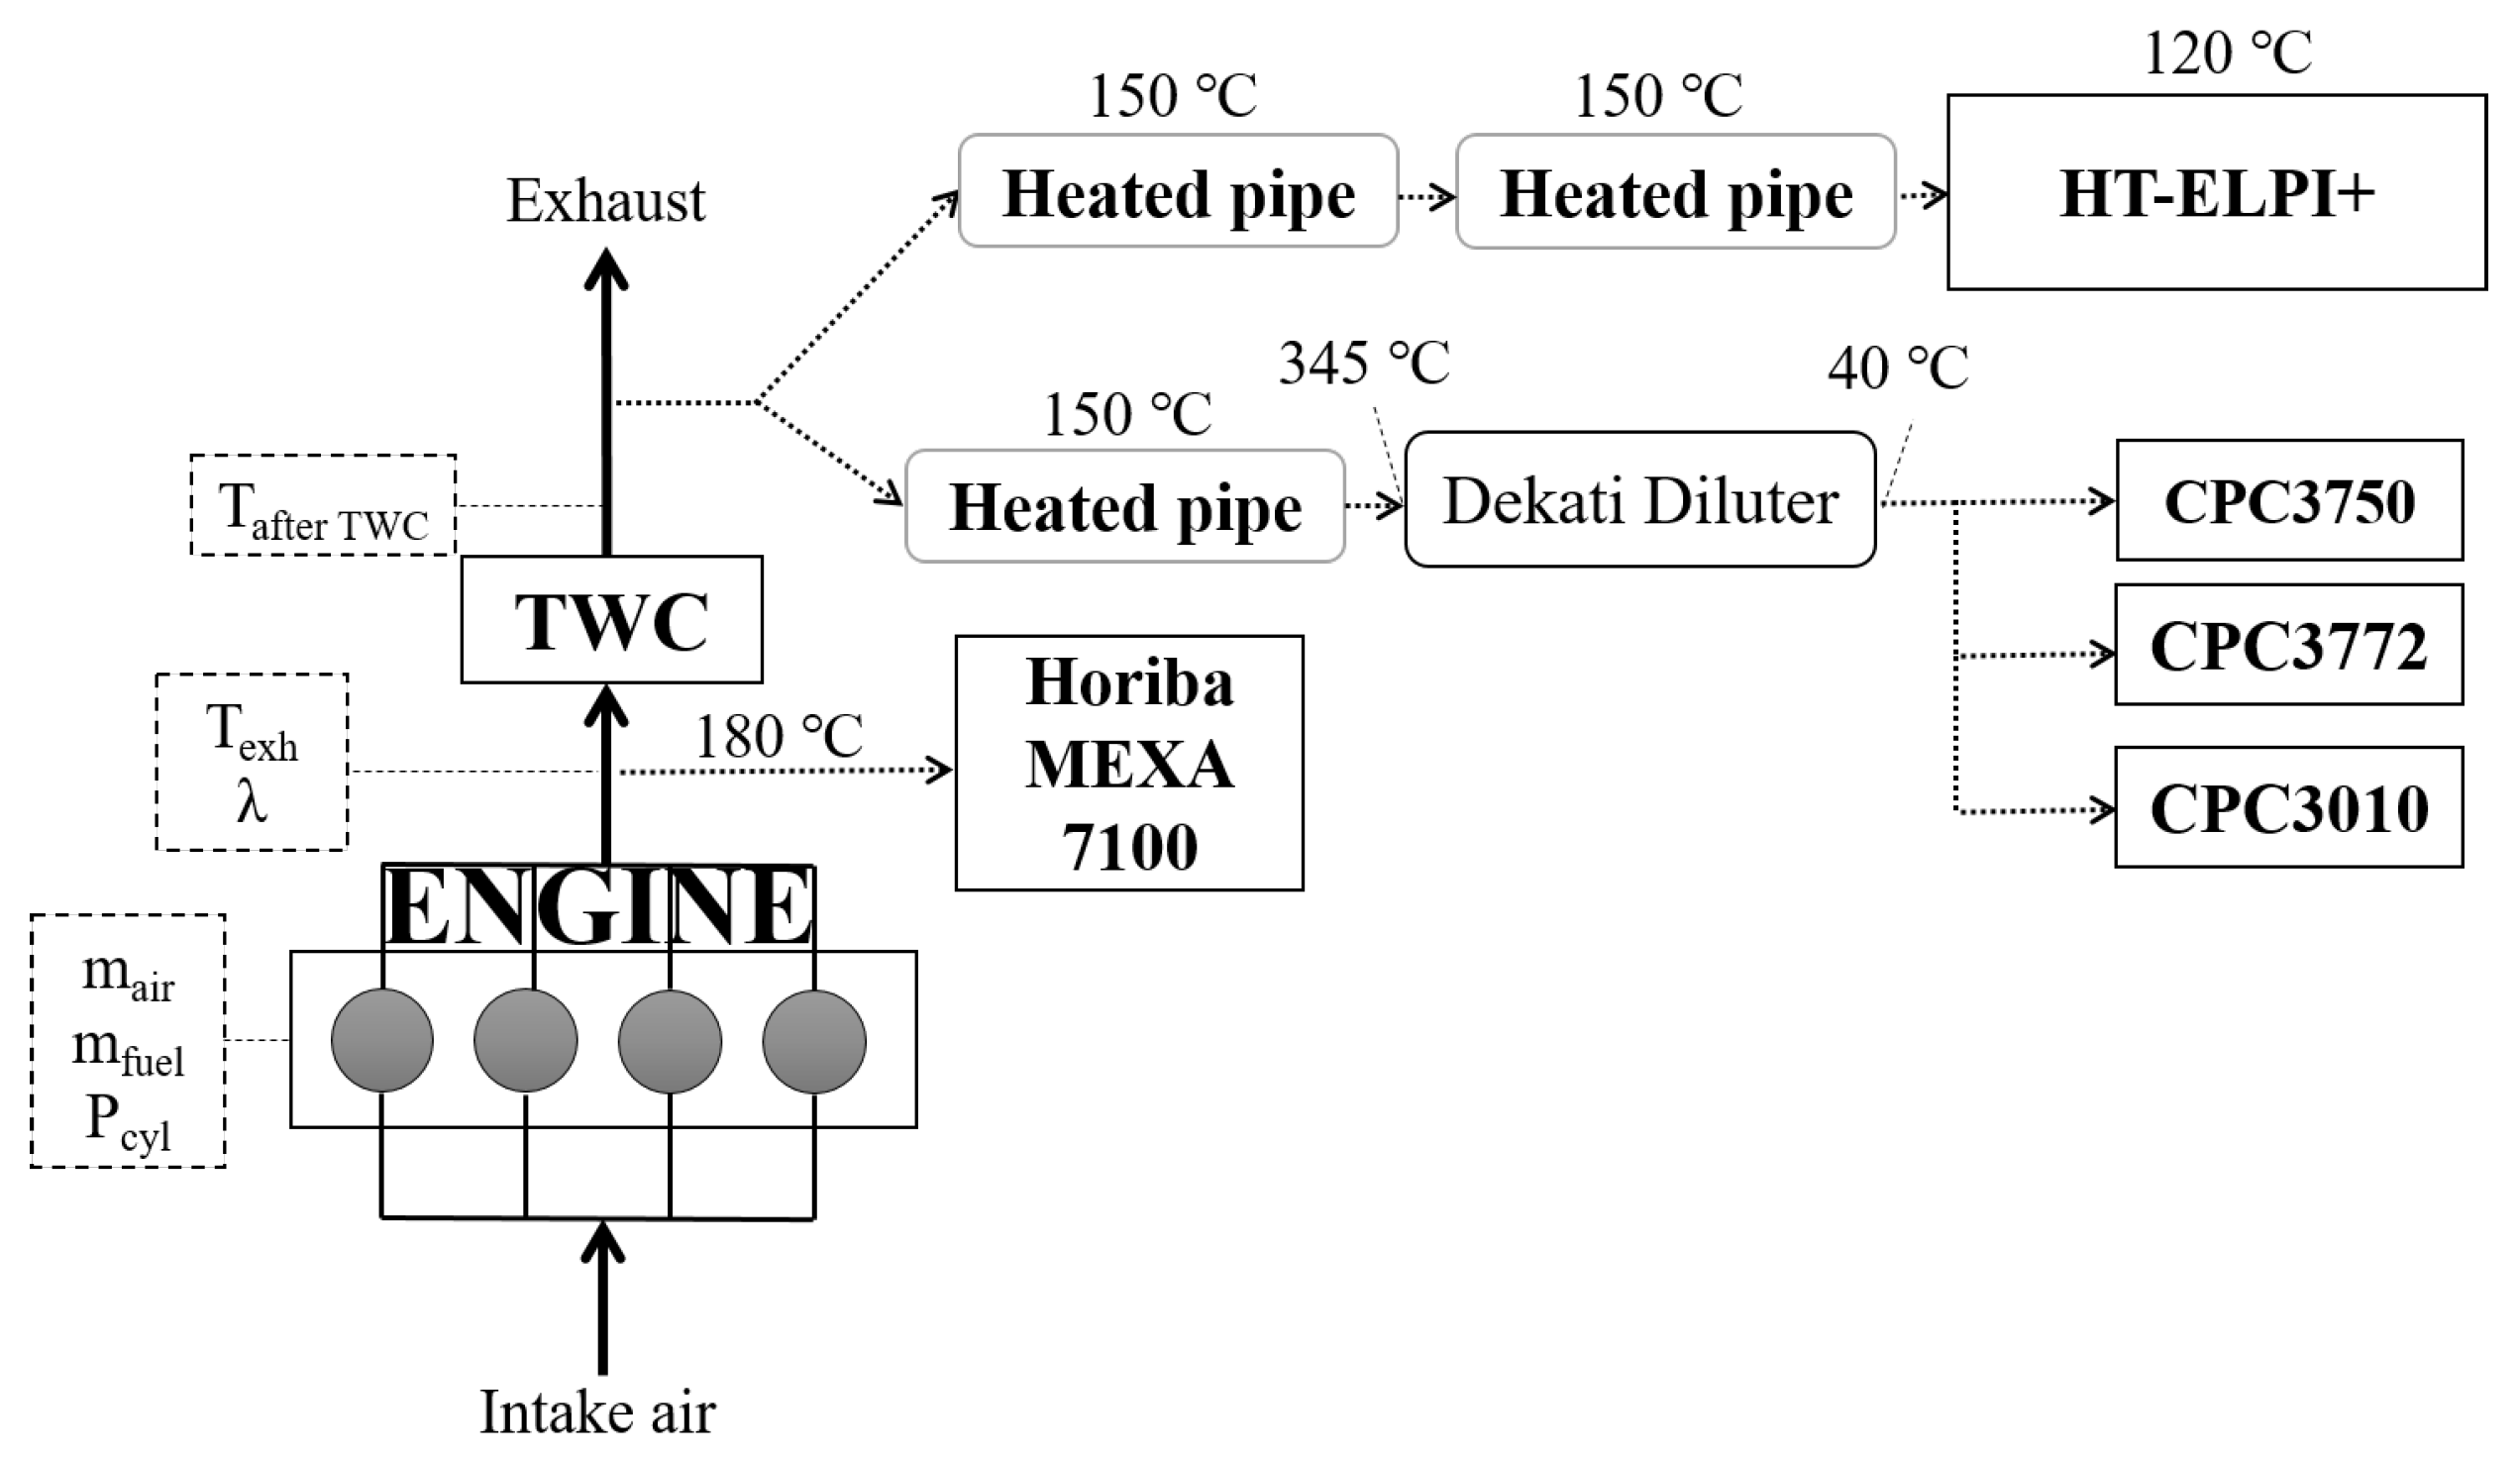
2.1. Experimental Setup

The measurements were performed on a spray-guided Volvo Cars T6 DISI engine. A schematic figure of the engine and the particle measurement setup used can be seen in Figure 1. A more detailed figure of the particle measurement setup can be found in Appendix A. The details of the engine can be seen in Table 1. No modifications to the engine hardware were made. The original catalyst was used during all experiments. The engine was not equipped with a particle filter.
Measurements of exhaust emissions of carbon monoxide (CO), undburned hydrocarbons (HC) and nitrogen oxides (NOx-emissions) were performed upstream of the three-way catalyst (TWC). All particle emissions were measured downstream of the TWC. To evaluate the effect of fuel on different particle sizes, PN was measured using three different condensation particle counters (CPCs) with different cut-off sizes: CPC3010 with a cut-off size of 23 nm, CPC3772 with a cut-off size of 10 nm, and CPC3750 with a cut-off size of 7 nm. The CPCs were connected to the exhaust using a two-stage ejector dilution system from Dekati (DI-1000) [29]. The diluter stages were placed in series. The first diluter stage was heated by the incoming dilution air to maintain an outlet temperature of 345 °C. The high temperature used at the first dilution stage drives the removal of a large fraction of volatiles but this setup does not guarantee that only solid particles are measured [30]. The second diluter stage operated at ambient temperature with a constant outlet temperature of 40 °C, see Figure 1. The dilution ratio for each stage was 1:8.45, resulting in a total dilution ratio of 1:71.4.
The particle size distribution was measured using a Dekati high resolution high-temperature ELPI+ (HT-ELPI+). The HT-ELPI+ allows for real-time measurements of particle emission samples up to 180 °C [31]. The high-resolution HT-ELPI+ measured the particle number distribution from 6 nm to 10 μm and classified it into 100 bins depending on the aerodynamic size of the particles. For these tests, the impactor stages of the HT-ELPI+ was kept at 120 °C. In this work, the particle size distribution is presented for particle sizes from 6 nm to 1000 nm. For this setup, measurements using the HT-ELPI+ could be performed without the need of any dilution of the exhaust (more detail in [21]).
The heated lines are connected to the exhaust via stainless steel pipes with a diameter of 8 mm (see Figure 1). The exact length of the pipes can be found in Appendix A.

2.2. Test Fuels

The fuels evaluated in this study were gasoline (non-commercial blend without oxygenated compounds) and five oxygenated fuels: ethanol, methanol, n-butanol, iso-butanol (i-butanol) and MTBE. The properties for the fuels can be seen in Table 2. The gasoline had an aromatic content of approximately 29% based on volume.
The fuels were analyzed at a commercial laboratory to determine the octane number, lower heating value (LHV) and dry vapour pressure equivalent (DVPE). The research octane number (RON) and motor octane number (MON) values for MTBE were estimated using octane numbers from reference [32] as the measured water content was below 0.03%.

2.3. Methodology

All the fuels were tested at six different engine operating points (see Figure 2). An initial stabilisation period of 45 min was applied every time the engine was restarted and when the fuel had been changed. For each operating point, the engine was stabilised for 15 min. The stabilisation time was used to ensure that the temperature throughout the exhaust would stabilise and that the fuel throughout the system was the desired one, and to burn of any excess particles or hydrocarbons formed due to oil changes. The oil temperature was kept at 90–115 °C and the coolant temperature was kept at 90–100 °C. The excess air ratio ( λ ) was kept at 1 ± 0.1. The data were sampled under steady-state conditions, which were identified as the point when the exhaust gas temperature was steady within a range of ±10 °C and the PN measurements were steady. To ensure the repeatability of the measurements, gasoline and ethanol were run at 1500 revolutions per minute (RPM) and approximately 7.5 bar is the mean effective pressure (IMEP) before, in the middle of and after the conducted experiments, and the arithmetic means of the PN emissions (cut-off 7 nm) were compared (see Appendix B).
An elemental analysis of the heavy elements of the high-temperature electrical low-pressure impactor (HT-ELPI+) filters was performed using energy-dispersive X-ray fluorescence (EDXRF). The analysis was performed using the Bruker M4 Tornado spectrometer equipped with an Rh-source. The power parameters used for all the analyses were a voltage of 50 kV and a current of 200 μA. For each filter, three accumulation points were analyzed together with a blank point (only filter grease). Each measurement point was measured for ≈5 min and three different particle sizes ( D 50 : 54, 150 and 250 nm. The chemical analysis of the filters was performed by Mancini Alessandro at Brembo (Stezzano, Italy).
The injection pressure ( p inj ) and injection duration ( t inj ) were set by the engine control unit (ECU) for each fuel to allow for tests under the same engine load conditions. No manual control of the injection pressure, injection duration, or timing was performed. The start of injection (SOI) varied between 310 and 343 CA bTDC depending on the operating point. SOI was constant between fuels. The combustion phasing varied due to variations in the combustion speed and knock resistance of each fuel. Spark timing was adjusted to reach the maximum brake torque (MBT) or knock limited spark advance (KLSA) for all fuels and operating points.

2.4. Data Acquisition and Analysis

The in-cylinder pressure was measured for 150 engine cycles for each test point using piezoelectric pressure sensors from Kistler. Measurements of temperatures, pressures, excess air ratio ( λ ) and emissions were made at 2 Hz for 5 min. The sensor signals were collected using hardware from National Instruments (NI) and a LabVIEW program developed in-house. The injection pressure, injection duration and injection timing from the ECU were collected for 1 min.
The measurement of exhaust emissions of carbon monoxide (CO), undburned hydrocarbons (HC) and nitrogen oxides (NOx-emissions) were performed using a Horiba MEXA-7100 DEGR emission cabinet. λ was measured before the TWC using a Bosch wideband oxygen sensor (LSU 4.9). All particle measurements were collected at 1 Hz for 5 min.
The sensors used and their uncertainty can be seen in Table 3. All results are presented as mean values. For the engine parameters, the error bars represent the standard deviation ( ± σ ). For the particle number and particle size distribution, the error bars represent the normalised random error for a confidence interval of 95% (see Equation (1)).
ϵ = C · σ n
where ϵ is the normalized random error, C is a constant for the confidence level (1.96), σ is the calculated standard deviation and n is the total number of samples (300 samples).
The particle losses were calculated in regard to thermophoretic losses, sedimentation losses and diffusive losses according to the method applied in [33,34]. The loss over the diluter was assumed to be 5%, according to previous results by Vanhanen et al. [35]. The sums of the losses are 26.3% ± 3.2 % for the HT-ELPI+ measurements and 29.1% ± 1.7% for the CPCs. A detailed description of particle loss calculation can be seen in Appendix A. The residence time for the particles in the system is 2.1 s for the CPCs and 0.8 s for HT-ELPI+. The residence time is thus lower for both the measurement setups than the recommended residence time of 3 s [36].

3. Results

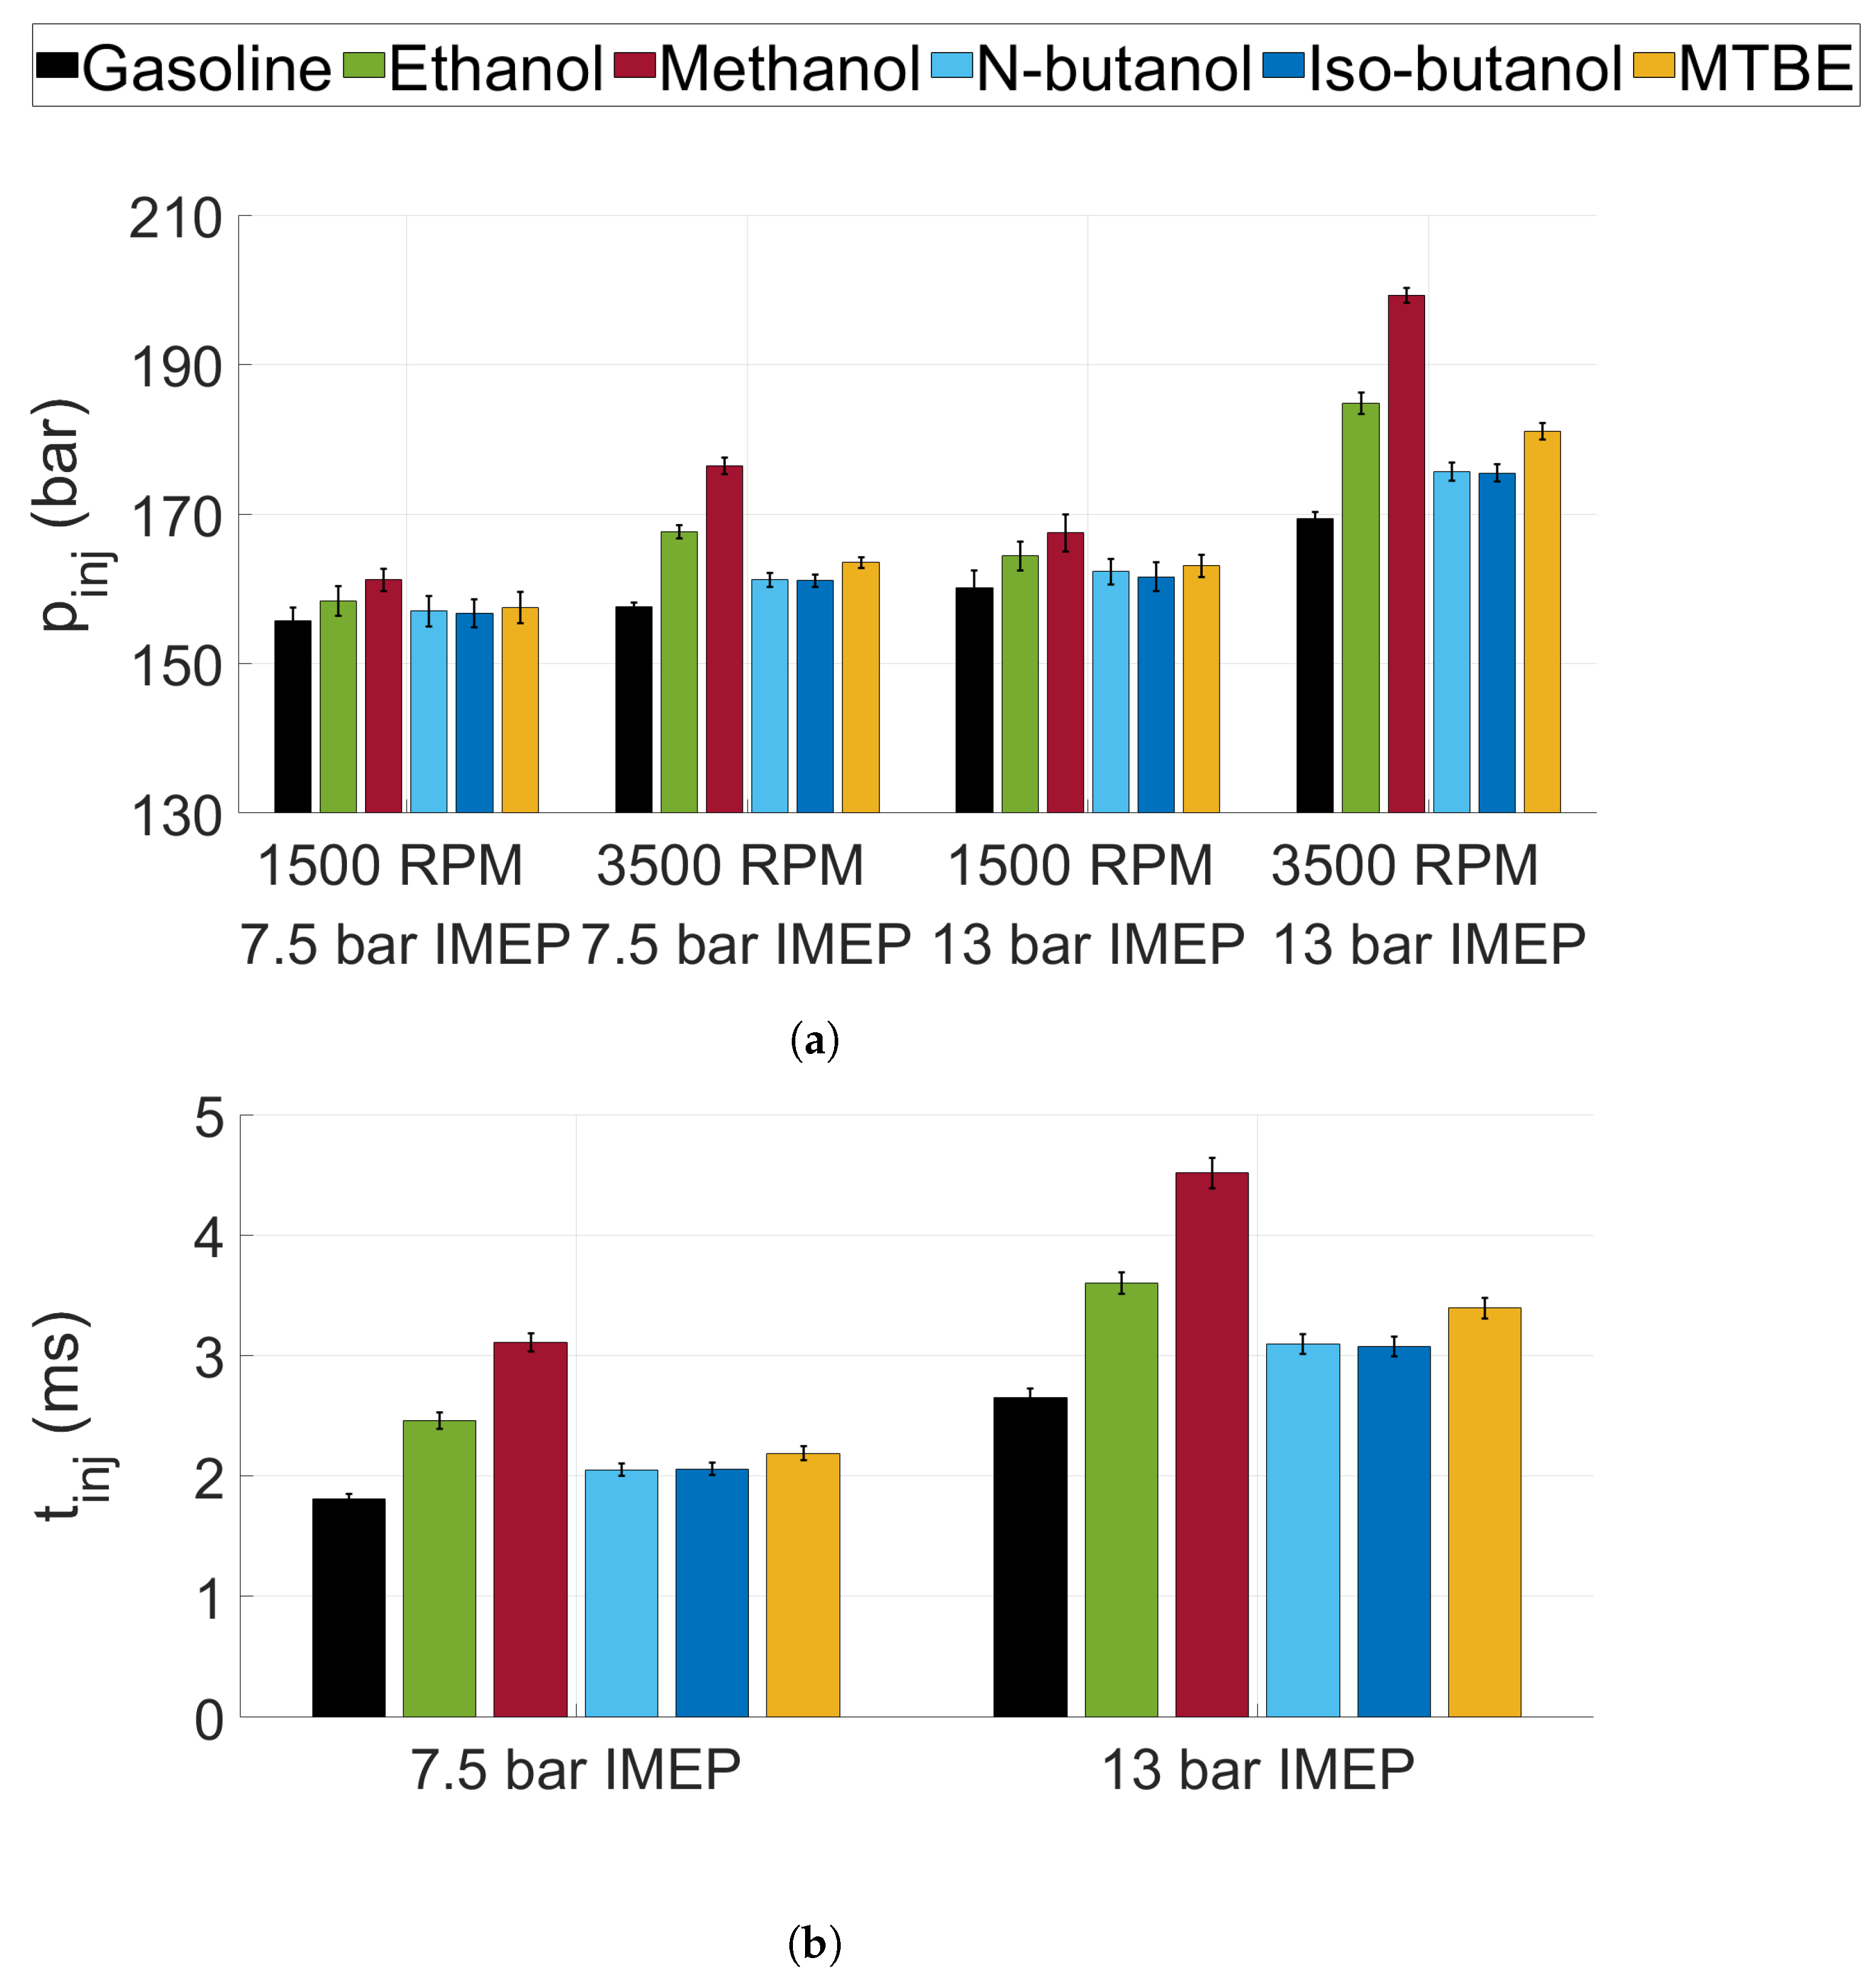
3.1. Injection Pressure and Duration

To achieve the same load points for all fuels, the injection pressure and injection duration were varied. The SOI was kept constant between fuels (310–343 CA bTDC depending on load point). The injection pressures and injection timings during the performed tests can be seen in Figure 3a,b. Injection timing did not change with engine speed. Methanol is the fuel with the highest injection pressure and the longest injection duration. This is consistent as methanol exhibits the lowest air-fuel ratio and energy density of the tested fuels. MTBE used a slightly higher injection pressure than n-butanol and iso-butanol, since MTBE was run at marginally higher load.
The increased injection pressure of methanol compared to the other fuels can affect the spray atomisation, allowing for better mixture preparation compared to the other fuels [6]. However, the longer injection duration can lead to the opposite effect as it puts EOI closer to the spark timing. Delaying the EOI leads to less time available for evaporation and mixture preparation. This could lead to a lower homogeneity of the fuel and air in-cylinder mixture and thus increased PN emissions [6].

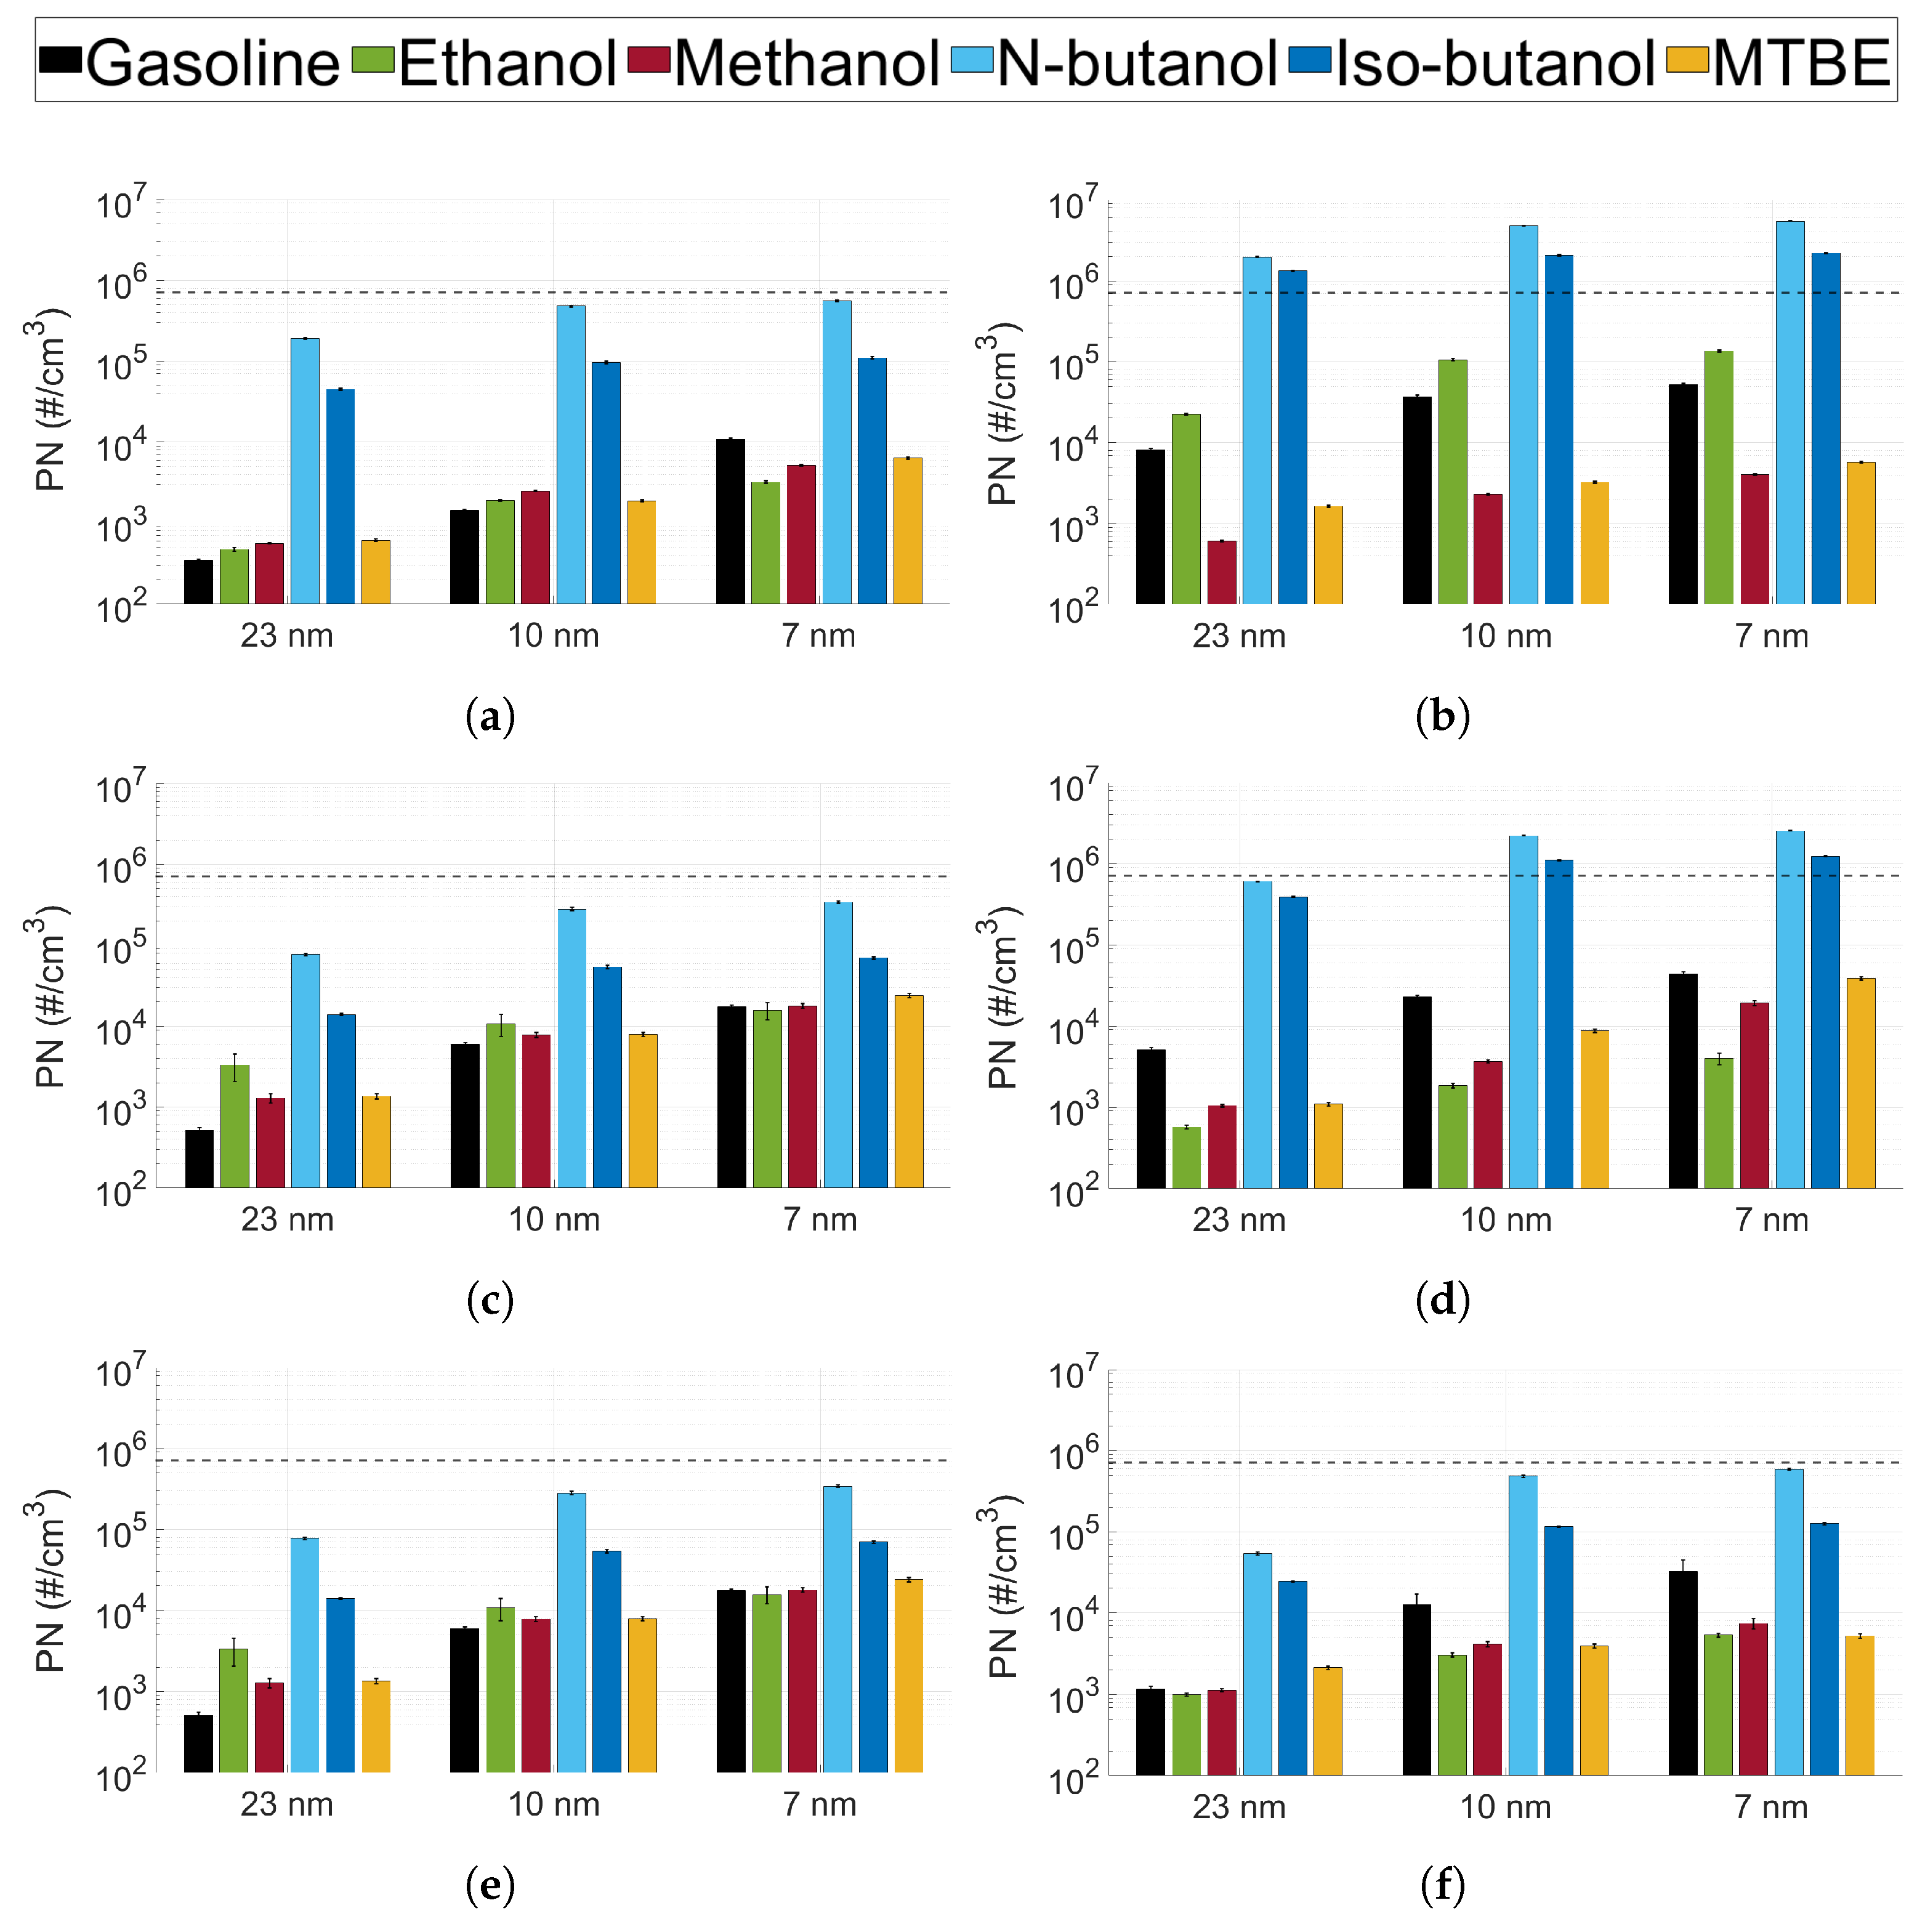
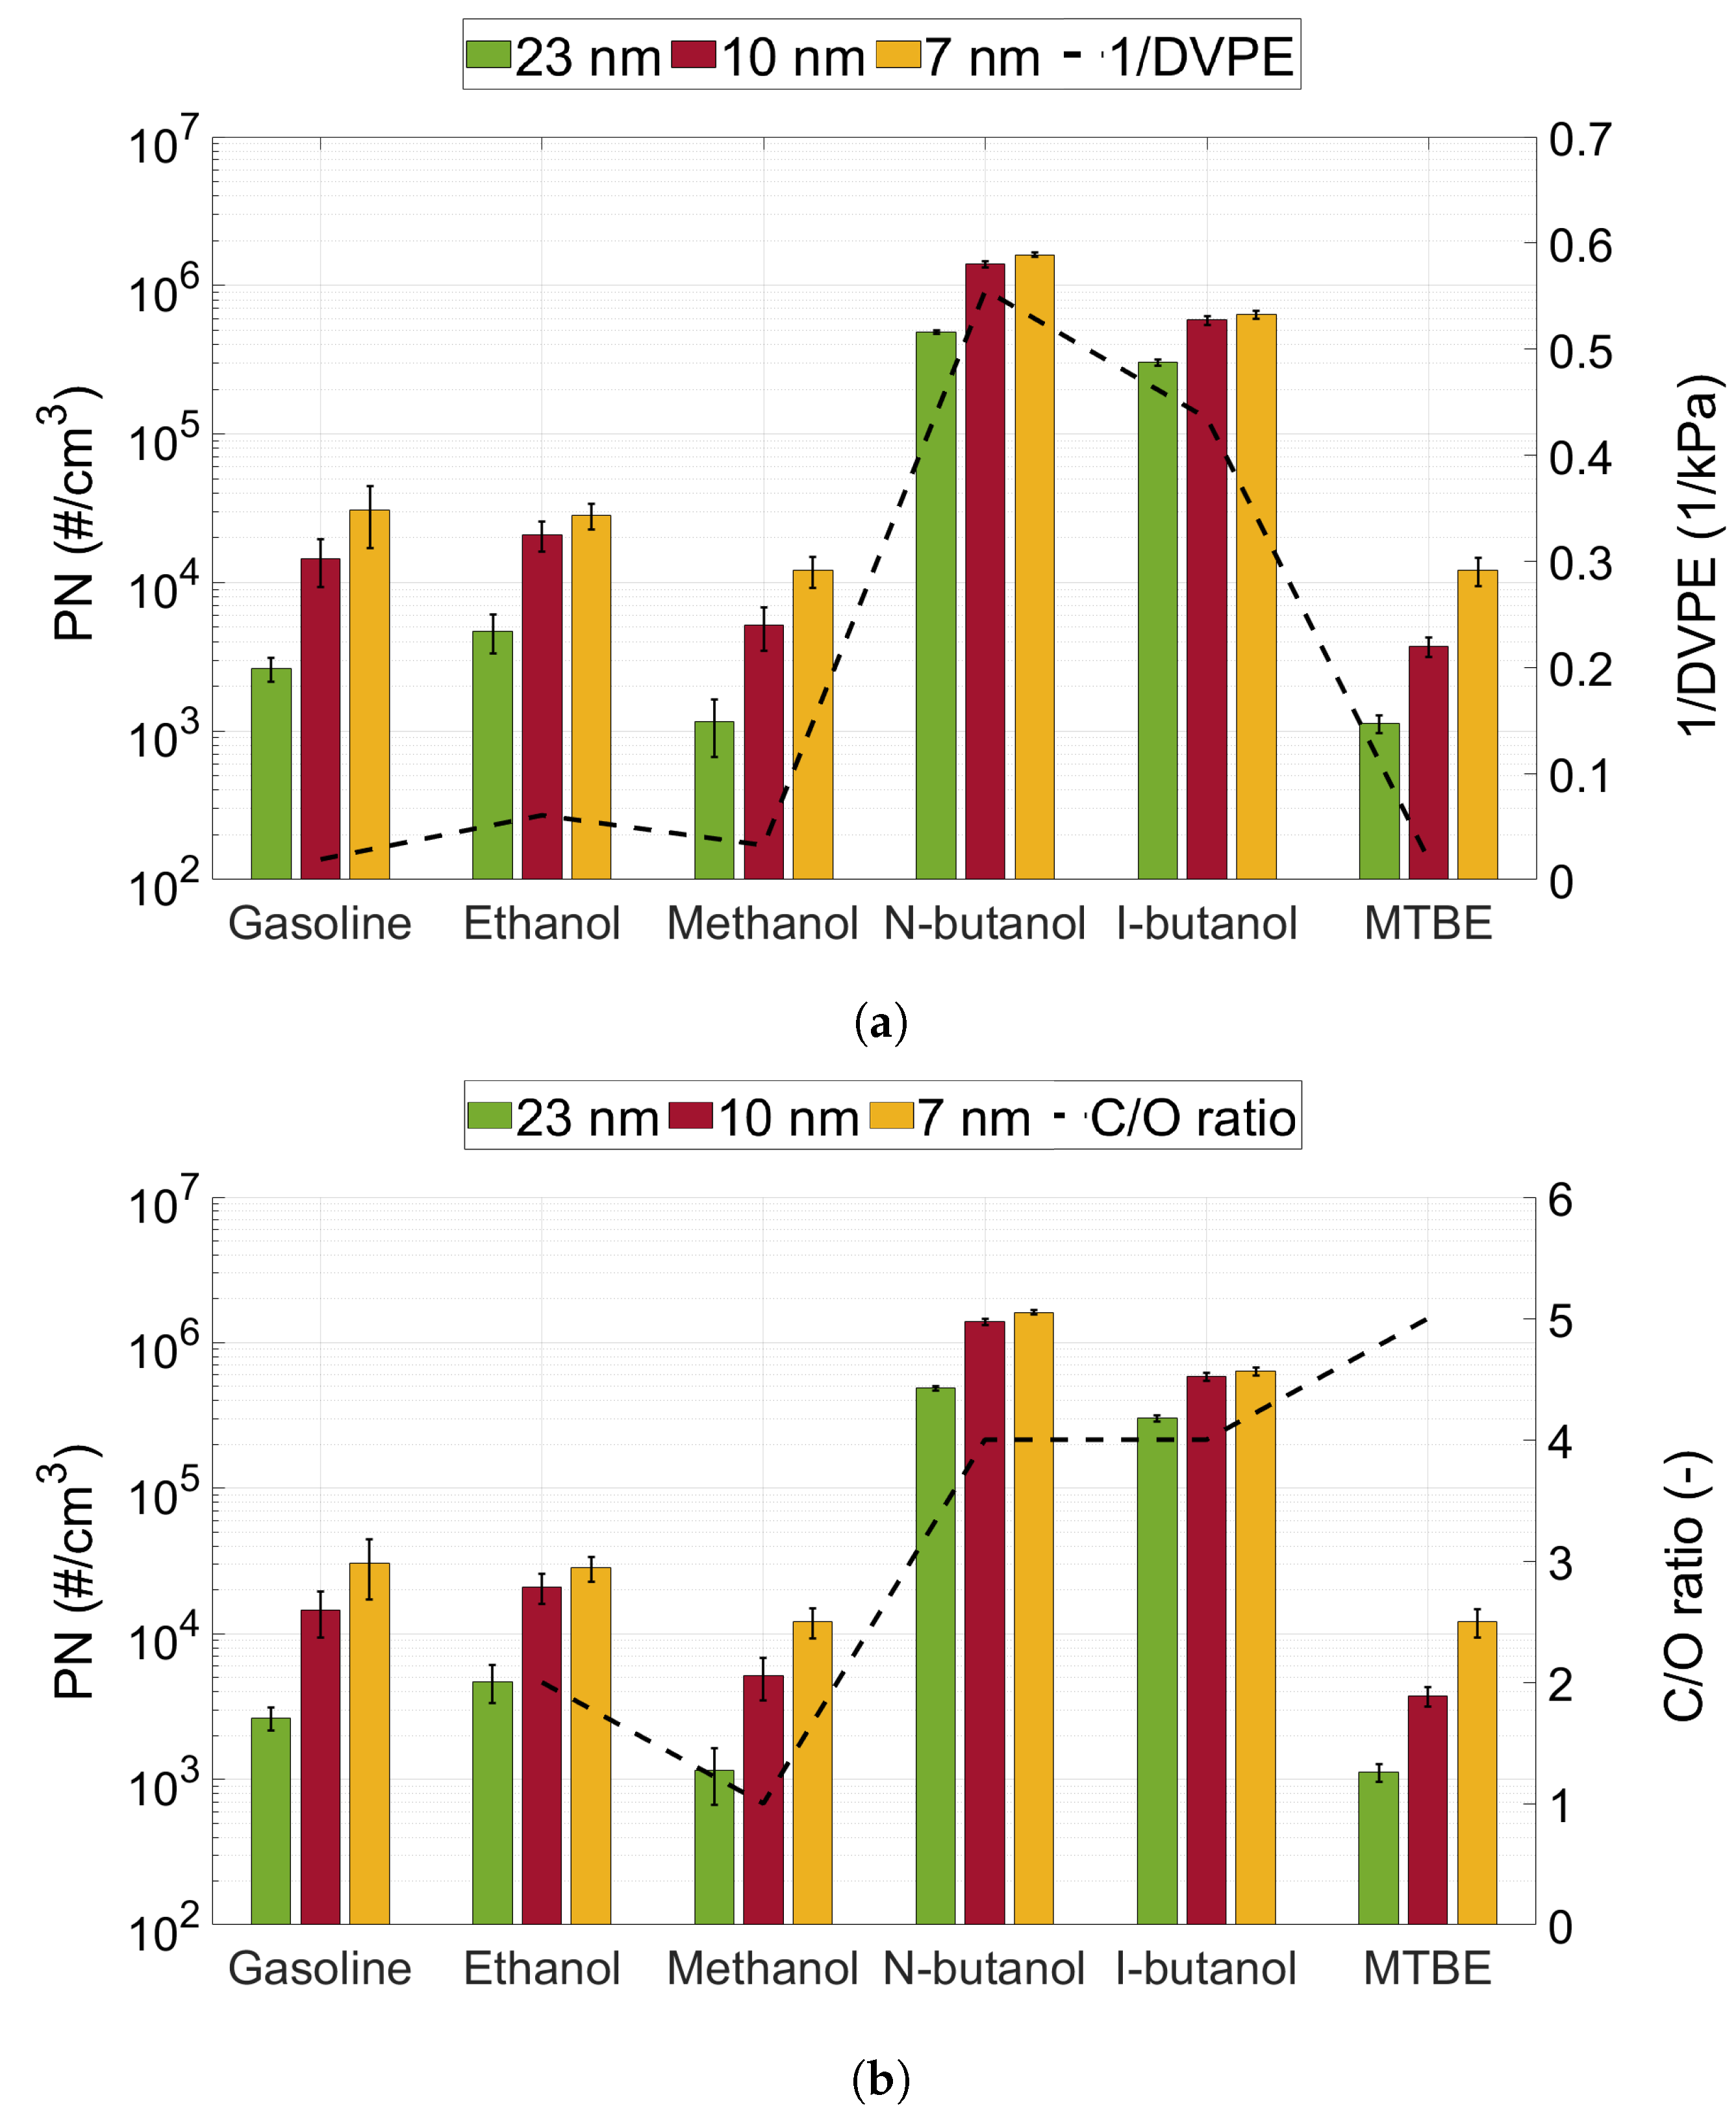
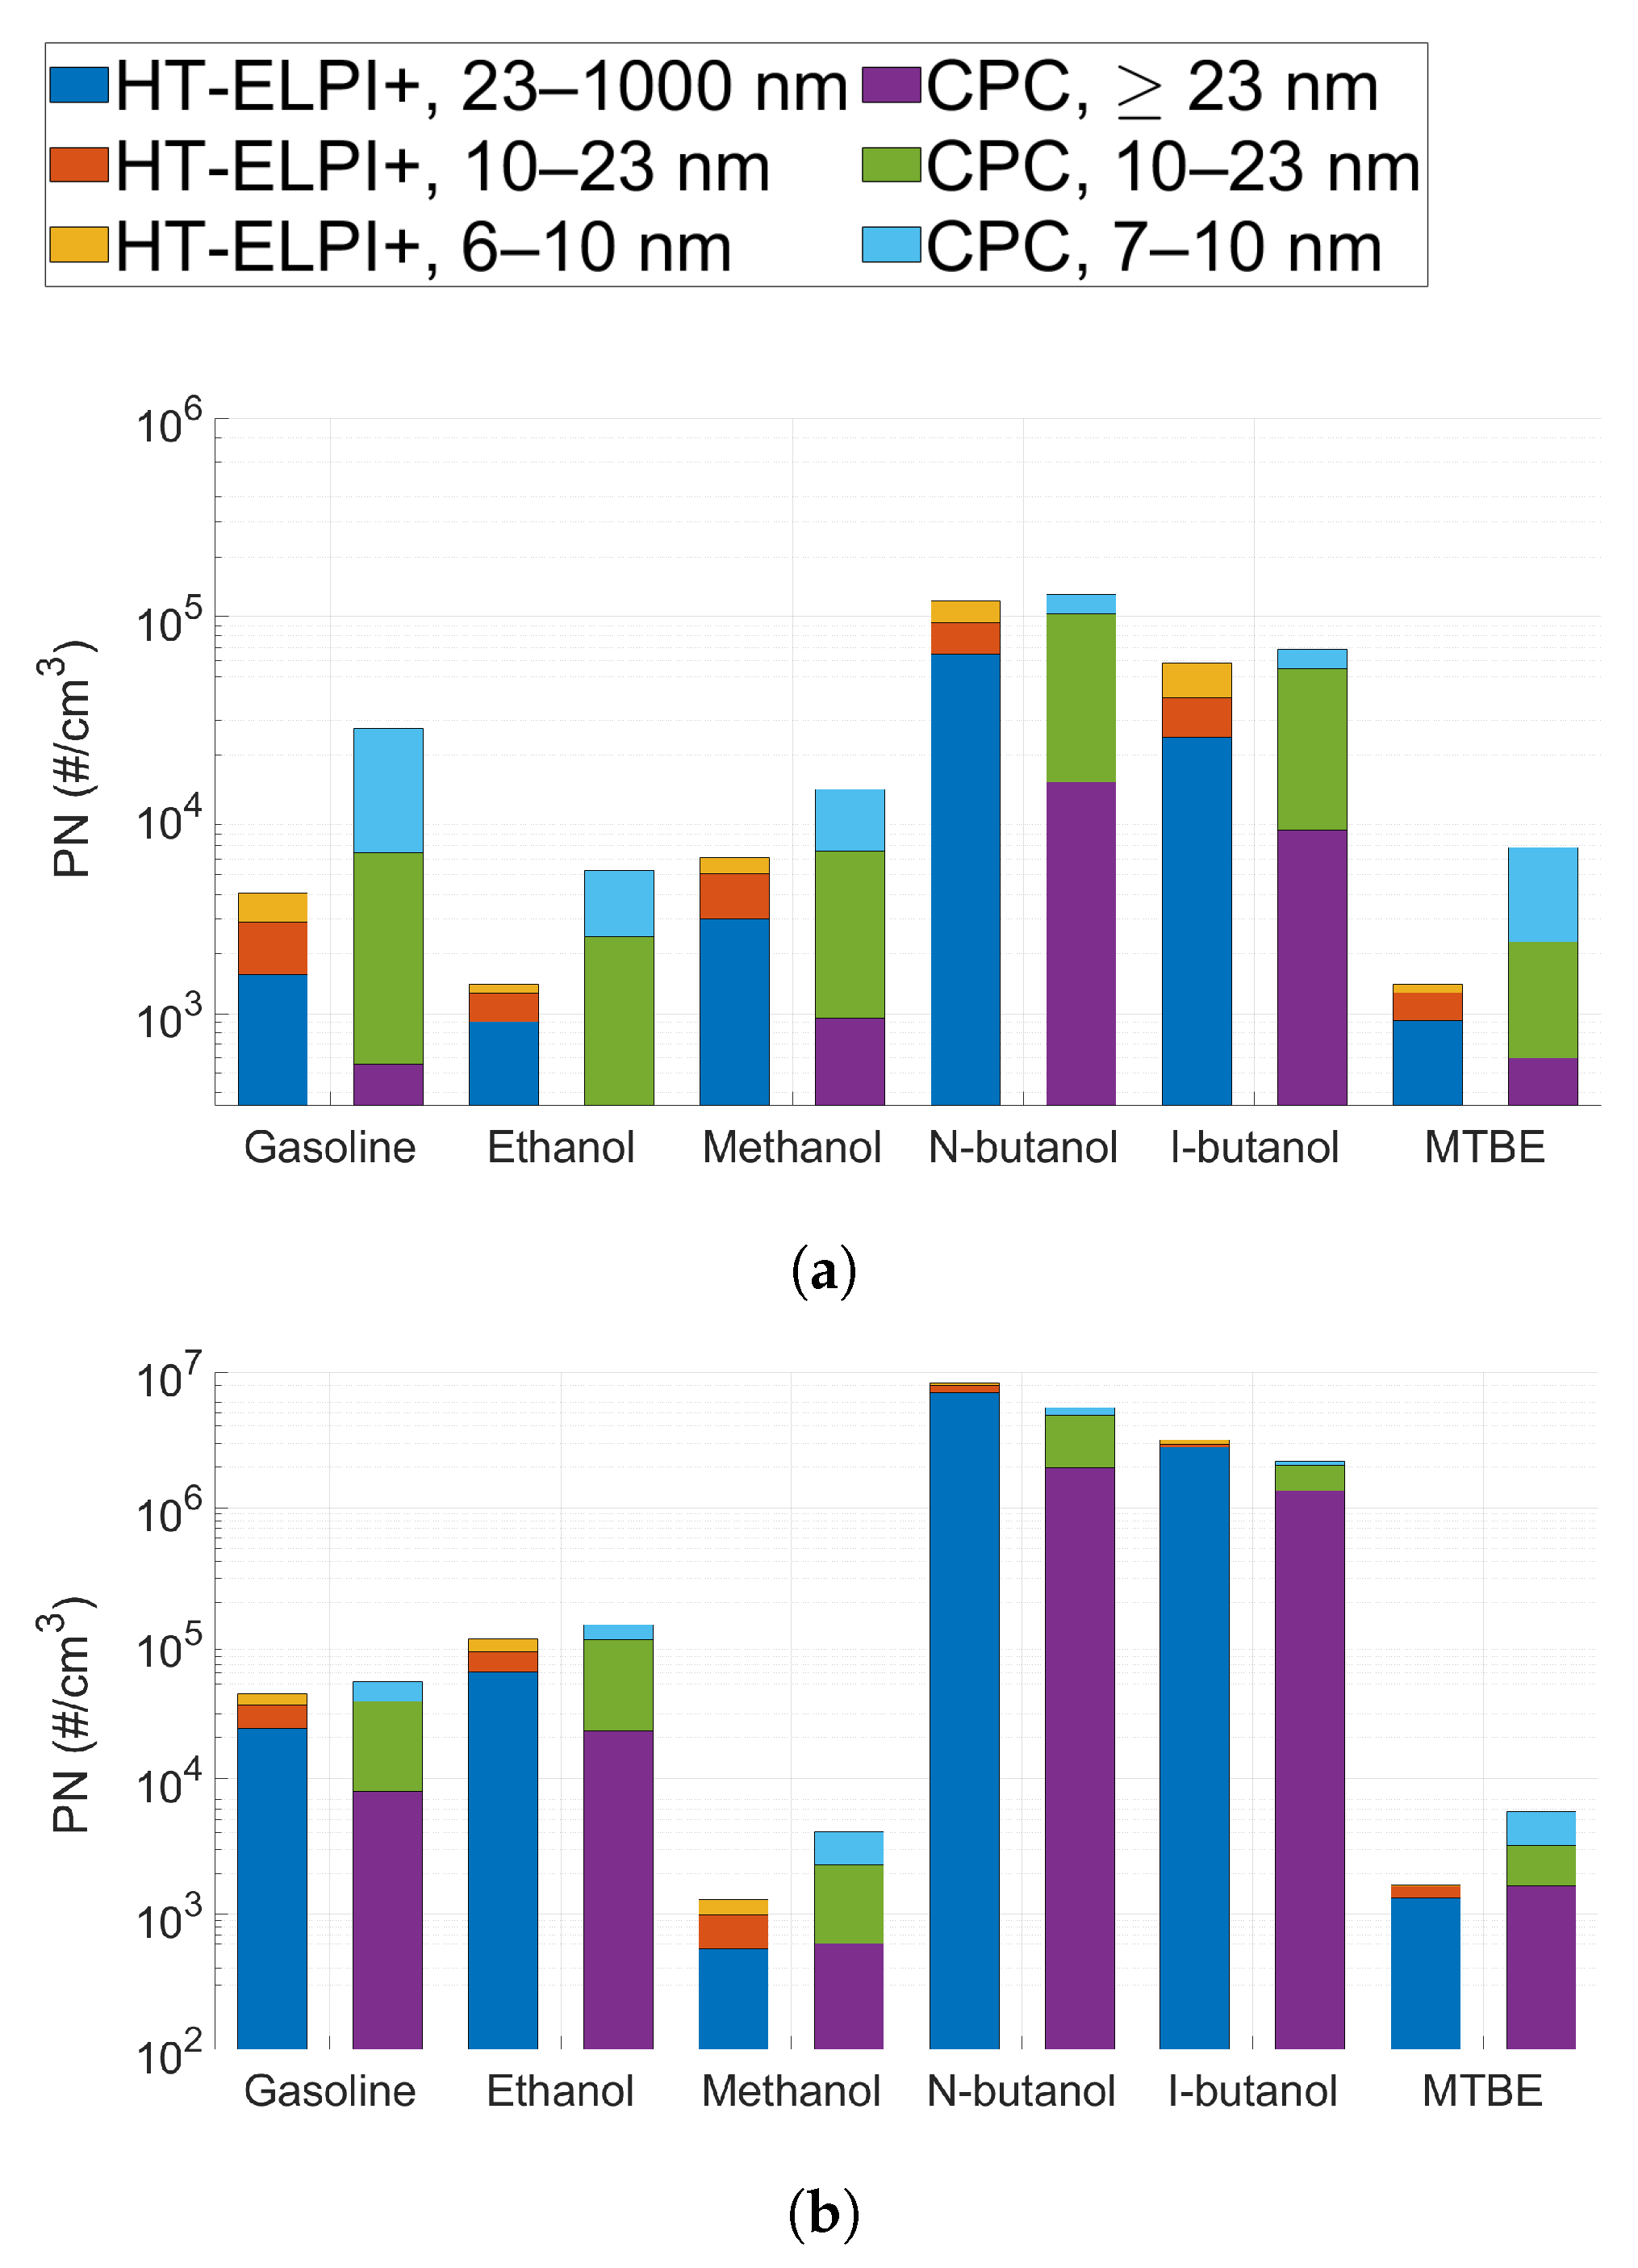
3.2. Particle Number Emissions

The particle number (PN) emissions were measured at six different operating points using the CPCs (see Figure 4). The left side shows the low-load conditions, and the right side shows the mid-load conditions. The dashed line is the instrument measuring limit for 23 and 10 nm. For the points where the mean value exceeds this value, the presented values have a larger uncertainty than given in Table 3. All fuels exhibited higher levels of PN emissions at higher loads and lower speeds. The highest level of PN emissions, for all fuels except MTBE, was seen at 1500 RPM and 13 bar IMEP. Since PN increases as the cut-off size decreases, one can assume that the engine is also emitting particles smaller than 7 nm that could not be measured in this measurement setup.
For all tested operating points, n-butanol exhibited the highest number of particle emissions, independent of the cut-off size. Iso-butanol showed slightly lower emissions compared to n-butanol, but these were still significantly higher than the other fuels. However, as engine speed increases, the difference between n-butanol, iso-butanol and the other fuels decreased. The biofuel with the lowest level of PN emissions is MTBE. MTBE emits approximately 57% less PN emissions than ethanol, and almost 100% less than n-butanol (comparing for 7 nm cut-off). MTBE is also the biofuel with the properties most similar to gasoline. However, at a low load, methanol showed higher levels of bigger particles (above 23 nm) compared to gasoline, but at mid-load conditions the emissions from methanol are lower. Ethanol exhibits lower PN emissions, compared to gasoline, at mid-load conditions and higher engine speeds only.
The effect of fuel properties on PN emissions are shown in Figure 5. Figure 5a shows the volatility of the fuel through the dry vapour pressure equivalent (DVPE) compared to the PN emissions, and Figure 5b shows the carbon to oxygen (C/O) ratio of the fuel compared to the PN emissions. As the gasoline used had no oxygen content, its C/O ratio was equal to infinity and could not be represented in the graph. The PN emissions shown are the arithmetic means for all operating points.
From Figure 5a, it can be seen that the decreased volatility of the fuel (lower DVPE) leads to an increased level of PN emissions. However, ethanol exhibited similar levels of PN emissions compared to gasoline, even if the DVPE of ethanol is less than half. In Figure 5b, the effect of increasing oxygen content on the PN emissions can be seen. It seems that, for the alcohols, an increasing level of oxygen in the fuel (lower C/O ratio) decreases the level of PN emissions. MTBE, which has the highest C/O ratio of the biofuels, did not exhibit the highest level of PN emissions. Furthermore, gasoline, with the highest C/O ratio of all fuels, did not exhibit the highest PN emissions. Hence, in DISI engines, compared to port-fuel injected (PFI) engines, it seems that the dilution effect has a less critical effect on particle formation, and the volatility of the fuel has the biggest effect. This has been shown by Leach et al., in a spray-guided DISI engine, who developed the PN-index [37]. However, these results indicate that this is also true for oxygenated biofuels, and not only gasoline.

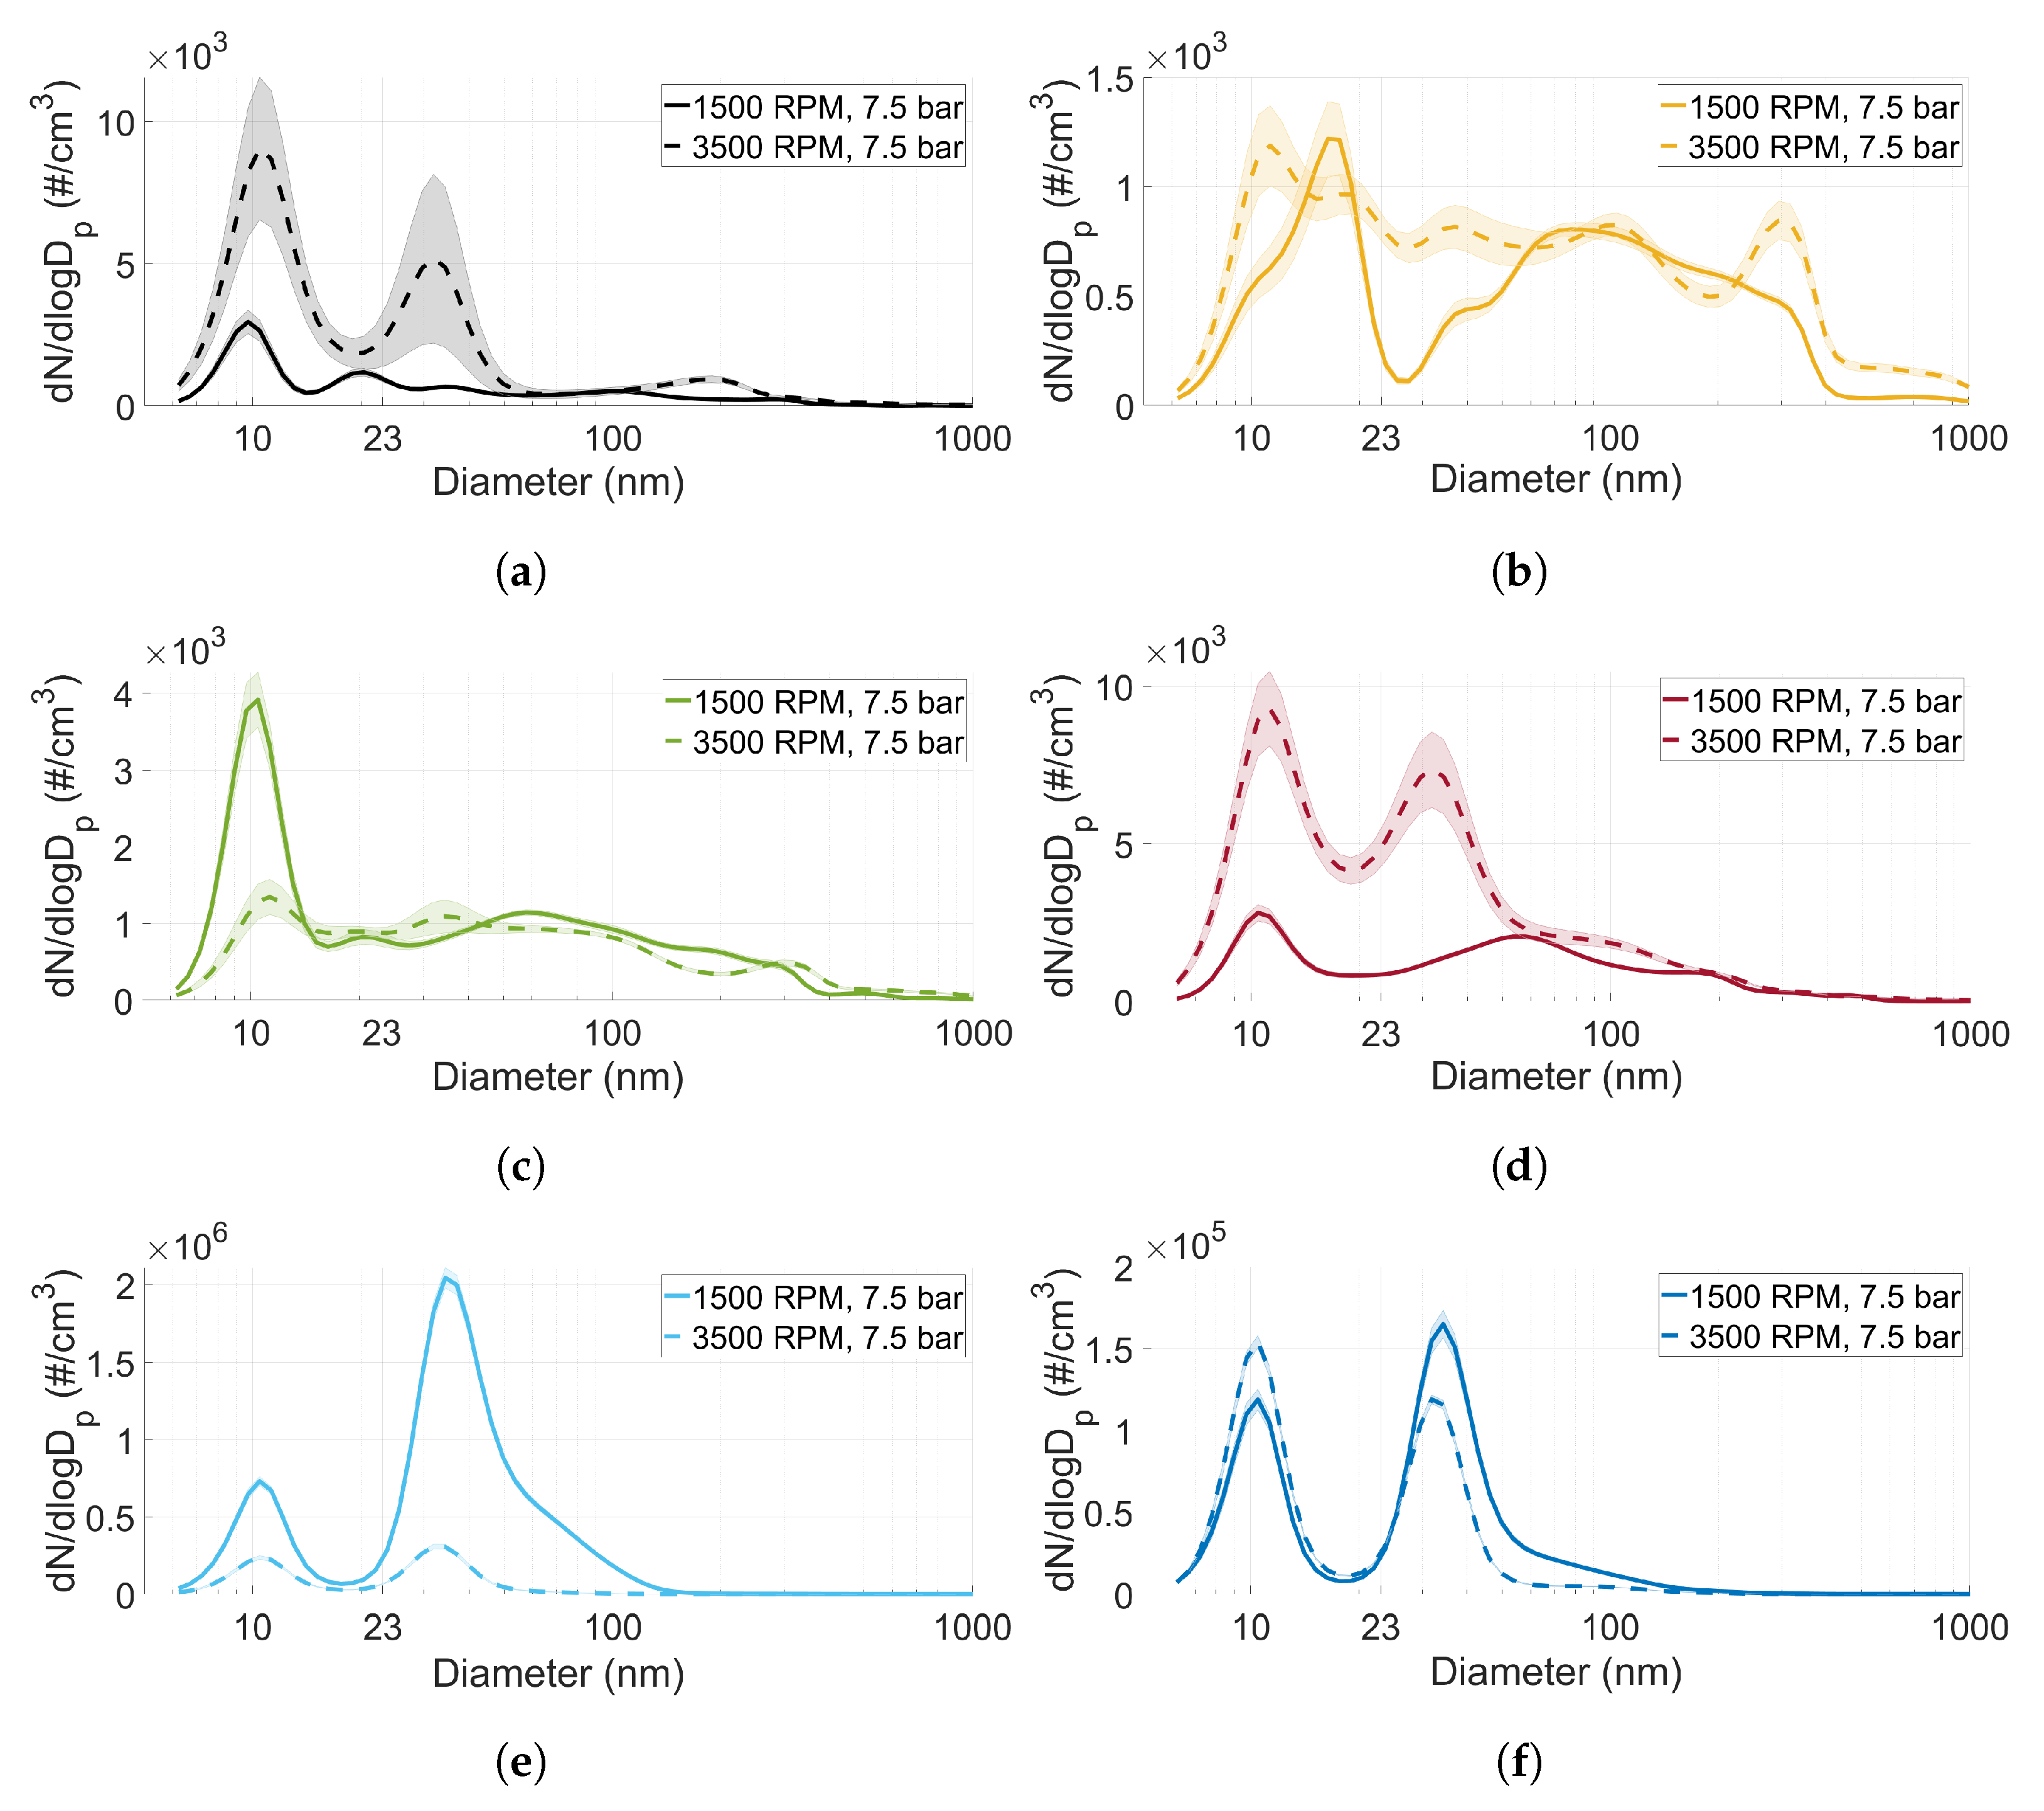
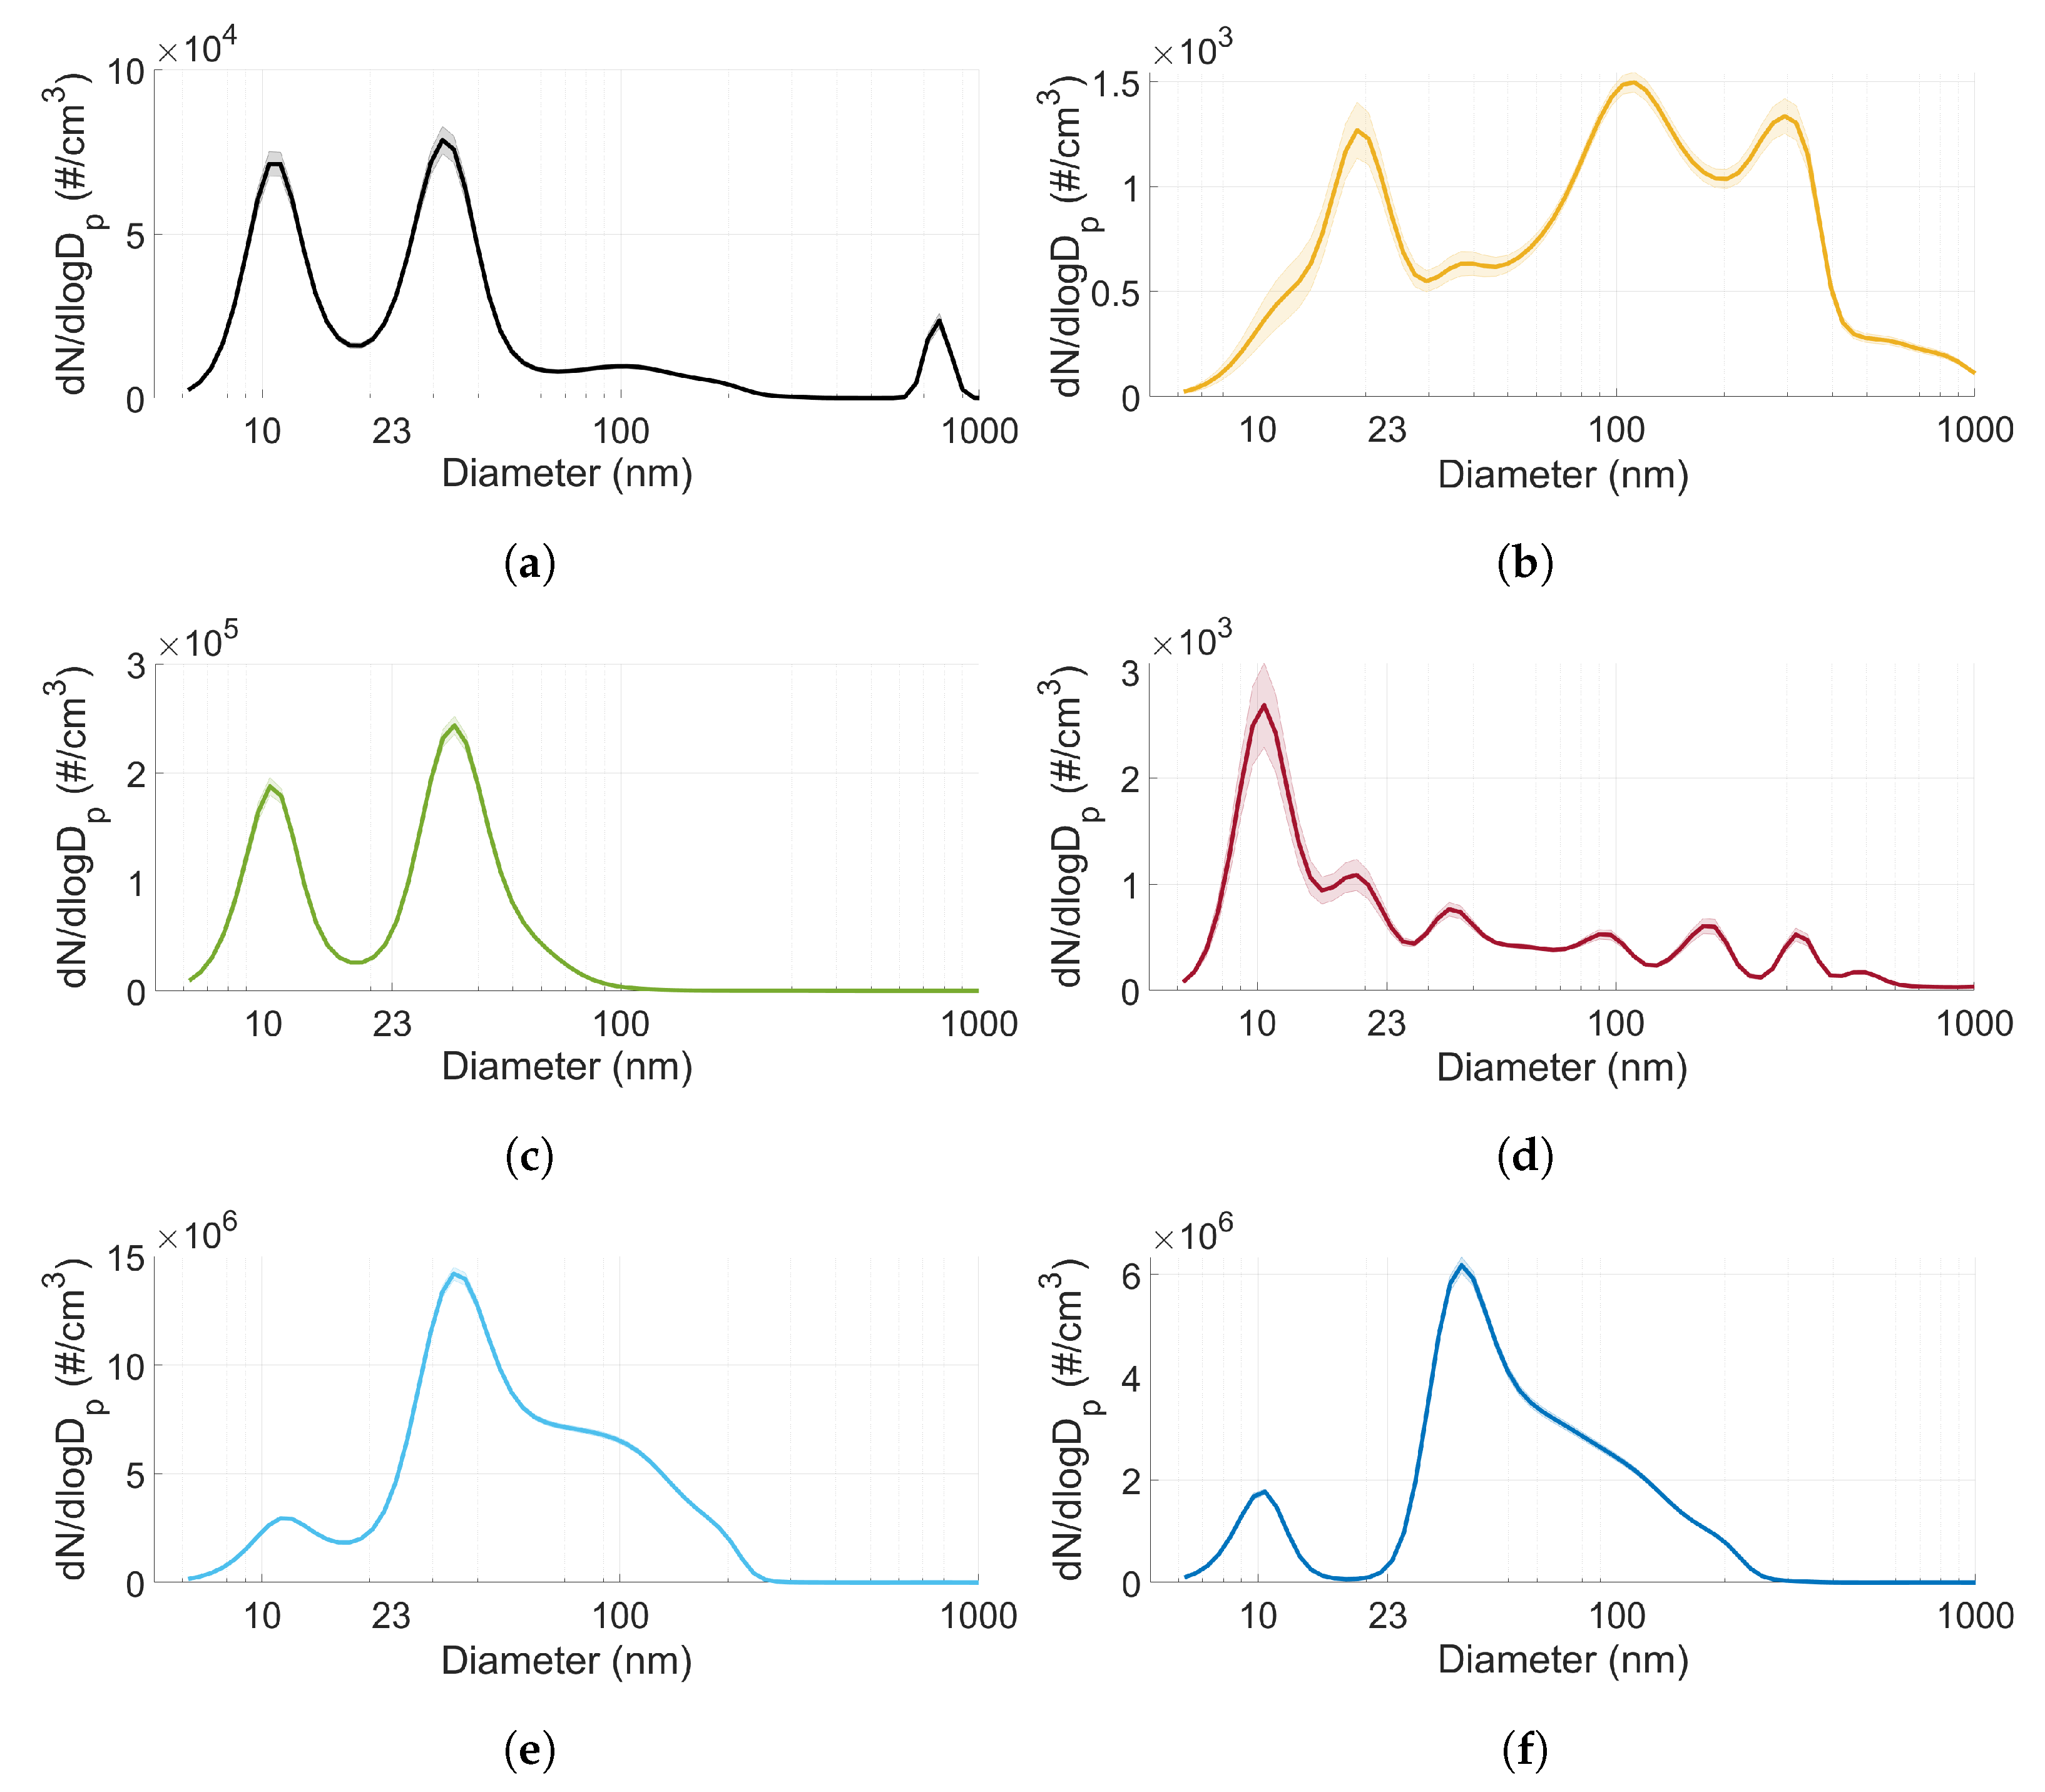
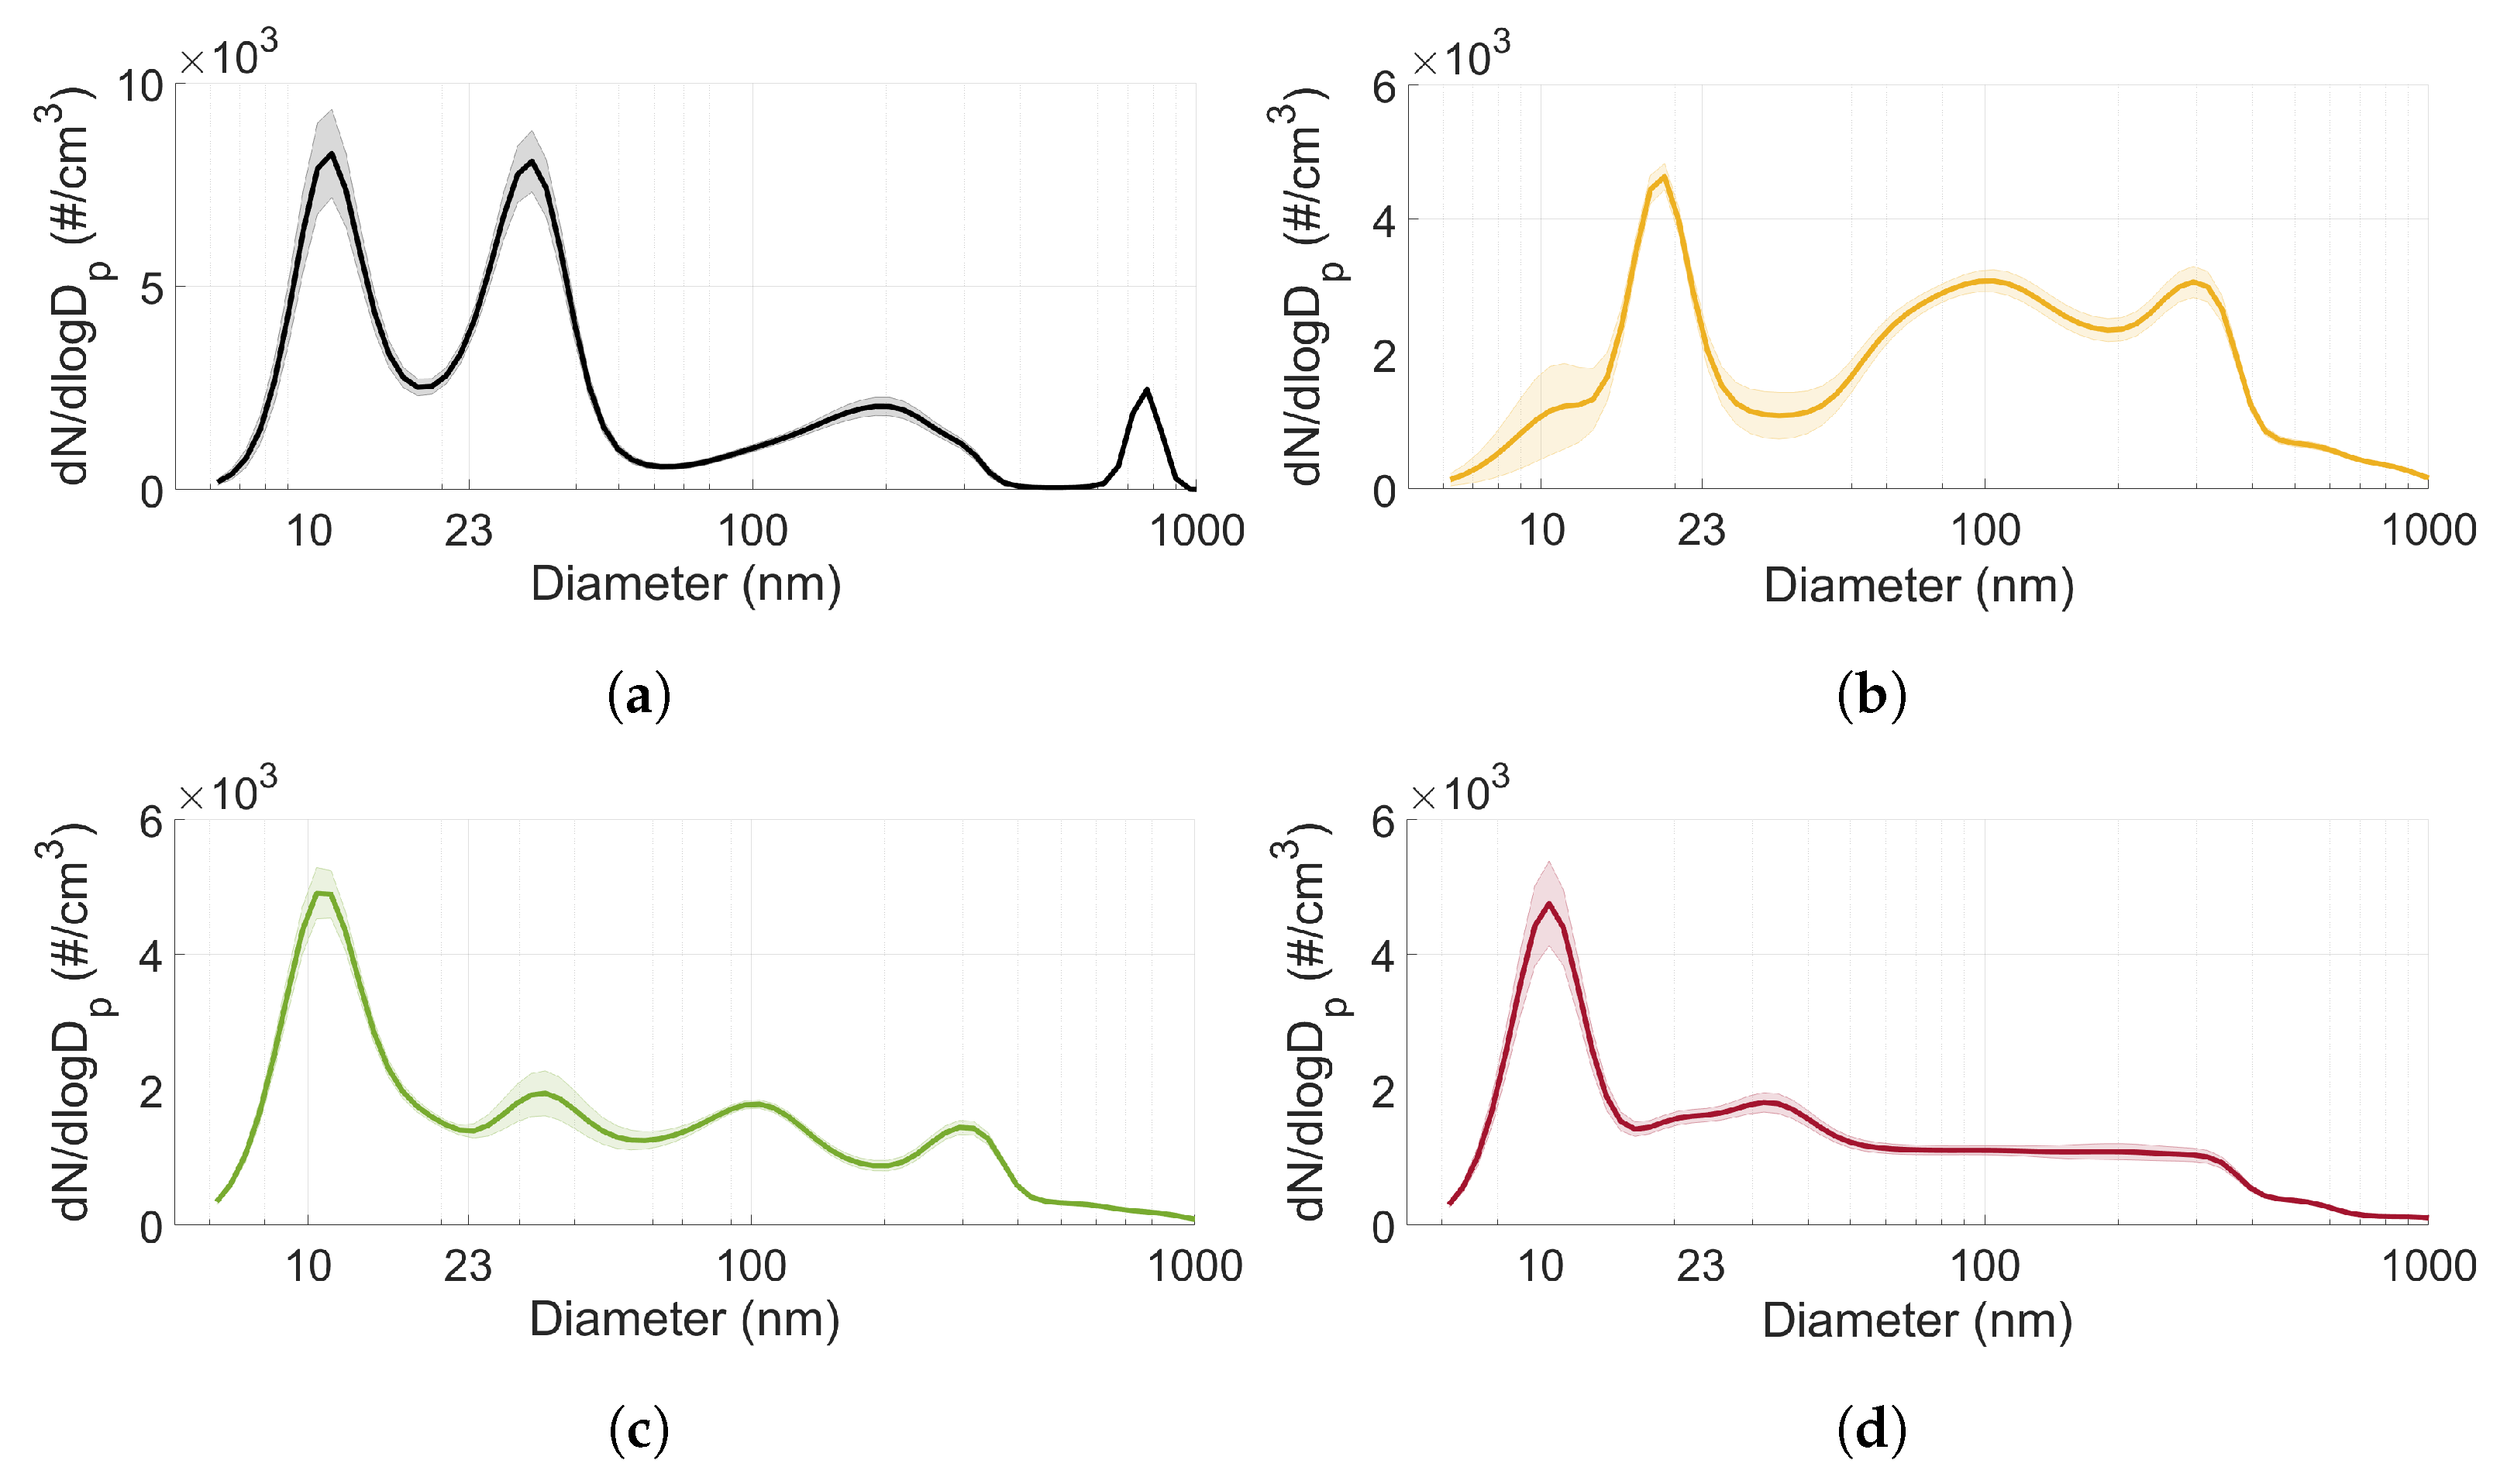
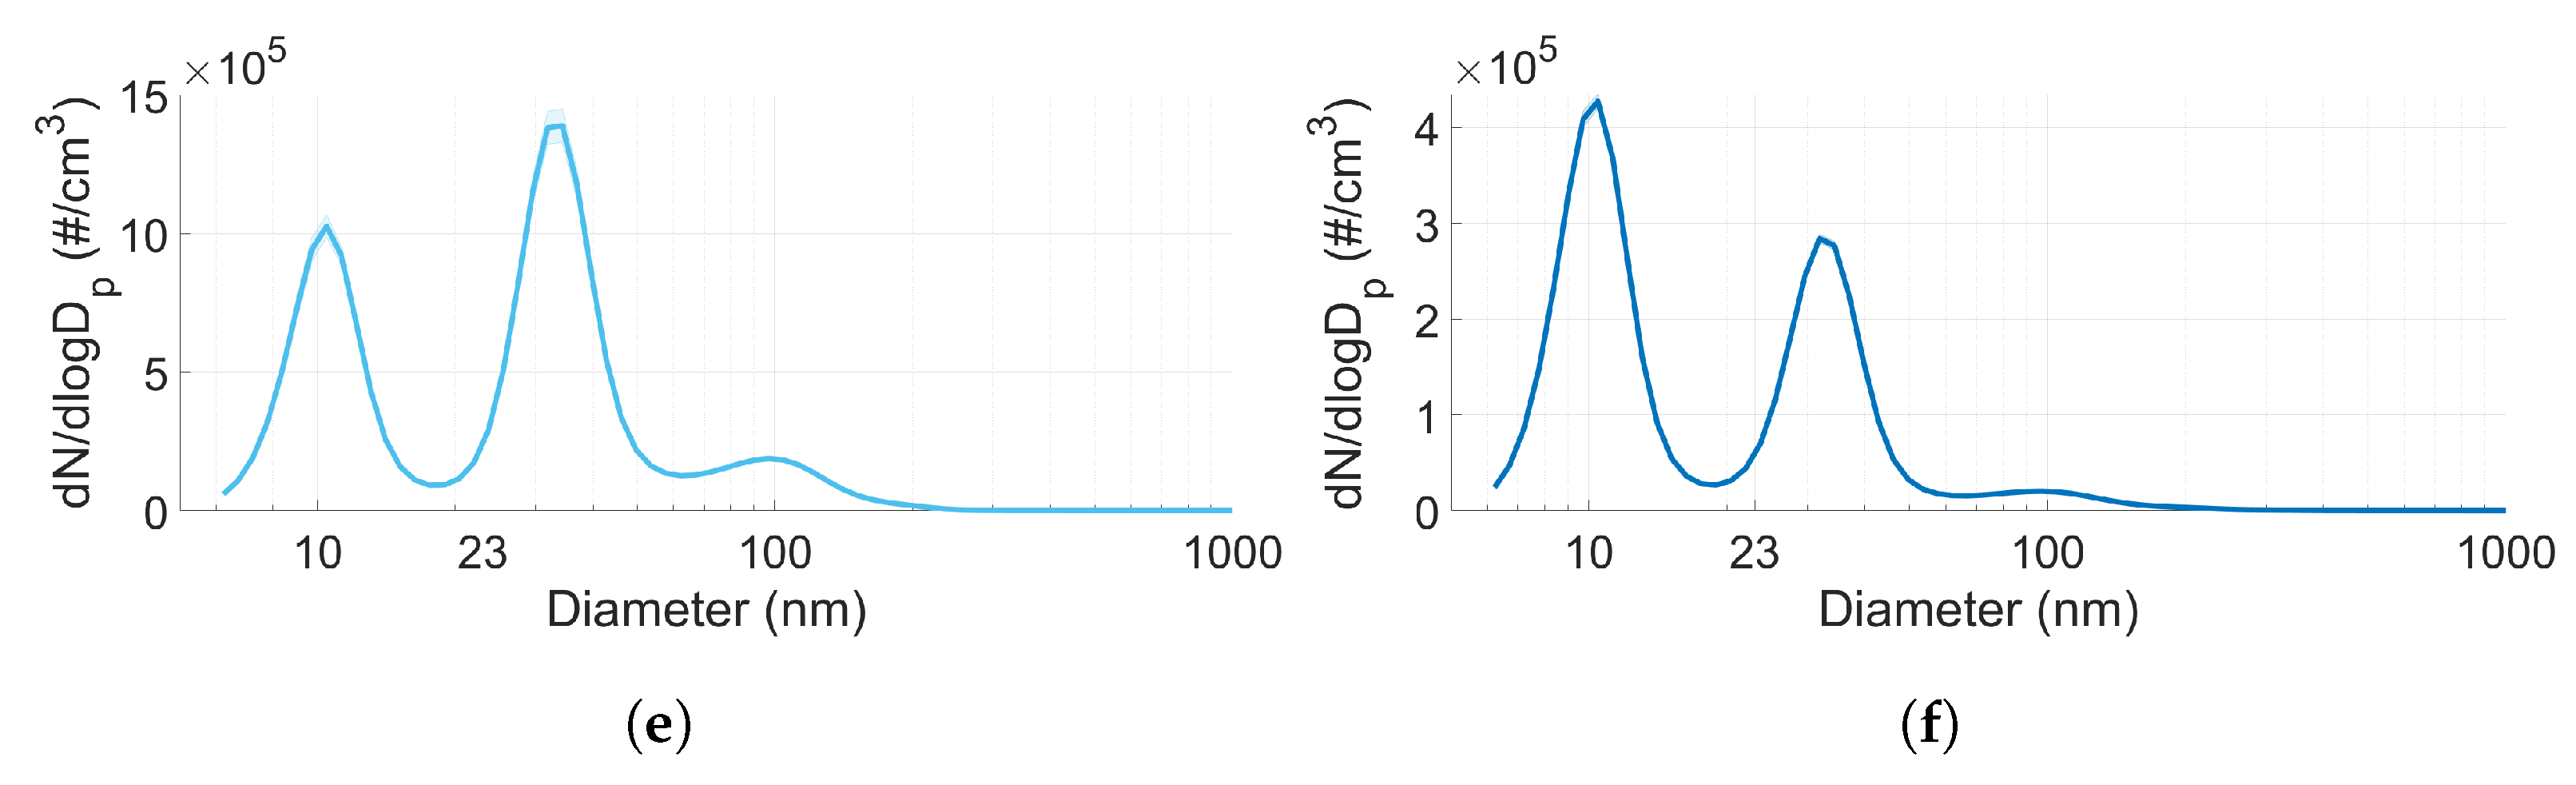
3.3. Particle Size Distribution

The total particle size distribution for all tested fuels at low-load conditions (7.5 bar IMEP) is shown in Figure 6. The shape of the particle size distribution varies between fuels. Gasoline, ethanol, n-butanol, and iso-butanol exhibit clear bimodal shapes, with one peak at 10 nm and one at 30 nm. For gasoline and ethanol, the peak at 10 nm is larger, indicating a higher ratio of small particles emitted from these two fuels. At low engine speeds (1500 RPM), n-butanol and iso-butanol show a higher ratio of larger particles (30–40 nm) being emitted. This is more notable for n-butanol than iso-butanol. Gasoline and methanol are the only fuels to exhibit a higher level of emissions at increased engine speeds.
Methanol exhibits a more unimodal shape with a clear peak at 10 nm and some lower peaks at larger particles sizes. The chemical structure of MTBE is different from the other oxygenated fuels, which seem to have an influence on the size distribution. MTBE exhibits a significantly higher ratio of accumulation mode particles than the other fuels. The first peak is visible at a higher particle size (20 nm) than for the other fuels. The particle diameter of the first peak seem to decrease as the engine speed increases.
At 1500 RPM and 7.5 bar IMEP gasoline, MTBE, ethanol and methanol all exhibit similar particle size distributions around 100 nm. These peaks are probably associated with particles formed from oil or engine wear. For n-butanol and iso-butanol, these emissions are probably masked by the increase in accumulation mode particles from the fuel itself.
The total particle size distribution for all tested fuels at 1500 RPM and under mid-load conditions (13 bar IMEP) is shown in Figure 7. The shape of the particle size distribution is similar to the one at low load. However, under these operating conditions, all fuels but methanol exhibit an increase in accumulation mode particles. Moreover, the particle diameter for the first peak for MTBE increased compared to that under the low-load conditions.
The total particle size distribution for all tested fuels at 3500 RPM and under mid-load conditions (13 bar IMEP) is shown in Figure 8. A similar trend to the one under low-load conditions can be observed in these graphs. All of the biofuels (except for methanol) show a lower ratio of accumulation mode particles as the engine speed increases. For gasoline, there is no distinct difference between 1500 RPM and 3500 RPM under these load conditions. Only methanol and MTBE exhibit a higher level of particle emissions at 3500 RPM compared to at 1500 RPM. Moreover, the peak for MTBE at approximately 20 nm is even more distinct at this engine speed and under these load conditions.

3.4. Comparison of Undiluted and Diluted Particle Measurements

A comparison between the total measured PN and the distribution is shown in Figure 9. In general, the CPCs emit a higher number of total PN than the HT-ELPI+. Only when a high number of larger particles (≥23 nm) the HT-ELPI+ exhibit similar levels of PN to the CPCs. Moreover, there is some difference in the measured particle size distributions between the two measurement setups. In general, the undiluted measurements show a higher ratio of larger particles than the diluted measurements. The difference seem to be independent of whether a high number of larger or smaller particles are emitted, which is shown by comparing the operating points of 1500 RPM and 13 bar IMEP and, 3500 RPM and 7.5 bar IMEP, respectively.

3.5. Elemental Analysis

The elemental composition of the particles retrieved from the HT-ELPI+ filters can be seen in Figure 10. Zinc and phosphorus are displayed as these components are usually found in lubricating oil. The analysis is based on three filters with three different median particle sizes ( D 50 ): 54, 150 and 250 nm.
For the smallest particle size (54 nm), there is only a minor difference in the elemental composition, both in terms of zinc and phosphorus. At 150 nm, gasoline shows a significantly higher ratio of oil-derived elements than the other fuels. At 250 nm, the highest level of zinc is seen for gasoline followed by n-butanol, while higher levels of phosphorus are seen for all fuels but methanol and iso-butanol. The results indicate that a higher number of oil-derived components can be seen for the particles emitted by gasoline than the oxygenated biofuels but only at larger particle sizes and not in nucleation or accumulation mode particles. There does not seem to be a correlation between a high level of emitted particles (n-butanol and iso-butanol) and the ratio of oil-derived particles, indicating that for the oxygenated fuels the increase in particles is associated with the fuel and not the lubricating oil.

4. Discussion

The reported results should be interpreted keeping the estimated particle losses in mind. For both the CPCs and the HT-ELPI+, the particle losses were around 25–30%, with slightly higher losses for the CPCs. Thus, the reported values of PN could be higher than those reported in this article, but the qualitative difference between the fuels should remain valid. However, the diffusion losses increase as the particle size decreases [34]; thus, it is possible that the losses are a few percentage points (1–10 percentage points) higher for the smallest measured particle diameters (6 nm for HT-ELPI+ and 7 nm for CPC3750) than for 23 nm. Moreover, this article does not include the losses due to agglomeration. These losses are reported to be dependent on flow, residence time and particle number concentration [38]. Thus, it is possible that the fuels emitting higher levels of PN can have higher losses associated with agglomeration. However, only a minor reduction in particles was reported for particle concentrations below 10 7   # / cm 3 [38], and thus it is assumed that the thermophoretic losses are still the most significant losses.
The effect of oxygenated biofuels on particle number emissions depends on the properties of the fuel and the operating point. Contrary to previous research, gasoline shows lower levels of PN emissions compared to most of the biofuel alternatives, also at particle sizes larger than 10 nm [12,13,14]. The alcohols exhibit three fuel properties that could be considered to increase the level of fuel impingement and pool fires: decreased energy density, increased heat of vaporisation and decreased volatility. The decreased energy density increases the amount of fuel that needs to be injected for the desired load. This causes an increase in the injection duration and decreases the time available for evaporation and air/fuel mixture preparation, which could decrease the homogeneity at the start of combustion. A higher heat of vaporisation will decrease the in-cylinder temperatures, especially in the vicinity of the spray or the fuel films. Furthermore, the low volatility of the fuel means that a longer time and higher temperatures are needed to fully evaporate the fuel. This could cause fuel films to develop within the combustion chamber that are not fully evaporated at the start of combustion and locally rich zones where high levels of particle are formed after spark. In a gasoline-optimised DISI engine, these properties have a more significant effect on the PN emissions than the increased oxygen content of the biofuel candidates.
The results indicate that the main fuel property affecting the particle number emissions is the volatility of the fuel. Decreased volatility increases PN emissions regardless of the particle size. The fuels with the lowest volatility, n-butanol and iso-butanol, showed a significant increase in PN emissions at low engine speeds and mid-load conditions. The increase in emitted particles at these conditions can be attributed to fuel impingement on the piston and other components in the combustion chamber. These results show that, contrary to port-fuel injected engines, or DISI engines with higher injection pressures, the dilution effect due to increased levels of embedded oxygen is not significant, and the main property affecting particle formation is the volatility of the fuel.
It is interesting that the oxygenated biofuels with the least similar fuel properties, MTBE and methanol, show similar levels of mean PN emissions. The low PN emissions for MTBE are assumed to be due to it having similar fuel properties to gasoline (DVPE and LHV). Thus, the fuel injection strategy is more suitable for the utilisation of MTBE compared to the other biofuels. However, the low PN emissions for methanol are attributed to a combination of factors: a higher volatility than for the other alcohols, increased injection pressure and high O/C-ratio, causing a more pronounced dilution effect at the flame front compared to the other fuels, as reported by [39,40,41,42].
In this engine, an early injection is applied. This has been shown by previous researchers to allow for more time for evaporation and mixture preparation, which is important to decrease particle emissions from gasoline [6]. However, it can also lead to a substantial fuel film being formed on the surfaces inside the cylinder [43]. The results from this study indicate that early injection with alcohol fuels are not optimal in regard to particle emissions. Thus, the optimisation of the fuel injection is needed to decrease the PN emissions from fuels, such as ethanol, n-butanol and iso-butanol.
As the engine speed increases, the particle emissions drop. This effect is more pronounced for the alcohol fuels than for gasoline and MTBE. This is assumed to be attributed to three parameters: increased injection pressures, increased piston and in-cylinder temperatures, and the morphology of the formed particles affecting oxidation rates. The difference in injection pressure between the alcohol fuels and gasoline increases as the engine speed increases. Increased injection pressures facilitate fuel atomisation and lead to a more homogeneous fuel/air mixture at the start of combustion. The increased piston and in-cylinder temperatures lead to increased rates of evaporation and oxidation. Furthermore, as reported by researchers, the morphologies of the particles formed from alcohol fuels are less dense and thus more reactive than those formed from hydrocarbon fuels, such as gasoline or diesel [41,44,45]. These three effects combined decrease PN significantly for ethanol, n-butanol and iso-butanol as engine speed increases. At 3500 RPM, these fuels exhibit PN emissions close to those of gasoline.
The undiluted measurements of the particle number distribution show that the fuel and the operating point also affect the size distribution of the emitted particles. Gasoline and the alcohol fuels show a high ratio of nucleation mode particles (below 50 nm). Methanol and ethanol, which are the fuels with the highest oxygen content, show a higher number of emitted particles at 10 nm than at 30 nm. MTBE is the only fuel to show a higher fraction of accumulation mode particles (50–500 nm) than nucleation mode particles for all operating points. However, under mid-load conditions and 1500 RPM, ethanol, n-butanol and iso-butanol also exhibit emissions of larger particles.
The formation of particles with increased particle sizes is promoted at low engine speeds and higher load due to increased rates of particle formation, but also increased rates of particle adsorption and coagulation. Particles are initially formed from pyrolysis in areas with low oxygen concentrations, such as pool fires due to fuel impingement. The high level of particle emissions under these operating conditions indicate decreased homogeneity during combustion and will cause increased levels of particle nucleation, adsorption and coagulation, as they all depend on the particle concentration [34,46]. The coagulation to form larger particles is more probable at lower engine speeds, since there is more time available for coagulation to occur and the in-cylinder temperature is lower. Furthermore, due to decreased in-cylinder turbulence, the particles are conserved in the area of the pool fire where it has a higher probability of coagulation and growth.
The increased particle sizes for MTBE do not seem to depend on the volatility of the fuel. The volatility of MTBE is on the same level as gasoline. As the first peak for MTBE is at a larger particle diameter (20 nm) compared to the other fuels, it is probable that the primary particles formed from MTBE have larger sizes than those formed from the alcohol fuels or gasoline. Previous research has shown that the branched structure of iso-butanol promotes the onset of nucleation further, leading to larger particle sizes [47], and that the pyrolysis of larger alcohols results in the formation of large alkenes [48]. The same theory could apply to the size distribution of MTBE, which has a branched chemical structure as well. It would also explain the high number of accumulation mode particles for n-butanol and iso-butanol.
The comparison between the undiluted (HT-ELPI+) and diluted (CPCs) measurements shows a higher level of measured total PN for the diluted setup. This could be due to the fact that the CPC setup does not remove all volatile particles, as discussed in previous publications [30]. It is also possible that all volatile particles are already removed upstream of the measurement point due to the hot exhaust temperatures or in the TWC, as discussed in a previously published study conducted by the authors [21]. However, there is a difference in the particle size distribution between the undiluted and diluted particle measurements. From the results in this study it is not possible to determine why. This is a topic for future studies. Moreover, future studies to compare the difference should use more similar measurement setups (measurement devices, pipe length and flows) and include measurements according to the particle measurement programme (PMP).
The biofuels exhibited lower ratios of oil-derived elements in their particle chemical compositions than gasoline. This could indicate that the mass of particles derived from oil is similar independent of the fuel used, as fuels with higher levels of emitted particles would give lower mass fraction values. Previous research conducted with hydrogen indicates that fuels with lower levels of fuel-derived particle emissions would increase the level of oil-derived particles in the nucleation mode [9], but this is not seen in these results. The effect could be associated with the increased heat of vaporisation for the alcohols. The increased heat of vaporisation (HOV) of the biofuels would decrease the evaporation rate of the oil film on the cylinder walls, decreasing the amount of oil in the cylinder gas during combustion [10]. There is a lack of research on the exact effect of particles emitted from lubrication oil from ICEs on human health. However, in addition to having the same negative impact that has been reported for exhaust emissions in general [49], the inhalation of phosphorous has been reported to cause respiratory tract irritation [50] and the inhalation of zinc oxide (ZnO) can have pulmonary effects [51].
As future legislation will consider particles down to 10 nm, it is important to consider the optimisation of the fuel injection and after-treatment systems to decrease the number of emitted particles, also with particle sizes below 23 nm. Fuels with low volatility, such as n-butanol and iso-butanol, will be harder to use as a biofuel alternative in engines considering future legislation limits.

5. Conclusions

In this paper, the undiluted particle size distribution and the total particle number emissions from a production DISI engine fueled with five different biofuel alternatives were investigated and compared to gasoline. The fuels were tested at different engine operating points instead of a drive cycle to evaluate the compliance to a legislation including a cumulative emission budget. The correlation of PN emissions with the fuel properties has been presented and discussed.
From the presented results, the following conclusions were made:
  • The particle number emissions increased with the utilisation of oxygenated biofuels, compared to gasoline, in a gasoline-optimised DISI engine.
  • For the oxygenated fuels, the highest number of emissions was seen for n-butanol, and the lowest number was seen for MTBE.
  • The particle size distribution seems to depend on the type of fuel used. MTBE exhibited a significantly higher ratio of accumulation mode particles compared to the other fuels (including gasoline).
  • Gasoline exhibited a higher mass ratio of zinc and phosphorus in the particles than the biofuels.
  • For spray-guided DISI engines, the volatility of the fuel is the main fuel property to consider for the optimisation of the fuel injection in regard to decreasing particle emissions.

Author Contributions

Conceptualisation, U.O. and T.L.; methodology, T.L. and U.O.; software, T.L.; validation, T.L., U.O. and A.C.E.; formal analysis, T.L.; investigation, T.L.; resources, U.O. and A.C.E.; data curation, T.L.; writing—original draft preparation, T.L.; writing—review and editing, U.O. and A.C.E.; visualisation, T.L.; supervision, U.O. and A.C.E.; project administration, U.O.; funding acquisition, U.O. and A.C.E. All authors have read and agreed to the published version of the manuscript.

Funding

This work was conducted within the project “Future alternative transportation fuels” and the authors would like to thank the contributing partners: The Swedish Energy Agency, Chevron, Lantmännen, Perstorp AB, Preem, Scania CV AB, St1, Saybolt Sweden, Stena Line, Volvo AB and Volvo Cars. This project has also received funding from the European Union’s Horizon 2020 Research and innovation program under grant agreement No. 954377 (nPETS).

Institutional Review Board Statement

Not applicable.

Informed Consent Statement

Not applicable.

Acknowledgments

The authors would like to express their gratitude towards Volvo Cars for the test engine and all the help during experiments, Saybolt Sweden AB for performing the fuel tests and Preem and Lantmännen for supplying fuels for the tests. The authors would also like to thank Mancini Alessandro at Brembo (Stezzano, Italy) for the assistance in the chemical analysis of the filters.

Conflicts of Interest

The authors declare no conflict of interest.

Abbreviations

The following abbreviations are used in this manuscript:
ϵ Normalised random error
λ Excess air ratio
μ ¯ Mean value
σ Standard deviation
bTDCbefore top dead center
Cconstant for the confidence level (1.96)
CACrank angle
COCarbon monoxide
C/OCarbon oxygen ratio
CPCCondensation particle counter
DISIDirect-injected spark-ignited
DVPEDry vapour pressure equivalent
ECUEngine control unit
EDXRFEnergy-Dispersive X-ray Fluorescence
EOIEnd of injection
HCUnburned hydrocarbons
HOVHeat of vaporisation
HT-ELPI+High-temperature Electrical Low-Pressure Impactor
i-butanolIso-butanol
ICEInternal combustion engine
IMEPIndicated mean effective pressure
KLSAKnock limited spark advance
LHVLower heating value
m air mass flow of air
m fuel mass flow of fuel
MBTMaximum brake torque
MONMotor octane number
MTBEMethyl tert-butyl ether
nnumber of samples
NINational Instruments
NOxNitrogen oxide
P cyl In-cylinder pressure
PFIPort-fuel injected
p inj Injection pressure
PMParticle mass
PNParticle number
RDEReal driving emissions
RONResearch octane number
RPMRevolutions per minute
SISpark-ignited
SOIStart of injection
T after TWC Temperature after three-way catalyst
T exh Exhaust temperature
t inj Injection duration
TWCThree-way catalyst

Appendix A. Particle Loss Calculations

The particle losses were calculated considering thermophoretic losses, sedimentation losses, and diffusive losses according to the method applied in [33,34]. The mean exhaust temperature (878 °C) was used as the temperature at the inlet of the sample setup. A value of 150 °C was assumed as the temperature at the end of the insulated pipes (due to the heated hoses), and the temperature at the wall of the insulated pipes was assumed to be 60 °C. The estimated losses for the CPCs and the HT-ELPI+ can be seen in Table A1. As the losses changes depending on particle size, the losses for three different particle sizes are presented here: 10, 100 and 1000 nm.
The CPCs were connected via one insulated pipe, one heated hose and a two-stage ejector diluter. The CPCs were assumed to have similar particle losses as they used the same setup until after the diluter. The sample flow was 1 L/min. It is assumed that the wall of the heated hoses are at a higher temperature than the center of the tube; hence, thermophoretic losses are only considered for the insulated pipe and are independent of particle size. Since the sedimentation and diffusive losses of the insulated pipe are negligible compared to the thermophoretic losses, the sedimentation and diffusive losses are only reported for the heated hoses. The losses over the diluter were assumed to be 5% according to previous results of Vanhanen et al. [35]. The HT-ELPI+ is connected via one insulated pipe and two heated hoses and losses are calculated similarly to the CPCs. The sample flow was 10 L/min. The losses for the heated hoses (sedimentation and diffusive losses) are summarised. The lengths of pipes and heated hoses can be seen in Figure A1.
Figure A1. Schematic figure of the experimental setup used for particle emission measurement and the lengths of the pipes.
Atmosphere 12 01493 g0a1
Table A1. Particle losses in percentage for the CPCs and the HT-ELPI+ in the measurement setup used for different particle sizes.
Type of LossCPCsHT-ELPI+
10 nm100 nm1000 nm10 nm100 nm1000 nm
Thermophoresis27.824.4
Sedimentation7.0 × 10 4 8.7 × 10 3 0.342.7 × 10 3 0.031.36
Diffusion3.00.140.025.10.240.04

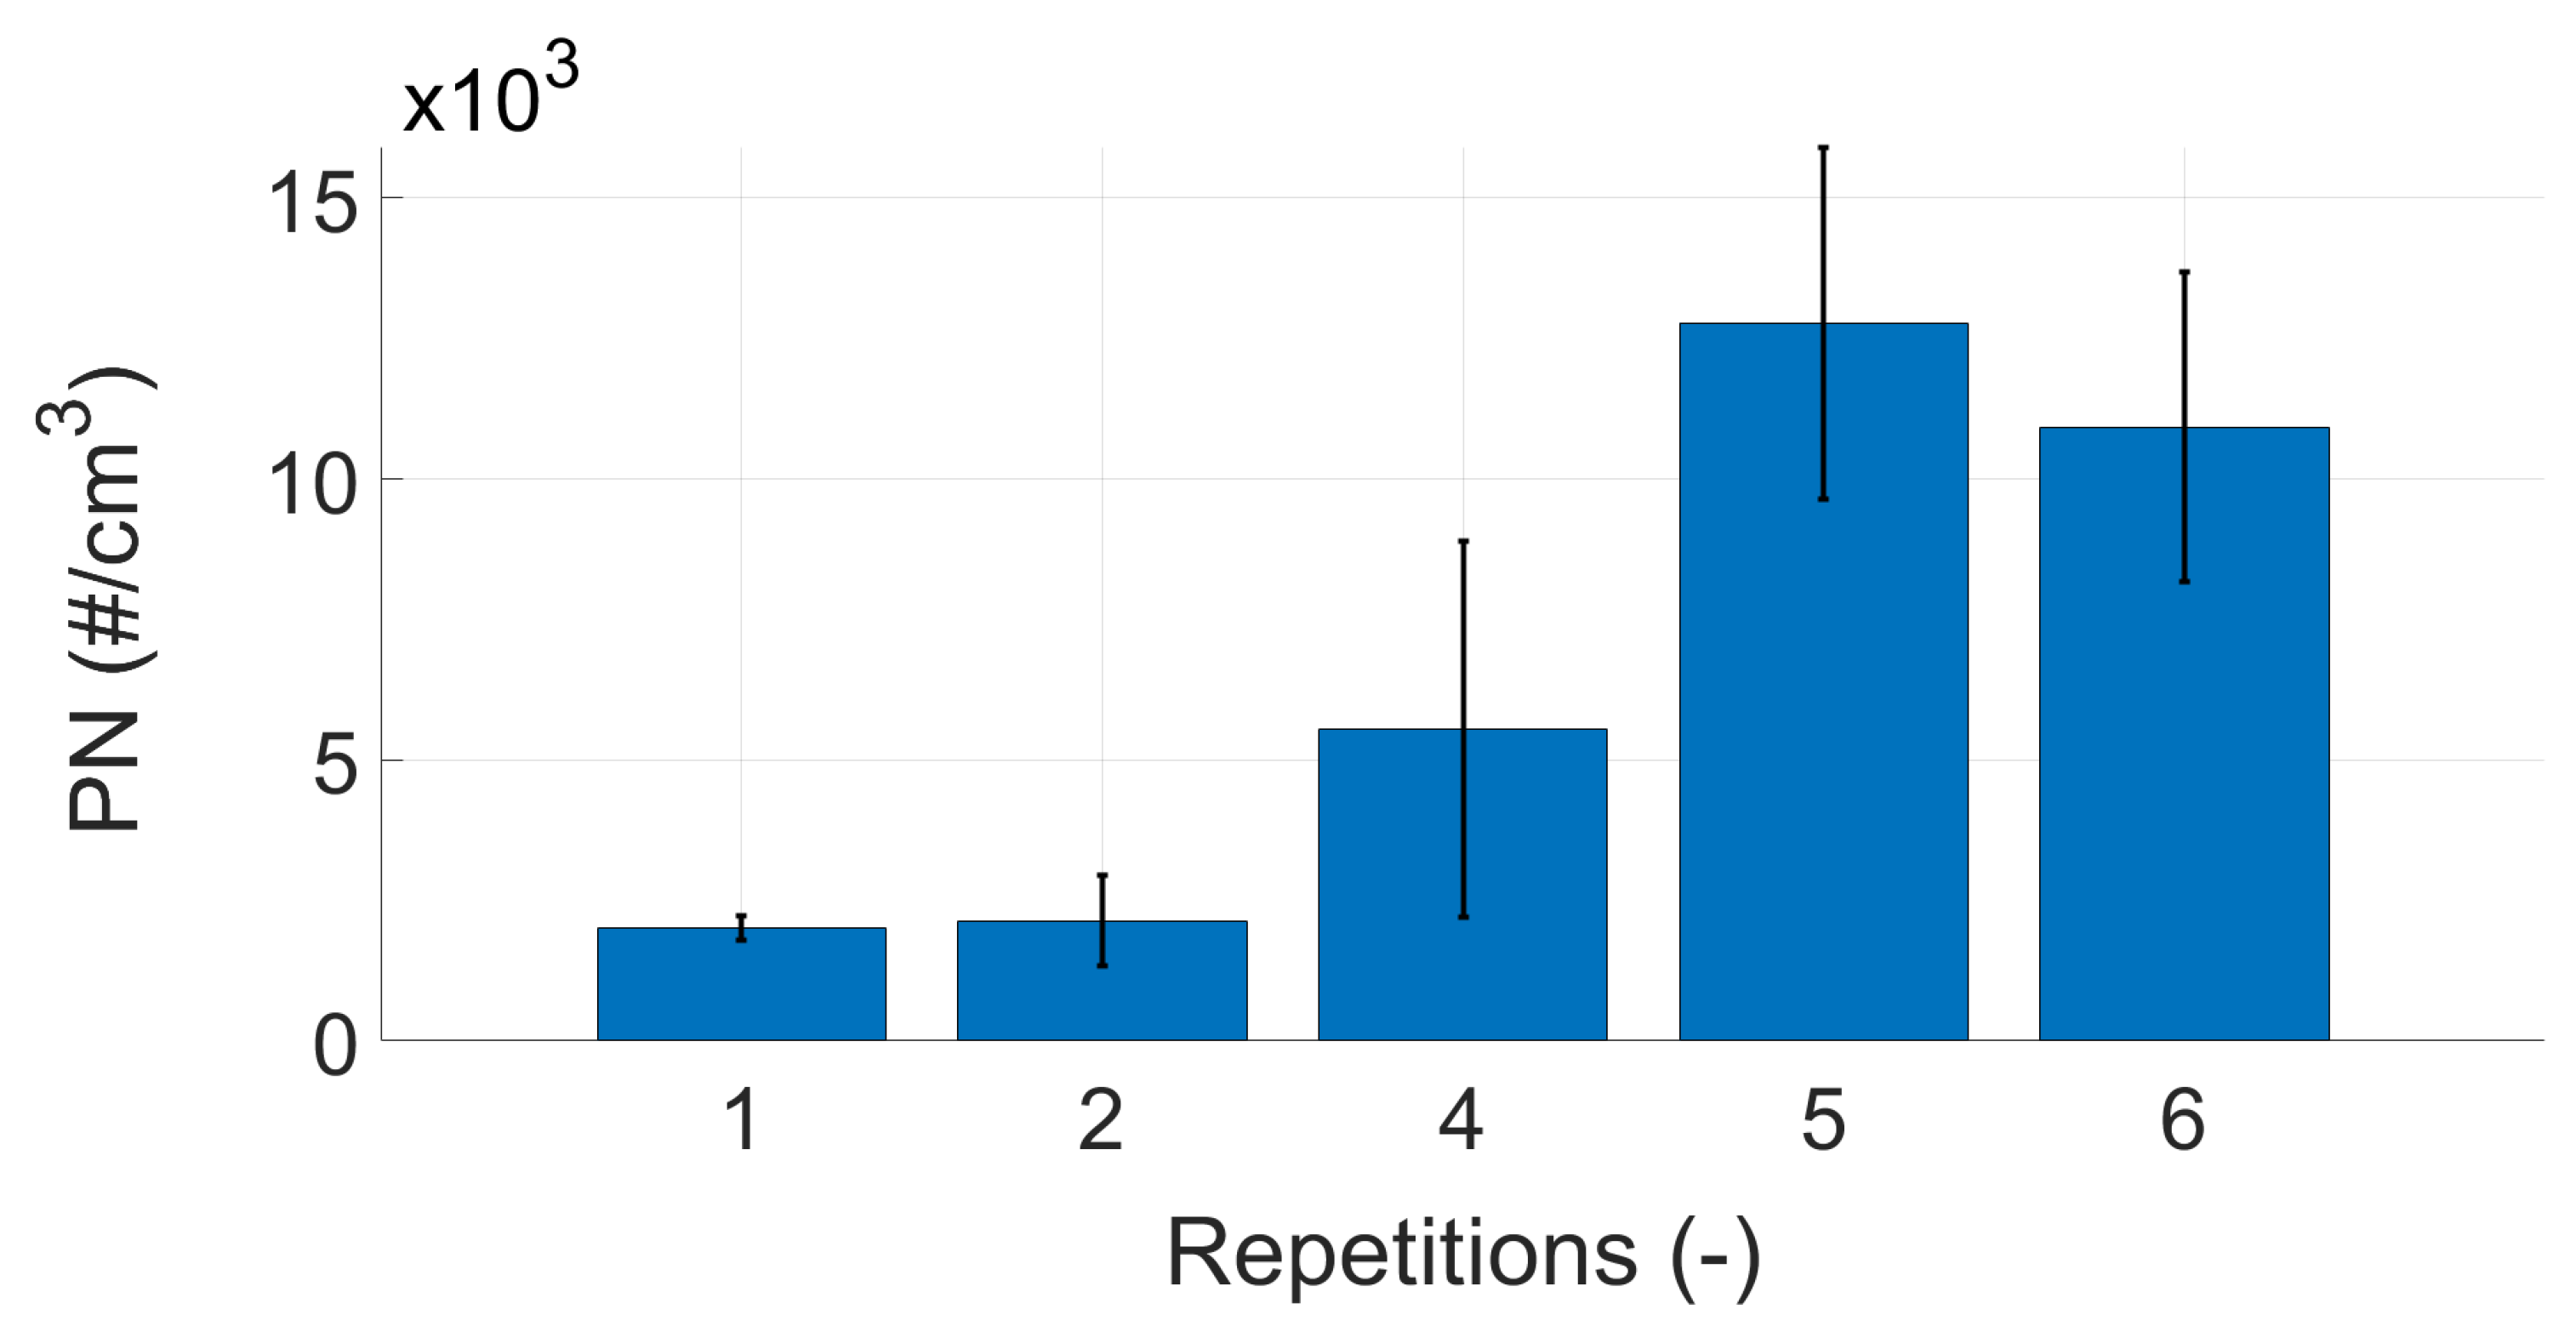
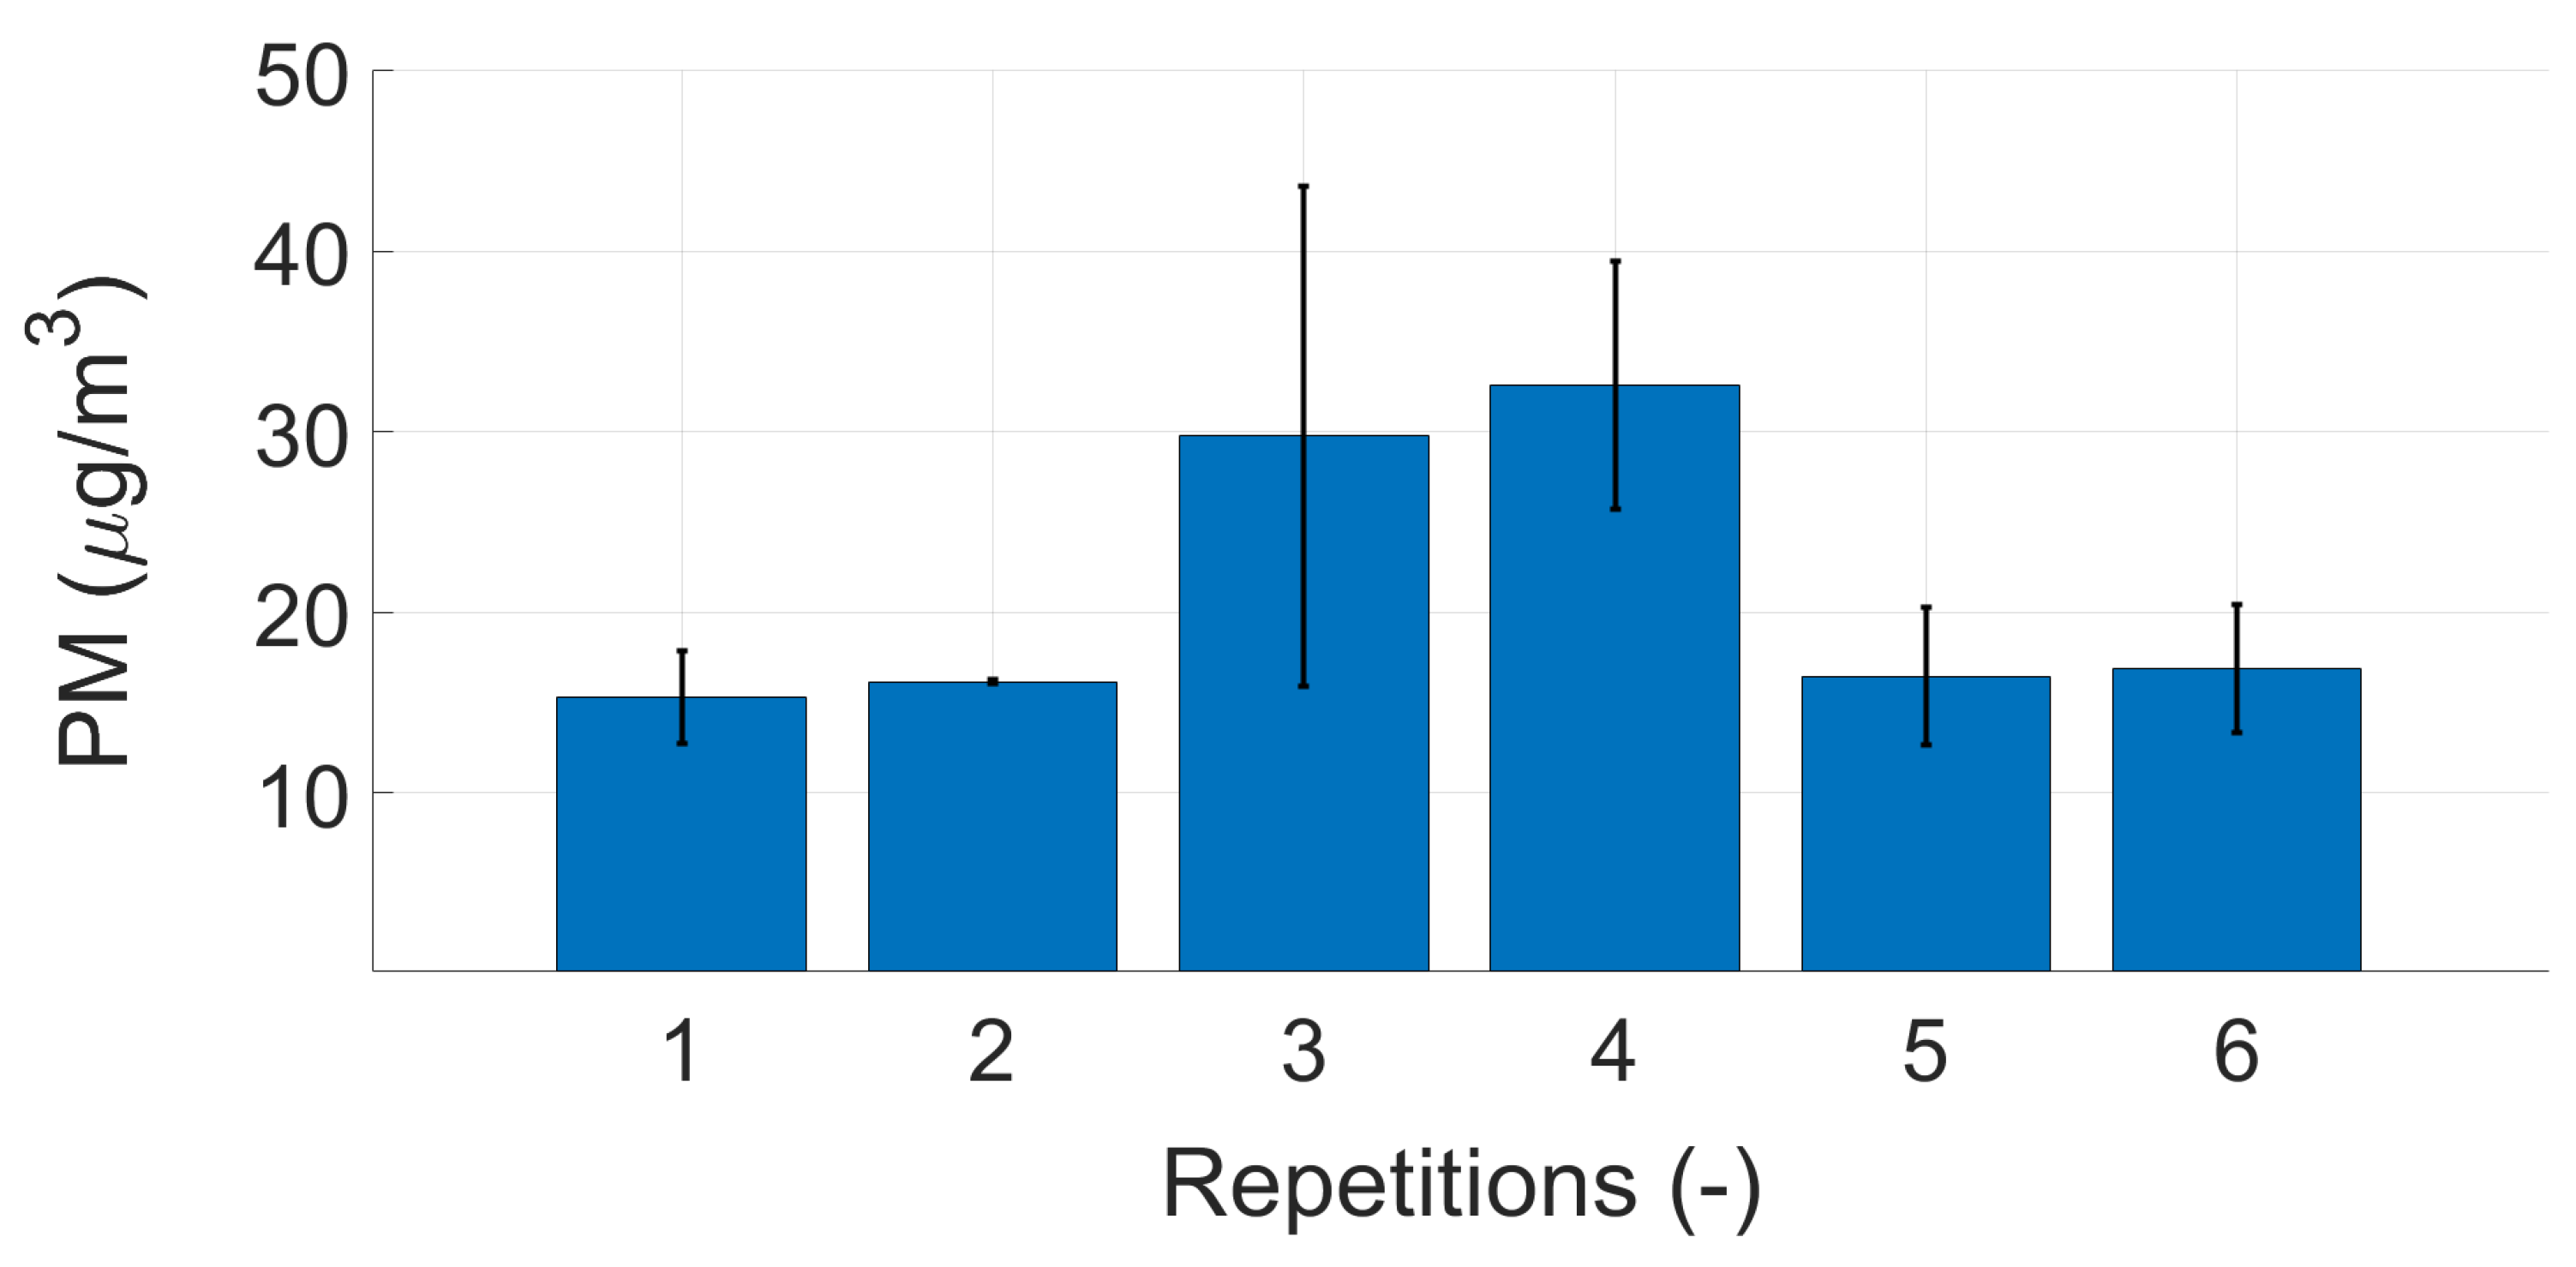
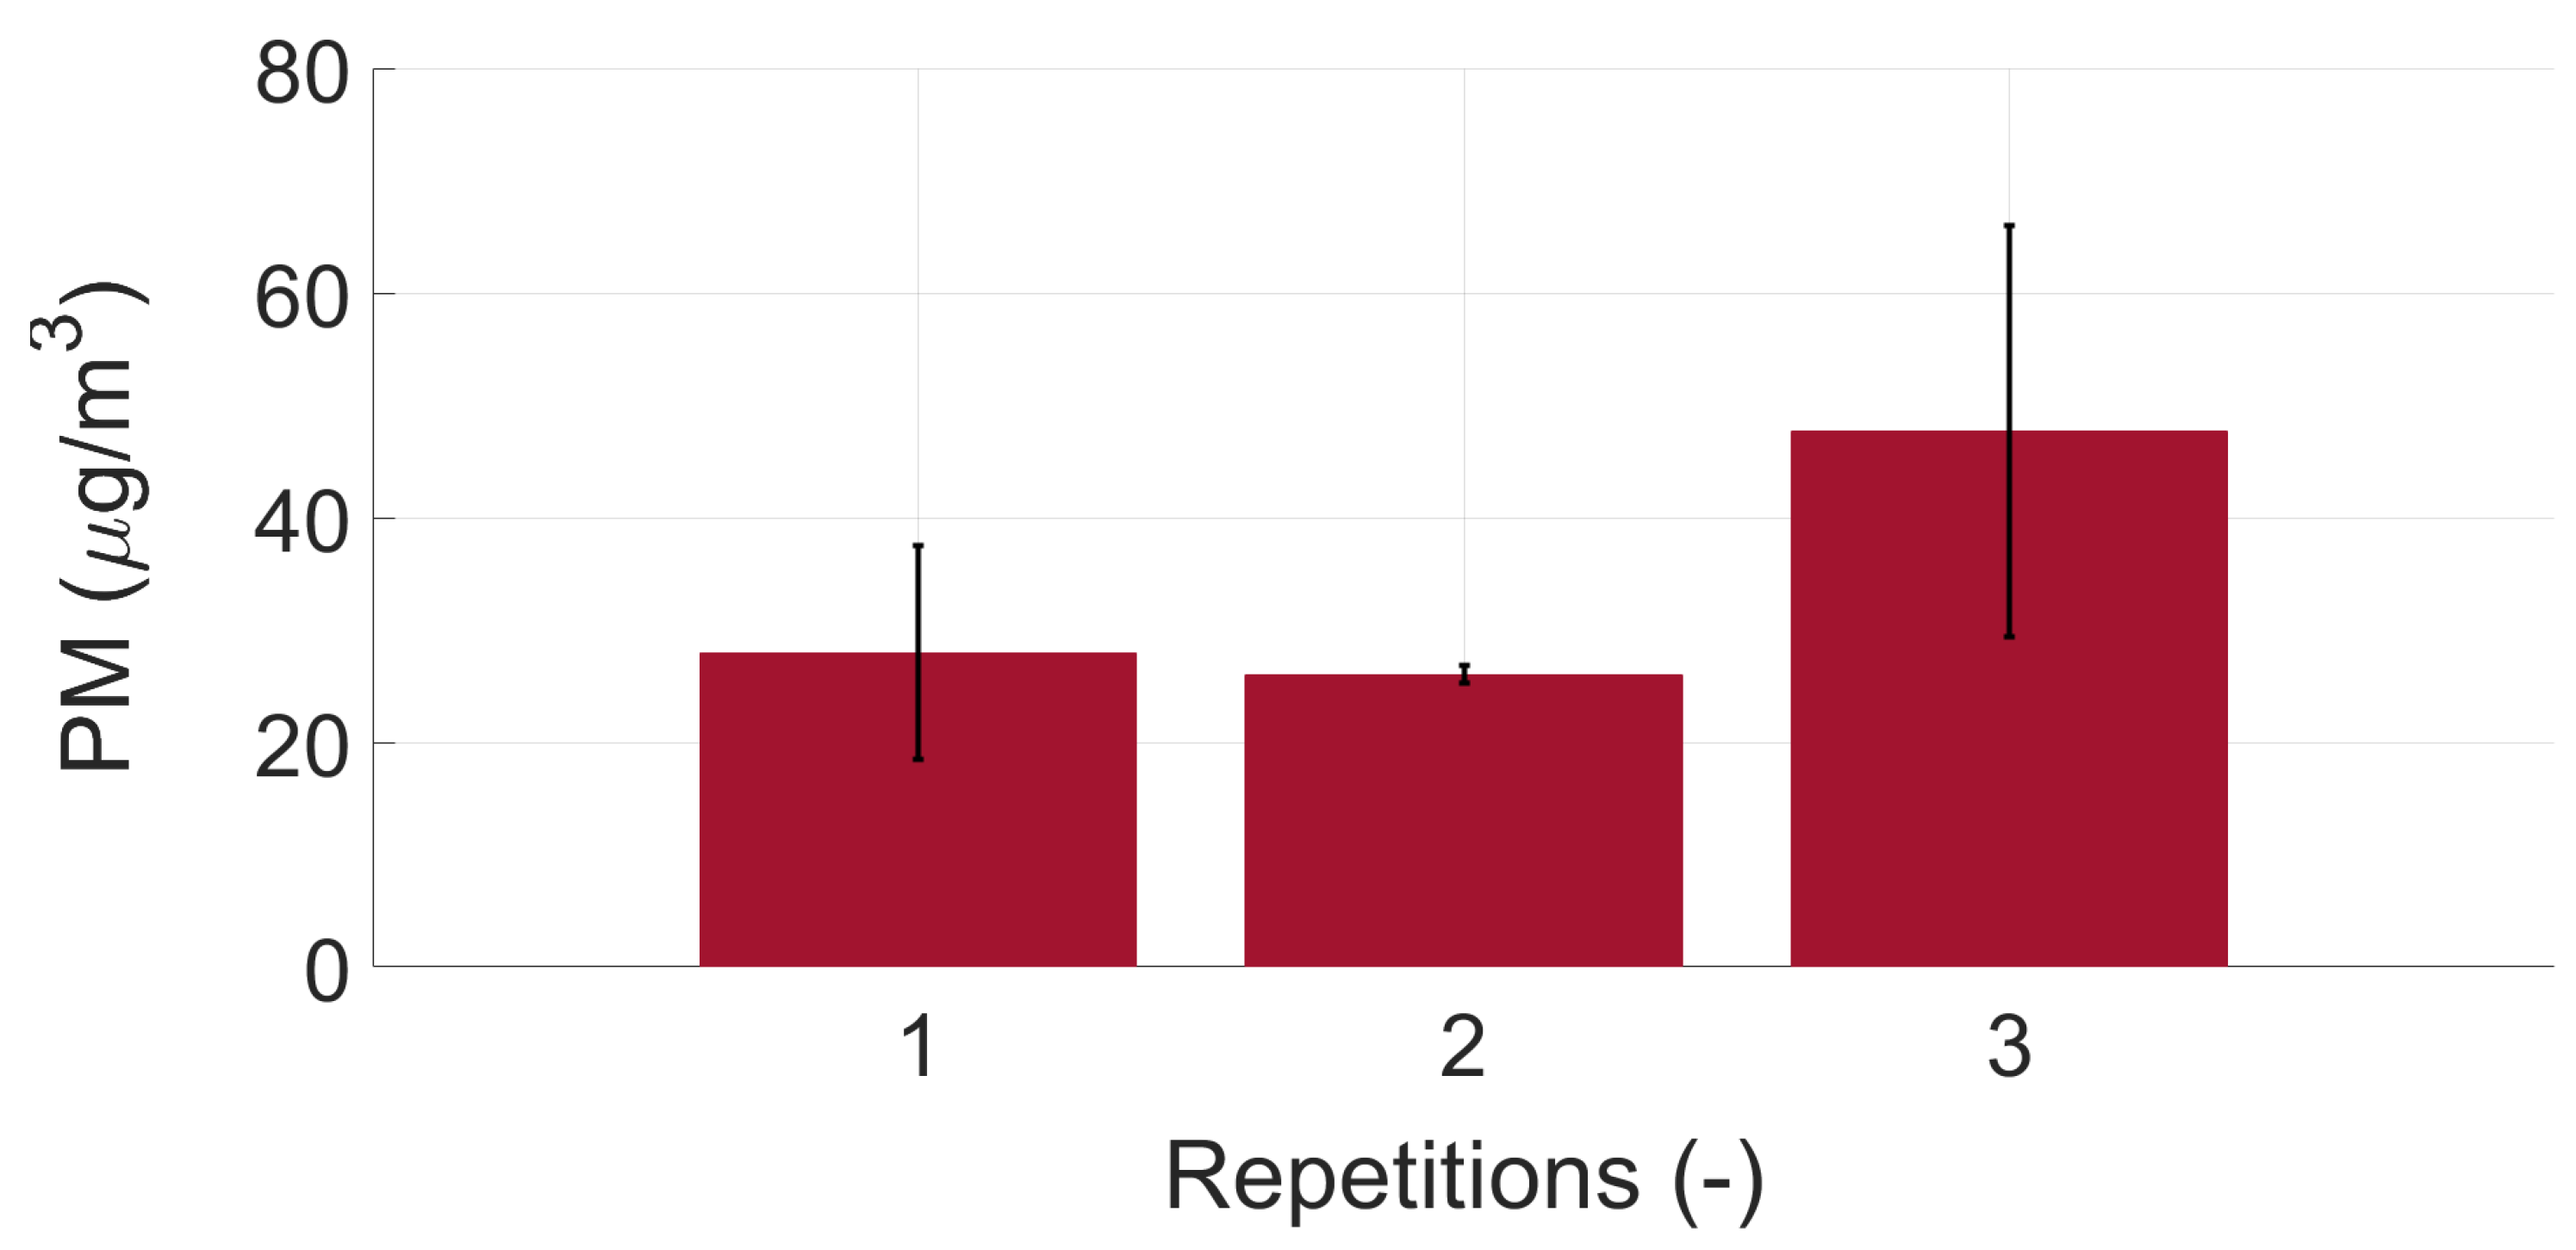
Appendix B. Repeatability Measurements

The repeatability of the particle measurements was evaluated by investigating the variation of the measured mean values for the PM and PN emissions. PM was measured using the AVL MSS and PN was measured using the CPC3750 (cut-off 7 nm).
The engine operating point for the repeatability test was 1500 RPM and 7.5 bar IMEP; λ was kept at 1 ± 0.05 for all tests. The mean values for gasoline (six repetitions) and ethanol (three repetitions) were compared. The number of repetitions is in the order of which they were tested. The tests were performed on different days and other fuels run in between these tests to consider the effects of different fuels on the particle measurements. The same conditions as in Figure 1 were applied.
The repetitions of the PN measurements can be seen in Figure A2 (gasoline) and in Figure A3 (ethanol). One of the PN measurements for gasoline (repetition 3) was considered as an outlier and was discarded from the analysis in the appended papers. Without the outlier, the variations in the mean value of PN for gasoline was considered to be within acceptable limits, however, with a slight increase in PN over time. The variation for ethanol was greater than for gasoline, but no clear increase over time was observed. The repeatability was considered to be acceptable.
Figure A2. The mean values of PN measurements of gasoline (cut-off: 7 nm) without the outlier.
Atmosphere 12 01493 g0a2
Figure A3. The mean values of PN measurements of ethanol (cut-off: 7 nm).
Atmosphere 12 01493 g0a3
The mean values of the PM measurements for gasoline and ethanol are presented in Figure A4 and Figure A5, respectively. For gasoline, the mean PM values were relatively close, with one discrepancy for repetition 4. For ethanol, all the mean values were comparable. The variation in PM was less than in PN for both fuels.
Figure A4. The mean values of PM measurements of gasoline.
Atmosphere 12 01493 g0a4
Figure A5. The mean values of PM measurements of ethanol.
Atmosphere 12 01493 g0a5

References

  1. Rönkkö, T.; Kuuluvainen, H.; Karjalainen, P.; Keskinen, J.; Hillamo, R.; Niemi, J.V.; Pirjola, L.; Timonen, H.J.; Saarikoski, S.; Saukko, E.; et al. Traffic is a major source of atmospheric nanocluster aerosol. Proc. Natl. Acad. Sci. USA 2017, 114, 7549–7554. [Google Scholar] [CrossRef] [PubMed] [Green Version]
  2. Leach, F.; Knorsch, T.; Laidig, C.; Wiese, W. A Review of the Requirements for Injection Systems and the Effects of Fuel Quality on Particulate Emissions from GDI Engines. In International Powertrains, Fuels & Lubricants Meeting; SAE International: Warrendale, PA, USA, 2018. [Google Scholar] [CrossRef]
  3. Becker, S.; Soukup, J.M.; Sioutas, C.; Cassee, F.R. Response of human alveolar macrophages to ultrafine, fine, and coarse urban air pollution particles. Exp. Lung Res. 2003, 29, 29–44. [Google Scholar] [CrossRef] [PubMed]
  4. European Vehicle Emissions Standards—Euro 7 for Cars, Vans, Lorries and Buses. Available online: https://ec.europa.eu/info/law/better-regulation/have-your-say/initiatives/12313-European-vehicle-emissions-standards-Euro-7-for-cars-vans-lorries-and-buses_en/ (accessed on 18 May 2021).
  5. Joshi, A. Review of Vehicle Engine Efficiency and Emissions; SAE WCX Digital Summit; SAE International: Warrendale, PA, USA, 2021. [Google Scholar]
  6. Raza, M.; Chen, L.; Leach, F.; Ding, S. A Review of Particulate Number (PN) Emissions from Gasoline Direct Injection (GDI) Engines and Their Control Techniques. Energies 2018, 6, 1417. [Google Scholar] [CrossRef] [Green Version]
  7. Seong, H.; Choi, S.; Zaluzec, N.J.; Lee, S.; Wu, T.; Shao, H.; Remias, J.E. Identification of engine oil-derived ash nanoparticles and ash formation process for a gasoline direct-injection engine. Environ. Pollut. 2021, 272, 116390. [Google Scholar] [CrossRef]
  8. Abdul-Khalek, I.S.; Kittelson, D.B.; Graskow, B.R.; Wei, Q. Diesel Exhaust Particle Size: Measurement Issues and Trends. In International Congress & Exposition; SAE International: Warrendale, PA, USA, 1998. [Google Scholar] [CrossRef]
  9. Miller, A.L.; Stipe, C.B.; Habjan, M.C.; Ahlstrand, G.G. Role of Lubrication Oil in Particulate Emissions from a Hydrogen-Powered Internal Combustion Engine. Environ. Sci. Technol. 2007, 41, 6828–6835. [Google Scholar] [CrossRef]
  10. Khuong, L.S.; Masjuki, H.H.; Zulkifli, N.W.M.; Mohamad, E.N.; Kalam, M.A.; Alabdulkarem, A.; Arslan, A.; Mosarof, M.H.; Syahir, A.Z.; Jamshaid, M. Effect of gasoline–bioethanol blends on the properties and lubrication characteristics of commercial engine oil. RSC Adv. 2017, 7, 15005–15019. [Google Scholar] [CrossRef] [Green Version]
  11. Di Iorio, S.; Lazzaro, M.; Sementa, P.; Vaglieco, B.M.; Catapano, F. Use of Renewable Oxygenated Fuels in Order to Reduce Particle Emissions from a GDI High Performance Engine. In SAE 2011 World Congress & Exhibition; SAE International: Warrendale, PA, USA, 2011. [Google Scholar] [CrossRef]
  12. Price, P.; Twiney, B.; Stone, R.; Kar, K.; Walmsley, H. Particulate and Hydrocarbon Emissions from a Spray Guided Direct Injection Spark Ignition Engine with Oxygenate Fuel Blends. In SAE World Congress & Exhibition; SAE International: Warrendale, PA, USA, 2007. [Google Scholar] [CrossRef] [Green Version]
  13. Karavalakis, G.; Short, D.; Vu, D.; Russell, R.L.; Asa-Awuku, A.; Jung, H.; Johnson, K.C.; Durbin, T.D. The impact of ethanol and iso-butanol blends on gaseous and particulate emissions from two passenger cars equipped with spray-guided and wall-guided direct injection SI (spark ignition) engines. Energy 2015, 82, 168–179. [Google Scholar] [CrossRef] [Green Version]
  14. Anselmi, P.; Matrat, M.; Starck, L.; Duffour, F. Combustion characteristics of oxygenated fuels Ethanol-and Butanol-gasoline fuel blends, and their impact on performance, emissions and Soot Index. In 2019 JSAE/SAE Powertrains, Fuels and Lubricants; SAE International: Warrendale, PA, USA, 2019. [Google Scholar] [CrossRef]
  15. Wang, C.; Xu, H.; Herreros, J.M.; Wang, J.; Cracknell, R. Impact of fuel and injection system on particle emissions from a GDI engine. Appl. Energy 2014, 132, 178–191. [Google Scholar] [CrossRef] [Green Version]
  16. Di Iorio, S.; Lazzaro, M.; Sementa, P.; Vaglieco, B.M.; Catapano, F. Particle Size Distributions from a DI High Performance SI Engine Fuelled with Gasoline-Ethanol Blended Fuels. In Proceedings of the 10th International Conference on Engines & Vehicles, Warrendale, PA, USA, 11 September 2011; SAE International: Warrendale, PA, USA, 2011. [Google Scholar] [CrossRef]
  17. Qin, J.; Li, X.; Pei, Y. Effects of Combustion Parameters and Lubricating Oil on Particulate Matter Emissions from a Turbo-Charged GDI Engine Fueled with Methanol/Gasoline Blends. In Proceedings of the SAE 2014 International Powertrain, Fuels & Lubricants Meeting, Warrendale, PA, USA, 13 October 2014; SAE International: Warrendale, PA, USA, 2014. [Google Scholar] [CrossRef]
  18. Wang, X.; Ge, Y.; Liu, L.; Peng, Z.; Hao, L.; Yin, H.; Ding, Y.; Wang, J. Evaluation on toxic reduction and fuel economy of a gasoline direct injection- (GDI-) powered passenger car fueled with methanol–gasoline blends with various substitution ratios. Appl. Energy 2015, 157, 134–143. [Google Scholar] [CrossRef]
  19. Yu, X.; Guo, Z.; He, L.; Dong, W.; Sun, P.; Shi, W.; Du, Y.; He, F. Effect of gasoline/n-butanol blends on gaseous and particle emissions from an SI direct injection engine. Fuel 2018, 229, 1–10. [Google Scholar] [CrossRef]
  20. Vojtisek-Lom, M.; Beranek, V.; Stolcpartova, J.; Pechout, M.; Klir, V. Effects of n-Butanol and Isobutanol on Particulate Matter Emissions from a Euro 6 Direct-injection Spark Ignition Engine During Laboratory and on-Road Tests. SAE Int. J. Engines 2015, 8, 2338–2350. [Google Scholar] [CrossRef]
  21. Larsson, T.; Prasath, A.; Olofsson, U.; Erlandsson, A. Undiluted Measurement of sub 10 nm Non-Volatile and Volatile Particle Emissions from a DISI Engine Fueled with Gasoline and Ethanol. In SAE WCX Digital Summit; SAE International: Warrendale, PA, USA, 2021. [Google Scholar]
  22. Salamanca, M.; Sirignano, M.; D’Anna, A. Particulate Formation in Premixed and Counter-flow Diffusion Ethylene/Ethanol Flames. Energy Fuels 2012, 26, 6144–6152. [Google Scholar] [CrossRef]
  23. Lee, Z.; Park, S. Particulate and gaseous emissions from a direct-injection spark ignition engine fueled with bioethanol and gasoline blends at ultra-high injection pressure. Renew. Energy 2020, 149, 80–90. [Google Scholar] [CrossRef]
  24. Bonatesta, F.; Chiappetta, E.; La Rocca, A. Part-load particulate matter from a GDI engine and the connection with combustion characteristics. Appl. Energy 2014, 124, 366–376. [Google Scholar] [CrossRef] [Green Version]
  25. Lyyränen, J.; Jokiniemi, J.; Kauppinen, E.I.; Backman, U.; Vesala, H. Comparison of Different Dilution Methods for Measuring Diesel Particle Emissions. Aerosol Sci. Technol. 2004, 38, 12–23. [Google Scholar] [CrossRef]
  26. Suresh, A.; Johnson, J.H. A Study of the Dilution Effects on Particle Size Measurement from a Heavy-Duty Diesel Engine with EGR. In SAE 2001 World Congress; SAE International: Warrendale, PA, USA, 2001. [Google Scholar] [CrossRef]
  27. Kayes, D.; Hochgreb, S. Investigation of the Dilution Process for Measurement of Particulate Matter from Spark-Ignition Engines. In International Fall Fuels and Lubricants Meeting and Exposition; SAE International: Warrendale, PA, USA, 1998. [Google Scholar] [CrossRef]
  28. Alozie, N.S.; Peirce, D.; Lindner, A.; Winklmayr, W.; Ganippa, L. Influence of Dilution Conditions on Diesel Exhaust Particle Measurement Using a Mixing Tube Diluter. In SAE 2014 World Congress & Exhibition; SAE International: Warrendale, PA, USA, 2014. [Google Scholar] [CrossRef]
  29. Dekati. Dekati Diluter. 2020. Available online: https://www.dekati.com/wp-content/uploads/dekatidiluterservices.pdf (accessed on 1 February 2021).
  30. Bernemyr, H.; Erlandsson, A. Comparison of Two Dilution and Conditioning Systems for Particle Number Measurements along the Exhaust After-Treatment System of an HD Diesel Engine. In SAE WCX Digital Summit; SAE International: Warrendale, PA, USA, 2021. [Google Scholar] [CrossRef]
  31. Dekati. Dekati High Temperature ELPI+. 2018. Available online: https://www.dekati.com/products/high-temperature-elpi/ (accessed on 1 February 2021).
  32. Babazadeh Shayan, S.; Seyedpour, S.M.; Ommi, F. Effect of oxygenates blending with gasoline to improve fuel properties. Chin. J. Mech. Eng. 2012, 25, 792–797. [Google Scholar] [CrossRef]
  33. Perricone, G.; Matĕjka, V.; Alemani, M.; Wahlström, J.; Olofsson, U. A Test Stand Study on the Volatile Emissions of a Passenger Car Brake Assembly. Atmosphere 2019, 10, 263. [Google Scholar] [CrossRef] [Green Version]
  34. Hinds, W.C. Aerosol Technology: Properties, Behavior, and Measurement of Airborne Particles; John Wiley & Sons, Incorporated: Hoboken, NJ, USA, 1999. [Google Scholar]
  35. Vanhanen, J.; Svedberg, M.; Miettinen, E.; Salo, J.P.; Väkevä, M. Dekati Diluter Characterization in the 1-20 nm Particle Size Range. 2017. Available online: https://www.researchgate.net/publication/319416891_Dekati_Diluter_characterization_in_the_1-20_nm_particle_size_range (accessed on 1 February 2021).
  36. Giechaskiel, B.; Schindler, W.; Jörgl, H.; Vescoli, V.; Bergmann, A.; Silvis, W. Accuracy of Particle Number Measurements from Partial Flow Dilution Systems. In Proceedings of the 10th International Conference on Engines Vehicles, Warrendale, PA, USA, 11 September 2011; SAE International: Warrendale, PA, USA, 2011. [Google Scholar] [CrossRef]
  37. Leach, F.; Stone, R.; Fennell, D.; Hayden, D.; Richardson, D.; Wicks, N. Predicting the particulate matter emissions from spray-guided gasoline direct-injection spark ignition engines. Proc. Inst. Mech. Eng. Part D J. Automob. Eng. 2017, 231, 717–730. [Google Scholar] [CrossRef]
  38. Giechaskiel, B.; Arndt, M.; Schindler, W.; Bergmann, A.; Drossinos, Y.; Silvis, W. Sampling of Non-Volatile Vehicle Exhaust Particles: A Simplified Guide. SAE Int. J. Engines 2012, 5, 379–399. [Google Scholar] [CrossRef]
  39. Ferraro, F.; Russo, C.; Schmitz, R.; Hasse, C.; Sirignano, M. Experimental and numerical study on the effect of oxymethylene ether-3 (OME3) on soot particle formation. Fuel 2021, 286, 119353. [Google Scholar] [CrossRef]
  40. Hua, Y.; Liu, F.; Wu, H.; Lee, C.F.; Li, Y. Effects of alcohol addition to traditional fuels on soot formation: A review. Int. J. Engine Res. 2021, 22, 1395–1420. [Google Scholar] [CrossRef]
  41. Wei, J.; Zeng, Y.; Pan, M.; Zhuang, Y.; Qiu, L.; Zhou, T.; Liu, Y. Morphology analysis of soot particles from a modern diesel engine fueled with different types of oxygenated fuels. Fuel 2020, 267, 117248. [Google Scholar] [CrossRef]
  42. Verma, P.; Jafari, M.; Rahman, S.A.; Pickering, E.; Stevanovic, S.; Dowell, A.; Brown, R.; Ristovski, Z. The impact of chemical composition of oxygenated fuels on morphology and nanostructure of soot particles. Fuel 2020, 259, 116167. [Google Scholar] [CrossRef]
  43. Stevens, E.; Steeper, R. Piston Wetting in an Optical DISI Engine: Fuel Films, Pool Fires, and Soot Generation. In SAE 2001 World Congress; SAE International: Warrendale, PA, USA, 2001. [Google Scholar] [CrossRef] [Green Version]
  44. Liu, F.; Hua, Y.; Wu, H.; fon Lee, C.; Shi, Z. Experimental and kinetic studies of soot formation in methanol-gasoline coflow diffusion flames. J. Energy Inst. 2019, 92, 38–50. [Google Scholar] [CrossRef]
  45. Liu, F.; Hua, Y.; Wu, H.; Lee, C.F.; He, X. Effect of Alcohol Addition to Gasoline on Soot Distribution Characteristics in Laminar Diffusion Flames. Chem. Eng. Technol. 2018, 41, 897–906. [Google Scholar] [CrossRef]
  46. David, K.; Simone, H. Mechanisms of Particulate Matter Formation in Spark-Ignition Engines. 1. Effect of Engine Operating Conditions. Environ. Sci. Technol. 1999, 33, 3957–3967. [Google Scholar] [CrossRef]
  47. Camacho, J.; Lieb, S.; Wang, H. Evolution of size distribution of nascent soot in n- and i-butanol flames. Proc. Combust. Inst. 2013, 34, 1853–1860. [Google Scholar] [CrossRef]
  48. Sarathy, S.M.; Oßwald, P.; Hansen, N.; Kohse-Höinghaus, K. Alcohol combustion chemistry. Prog. Energy Combust. Sci. 2014, 44, 40–102. [Google Scholar] [CrossRef]
  49. Rönkkö, T.; Pirjola, L.; Ntziachristos, L.; Heikkilä, J.; Karjalainen, P.; Hillamo, R.; Keskinen, J. Vehicle Engines Produce Exhaust Nanoparticles Even When Not Fueled. Environ. Sci. Technol. 2014, 48, 2043–2050. [Google Scholar] [CrossRef]
  50. Phosphorus—US Environmental Protection Agency. Available online: https://www.epa.gov/sites/default/files/2016-09/documents/phosphorus.pdf (accessed on 27 October 2021).
  51. Gordon, T.; Chen, L.; Fine, J.; Schlesinger, R.; Su, W.; Kimmel, T.; MO, A. Pulmonary effects of inhaled zinc oxide in human subjects, guinea pigs, rats, and rabbits. Am. Ind. Hyg. Assoc. J. 1992, 53, 503–509. [Google Scholar] [CrossRef] [PubMed]
Figure 1. Schematic figure of the experimental setup used including temperatures, where, m air is the mass air flow, m fuel is the mass fuel flow, P cyl is the in-cylinder pressure, T exh is the exhaust temperature, λ is the excess air ratio and T after TWC is the temperature after the TWC. The value of 345 °C is the temperature measured at the outlet of the first diluter stage, and 40 °C is the temperature measured at the outlet of the second diluter stage.
Atmosphere 12 01493 g001
Figure 2. The engine test points marked for all tested fuels in terms of load (IMEP) and engine speed (RPM). All fuels were tested at two different load conditions and three different engine speeds for each load condition.
Atmosphere 12 01493 g002
Figure 3. The injection parameters for all tested fuels at different operating points: (a) injection pressure and (b) injection duration. The error bars show the standard deviation ( ± σ ).
Atmosphere 12 01493 g003
Figure 4. The particle number emissions at different cut-off sizes and different operating conditions measured using the CPCs. The dashed lines show the concentration limit for the CPCs with cut-offs at 23 nm and 10 nm. The error bars show the normalised random error ( ± ϵ ). (a) 1500 RPM, 7.5 bar IMEP, (b) 1500 RPM, 13 bar IMEP,(c) 2500 RPM, 7.5 bar IMEP, (d) 2500 RPM, 13 bar IMEP, (e) 3500 RPM, 7.5 bar IMEP and (f) 3500 RPM, 13 bar IMEP.
Atmosphere 12 01493 g004
Figure 5. Particle emissions measured using the CPCs (cut-off 23, 10 and 7 nm) compared to the (a) DVPE and (b) C/O-ratio of the fuels. No value for C/O-ratio is displayed for gasoline as its oxygen content was 0 vol-%. The error bar show the normalised random error ( ± ϵ ).
Atmosphere 12 01493 g005
Figure 6. The total particle size distribution for (a) gasoline, (b) MTBE, (c) ethanol, (d) methanol, (e) n-butanol and (f) iso-butanol at low-load conditions. The shadowed areas show the normalised random error ( ± ϵ ).
Atmosphere 12 01493 g006
Figure 7. The total particle size distribution for particle emissions for (a) gasoline, (b) MTBE, (c) ethanol, (d) methanol, (e) n-butanol and (f) iso-butanol at 1500 RPM and 13 bar IMEP. The shadowed areas show the normalised random error ( ± ϵ ).
Atmosphere 12 01493 g007
Figure 8. The total particle size distribution for particle emissions for (a) gasoline, (b) MTBE, (c) ethanol, (d) methanol, (e) n-butanol and (f) iso-butanol at 3500 RPM and 13 bar IMEP. The shadowed areas show the normalised random error ( ± ϵ ).
Atmosphere 12 01493 g008aAtmosphere 12 01493 g008b
Figure 9. A comparison of the total number and particle size distribution between the undiluted (HT-ELPI+) and the diluted (CPC) particle number measurements at (a) 3500 RPM and 7.5 bar IMEP and (b) 1500 RPM and 13 bar IMEP.
Atmosphere 12 01493 g009
Figure 10. Elemental composition of the particles from the HT-ELPI+ filters: (a) zinc and (b) phosphorus.
Atmosphere 12 01493 g010
Table 1. Specifications of the test engine used, Volvo Cars T6 DISI engine.
Displacement volume1969 cc
Stroke93.2 mm
Bore82 mm
Connecting rod143.8 mm
Compression ratio10.3
Number of cylinders4 (inline)
Peak power225 kW (5700 RPM)
Peak injection pressure200 bar
Table 2. Properties of the tested oxygenated biofuels.
FuelRON (-)MON (-)DVPE (kPa)LHV (MJ/kg)Oxygen Content (wt-%)
Gasoline93.784.952.5430
Ethanol107.289.516.526.834.7
Methanol10888.730.919.749.9
N-butanol9884.7<9.0 (2.3)33.121.6
I-butanol104.689.6<9.0 (1.8)33.221.6
MTBE116 [32]101 [32]53.638.218.2
Table 3. Sensor measurement range and uncertainty.
MeasurementSensorRangeUncertainty
( ± % FS)
In-cylinder pressureKistler 6045A324200–250 Bar0.4
Kistler Noridc AB,
Jonsered, Sweden
LambdaBosch O2-sensor LSU 4.90.65–∞0.7 ( λ = 1)
Via National Instruments,
Budapest, Hungary
CO emissionsHoriba MEXA-71000–7000 ppm
HC emissionsHoriba Europe,0–5000 ppm2
NOx emissionsGuthenburg, Sweden0–5000 ppm
Particle number ≥ 23 nmTSI CPC3010≤10,000 #/cm310
TSI Europe,
Aachen, Germany
Particle number ≥ 10 nmTSI CPC3772≤10,000 #/cm310
TSI Europe,
Aachen, Germany
Particle number ≥ 7 nmTSI CPC3750≤10 5 #/cm35
TSI Europe,
Aachen, Germany
Particle size distributionDekati HT-ELPI+6 nm–10 μm20
Dekati,
Kangasala, Finland
Publisher’s Note: MDPI stays neutral with regard to jurisdictional claims in published maps and institutional affiliations.

