1. Introduction
The recently released Sixth Assessment Report of the Intergovernmental Panel on Climate Change (IPCC) reported that the global surface temperature in the second decade of the 21st century (2011–2020) was 1.09 °C (the likely range is 0.95~1.20 °C) higher than that of 1850–1900, within which the anthropogenic warming is 1.07 °C [
1]. In China, the observational warming trend is 0.121 °C per decade from 1900 to 2015 [
2]. Extreme temperature events have been observed to increase more rapidly than the mean temperature. Averaged over China, the annually hottest day has a warming trend ranging from 0.13 °C to 0.19 °C per decade over 1961–2009, and the trend is most significant in central China with a value of 0.4 °C per decade [
3]. Global warming is persistent, and its magnitude largely depends on the ongoing climate mitigation strategy, which is represented as different emission scenarios in climate projections [
1].
Aviation operations are significantly affected by weather conditions, such as clear-air turbulence, lightning strikes, heavy precipitation, and hot days [
4,
5,
6,
7,
8]. Weather is responsible for a large portion of passenger delays and enormous revenue lost per year for the aviation sector [
9,
10]. Under global warming, the atmospheric general circulation and weather are projected to change. The aviation sector is aware that these changes may have considerable impacts [
11]. For example, higher temperature maxima at ground lead to significant decreases in air density and the lift force of departing aircraft; the changes in the prevailing jet may modify optimal flight routes, journey times, and fuel consumption; and the changes of wind shear and atmospheric stability at cruising levels may increase the likelihood of clear-air turbulence breaking out [
12,
13,
14].
Among the possible pathways of climatic impacts on aviation, the reduction in takeoff weight by the increase in surface temperature is perhaps the most robust and consistent one [
11]. In a warmer climate, the reduction in air density results in less lifting forces on aircraft at a given speed. Given a fixed runway length, this leads to a reduction in takeoff weight by removing either passengers or cargo. There are only limited studies that evaluated the impact of global warming on aircraft takeoff performance, for example, the number of weight-restriction days for a specific weight reduction threshold for several airports in the United States [
12,
15] and China [
16].
In this study, we examine the impact of global warming on aircraft takeoff performance at 53 airports in China. Compared with previous studies [
12,
16], the observational data of this study have better representativeness, the number of examined airports is much larger, and the quantification of climate impacts is improved. For each airport, there is a critical temperature above which the takeoff weight decreases significantly with the increase in air temperature. We examine the number of days with a daily maximum temperature exceeding the critical temperature for both the present and warmer climate. We also evaluate the weight reduction per year as the climate warms. The results help us better understand the impact of climate change on aviation and better plan for the corresponding climate adaptation.
2. Materials and Methods
This study is based on analyses of 53 major-city airports (
Table S1), which cover most regions in China. The selection of these airports is limited by the availability of instrumental data and airport parameters. At each airport, 9-years (2012–2020) observational records of daily maximum surface air temperature from aerodrome reports [
17], measured by instruments at the airport, provide a present climatology of the aircraft takeoff temperature. Since the reduction in aircraft takeoff weight is affected by high temperature, we focus on the extended summer months (May–September) following the previous study [
15].
Climate simulations from 22 models in the CMIP6 archive (
Table S2) are used to estimate the increase in summer temperature by the end of the century. Two time periods are considered for the CMIP6 simulations. The historical simulations between 2005 and 2014 represent the present climate and are compared with the observational data. Note that the years between the simulations and observations do not exactly match each other, since the historical simulations in CMIP6 end in 2014. However, these simulations shall be sufficient to provide a reasonable climatology of the present climate. The SSP5-8.5 scenario simulations between 2091 and 2100 represent the future warmer climate. For a stronger signal-to-noise ratio, here we examine the high emission scenario of SSP5-8.5, in which climate warming is stronger than that suggested by the Paris Climate Agreement [
1]. However, the climate response of local surface air temperature is reasonably linear with the global mean warming, and it is easy to convert our results for a less warming scenario.
There are systematic biases in the climate simulations. To remove the biases in the daily maximum temperature in climate simulations, we use a correction procedure with observational data following previous studies [
12,
16]. Briefly, we separate the observed and modeled historical temperature distributions at each airport into 20 five-percentile bins, and the mean bias between the modeled and observed temperature in each bin is subtracted from the model data. This correction is performed for each CMIP6 model, and the corrected model data are then averaged to form a multi-model mean. After correction, the simulated and observed daily maximum temperatures match each other well (
Figure 1). Then, the same correction is applied to the simulation results of the warmer climate, providing the corrected global warming effects. The distributions of daily maximum temperature are fitted by the generalized extreme value distributions, following Zhou et al. (2018) [
16].
The maximum takeoff weight (MTW) of an aircraft depends on a couple of factors, including surface air temperature, relative surface wind, airport elevation, and runway length. To isolate the impacts of global warming, we fix all the other parameters. The relative surface wind speed is set to be zero. The dependence of MTW on surface air temperature is calculated using the Standard Takeoff Analysis Software, which is the operational software used by the airlines. The calculation has taken the elevation and runway length of each airport into account. The aircraft considered here is Boeing 737-800, which is one of the most common short-to-medium-range aircraft. It is also the same aircraft considered in previous studies [
12,
16], allowing a better comparison of the results.
3. Results
We first showcase the results of four representative airports as examples (
Figure 1). These airports are the Beijing Capital International Airport (ZBAA), the Shanghai Pudong International Airport (ZSPD), the Guangzhou Baiyun International Airport (ZGGG), and the Urumqi Diwopu International Airport (ZWWW); they are chosen because of their high traffic loads and representative locations. The lower panels in
Figure 1 show the dependence of MTW on surface air temperature at each airport. As air temperature increases, the MTW slowly decreases at first. After reaching a certain temperature, the MTW begins to decrease rapidly at a relatively constant slope. We may call it the critical temperature (
), defined as the temperature with maximum second derivative. Note that the threshold of
is less strict than the threshold temperature in previous studies, which is defined as the temperature for a weight restriction of 1000 lbs [
12,
16]. As shown in the upper panels of
Figure 1, the distributions of bias-corrected daily maximum temperature for CMIP6 historical simulations match well with those in observation. At the end of the century, global warming leads to a significant shift of the distributions to the right, along with notable modification of the shape of the distributions. It is clear that the distribution change of summer temperature under global warming will lead to a reduction in MTW.
Figure 2a shows the observed summer-mean daily maximum temperature (i.e., the mean value of the temperature probability distribution as shown in
Figure 1) at the 53 airports in China. The summer-mean daily maximum temperature shows a significant regional pattern, which is high in Southeast China and Northwest China. Under the SSP5-8.5 scenario, the summer-mean daily maximum temperature is projected to increase by 5.2 °C (the model range is 3.1–7.4 °C) averaged over China at the end of the century (
Figure 2b). The warming also demonstrates clear regional differences, with higher warming in North China and Northwest China and less warming in South China. The heterogeneous warming indicates that each airport is affected by warming with a different magnitude. Among the four airports, Urumqi has the strongest warming of 6.7 °C (the model range is 3.3–8.9 °C), and Guangzhou has the weakest warming of 4.0 °C (the model range is 2.2–6.0 °C) (
Figure 1).
Due to different parameters (i.e., elevation and runway length), the critical temperature (
) varies significantly across different airports (
Figure 3a). Overall,
is lower in West China than that in East China, largely due to the elevation differences of the airports. In
Figure 3b, we count the number of summer days that the daily maximum temperature exceeds
under the current climate; on these days, a takeoff weight restriction is needed. Note that in East China, both the summer-mean daily maximum temperature (
Figure 2a) and
(
Figure 3a) are higher than those in West China. The number of weight-restriction days is dominated by the effects of
. Thus, the distribution in
Figure 3b is anticorrelated with that in
Figure 3a. In East China, only several tens of days require weight reduction, while in West China, more than half of the summer days require weight reduction.
Figure 3c shows the number of weight-restriction days by the end of the century under the SSP5-8.5 scenario. For airports in West China, almost all summer days require weight reduction (
Figure 3c). The number increase in weight-restriction days is larger for airports in East China (
Figure 3d) because the bulk of the temperature probability distribution approaches
due to global warming. The analyses in
Figure 3 and those in previous studies [
12,
16] count the days requiring weight restriction. However, as shown in
Figure 1, the MTW is a function of temperature with different behaviors over different regimes. We will provide a more quantitative estimation of the climate impact on takeoff performance in the following.
Instead of only counting the days requiring weight restriction, we further estimate the carry capacity reduction due to global warming. Given the temperature probability distribution and the dependence of MTW on temperature, one may calculate the total MTW over the summer season. Without further knowledge, we assume that there is only one Boeing 737-800 flight each day at one airport. This total MWT represents the carrying capacity of one Boeing 737-800 during summer under the above flight-planning assumption. Modifications may easily be performed for an operational flight-planning scenario. Note that the carrying capacity includes weights of fuel and flight attendances; the effective carrying capacity for passengers and cargo is even less.
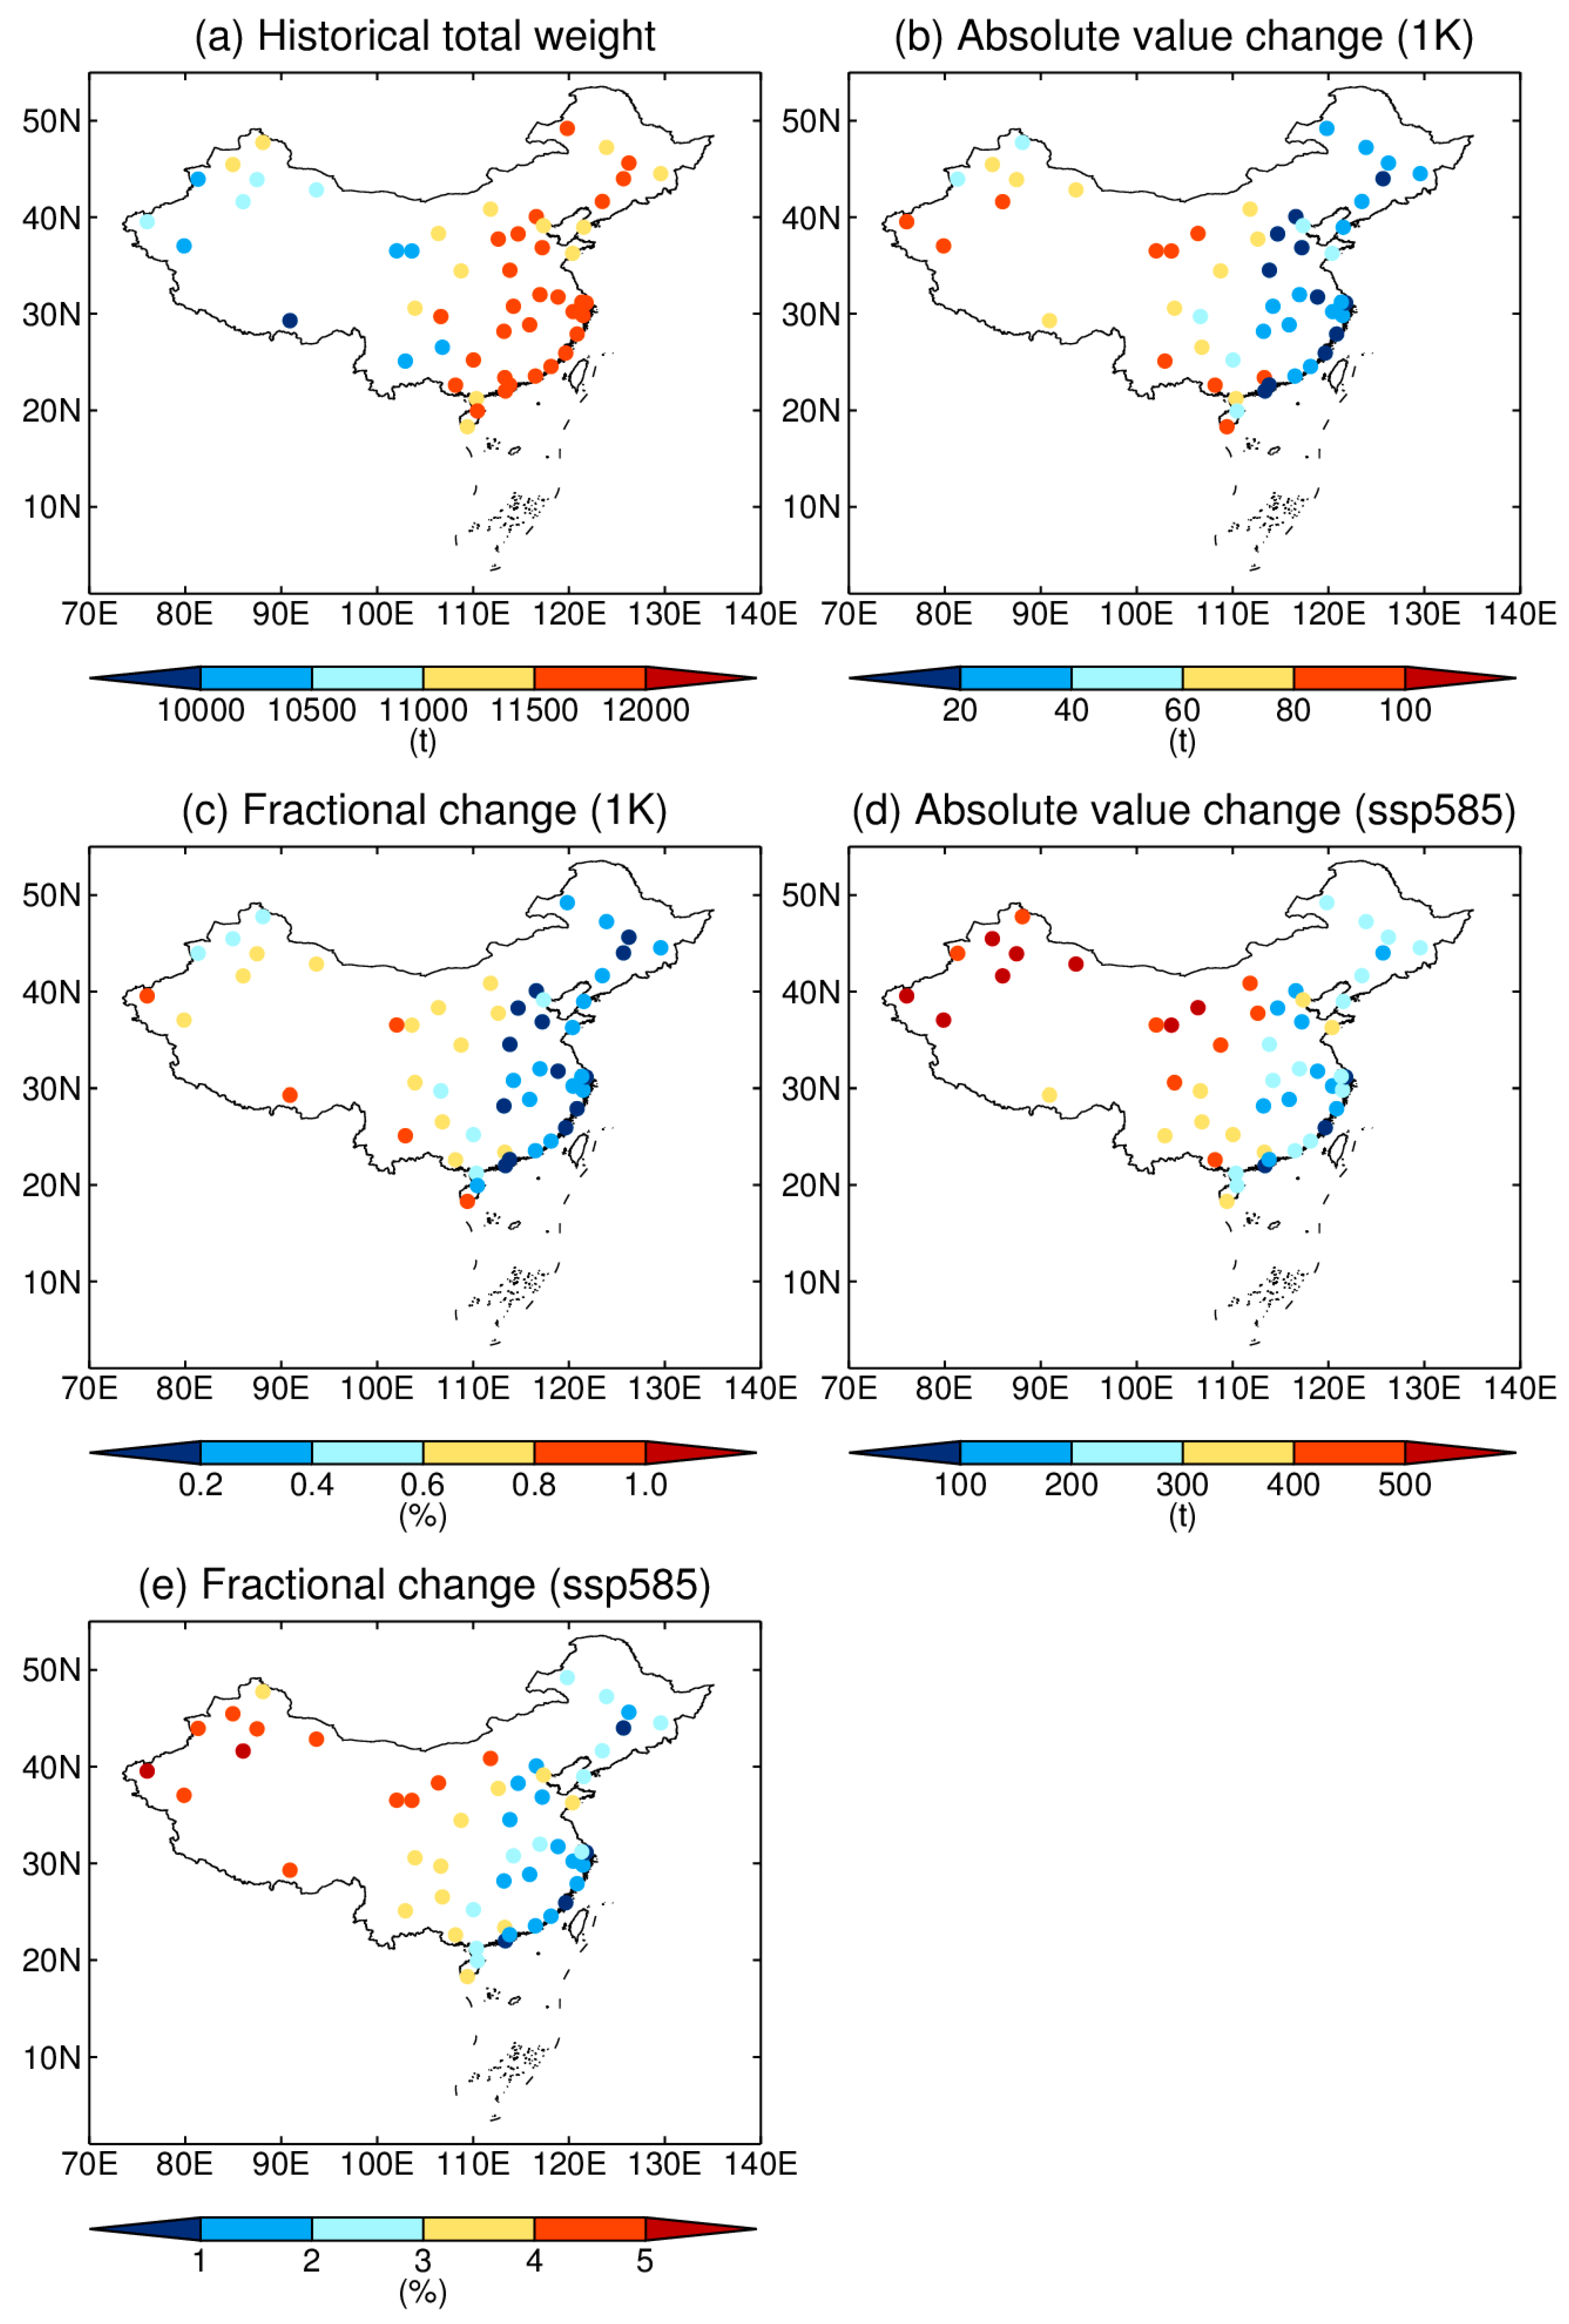
Figure 4a shows the total summer carry capacity at each airport in the current climate. The airport’s carrying capacity in East China is greater than that in West China, consistent with the higher
(
Figure 3a) and smaller numbers of weight restriction days (
Figure 3b). Averaged over all 53 airports, the total carry capacity is 11.3 kilotons (the difference between models is very small after bias correction).
Figure 4b,c shows the absolute and fractional reduction in carrying capacity if the daily maximum surface air temperature in all airports is evenly increased by 1 °C, respectively. This represents the vulnerability of carrying capacity at each airport. The carrying capacity of airports in West China is more sensitive to temperature rising (
Figure 3b,c). Averaged over all airports, the reduction is 46.6 t per degree of warming, and the factional change is 0.4%/K (
Figure 4c). Assuming an average passenger weight of 190 lb (including carry-on baggage; Federal Aviation Administration 2005 [
18]), a uniform 1 °C warming means that about 542 passengers cannot be carried per summer. Under the SSP5-8.5 scenario, by the end of the century, the total summer carry capacity will be reduced by 310.2 t (the model range is 167.9–478.1 t) and the fractional change is 2.8% (the model range is 1.5%–4.3%) averaged over the 53 airports (
Figure 4d,e). It corresponds to a reduction of 3607 (the model range is 1948–5547) passengers carried by Boeing 737-800 during summer. The airports in West China are most affected due to the higher vulnerability (
Figure 4b) and stronger warming (
Figure 2b). These estimations provide valuable information to calculate the revenue lost due to global warming.
4. Discussion
Our results highlight and quantify the impact of global warming on aircraft takeoff performance. Compared with the previous study [
16] using a single model with prescribed sea surface temperature, this study uses the multi-model data from fully coupled climate models and provides information of a wider coverage of airports in China. In addition to count the number of weight-restriction days as in previous studies [
12,
13,
15,
16], in this study, we also provide a more comprehensive quantification of the climate impact on aviation by taking the dependence of MTW on temperature into account.
There are some limitations of this study. In this paper and previous studies, only the influence of temperature on air density is considered. However, the increase in temperature leads to an increase in water vapor [
19], which further decreases air density (because the molecular weight of water vapor is smaller than that of dry air). This so-called “virtual effect” of water vapor may be important at low-latitude regions, or, at least, shall be evaluated in the future. Another factor that shall be explored in the future is the possible change of temperature diurnal cycle [
20]. The shift of temperature diurnal cycle may change the timing of high temperature requiring weight restriction, thus affecting the flight planning. Lastly, the climate projections are coarse-resolution outputs and may not well represent the climate changes of local airports. A high-resolution downscaling simulation is a feasible approach for improvement.
5. Conclusions
In this study, we investigate the impact of global warming on the aircraft takeoff performance in 53 airports in China by employing observational data and climate projections. The increase in temperature decreases the air density, and thus, reduces the maximum takeoff weight (MTW) of an aircraft. For each airport, we defined a critical temperature threshold (), above which the MTW decreases significantly with the increasing air temperature. varies among different airports due to different airport elevation and runway lengths. By the end of the century under the high emission SSP5-8.5 scenario (with average warming of 5.2 °C (the model range is 3.1–7.4 °C) in China), daily maximum temperature for nearly all summer days in West China and for about half of summer days in East China exceeds . We further examine the reduction in carrying capacity due to climate change. By the end of the century under the SSP5-8.5 scenario, the summer total carrying capacity will be reduced by about 2.8% (the model range is 1.5%–4.3%) averaged over all 53 airports. The multi-model mean reduction in carrying capacity is more significant for the airports in Western China (as large as 5%) than that in East China (~1%).
Although our results are for one type of aircraft (Boeing 737-800) and under a certain scenario, modifications may be easily carried out for other aircraft and scenarios. With the information of carrying capacity reduction, the aviation sector may assess the economic feasibility of upgrading new aircraft or extending the runway for a certain airport. Thus, the results help plan the adaptation of the aviation sector to climate change. Many nations have set up their timeline toward carbon neutrality, however, with unsettled routes. Future work may utilize a similar method to evaluate gains and costs of different carbon-neutrality routes.


