Article

Sensitivity of the Short-Range Precipitation Forecast in South China Region to Sea Surface Temperature Variations

by
Diah Valentina Lestari
1,2,† and
Xiaoming Shi
1,*
1
Division of Environment and Sustainability, The Hong Kong University of Science and Technology, Hong Kong, China
2
Department of Environmental Engineering, Faculty of Engineering, Mahasaraswati University, Denpasar 80233, Indonesia
*
Author to whom correspondence should be addressed.
Current address: Division of Environment and Sustainability, Hong Kong University of Science and Technology Clear Water Bay, Kowloon, Hong Kong, China.
Atmosphere 2021, 12(9), 1138; https://doi.org/10.3390/atmos12091138
Submission received: 22 July 2021 / Revised: 27 August 2021 / Accepted: 1 September 2021 / Published: 4 September 2021

Abstract

:
Ocean variability plays an essential role in the climate system at different time scales through air–sea interactions. Recent studies have addressed the importance of the ocean mixed layer in cooling feedback to tropical cyclones (TCs). However, using constant sea surface temperature (SST) in short-range weather forecasts remains common, especially in high-resolution regional models. This study investigates the role of subsurface ocean mixing in the short-range forecast of non-TC extreme rainfall with the Weather Research and Forecast (WRF) model. In the simulations of 26 heavy rainfall cases, we found that using a one-dimensional mixed layer model leads to a 15% enhancement (reduction) of rainfall maximum in six (two) cases compared to using constant SST. When the initial depth of the mixed layer model is perturbed by the amount of daily variability, 13 cases exhibit larger than 15% increases or decreases. A detailed analysis of one case suggests that the radiative process dominates the overall response of SST. The warming and moistening of boundary layer air cause significant strengthening of updrafts in convection. Although the SST change in most cases due to varying mixed layer model setups is less than 0.5 K, convective motions in some cases are surprisingly sensitive to small changes.

1. Introduction

Physical processes in the ocean play critical roles in modulating the Earth’s climate, not only for the energy transport that determines the mean climate but also for climate variability at different time scales, such as the El Niño-Southern Oscillation, the East Asia Monsoon, and the Madden-Julian oscillation [1,2,3,4]. However, for the short-term evolution of weather systems, the importance of ocean processes other than the sea surface temperature (SST) was not well appreciated until recently. Thus, to date, it is still common to prescribe persistent SST from observation or global model data in regional simulations, especially those for a short-range forecast and at high resolutions [5,6].
Met Office introduces the common practice in regional model by relying on the initialization of SST from the Operational Sea Surface Temperature and Ice Analysis (OSTIA) [7]. Utilizing the daily updates of OSTIA data, previous studies imply a better model performance in short-range forecast compared to the use of a finer resolution weekly static SST [8]. They further suggest the importance of assimilated ocean model in capturing significant differences in precipitation over the sea during a cold front case. A recent study addressed a similar result in a five-days simulation, showing reduced temperature bias by using a time-varying SST from regional numerical weather prediction [5].
Although deep ocean dynamics probably do not impact SST significantly on the time scale (1–3 days) of short-range weather forecasts, recent studies have highlighted the notable effects of ocean mixed layer (OML) on the short-term development of tropical cyclones (TCs). Studies on Hurricane Irene show ahead-of-eye-center cooling of more than 6 C in a large area of the coastal ocean and this is critical for reproducing the accelerated intensity reduction of Irene in simulations [9]. They also confirmed that similar ahead-of-eye-center cooling also occurred beneath another 11 TCs that traversed the Mid-Atlantic Bight continental shelf. In addition, an inclusion of a coupled ocean model in the simulations of six TCs results in a reduced intensity errors by 29–47% at 24–96 h forecast lead times [10]. The salinity-induced barrier layer at the base of the mixed layer may also potentially affect the SST response to TCs, but the specific effects depend on the stages of TCs and ocean stratification [11]. Recent studies also support the importance of ocean subsurface stratification on rapidly intensified TCs in a 24-h simulation [12]. They suggest the salinity stratification plays a role in further reducing the SST cooling by limiting the ocean mixing.
In this study, we intend to investigate the necessity of including ocean mixing processes in the short-range forecasting of extreme precipitation events that are not related to TCs. In a non-TC environment, intense air–sea interactions due to gustiness in a TC environment are likely absent. Therefore, using persistent SST in short-term simulations is seemingly fine or even preferred over coupled atmosphere-ocean models because of reduced computational costs. However, as it will be discussed later in this article, we found that the short-term variability in SST, albeit small in amplitude, has a negligible influence on large-area regional means but exerts significant impacts on local rainfall maxima.
Our study focuses on the South China coast and the pre-summer season, during which more than 50% of annual rainfall occurs but with rarely active TCs [13]. In this period, moisture transport from the South China Sea (SCS) contributed significantly to precipitation development over land [3,14]. Previous case studies suggest that low-level jets, frontal systems, and moisture transport all play important roles in the triggering and development of precipitation systems [15,16,17,18]; therefore, air–sea interactions can potentially impact rainfall by modulating boundary layer processes. Our investigation used the Weather Research & Forecast (WRF) model [19] at convection permitting resolutions coupled to a one-dimensional (1-D) ocean mixed layer (OML) model [20,21,22], together with experiments using persistent SST. It should be noted that we do not intend to advocate the simple 1-D OML model as a satisfying replacement of a full dynamic ocean model. We chose it because of its simplicity in varying parameters (such as the initial ocean mixed layer depth) and because it is sufficient to provide a semiquantitative estimate of the sensitivity of short-range forecasts to ocean mixed layer processes.
The remainder of the article is organized as follows: detailed model setup and statistical analysis methods are explained in Section 2; Section 3 analyses the sensitivity of precipitation forecasts to varying ocean conditions and relevant dynamic processes; our conclusions and a discussion are provided in Section 4.

2. Materials and Methods

2.1. Selection of Heavy Rainfall Cases

Observational daily rainfall data are used for selecting heavy precipitation cases. NOAA/OAR/ESRL PSL provides daily rainfall data at a 0.5 × 0.5 spatial resolution as a product of CPC Global Unified Precipitation (Colorado, USA, http://psl.noaa.gov/, accessed on 30 July 2020). The dataset is available based on the Global Telecommunication System (GTS) interpolated daily gauge rainfall dataset combined with satellite estimated and numerical model forecast data to control the quality [23].
A total of 26 coastal heavy rainfall cases are chosen with the 95th percentile of daily precipitation as the threshold from the spring months (March to May) between 2009 and 2013. The heavy rainfall case is an important parameter in assessing the time-varying SST impact on extreme rainfall over coastal regions. South China, as the focus research area, recorded numerous severe flooding during the pre-summer season. The coastal region is defined as locations with a maximum distance of 100 km from the coastline, and precipitation in the coastal region is analyzed. In addition, the case study selection is limited to days without TC activities to restrict the analysis of mesoscale systems causing heavy rainfall events over South China. TC events are documented on the Hong Kong Observatory (HKO) website for any TCs entering the Western North Pacific (WNP) and South China Sea region (10 N–30 N, 105 E–125 E) (HKO, http://www.hko.gov.hk/en/publica/pubtc.htm, accessed on 30 July 2020).

2.2. WRF Experimental Setup

This research is conducted using the Weather Research and Forecast (WRF) model (Version 4.2) [19], which provides an option for representing ocean processes with a simple mixed layer model. The WRF simulations adopted three nested domains, and the focus area of this research is the third (innermost) domain (d03), which uses a 4-km spatial resolution and 38 vertical levels with the model top at 50 hPa. Domain d03 covers most of the South China region, and the first (outermost) domain (d01) consists of a larger domain with coarse resolution (36 km) (Figure 1). Domain 02 has a spatial resolution of 12 km with slightly larger area coverage than d03. No feedback between the domains was included (one-way nesting). In addition, each simulation includes an additional 6 h prior to and after the selected day of simulation, adding the simulation time for each case to 36 h. Table 1 listed the physical package used in the simulation. The same physical package is applied to all domains, except for the cumulus parameterization in d03. No cumulus parameterization is applied to d03 because of its fine resolution, which resolves convection.
The 1-D OML Pollard model is a slab model with a homogeneous and well-mixed layer [20,21,22]. Neglecting horizontal advection, this model considers a one-dimensional linearized Boussinesq model with surface wind stress ( τ x , τ y ). The momentum of the mixed layer follows the equation:
( h u ) t f ( h v ) = τ x ρ
( h v ) t + f ( h u ) = τ y ρ
where h is the depth of the mixed layer, u and v are the horizontal velocities of the mixed layer current, ρ is the density, and f is the Coriolis parameter. Considering the effect of total external heat flux Q through the surface, the conservation of heat is expressed as:
t ( Δ T ) h 1 2 Γ h 2 = Q ρ c
in which Γ is the deep-layer lapse rate and c is the specific heat of seawater. Assuming that temperature does not change in time below the mixed layer, Δ T denoted as the temperature jump across the bottom of the mixed layer,
Δ T = T m l , t T m l , 0 + Γ ( h 0 h ) = T m l , t T p , t
where T m l , t is the temperature of the mixed layer at time t and T p , t is the temperature immediately below the mixed layer. The values of ( h u ) , ( h v ) , and the term in the square brackets of Equation (3) are advanced in time by integrating Equations (1)–(3). Then, the separate values of h and T m l , t are obtained based on the assumption that the Richardson number stays close to the critical value of one, i.e.,
R i g a Δ T h u 2 + v 2 = R i c r i t i c a l = 1
where g is gravity and α is the thermal coefficient of expansion. In general, the external heat flux acted as an external force and further changed the ocean enthalpy in Equation (3). The external heat flux, hereafter named total energy flux, includes both net radiation and net heat flux.
The 1D OML model requires an initial condition of the OML depth (MLD) and the deep-layer lapse rate (K m−1). MLD is defined as a well-mixed layer in which the temperature, salinity, and density are nearly uniform following certain criterion. Both parameters are set with horizontally uniform values for all grid points based on the area averages. The daily MLD data are obtained from the ECMWF ORAP5.0 reanalysis project during a 5-year period from 2009 to 2013 [29]. The MLD chosen from ECMWF dataset is defined as the depth at which the density exceeds a 0.01 kg m−3 difference from the 10 m reference depth value. The lapse rate is computed with daily temperature profiles below the MLD from the Global Ocean Physics Reanalysis (GLORYS12V1) product by the European Copernicus Marine Environment Monitoring Service (CMEMS, http://resources.marine.copernicus.eu/, accessed on 4 August 2020). Due to data availability, the MLD for lapse rate is determined with temperature threshold criterion by ±0.2 °C with a reference depth at 10 m [30]. The deep layer is defined as the ocean layer between the MLD and 225.5 m depth from the surface, as the temperature changes drastically within this layer. In addition, the initial SST value, lateral boundary condition, and the other essential variables for the simulation are obtained from the ERA5 six-hourly data at a 0.25 × 0.25 spatial resolution [31].
The setups above are the baseline configuration of our simulations, and we refer to the experiments of this group as “1D”. Table 2 shows the experimental setup for each simulation in terms of the SST condition and ocean coupling applied to the simulations. To compare the model sensitivity in simulating the heavy rainfall case, a group of static SST experiments (named “Fix”) is conducted with the same physical package setup and initial condition. In addition, another two groups of experiments are conducted based on different initial MLD values, which are varied by one standard deviation (±1 std) from the daily MLD values during the whole analysis period 2009–2013. These two groups are referred to as “Deep” and “Shallow”, which are used for evaluating the sensitivity of the 1-D OML model to different initial MLD values. The standard deviation is 4.32 m, calculated from high-pass filtered MLD data, for which a 10-day moving average is removed. The MLD for the 26 cases ranges from 12.5 m to 32.8 m.

2.3. Particle Trajectory Model Setup

In addition to analyzing the dynamic process included in the WRF simulation, trajectories of parcels are calculated to illustrate the contribution of the oceanic boundary layer to coastal rainfall. NOAA provides the Hybrid Single-Particle Lagrangian Integrated Trajectory (HYSPLIT) Model for tracing particles backward [32]. The particle trajectory is derived from the WRF simulated hourly wind field based on the Lagrangian model. Endpoints are set at 1500, 3000, 4210, 5500, 6600, and 7500 m above ground level (AGL), and the model is integrated backward for 30 h from 100 randomly selected locations at each level inside the storm center (Figure 5) of one case. In addition, the analysis is conducted separately for two different end-times based on the time of maximum rainfall rate.

3. Results

3.1. Heavy Rainfall Cases

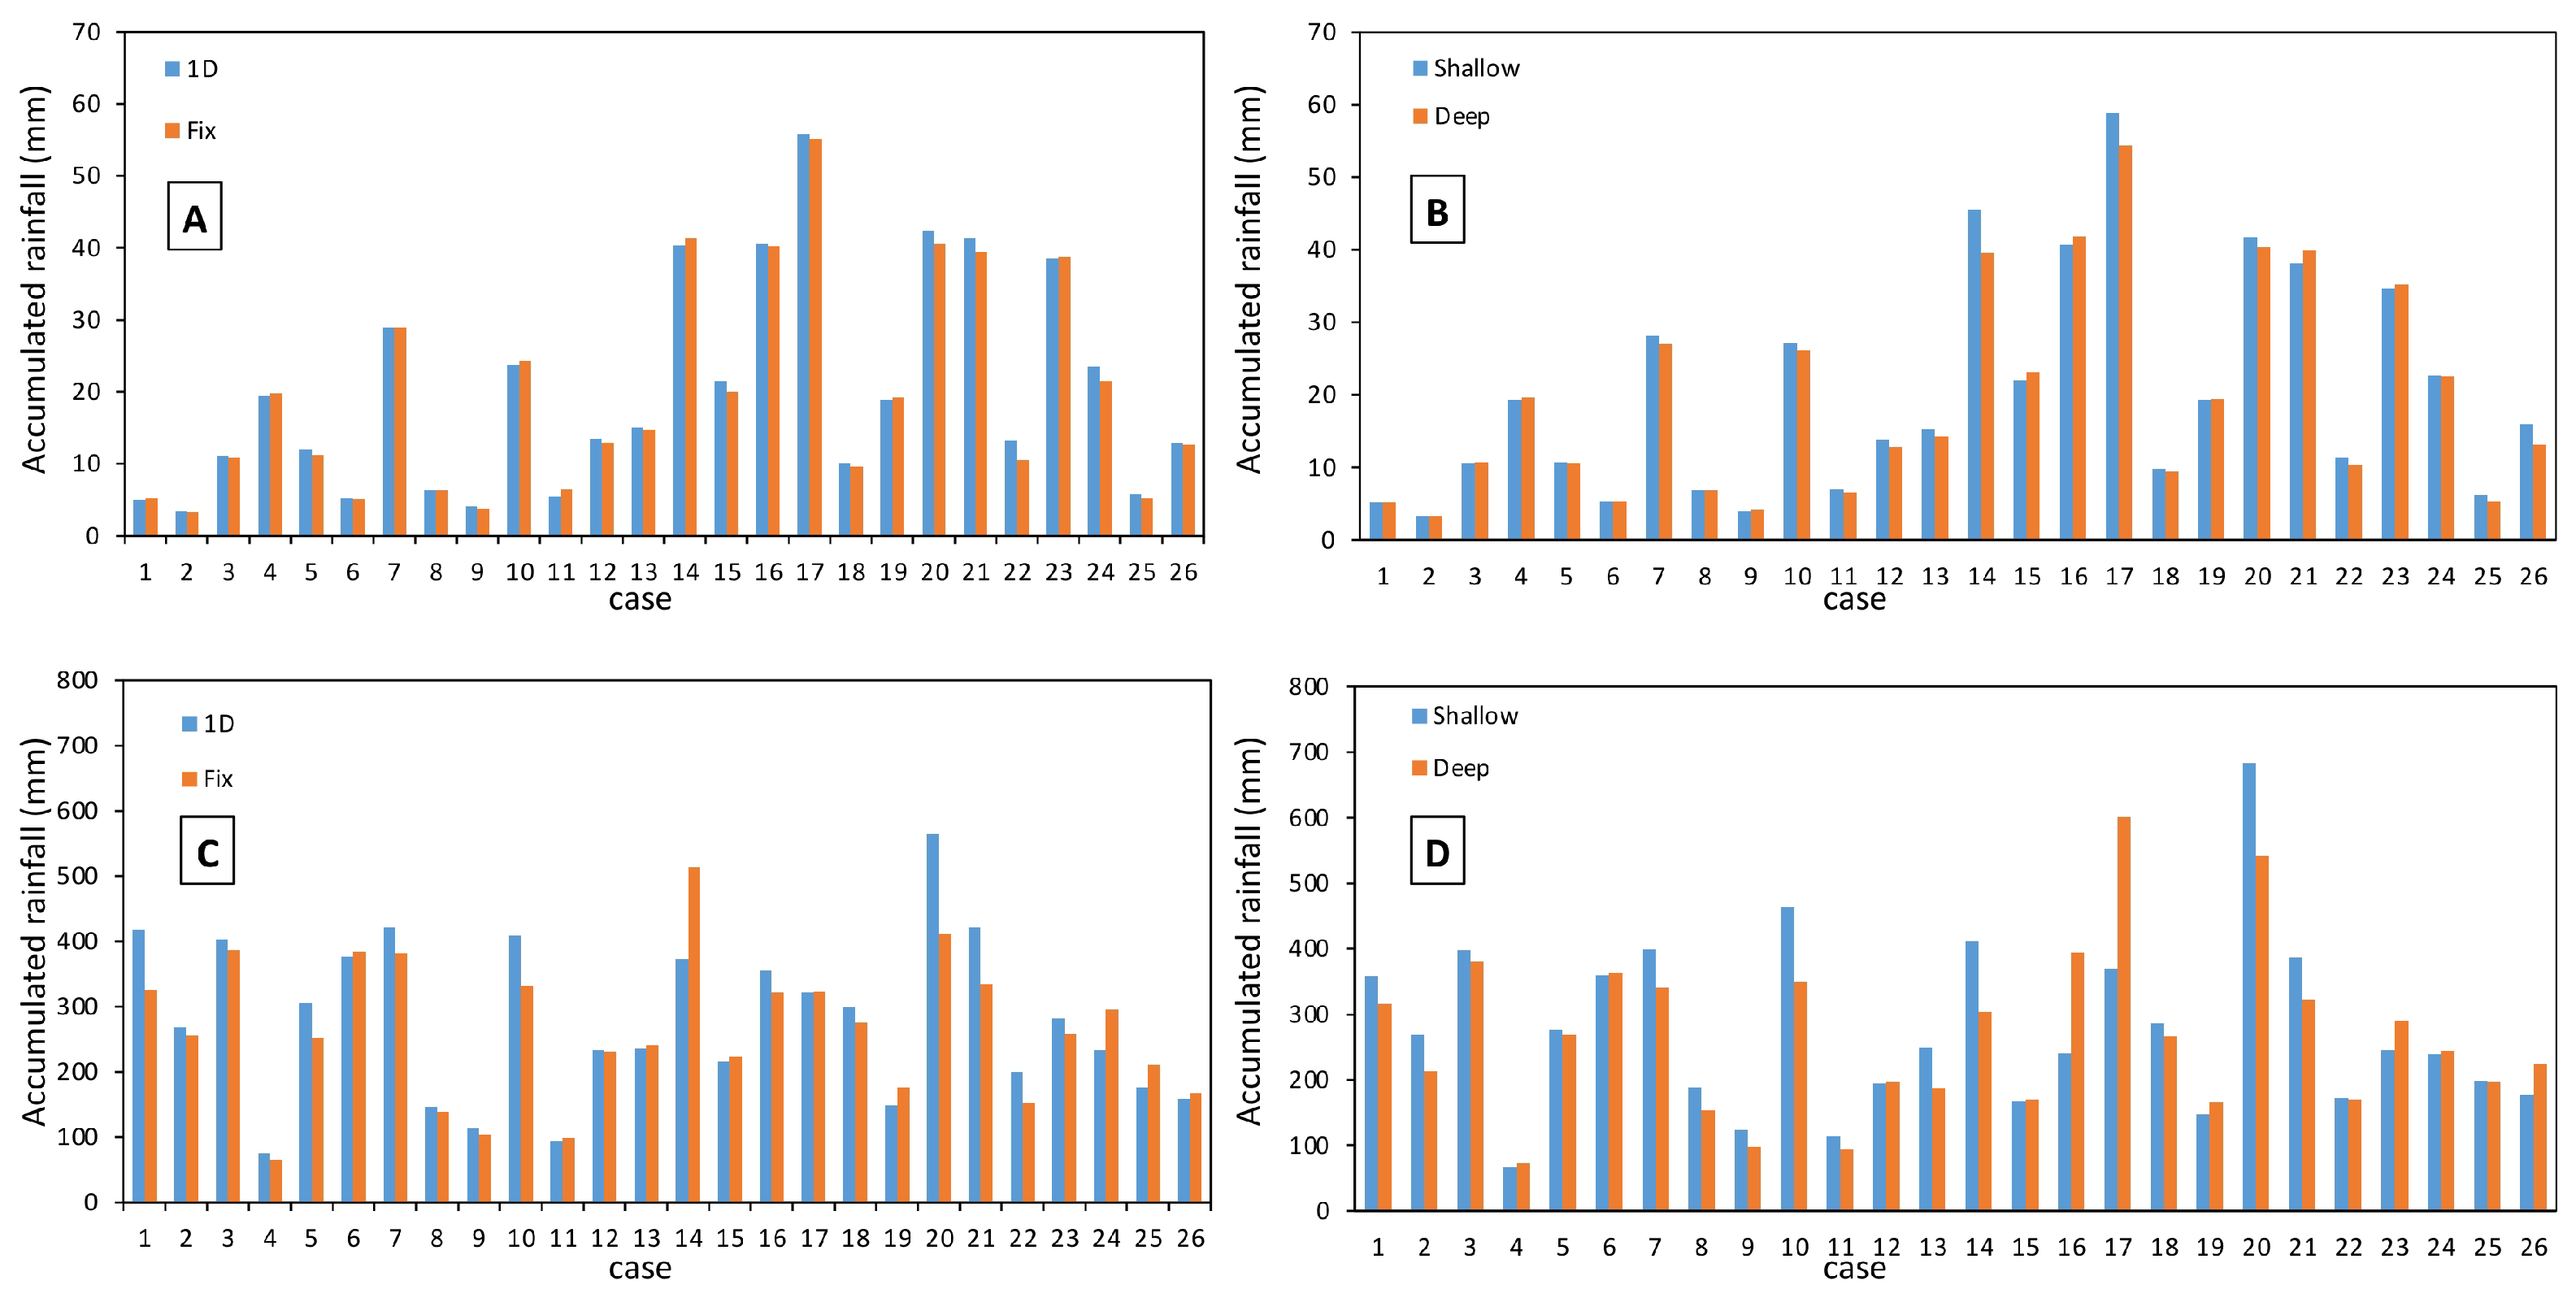
The analysis of heavy rainfall is conducted based on 26 selected cases. The area-mean accumulated coastal rainfall over 36-h simulations shows similar magnitudes in four different model setups, 1D and Fix (Figure 2A), together with the initial MLD sensitivity test (Figure 2B). While 1D and Fix show minimal differences in coastal rainfall, different initial MLDs (shallow vs. deep) result in more than 15% changes in some cases, e.g., cases 14, 25, and 26 (Figure 2B). Differing from area-mean rainfall analysis, the maximum accumulated coastal rainfall exhibits significant differences, with higher magnitude in 1D for 16 cases and lower magnitude in 1D for the other 10 than the Fix simulations (Figure 2C). There are six cases out of those 16 cases that show a significant difference with a more than 15% increase in rainfall for the 1D simulation. Similarly, more than half of the cases showed a higher accumulated rainfall in the Shallow group than in the Deep group (Figure 2D). Figure 2D also shows that a total of 10 cases reached a more than 15% increase in rainfall based on the shallow experiment.
We select eight cases and grouped them into three separate groups, each of which shared similar rainfall patterns, to analyze the large-scale circulation. The groups are selected based on the dominant pattern of simulated rainfall difference between experiments, for which we require a significant positive difference between 1D and Fix and a positive difference between Shallow and Deep. Such selection criteria are set to ensure representativeness of the composite analysis because Fix simulation is equivalent to setting an infinitely deep MLD. Thus, consistent positive differences between the two pairs of experiments suggest a more robust response to changes in mixed layer properties. In addition, a statistical analysis of the normalized accumulated rainfall based on the k-medoids clustering method is also used for the grouping cases into five groups (Supplementary Figure S1). The number of groups is limited to a maximum of five in the K-medoids cluster analysis, which results in three major groups. The other two groups only contain one case each and therefore are excluded from Figure 3. Group 1 consists of cases 7, 20, and 21, while Group 2 covers cases 8, 9, and 22. An additional Group 3 represents Case 2 and 3. The case naming follows the case order in Figure 2. The large-scale pattern for each group is presented as low-level (700 hPa) horizontal wind, moisture flux, eddy component of the temperature, and upper-level geopotential height (Figure 3). The weather variables are chosen to be those at the times with the maximum rainfall rate for each case.
The rainband of Group 1 members is generally located along the South China coast with the highest magnitude around Guangxi Province (Supplementary Figure S1a–c). The geopotential height at 500 hPa indicates a trough and low-pressure system in the upper level (Figure 3d). As a result, a low-level convergence is shown in the southeastern part of the trough. A low-level jet appears at approximately 23–27 N, inducing strong moisture transport toward the coast of Southeast China (Figure 3a). Similarly, the rainfall bands for the three cases in Group 2 are concentrated over Southeast China at approximately 27–30 N, 115–125 E (Supplementary Figure S1d–f). A weaker upper-level trough compared to Group 1 is located near the storm center with a strong low-level jet along 25 N (Figure 3b,e). The strong jet results in water vapor transport toward the eastern coastal region at approximately 115–125 E. The presence of moisture around the eastern coastal region leads to heavy rainfall events over the same region.
For the third group, the two members show similar accumulated rainfall patterns, with the highest value over the coastal region of Vietnam (Supplementary Figure S1g,h). The presence of low-pressure anomalies over land and high-pressure anomalies over the South China Sea generates low-level easterly flows, which transport moisture from the ocean surface toward land (Figure 3c,f). The moisture flux is not particularly strong. However, possibly due to the triggering of orographic convection along the Vietnam coast, the moderate moisture transport toward the coastal region from the SCS brings a maximum of approximately 400 mm accumulated rain in the Vietnam coastal region (Figure 3c and Supplementary Figure S1g,h).
In summary, the common characteristics of the three groups are the presence of low-level jets, which cause moisture transport at least partially from the ocean toward coastal regions; upper-level low-pressure anomalies or troughs are present to cause local convergence and trigger convection. In addition, the long rainfall band that appeared in Groups 1 and 2 is also possibly related to the spring climatology pattern of the vertically integrated horizontal water vapor transport (IVT) within the atmospheric river (AR) plums [33]. They show that ARs contribute up to 52% of rainfall in Southeast China during the spring season (March-April-May), which is wide enough to cover most of southeast China and the western north Pacific (WNP) with a high IVT value.
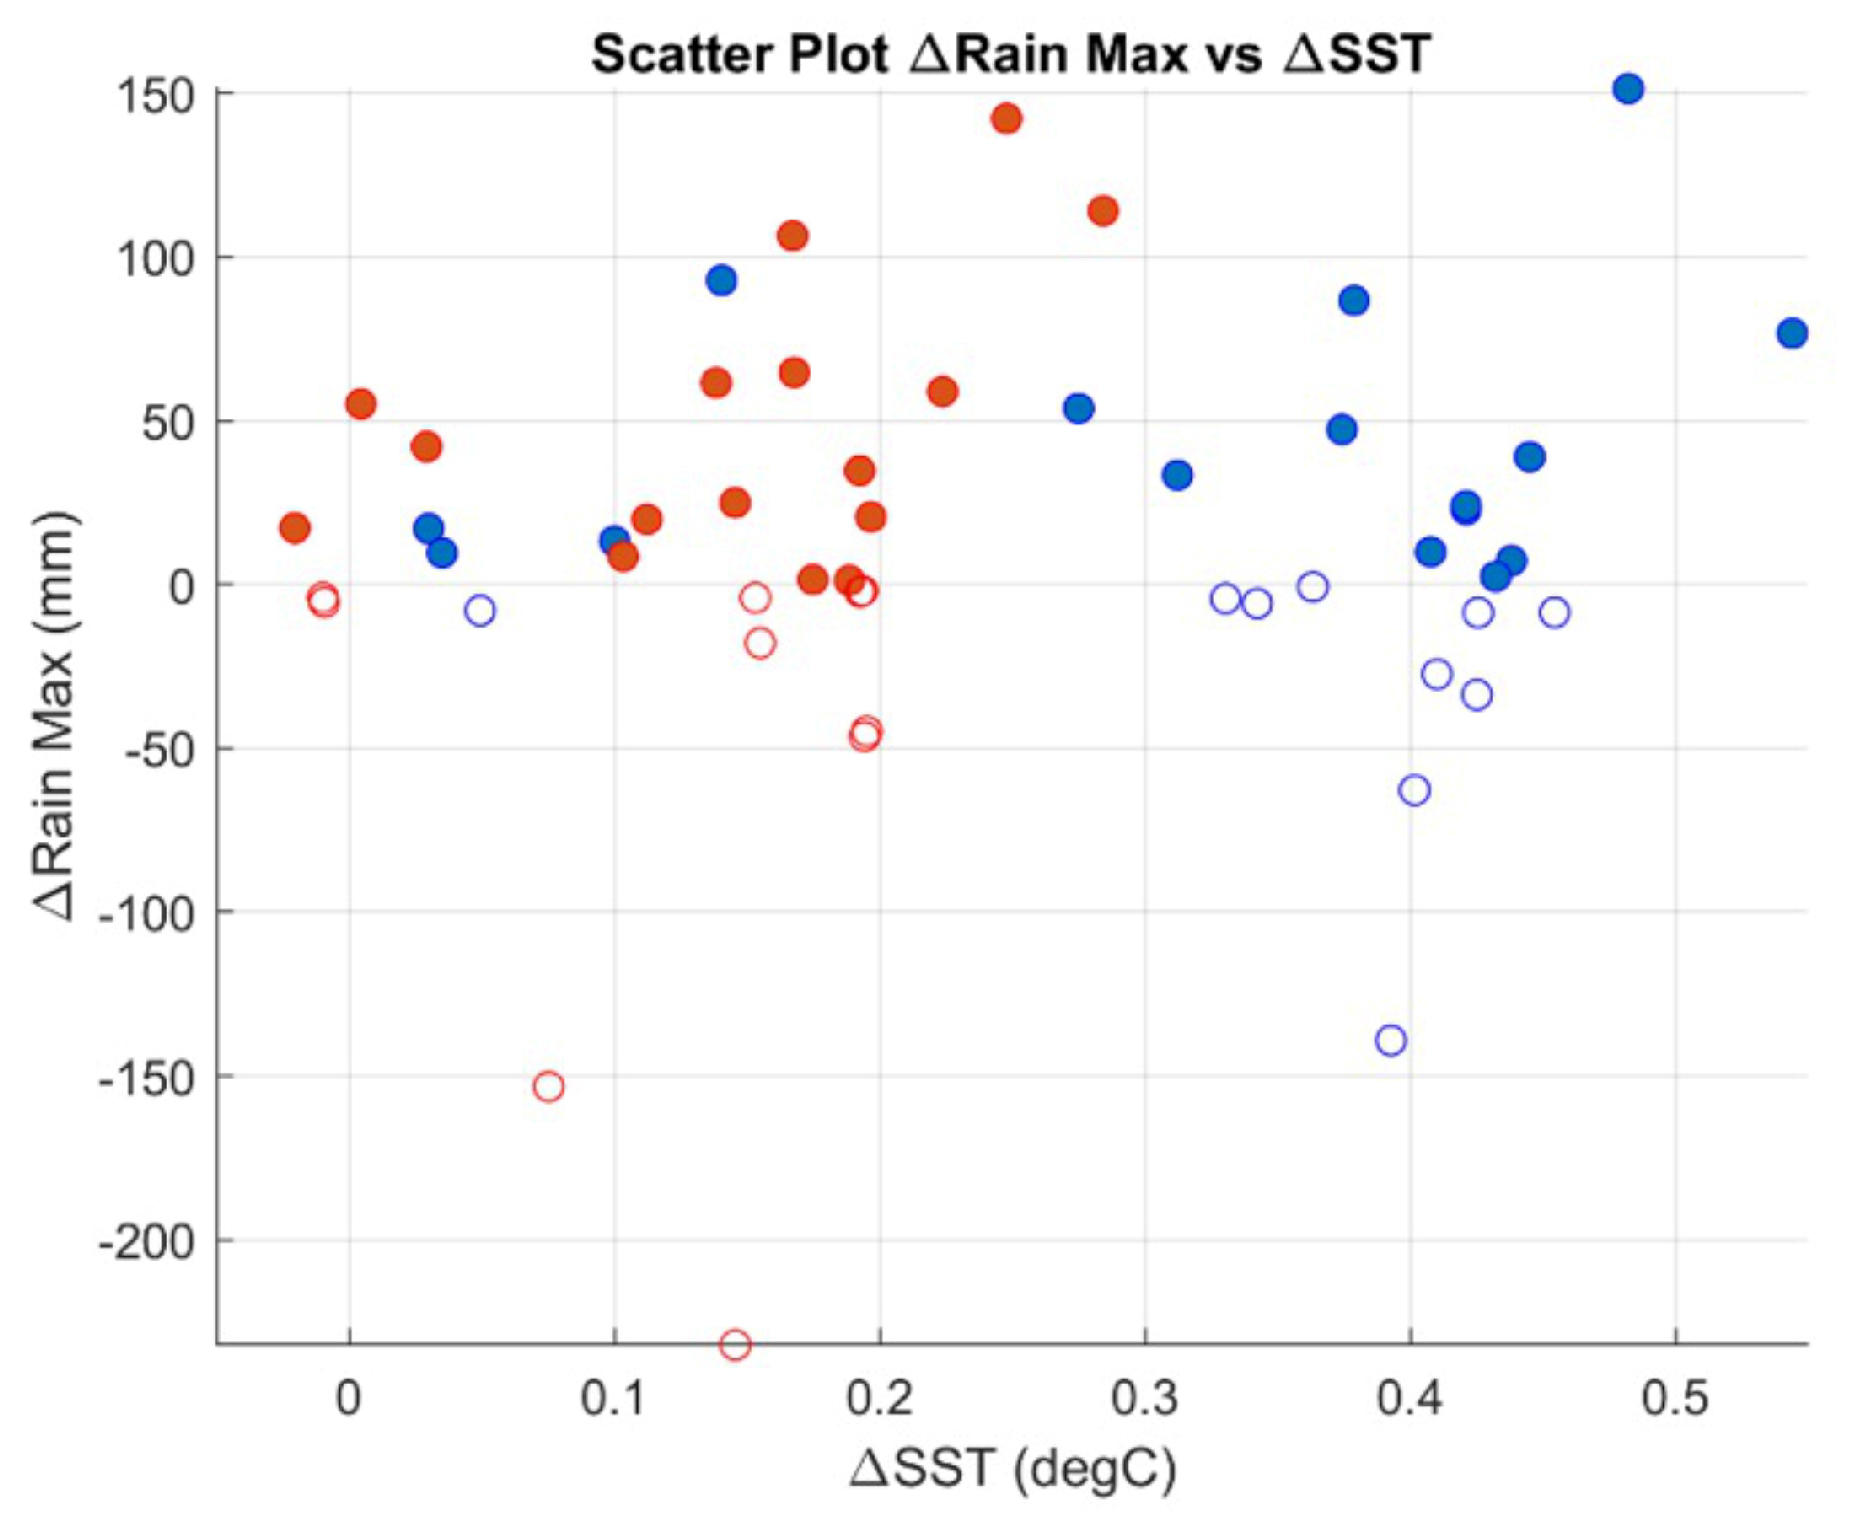
In addition to cluster analysis on the weather system, a scatter plot of the SST and accumulated rainfall difference between simulations summarizes the general sensitivity test (Figure 4). One-dimensional simulation shows more than half of the cases exhibit a warming response within the range of 0–0.5 C compared to Fix simulation. Similarly, a warming response in the Shallow experiment compared to Deep runs is also shown within a slightly smaller range (−0.05–0.3 C). In addition, the Shallow experiment suggests that cases within 0.1–0.3 C warming exhibit relatively more intense rainfall compared to the weak-warming groups.

3.2. A Case Study

In this section, we conduct detailed analysis for one heavy rainfall case to understand what processes are critical for causing large sensitivities of coastal rainfall to ocean mixed layer properties. Among the eight cases discussed above, Case 20 (19 May 2009) shows the highest consistent difference between the four model setups (Figure 2), and it is also one of the cases with the strongest precipitation intensity. Different experimental setups of each model result in different coastal rainfall maxima while maintaining the general rainfall spatial patterns. Therefore, it is reasonable to focus on a fixed area to analyze and understand the dynamic process related to rainstorms. For Case 20, we define a rectangular area to represent the storm center based on the liquid water and ice mixing ratio. An examination of cloud cover at 450, 500, and 600 hPa pressure level data suggests that the storm center area is located at 21.3 N–22.7 N, 107.0 E–110.2 E (white boxes in Figure 5). The area average of accumulated rainfall inside the selected region shows approximately 40% more rainfall in the 1D simulation than in the fixed simulation for this case and a more than 20% increase in the shallow experiment compared to the deep experiment (Figure 5).
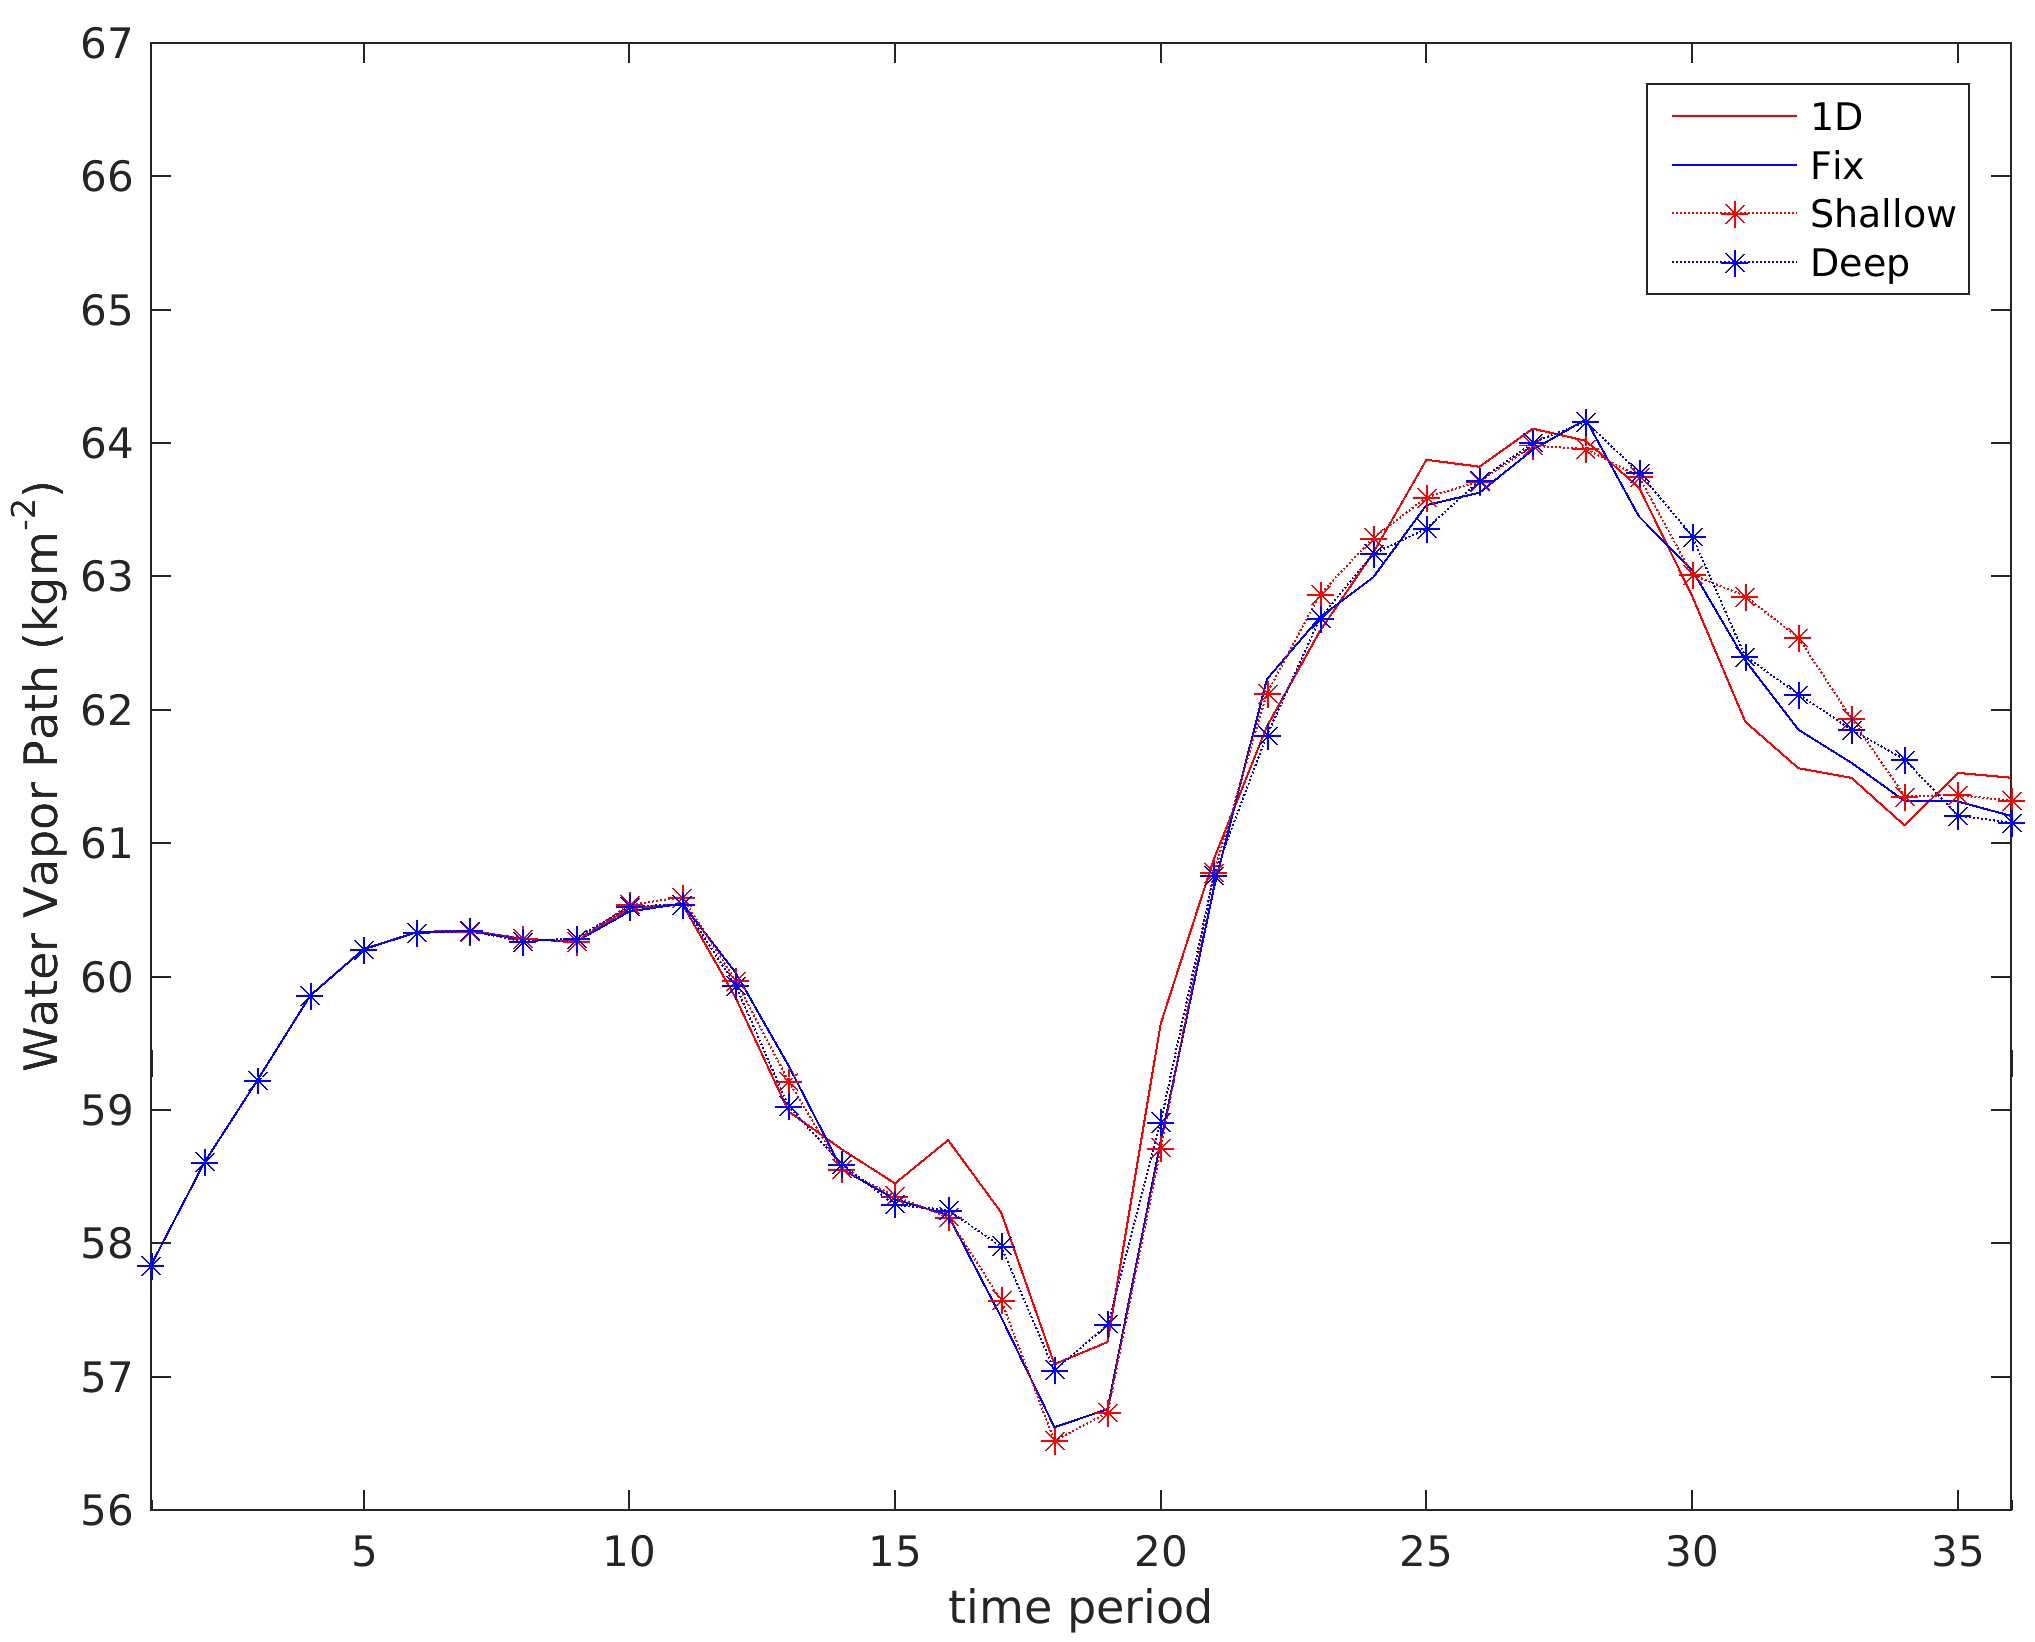
The time series of the area-averaged water vapor path (WVP) based on column-integrated water vapor shows the temporal change over 36 h. It reaches maxima of 60 and 64 kg m−2 around Hours 10 and 28, respectively (Figure 6). The temporal pattern indicates diurnal variability, as it hits the lowest magnitude at Hour 18 (12:00 UTC), while it peaks approximately 12 h later. The diurnal variability is probably related to the sea breeze near the coast. A recent study suggests that in the pre-summer time near the South China Coast, the nocturnal low-level jet can interact with moist monsoonal flow and trigger intense nocturnal convection [34]. The large value of WVP around Hour 28 is probably a result of the enhanced local convergence due to convection. However, there are no significant differences in WVP over the storm center (white box) between different experiments. The analysis on maximum convective available potential energy (CAPE) also shows no trace of significant difference between all four simulations (not shown), suggesting a dominant contribution from other dynamic processes in generating heavy coastal rainfall.
The minimal changes in vertically integrated moisture between different experiments suggest that the difference in accumulated rainfall is most likely due to variations in vertical motions in convection. The maximum magnitude of vertical motion in the 1D simulation indicates some diurnal variability in the 36-h simulation, while the average value within the storm area shows a single peak at hours 25–36. The vertical motion reaches its maximum value of 30 m/s at 300 hPa (Figure 7a). Similarly, the average vertical motion inside the storm center (white box) peaks at 300 hPa with an amplitude of 0.7 m/s (Figure 7b). Similar diurnal variability and area-mean vertical velocity patterns are also observed in shallow and deep simulations (not shown).
The maximum vertical motion (w) in the fixed simulation is generally weaker than that in 1D between Hours 7 and 16 (Figure 7c). In the period between Hours 22 and 31, the weaker vertical motion in Fix is persistent during this peak period of convection and rainfall. Similarly, a clear difference is observed in the average vertical motion pattern, with stronger vertical motions in 1D than in Fix during the peak period (Figure 7d). The fluctuating difference in vertical motion maxima, as in Figure 7c, also appears in the difference between shallow and deep simulations. The maximum w at the peak of convection is approximately 10 m/s stronger in the shallow simulations than in the deep simulations.

3.3. Ocean Surface Flux and Boundary Layer

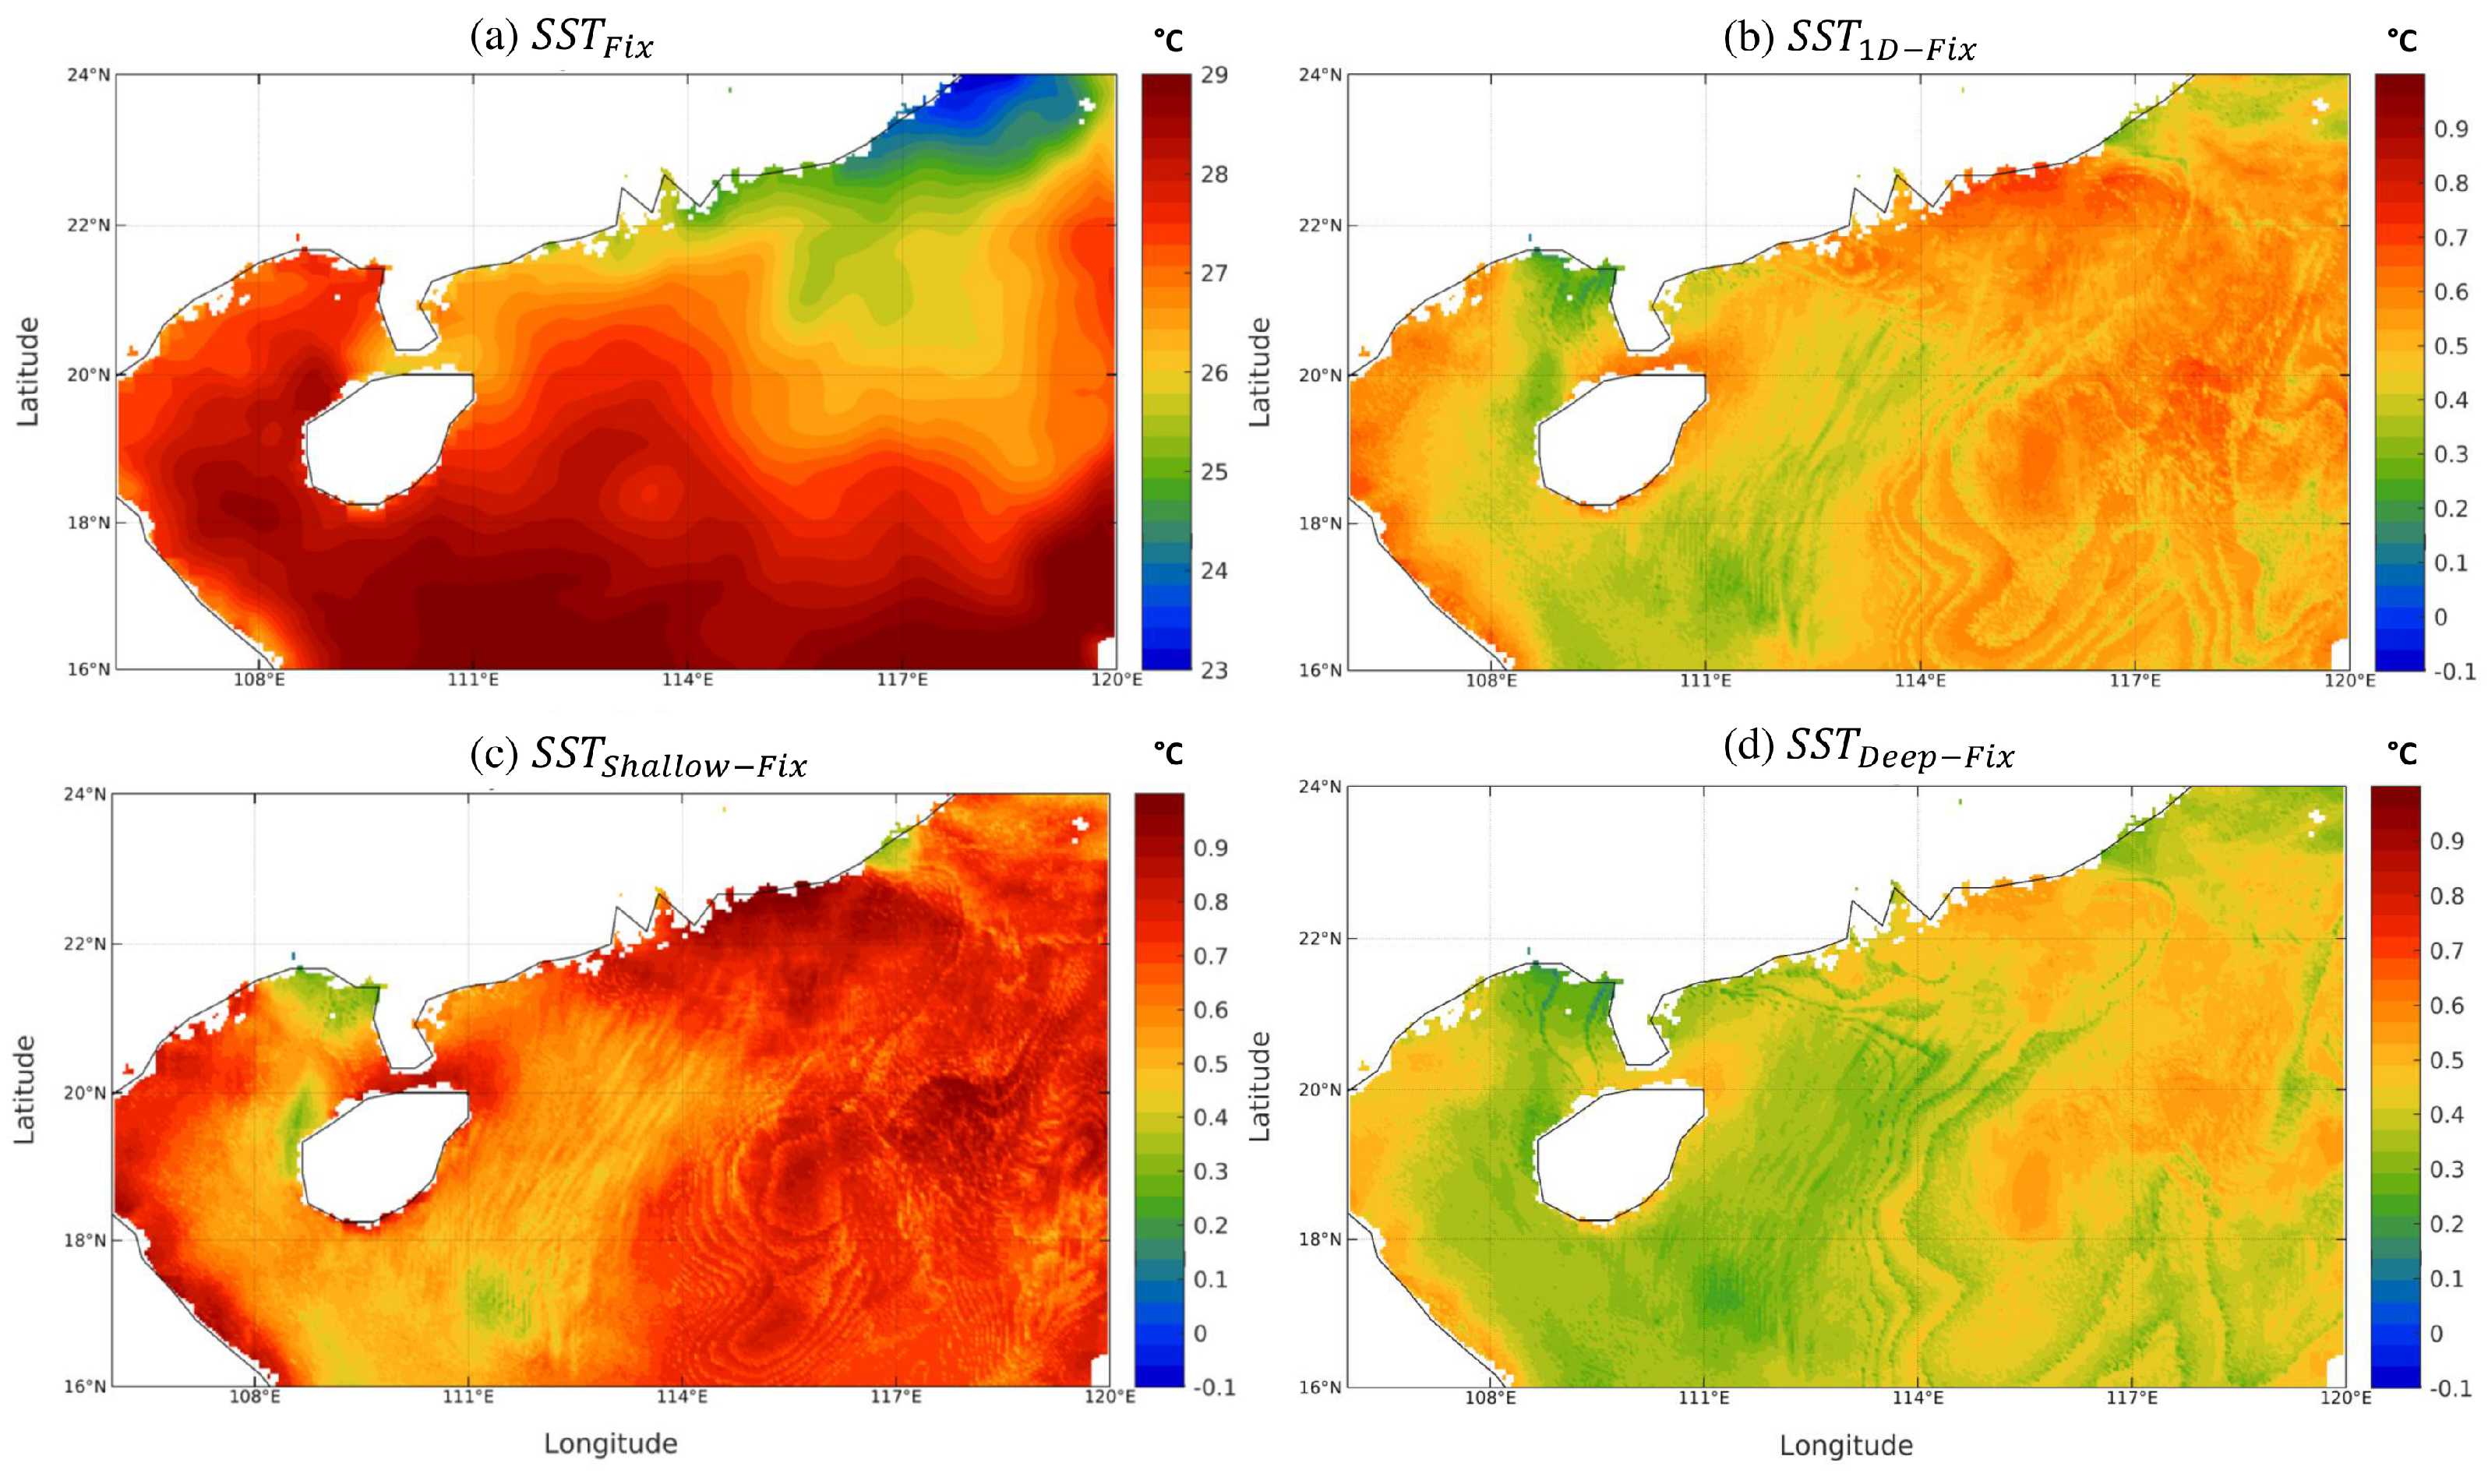
The air–sea interaction process is a critical part of understanding the differences between different experiments. The vertical mixing in the subsurface layer of the northern part of the SCS brings notable changes in the SST in the 36-h simulation of Case 20. Figure 8 shows the SST spatial patterns at the end of the simulations with warmer SST near the northwest coast and lower SST over the northeastern part. A warming effect up to 0.7 degrees due to the inclusion of the 1D model is observed near the coast and in the northeastern part of the SCS (Figure 8b). Furthermore, different initial MLD values also result in different SST responses. The shallow experiment exhibits temperatures 0 to 0.4 degrees warmer than the deep experiment (Figure 8c,d).
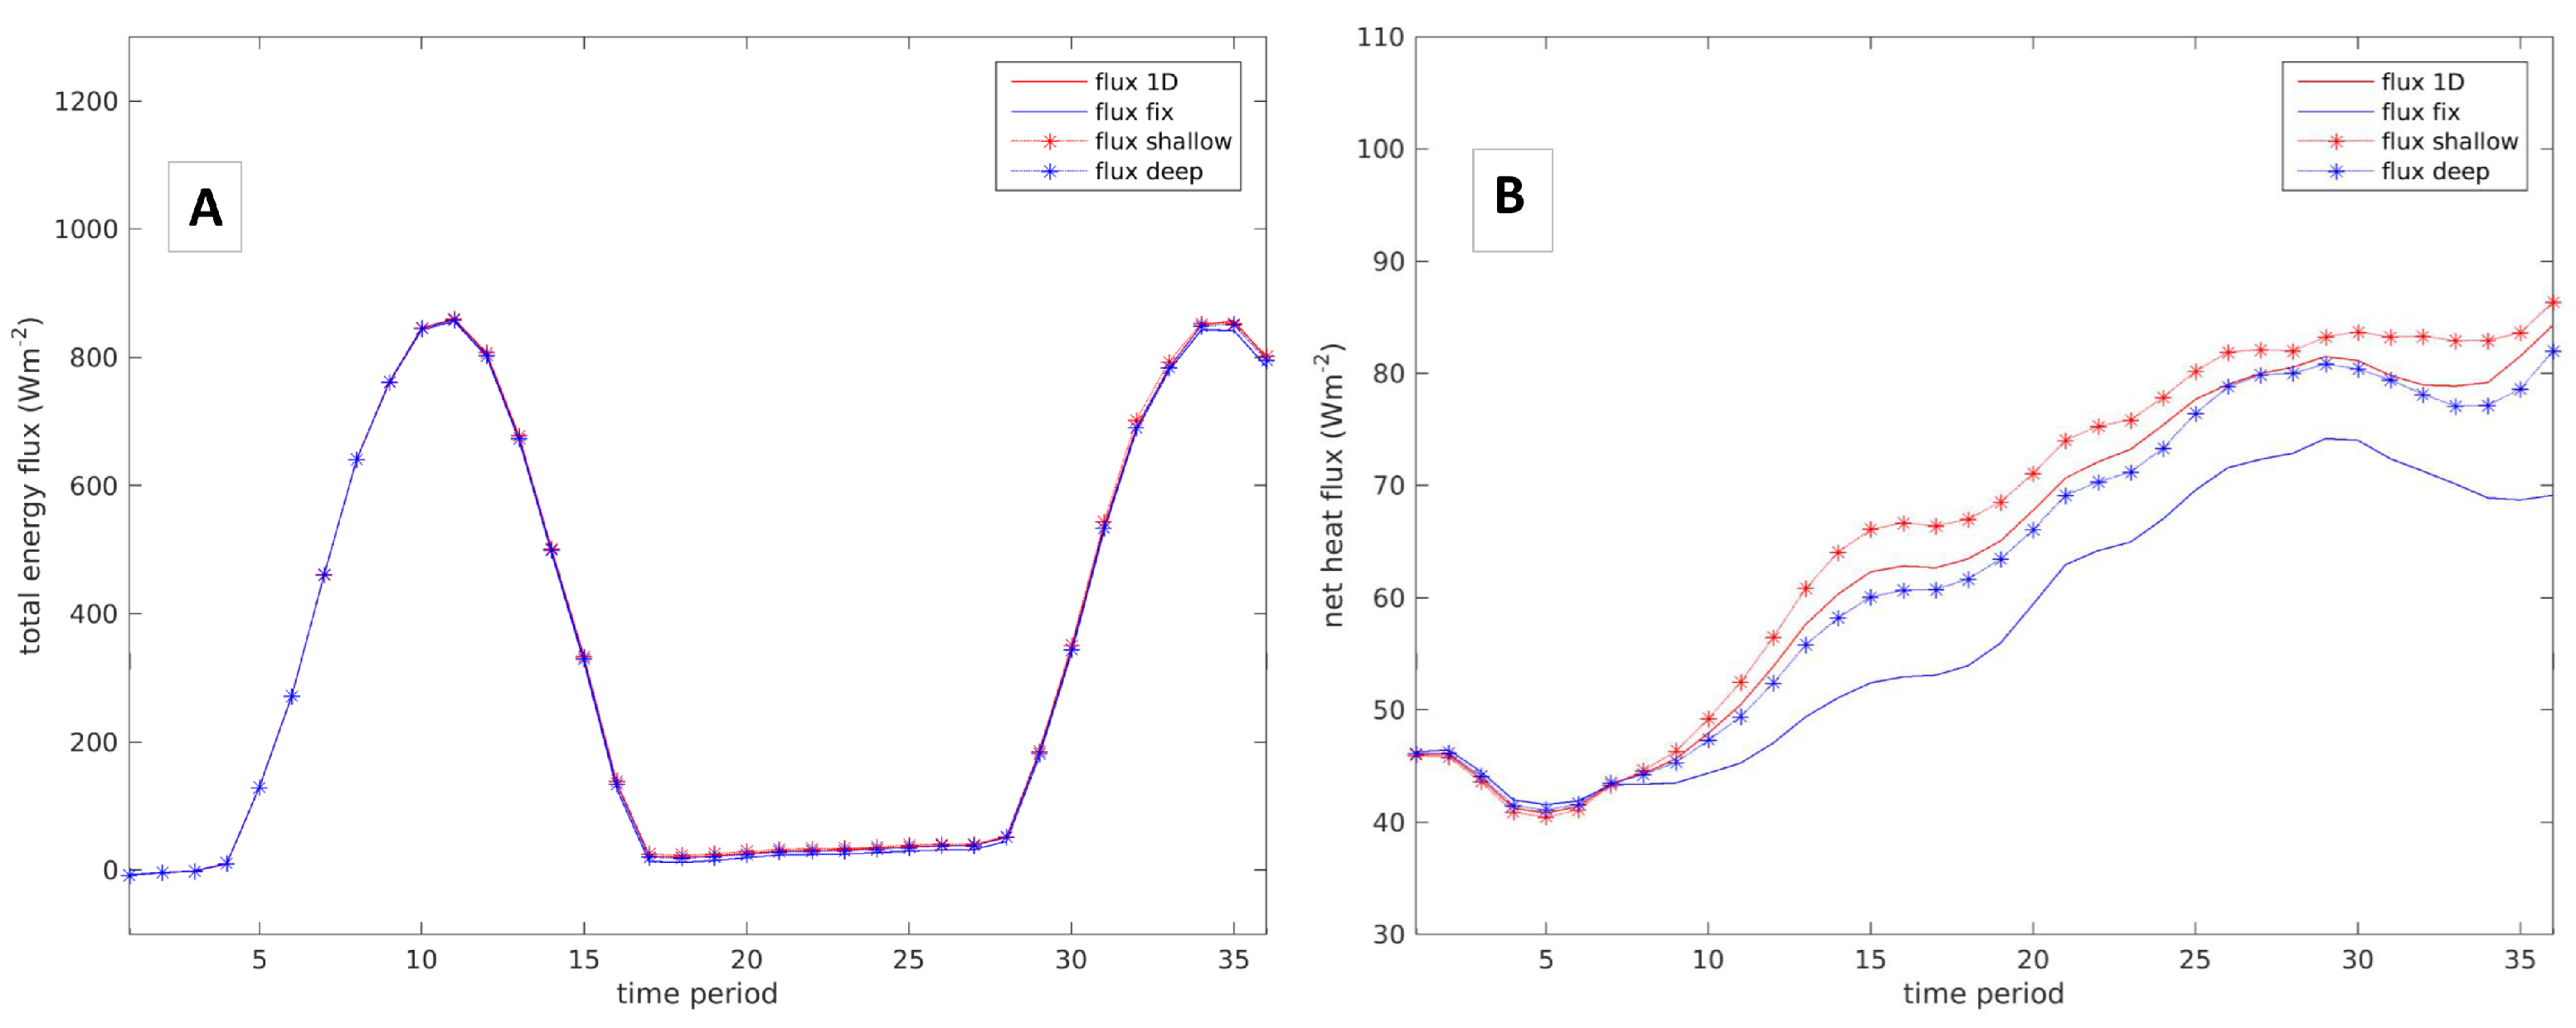
The differences in SST between different simulations can be understood by examining the energy fluxes at the ocean’s surface. In this study, the energy flux is divided into two components: the net radiation and net heat flux. The net radiation flux is a diagnostic variable calculated from the net longwave radiation (downward minus upward radiation) and net shortwave radiation at the ocean surface in the model. A standard definition of the net radiation flux follows a positive value when directed downward. Figure 9A shows the area mean net radiation flux at the ocean’s surface in Domain d03 of the simulations. It exhibits clear diurnal cycles, with the highest magnitude of 800 W/m2 at local noon. The SST field also exhibits a weak diurnal cycle with an amplitude of approximately 0.06 degrees (not shown). However, there is no significant difference in net radiation flux between 1D and Fix simulations or between the Shallow and Deep experiments (not shown in Figure 9A). The similar pattern in net radiation flux response is aligned to several studies showing net heat flux domination on the SST feedback [35,36]. In contrast, the net heat flux, the sum of sensible and latent heat flux at the ocean surface, shows no significant sign of the diurnal cycle and exhibits a gradual increase after the 5th hour; the figure suggests a consistently higher magnitude in 1D than in Fix (Figure 9B). The shallow and deep simulations show a net heat flux similar to that of Fix with a slightly higher net heat flux in the shallow region among all simulations.
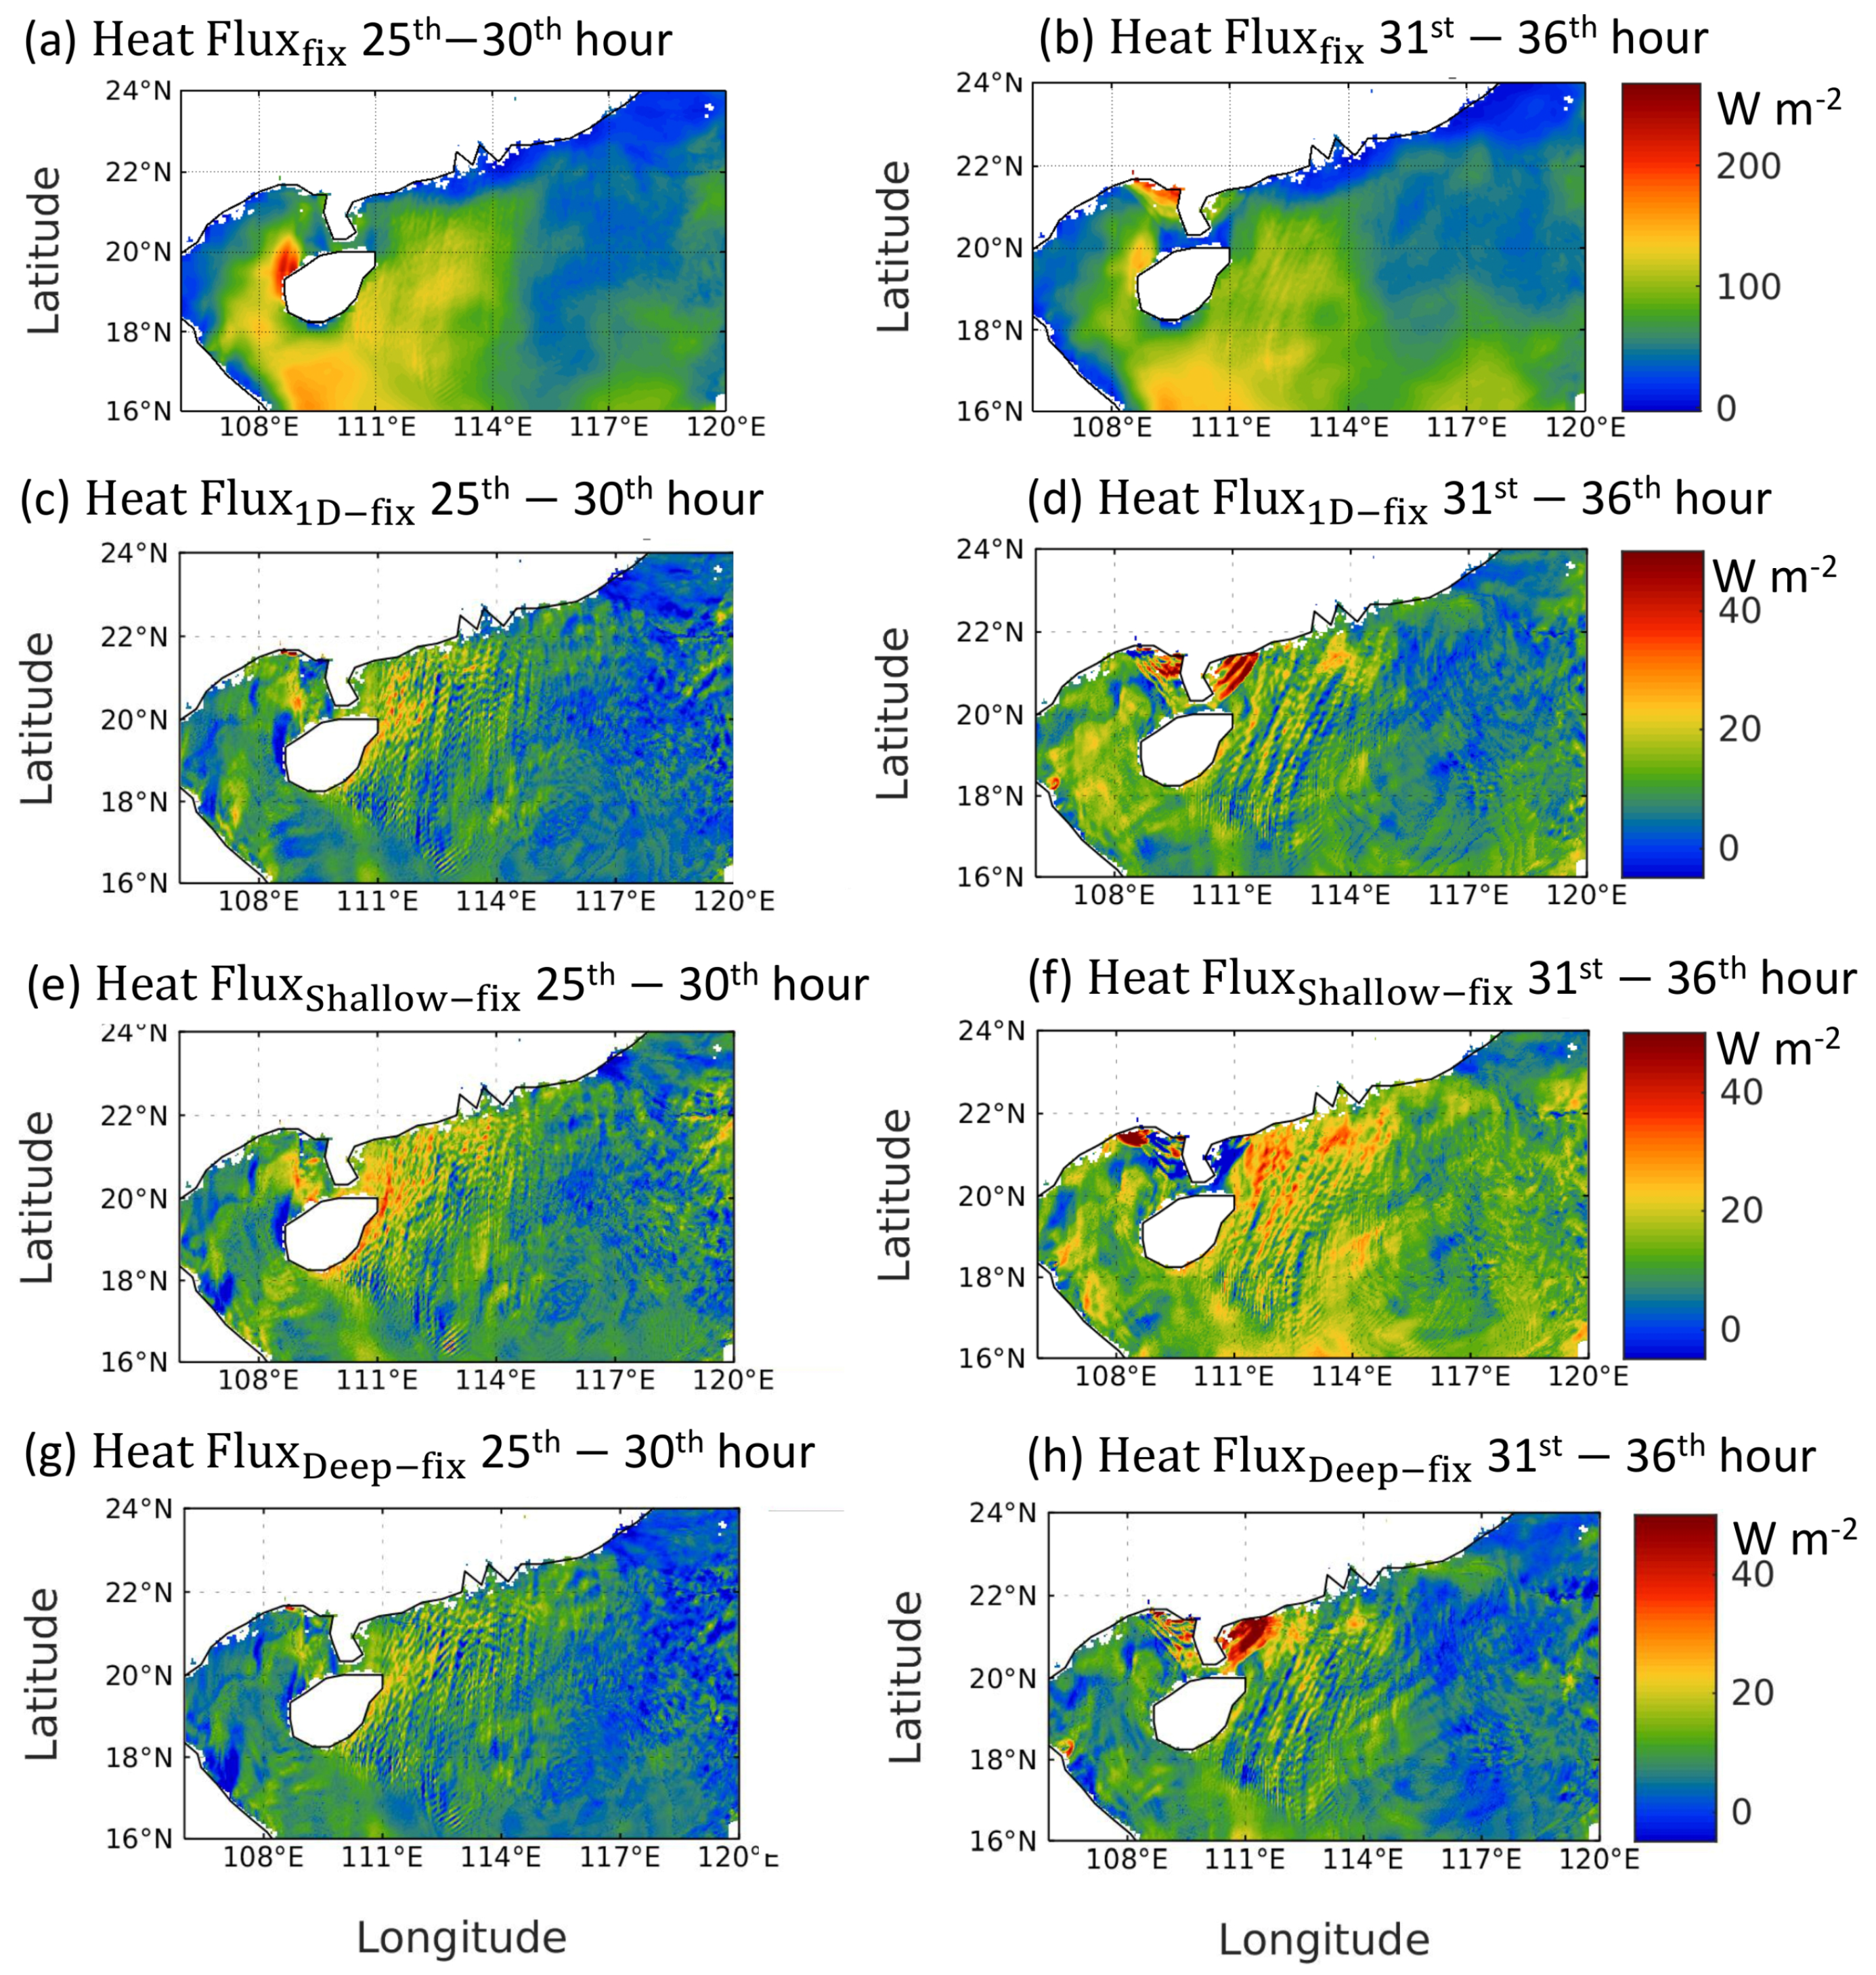
The energy fluxes in the experiments suggest that the relatively warm SST in the 1D and shallow simulations is contributed by the incoming solar radiation in the daytime. Although the SST difference between 1D and Fix (Shallow and Deep) is only around 0.5 (0.2) degrees, the resulting net heat flux is approximately 10–15 (5–10) W/m2 (Figure 9B). Figure 10 shows the spatial distribution of net heat flux in the simulations. Compared with Fix, the 1D simulation exhibits an approximately 15% change at the 25th–30th hour period and an approximately 25% change in the 31st to 36th hour in net heat flux. These changes are mostly concentrated over the northwestern part of the SCS (Figure 10c,d). The largest differences appear in the offshore areas near the storm center. The experiments with different initial MLD values (shallow vs. deep) also suggested significantly different net heat fluxes, with generally higher magnitudes in the shallow run (Figure 10e–h).
The difference between the simulations in net heat flux can be explained through the overall warmer SST in 1D and Shallow (Figure 8b–d and Figure 10c–h). However, the increase in net heat flux due to warmer SST is larger over the northwestern SCS than over the northeastern part (Figure 10). Such a distribution indicates a weaker heat flux response over the area with initially cold SST (Figure 8a). In addition, the northeastern SCS is characterized by a lower net heat flux than the northwestern SCS (Figure 10a,b).
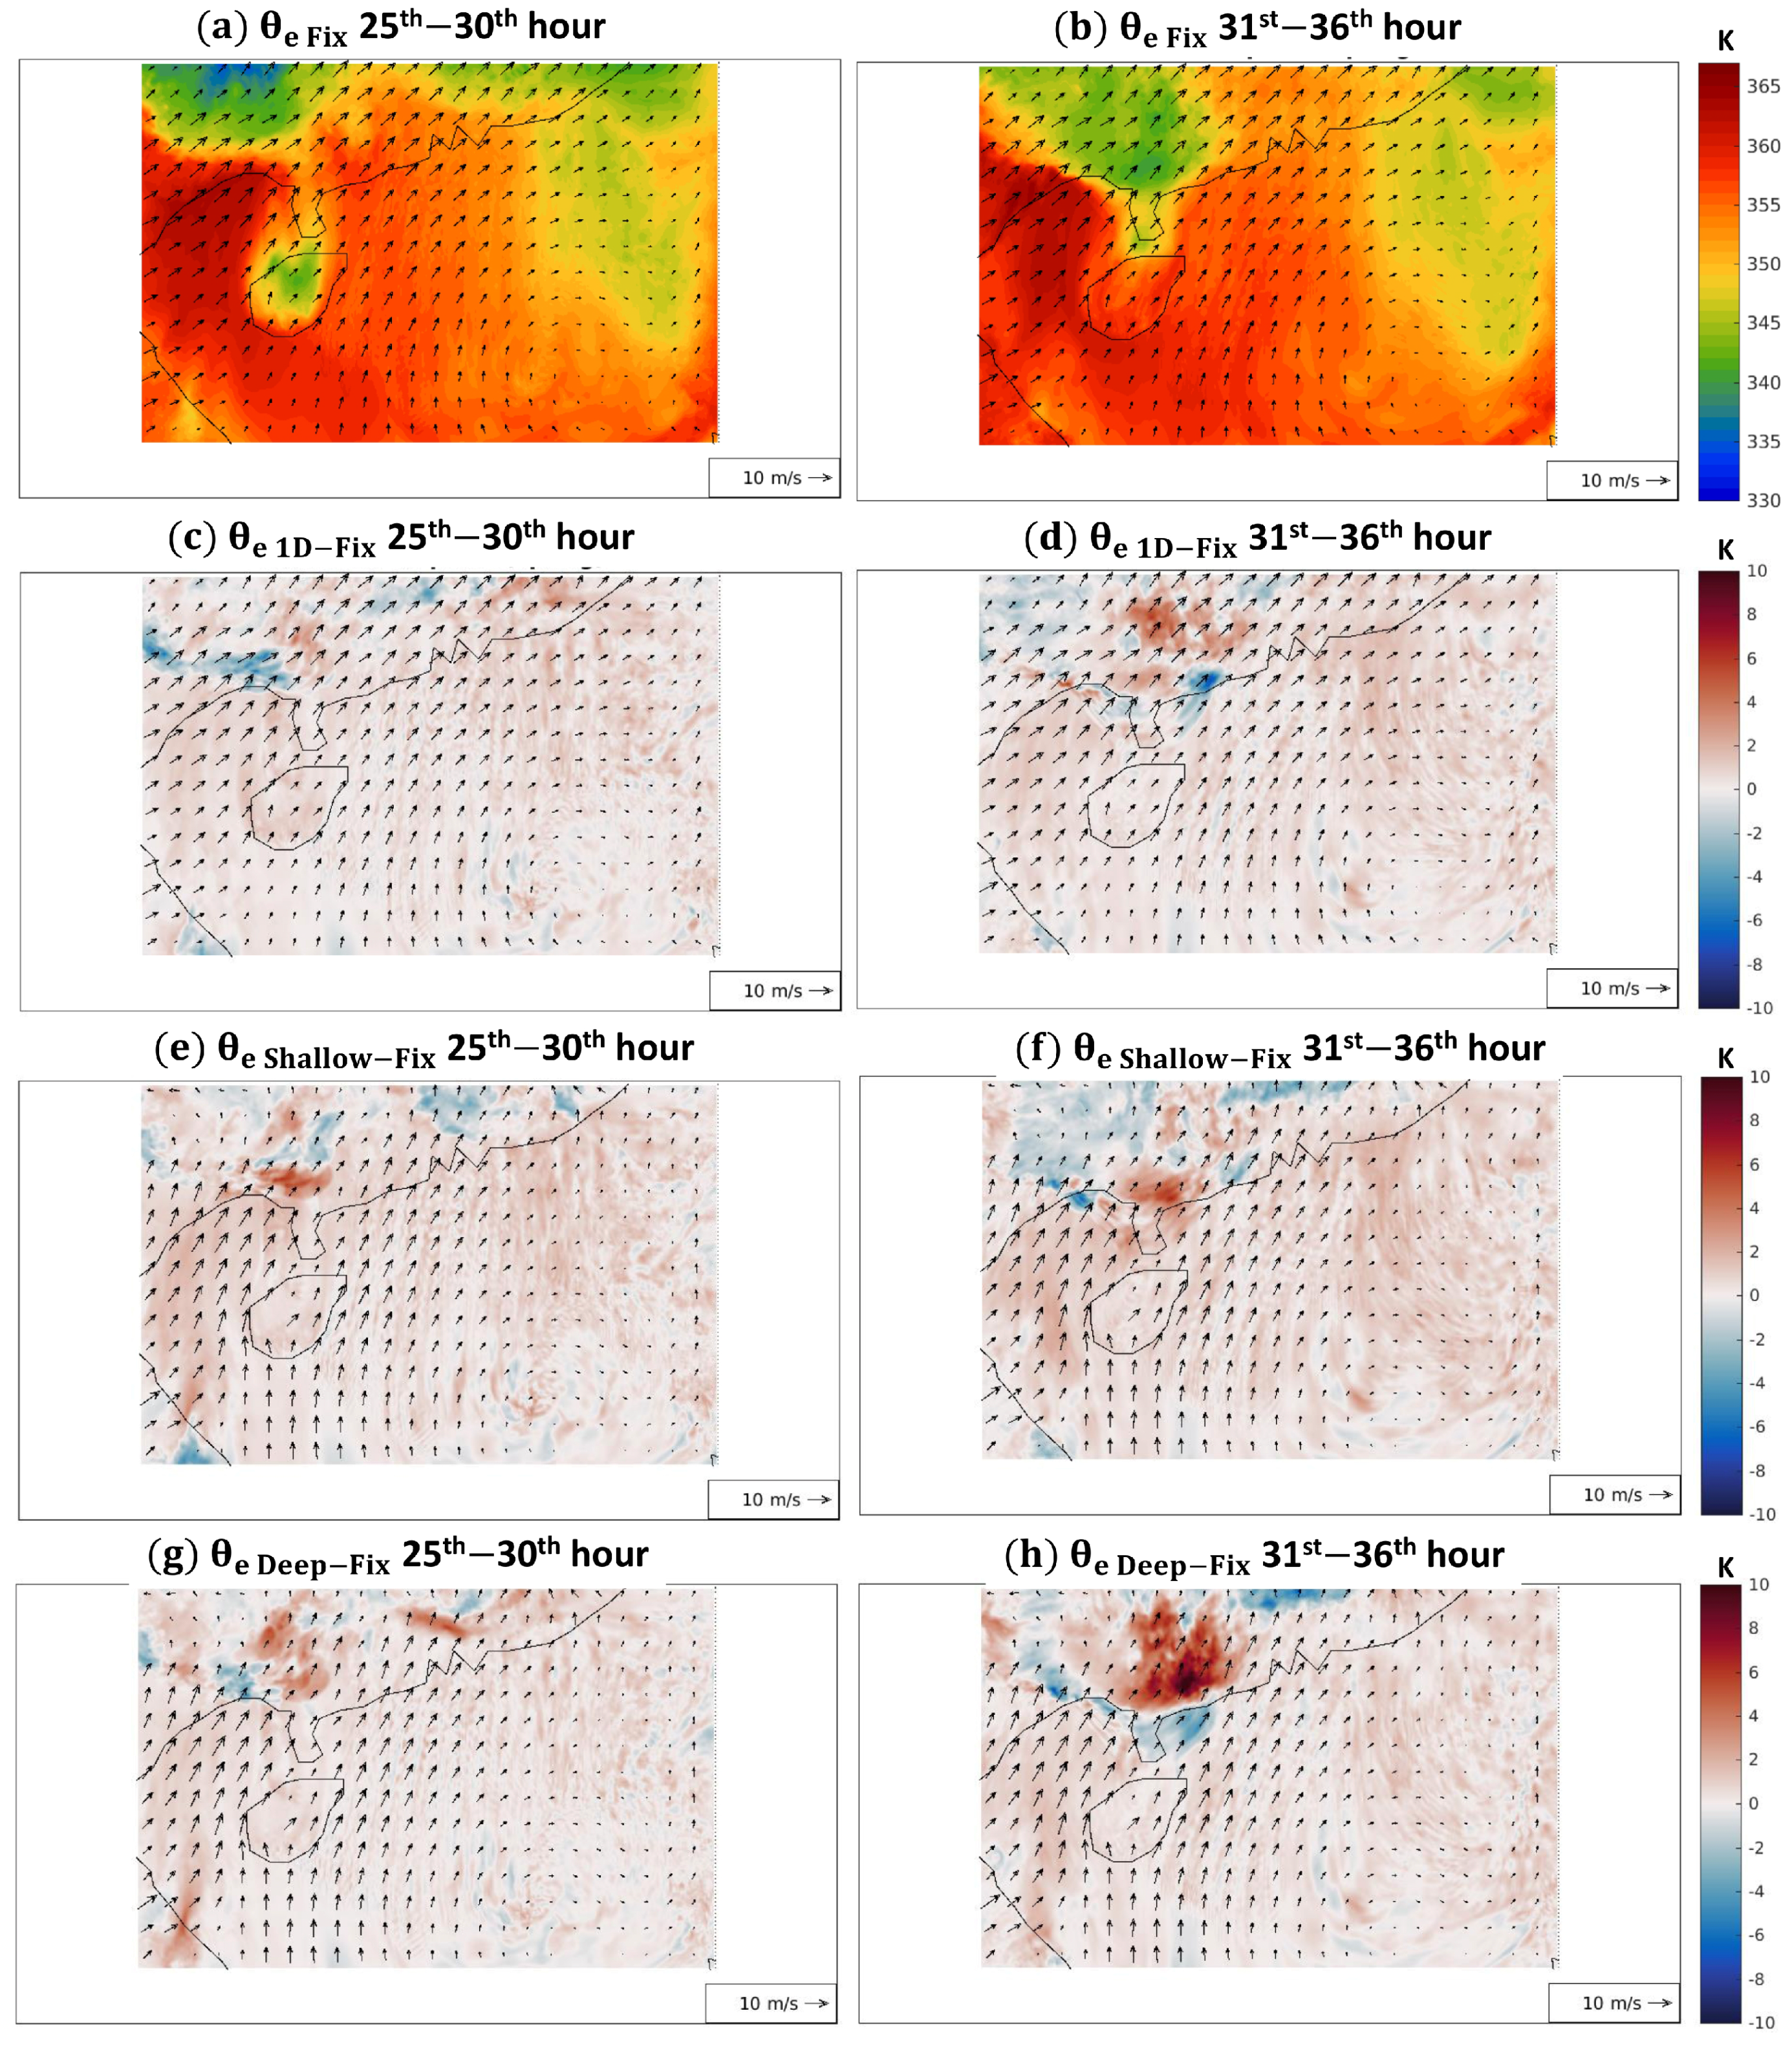
The temporal and spatial changes within the boundary layer are calculated based on the vertical average of the equivalent potential temperature ( θ e ) below the 850 hPa model level. θ e indicates the existence of a warm-moist tongue over the northwestern SCS (Figure 11a,b). The strong southerly wind and high θ e over the west SCS enhance the moisture and entropy transport from the ocean to the coastal region, where the high entropy air encounters low entropy air from the inland area. Figure 11c–f shows that the oceanic flow over the SCS has consistently higher entropy in the 1D and shallow simulations than in the fixed and deep simulations. This supply of low-level high entropy air is probably responsible for the more intense convection in the 1D and shallow simulations. Over land near the storm center, the sign of θ e change is uncertain, especially in Figure 11c,f. Figure 11c shows that over land, near the storm center, the 1D simulation exhibits a tendency to have a boundary layer with higher θ e , but Figure 11f exhibits lower θ e over land but significantly higher θ e over water near the storm center. Because Figure 11c,f are the poststorm period, we believe the inconsistent θ e change over land is the result of the details of storm dynamics instead of the cause of the changes in storm intensity. While the change in oceanic flow entropy intensifies convection in both 1D and Shallow simulations, vertical mixing due to storms may increase or decrease local low-level entropy (compared with Fix and Deep), depending on the details of storm dynamics.

3.4. Particle Trajectory

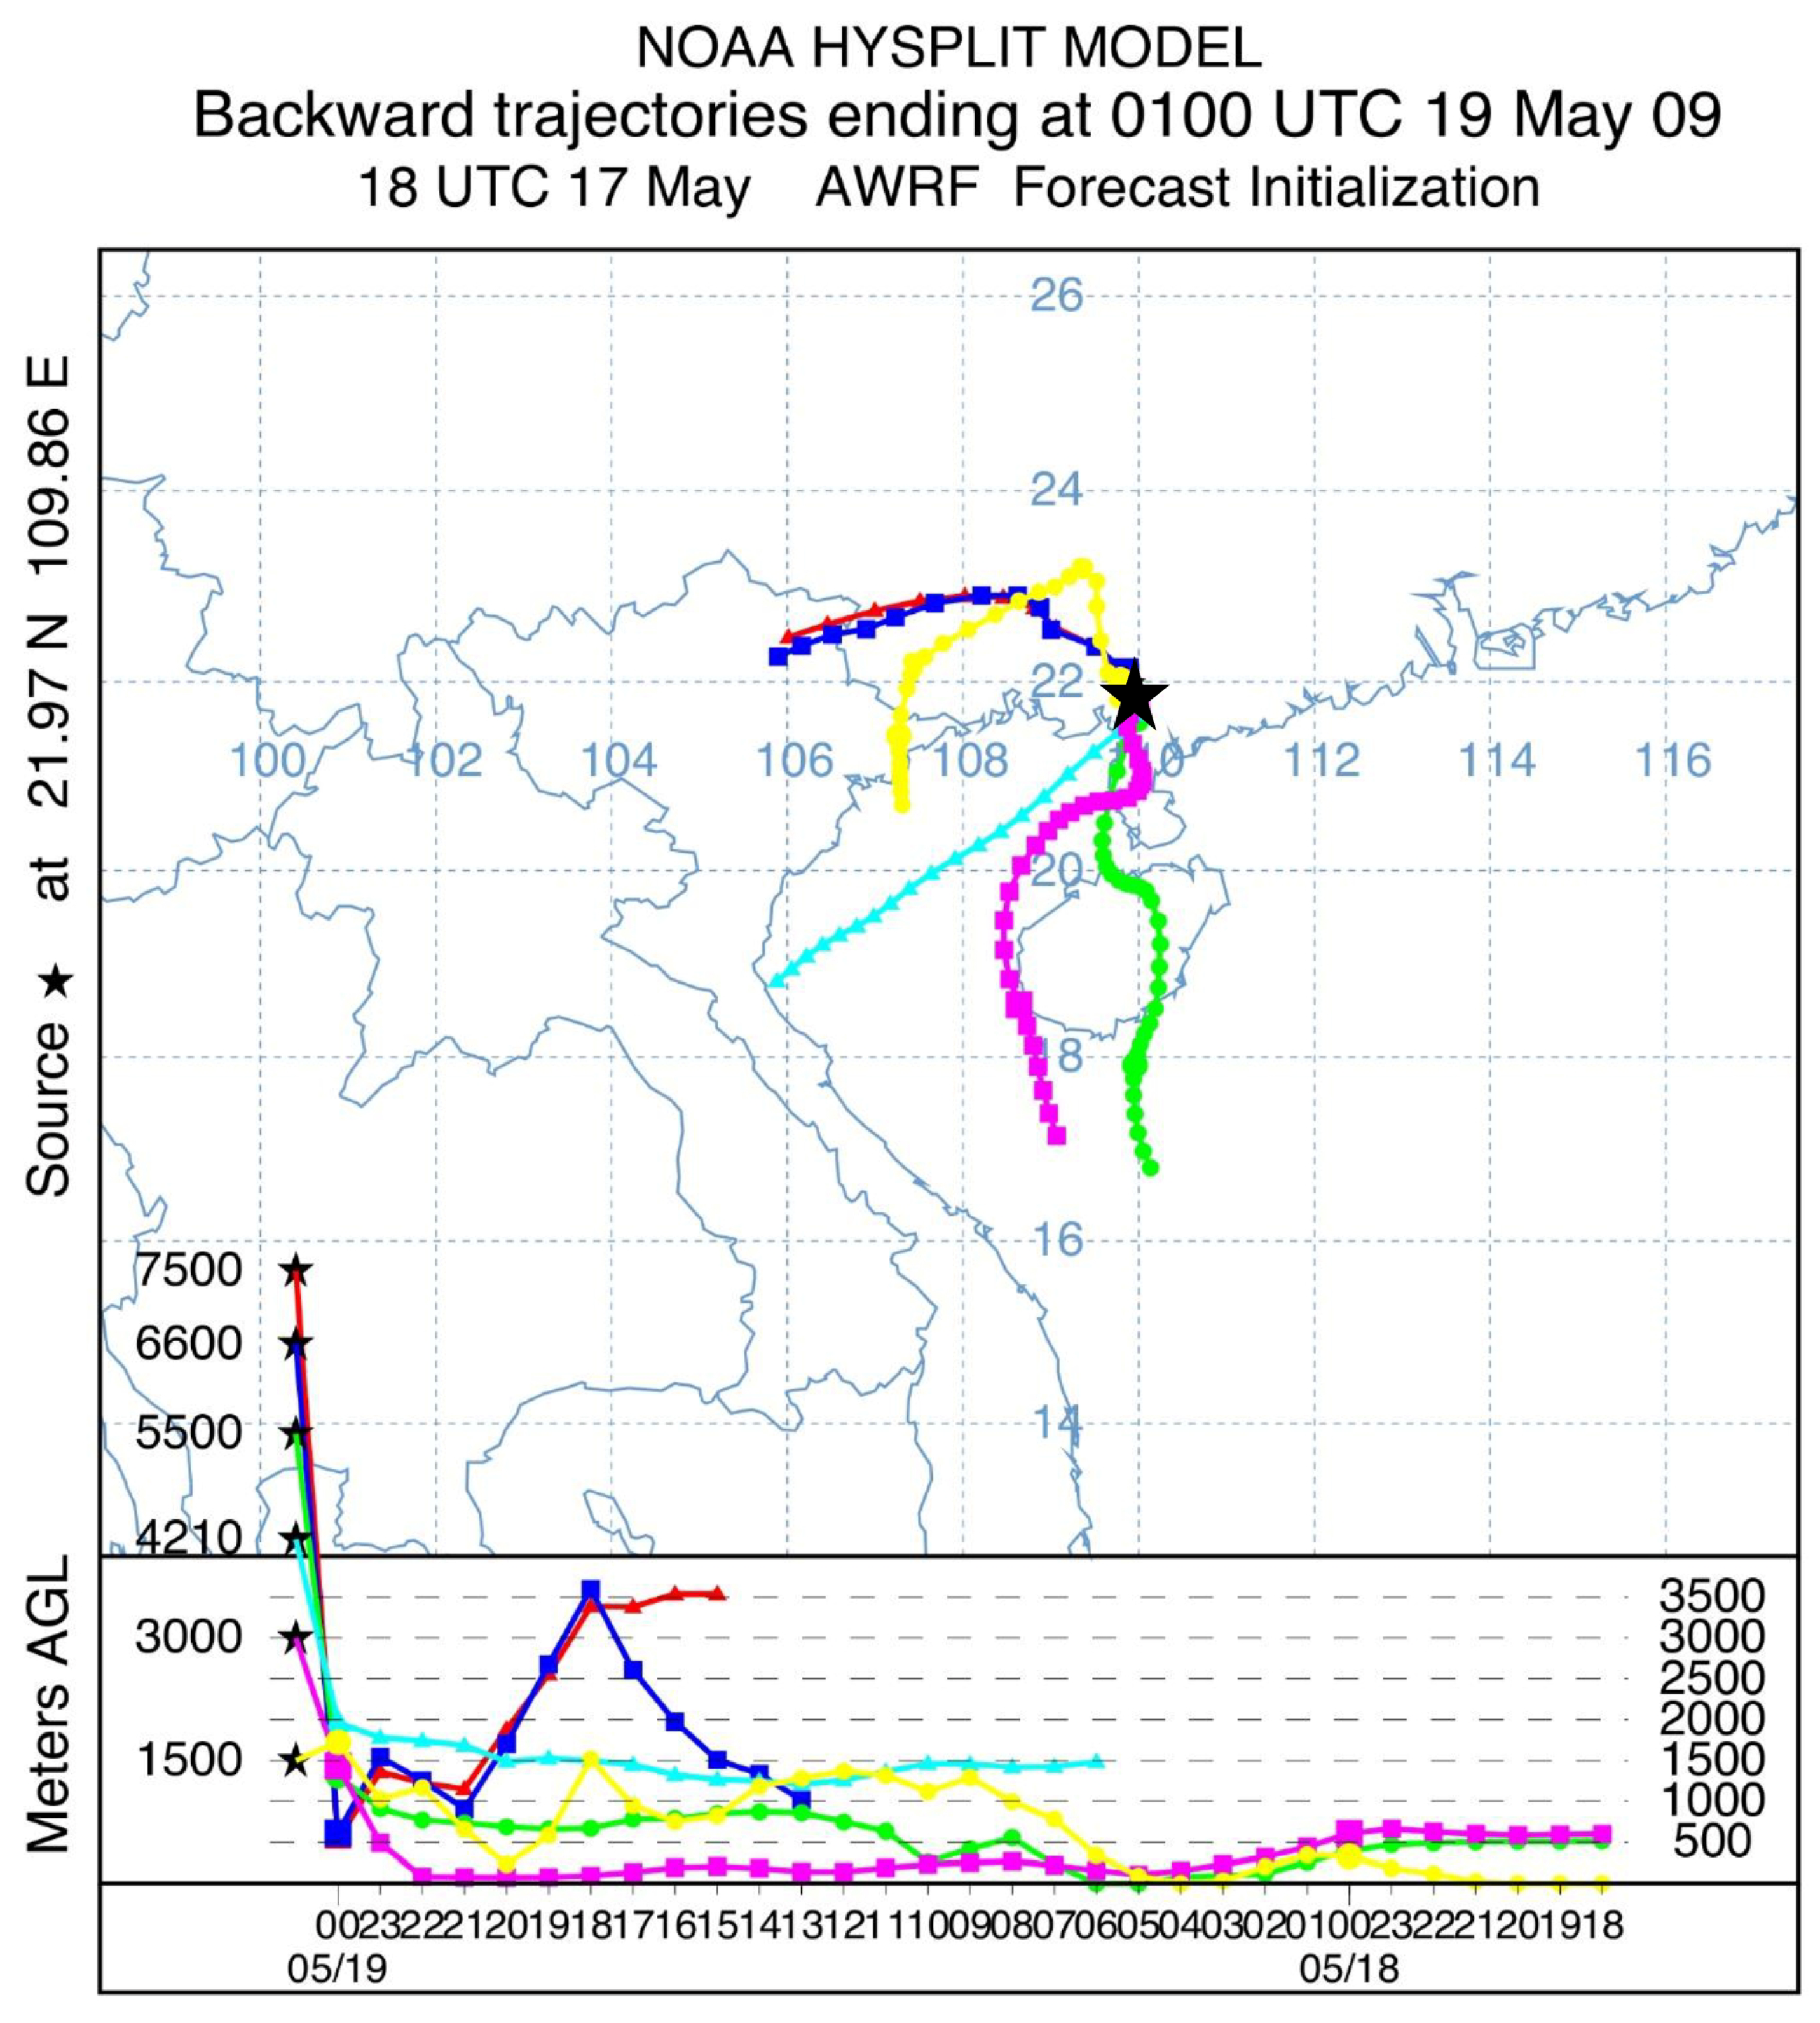
The NOAA HYSPLIT model provides a particle back-tracing function based on predicted wind simulated in WRF. We conducted HYSPLIT analysis by choosing two different times of the particle’s ending position at the 32-nd and 29-th hours of the simulation. This choice is made based on the maximum rainfall rate time, as both simulation times show similar rainfall maxima. The source of the back-tracing analysis starts from 100 randomly selected particle positions inside the storm center at six different vertical levels (Figure 5 white box). Each trajectory is obtained by integrating the HYSPLIT model backward for 30 h. In this study, the proportion of particles that originated from the ocean was calculated based on each of the four simulations and the backward trajectory of the particles. Figure 12 shows a backward trajectory map based on the particle ending at 21.97 N 109.86 E during one of the end times at 1 a.m. UTC (Hour 32 on 19 May 2009). This illustrates that some particles come from different places in the ocean regions and end at four different altitudes, ranging from 1500 m AGL to 5500 m AGL (Figure 12).
Figure 12 shows that particles ending at 1500 m AGL inside the storm center have the longest traveling time among other altitudes. While the overall particle back-tracing shows that both end-times provide slightly different proportions, particles ending at the 32-nd hour of the simulation (01:00 UTC, 19 May 2009) have a larger portion (26%) from the ocean, and those ending at the 29-th hour of the simulation (23:00 UTC, 18 May 2009) have 21% from the ocean (Table 3). The fraction of particles originating from the ocean is lower at higher levels. The large fraction of particles originating from the ocean in the low-level atmosphere suggests that oceanic boundary layer air can travel for a long distance while staying near the ocean surface during travel. Therefore, even when the change in ocean surface heat flux is far from coastal convection, subtle changes in the ocean boundary layer properties can still influence convection triggering and intensity over land.

4. Discussion and Conclusions

The active role of the ocean in the climate system has long been appreciated, and it is also known that the ocean’s memory plays a paramount role in subseasonal to seasonal weather forecasts [37]. However, for short-range weather forecasting, only the intense air–sea interaction in TCs has been addressed in previous studies [9,10,38,39]. In this study, we intend to assess the necessity in the inclusion of ocean mixing process for short-range NWP forecast of extreme rainfall. Our investigation here suggests that in the short-range forecast of non-TC precipitation events, a significant number of them are sensitive to ocean mixing processes, which improves the representation of short-term variability in SST compared with prescribing persistent SST conditions.
In our study, we conducted four groups of simulations, one of which used fixed SST conditions and the others used different setups of the initial mixed layer depth. Of the 26 extreme rainfall cases we simulated, most cases in the four experiments show similar area-mean coastal rainfall. However, the different groups exhibit substantially different rainfall maxima in a significant number of cases. Comparing the group with the standard mixed layer depth setup to that with fixed SST, six cases exhibit a more than 15% increase in rainfall maximum, and two cases exhibit a more than 15% decrease. Similarly, 10 (3) cases exhibit a greater than 15% increase (decrease) in the simulations with shallower mixed layers than in those with deeper layers. The difference in rainfall maxima based on four different experiments suggests the sensitivity to ocean mixed layer modeling, such as the initial ocean mixed layer depth, in simulating extreme rainfall over the coastal region. Under the same initial SST value for each simulation, 1-D ocean mixed layer model added the ocean vertical mixing process to the simulation and leads to larger than 15% change (increase or decrease) in 8 out of the 26 cases.
In the detailed analysis of a single case with larger changes, we found that switching to the mixed layer model from fixed SST leads to an overall increase in SST during the simulation, albeit some locations exhibit changes close to zero. The simulation with a shallower mixed layer also exhibits overall warmer SSTs than the simulation with a deeper mixed layer depth. The SST changes are only a few tenths of a degree. We did not find a significant change in atmospheric water vapor load due to this slight warming effect, but the vertical motions in this case are strengthened substantially. Our analysis suggests that near-surface level air gains higher equivalent potential temperature due to the weak warming effect in SST and eventually leads to the intensification of ascending motions in convection. Such findings of the critical effect of low-level moisture on convection triggering and development are consistent with previous studies [40,41,42].
An examination of all of our simulations shows that the group with the mixed layer model consistently produces warmer SSTs (0–0.5 C) than the group with persistent SSTs; the group with shallower mixed layers also exhibits a consistent warming effect (−0.05–0.3 C). The consistent warming effect may be due to biases in the ERA5 reanalysis data, in which SST data do not have diurnal cycles and are updated every day at 22:00 UTC (06:00 Hong Kong time). However, as shown in Figure 2 and Figure 4, overall warming does not always mean that the persistent SST setup would lead to underestimation of precipitation maxima. While more cases exhibit increases in rainfall maxima in response to warming, some other cases exhibit decreases. Actually, the largest change is in a case in which the average SST increases by 0.14 C when switching from the deep to the shallow mixed layer depth setup but rainfall maxima decreases by 220 mm. The complex responses in the simulations suggest that the effect on rainfall maxima depends not only on regional mean SST but also on spatial variability, which is determined by the detailed distribution of clouds and gustiness and initial SST.
Our study here suggests that even though the short-term air–sea interaction is much less intense when TCs do not exist than when they occur, the temporal and spatial variability of SST can still significantly impact the short-range weather forecast for rainfall extremes. A full dynamic ocean model coupled with the atmosphere model may provide the most accurate representation of ocean dynamics, given that small-scale eddies in the ocean do have a non-negligible effect on storm development [43], but the substantial increase in computational cost may not be desirable for a short-range weather forecast. A simple mixed layer model adds little computational cost to the forecast, yet how to set up its parameters to optimize its accuracy and limit such tuning has not been studied before. This problem will be explored in our future work.
What is also highlighted in our study is the necessity of acquiring subsurface layer observations of the ocean. We showed that the uncertainty in the initial mixed layer depth at an amplitude comparable to its daily variability could lead to a substantial change in the forecast of rainfall extremes. Regardless of whether a full dynamic ocean model or a simple mixed layer model is the preferred choice for short-range weather forecasting, the accuracy of forecasting cannot be effectively enhanced without reliable observation data. Furthermore, an assessment of the model accuracy against observations will be another focus of the future work. The SST bias for different cases will support the analysis to link the SST bias pattern and short-range rainfall forecast. Moving the analysis period to the rainfall cases in recent years will lead to the possible use of the high-density automated station to further support the finding in this study.

Supplementary Materials

The following are available online at https://www.mdpi.com/article/10.3390/atmos12091138/s1, Figure S1: Accumulated Rainfall for eight selected case study based on 1D simulation (Domain 3 data) in Section 3.1.

Author Contributions

Data curation, D.V.L.; investigation, D.V.L.; methodology, D.V.L. and X.S.; resources, X.S.; supervision, X.S.; writing—original draft, D.V.L.; Writing—review and editing, X.S. All authors have read and agreed to the published version of the manuscript.

Funding

This research was funded by the Research Grants Council of Hong Kong SAR, China (Project Nos. AoE/E-603/18 and HKUST 26305720).

Data Availability Statement

Publicly available datasets were analyzed in this study. Land precipitation data can be found here: https://www.psl.noaa.gov/data/gridded/data.cpc.globalprecip.html (access date: 30 August 2021). The tropical cyclones data can be found at https://www.hko.gov.hk/en/publica/pubtc.htm (access date: 30 August 2021). In addition, daily temperature profile and ocean mixed-layer depth data are available at https://resources.marine.copernicus.eu/ (access date: 30 August 2021) and ftp://nrtcmems.mercator-ocean.fr/Core/GLOBALREANALYSISPHYS001017/ (access date: 30 August 2021), respectively.

Conflicts of Interest

The authors declare no conflict of interest.

References

  1. Hartmann, D.L. Global Physical Climatology, 2nd ed.; Newnes: London, UK, 2015; Volume 103. [Google Scholar]
  2. Deser, C.; Alexander, M.A.; Xie, S.P.; Phillips, A.S. Sea surface temperature variability: Patterns and mechanisms. Annu. Rev. Mar. Sci. 2010, 2, 115–143. [Google Scholar] [CrossRef] [Green Version]
  3. Yihui, D.; Chongyin, L.; Yanju, L. Overview of the South China Sea monsoon experiment. Adv. Atmos. Sci. 2004, 21, 343–360. [Google Scholar] [CrossRef]
  4. DeMott, C.A.; Klingaman, N.P.; Tseng, W.L.; Burt, M.A.; Gao, Y.; Randall, D.A. The convection connection: How ocean feedbacks affect tropical mean moisture and MJO propagation. J. Geophys. Res. Atmos. 2019, 124, 11910–11931. [Google Scholar] [CrossRef]
  5. Mahmood, S.; Lewis, H.; Arnold, A.; Castillo, J.; Sanchez, C.; Harris, C. The impact of time-varying sea surface temperature on UK regional atmosphere forecasts. Meteorol. Appl. 2021, 28, e1983. [Google Scholar] [CrossRef]
  6. Kendon, E.; Prein, A.; Senior, C.; Stirling, A. Challenges and outlook for convection-permitting climate modelling. Philos. Trans. R. Soc. A 2021, 379, 20190547. [Google Scholar] [CrossRef]
  7. Fiedler, E.; Mao, C.; Good, S.; Waters, J.; Martin, M. Improvements to feature resolution in the OSTIA sea surface temperature analysis using the NEMOVAR assimilation scheme. Q. J. R. Meteorol. Soc. 2019, 145, 3609–3625. [Google Scholar] [CrossRef]
  8. Strajnar, B.; Cedilnik, J.; Fettich, A.; Ličer, M.; Pristov, N.; Smerkol, P.; Jerman, J. Impact of two-way coupling and sea-surface temperature on precipitation forecasts in regional atmosphere and ocean models. Q. J. R. Meteorol. Soc. 2019, 145, 228–242. [Google Scholar] [CrossRef] [Green Version]
  9. Glenn, S.; Miles, T.; Seroka, G.; Xu, Y.; Forney, R.; Yu, F.; Roarty, H.; Schofield, O.; Kohut, J. Stratified coastal ocean interactions with tropical cyclones. Nat. Commun. 2016, 7, 1–10. [Google Scholar] [CrossRef]
  10. Srinivas, C.; Mohan, G.M.; Naidu, C.; Baskaran, R.; Venkatraman, B. Impact of air-sea coupling on the simulation of tropical cyclones in the North Indian Ocean using a simple 3-D ocean model coupled to ARW. J. Geophys. Res. Atmos. 2016, 121, 9400–9421. [Google Scholar] [CrossRef] [Green Version]
  11. Yan, Y.; Li, L.; Wang, C. The effects of oceanic barrier layer on the upper ocean response to tropical cyclones. J. Geophys. Res. Ocean. 2017, 122, 4829–4844. [Google Scholar] [CrossRef]
  12. Balaguru, K.; Foltz, G.R.; Leung, L.R.; Kaplan, J.; Xu, W.; Reul, N.; Chapron, B. Pronounced impact of salinity on rapidly intensifying tropical cyclones. Bull. Am. Meteorol. Soc. 2020, 101, E1497–E1511. [Google Scholar] [CrossRef] [Green Version]
  13. Su, L.; Li, J.; Shi, X.; Fung, J.C. Spatiotemporal variation in presummer precipitation over south China from 1979 to 2015 and its relationship with urbanization. J. Geophys. Res. Atmos. 2019, 124, 6737–6749. [Google Scholar] [CrossRef]
  14. Huang, H.; Mao, W. The South China sea monsoon experiment—Boundary layer height (SCSMEX-BLH): Experimental design and preliminary results. Mon. Weather Rev. 2015, 143, 5035–5053. [Google Scholar] [CrossRef]
  15. Wu, N.; Zhuang, X.; Min, J.; Meng, Z. Practical and intrinsic predictability of a warm-sector torrential rainfall event in the South China monsoon region. J. Geophys. Res. Atmos. 2020, 125, e2019JD031313. [Google Scholar] [CrossRef]
  16. Luo, Y.; Zhang, R.; Wan, Q.; Wang, B.; Wong, W.K.; Hu, Z.; Jou, B.J.D.; Lin, Y.; Johnson, R.H.; Chang, C.P.; et al. The southern China monsoon rainfall experiment (SCMREX). Bull. Am. Meteorol. Soc. 2017, 98, 999–1013. [Google Scholar] [CrossRef]
  17. Huang, L.; Luo, Y.; Zhang, D.L. The relationship between anomalous presummer extreme rainfall over South China and synoptic disturbances. J. Geophys. Res. Atmos. 2018, 123, 3395–3413. [Google Scholar] [CrossRef] [Green Version]
  18. Zhang, L.; Sun, J.; Ying, Z.; Xiao, X. Initiation and development of a squall line crossing Hangzhou Bay. J. Geophys. Res. Atmos. 2021, 126, e2020JD032504. [Google Scholar]
  19. Skamarock, W.C.; Klemp, J.B.; Dudhia, J.; Gill, D.O.; Liu, Z.; Berner, J.; Wang, W.; Powers, J.G.; Duda, M.G.; Barker, D.M.; et al. A Description of the Advanced Research WRF Model Version 4; National Center for Atmospheric Research: Boulder, CO, USA, 2019; p. 145. [Google Scholar]
  20. Pollard, R.T.; Rhines, P.B.; Thompson, R.O. The deepening of the wind-mixed layer. Geophys. Fluid Dyn. 1973, 4, 381–404. [Google Scholar] [CrossRef]
  21. Emanuel, K.; DesAutels, C.; Holloway, C.; Korty, R. Environmental control of tropical cyclone intensity. J. Atmos. Sci. 2004, 61, 843–858. [Google Scholar] [CrossRef]
  22. Davis, C.; Wang, W.; Chen, S.S.; Chen, Y.; Corbosiero, K.; DeMaria, M.; Dudhia, J.; Holland, G.; Klemp, J.; Michalakes, J.; et al. Prediction of landfalling hurricanes with the advanced hurricane WRF model. Mon. Weather Rev. 2008, 136, 1990–2005. [Google Scholar] [CrossRef] [Green Version]
  23. Chen, M.; Xie, P. 3.3. Quality Control of Daily Precipitation Reports at NOAA/CPC. 2008. Available online: https://ftp.cpc.ncep.noaa.gov/precip.orig/CPC_UNI_PRCP/GAUGE_GLB/DOCU/CPC%20GTS%20QC%20AMS2008MingyueChen.pdf (accessed on 30 July 2020).
  24. Thompson, G.; Field, P.R.; Rasmussen, R.M.; Hall, W.D. Explicit forecasts of winter precipitation using an improved bulk microphysics scheme. Part II: Implementation of a new snow parameterization. Mon. Weather Rev. 2008, 136, 5095–5115. [Google Scholar] [CrossRef]
  25. Iacono, M.J.; Delamere, J.S.; Mlawer, E.J.; Shephard, M.W.; Clough, S.A.; Collins, W.D. Radiative forcing by long-lived greenhouse gases: Calculations with the AER radiative transfer models. J. Geophys. Res. Atmos. 2008, 113. [Google Scholar] [CrossRef]
  26. Chen, F.; Dudhia, J. Coupling an advanced land surface–hydrology model with the Penn State–NCAR MM5 modeling system. Part I: Model implementation and sensitivity. Mon. Weather Rev. 2001, 129, 569–585. [Google Scholar] [CrossRef] [Green Version]
  27. Hong, S.Y.; Noh, Y.; Dudhia, J. A new vertical diffusion package with an explicit treatment of entrainment processes. Mon. Weather Rev. 2006, 134, 2318–2341. [Google Scholar] [CrossRef] [Green Version]
  28. Zhang, C.; Wang, Y.; Hamilton, K. Improved representation of boundary layer clouds over the southeast Pacific in ARW-WRF using a modified Tiedtke cumulus parameterization scheme. Mon. Weather Rev. 2011, 139, 3489–3513. [Google Scholar] [CrossRef] [Green Version]
  29. Zuo, H.; Balmaseda, M.A.; Mogensen, K. The new eddy-permitting ORAP5 ocean reanalysis: Description, evaluation and uncertainties in climate signals. Clim. Dyn. 2017, 49, 791–811. [Google Scholar] [CrossRef]
  30. de Boyer Montégut, C.; Madec, G.; Fischer, A.S.; Lazar, A.; Iudicone, D. Mixed layer depth over the global ocean: An examination of profile data and a profile-based climatology. J. Geophys. Res. Ocean. 2004, 109. [Google Scholar] [CrossRef]
  31. Hersbach, H.; Bell, B.; Berrisford, P.; Biavati, G.; Horányi, A.; Muñoz Sabater, J.; Nicolas, J.; Peubey, C.; Radu, R.; Rozum, I.; et al. ERA5 Hourly Data on Pressure Levels from 1979 to Present, Copernicus Climate Change Service (C3S) Climate Data Store (CDS). 2018. Available online: https://cds.climate.copernicus.eu/cdsapp#!/dataset/10.24381/cds.bd0915c6?tab=overview (accessed on 4 August 2020). [CrossRef]
  32. Stein, A.; Draxler, R.R.; Rolph, G.D.; Stunder, B.J.; Cohen, M.; Ngan, F. NOAA’s HYSPLIT atmospheric transport and dispersion modeling system. Bull. Am. Meteorol. Soc. 2015, 96, 2059–2077. [Google Scholar] [CrossRef]
  33. Liang, J.; Yong, Y. Climatology of atmospheric rivers in the Asian monsoon region. Int. J. Climatol. 2021, 41, E801–E818. [Google Scholar] [CrossRef]
  34. Su, L.; Fung, J.C.; Li, J.; Wong, W.K. Trends in diurnal cycle of summertime rainfall over coastal South China in the past 135 years: Characteristics and possible causes. J. Geophys. Res. Atmos. 2021, 126, e2020JD033621. [Google Scholar] [CrossRef]
  35. Frankignoul, C.; Kestenare, E. The surface heat flux feedback. Part I: Estimates from observations in the Atlantic and the North Pacific. Clim. Dyn. 2002, 19, 633–647. [Google Scholar]
  36. Park, S.; Deser, C.; Alexander, M.A. Estimation of the surface heat flux response to sea surface temperature anomalies over the global oceans. J. Clim. 2005, 18, 4582–4599. [Google Scholar] [CrossRef] [Green Version]
  37. Vitart, F.; Robertson, A. The sub-seasonal to seasonal prediction project (S2S) and the prediction of extreme events. NPJ Clim. Atmos. Sci. 2018, 1, 1–7. [Google Scholar] [CrossRef] [Green Version]
  38. Souri, A.H.; Choi, Y.; Kodros, J.K.; Jung, J.; Shpund, J.; Pierce, J.R.; Lynn, B.H.; Khain, A.; Chance, K. Response of Hurricane Harvey’s rainfall to anthropogenic aerosols: A sensitivity study based on spectral bin microphysics with simulated aerosols. Atmos. Res. 2020, 242, 104965. [Google Scholar] [CrossRef]
  39. Dong, W.; Feng, Y.; Chen, C.; Wu, Z.; Xu, D.; Li, S.; Xu, Q.; Wang, L.; Beardsley, R.C.; Lin, H.; et al. Observational and modeling studies of oceanic responses and feedbacks to typhoons Hato and Mangkhut over the northern shelf of the South China Sea. Prog. Oceanogr. 2021, 191, 102507. [Google Scholar] [CrossRef]
  40. Weckwerth, T.M. The effect of small-scale moisture variability on thunderstorm initiation. Mon. Weather Rev. 2000, 128, 4017–4030. [Google Scholar] [CrossRef]
  41. Hsiao, F.; Chen, Y.L.; Hitzl, D.E. Heavy rainfall events over central Oahu under weak wind conditions during seasonal transitions. Mon. Weather Rev. 2020, 148, 4117–4141. [Google Scholar] [CrossRef]
  42. Du, Y.; Chen, G. Heavy rainfall associated with double low-level jets over southern China. Part II: Convection initiation. Mon. Weather Rev. 2019, 147, 543–565. [Google Scholar] [CrossRef]
  43. Grist, J.P.; Josey, S.A.; Sinha, B.; Catto, J.L.; Roberts, M.J.; Coward, A.C. Future evolution of an eddy rich ocean associated with enhanced east Atlantic storminess in a coupled model projection. Geophys. Res. Lett. 2021, 48, e2021GL092719. [Google Scholar] [CrossRef]
Figure 1. Terrain height (color shading) and WRF domain setup. Domain d01 and d03 (black box) are shown.
Atmosphere 12 01138 g001
Figure 2. Thirty-six-hour accumulated coastal rainfall of 26 selected cases based on its spatial average and maximum value in Domain d03 for (A,C) 1D and Fix (B,D) Shallow and Deep Simulation.
Atmosphere 12 01138 g002
Figure 3. (ac) 700 hPa wind (vector) and horizontal moisture flux (shading) and (df) eddy component (deviation from zonal mean) of 700 hPa temperature (shading) and 500 hPa geopotential height (contours). Data from 1D simulations are used in these composite maps. Each variable represents the mean value of the group at the time of each member’s maximum rainfall rate.
Atmosphere 12 01138 g003
Figure 4. Scatter plot of the difference in area-maximum of 36-h-accumulated coastal rainfall (mm) vs. difference in SST ( C) at the end of the simulation. The blue dots and circles represent the difference between 1D and Fix, while the red dots and circles are the difference between Shallow and Deep. Only cases with positive change in rain maxima are shown in filled circles.
Atmosphere 12 01138 g004
Figure 5. Accumulated rainfall of different experiments based on (a) 1D, (b) Fix, (c) Shallow, and (d) Deep Simulation.
Atmosphere 12 01138 g005
Figure 6. Area-averaged water vapor path (WVP) within the storm region (white box in Figure 5) in the simulations of Case 20.
Atmosphere 12 01138 g006
Figure 7. Vertical velocity (w) inside the storm region (white box in Figure 5) during the simulation of Case 20. (a) Shows the area-maximum value based on 1D; (b) area-mean value based on 1D, difference between 1D and Fix simulation according to (c) the area-maximum and (d) area-mean.
Atmosphere 12 01138 g007
Figure 8. SST at the end of simulations based on (a) Fix, (bd) shows the difference between 1D, Shallow, and Deep in comparison to Fix simulation.
Atmosphere 12 01138 g008
Figure 9. (A) Area mean total energy flux (net radiation + net heat flux) and (B) net heat (sensible + latent) flux at the ocean surface in the simulations of Case 20. Data are averaged over the entire domain d03.
Atmosphere 12 01138 g009
Figure 10. Difference between simulations for the temporarily averaged net heat flux (W/m2) for the periods of Hours 25 to 30 and Hours 31 to 36. (a,b) shows the spatial pattern of Fix simulation, (ch) shows the difference between 1D, Shallow, and Deep in comparison to Fix simulation.
Atmosphere 12 01138 g010
Figure 11. Equivalent potential temperature, θ e (K) for (a,b) Fix and (ch) the difference between simulations. θ e data is the mean value within the PBL. Vectors show the mean wind at the 850-hPa level based on the 1D simulation.
Atmosphere 12 01138 g011
Figure 12. The backward trajectory calculated for some particles ended at 21.97 N, 109.66 E at Hour 32 (peak time of rainfall). Different colors with marker represent six different altitudes of the particle’s ending point, red: 7500 m; dark blue: 6600 m; green: 5500 m; light blue: 4210 m; rose red: 3000 m; yellow: 1500 m. The calculation was performed by integrating the HYSPLIT model backwards for 30 h. The starting points (right ends in the bottom panel) of some trajectories are not 30 h prior to the ending time because the tracing reaches the western boundary of Domain d03.
Atmosphere 12 01138 g012
Table 1. List of the physical scheme used in WRF simulation.
CategorySetup
MicrophysicsThompson [24]
RadiationRapid Radiative Transfer Model [25]
Land surfaceNoah Land Surface Model [26]
Planetary Boundary Layer (PBL)YSU [27]
Cumulus parameterizationTiedtke [28]
Ocean physicsPollard OML model [20]
Table 2. Experimental setup for each simulation. Shallow and Deep simulations are simulated based on the same setup as 1D with ±1 standard deviation (STD) difference from the initial MLD.
ExperimentSST ConditionOcean Coupling
FixERA5 initial SST (fixed)None
1DERA5 initial SST, SST changing based on WRF 1-D OML model (initial MLD = daily MLD, lapse rate = area mean daily lapse rate from vertical temperature profile)1-D OML model
ShallowERA5 initial SST, SST changing based on WRF 1-D OML model (initial MLD = daily MLD − 1 STD, lapse rate = area mean daily lapse rate from vertical temperature profile)1-D OML model
DeepERA5 initial SST, SST changing based on WRF 1-D OML model (initial MLD = daily MLD + 1 STD, lapse rate = area mean daily lapse rate from vertical temperature profile)1-D OML model
Table 3. Particles originated from the ocean based on HYSPLIT model integration. The ending points are set at 100 locations inside the storm center for each height level, and trajectories are calculated by integrating backwards for 30 h.
End-Time7500 m6600 m5500 m4210 m3000 m1500 m
11 p.m. UTC 18 May 20094%3%5%6%10%26%
1 a.m. UTC 19 May 20096%8%8%11%15%21%
Publisher’s Note: MDPI stays neutral with regard to jurisdictional claims in published maps and institutional affiliations.