Article

Remote Impacts from El Niño and La Niña on Climate Variables and Major Crops Production in Coastal Bangladesh

by
Md. Abdus Sattar
1,*,
Shamim Mia
2,
Afroza Akter Shanta
1,
A. K. M. Abdul Ahad Biswas
1 and
Fulco Ludwig
3
1
Department of Disaster Risk Management, Patuakhali Science and Technology University, Patuakhali 8602, Bangladesh
2
Department of Agronomy, Patuakhali Science and Technology University, Patuakhali 8602, Bangladesh
3
Department of Environmental Sciences, Wageningen University, 6700 AA Wageningen, The Netherlands
*
Author to whom correspondence should be addressed.
Atmosphere 2021, 12(11), 1449; https://doi.org/10.3390/atmos12111449
Submission received: 28 September 2021 / Revised: 27 October 2021 / Accepted: 31 October 2021 / Published: 2 November 2021
(This article belongs to the Special Issue Atmosphere-Ocean Interactions)

Abstract

:
El Niño and La Niña Southern Oscillation (ENSO) are major drivers that affect climatic variables in many countries. Therefore, ENSO mediated variation in climatic factors have significant consequences for crop production. We studied ENSO mediated variations in temperature and rainfall in the five coastal districts of Bangladesh during 1951–2017, and the impacts on major crops production were analyzed using growing degree day (GDD) index. Statistical analyses were performed on different climatic parameters in relation to ENSO events and locations. Results indicate that ENSO events had significant influence on monthly, seasonal and annual temperature and rainfall amounts (p < 0.05). Specifically, maximum temperature under ENSO phases were higher during Kharif-I and Kharif-II seasons than neutral years. In contrast, the minimum temperature was higher in neutral years than ENSO events during Rabi season. Averaged across stations, annual mean maximum temperature was 0.5 and 0.23 °C higher during El Niño and La Niña compared to neutral years. Rainfall was higher during neutral years compared to El Niño and La Niña. These changes in seasonal temperature variably changed crop GDD in different locations and thus, crop growth duration and crop yield. Therefore, this study provides a general understanding to ENSO mediated impacts on coastal agriculture in Bangladesh.

1. Introduction

El Niño Southern Oscillation (ENSO), a strong climatic driver, is active in the tropical regions with significant impacts on the climate and weather systems [1,2,3]. It results from the ocean–atmosphere interactions occurred in inter-annual timescales. These interactions usually result in two different types of climate phenomenon, i.e., warm (El Niño) and cold (La Niña) sea surface temperature (SST) in the central and eastern Pacific Ocean. Variation in the ENSO cycles may simply be a result of random fluctuations in the Earth’s highly perplexing climate system [4]. However, El Niño Southern Oscillation is also classified into eastern Pacific (EP) and central Pacific (CP) types based on their occurrence in the tropical eastern Pacific and the tropical central Pacific, respectively [5,6,7,8].
A range of studies have shown that ENSO events significantly impact global weather and climatic variables [9,10,11,12,13,14,15,16,17,18]. For instance, Rishma and Katpatal [17] reported that the average rainfall during El Niño years was less than it was during La Niña and normal years in central India. However, impacts of ENSO signals on climate variables are not uniform, rather it significantly varies with locations across the globe [19]. Moreover, it is well-known that extreme climatic events such as drought, flood, and tropical cyclone are associated with ENSO events [20,21,22]. Thus, ENSO events could have significant effects on agricultural production.
Since ENSO signals have strong teleconnection impacts on climate variables, which can substantially regulate crop production in some regions of the world [14,16,23,24,25,26,27,28]. As each crop requires a cardinal temperature and a specific amount of rainfall for its proper growth and development. A temperature below and above the cardinal temperature negatively affects crop growth and development, while soil moisture deficit (drought) or excess than the requirement (waterlogging) has similar negative impacts. For instance, rice production is sensitive to temperature and rainfall particularly during its stem prolongation, the booting, heading, flowering, and grain filling stages [29,30]. Thus, the agriculture sector may experience additional stress from weather and climatic variables related to the ENSO phenomenon.
Growing degree day (GDD) is one of the most common temperature indexes used to estimate plant growth and development in relation to the variations in temperature [31,32]. This index estimates the impacts of temperature on the development and production of a specific crop grown in a specific agro-climatic zone. Temperature largely influences not only the growth duration but also the growth pattern and productivity of crops. For example, Asseng, et al. [33] reported that a variation in temperature by ±2 °C from the mean temperature during a growing season in Australia can reduce wheat yield up to 50%. As GDD estimates the crop growth duration, it can be used for estimating the impacts of temperature on yields of major crops.
While Bangladesh is an agro-based country and its majority of the rural population rely on agriculture, there are only a few studies that examined ENSO effects on climatic variables [18,34,35] while the impacts of ENSO events on agriculture is completely missing. Therefore, the present study was conducted to analyze the impacts of El Niño and La Niña Southern Oscillation on climatic variables and their indirect effects on the major crops grown in five coastal districts of Bangladesh.

2. Materials and Methods

2.1. Study Area

Bangladesh is an agro-based developing country having an area of about 1,47,570 square kilometers and its geographical position is between 20°34′ N to 26°38′ N and 88°01′ E to 92°41′ E. It has 64 administrative districts, where 19 of these districts such as Jessore, Narail, Gopalganj, Shariatpur, Satkhira, Khulna, etc. are situated in the coastal areas (Figure 1). Based on the geographic features, coastal zones of Bangladesh are categorized into three main regions, namely, (a) the eastern zone, (b) the central zone, and (c) the western zone. The current study was conducted with five coastal districts, i.e., Barishal, Bhola, Patuakhali, Satkhira, and Khulna, comprising three from central and two from the western zones, which are highlighted in the map in Figure 1.
Bangladesh Meteorological Department (BMD) in Bangladesh has 34 observational stations to record climatic data, which are shown in Figure 1. Five stations from the five south-central and south-western coastal districts (one from each district) were purposefully selected to analyze the impacts of ENSO signals in the coastal Bangladesh.

2.2. Major Cropping Seasons

The soil and the climatic conditions of Bangladesh are suitable for growing different crop production. Therefore, farmers can cultivate diversified crops throughout the year. There are three main crop seasons in Bangladesh. These are Kharif-I, Kharif-II, and Rabi, which, respectively, correspond to Aus, Aman, and Boro season for rice cultivation [24]. Here, we considered that the Kharif-I season extends from March to June, whereas Kharif-II covers the months between July to October and the Rabi season consists of rest of the time of the year, November to March. Rice is usually transplanted and thus, it remains in the nursery bed for around a month before transplanting. Therefore, the rice growing seasons, i.e., Aus, Aman and Boro are, respectively, considered from April to August (5 months), July to December (6 months) and December to May (6 months), a slightly different than agricultural seasons. For this reason, the seasonal variation in temperature and rainfall was separately determined both for agricultural seasons and rice growing seasons.

2.3. Selection of ENSO Events

The selection of ENSO years varies largely between studies. Since the present study aimed at investigating the impacts of ENSO signals on major crops in the coastal areas of Bangladesh, we chose the ENSO events from Climate Prediction Center of NOAA/National Weather Service (https://origin.cpc.ncep.noaa.gov/products/analysis_monitoring/ensostuff/ONI_v5.php last accessed on 30 June 2019 ) where seasonal warm (El Niño) and cold (La Niña) periods are defined as exceeds of the threshold temperature (ERSST.v5 SST) by ±0.5 °C for 3 months in the Niño 3.4 region (5° N–5° S, 120°–170° W). The variation was considered for the Oceanic Niño Index (ONI) for a minimum of five consecutive overlapping seasons. In addition, we chose only the dominant El Niño/La Niña years by considering this threshold ±1.0 °C for the ONI without overlapping El Niño/La Niña in the entire month. Because crops are grown all year-round, a small variation needs to be considered for. The neutral years are selected when no warm and cold events exist throughout the year. Finally, we selected 11 El Niño, nine La Niña, and eight neutral years (Table 1).

2.4. Calculation of GDD

The GDD is a popular index for estimating the impacts of extreme temperature events on crop production. This index is also known as Growing Degree Units (GDU). It is a simple but important method to predict when a particular plant stage will occur. Therefore, it can be used to determine the total accumulated heat required for the completion of life cycle a specific crop. In this study, we computed GDD by using Equation (1) below, which was proposed by McMaster and Wilhelm [36]:
GDD = Tmax + Tmin 2 Tbase
where Tmax and Tmin represent daily maximum and minimum air temperature, respectively, and Tbase is the base temperature, which is considered as 10 °C [37]. The GDD was computed in this study using the temperature data of the year 1976 to 2017 since the data were available from 1976.

2.5. Impact on Crops

The impact of ENSO events on major crops grown in the study area was determined by analyzing the development of the crop growth phases in relation to GDD. First, GDD for each crop was calculated from the daily GDD experienced in its life span when grown in a particular district in a neutral year. Here, the sowing and harvesting time of the crops were used from the crop calendar of the Department of Agricultural Extension (DAE) of the government of Bangladesh. Next, the average GDD of a crop was derived from GDD of different districts. Moreover, the life span of a crop was divided into four growth stages, i.e., seedling, vegetative, flowering, and maturity. We considered that seedling, vegetative, flowering, and maturity stages of a crop, respectively, require 30%, 40%, 15%, and 15% of the total GDD [38,39]. The GDD required for each of these stages is presented in Table S3. Later, time required for completion of each growth stages under different ENSO events was estimated from the number of days required to experience the total GDD of the corresponding stage. Finally, total growth duration of a crop is derived by summing up the durations for different growth stages.
The possible impacts of ENSO events on yield were assessed considering the occurrence of different growth events and its photosynthesis efficiency, and possible climatic hazards. We considered that a reduction in growth duration would reduce yield while it can facilitate early planting of the next crop [40]. Additionally, we considered that exposure of crops to extreme conditions such as high or low temperatures at critical growth stages (flowering and grain filling) will significantly reduce fruit setting, grain weight and grain yield [41,42]. Opposite effects are expected when the duration of crop increases. Considering the change in growth duration, we evaluated the possibility of facing natural hazards such as flood, waterlogging, and nor’wester in different seasons. Here, we used crop and hazard calendars for assessing the potential hazards. Instead of presenting the impact of ENSO events on crops under five different districts, here, we combined them into two zones, i.e., Barishal and Khulna, because, the variation in climatic factors between districts under each zone was minimal. Additionally, we also compared the total life span of different crops grown in two different zones.

2.6. Data Sources and Statistical Analysis

In this study, daily rainfall and temperature (daily maximum and daily minimum) data from 1951 to 2017 were obtained from five observational stations of BMD that are situated in the south-central and south-western coastal districts (Figure 1). Monthly and seasonal average temperature and total rainfall for each station were computed from daily data. Some stations (Barishal, Khulna and Satkhira) have data from 1951, while others only from 1966 (Bhola) and 1982 (Patuakhali). Crop data were collected from Bangladesh Bureau of Statistics (BBS) [43]. We performed composite analysis since this analysis is considered as a better method than correlation to assess the impacts of ENSO teleconnection [44].
We applied statistical methods in order to test whether climatic factors vary for different ENSO events using one-way Analysis of Variance (ANOVA) with the help of IBM SPSS Statistics 23. Post hoc test (Tukey’s b at α = 5%) was applied for separating the means of the variables. Similarly, spatial variability of climatic variables was also analyzed following one way ANOVA. A two-way analysis of variance (ANOVA) was also performed to assess variation in climatic factors and GDD due to location and seasons, ENSO events and location, ENSO events, and season.

3. Results

3.1. Variation in Monthly and Annual Temperature and Rainfall Composite

3.1.1. Monthly Variations

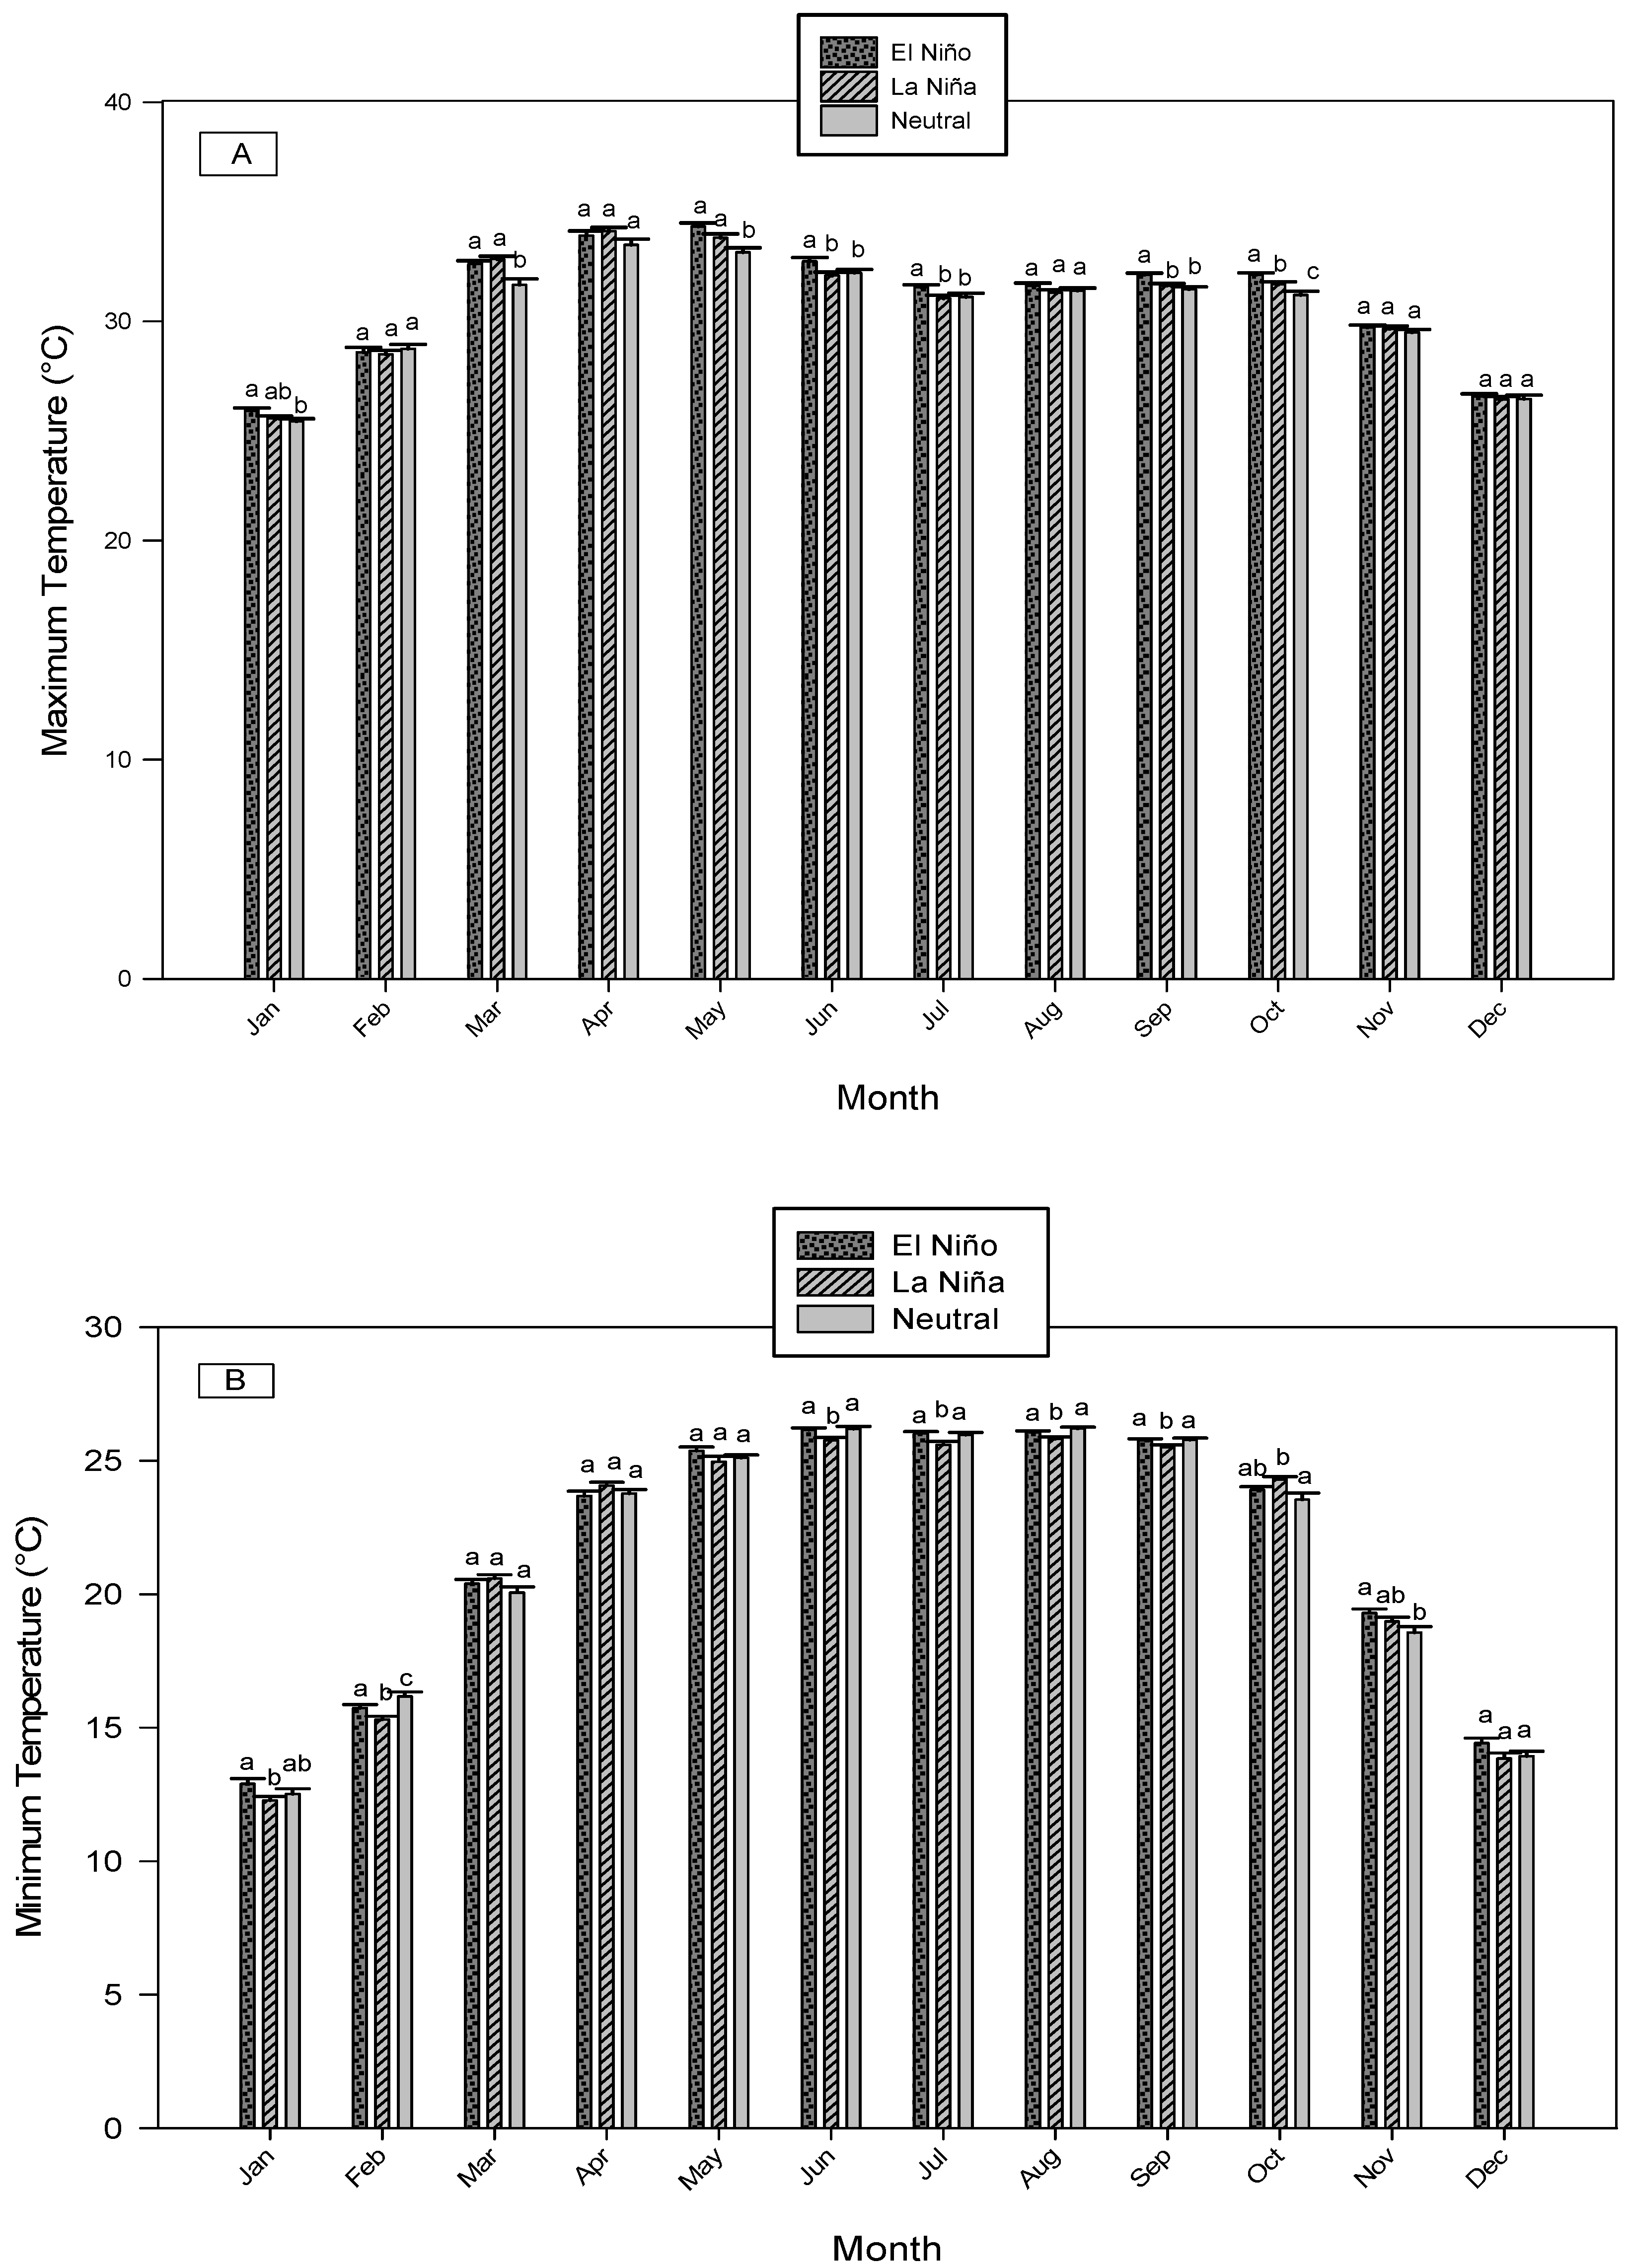
Across all stations, monthly maximum and minimum temperature varied between ENSO events (Figure 2A,B). The monthly average maximum temperature was higher in both El Niño and La Niña years compared to the neutral years with a larger difference in the El Niño years. For instance, during El Niño years, up to 1.17 °C higher maximum temperatures were recorded in May, while up to 0.74 °C higher minimum temperatures were measured in November. Statistically significant (p value < 0.05) variation of maximum temperature was computed for the months January, March, May, June, July, September, and October, whereas the rest of the months did not show a significant difference (Figure 2A). Temperatures are most prominent in October where El Niño, La Niña and neutral years vary significantly from each other. Similarly, we found significant variations of minimum temperature for all months except March, April, May, and December (Figure 2B).
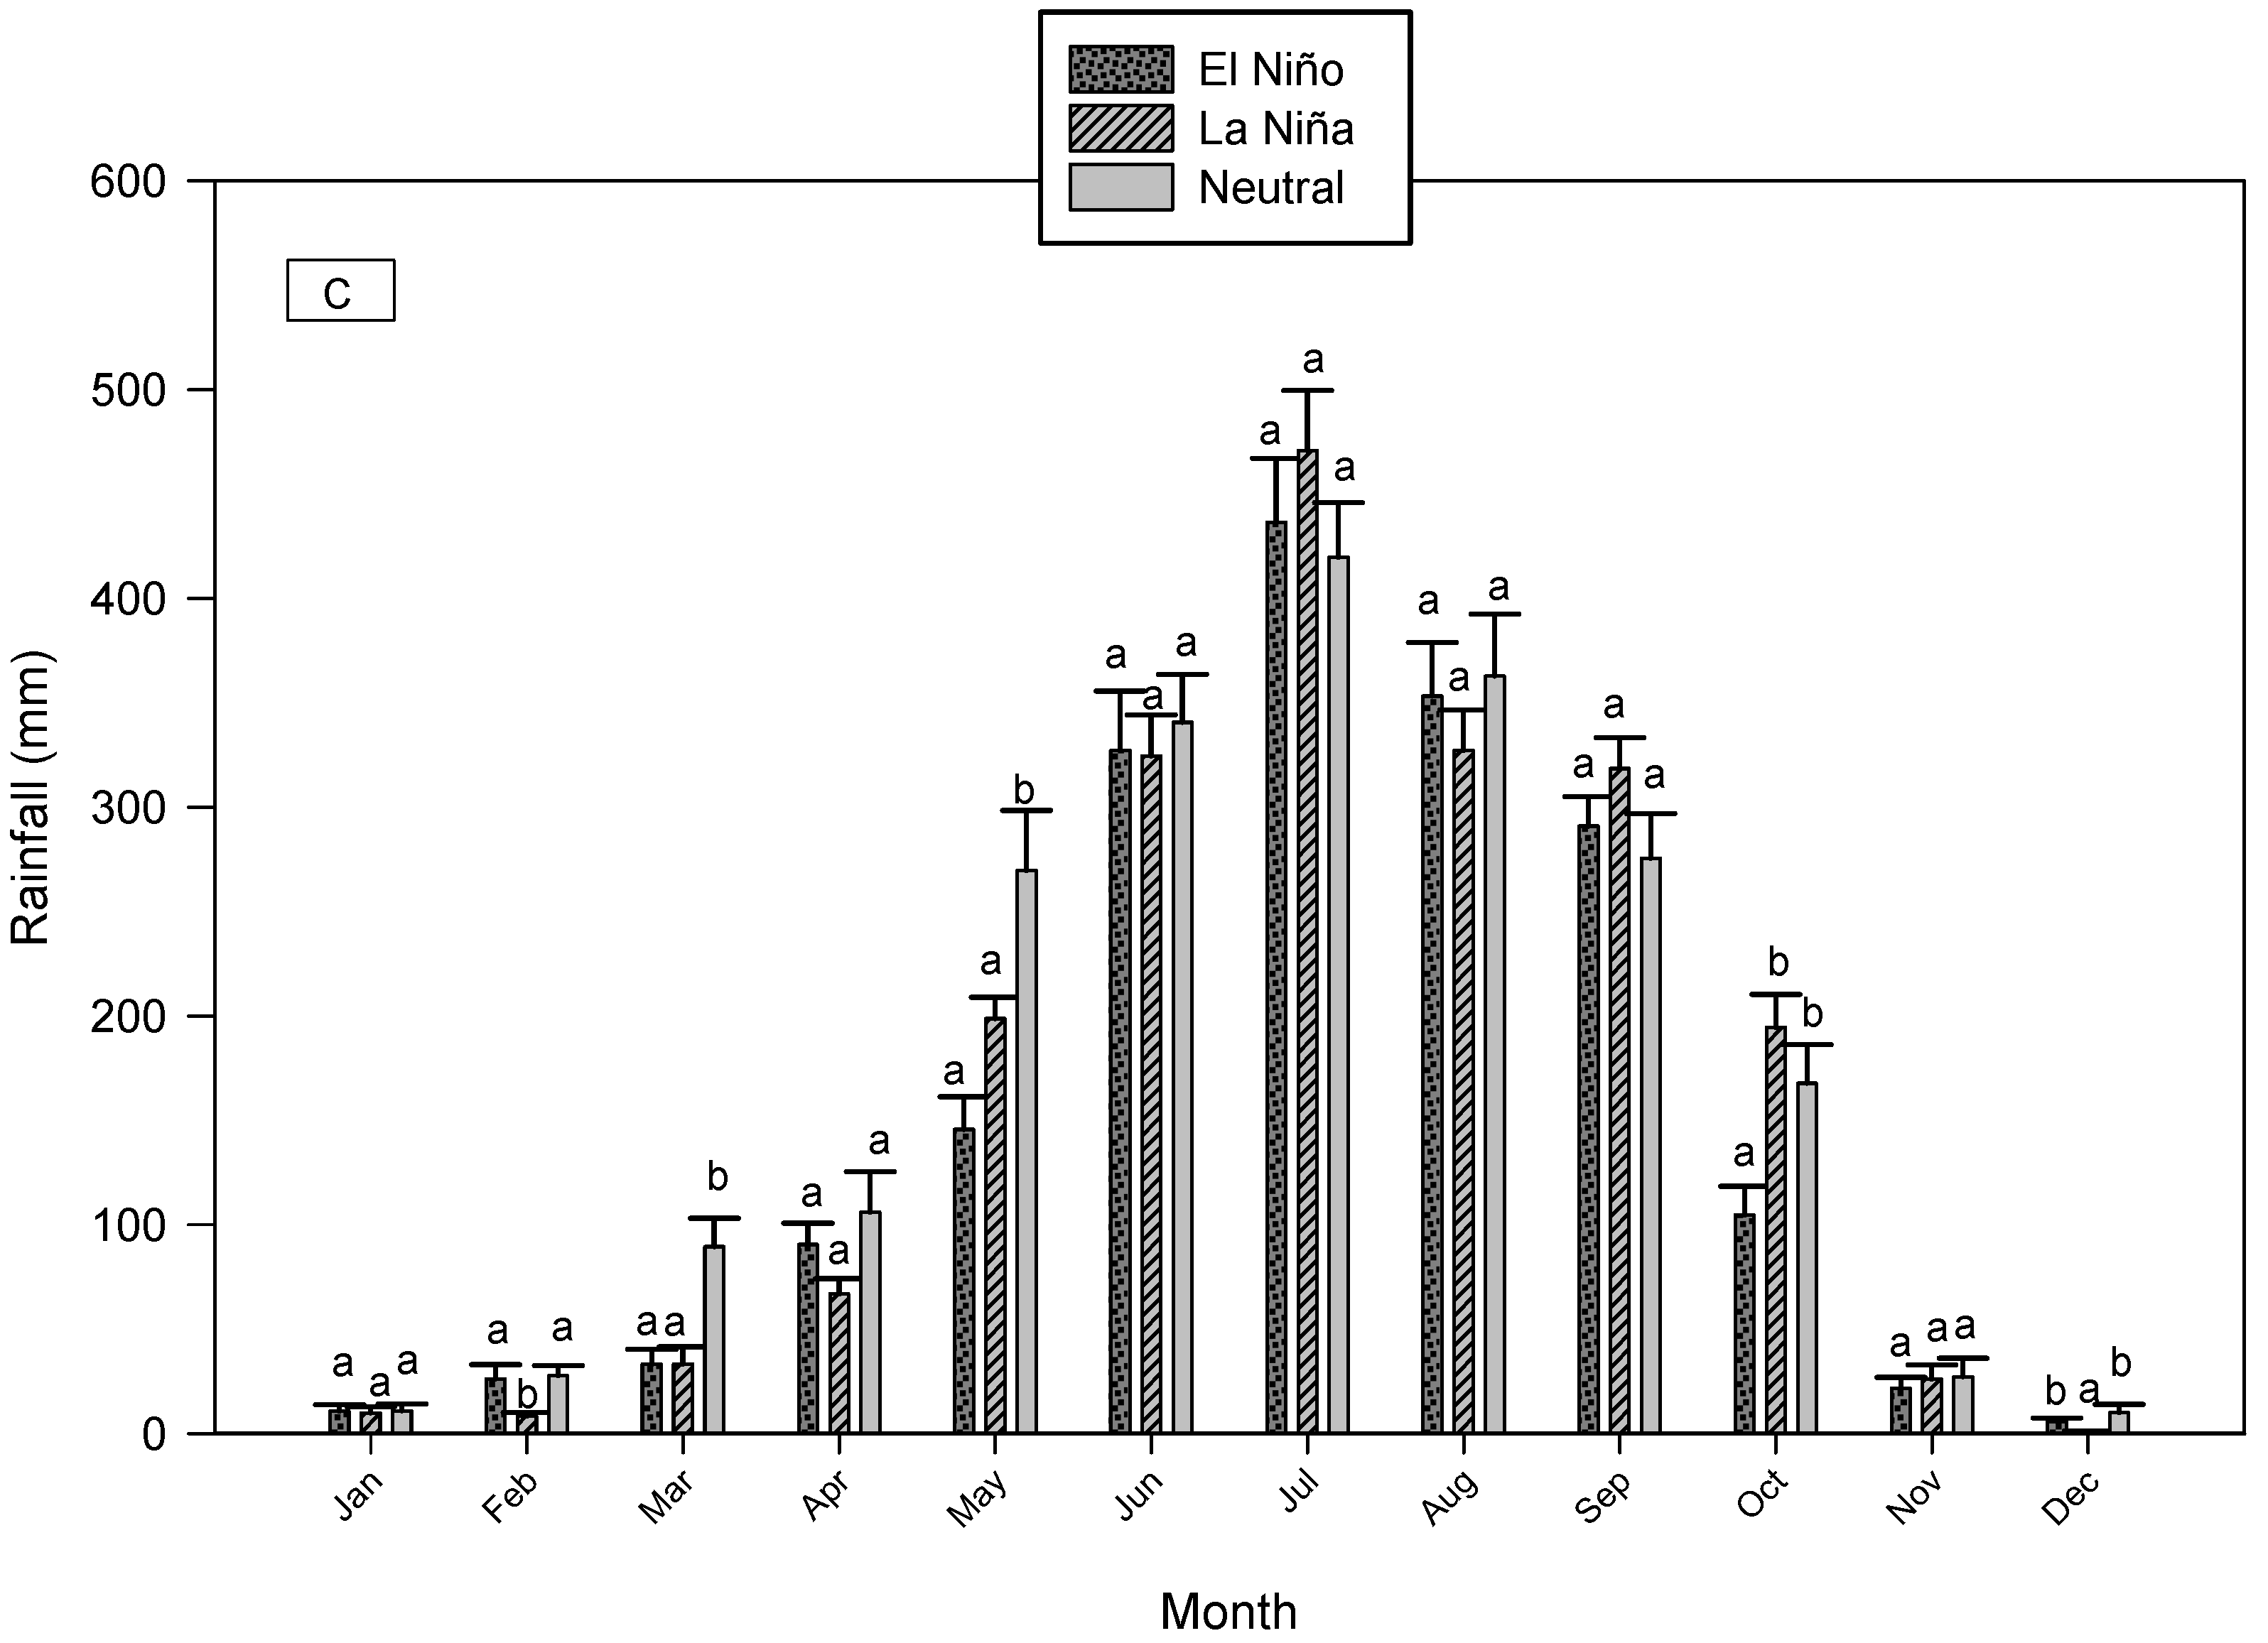
In contrast to temperature, the amount of rainfall during the El Niño and La Niña years was substantially lower compared to neutral years during several months (February, March, May, October, and December) (Figure 2C). In addition, La Niña years had lower rainfall than El Niño years during January, February, April, June, August, and December and the reverse phenomenon was observed in the rest of the months. Nevertheless, the variation in the amount of rainfall for the rest of the months was not statistically significant. Similar to temperature, the amount of rainfall is not the same in the selected stations (data was not shown). Station-wise variations of temperature and rainfall were analyzed and significant difference was found (Table S1). From our analysis, it is obvious that we can expect substantially lower amounts of rainfall during May (pre-monsoon) and October (post-monsoon) in the El Niño years compared to those in the neutral years. It may also indicate a shorter monsoon season for El Niño years. Therefore, the El Niño years will have potential impacts on crops grown during the monsoon season. Hence, farmers need to be well prepared to cope with this situation in order to minimize their crop risks.

3.1.2. Annual Variations

Average across stations, the annual mean maximum temperature was significantly higher by 0.5 and 0.23 °C in the El Niño and La Niña than neutral years (Figures S1 and S2). In contrast, the annual mean minimum temperature was significantly lower in the La Niña years than neutral and El Niño events. The annual mean maximum temperature in the Khulna and Satkhira districts was significantly higher by 0.83 °C than Barishal, Bhola, and Patuakhali districts. In contrast, a higher annual minimum temperature was in Patuakhali and Khulna than in Satkhira and Barishal district.
Averaged across all stations, the annual rainfall was lower by 133 and 261 mm in La Niña and El Niño respectively than neutral years (Figure S2). In contrast to the annual temperature, the rainfall in the Khulna and Satkhira districts were significantly lower by 630 mm than Barishal, Bhola, and Patuakhali districts.

3.2. Variation of Seasonal Temperature and Rainfall due to ENSO Events

3.2.1. Minimum and Maximum Temperature Composite

Seasonal composites of the climate variables may vary due to ENSO teleconnections. Across all stations, both minimum and maximum temperature composites varied significantly due to the occurrence of ENSO episodes (Figure 3). In Kharif-I and Kharif-II, a significantly higher maximum temperature was observed during El Niño and La Niña years than neutral years while the minimum temperature was similar in these two seasons. However, the minimum temperature was lower in the Rabi season during the El Niño and La Niña years than normal years although a significant effect was not found for maximum temperature.
Similar to the agricultural seasons, we also found significant differences in maximum and minimum temperatures in different rice growing seasons for ENSO events (Figure 4). Compared to neutral years, a higher maximum temperature was recorded in Aus, Aman and Boro seasons due to occurrence of El Niño and La Niña events (Figure 4A). Interestingly, ENSO had no effect on the average minimum temperatures (Figure 4B).

3.2.2. Rainfall Composite

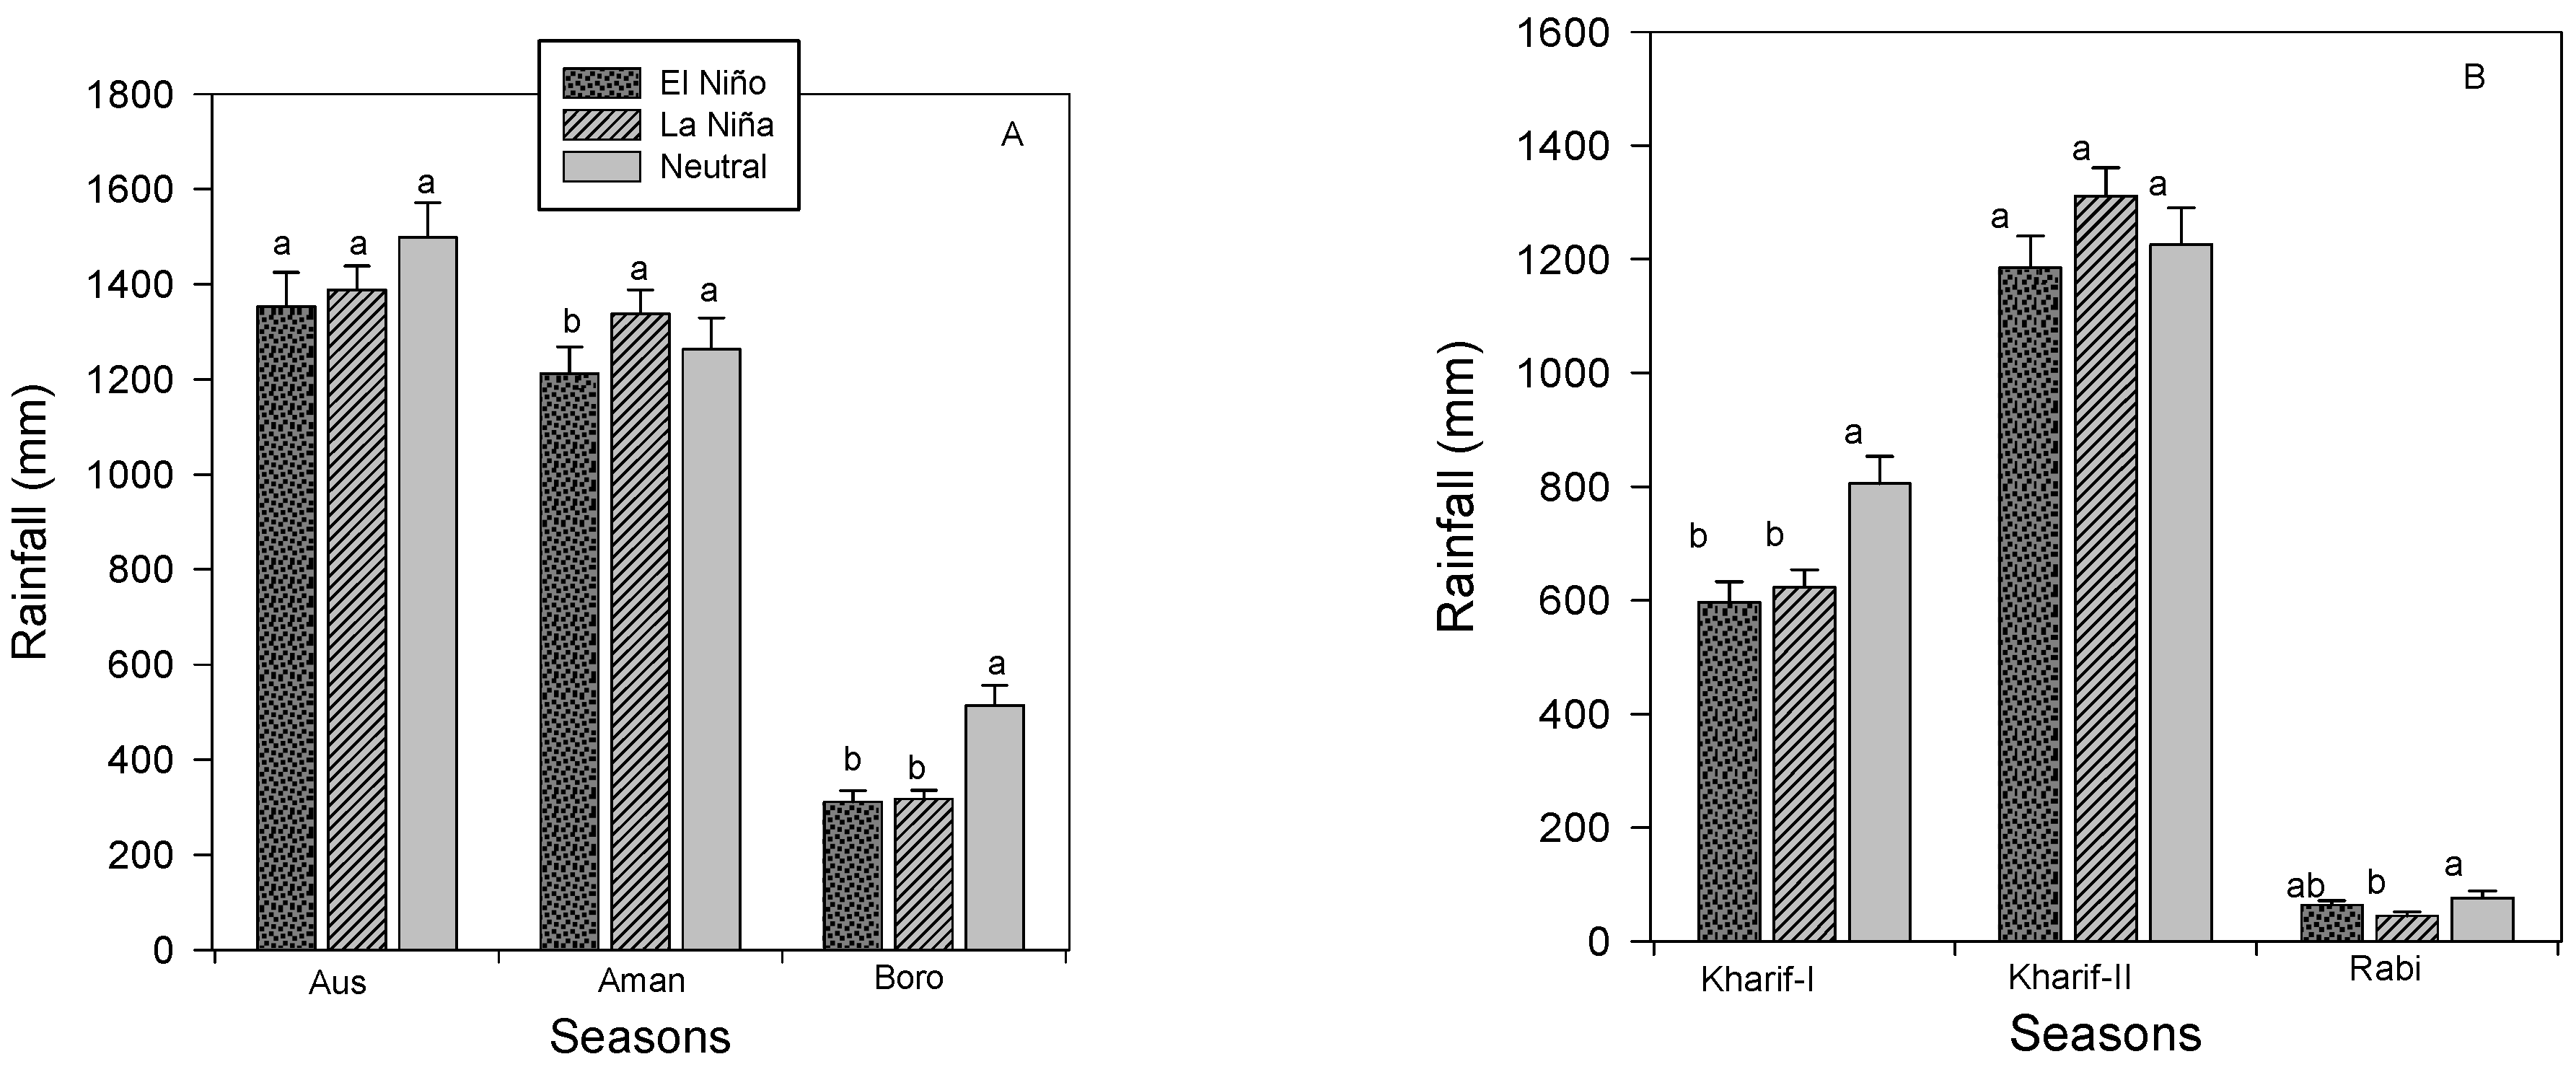
Our results show that rainfall amounts not only vary for the individual month but also vary for the seasonal composite due to ENSO events. Rainfall varied for the occurrence of ENSO events (p < 0.05, Figure 5). With consistent to monthly variation of rainfall amounts, a significantly lower amount of rainfall was recorded in the El Niño years compared to neutral years (Figure 5A). Furthermore, the highest amount of rainfall was measured for La Niña years during Kharif-II season.
Like agricultural seasons, rainfall was higher in the neutral years during Aus and Boro seasons. Specifically, it was ~1500 mm which was statistically insignificant although this value is numerically lower for La Niña (~1390 mm) El Niño (~1355 mm) events. However, the composite rainfall in the Aman season was significantly higher in the La Niña and neutrals years than El Niño years (Figure 5B).

3.3. Variation in GDD and on Crop Growth Duration

A significant variation in temperature could have large impact on GDD and thus, crop growth duration. Impacts of ENSO events on these factors are followed.

3.3.1. Growing Degree Day (GDD)

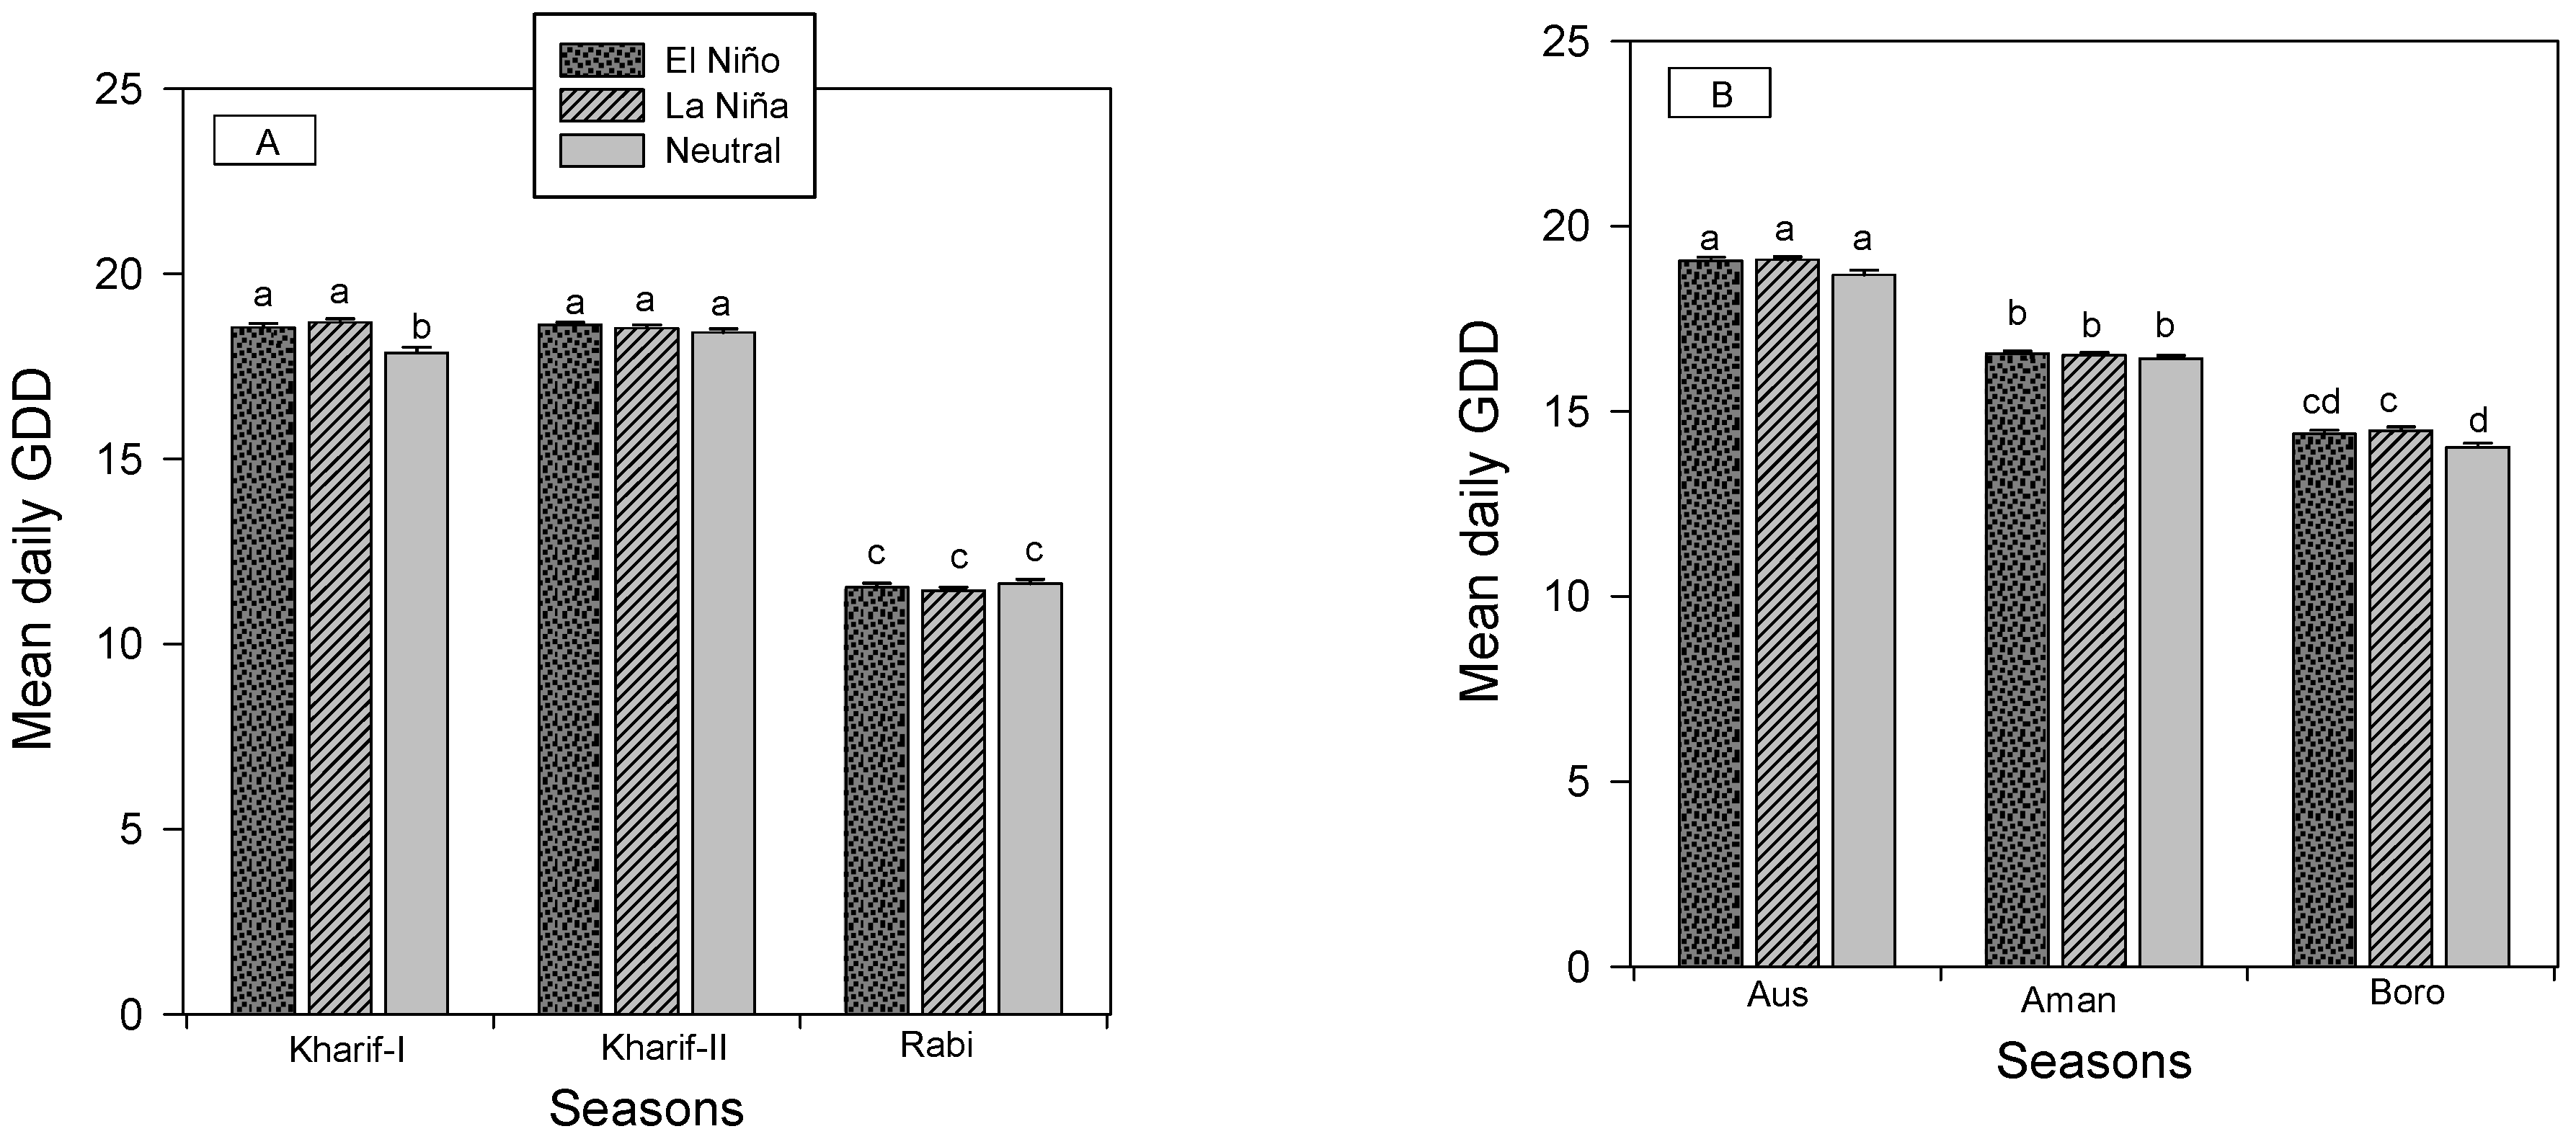
Across all seasons, ENSO events had a significant impact on daily mean GDD (Figure 6). For instance, El Niño and La Niña had higher daily mean GDD seasons than neutral years during both agricultural and rice growing seasons. However, it was in the order of Aus > Aman > Boro for rice growing seasons. The daily mean GDD in Kharif-I and Kharif II was similar but higher than Rabi season. The daily mean GDD was significantly higher in the Khulna and Satkhira districts than other districts in both growing seasons considered (Figure S2).

3.3.2. Crop Growth Duration and Yield

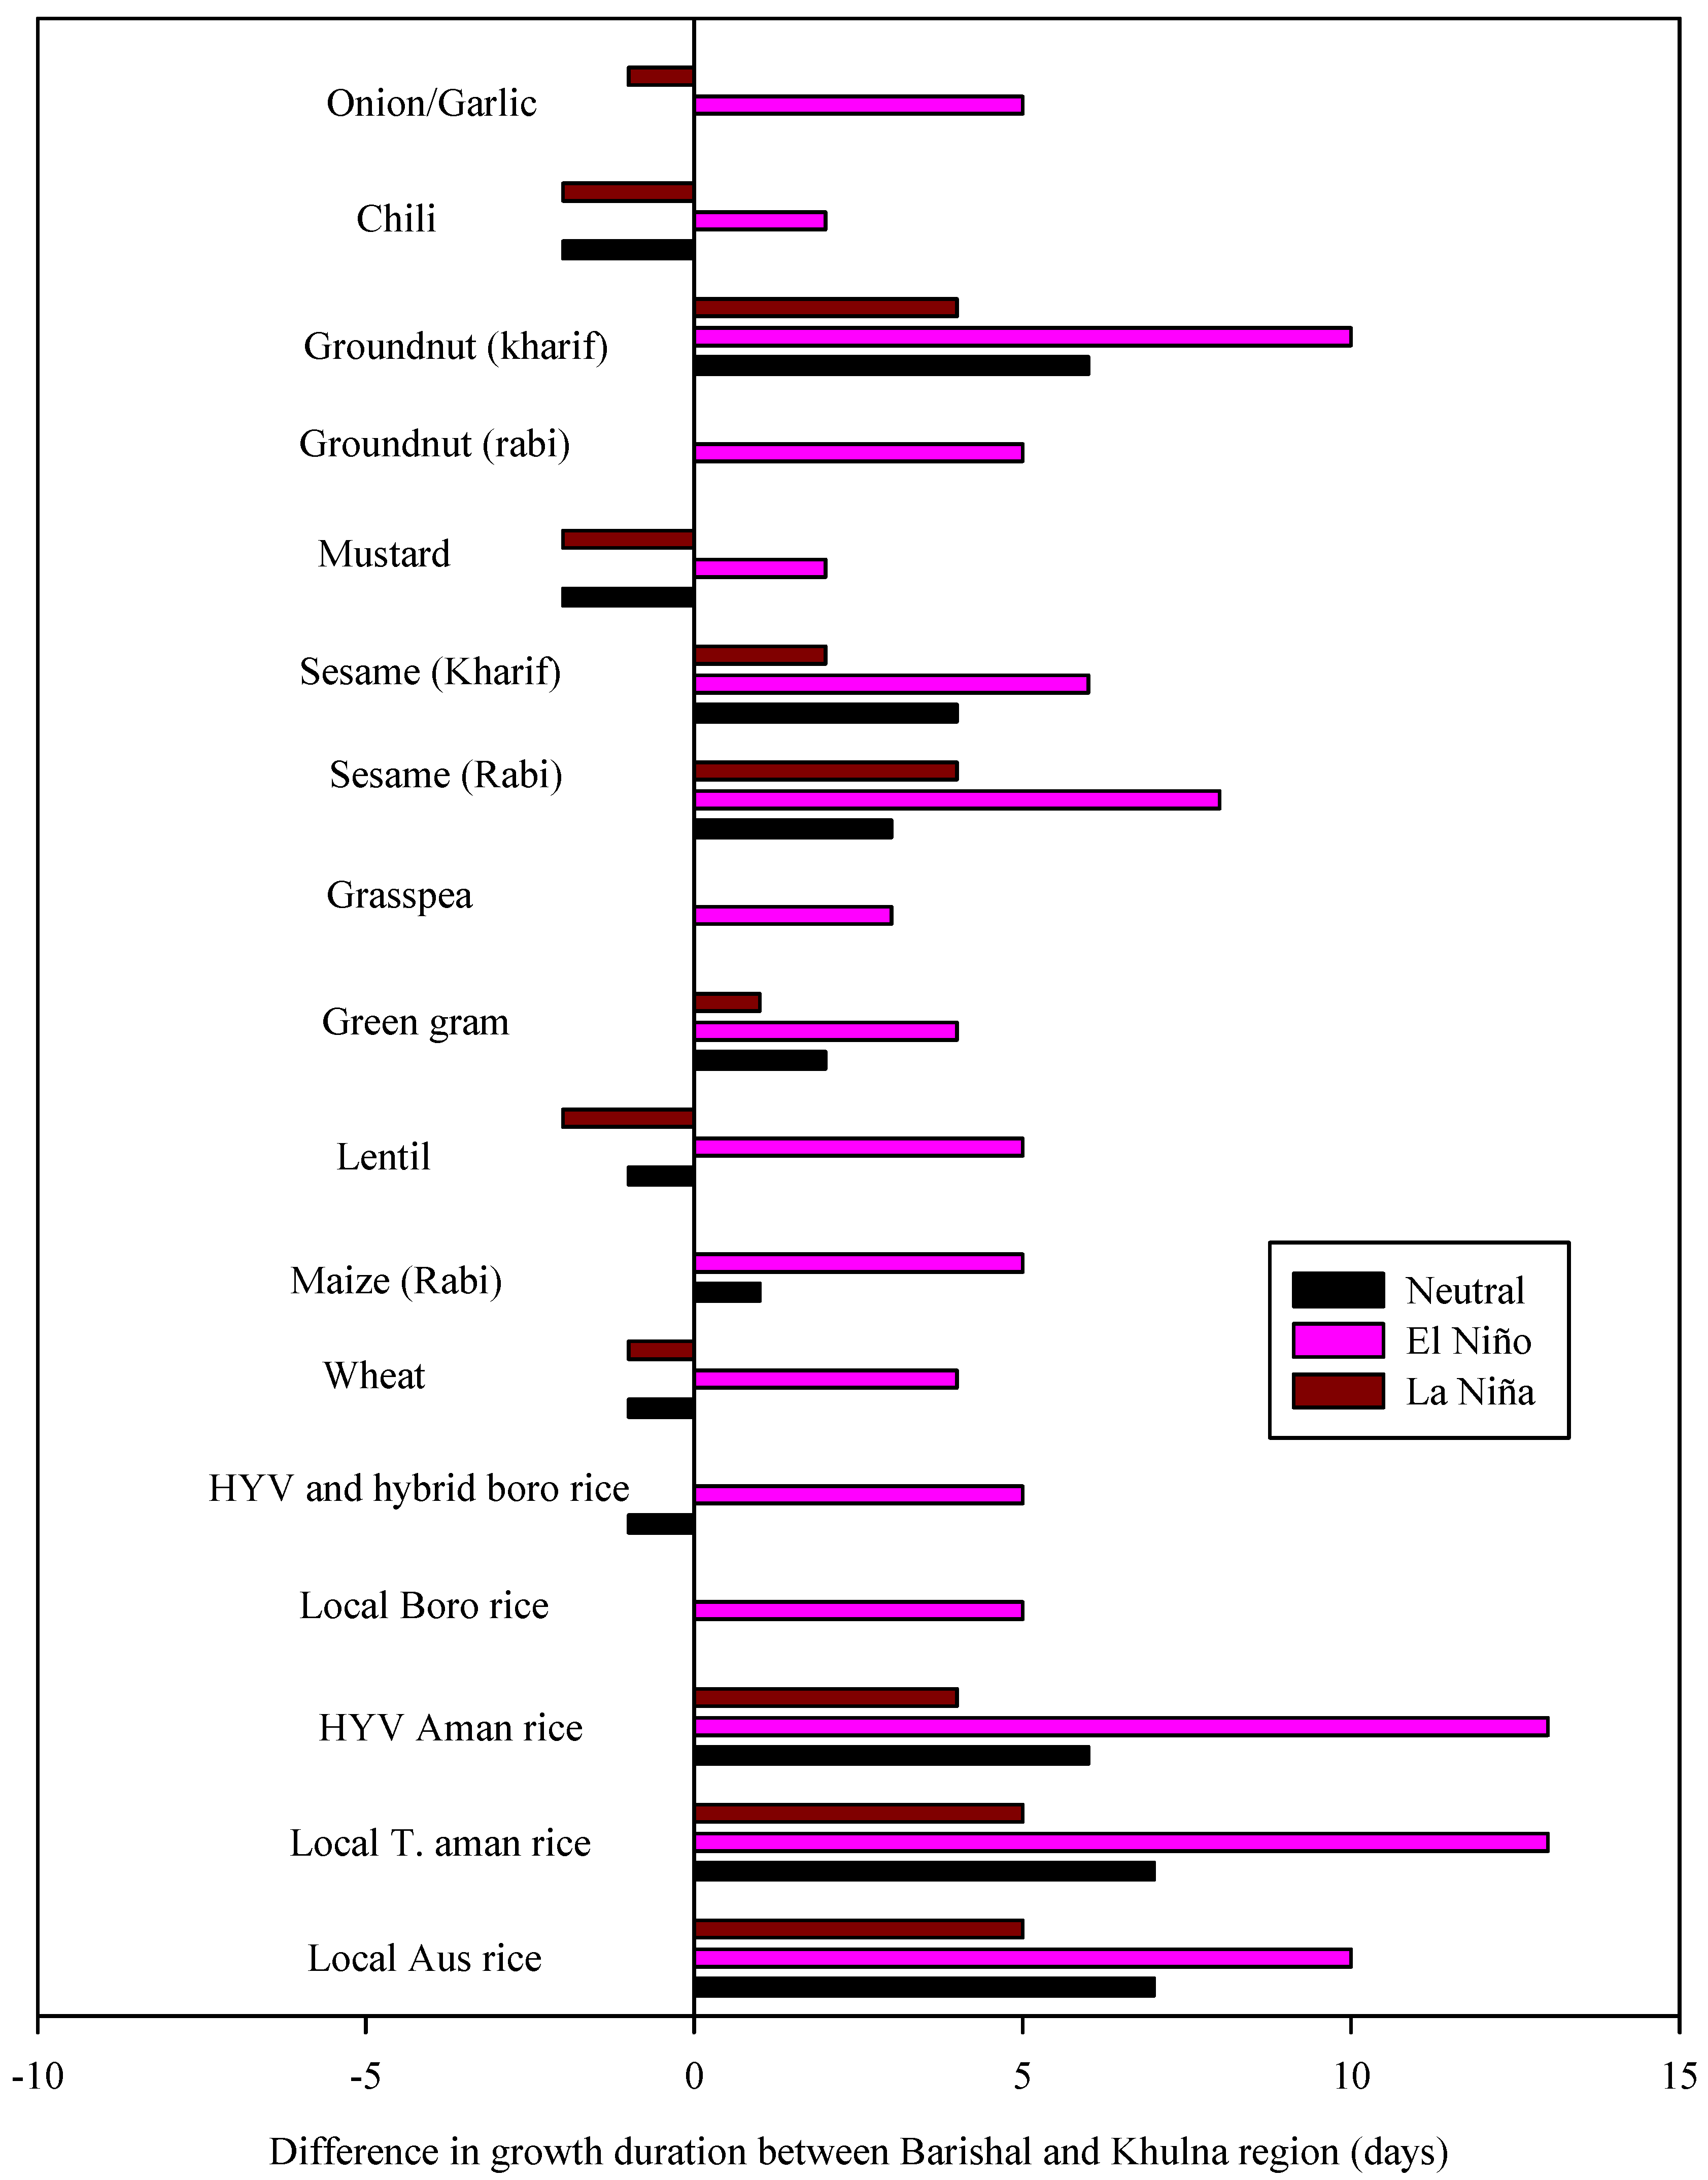
Impact of ENSO events on different crops under two different zones is presented in Table 2 (for Barishal) and supplementary Table S2 (for Khulna). In Barishal, La Niña reduces growth duration of crops grown in Aus/Kharif-1 season while similar impacts were not observed for El Niño events. For example, the life span of local Aus rice reduces by 6 d compared to neutral years (Table 2). During the Aman season, El Niño events increased crop duration while La Niña events slightly reduced growth duration. Similarly, during the Rabi/Boro season, the duration of crops increased during El Niño events and reduced in the years of La Niña events. In Khulna region, the effects of ENSO events were less dominant. Therefore, there are differences between the two zones in respect of crop growth duration (Figure 7). In most cases, the crop growth duration was higher in Barishal regions when El Niño events occurred. However, these differences were small for neutral year and there was hardly any difference during La Niña events.

4. Discussion

ENSO events can influence climatic factors including temperature and rainfall in many different areas of the world [9,10,11,12,13,14,16,17,18]. In our study, the annual mean maximum temperature was significantly higher by 0.5 and 0.23 °C in the El Niño and La Niña than neutral years although the minimum temperature was lower in ENSO events than neutral years. Our results are consistent with the results of other studies [18,45,46]. For instance, Wahiduzzaman and Luo [18] reported an increase of mean temperature by 1.0 °C with ENSO events compared to the neutral years in Bangladesh. Moreover, our estimates showed a substantial reduction of rainfall (145 mm annually) during in El Niño years than neutral years, a phenomenon that was also reported by others [45,47]. Specifically, the rainfall is significantly lower in the month of May and October. In contrast to our results, Chowdhury [34] reported a relatively small variation in rainfall in Bangladesh. These variations are possibly associated with the selection of ENSO years and with locations of the study area
Crop yield is a function of its genetic potential and the environment, i.e., soil and climate it grows. Therefore, climatic factors such as temperature and rainfall during a crop growing season are one of the important determinants regulating crop production. Our estimates clearly showed that during ENSO events, the maximum temperature was higher in all rice growing seasons (Aus, Aman, and Boro) and in two of three agricultural seasons (Kharif-I and Kharif-II). In contrast, the minimum temperature was lower during ENSO events than in neutral years. We are not aware of any studies to compare our results although a few studies report general season variations, e.g., pre monsoon, monsoon, and post-monsoon [18,46,47]. Moreover, in ENSO years, two of the three agricultural seasons (Kharif –I and Rabi), and two rice growing seasons (Aus and Boro) received reduced rainfall in comparison to neutral years. Similar to the study of Rishma and Katpatal [17], our findings showed a significant reduction of the rainfall during El Niño years. However, La Niña years received the highest amount of rainfall during Kharif-II and Aman season (Figure 5A). These results suggest that ENSO events create more extreme environmental conditions with a higher rainfall in rainy seasons and lower rainfall in the dry seasons in Bangladesh. In literature, there are no studies that report variability in rainfall in different crop growing seasons in Bangladesh. However, Wahiduzzaman and Luo [18] reported a larger rainfall deficit in Bangladesh in the El Niño years compared to neutral years. However, Ahmed, Alam, Yousuf and Islam [46] did not find significant influence of ENSO events on rainfall in Bangladesh.
Changes in temperature influence the GDD [37]. Across all stations, El Niño and La Niña events had higher seasonal GDD than neutral years. It is likely that an increase or decrease in average temperature would result in an increase or decrease in GDD [48]. Although no reports are available for this study area or for Bangladesh, ENSO mediated an increase in average temperature and thus, GDD has been reported for elsewhere [49,50]. Additionally, spatial variations of GDD were also observed between two zones (Figure S3). Similar to ENSO events, spatial variability in GDD can be found although such reports are not available for Bangladesh.
Changes in life events, i.e., development of a crop species, depend on the amount of heat unit they receive during a certain period of time [37,51,52]. We observed variability in life span along with its growth stages in different crop species grown in the study area (Table 2 and Table S3). These variations were both season and site-specific (Figure 7). Particularly, La Niña reduces growth duration in all growing seasons in Barishal region while El Niño events had almost no effect. However, El Niño increased the growth duration of crops grown in Aus/Kharif-I and Aman and in Rabi/Boro season. Additionally, similar but minimal effects were observed in Khulna region (Table S3). Therefore, we observed variability in crop growth duration between zones provided all crops are sown/planted at the same time. These results suggest that planting time of crops should be adjusted according to sites and also for ENSO events. To our knowledge, there are no studies to compare our results.
Table 2. Impacts of ENSO events on crops grown in Barishal.
Crops (Growing Season)ENSO EventsStart Date and Duration of the Growth PhasePossible ImpactsReferences
SeedlingVegetativeFloweringMaturityTotal
Local Aus riceNeutral 1-Mar
(56)
26-Apr
(65)
30-Jun
(25)
25-Jul
(25)
171 [53]
El Niño 1-Mar
(55)
25-Apr
(65)
30-Jun
(25)
23-Jul
(25)
170Similar to neutral
La Niña 1-Mar
(52)
22-Apr
(64)
25-Jun
(24)
19-Jul
(25)
165Reduce grain yield
Local transplant AmanNeutral 1-Jul
(47)
17-Aug
(63)
19-Oct
(27)
15-Nov
(34)
171
El Niño 1-Jul
(48)
18-Aug
(63)
20-Oct
(27)
16-Nov
(38)
176Delay Rabi crop planting
May face cyclones
La Niña 1-Jul
(47)
17-Aug
(62)
18-Oct
(26)
13-Nov
(34)
169Similar to neutral
Aman (HYV)Neutral 16-Jun
(46)
1-Aug
(60)
30-Sep
(23)
23-Oct
(27)
156
El Niño 16-Jun
(46)
1-Aug
(61)
1-Oct
(23)
23-Oct
(29)
159Delay Rabi crop planting
May face cyclones
La Niña 16-Jun
(46)
1-Aug
(60)
1-Oct
(22)
21-Oct
(26)
154Reduce grain yield
Local BoroNeutral 16-Nov
(61)
16-Jan
(68)
25-Mar
(19)
13-Apr
(18)
166
El Niño 16-Nov
(63)
18-Jan
(69)
27-Mar
(19)
15-Apr
(18)
169Crop may be affected with flood. May face cyclones[47]
La Niña 16-Nov
(60)
15-Jan
(69)
24-Mar
(18)
11-Apr
(17)
164Reduce grain yield
Boro (HYV)/HybridNeutral 1-Dec
(61)
31-Jan
(57)
29-Mar
(17)
15-Apr
(17)
152
El Niño 1-Dec
(63)
2-Feb
(57)
30-Mar
(17)
16-Apr
(17)
154Crop may be affected with flood[35]
La Niña 1-Dec
(61)
31-Jan
(56)
27-Mar
(17)
13-Apr
(15)
149Reduce grain yield
Wheat (Rabi)Neutral 1-Dec
(50)
20-Jan
(54)
15-Mar
(15)
30-Mar
(14)
133
El Niño 1-Dec
(52)
22-Jan
(55)
17-Mar
(15)
1-Apr
(14)
136May reduce grain yield due high temperature induced to spikelet sterility[54]
La Niña 1-Dec
(50)
20-Jan
(54)
14-Mar
(14)
28-Mar
(14)
132Similar to neutral
Maize (Rabi)Neutral 1-Dec
(68)
7-Feb
(61)
9-Apr
(19)
28-Apr
(18)
166
El Niño 1-Dec
(71)
10-Feb
(60)
10-Apr
(19)
29-Apr
(18)
168Yield reduction to due to lodging and flooding
La Niña 1-Dec
(68)
7-Feb
(60)
7-Apr
(18)
25-Apr
(17)
163Early harvesting but may reduce yield[48]
Lentil (Rabi)Neutral 16-Nov
(34)
20-Dec
(55)
13-Feb
(16)
29-Feb
(14)
119
El Niño 16-Nov
(36)
20-Dec
(60)
18-Feb
(15)
4-Mar
(14)
125Yield increase provided no additional disease pressure
La Niña 16-Nov
(34)
20-Dec
(56)
14-Feb
(16)
2-Mar
(13)
119Similar to neutral
Green gram (Rabi)Neutral 1-Jan
(55)
25-Feb
(49)
15-Apr
(16)
1-May
(16)
136
El Niño 1-Jan
(58)
28-Feb
(47)
15-Apr
(17)
2-May
(15)
137Yield reduction to due to lodging and flooding
La Niña 1-Jan
(57)
27-Feb
(46)
13-Apr
(15)
27-Apr
(15)
133Early harvesting but may reduce yield[48]
Grass pea (Rabi)Neutral 16-Nov
(42)
28-Dec
(61)
27-Feb
(17)
16-Mar
(15)
135
El Niño 16-Nov
(45)
31-Dec
(63)
3-Mar
(16)
19-Mar
(14)
138Yield reduction to due to lodging and flooding[35,47]
La Niña 16-Nov
(42)
28-Dec
(63)
29-Feb
(16)
15-Mar
(14)
135
Sesame (Rabi)Neutral 1-Sep
(31)
2-Oct
(44)
15-Nov
(20)
5-Dec
(27)
122
El Niño 1-Sep
(31)
2-Oct
(44)
15-Nov
(22)
6-Dec
(30)
127Yield reduction to due to lodging and flooding[47]
La Niña 1-Sep
(31)
2-Oct
(44)
14-Nov
(20)
4-Dec
(27)
122
Sesame (Kharif)Neutral 1-Feb
(44)
17-Mar
(46)
2-May
(16)
18-May
(16)
122
El Niño 1-Feb
(46)
18-Mar
(45)
2-May
(15)
17-May
(16)
122
La Niña 1-Feb
(44)
16-Mar
(43)
28-Apr
(15)
13-May
(15)
117Early harvesting but may reduce yield[48]
Rape and Mustard (Rabi)Neutral 16-Nov
(27)
13-Dec
(50)
1-Feb
(14)
15-Feb
(14)
105
El Niño 16-Nov
(29)
15-Dec
(51)
4-Feb
(16)
20-Feb
(13)
109Yield increase but experience early climatic hazards[47]
La Niña 16-Nov
(28)
14-Dec
(49)
1-Feb
(15)
16-Feb
(14)
106
Groundnut (Rabi)Neutral 16-Nov
(61)
16-Jan
(68)
25-Mar
(19)
13-Apr
(18)
166
El Niño 16-Nov
(63)
18-Jan
(69)
27-Mar
(19)
15-Apr
(18)
169Yield reduction due to pollination failure and fruit setting while may face natural hazards (flooding)[47]
La Niña 16-Nov
(60)
15-Jan
(69)
24-Mar
(18)
11-Apr
(17)
164Early harvesting but may sacrifice yield[48]
Groundnut (Kharif)Neutral 16-Jun
(46)
1-Aug
(59)
29-Sep
(24)
23-Oct
(25)
154
El Niño 16-Jun
(46)
1-Aug
(61)
1-Oct
(23)
24-Oct
(27)
157May increase yield[48]
La Niña 16-Jun
(45)
31-Jul
(60)
29-Sep
(22)
21-Oct
(26)
153
Chili (Rabi) Neutral 16-Nov
(34)
20-Dec
(56)
14-Feb
(15)
1-Mar
(15)
120
El Niño 16-Nov
(36)
22-Dec
(59)
19-Feb
(15)
5-Mar
(13)
123Increase risk of experiencing climatic hazards [47]
La Niña 16-Nov
(34)
20-Dec
(57)
15-Feb
(16)
2-Mar
(13)
120
Onion/Garlic (Rabi)Neutral 16-Nov
(60)
15-Jan
(68)
24-Mar
(20)
13-Apr
(18)
166
El Niño 16-Nov
(63)
18-Jan
(69)
27-Mar
(18)
14-Apr
(18)
169Increase risk of experiencing climatic hazards[47]
La Niña 16-Nov
(60)
15-Jan
(69)
24-Mar
(18)
11-Apr
(17)
164
Changes in the length of the growing season can affect crop yield either by reducing assimilate conservation and portioning efficiency or adverse effects on pollination and fruit setting. A longer growing season can also increase the risk of exposure to natural hazards and delays the planting of succeeding crops. Our results indicate a longer growing season during El Niño events could potentially affect crop yields due to higher risks of exposure to natural hazards. In most cases, an increase in growth duration of Rabi/Boro crops would receive additional risk from natural hazards of waterlogging/flooding, nor’wester, and cyclones [35,47,55] while an increased yield is expected if favorable climatic conditions prevail. In the other the two seasons, these effects may be less intense since natural hazards are less frequent.
A change in temperature and rainfall can also affect soil water balance and salinity in the coastal area of Bangladesh. During ENSO events, a relatively higher temperature and lower rainfall were recorded suggesting a drier year. These could increase soil and water salinity through saltwater intrusion and capillary raise affecting crops growth and yield of Rabi crops/Boro rice. Since the soil and water salinity are reported to be the maximum during April to May, ENSO could have a significant impact on crop yield.
However, farmers can minimize their risk from ENSO events. In this case, a reliable and timely weather forecast is necessary. For instance, if farmers receive a weather forecast that a El Niño year is coming then they can expect a lower amount of rainfall in the monsoon season particularly in the month of May and October. So, they could either avoid growing higher water demanding crop/cultivars or they might adopt some adaptation measures such as artificial irrigation. Farmers could also change the planting date of seeds considering the expected duration of the crops during ENSO events. Therefore, the present study unfolds the importance of weather forecasts based on the ENSO signals to make coastal agriculture more resilient.

5. Conclusions

The ENSO event has a larger impact on crop productions in many countries in the world including Bangladesh. Our results showed that ENSO events had significant impacts on temperature and rainfall calculated for month, year, and cropping seasons. ENSO events mediated a change in local temperature affected the estimated crop growth duration with implications for affecting crop yield. This study concludes that a significant reduction of rainfall and higher temperature might be expected during the El Niño years. The climate in the ENSO phases was identified as relatively more extreme with a significantly higher maximum temperature during summer (March to October) and a lower minimum temperature during winter (November to February). A significantly lower rainfall was also recorded during winter when the rainfall is relatively low. These changes in climatic conditions infer a significant change in crop growth duration and yield while suggesting adoption measures for ENSO forecasted years.

Supplementary Materials

The following are available online at https://www.mdpi.com/article/10.3390/atmos12111449/s1, Figure S1: Station-wise maximum (panel A) and minimum (Panel B) mean annual temperature composite, Figure S2: Annual variation in rainfall at different districts under different ENSO events, Figure S3: Mean daily GDD Annual variation in rainfall at different districts under different agricultural (panel A) and rice growing (panel B) seasons, Table S1: Monthly station-wise p-values for minimum temperature, maximum temperature and rainfall from one-way ANOVA during the selected El Nino, La Nina and neutral years in Bangladesh, Table S2: Station-wise p-values for minimum temperature, maximum temperature and rainfall from one-way ANOVA for the crop seasons during the selected El Nino, La Nina and neutral years in Bangladesh, Table S3: Calculated GGD required for different growth stages of crops grown in study area, Table S4: Impacts of ENSO events crops grown in Khulna.

Author Contributions

Conceptualization, M.A.S., S.M., A.A.S., A.K.M.A.A.B. and F.L.; Formal analysis, M.A.S., S.M. and A.A.S.; Funding acquisition, A.A.S.; Methodology, M.A.S., S.M., A.A.S. and F.L.; Project administration, A.K.M.A.A.B.; Supervision, M.A.S. and A.K.M.A.A.B.; Visualization, M.A.S., S.M. and A.A.S.; Writing—original draft, M.A.S., S.M. and A.A.S.; Writing—review and editing, M.A.S., S.M., A.K.M.A.A.B. and F.L. All authors have read and agreed to the published version of the manuscript.

Funding

This research was funded by the National Science and Technology (NST) fellowship under the Ministry of Science and Technology of Bangladesh.

Institutional Review Board Statement

Not applicable.

Informed Consent Statement

Not applicable.

Data Availability Statement

Some data were purchased from Bangladesh Meteorological Department (BMD) (http://bmd.wowspace.org/team/homex.php last accessed on 30 June 2019) that are available on request and the rest are readily available online.

Conflicts of Interest

The authors declare no conflict of interest.

References

  1. Brönnimann, S. Impact of El Niño–Southern oscillation on European climate. Rev. Geophys. 2007, 45, RG3003. [Google Scholar] [CrossRef] [Green Version]
  2. Sarachik, E.S.; Cane, M.A. The El Nino-Southern Oscillation Phenomenon; Cambridge University Press: Cambridge, UK, 2010. [Google Scholar]
  3. Zhang, W.; Li, H.; Stuecker, M.F.; Jin, F.-F.; Turner, A.G. A new understanding of El Niño’s impact over East Asia: Dominance of the ENSO combination mode. J. Clim. 2016, 29, 4347–4359. [Google Scholar] [CrossRef]
  4. McPhaden, M.J. El Nino and La Nina: Causes and global consequences. Glob. Environ. Change. 2002, 1, 1–17. [Google Scholar]
  5. Ashok, K.; Behera, S.K.; Rao, S.A.; Weng, H.; Yamagata, T. El Niño Modoki and its possible teleconnection. J. Geophys. Res. 2007, 112. [Google Scholar] [CrossRef]
  6. Kao, H.-Y.; Yu, J.-Y. Contrasting eastern-Pacific and central-Pacific types of ENSO. J. Clim. 2009, 22, 615–632. [Google Scholar] [CrossRef]
  7. Kug, J.-S.; Jin, F.-F.; An, S.-I. Two types of El Niño events: Cold tongue El Niño and warm pool El Niño. J. Clim. 2009, 22, 1499–1515. [Google Scholar] [CrossRef]
  8. Yu, J.-Y.; Kim, S.T. Relationships between Extratropical Sea Level Pressure Variations and the Central Pacific and Eastern Pacific Types of ENSO. J. Clim. 2011, 24, 708–720. [Google Scholar] [CrossRef]
  9. Kim, H.-M.; Webster, P.J.; Curry, J.A. Impact of shifting patterns of Pacific Ocean warming on North Atlantic tropical cyclones. Science 2009, 325, 77–80. [Google Scholar] [CrossRef] [PubMed]
  10. Weng, H.; Behera, S.K.; Yamagata, T. Anomalous winter climate conditions in the Pacific rim during recent El Niño Modoki and El Niño events. Clim. Dyn. 2009, 32, 663–674. [Google Scholar] [CrossRef]
  11. Yeh, S.W.; Kirtman, B.P. On the relationship between the interannual and decadal SST variability in the North Pacific and tropical Pacific Ocean. J. Geophys. Res. Atmos. 2003, 108, 4344. [Google Scholar] [CrossRef] [Green Version]
  12. Sentelhas, P.; Pereira, A. El Niño–Southern Oscillation and Its Impacts on Local Climate and Sugarcane Yield in Brazil. Sugar Tech. 2019, 21, 976–985. [Google Scholar] [CrossRef]
  13. Pandey, V.; Misra, A.; Yadav, S. Impact of El-Nino and La-Nina on Indian Climate and Crop Production. In Climate Change and Agriculture in India: Impact and Adaptation; Springer: Cham, Switzerland, 2019; pp. 11–20. [Google Scholar]
  14. Lakhraj-Govender, R.; Grab, S.W. Assessing the impact of El Niño–Southern Oscillation on South African temperatures during austral summer. Int. J. Climatol. 2019, 39, 143–156. [Google Scholar] [CrossRef] [Green Version]
  15. Hua, S.; Jing, T.; Jingfeng, H.; Pei, G.; Zhibo, Z.; Jianwu, W. Hybrid Causality Analysis of ENSO’s Global Impacts on Climate Variables Based on Data-Driven Analytics and Climate Model Simulation. Front. Earth Sci. 2019, 7, 233. [Google Scholar] [CrossRef]
  16. Pheakdey, D.V.; Xuan, T.D.; Khanh, T.D. Influence of climate factors on rice yields in Cambodia. AIMS Geosci. 2017, 3, 561–575. [Google Scholar] [CrossRef]
  17. Rishma, C.; Katpatal, Y.B. Variability in rainfall and vegetation density as a response to ENSO events: A case study in Venna river basin of central India. J. Agrometeorol. 2016, 18, 300–305. [Google Scholar]
  18. Wahiduzzaman, M.; Luo, J.-J. A statistical analysis on the contribution of El Niño–Southern Oscillation to the rainfall and temperature over Bangladesh. Meteorol. Atmos. Phys 2020, 133, 55–68. [Google Scholar] [CrossRef]
  19. Davey, M.K.; Brookshaw, A.; Ineson, S. The probability of the impact of ENSO on precipitation and near-surface temperature. Clim. Risk Manag. 2014, 1, 5–24. [Google Scholar] [CrossRef] [Green Version]
  20. Zaroug, M.A.; Eltahir, E.A.; Giorgi, F. Droughts and floods over the upper catchment of the Blue Nile and their connections to the timing of El Niño and La Niña events. Hydrol. Earth Syst. Sci. 2014, 18, 1239–1249. [Google Scholar] [CrossRef] [Green Version]
  21. Tong, J.; Qiang, Z.; Deming, Z.; Yijin, W. Yangtze floods and droughts (China) and teleconnections with ENSO activities (1470–2003). Quat. Int. 2006, 144, 29–37. [Google Scholar] [CrossRef]
  22. Li, R.C.Y.; Zhou, W. Changes in Western Pacific Tropical Cyclones Associated with the El Niño–Southern Oscillation Cycle. J. Clim. 2012, 25, 5864–5878. [Google Scholar] [CrossRef]
  23. Sikder, R.; Xiaoying, J. Climate change impact and agriculture of Bangladesh. Environ. Earth Sci. 2014, 4, 35–40. [Google Scholar]
  24. Hossain, M.S.; Qian, L.; Arshad, M.; Shahid, S.; Fahad, S.; Akhter, J. Climate change and crop farming in Bangladesh: An analysis of economic impacts. Int. J. Clim. Chang. Str. 2019, 11, 424–440. [Google Scholar] [CrossRef]
  25. Naylor, R.L.; Falcon, W.P.; Rochberg, D.; Wada, N. Using El Nino/Southern Oscillation climate data to predict rice production in Indonesia. Clim. Change 2001, 50, 255–265. [Google Scholar] [CrossRef]
  26. Yuan, C.; Yamagata, T. Impacts of IOD, ENSO and ENSO Modoki on the Australian Winter Wheat Yields in Recent Decades. Sci. Rep. 2015, 5, 17252. [Google Scholar] [CrossRef] [Green Version]
  27. Kim, M.-K.; McCarl, B.A. The agricultural value of information on the North Atlantic oscillation: Yield and economic effects. Clim. Change 2005, 71, 117–139. [Google Scholar] [CrossRef]
  28. Ray, D.K.; Gerber, J.S.; MacDonald, G.K.; West, P.C. Climate variation explains a third of global crop yield variability. Nat. Commun. 2015, 6, 5989. [Google Scholar] [CrossRef] [PubMed] [Green Version]
  29. Rahman, M.A.; Kang, S.; Nagabhatla, N.; Macnee, R. Impacts of temperature and rainfall variation on rice productivity in major ecosystems of Bangladesh. Agric. Food Secur. 2017, 6, 10. [Google Scholar] [CrossRef] [Green Version]
  30. Zhang, Z.; Liu, X.; Wang, P.; Shuai, J.; Chen, Y.; Song, X.; Tao, F. The heat deficit index depicts the responses of rice yield to climate change in the northeastern three provinces of China. Reg. Environ. Change. 2014, 14, 27–38. [Google Scholar] [CrossRef]
  31. Grigorieva, E.; Matzarakis, A.; de Freitas, C. Analysis of growing degree-days as a climate impact indicator in a region with extreme annual air temperature amplitude. Clim. Res. 2010, 42, 143–154. [Google Scholar] [CrossRef] [Green Version]
  32. Spinoni, J.; Vogt, J.; Barbosa, P. European degree-day climatologies and trends for the period 1951–2011. Int. J. Climatol. 2015, 35, 25–36. [Google Scholar] [CrossRef] [Green Version]
  33. Asseng, S.; Foster, I.A.N.; Turner, N.C. The impact of temperature variability on wheat yields. Global Change Biol. 2011, 17, 997–1012. [Google Scholar] [CrossRef]
  34. Chowdhury, M. The El Niño -Southern Oscillation (ENSO) and seasonal flooding? Bangladesh. Theor. Appl. Climatol. 2003, 76, 105–124. [Google Scholar] [CrossRef]
  35. Pervez, M.S.; Henebry, G.M. Spatial and seasonal responses of precipitation in the Ganges and Brahmaputra river basins to ENSO and Indian Ocean dipole modes: Implications for flooding and drought. Nat. Hazards Earth Syst. Sci. 2015, 2, 147–162. [Google Scholar] [CrossRef] [Green Version]
  36. McMaster, G.S.; Wilhelm, W.W. Growing degree-days: One equation, two interpretations. Agric. For. Meteorol. 1997, 87, 291–300. [Google Scholar] [CrossRef] [Green Version]
  37. Acharjee, T.K.; van Halsema, G.; Ludwig, F.; Hellegers, P. Declining trends of water requirements of dry season Boro rice in the north-west Bangladesh. Agric. Water Manag. 2017, 180, 148–159. [Google Scholar] [CrossRef]
  38. Mahmood, R. Impacts of air temperature variations on the boro rice phenology in Bangladesh: Implications for irrigation requirements. Agric. For. Meteoro. 1997, 84, 233–247. [Google Scholar] [CrossRef]
  39. Rahman, M.S.; Sharma, N.; Khatun, A.; Saleque, M.A. Growing degree days for Boro rice varieties. Bangladesh Rice J. 2010, 15, 77–80. [Google Scholar]
  40. Li, Y.; Li, X.; Yu, J.; Liu, F. Effect of the transgenerational exposure to elevated CO2 on the drought response of winter wheat: Stomatal control and water use efficiency. Environ. Exp. Bot. 2017, 136, 78–84. [Google Scholar] [CrossRef]
  41. Krishnan, P.; Ramakrishnan, B.; Reddy, K.R.; Reddy, V.R. Chapter three—High-Temperature Effects on Rice Growth, Yield, and Grain Quality. In Advances in Agronomy; Sparks, D.L., Ed.; Academic Press: Cambridge, MA, USA, 2011; Volume 111, pp. 87–206. [Google Scholar]
  42. Jagadish, S.; Craufurd, P.; Wheeler, T. High temperature stress and spikelet fertility in rice (Oryza sativa L.). J. Exp. Bot. 2007, 58, 1627–1635. [Google Scholar] [CrossRef] [Green Version]
  43. BBS (Bangladesh Bureau of Statistics). Yearbook of Agricultural Statistics-2017; Statistics and Informatics Division (SID), Ministry of Planning, Government of the People’s Republic of Bangladesh: Dhaka, Bangladesh, 2018.
  44. Fogt, R.L.; Bromwich, D.H.; Hines, K.M. Understanding the SAM influence on the South Pacific ENSO teleconnection. Clim. Dyn. 2011, 36, 1555–1576. [Google Scholar] [CrossRef] [Green Version]
  45. Hossain, E.; Alam, S.S.; Imam, K.H.; Hoque, M.M. The Assessment of El Nino Impacts and Responses: Strategies for the 1997–98 El Nino Event in Bangladesh; Bangladesh Public Administration Training Centre: Dhaka, Bangladesh, 2000.
  46. Ahmed, M.K.; Alam, M.S.; Yousuf, A.H.M.; Islam, M.M. A long-term trend in precipitation of different spatial regions of Bangladesh and its teleconnections with El Niño/Southern Oscillation and Indian Ocean Dipole. Theor. Appl. Climatol. 2017, 129, 473–486. [Google Scholar] [CrossRef]
  47. Islam, M.N.; Parvez, M.P. Predicting the El Niño and La Niño impact on the coastal zones at the Bay of Bengal and the likelihood of weather patterns in Bangladesh. Model. Earth Syst. Environ. 2020, 6, 1823–1839. [Google Scholar] [CrossRef]
  48. Mix, K.; Rast, W.; Lopes, V.L. Increases in Growing Degree Days in the Alpine Desert of the San Luis Valley, Colorado. Water Air Soil Pollut. 2010, 205, 289. [Google Scholar] [CrossRef]
  49. Iqbal, M.J.; Ali, Z.U.; Ali, S.S. Agroclimatic modelling for estimation of wheat production in the Punjab Province, Pakistan. Proc. Pak. Acad. Sci. 2012, 49, 241–249. [Google Scholar]
  50. Fraisse, C.W.; Bellow, J.; Brown, C. Degree Days: Heating, Cooling, and Growing; Agricultural and Biological Engineering Department, University of Florida: Gainesville, FL, USA, 2011. [Google Scholar]
  51. Miller, P.; Lanier, W.; Brandt, S. Using growing degree days to predict plant stages. In Ag/Extension Communications Coordinator, Communications Services; Montana State University-Bozeman: Bozeman, MO, USA, 2001. [Google Scholar]
  52. Acharjee, T.K.; van Halsema, G.; Ludwig, F.; Hellegers, P.; Supit, I. Shifting planting date of Boro rice as a climate change adaptation strategy to reduce water use. Agric. Syst. 2019, 168, 131–143. [Google Scholar] [CrossRef]
  53. Li, R.; Li, M.; Ashraf, U.; Liu, S.; Zhang, J. Exploring the Relationships Between Yield and Yield-Related Traits for Rice Varieties Released in China From 1978 to 2017. Front. Plant Sci. 2019, 10, 543. [Google Scholar] [CrossRef] [PubMed] [Green Version]
  54. Begum, F.; Nessa, A. Effects of temperature on some physiological traits of wheat. J. Bangladesh Acad. Sci. 2014, 38, 103–110. [Google Scholar] [CrossRef] [Green Version]
  55. Anannya, A.M. Understanding the Impact of El Niño and La Niña on Bangladesh’s Crop Production and Disaster Management Plan. Master’s Thesis, Norwegian University of Life Sciences, As, Norway, 2018. [Google Scholar]
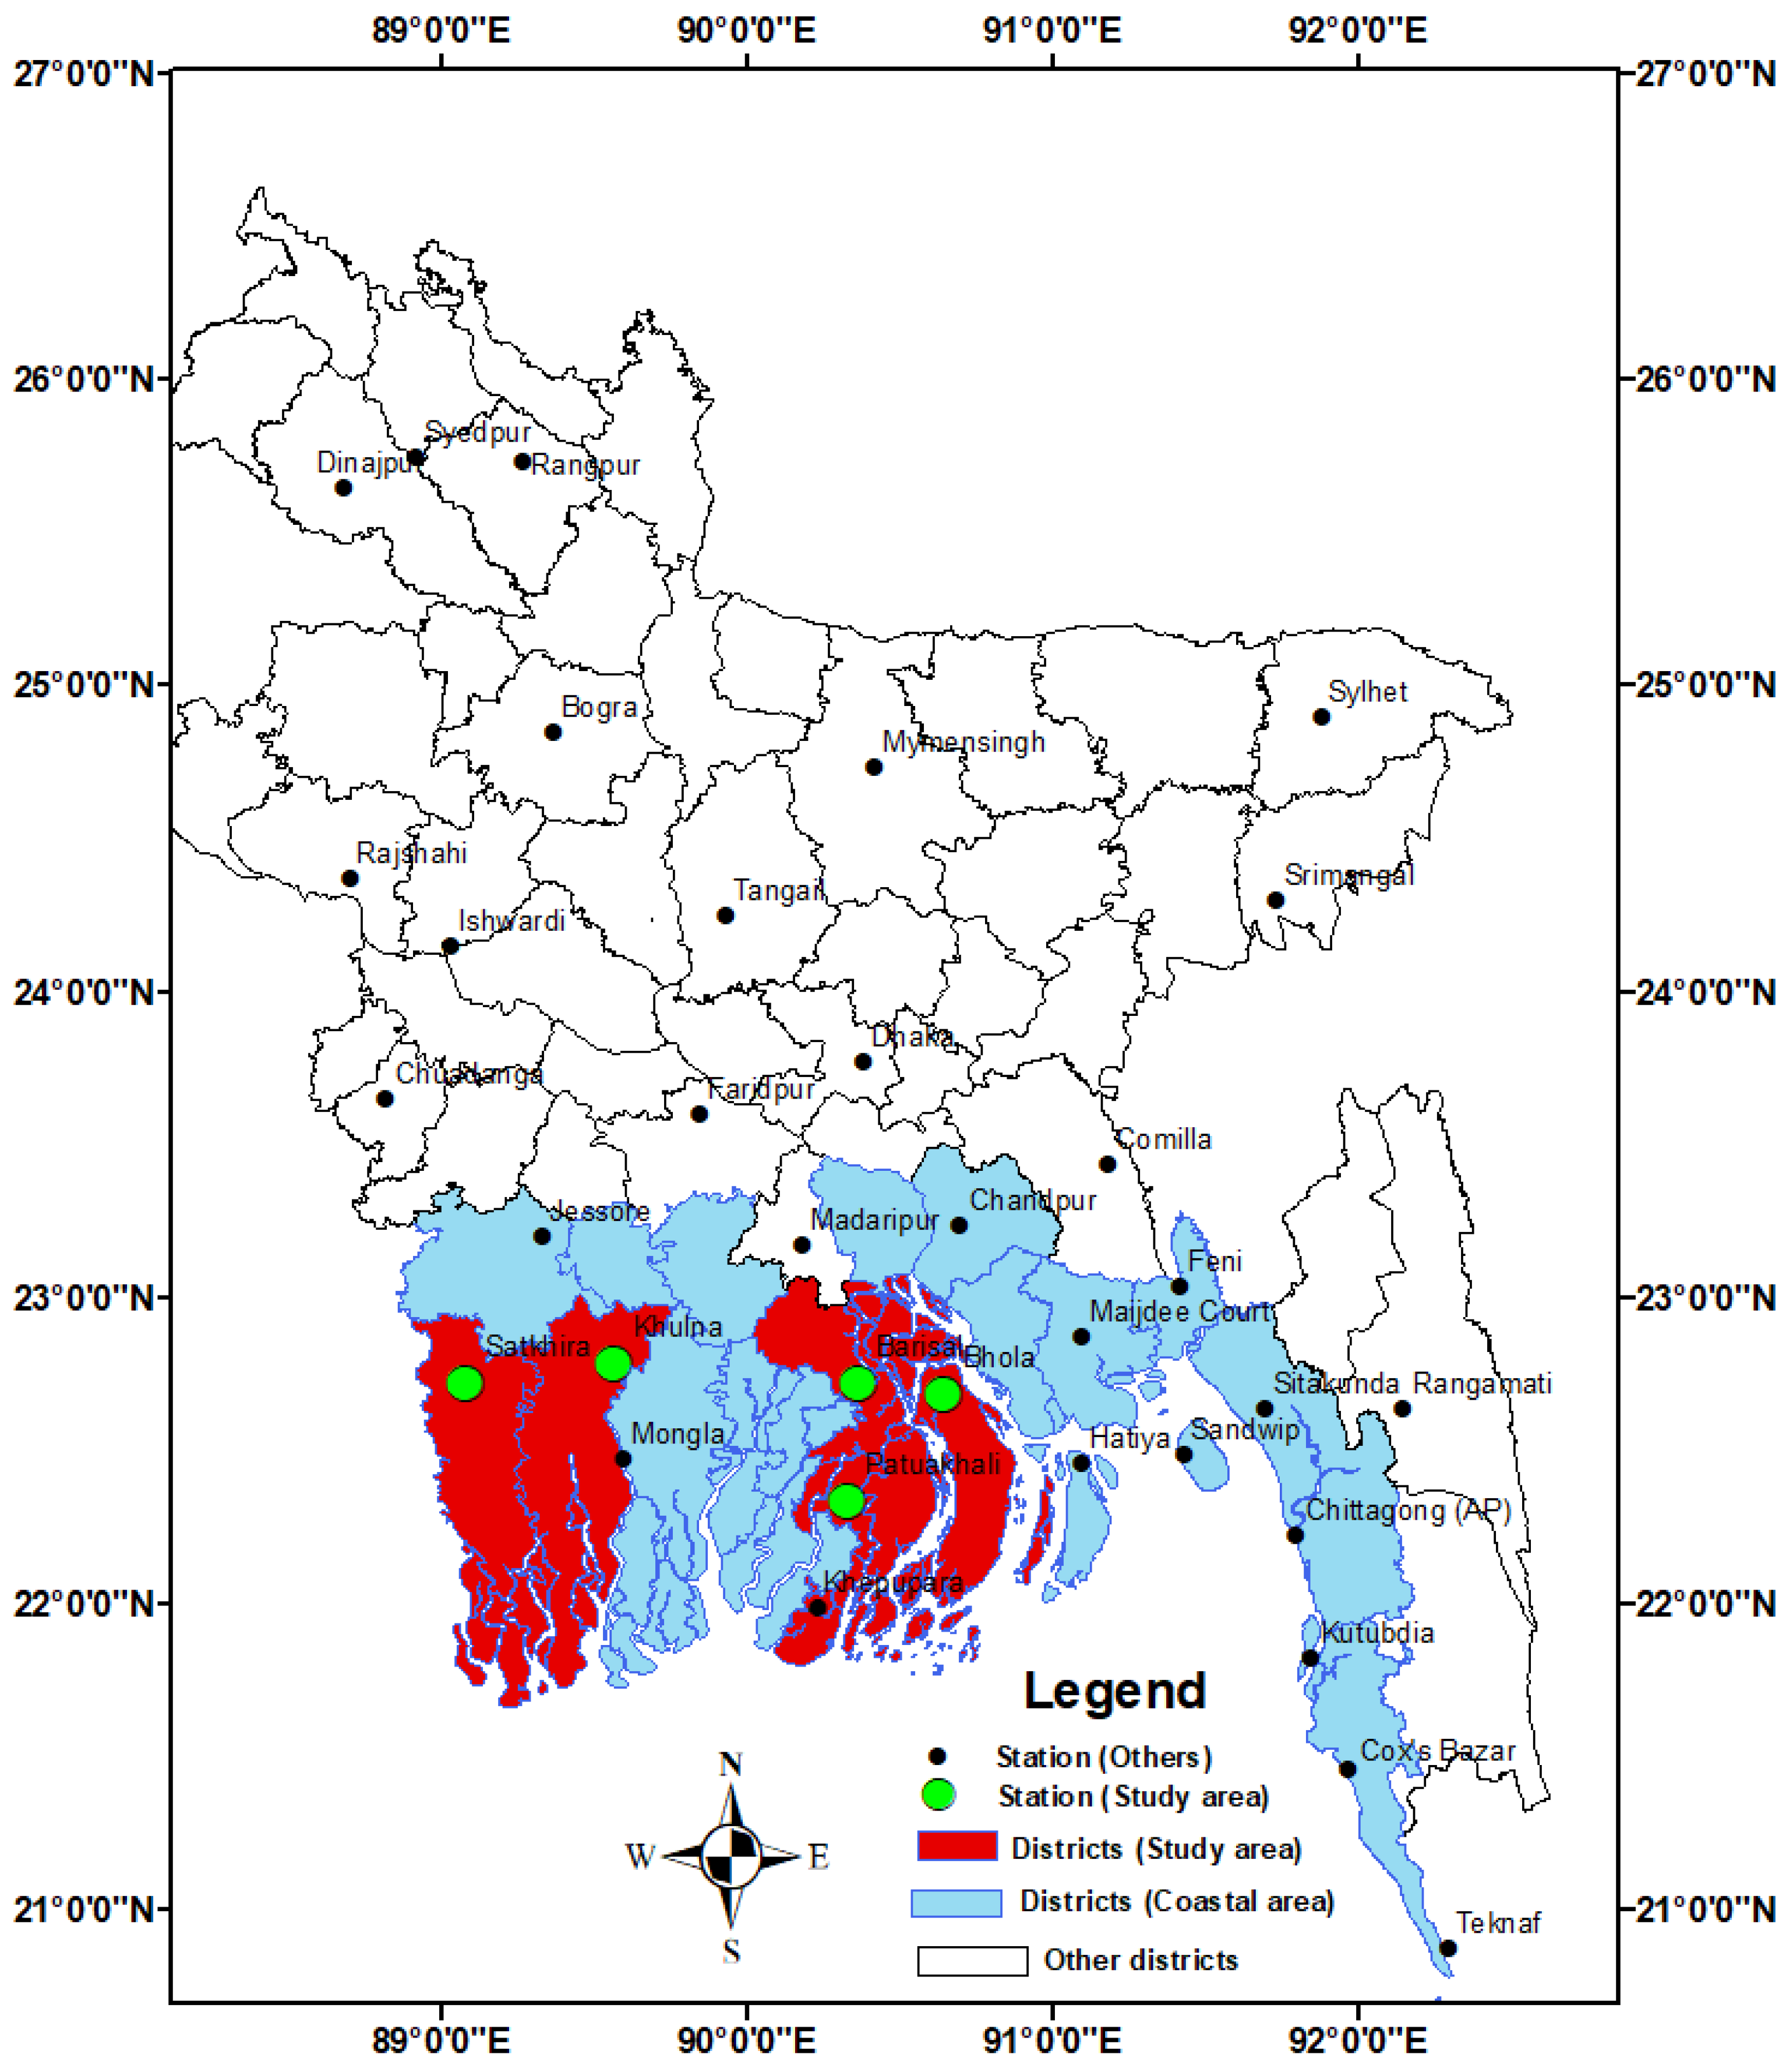
Figure 1. Map showing the observational stations of Bangladesh Meteorological Department while study areas are highlighted with red colors and other coastal districts are highlighted with lake colors.
Atmosphere 12 01449 g001
Figure 2. Average monthly variations of maximum temperature (A), minimum temperature (B), and rainfall (C) for all selected stations in coastal Bangladesh. Means that do not share same letters are statistically significant (Tukey’s b, α = 5%). The error bars represent the standard error of the means.
Atmosphere 12 01449 g002aAtmosphere 12 01449 g002b
Figure 3. Impacts of ENSO on maximum temperature (A) and minimum temperature (B) composite during Kharif-I, Kharif-II and Rabi seasons for all selected stations in coastal Bangladesh. Means that do not share same letters are statistically significant (Tukey’s b, α = 5%). The error bars represent the standard error of the means.
Atmosphere 12 01449 g003
Figure 4. Impacts of ENSO on maximum temperature (A) and minimum temperature (B) composite during Aus, Aman, and Boro seasons for all selected stations in coastal Bangladesh. Means that do not share same letters are statistically significant (Tukey’s b, α = 5%). The error bars represent the standard error of the means.
Atmosphere 12 01449 g004
Figure 5. Impacts of ENSO signals on the amount of total rainfall composite during (A) Aus, Aman, and Boro, and (B) Kharif-I, Kharif-II and Rabi seasons for all selected stations in the coastal Bangladesh. Means that do not share same letters are statistically significant (Tukey’s b, α = 5%). The error bars represent the standard error of the means.
Atmosphere 12 01449 g005
Figure 6. Mean daily GDD of different ENSO events under agricultural (A) and rice growing (B) seasons. The error margin in the bars represents the standard error of the means while different latter above the bars indicate significant differences (Tukey’s b, α = 5%).
Atmosphere 12 01449 g006
Figure 7. Estimated difference in growth duration of different crops grown between Barishal and Khulna regions.
Atmosphere 12 01449 g007
Table 1. Identified ENSO years during 1951–2017.
ENSO EventsYears
El Niño1951, 1957, 1958, 1963, 1966, 1982, 1987, 1992, 1997, 2002 and 2015
La Niña1955, 1971, 1974, 1975, 1989, 1999, 2000, 2008 and 2011
Neutral 1960, 1961, 1962, 1967, 1981, 1990, 1993 and 2013
Publisher’s Note: MDPI stays neutral with regard to jurisdictional claims in published maps and institutional affiliations.