Abstract
Global climatic changes have been observed for all natural biomes, with the greatest impact in the permafrost zone. The short series of direct observations of air temperature and precipitation from meteorological stations for this territory make it difficult to use them in studies of the impact of climate change on forest and forest-tundra ecosystems, but only longer series of gridded data expand the temporal-spatial resolution of this analysis. We compared local and gridded air temperature, precipitation and vapor pressure deficit (VPD) data, analyzed the trends of their changes over the last century for three sites in the permafrost zone (YAK and TAY in Russia, and CAN in Canada), and estimated the effect of their variability on oxygen isotopes in the tree-ring cellulose (δ18Ocell) of three different species (Larix cajanderi Mayr, Larix gmelinii Rupr. Rupr and Picea glauca (Moench) Voss). Climate trend analysis showed strong changes after the 1980s, and even more pronounced from 2000 to 2020. We revealed that δ18Ocell-YAK showed mixed signals of the July temperature (r = 0.49; p = 0.001), precipitation (r = −0.37; p = 0.02) and vapor pressure deficit (VPD) (r = 0.31; p = 0.02), while δ18Ocell-CAN captured longer March–May (r = 0.37, p = 0.001) and July (r = 0.32, p < 0.05) temperature signals as well as spring VPD (r = 0.54, p = 0.001). The δ18Ocell-TAY showed a significant correlation with air temperature in July (r = 0.23, p = 0.04) and VPD in March (r = −0.26, p = 0.03). The obtained eco-hydrological relationships indicate the importance of temperature and moisture to varying degrees, which can be explained by site- and species-specific differences.
1. Introduction
Drastic temperature and precipitation changes over the past few decades have led to massive wildfires [1,2,3] and permafrost degradation [4] in boreal forests [5]. Conifer trees growing in circumpolar regions are highly sensitive to rapid climatic changes due to their location at high latitudes, where air temperature is a limiting factor and has a strong impact on tree growth [6,7,8,9,10,11]. Permafrost plays an important role in stabilizing the climatic system and climate-albedo feedbacks that are unique to the circumpolar regions [12]. Due to climate warming, both vapor pressure deficit (VPD) and evapotranspiration are expected to increase in the subarctic, which has a strong impact on trees’ water relations [4,10,13,14].
The major advantage of studying conifer trees from circumpolar regions is their remoteness, allowing one to investigate tree responses to environmental changes without anthropogenic disturbances. A major disadvantage is the scarcity of local weather stations in the study regions. Moreover, local climate data observations have been documented since 1945 without gaps and missing values (http://meteo.ru/, Accessed on 30 August 2021), while earlier periods have gaps and missing values comprise up to 23% of the time series length. Gridded large-scale climate data (CRU TS 4.04 land, KNMI climexp.knmi.nl, Accessed on 30 August 2021) can help in filling the gaps in the observed climate data and can improve the quality of climate reconstructions for remote regions. However, it remains unclear as to which weather stations should be included when obtaining gridded data and if these data have gaps or missing values, and how valuable they can be in the selected nets for climate interpretation.
We do expect highly significant statistical relationships between local air temperature data and gridded data; however, precipitation and vapor pressure deficit (VPD) changes can be challenging to extrapolate for a spatial allocation due to site-specific differences.
Many studies have shown that spring and summer air temperatures are the main drivers of conifer trees’ responses from the circumpolar regions [7,8,15,16,17,18,19,20,21,22]. However, diverging trends between tree-ring chronologies and spring or summer air temperature in some parts of the northern boreal forest, as suggested by D’Arrigo et al. [19], are disputed over recent decades in the dendro community, because they complicate the assumption of uniformitarianism with regard to ring-width-based climate reconstructions in regions affected by divergence [23,24]. Alternatively, stable oxygen isotopes in tree rings were considered as a potentially more reliable climate proxy, which can record both air temperature and precipitation, as well as soil water changes (modified by evaporation at the soil surface) [25,26,27,28,29,30].
Therefore, we aimed to (i) test the usability of local vs. gridded climate data; (ii) examine how conifer trees capture temperature and moisture signals based on the local weather station data from the two sites in Siberia and one site in Canada versus gridded data; (iii) perform trend analysis of climatic data and δ18O in tree-ring cellulose; and (iv) carry out spatial correlation analysis of oxygen isotope patterns and determine the distribution of climatic signals over the subarctic.
2. Materials and Methods
2.1. Study Regions
We studied three conifer tree species (Larix cajanderi Mayr., Larix gmelinii Rupr. Rupr., Picea glauca (Moench) Voss) from circumpolar regions in the permafrost zone in Siberia (Russia): northeastern Yakutia, YAK, 69° N, 149° E; eastern Taimyr, TAY, 70° N, 103° E and the Mackenzie Delta, CAN, 68° N, 133° W, Canada. All study sites are characterized by harsh climate conditions with a low annual temperature (−13 °C for YAK, −12.1 °C TAY, −9.6 °C CAN) and a low amount of annual precipitation (236 mm/year for YAK, 343 mm/year for TAY, and 245 mm/year for CAN). Trees growing in the subarctic regions can reach an age of 1216 years [31]. The vegetation period in the Siberian subarctic lasts ca. 90 days [31,32], while in Canada, the duration of the vegetation period is slightly longer, at 103 days, according to Inuvik weather station data.
2.2. Data Availability and Climate Analysis
We used our earlier published δ18O in tree-ring cellulose (δ18Ocell) records from the three studied sites: northeastern Yakutia, YAK [33], eastern Taimyr, TAY [28] and the Mackenzie Delta, CAN [29], to perform climate analysis with environmental parameters (air temperature, precipitation, vapor pressure deficit) from the local weather stations and gridded data. YAK and TAY δ18Ocell chronologies were based on at least five trees from each location. Tree cores were collected from the old (>350 years) conifer trees. Meanwhile, the δ18Ocell chronology from CAN was based on three samples with an average age of up to 185 years old [29].
The local weather station data from Chokurdakh, YAK (70°37′ N, 147°53′ E) vs. gridded data for 70–71° N, 147–148° E; Khatanga, TAY (71°59′ N, 102°28′ E) vs. gridded data for 71–72° N, 102–103° E and Inuvik, CAN (68°30′ N, 133°48′ W) vs. gridded data for 68–69° N, 133–134° W were used to evaluate the correspondence between datasets for temperature and precipitation for the period 1966–2020.
The local weather station data, including monthly precipitation, temperature and vapor pressure deficit (VPD), daily precipitation, and daily air temperature for Chokurdakh and Khatanga, were downloaded from the meteo.ru database for the period from 1901 to 2020. Monthly air temperature and monthly precipitation data for the Inuvik weather station were downloaded from the climate explorer KNMI https://climexp.knmi.nl (Accessed on 30 August 2021), CRU TS 4.04 (land) and http://www.cccma.ec.gc.ca/hccd/ (Accessed on 30 August 2021) for the period from 1901 to 2020.
The daily and dew point temperatures were obtained by taking the mean values of the hourly data for each day from https://climate.weather.gc.ca/historical_data/search_historic_data_e.html (Accessed on 30 August 2021), which were downloaded from climate.weather_gc_ca.py (Accessed on 30 August 2021).
Daily VPD data were calculated as follows:
where is the average daily air temperature (in °C), is the average daily dew temperature (in °C), and
A python application was written for data processing (https://github.com/mikewellmeansme/ClimateMaster, accessed on 30 August 2021).
2.3. Trend Analysis
Trend analysis was obtained by using functions from climate.trend_plots.py. Trend lines were plotted by applying the least squares polynomial fit to input data (air temperature, precipitation, VPD) for the period from 1901 to 2020. Then, Pearson’s correlation coefficients between the trend line and input data were calculated. The years without any data were omitted. Trend lines for both periods, 1901–1979 and 1980–2020, were calculated to test the significance of the recent climatic changes reported for subarctic regions [4,22,27,28].
Multiple linear regression analysis between monthly (daily) station data and δ18Ocell was conducted. Pearson’s correlations (R) coefficients and coefficients of determination (R2) were calculated. Maps with the distribution of correlation coefficients within the range from 70° N to 135° W vs. local weather station data as well as δ18Ocell were computed using “Climate Explorer climexp.knmi.nl”.
3. Results
3.1. Local Weather Station Data vs. Gridded Data
Monthly air temperature and precipitation data obtained from the Chokurdakh (YAK), Khatanga (TAY) and Inuvik (CAN) local weather stations were correlated versus gridded climate data. We found significant agreement (p < 0.0001) between local and gridded air temperature and precipitation data for Chokurdakh, in the range of 0.92–0.98, while for Khatanga air temperature it was 0.79–0.99 and for precipitation it was 0.85–0.99 (Table S1). The average annual air temperature and precipitation records for the available periods for both Chokurdakh and Khatanga weather stations versus gridded data showed significant correspondence between each other (Figure S1). However, we found a higher amplitude of air temperature variability for the gridded data in comparison with data from local stations.
No comparisons between local and gridded VPD data were conducted because the VPD values were calculated from the daily local weather station data for Inuvik and no VPD gridded data were available. Further climate analysis was performed with local weather station data.
3.2. Trend Analysis between Local Weather Station Data vs. Gridded Data
3.2.1. Air Temperature
Climate trends were calculated based on the local weather station data available for the three studied sites—northeastern Yakutia (YAK), eastern Taimyr (TAY) and Mackenzie Delta (CAN)—for the three most important environmental parameters: air temperature, precipitation and vapor pressure deficit (VPD).
We found significant correlations between gridded and local weather station temperature data for all weather stations (r ≥ 0.9; p < 0.0001) (Table S1), while insignificant correlations were revealed between gridded and local weather station precipitation data (r = 0.22; p = 0.12) for Chokurdakh. Less pronounced but still significant correlations were found for the Inuvik VPD (r = 0.32, p = 0.01) and Chokurdakh VPD (r = 0.34, p = 0.0004) (Table S1).
We found that 23% of the daily climatic data were missing before the 1950s, and discovered some dropouts caused by the data availability of one month based on the local Chokurdakh weather station (Figure S1). Such dropouts and missing values were excluded from the statistical analysis.
After data cleaning, we revealed that the average air temperature increased significantly mainly over recent years, staring from the 1980s (Figure 1, red line), which is confirmed by significant trends (p < 0.0001) for the period 1980–2000 for the mean annual (January-December), winter (December of the previous hydrological year to January and February of the current one—DJF), spring (March, April, May—MAM), and summer (June, July, August—JJA) temperatures for the Siberian subarctic (Figure 1, Table S2). Since the 1980s, the autumn months of the previous hydrological year (September, October, November-SON) have played an important role for CAN (Inuvik) (Figure 1, Table S2). Meanwhile, during the period 1939–1979, trends showed insignificant changes (p > 0.05) (Table S2).
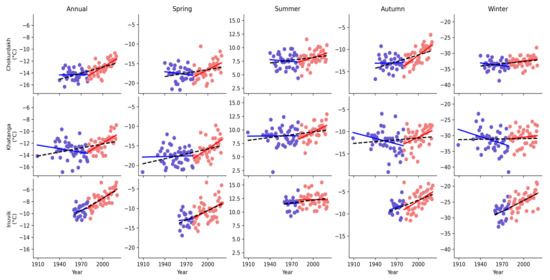
Figure 1.
Annual, spring, summer, autumn and winter air temperature data were obtained from the local meteo.ru database for Chokurdakh (YAK) and Khatanga (TAY), while they were obtained from climate.weather.gc.ca, Accessed on 30 August 2021 for Inuvik (CAN) for annual, spring, summer, autumn and winter, respectively.
To estimate a difference between two periods before the 1980s and after that, a percentage was calculated for all studied weather stations. We found that large changes in average temperature occurred for CAN (21%), while these changes were lesser and similar in magnitude for YAK (8%) and for TAY (9%), respectively. Autumn temperature increased by 13% in YAK and CAN during the period of 1980–2020. Spring temperature increased by 10% in TAY and 18% in CAN, while in the eastern part of Siberia, it increased by only 6%.
The average annual (January-December) and seasonal (spring, summer, autumn, winter) air temperatures are significantly (p < 0.01) allocated from east 100° E to west 100° W and from north 70° N to middle-latitude 50° N (Figure 2).
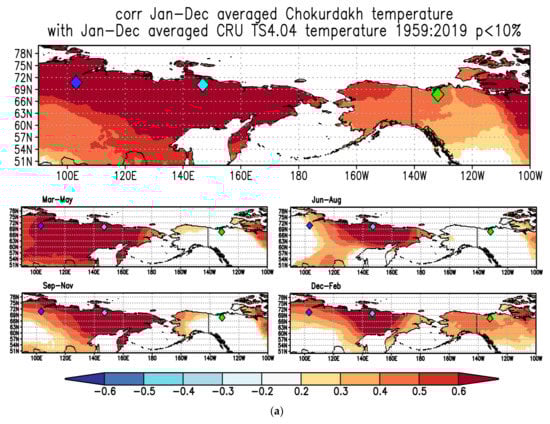
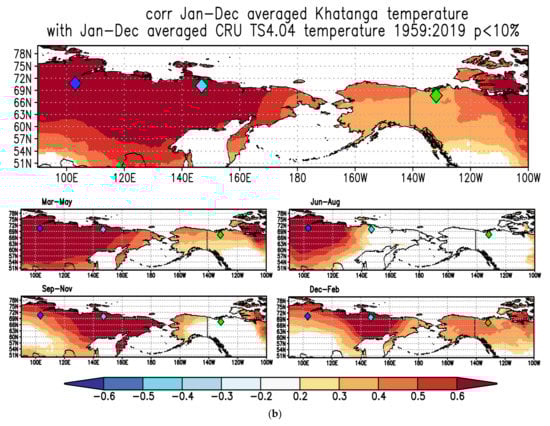
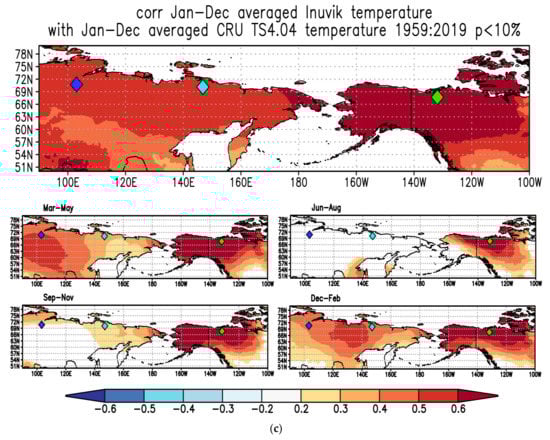
Figure 2.
Spatial distribution of correlation coefficients between gridded (51° N–78° N 90° E–100° W) and local annual (January-December), spring (March-April-May), summer (June-July-August), autumn (September-October-November), and winter (December-January-February) air temperatures for (a) Chokurdakh, northeastern Yakutia (YAK), (b) Khatanga, eastern Taimyr (TAY), and (c) the Mackenzie Delta, Canada (CAN) for the period from 1959 to 2019. Negative significant correlation coefficients are marked in dark blue (r ≥ −0.6; p < 0.01), while positive significant correlations are highlighted in red (r ≥ 0.6, p < 0.01).
3.2.2. Precipitation Trends and Spatial Allocation
Since the 1980s, a significant precipitation decrease was revealed for both YAK (Chokurdakh) and CAN (Inuvik), with pronounced changes during summer, and the annual amount of precipitation decreased for YAK, while decreasing trends for annual, winter, and spring precipitation for CAN were detected (Figure 3, Table S2). Yet, for TAY (Khatanga), significant precipitation changes were occurred earlier compared to YAK and CAN, starting from 1960s.
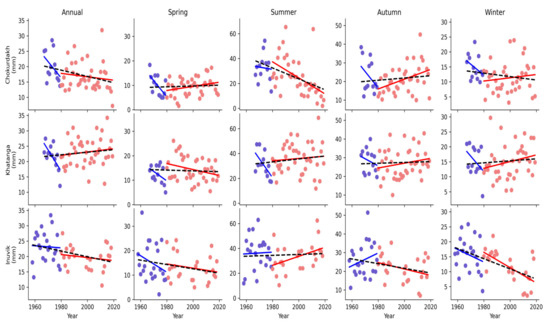
Figure 3.
Annual, spring, summer, autumn and winter precipitation data were obtained from the local meteo.ru database for Chokurdakh (YAK) and Khatanga (TAY), while they were obtained from climate.weather.gc.ca, Accessed on 30 August 2021 for Inuvik (CAN), respectively.
Since the 1980s, annual precipitation has decreased for YAK and CAN by 16%, contrary to the increase (up to 6%) for TAY compared to the period of 1966–1979. Summer and winter precipitation decreased drastically for YAK (23% and 24%, respectively). In TAY, spring and summer precipitation have increased over the past 40 years, showing a reduction in precipitation mainly during winter and autumn. For CAN, precipitation reduced throughout all seasons (winter—25%, spring—14%, summer—9%, and autumn—17%, respectively).
The distribution of precipitation is locally presented in Figure 4 for all studied sites compared to air temperature, which is allocated over a large subarctic territory, taking into account the fact that local distribution is represented within 50–80° N and 90 ° E–100° W (Figure 4).
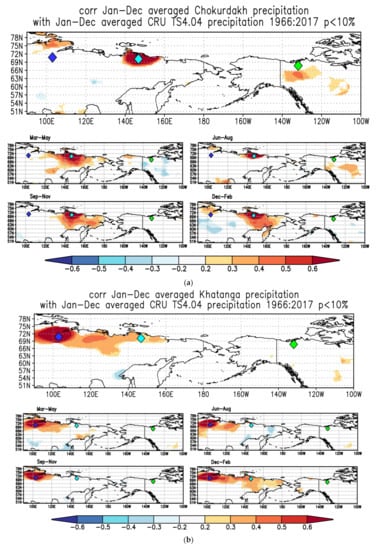
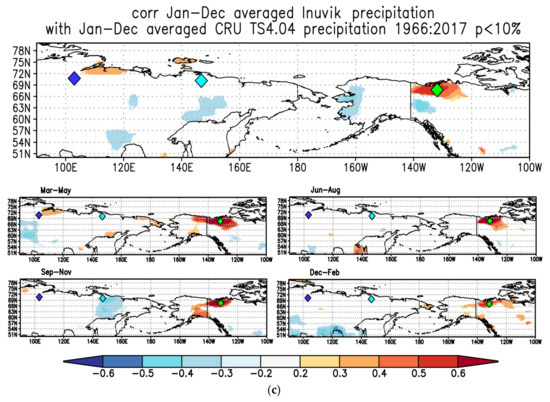
Figure 4.
Spatial distribution of correlation coefficients between gridded (51°N–78° N 90° E–100° W) and local annual (January-December), spring (March-April-May), summer (June-July-August), autumn (September-October-November) and winter (December-January-February) precipitation for (a) Chokurdakh, northeastern Yakutia (YAK), (b) Khatanga, eastern Taimyr (TAY) and (c) the Mackenzie Delta, Canada (CAN) for the period from 1966 to 2017. Negative significant correlation coefficients are marked in dark blue (r ≥ −0.6; p < 0.01), while positive significant correlations are highlighted in red (r ≥ 0.6, p < 0.01).
3.2.3. Vapor Pressure Deficit (VPD) Trends and Changes in a Large Scale
Vapor pressure deficit (VPD) changes recorded from the local weather stations showed significant increasing trends during spring for all studies sites after the 1980s (Figure 5, Table S2), while summer VPD increased mainly for Siberian (TAY, YAK) sites, contrary to the decreasing trend for summer VPD in CAN. Winter VPD data remained stable over the cold winters in the Siberian subarctic, while winter VPD data in CAN increased drastically (Figure 5).
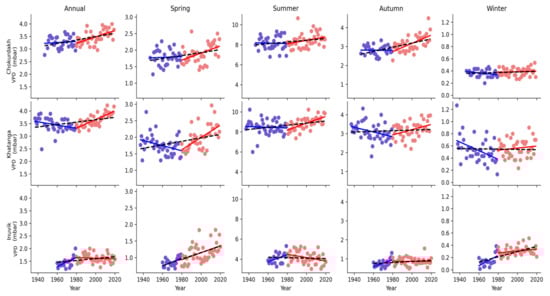
Figure 5.
Annual, spring, summer, autumn and winter vapor presseure deficit (VPD) data were obtained from the local meteo.ru database for Chokurdakh (YAK) and Khatanga (TAY), while they were obtained from climate.weather.gc.ca (Accessed on 30 August 2021) for Inuvik (CAN), respectively.
Annual VPD changes were more pronounced in CAN over the period of 1980–2020 and reached 11%, which is almost two times higher compared to those of YAK and TAY. Spring VPD changes are also distributed mainly for the TAY and CAN regions. Meanwhile, in YAK, autumn VPD changes were more pronounced (up to 12%) compared to the other seasonal changes (6–7%).
The VPD obtained from the local Chokurdakh (YAK) and Khatanga (TAY) weather stations versus gridded VDP data showed significant correlations and a large distribution of VPD data within the net for all seasons, which is not the case for Inuvik (CAN) (Figure 6).
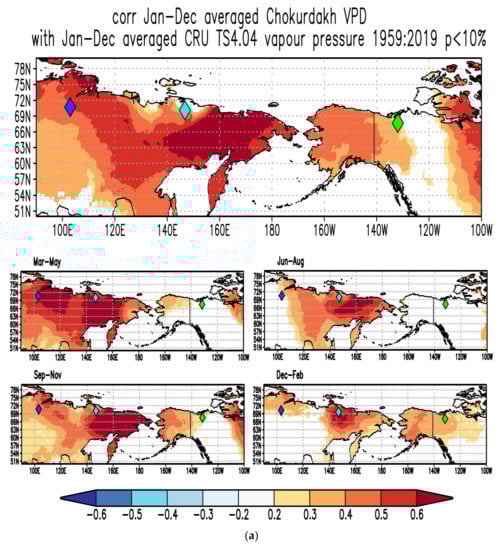
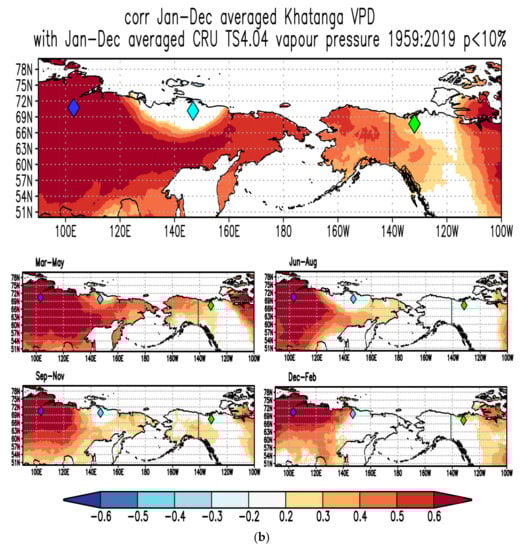
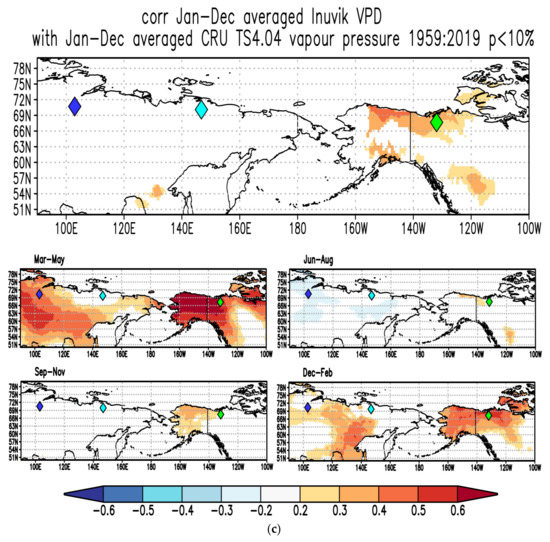
Figure 6.
Spatial distribution of correlation coefficients between gridded (51°N–78° N 90° E–100° W) and local annual (January-December), spring (March-April-May), summer (June-July-August), autumn (September-October-November) and winter (December-January-February) vapor pressure deficit (VPD) data for (a) Chokurdakh, northeastern Yakutia (YAK), (b) Khatanga, eastern Taimyr (TAY), and (c) the Mackenzie Delta, Canada (CAN) for the period from 1959 to 2019. Negative significant correlation coefficients are marked in dark blue (r ≥ −0.6; p < 0.01), while positive significant correlations are highlighted in red (r ≥ 0.6, p < 0.01).
3.3. Oxygen Isotope Patterns and Climatic Trends
The lower averaged δ18Ocell values were revealed for YAK (19.6‰) compared to the central part of Siberia, TAY (20.7‰), and western part of CAN (21.4 ‰). The δ18Ocell showed significant increasing trends only from the 1980s for CAN (r = 0.69, p = 0.0002) and for TAY (r = 0.56, p = 0.0014) (Figure 7b,c), while insignificant changes were detected for YAK only (p > 0.1) (Figure 7a).
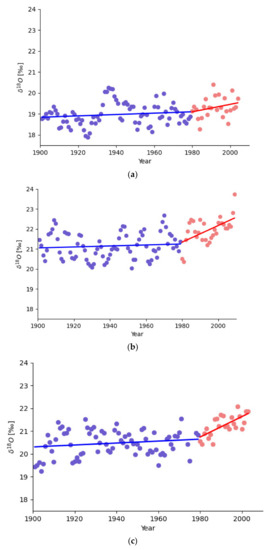
Figure 7.
Annually resolved δ18O in tree-ring cellulose (δ18Ocell) chronologies and their trends for northeastern Yakutia (YAK) (a), eastern Taimyr (TAY) (b) and the Mackenzie Delta (CAN) (c). Trends are marked in blue for the period from 1900 to 1979 and in red for the period from 1980 to 2004 for YAK, and from 1980 to 2009 for TAY and CAN, respectively.
To reveal the impact of environmental parameters (temperature, precipitation and VPD) on the isotopic composition of δ18Ocell, we used local weather stations data instead of gridded data, taking into account the fact that precipitation and VPD data obtained from Chokurdakh and VPD data from Inuvik weather stations insignificantly or poorly correlated with gridded data (see Table S1). Based on multiple linear regression analysis, we revealed positive significant relationships between δ18Ocell-YAK and July air temperature (r = 0.49, p = 0.0001) (Table S3a), as well as July VPD (r = 0.31, p = 0.02) (Table S3c). The temperature of July (26.3%) and the VPD of June (24.9%) and July (28.6%) play a significant role in the variability of δ18O cell from YAK, while precipitation’s contribution is less significant, with negative correlations between the δ18O cell of YAK and July precipitation (r = −0.37, p = 0.02) (Table S3b) for the period of 1966–2003.
July air temperature showed significant correlations with the δ18O cell of TAY (r = 0.23, p = 0.04) and March VPD (r = 0.26, p = 0.03). The highest contribution of July VPD was revealed with the δ18O cell of TAY, reaching 29.4%. The average JJA temperature significantly impacts the δ18O cell of YAK and the δ18O cell of TAY, which is not the case for CAN, where spring (MAM) temperatures are the dominant factor for tree growth (Table S3a), with an even more significant impact for spring VPD (25.5%) on δ18O cell variability.
It is important to note that winter, spring and summer VPD significantly influence the δ18O cell of CAN, r = 0.42, p = 0.005 (Table S3c), while summer VPD significantly affects Siberian trees (Table S2c).
Spatial distribution patterns between δ18Ocell and air temperature (Figure 8a), precipitation (Figure 8b) and VPD (Figure 8c) for TAY, YAK and CAN for the period of 1901–2003 were calculated.
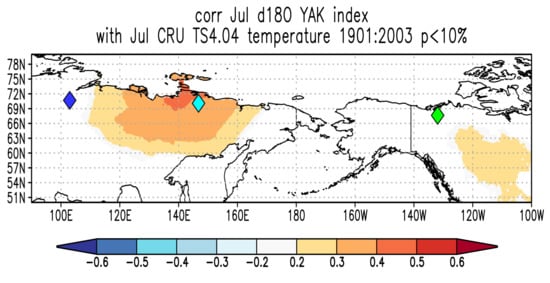
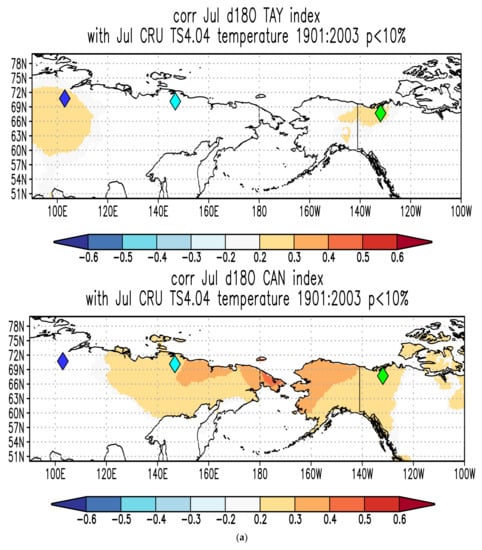
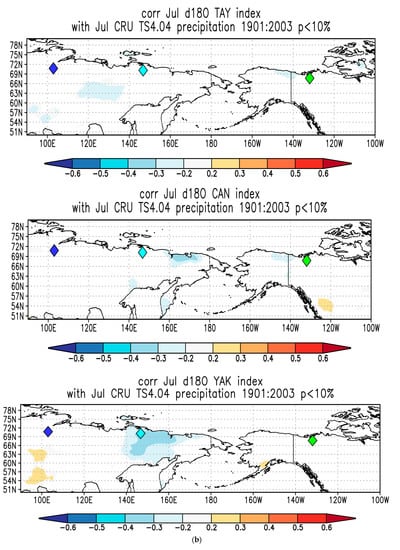
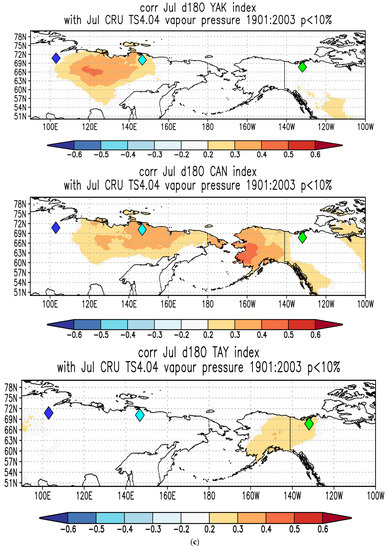
Figure 8.
Spatial distribution of correlation coefficients within gridded net 0.5°, p < 0.01 between δ18Ocell and air temperature (a), precipitation (b) and VPD (c) for TAY, YAK and CAN, respectively.
4. Discussion
Comparative analysis of the local and gridded climatic data (air temperature, precipitation and vapor pressure deficit (VPD)) for two studied sites in the Siberian subarctic and one in Canada showed that temperatures are highly correlated between each other. Subarctic trees grow in a temperature-limited environment; therefore, the large spatial distribution of temperature signal is not surprising. Meanwhile, the insignificant correlation between local and gridded precipitation data and the rather low correlations obtained for VPD can be caused by site-specific climate conditions compared to regional and global temperature effects.
The analyzed climatic trends over the last century clearly showed drastic changes through all seasons starting from the 1980s. This is in line with previously published studies for circumpolar regions [4,9,28,30,32,33]. Annual and summer precipitation decreased significantly (p < 0.001), while summer air temperature and summer VPD showed pronounced increasing trends since the 1980s for the Siberian sites. Increasing VPD along with temperature increase can be explained by low stomatal conductance in the subarctic forest ecosystems, while water availability for trees and nutrient supply depends on freeze–thaw processes in the active soil layer [12]. We also do not exclude species-specific responses to climatic changes of evergreen Picea and deciduous Larix species, which lose their needles and can show different eco-physiological responses to a reduction in precipitation under accelerating temperature and VPD changes, which caused the development of water shortage and drought conditions in the permafrost zone.
The δ18Ocell variations reflect, as a first approximation, average ambient temperatures and moisture changes (precipitation and vapor pressure deficit). To a large extent, major differences in the δ18Ocell values can be explained by Rayleigh fractionation [34,35] of moist air moving from the oceanic source region to colder, more continental areas. Yakutia has one of the most continental climates on the Earth. This is reflected in the extremely cold mean climate, the high seasonality in monthly air temperatures and some of the most depleted precipitation δ18O values observed in the Northern Hemisphere [12,13]. Permafrost δ18O values also show this pattern, with relatively positive ice-wedge δ18O values in western Siberia compared to extremely negative δ18O values in Yakutia [36].
The highly complex hydrological regime of boreal forests, as recorded in the δ18Ocell, reflects a blended water source with seasonal precipitation contributions and a remnant active layer water, and secondary leaf water enrichment. Winter precipitation uptake is only possible in the warming spring and summer months after the snowmelt and active soil layer thaw have occurred. Even before the frozen surface has thawed, snowmelt can infiltrate the ground through frost cracks and migrates to the middle active layer where the ground is relatively dry [37]. From an isotopic perspective, the importance of winter-spring precipitation to soil moisture recharge and tree source waters in cold regions with a freeze–thaw cycle is well-established [12]. This explains the significant correlations commonly observed between δ18Ocell and winter and spring air temperatures, when this fraction of the annual precipitation becomes available for conifer trees [28]. This variation of seasonal δ18Ocell from thawed permafrost water must be taken into account for the evaluation of tree-ring chronologies. Enrichment in δ18Ocell occurs in the conifer needles during transpiration, which may be enhanced under drought conditions when VPD is high [36]. A mixed signal relating to sources and needle water enrichment is finally stored in the wood and cellulose of the tree rings [38,39]. Eco-hydrological differences can be explained by site-specific conditions, the length of the growing season, which is slightly longer and starts earlier in CAN compared to the Siberian sites. A simultaneous air temperature increase and an increase in VPD, especially during spring, are caused by the earlier vegetation season and earlier snowmelt [28,40,41]. The decreasing precipitation and increasing air temperature and VPD during summer (mainly July) in YAK lead to increasing drought [40], while the increasing of air temperature during spring in TAY is leads to an earlier start of the vegetation period. Winter-spring warming in the central part of Siberia (TAY) caused a positive phase of the Arctic oscillation patterns, which brings warmer conditions and heatwaves, leading to wild fires during summer [2,3,41,42]. The strong impact of winter, spring and summer VPD along with air temperature increase can cause the development of drought similar to the eastern Siberian subarctic, even under the thawing of permafrost [14,40].
Depending on the choice of future carbon emission scenarios, the projected global surface air temperature changes for the end of this century relative to preindustrial conditions range from 1.6 °C (0.9 to 2.4 °C, 5–95% confidence interval, RCP2.6) to 4.3 °C (3.2 to 5.5 °C, 5–95% confidence interval, RCP8.5 [41]. Models project substantially higher warming at high latitudes (e.g., Arctic temperature changes are amplified in models by a factor of 2 to 3, implying future warming of 3 (RCP2.6) to 12 °C (RCP8.5)). Moreover, in most areas, the warming is projected to be greater over the land than over the ocean [43,44]. Trees growing on permafrost in subarctic ecosystems, such as those we studied in the Siberian and Canadian subarctic, are sensitive to climate change due to the low precipitation input and the short vegetation season. As temperature increases, the vapor pressure deficit will likely increase, resulting in increased evapotranspiration, which particularly impacts the trees’ water relations [9,12,14]. The potential effects of increased evaporative demand and more intense drought periods on these ecosystems have not been yet extensively studied, although the consequences of large-scale eco-hydrological changes could be dramatic.
5. Conclusions
Trend analysis of the climate data showed that drastic changes in climate variability occurred from the 1980s in subarctic regions, and are even more pronounced from 2000 to 2020. Recent warming and the development of drought conditions are more pronounced in the western hemisphere (Canadian subarctic) compared to the Siberian subarctic. Drastic precipitation changes, temperature and VPD increase mainly occur during winter, spring and autumn in subarctic regions covered by permafrost.
New updated stable isotope chronologies are urgently needed to obtain a full picture of the recent changes in comparison to the past. Accurate extrapolation of the climatic data back into the past by using local and gridded data for remote subarctic sites will improve the quality of climate reconstructions and climate prediction models.
Supplementary Materials
The following are available online at https://www.mdpi.com/article/10.3390/atmos12111416/s1, Figure S1. Annual air temperature (upper pannel), precipitation (middle pannel) and vapor pressure deficit (low pannel) data obtained from the gridded climexp vs. local meteo.ru data for Chokurdakh (left panel), Khatanga (middle panel) and Inuvik, climate.weather.gc.ca and https://climexp.knmi.nl/selectstation.cgi?id=someone@somewhere, accessed on 30 August 2021 (right panel), respectively. Table S1. Trend analysis (r) and (p-values) calculated based on the local weather station observations for the periods of 1901–1979, 1980–2020 and 1901–2020 for annual (January-December, J-D), winter (December, January, February, DJF), spring (March, April, May, MAM), summer (June, July, August, JJA), and autumn (September, October, November, SON) air temperature, precipitation and vapor pressure deficit (VPD). Table S2. Pearson correlation coefficients (r) and p-values (p) calculated monthly from January until December (1–12) and seasonal (spring 3–5, summer 6–8, autumn 9–11 and winter 12–2) air temperature (Tem.) (a), precipitation (Prec.) (b), and vapor pressure deficit (VPD) (c) versus δ18O in tree-ring cellulose (δ18Ocell) chronologies obtained from northeastern Yakutia (YAK), eastern Taimyr (TAY) and the Mackenzie Delta in Canada (CAN) over the period from 1966 to 2004.
Author Contributions
Conceptualization, O.V.C. and M.V.F.; methodology, O.V.C., M.S., M.V.F., M.S.Z., V.V.B.; software, M.S.Z.; validation, M.S.Z., O.V.C. and V.V.B.; formal analysis, M.S.Z., O.V.C., T.J.P., V.V.B.; investigation, O.V.C., M.S., T.J.P. and M.V.F.; resources, M.S.Z., O.V.C.; data curation, M.S.Z., O.V.C.; writing—all authors contributed to the paper writing, original draft preparation, M.S.Z., O.V.C.; writing—review and editing, O.V.C., M.V.F., M.S., T.J.P.; visualization, M.S.Z.; supervision, O.V.C. funding acquisition, O.V.C. All authors have read and agreed to the published version of the manuscript.
Funding
This research was funded by the Russian Science Foundation (RSF) grant number 21-17-00006 (https://rscf.ru/en/project/21-17-00006/, accessed on 1 June 2021).
Institutional Review Board Statement
Not applicable.
Informed Consent Statement
Not applicable.
Data Availability Statement
Data and codes https://github.com/mikewellmeansme/ClimateMaster are available via FAIR Zenodo open research data repository. (accessed on 1 June 2021).
Conflicts of Interest
The authors declare no conflict of interest. The funders had no role in the design of the study; in the collection, analyses, or interpretation of data; in the writing of the manuscript, or in the decision to publish the results.
References
- Soja, A.J.; Tchebakova, N.M.; French, N.H.F.; Flannigan, M.D.; Shugart, H.H.; Stocks, B.J.; Sukhinin, A.I.; Parfe-nova, E.I.; Chapin, F.S.; Stackhouse, P.W. Climate induced boreal forest change: Predictions versus current observations. Glob. Planet. Chang. 2007, 56, 274–296. [Google Scholar] [CrossRef]
- Knorre, A.A.; Kirdyanov, A.V.; Prokushkin, A.S.; Krusic, P.J.; Büntgen, U. Tree ring-based reconstruction of the long-term influence of wildfires on permafrost active layer dynamics in Central Siberia. Sci. Total Environ. 2019, 652, 314–319. [Google Scholar] [CrossRef] [PubMed]
- Kirdyanov, A.V.; Saurer, M.; Siegwolf, R.; Knorre, A.A.; Prokushkin, A.S.; Churakova (Sidorova), O.V.; Fonti, M.V.; Buentgen, U. Long-term ecological consequences of forest fires in the continuous permafrost zone of Siberia. Environ. Res. Lett. 2020, 15, 034061. [Google Scholar] [CrossRef]
- AMAP. Impacts of a Warming Arctic. In Arctic Climate Impact Assessment—ACIA Overview Report; Cambridge University Press: Cambridge, UK, 2004; p. 140. [Google Scholar]
- Apps, M.J.; Shvidenko, A.Z.; Vaganov, E.A. Boreal Forests and the Environment: A Foreword. Mitig. Adapt. Strat. Glob. Chang. 2006, 11, 1–4. [Google Scholar] [CrossRef]
- Hughes, M.K.; Vaganov, E.A.; Shiyatov, S.; Touchan, R.; Funkhouser, G. Twentieth-century summer warmth in northern Yakutia in a 600-year context. Holocene 1999, 9, 629–634. [Google Scholar] [CrossRef]
- Naurzbaev, M.M.; Vaganov, E.A.; Sidorova, O.V.; Schweingruber, F.H. Summer temperatures in eastern Tai-myr inferred from a 2427-year late-Holocene tree-ring chronology and earlier floating series. Holocene 2002, 12, 727–736. [Google Scholar] [CrossRef]
- Briffa, K. Annual climate variability in the Holocene: Interpreting the message of ancient trees. Quat. Sci. Rev. 2000, 19, 87–105. [Google Scholar] [CrossRef]
- Churakova (Sidorova), O.V.; Fonti, M.V.; Saurer, M.; Guillet, S.; Corona, S.; Fonti, P.; Myglan, V.S.; Kirdyanov, A.V.; Naumova, O.V.; Ovchinnikov, D.V.; et al. Siberian tree-ring and stable isotope proxies as indicators of temperature and moisture changes after major stratospheric volcanic eruptions. Clim. Past 2019, 15, 685–700. [Google Scholar] [CrossRef]
- Churakova (Sidorova), O.V.; Fonti, M.V.; Siegwolf, R.T.W.; Saurer, M.; Myglan, V.S. Impact of Recent Climate Change on Water-Use Efficiency Strategies of Larix sibirica in the Altai-Sayan Mountain Range. Forests 2020, 11, 1103. [Google Scholar] [CrossRef]
- Churakova (Sidorova), O.V.; Myglan, V.S.; Fonti, M.V.; Saurer, M. Isotopic responses to dry and wet episodes as captured in tree rings of southern Altai relict forests. Eur. J. For. Res. 2021, 140, 527–535. [Google Scholar] [CrossRef]
- Bonan, B. Forests and Climate Change: Forcings, Feedbacks, and the Climate Benefits of forests. Science 2008, 320, 1444–1449. [Google Scholar] [CrossRef]
- Sugimoto, A.; Yanagisawa, N.; Naito, D.; Fujita, N.; Maximov, T.C. Importance of permafrost as a source of water for plants in east Siberian taiga. Ecol. Res. 2002, 17, 493–503. [Google Scholar] [CrossRef]
- Churakova (Sidorova), O.V.; Shashkin, A.V.; Siegwolf, R.T.; Spahni, R.; Launois, T.; Saurer, M.; Bryukhanova, M.V.; Benkova, A.V.; Kuptsova, A.V.; Peylin, P.; et al. Application of eco-physiological models to the climatic interpretation of δ13C and δ18O measured in Siberian larch tree-rings. Dendrochronologia 2016, 39, 51–59. [Google Scholar] [CrossRef]
- Sidorova, O.V.; Naurzbaev, М. Response of Larix cajanderi to climatic changes at the upper timberline and flood-plane terrace from Indigirka River valley. Russ. For. Manag. 2002, 2, 73–75. [Google Scholar]
- Hantemirov, R.; Gorlanova, L.A.; Surkov, A.Y.; Shiyativ, S.G. Extreme climate events on Yamal for the last 4100 years according to dendrochronological data. Izv. Ross. Akad. Nauk. Ser. Geogr. 2011, 2, 89–102. [Google Scholar]
- Grudd, H. Torneträsk tree-ring width and density ad 500–2004: A test of climatic sensitivity and a new 1500-year reconstruction of north Fennoscandian summers. Clim. Dyn. 2008, 31, 843–857. [Google Scholar] [CrossRef]
- Kononov, Y.; Friedrich, M.; Boettger, T. Regional Summer Temperature Reconstruction in the Khibiny Low Mountains (Kola Peninsula, NW Russia) by Means of Tree-ring Width during the Last Four Centuries. Arct. Antarct. Alp. Res. 2009, 41, 460–468. [Google Scholar] [CrossRef]
- D’Arrigo, R.; Wilson, R.; Liepert, B.; Cherubini, P. On the ‘Divergence Problem’ in Northern Forests: A review of the tree-ring evidence and possible causes. Glob. Planet. Chang. 2008, 60, 289–305. [Google Scholar] [CrossRef]
- Myglan, V.; Oidupaa, O.; Kirdyanov, A.; Vaganov, E. 1929-year tree-ring chronology for Altai-Sayan region (Western Tuva). Archaeol. Ethnol. Anthr. Eurasia 2008, 36, 25–31. [Google Scholar] [CrossRef]
- Schneider, L.; Smerdon, J.E.; Büntgen, U.; Wilson, R.J.S.; Myglan, V.S.; Kirdyanov, A.V.; Esper, J. Revising mid-latitude summer temperatures back to A.D. 600 based on a wood density network. Geophys. Res. Lett. 2015, 42, 4556–4562. [Google Scholar] [CrossRef]
- Porter, T.J.; Pisaric, M.F.J.; Kokelj, S.V.; de Montigny, P. A ring-width-based reconstruction of June–July mini-mum temperatures since AD 1245 from white spruce stands in the Mackenzie Delta region, northwestern Canada. Quat. Res. 2013, 80, 167–179. [Google Scholar] [CrossRef]
- Wilmking, M.; Juday, G.P.; Barber, V.A.; Zald, H.S.J. Recent climate warming forces contrasting growth responses of white spruce at treeline in Alaska through temperature thresholds. Glob. Chang. Biol. 2004, 10, 1724–1736. [Google Scholar] [CrossRef]
- Pisaric, M.F.J.; Carey, S.K.; Kokelj, S.V.; Youngblut, D. Anomalous 20th century tree growth, Mackenzie Delta, Northwest Territories, Canada. Geophys. Res. Lett. 2007, 34, 5. [Google Scholar] [CrossRef]
- Barber, V.A.; Juday, G.P.; Finney, B.P. Reduced growth of Alaskan white spruce in the twentieth century from temperature-induced drought stress. Nat. Cell Biol. 2000, 405, 668–673. [Google Scholar] [CrossRef] [PubMed]
- Saurer, M.; Siegwolf, R.T.W.; Schweingruber, F.H. Carbon isotope discrimination indicates improving water-use efficiency of trees in northern Eurasia over the last 100 years. Glob. Chang. Biol. 2004, 10, 2109–2120. [Google Scholar] [CrossRef]
- Sidorova, O.V.; Siegwolf, R.T.W.; Saurer, M.; Shashkin, A.V.; Knorre, A.A.; Prokushkin, A.; Vaganov, E.; Kirdyanov, A. Do centennial tree-ring and stable isotope trends of Larix gmelinii (Rupr.) Rupr. indicate increasing water shortage in the Siberian north? Oecologia 2009, 161, 825–835. [Google Scholar] [CrossRef]
- Sidorova, O.V.; Siegwolf, R.; Saurer, M.; Naurzbaev, M.; Shashkin, A.V.; Vaganov, E.A. Spatial patterns of climatic changes in the Eurasian north reflected in Siberian larch tree-ring parameters and stable isotopes. Glob. Chang. Biol. 2010, 16, 1003–1018. [Google Scholar] [CrossRef]
- Porter, T.J.; Pisaric, M.F.J.; Kokely, S.V.; Edwards, T.W.D. Climatic signals in (δ13C and δ18O of tree rings from white spruce in the Mackenzie Delta region, northern Canada. Arct. Antarct. Alp. Res. 2009, 41, 497–505. [Google Scholar] [CrossRef]
- Porter, T.J.; Pisaric, M.F.J.; Field, R.D.; Kokelj, S.V.; Edwards, T.W.D.; Demontigny, P.; Healy, R.; LeGrande, A.N. Spring-summer temperatures since AD 1780 reconstructed from stable oxygen isotope ratios in white spruce tree-rings from the Mackenzie Delta, northwestern Canada. Clim. Dyn. 2014, 42, 771–785. [Google Scholar] [CrossRef][Green Version]
- Sidorova, O.V. Long-Term Climatic Changes and the Larch Radial Growth on the Northern Middle Siberia and the Northeastern Yakutia in the Late Holocene; Sukachev Institute of Forest: Krasnoyarsk, Russia, 2003. [Google Scholar]
- Abaimov, A.P.; Bondarev, A.I.; Zyryanova, O.A.; Shitova, S.A. Polar Forests of Krasnoyarsk Region; Novosibirsk Branch of the Publishing House “Science”: Novosibirsk, Russia, 1997; p. 208. [Google Scholar]
- Sidorova, O.V.; Siegwolf, R.; Saurer, M.; Naurzbaev, M.M.; Vaganov, E.A. Isotopic composition (δ13C, δ18O) in Siberian tree-ring chronology. Geophys. Res. Biogeosci. 2008, 113, 13. [Google Scholar]
- Saurer, M.; Schweingruber, F.; Vaganov, E.A.; Shiyatov, S.G.; Siegwolf, R. Spatial and temporal oxygen isotope trends at the northern tree-line in Eurasia. Geophys. Res. Lett. 2002, 29, 7–11. [Google Scholar] [CrossRef]
- Dansgaard, W. Stable isotopes in precipitation. Tellus 1964, 16, 436–468. [Google Scholar] [CrossRef]
- Porter, T.J.; Opel, T. Recent advances in paleoclimatological studies of Arctic wedge and pore-ice stable-water isotope records. Permafr. Periglac. Process. 2020, 31, 429–441. [Google Scholar] [CrossRef]
- Mackay, J.R. Downward water movement into frozen ground, western arctic coast, Canada. Can. J. Earth Sci. 1983, 20, 120–134. [Google Scholar] [CrossRef]
- Yakir, D.; Sternberg, L.D.S.L. The use of stable isotopes to study ecosystem gas exchange. Oecologia 2000, 123, 297–311. [Google Scholar] [CrossRef] [PubMed]
- Roden, J.S.; Lin, G.; Ehleringer, J.R. A mechanistic model for interpretation of hydrogen and oxygen isotope ratios in tree-ring cellulose. Geochim. Cosmochim. Acta 2000, 64, 21–35. [Google Scholar] [CrossRef]
- Vaganov, E.A.; Hughes, M.K.; Kirdyanov, A.V.; Schweingruber, F.H.; Silkin, P.P. Influence of snowfall and melt timing on tree growth in subarctic Eurasia. Nat. Cell Biol. 1999, 400, 149–151. [Google Scholar] [CrossRef]
- Churakova Sidorova, O.V.; Corona, C.; Fonti, M.; Guillet, S.; Saurer, M.; Siegwolf, R.T.W.; Stoffel, M.; Vaganov, E.A. Recent atmospheric drying in Siberia is not unprecedented over the last 1,500 years. Sci. Rep. 2020, 10, 1–8. [Google Scholar] [CrossRef] [PubMed]
- Churakova (Sidorova), O.V.; Siegwolf, R.T.W.; Fonti, M.V.; Vaganov, E.A.; Saurer, M. Spring arctic oscillation as a trigger of summer drought in Siberian subarctic over the past 1494 years. Sci. Rep. 2021, 11, 1–10. [Google Scholar] [CrossRef]
- IPCC. 2013: Climate Change the Physical Science Basis. Contribution of Working Group I to the Fifth Assessment Report of the Intergovernmental Panel on Climate Change; Stocker, T.F., Qin, D., Plattner, G.-K., Tignor, M., Allen, S.K., Boschung, J., Nauels, A., Xia, Y., Bex, V., Midgley, P.M., Eds.; Cambridge University Press: Cambridge, UK, 2013; 1535p. [Google Scholar] [CrossRef]
- Fischer, H.; Meissner, K.J.; Mix, A.C.; Abram, N.J.; Austermann, J.; Brovkin, V.; Capron, E.; Colombaroli, D.; Daniau, A.-L.; Dyez, K.A.; et al. Palaeoclimate constraints on the impact of 2 °C anthropogenic warming and beyond. Nat. Geosci. 2018, 11, 474–4858. [Google Scholar] [CrossRef]
Publisher’s Note: MDPI stays neutral with regard to jurisdictional claims in published maps and institutional affiliations. |
© 2021 by the authors. Licensee MDPI, Basel, Switzerland. This article is an open access article distributed under the terms and conditions of the Creative Commons Attribution (CC BY) license (https://creativecommons.org/licenses/by/4.0/).