Abstract
The macroscopic characteristics of clouds over Lanzhou, China were investigated using micro-pulse lidar data from September 2005 to November 2011. The results show that the mean of the cloud base height, cloud peak height, cloud top height and cloud thickness during the observation was 4.03 km, 4.81 km, 5.50 km and 1.47 km, respectively; the maximum frequency of the cloud base height, cloud peak height, cloud top height and cloud thickness was 25.7% in the range of 1–2 km, 16.2% in the range of 2–3 km, 14.6% in the range of 2–3 km and 42.2% in the range of 1–2 km, respectively; the maximum frequency of cloud base height was 24.2%, 24.6%, 29.7% and 21.4% in spring, summer, autumn and winter, respectively, all in the range of 1–2 km, and middle clouds occurred most frequently at 41.4%, followed by low clouds (33.7%) and high clouds (24.9%) during the observation period; the maximum frequency of cloud peak height was 15.8% in the range of 3–4 km, 18% in the range of 4–5 km, 20% in the range of 2–3 km in autumn and 18.6% in the range of 5–6 km in winter; the maximum frequency of cloud top height was 14% in the range of 3–4 km in spring, 16% in the range of 4–5 km in summer, 20.1% in the range of 2–3 km in autumn and 17.8% in the range of 7–8 km in winter; the maximum frequency of cloud thickness was 44.9%, 35.6% and 52% in the range of 1–2 km in spring, summer and winter, respectively, while it was 44.9% in the range of 0–1 km in autumn; the cloud thickness was mostly less than 3 km; generally, the thicker of cloud, the less the frequency.
1. Introduction
Clouds cover more than 50% of the Earth’s surface, even reaching 66% to 74%, with approximately 10% more cloud cover occurring over the ocean as compared to land [1,2,3]. Clouds play a key role as water vapor regulators in atmospheric water circulation, mainly by affecting atmospheric water transportation and precipitation [3]. Clouds can affect the radiation balance of the Earth-atmosphere system by reflecting short-wave radiation, absorbing long-wave radiation and releasing latent heat during their formation [4,5,6,7,8]. Researching the characteristics of clouds is of great significance for understanding cloud–climate interactions and climate change. Clouds have cooling effects through reflection of the incoming solar radiation and warming effects through absorbing terrestrial radiation. Clouds are one of the largest uncertainties in climate simulation and climate change research [9]. The cloud radiative forcing relies on the microphysical and macrophysical characteristics, such as the cloud phase, optical depth, particle size distribution, effective radius, droplet number concentration, water content, cloud fraction, cloud vertical structure, cloud height, and so on [9,10,11]. Regarding the cloud heights, the cloud base height (CBH), cloud peak height (CPH) and cloud top height (CTH) characterize the position where cloud appears. Clouds at different heights have different cloud forcing. In general, the warming effect of high clouds is dominant, while it is opposite for the low clouds whose cooling effect is larger [3]. Thus, cloud height is a key parameter for determining the sign of cloud radiative forcing and understanding the cloud impacts on the radiation budget and climate change [11,12]. Therefore, research on the cloud height is of important significance for research on weather and climate change.
The cloud height can be retrieved from ground-based observations and satellite remote sensing. Many studies have revealed the cloud vertical structure and statistical characteristics of cloud base height, top height and geometrical depth using CloudSat, CALIPSO, MODIS, AIRS, MISR, GLAS and TOGA/COARE [5,6,7,9,10,12,13,14,15,16,17,18]. There have also been extensive studies using ground-based and in-situ measurements, such as lidar and radar [7,12,14,15,16,19,20,21,22,23,24,25], radiosonde [10,15,21,25], ceilometer [11] and meteorological station observations [26,27]. These studies have used different means to study the distribution characteristics of clouds in different regions, each with its own advantages. Satellite remote sensing is more suitable for studies over large areas, while ground-based observations are generally fixed points and have relatively high temporal accuracy.
Some previous works have investigated the cloud vertical structure and cloud macroscopic characteristics in Lanzhou. For example, Ge et al. [23,28] analyzed the vertical profile of cirrus cloud occurrence using continuous observations of Ka-band ARM Zenith Radar (KAZR) from 1 August 2013 to 31 July 2015 in the Semi-Arid Climate and Environment Observatory of Lanzhou University (SACOL, 35.57° N, 104.08° E, 1965.8 m above sea level), which carried out measurements during more than 96.8% of the observation period. The longest system shutdown was from 26 to 31 July 2014. It revealed that cirrus clouds occurred 41.6% of the observation time and most frequently appeared at approximately 7.2 km above ground; Liu et al. [29] and Wang et al. [30] analyzed the variation characteristics of cirrus cloud top height, base height, mid-cloud height and thickness using the micro-pulse lidar (MPL-4B) and profiling radiometer measurement from April to November 2007 in SACOL. The results show that the cirrus cloud generally existed in the height from 5.8 km to 12.7 km with the average of 9.0 km, and the mean cloud thickness was 2.0 km; the maximum frequency of cloud height was 8–10 km. The above studies were based on observation data from SACOL, which is located approximately 48 km away from the centre of Lanzhou. There has been relatively little research on the cloud distribution characteristics over Lanzhou. Moreover, the properties of clouds are highly variable, both in time and space [31]. It is of great scientific significance and necessity to study the cloud height over Lanzhou, such as statistical characteristics of CBH, CPH, CTH, cloud thickness and their frequency distributions.
2. Observation and Instrument
The observation was carried out in Lanzhou, China from September 2005 to November 2011. Lanzhou city is the capital of Gansu Province, China. It is located on the northeastern edge of the Qinghai-Tibet Plateau of China and is situated in a valley basin of the Yellow River. Its urban area is 1631.6 km2 and resident population reaches about 4.4 million. Lanzhou has a typical semi-arid and temperate continental climate with an annual average rainfall of 327 mm and an annual mean temperature of 9.3 °C [32].
The instrument used in the study is a cloud and aerosol micro-lidar (Cimel Electronique, France, model: CE370-2), which uses a Q-switched frequency-doubled Nd:YAG laser with a wavelength of 532 nm, a pulse repetition frequency (PRF) of 4.7 kHz and a total laser beam divergence of 55 μrad. The receiver consists of a telescope with a diameter of 20 cm and a field-of-view (FOV) of 110 μrad. The lidar system uses an avalanche photodiode (APD) module as the detector. The quantum efficiency is approximately 55%, and the maximum count rate is approximately 20 MHz. The vertical range resolution is 15 m, and the maximum detection range is 30 km. The effective detection range varies depending on the weather and pollution condition. For example, under severe pollution conditions, its effective detection range is about 5 km or less. The lidar obtains a vertical profile every minute. Taking the laser life into consideration, the lidar works 5 min and retrieves 5 vertical profiles, then does not work for about 25 min for laser recovery. Operationally, it works almost 24 h/day autonomously, except when it is raining or snowing. Zhang et al. described the micro-pulse lidar [33].
Figure 1 shows the distribution of lidar observation days. Generally, the lidar observation was carried out under no-rain and no-snow conditions, while the lidar was turned off a few hours before rain or snow weather and turned on after the rain or snow. There was no lidar observation during the periods of routine lidar checks and maintenances, such as changing a new laser and optimizing the optical system. During the winter and summer vacations, the shortage of human resources resulted in fewer lidar observation.
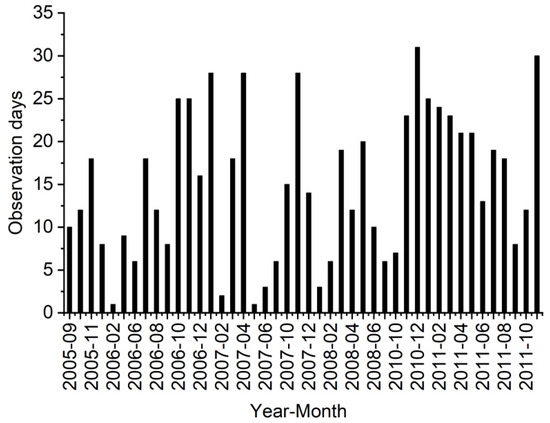
Figure 1.
Distribution of observation days from September 2005 to November 2011.
3. Cloud Discrimination Algorithm
The lidar system observes the backscattering signal of molecules, aerosols and clouds. The original lidar data should be corrected before cloud discrimination. The types of correction include range square correction, overlap correction, afterpulse correction and background noise subtraction. Cao et al. provides an introduction of all the above data corrections [34].
The cloud discrimination algorithm was originated by Mao et al. [35] using the lidar data, then it was developed by Cao et al. [34,36] using the lidar data (CE370-2; L2S-SM II, NIES, Sibata Scientific Technology). It was also applied in the papers by Gao et al. [37,38] based on the lidar data (L2S-SM II).
The schematic diagram in Figure 2 shows a trend function defined to consider the lidar backscattering signal increasing with height, and it can be expressed as , where is the number of range bins whose range corrected signals (RCS) in the lower half of the window are weaker than that of the central range bin, is the number of range bins whose RCS in the upper half of the window are stronger than that of the central range bin, and is the number of range bins in the window. Here the window is height range and it varies with height. The initial window size is set to 150 m (10 range bins). When , the window is enlarged, and is recalculated until . The height with the maximum RCS is set to be the peak, and the starting range bin is the base. The selected window is a candidate for the feature region between the cloud base and peak (BPR). If , the selected window is classified as the cloud layer, where is the lidar signal in the range after performing all the corrections except the range square correction, and the subscripts and represents the peak and base, respectively. The next step is over-detection rejection using , where is the standard deviation of in the range of 22–27 km. Finally, the adjustment of the cloud base height is carried out. When , the cloud base height is reset to be the height a range bin up from the former cloud base height, where is the standard deviation of in the range of cloud base height to 9 range bins up from the cloud base height. The height with the maximum RCS is set to be the cloud peak, the cloud top is defined as where the RCS is smaller than that at the cloud base height. The cloud thickness is defined as the range between the cloud base and cloud top. A case of cloud detection using the cloud discrimination algorithm and the lidar data at 19:30 (UTC) on 10 September 2005 is provided in Figure 3.
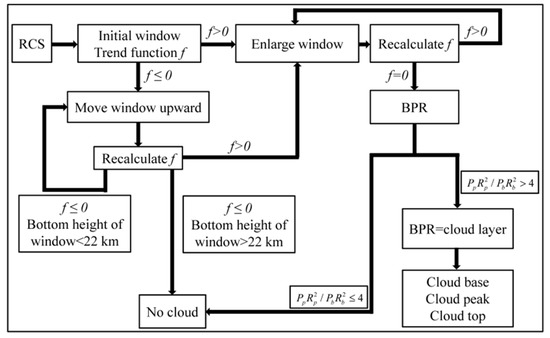
Figure 2.
Schematic diagram of cloud discrimination algorithm.
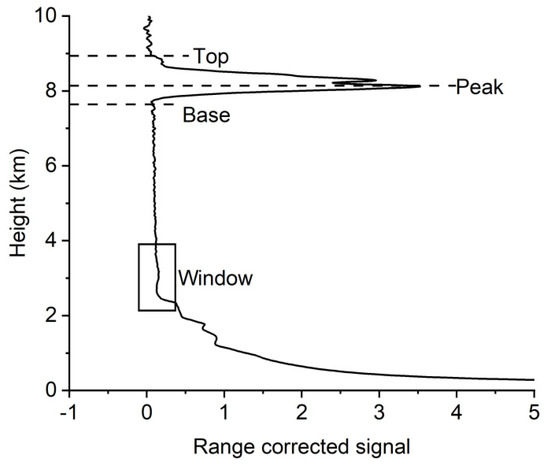
Figure 3.
A case of cloud detection using the cloud discrimination algorithm and the observation lidar data at 19:30 (UTC) on 10 September 2005.
4. Results
In total, 24,932 vertical profiles of lidar backscattering signal were collected in Lanzhou, China, from September 2005 to November 2011. After data corrections and cloud discrimination, clouds were recognized from 9218 vertical profiles of lidar backscattering signal.
Figure 4 shows the frequency distributions of (a) cloud thickness, (b) cloud top height, (c) cloud peak height and (d) cloud base height during the observation period. The frequency of cloud thickness was 42.2% in the range of 1–2 km, 35.7% in the range of 0–1 km and 16.3% in the range of 2–3 km (Figure 4a). Therefore, the cloud thickness was mostly less than 3 km at 94.2%, and generally, the thicker the cloud the less the frequency. The frequency distribution of cloud top height was rather uniform in the range of 1–9 km at approximately 10%, and the frequency was 14.6% in the range of 2–3 km, 12.3% in the range of 7–8 km and 12% in the range of 6–7 km (Figure 4b). The frequency of the cloud peak height was 16.2% in the range of 2–3 km, 14.4% in the range of 5–6 km and 12.9% in the range of 4–5 km, respectively (Figure 4c). The frequency of the cloud base height was 25.7% in the range of 1–2 km, 13.2% in the range of 4–5 km and 12.4% in the range of 5–6 km, respectively (Figure 4d). The clouds were classified into three categories according to the research of Ye et al. [24]: low clouds (cloud base height less than 2 km), middle clouds (cloud base height larger than 2 km and less than 6 km) and high clouds (cloud base height larger than 6 km). During the observation period, the occurrence frequency of middle clouds was the largest, at 41.4%, followed by low clouds (33.7%) and high clouds (24.9%).
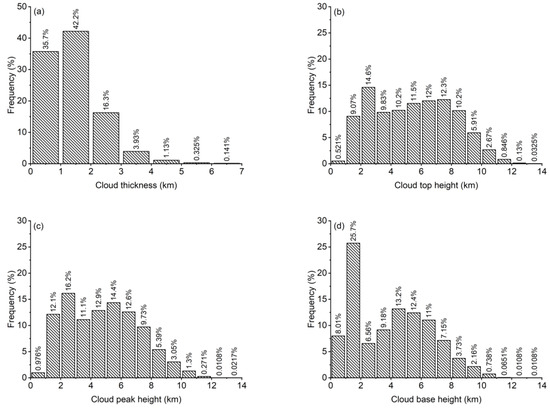
Figure 4.
Frequency distributions of (a) cloud thickness, (b) cloud top height, (c) cloud peak height and (d) cloud base height during the observation period.
Figure 5 shows the box plots of the cloud base height (black), cloud peak height (red), cloud top height (green) and cloud thickness (blue) during the observation period. Each box plot shows the mean and the 25th and 75th percentiles (box) and the first and 99th percentiles (vertical lines). The first percentile and 99th percentile of the cloud base height was 0.60 km and 9.90 km, respectively, and the mean was 4.03 km; the 25th percentile and 75th percentile was 1.45 km and 5.98 km, respectively, and the median was 4.03 km, which was almost the same as its mean. The first percentile and 99th percentile of the cloud peak height was 1.00 km and 10.24 km, respectively, and the mean was 4.81 km, the median was 4.75 km and the 25th percentile and 75th percentile was 2.67 km and 6.58 km, respectively. The first percentile and 99th percentile of the cloud top height was 1.11 km and 11.16 km, respectively, and the mean was 5.50 km; the 25th percentile and 75th percentile was 3.07 km and 7.59 km, respectively, and the median was 5.53 km. The first percentile and 99th percentile of the cloud thickness was 0.22 km and 4.65 km, respectively, and the mean was 1.47 km; the 25th percentile and 75th percentile was 0.76 km and 1.90 km, respectively, and the median was 1.30 km.
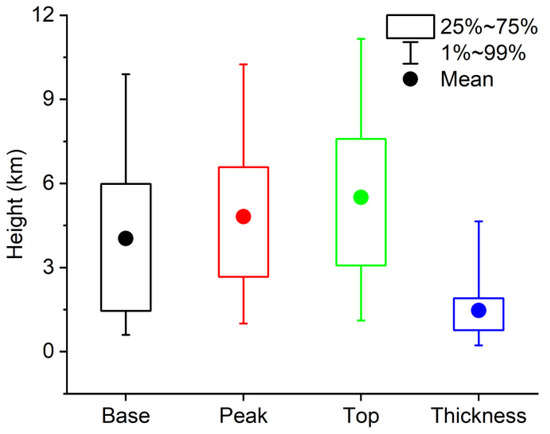
Figure 5.
Box plots of cloud base height (black), cloud peak height (red), cloud top height (green) and cloud thickness (blue) during the observation period.
Figure 6 presents the frequency distributions of the cloud base height in (a) spring, (b) summer, (c) autumn and (d) winter. Spring is considered to be from March to May, summer from June to August, autumn from September to November and winter from December to February. The frequency distributions of the cloud base height in the four seasons were similar, and the maximum frequency was 24.2%, 24.6%, 29.7% and 21.4% in spring, summer, autumn and winter, respectively, all in the range of 1–2 km. It can be seen that in the range of 1–2 km, the frequency in autumn was largest. The second largest frequency was 12% in spring in the range of 5–6 km, and 12.9% in summer, 11.6% in autumn, and 17.3% in winter (all in the range of 4–5 km in summer to winter). The third largest frequency was 11.8% in spring in the range of 4–5 km, 12.8% in summer in the range of 6–7 km, 11.2% in autumn below 1 km, and 16.9% in winter in the range of 5–6 km. Comparing Figure 6 with Figure 4, the frequency distributions in autumn and winter were similar to the distribution during the whole observation period. Clouds with base height above 10 km mostly occurred in spring and summer, rarely in autumn, and never in winter.
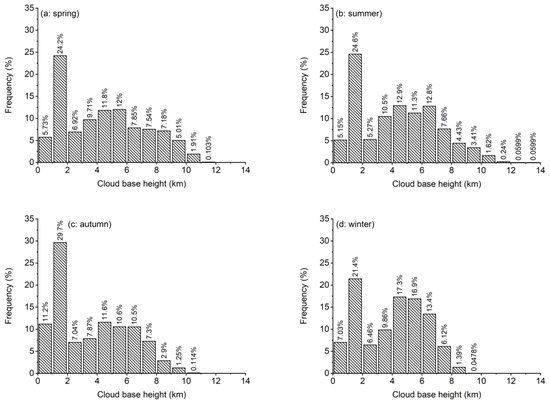
Figure 6.
Frequency distributions of the cloud base height in (a) spring, (b) summer, (c) autumn and (d) winter.
Figure 7 presents the frequency distributions of the cloud peak height in (a) spring, (b) summer, (c) autumn and (d) winter. It shows that the frequency distributions of cloud peak height in spring and in summer were similar; the maximum frequency in spring and summer was 15.8% in the range of 3–4 km and 18% in the range of 4–5 km, respectively; the second largest frequency was 15.1% in the range of 2–3 km in spring and 16.8% in the range of 3–4 km in summer; the third largest frequency was 13% in spring and 14.2% in summer both in the range of 5–6 km; the frequency of cloud peak height in summer increased with height below 5 km, and generally decreased with height above 4 km. The frequency distributions of the cloud peak height in autumn and winter were also similar, except that the frequency in the range 1–3 km in autumn was comparatively larger than that in winter; the maximum frequency was 20% in the range of 2–3 km in autumn and 18.6% in the range of 5–6 km in winter; the second largest frequency was 19% in the range of 1–2 km in autumn and 16.8% in the range of 6–7 km in summer; the third largest frequency was 12.7% in the range of 5–6 km in autumn and 14.7% in the range of 2–3 km in winter; it was the same in that the frequency decreased with height above 5 km in autumn and winter.
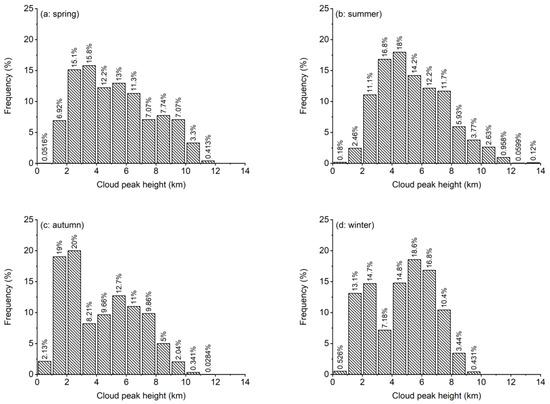
Figure 7.
Frequency distributions of the cloud peak height in (a) spring, (b) summer, (c) autumn and (d) winter.
Figure 8 presents the frequency distributions of the cloud top height in (a) spring, (b) summer, (c) autumn and (d) winter. Overall, the frequency distributions of the cloud top height in spring and summer were similar with maximum frequency of 14% in the range of 3–4 km in spring and 16% in the range of 4–5 km in summer; the second largest frequency was 13.5% in the range of 4–5 km in spring and 14.7% in the range of 3–4 km in summer; the third largest frequency was 10.9% in the range of 6–7 km in spring and 14% in the range of 5–6 km in summer; the frequency of each range bin within 2–11 km changed little in spring with their frequencies of approximately 10%; while in summer, the frequency increased with height below 5 km and then generally decreased with height above 4 km. The frequency distributions of the cloud top height in autumn and winter were similar with maximum frequency of 20.1% in the range of 2–3 km in autumn and 17.8% in the range of 7–8 km in winter; the second largest frequency was 15.9% in the range of 1–2 km in autumn and 17.5% in the range of 6–7 km in winter; the third largest frequency was 11.1% in the range of 7–8 km in autumn and 15.1% in the range of 2–3 km in winter; the frequencies below 3 km and within the range from 3 km to 7 km in autumn and winter increased with height, then the frequencies decreased with height above 7 km, both in autumn and winter.
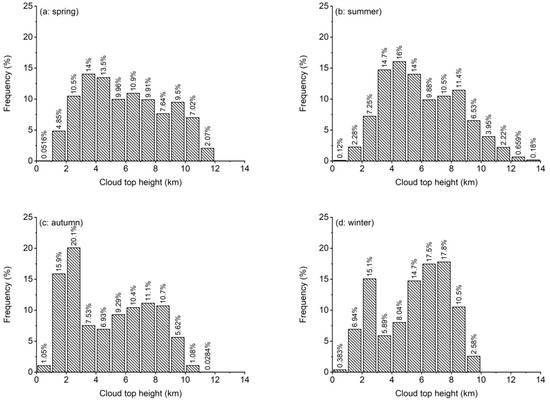
Figure 8.
Frequency distributions of the cloud top height in (a) spring, (b) summer, (c) autumn and (d) winter.
Figure 9 presents the frequency distributions of the cloud thickness in (a) spring, (b) summer, (c) autumn and (d) winter. Overall, the frequency distributions of the cloud thickness in spring, summer and winter were similar with maximum frequency of 44.9%, 35.6% and 52%, respectively, in the range of 1–2 km; the second largest frequency was 30.3%, 31.3% and 28.9% in spring, summer and winter, respectively, in the range of 0–1 km; the third largest frequency was 18.6%, 22.1% and 14.5% in spring, summer and winter, respectively, in the range of 2–3 km; the frequencies increased with thickness less than 2 km, then they decreased with thickness greater than 1 km in spring, summer and winter. Regarding the frequency distribution of the cloud thickness in autumn, the frequency decreased with increasing cloud thickness; the maximum frequency was 44.9% in the range of 0–1 km, the second largest frequency was 38% in the range of 1–2 km followed by 13.2% in the range of 2–3 km. Figure 9 shows that most of the cloud thickness was less than 3 km at 93.8%, 89%, 96.1% and 95.4% in spring, summer, autumn and winter, respectively. Comparing Figure 9 to Figure 4, the frequency distributions of cloud thickness in spring, summer and winter were similar to the distribution during the whole observation period.
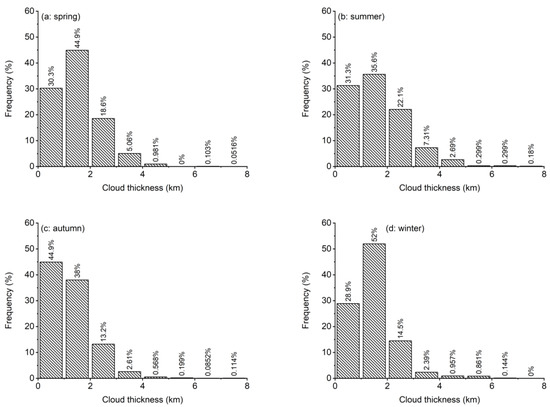
Figure 9.
Frequency distributions of the cloud thickness in (a) spring, (b) summer, (c) autumn and (d) winter.
5. Conclusions and Discussion
In this paper, the statistical characteristics of the cloud base height, cloud peak height, cloud top height and cloud thickness were analyzed using micro-pulse lidar observation over Lanzhou, China from September 2005 to November 2011. The main results are as follows:
- During the observation period, the mean height of the cloud base, cloud peak, cloud top and mean cloud thickness was 4.03 km, 4.81 km, 5.50 km and 1.47 km, respectively; the maximum frequency of the cloud base height, cloud peak height, cloud top height and cloud thickness was 25.7% in the range of 1–2 km, 16.2% in the range of 2–3 km, 14.6% in the range of 2–3 km and 42.2% in the range of 1–2 km, respectively.
- The frequency distribution of cloud base height additionally showed that middle clouds occurred most frequently at 41.4%, followed by low clouds (33.7%) and high clouds (24.9%) during the observation period.
- The frequency distributions of the cloud base height in the four seasons were rather similar, and the maximum frequency was 24.2%, 24.6%, 29.7% and 21.4% in spring, summer, autumn and winter, respectively, all in the range of 1–2 km. The frequency distributions in autumn and winter were similar to the distribution during the whole observation period.
- The frequency distributions of cloud peak height in spring and summer were similar; the maximum frequency in spring and summer was 15.8% in the range of 3–4 km and 18% in the range of 4–5 km, respectively. The frequency distributions of the cloud peak height in autumn and winter were also basically similar, and the maximum frequency was 20% in the range of 2–3 km in autumn and 18.6% in the range of 5–6 km in winter, respectively.
- The frequency distributions of the cloud top height in spring and summer were similar, and the frequency distribution of the cloud top height in autumn was similar to that in winter; the maximum frequency was 14% in the range of 3–4 km in spring, 16% in the range of 4–5 km in summer, 20.1% in the range of 2–3 km in autumn and 17.8% in the range of 7–8 km in winter.
- The cloud thickness was mostly less than 3 km at 94.2%, and generally the thicker the cloud the less the frequency. The frequency distributions of the cloud thickness in spring, summer and winter were similar with maximum frequency of 44.9%, 35.6% and 52%, respectively, in the range of 1–2 km. The frequency of the cloud thickness in autumn decreased with increasing cloud thickness, and the maximum frequency was 44.9% in the range of 0–1 km.
The research was based on the micro-pulse lidar data and cloud discrimination algorithm. Due to the short wavelength and small laser energy of micro-pulse lidar, it led to the attenuation of lidar backscattering signal with height, especially in clouds, which affected the cloud detection to a certain degree, especially the judgment of cloud top height. In the cloud discrimination algorithm, considering the detection capability of micro-pulse lidar, the algorithm only considered the condition of single-layer cloud, and did not further analyze the characteristics of multi-layer clouds, which resulted in some effects on the results, which can lead to further analysis in the future. Kim et al. [16] stated that the CALIOP had difficulties in determining the cloud vertical structure for thick clouds underlying thin cirrus clouds due to the signal attenuations. Dupont et al. [7] validated the cloud height between CALIOP and ground-based lidars, and showed that the consistency on average (both base and top height) ranged from −0.4 km to +0.5 km. The cloud geometrical thickness distributions varied significantly between the different data sets, due in part to the original vertical resolutions of the lidar profiles. Due to the lack of other supporting observation data, no comparative verification of cloud height was carried out, which also affected the study of distribution characteristics of cloud height and to a certain degree, influenced the understanding of cloud height.
Author Contributions
Project administration, X.C.; Supervision, X.C.; Writing—original draft, X.C.; Formal analysis, G.L.; Visualization, M.L. and J.W.; Writing—review & editing, M.L. and J.W. All authors have read and agreed to the published version of the manuscript.
Funding
This research was funded by the Second Tibetan Plateau Scientific Expedition and Research Program (STEP, 2019QZKK0602) and National Natural Science Foundation of China (41627807 and 41905017).
Data Availability Statement
The lidar data was obtained from the Semi-Arid Climate and Environment Observatory of Lanzhou University (SACOL).
Acknowledgments
Thanks are given to the Semi-Arid Climate and Environment Observatory of Lanzhou University (SACOL) for providing the lidar data. We also thank all the reviewers for their valuable and critical comments.
Conflicts of Interest
The authors declare no conflict of interest.
References
- Mace, G.; Marchand, R.; Zhang, Q.; Stephens, G. Global hydrometeor occurrence as observed by CloudSat: Initial observations from summer 2006. Geophys. Res. Lett. 2007, 34, L09808. [Google Scholar] [CrossRef] [Green Version]
- Stubenrauch, C.; Cros, S.; Guignard, A.; Lamquin, N. A 6-year global cloud climatology from the atmospheric infrared Sounder AIRS and a statistical analysis in synergy with CALIPSO and CloudSat. Atmos. Chem. Phys. 2010, 10, 7197–7214. [Google Scholar] [CrossRef] [Green Version]
- Zhao, M.; Zhang, H.; Wang, H.; Zhou, X.; Zhu, L.; An, Q.; Chen, Q. The change of cloud top height over East Asia during 2000–2018. Adv. Clim. Chang. Res. 2020, 11, 110–117. [Google Scholar] [CrossRef]
- Arking, A. The radiative effects of clouds and their impact on climate. Bull. Amer. Meteorol. Soc. 1991, 71, 795–813. [Google Scholar] [CrossRef]
- Dessler, A.; Palm, S.; Spinhirne, J. Tropical cloud-top height distributions revealed by the Ice, Cloud, and Land Elevation Satellite (ICESat)/Geoscience Laser Altimeter System (GLAS). J. Geophys. Res. 2006, 111, D12215. [Google Scholar] [CrossRef] [Green Version]
- Weisz, E.; Li, J.; Menzel, W.; Heidinger, A.; Kahn, B.; Liu, C. Comparison of AIRS, MODIS, CloudSat and CALIPSO cloud top height retrievals. Geophys. Res. Lett. 2007, 34, L17811. [Google Scholar] [CrossRef]
- Dupont, J.; Haeffelin, M.; Morille, Y.; Noël, V.; Keckhut, P.; Winker, D.; Comstock, J.; Chervet, P.; Roblin, A. Macrophysical and optical properties of midlatitude cirrus cloudsfrom four ground-based lidars and collocated CALIOP observations. J. Geophys. Res. 2010, 115, D00H24. [Google Scholar] [CrossRef] [Green Version]
- Zhao, C.; Garrett, T. Effect of Arctic haze on surface cloud radiative forcing. Geophys. Res. Lett. 2015, 42, 557–564. [Google Scholar] [CrossRef]
- Pan, Z.; Gong, W.; Mao, F.; Li, J.; Wang, W.; Li, C.; Min, Q. Macrophysical and optical properties of clouds over East Asia measured by CALIPSO. J. Geophys. Res. Atmos. 2015, 120, 11653–11668. [Google Scholar] [CrossRef]
- Liu, C.; Chiu, C.; Lin, P.; Min, M. Comparison of cloud-top property retrievals from advanced Himawari Imager, MODIS, CloudSat/CPR, CALIPSO/CALIOP, and Radiosonde. J. Geophys. Res. Atmos. 2020, 125, e2020JD032683. [Google Scholar] [CrossRef]
- An, N.; Pinker, R.; Wang, K.; Rogers, E.; Zuo, Z. Evaluation of cloud base height in the North American Regional Reanalysis using ceilometer observations. Int. J. Climatol. 2019, 40, 3161–3178. [Google Scholar] [CrossRef]
- Huo, J.; Li, J.; Duan, M.; Lv, D.; Han, C.; Bi, Y. Measurement of cloud top height: Comparison of MODIS and ground-based millimeter radar. Remote Sens. 2020, 12, 1616. [Google Scholar] [CrossRef]
- Sassen, K.; Benson, R.; Spinhirne, J. Tropical cirrus cloud properties derived from TOGA/COARE airborne polarization lidar. Geophys. Res. Lett. 2000, 27, 673–676. [Google Scholar] [CrossRef]
- Naud, C.; Muller, J.; Haeffelin, M.; Morille, Y.; Delaval, A. Assessment of MISR and MODIS cloud top heights through inter-comparison with a back-scattering lidar at SIRTA. Geophys. Res. Lett. 2004, 31, L04114. [Google Scholar] [CrossRef] [Green Version]
- Chae, J.; Sherwood, S. Insights into cloud-top height and dynamics from the seasonal cycle of cloud-top heights observed by MISR in the West Pacific region. J. Atmos. Sci. 2010, 67, 248–261. [Google Scholar] [CrossRef] [Green Version]
- Kim, S.; Chung, E.; Yoon, S.; Sohn, B.; Sugimoto, N. Intercomparisons of cloud-top and cloud-base heights from ground-based Lidar, CloudSat and CALIPSO measurements. Int. J. Remote Sens. 2011, 32, 1179–1197. [Google Scholar] [CrossRef]
- Peng, J.; Zhang, H.; Shen, X. Analysis of vertical structure of clouds in East Asia with CloudSat data. Chin. J. Atmos. Sci. 2013, 37, 91–100. (In Chinese) [Google Scholar]
- Ye, P.; Wang, T.; Shang, K.; Lv, Q.; Wang, S.; Li, J. Analysis of Cloud Vertical Structure in Western China Based on Satellite Data. Plateau Meteorol. 2014, 4, 977–987. (In Chinese) [Google Scholar]
- Comstock, J.; Ackerman, T.; Mace, G. Ground-based lidar and radar remote sensing of tropical cirrus clouds at Nauru Island: Cloud statistics and radiative impacts. J. Geophys. Res. 2002, 107, 4714. [Google Scholar] [CrossRef]
- Mahesh, A.; Campbell, J.; Spinhirne, J. Multi-year measurements of cloud base heights at South Pole by lidar. Geophys. Res. Lett. 2005, 32, L09812. [Google Scholar] [CrossRef]
- Wang, X.; Song, X.; Chen, B.; Wu, S.; Shao, N. Observation and validation of cloud layer structures from the mobile doppler lidar and radiosonde during spring in Beijing. Acta Opt. Sin. 2015, 35, s201001. (In Chinese) [Google Scholar] [CrossRef]
- Oh, S.; Kim, Y.; Kim, K.; Cho, C.; Lim, E. Verification and correction of cloud base and top height retrievals from Ka–band cloud radar in Boseong, Korea. Adv. Atmos. Sci. 2016, 33, 73–84. [Google Scholar] [CrossRef]
- Ge, J.; Zheng, C.; Xie, H.; Xin, Y.; Huang, J.; Fu, Q. Midlatitude cirrus clouds at the SACOL Site: Macrophysical properties and large-scale atmospheric states. J. Geophys. Res. Atmos. 2018, 123, 2256–2271. [Google Scholar] [CrossRef]
- Ye, B.; Jung, E.; Shin, S.; Lee, G. Statistical characteristics of cloud occurrence and vertical structure observed by a ground-based Ka-band cloud radar in South Korea. Remote Sens. 2020, 12, 2242. [Google Scholar] [CrossRef]
- Giannakaki, E.; Balis, D.; Amiridis, V.; Kazadzis, S. Optical and geometrical characteristics of cirrus clouds over a southern European lidar station. Atmos. Chem. Phys. 2007, 7, 5519–5530. [Google Scholar] [CrossRef] [Green Version]
- Warren, G.; Eastman, M.; Hahn, J. A survey of changes in cloud cover and cloud types over land from surface observations, 1971–1996. J. Clim. 2007, 20, 717–738. [Google Scholar] [CrossRef] [Green Version]
- Fu, C.; Dan, L.; Feng, J.; Peng, J.; Ying, N. The temporal and spatial variation of total cloud cover and its relationship with air temperature and water vapor in China from 1960 to 2012. Chin. J. Atmos. Sci. 2019, 43, 87–98. (In Chinese) [Google Scholar]
- Ge, J.; Wang, Z.; Liu, Y.; Su, J.; Wang, C.; Dong, Z. Linkages between mid-latitude cirrus cloud properties and large-scale meteorology at the SACOL site. Clim. Dyn. 2019, 53, 5035–5046. [Google Scholar] [CrossRef]
- Liu, R.; Zhang, L.; Wang, H.; Cao, X.; Huang, J.; Bi, J. Cirrus cloud measurement using lidar over semi-arid areas. Chin. J. Atmos. Sci. 2011, 35, 863–870. (In Chinese) [Google Scholar]
- Wang, J.; Zhang, L.; Huang, J.; Cao, X.; Liu, R.; Zhou, B.; Wang, H.; Huang, Z.; Bi, J.; Zhou, T.; et al. Macrophysical and optical properties of mid-latitude cirrus clouds over a semi-arid area observed by micro-pulse lidar. J. Quant. Spectrosc. Radiat. Transf. 2013, 122, 3–12. [Google Scholar] [CrossRef]
- Hess, M.; Koepke, P.; Schult, I. Optical properties of aerosols and clouds: The software package OPAC. Bull. Am. Meteorol. Soc. 1998, 79, 831–844. [Google Scholar] [CrossRef]
- Zhao, S.; Yu, Y.; Yin, D.; Yu, Z.; Dong, L.; Mao, Z.; He, J.; Yang, J.; Li, P.; Qin, D. Concentrations, optical and radiative properties of carbonaceous aerosols over urban Lanzhou, a typical valley city: Results from in-situ observations and numerical model. Atmos. Environ. 2019, 213, 470–484. [Google Scholar] [CrossRef]
- Zhang, L.; Cao, X.; Bao, J.; Zhou, B.; Huang, J.; Shi, J.; Bi, J. A case study of dust aerosol radiative properties over Lanzhou, China. Atmos. Chem. Phys. 2010, 10, 4283–4293. [Google Scholar]
- Cao, X.; Wang, Z.; Tian, P.; Wang, J.; Zhang, L.; Quan, X. Statistics of aerosol extinction coefficient profiles and optical depth using lidar measurement over Lanzhou, China since 2005–2008. J. Quant. Spectrosc. Radiat. Transf. 2013, 122, 150–154. [Google Scholar] [CrossRef]
- Mao, F.; Gong, W.; Zhu, Z. Simple multiscale algorithm for layer detection with lidar. Appl. Opt. 2011, 50, 6591–6598. [Google Scholar] [CrossRef]
- Cao, X.; Liang, J.; Tian, P.; Zhang, L.; Quan, X.; Liu, W. The mass concentration and optical properties of black carbon aerosols over a semi-arid region in the northwest of China. Atmos. Pollut. Res. 2014, 5, 601–609. [Google Scholar] [CrossRef] [Green Version]
- Gao, X.; Cao, X.; Tian, P.; Zhang, L.; Huang, Z.; Zhou, T. Combined observation of a dust storm over the Loess Plateau using a dual-wavelength lidar and an aethalometer. Atmos. Pollut. Res. 2017, 8, 1103–1112. [Google Scholar] [CrossRef]
- Gao, X.; Cao, X.; Wang, J.; Guo, Q.; Du, T.; Zhang, L. Analysis of aerosol optical properties in a Lanzhou suburb of China. Atmos. Res. 2020, 246, 105098. [Google Scholar] [CrossRef]
Publisher’s Note: MDPI stays neutral with regard to jurisdictional claims in published maps and institutional affiliations. |
© 2021 by the authors. Licensee MDPI, Basel, Switzerland. This article is an open access article distributed under the terms and conditions of the Creative Commons Attribution (CC BY) license (https://creativecommons.org/licenses/by/4.0/).