1. Introduction
Atmospheric pollutants are a complex system composed of various gaseous pollutants and particulate pollutants, which play an important role in the radiation balance of the atmospheric system, and also affect the efficient use of energy, i.e., solar energy [
1,
2,
3]. At the same time, atmospheric particulate matter pollution has a very important impact on human health, atmospheric climate and radiation. It is an important air pollutant affecting human health and reducing visibility [
4,
5]. Studies have already shown that PM2.5 can easily absorb other pollutants, including heavy metal, organic chemicals, bacteria and viruses. Due to the small particle size of PM2.5, it can penetrate deep into the lungs, and long-term exposure to polluted environments will increase the incidence of cardiovascular and cardiopulmonary diseases [
6,
7,
8,
9]. The chemical composition of atmospheric particulate matter is complex and varies greatly in different regions, but it is basically composed of carbonaceous substances (Elemental Carbon and Organic Carbon), water-soluble ions and various inorganic heavy metal elements [
10,
11]. Heavy metal elements in atmospheric particles will seriously affect the growth of plants [
12,
13]. Particulate matter will also carry heavy metal elements into the human alveoli, which is more harmful to humans. Organic carbon and elemental carbon in aerosols are the main causes of visible light digestion, which reduces atmospheric visibility and causes extreme weather [
14]. At the same time, aerosol particles are also the main components of cloud condensation nuclei, which can affect the lifetime and optical properties of the cloud, and indirectly affect the climate [
15].
Some scholars’ researches in the field of atmospheric aerosols have made great contributions to the governance of the atmospheric environment. Cheng [
16] et al. collected PM2.5, tested their inorganic elements, and used PMF models to study the sources of PM2.5 in Wuhan city, and found that motor vehicle emissions and secondary ion compound pollution affect PM2.5’s contribution is more than 50%. Querol [
17] et al. used Principal Component analysis to analyze the sources of PM10 in the atmospheric environment of Wuhan. The results showed that industry behaviors such as cement and steel production, were the largest pollution sources of PM10 in industrial areas, accounting for 34%, followed by coal burning (20%) and the contribution of the movement of regional pollution sources (16%). In urban areas, coal has the largest contribution rate (31%), followed by the transfer of regional pollution sources (28%), with traffic sources accounting for 16%. Huang [
18] et al. analyzed the causes and sources of air pollution in Wuhan in summer and winter, the results show that the summer air pollution process in Wuhan was greatly affected by the use of solvent coatings, motor vehicle exhaust emissions and industrial emissions of VOCs. Environmental pollution in winter is mainly affected by secondary aerosol sources, coal-burning industrial sources and motor vehicle sources. At the same time, regional transmission also has a certain impact on the occurrence of polluted weather in Wuhan: the polluted air masses in summer and winter come from the southeast and northwest of Hubei Province, respectively. Chen [
19] et al. studied the chemical composition of PM2.5 in Harbin and analyzed the elements in PM2.5 by enrichment factor analysis. It was found that Cr, Ni, Cu, Br and Zn were highly enriched, indicating that these elements were seriously affected by human activities. Zhang [
20] et al. studied the potential sources and source regions of PM1 and PM2 in Beijing using PMF model, Backward Trajectory model and Potential Source Contribution function model. The results show that secondary aerosol and coal combustion, vehicle industry and biomass combustion are the main sources of atmospheric particulate matter.
The above research results are based on the typical areas of the city, and the selections of research sites belong to the areas with high population density, but the popularization of these research conclusions is limited, especially for some other typical areas with different pollution conditions. In this study, the atmospheric environment under various meteorological conditions in the Huangjiahu area of Wuhan is sampled, and its chemical composition and source characteristics are studied. The research results have certain guiding significance for many industries such as environmental monitoring, energy utilization, health care, transportation and so on.
2. Experimental Methods
2.1. Sampling Location
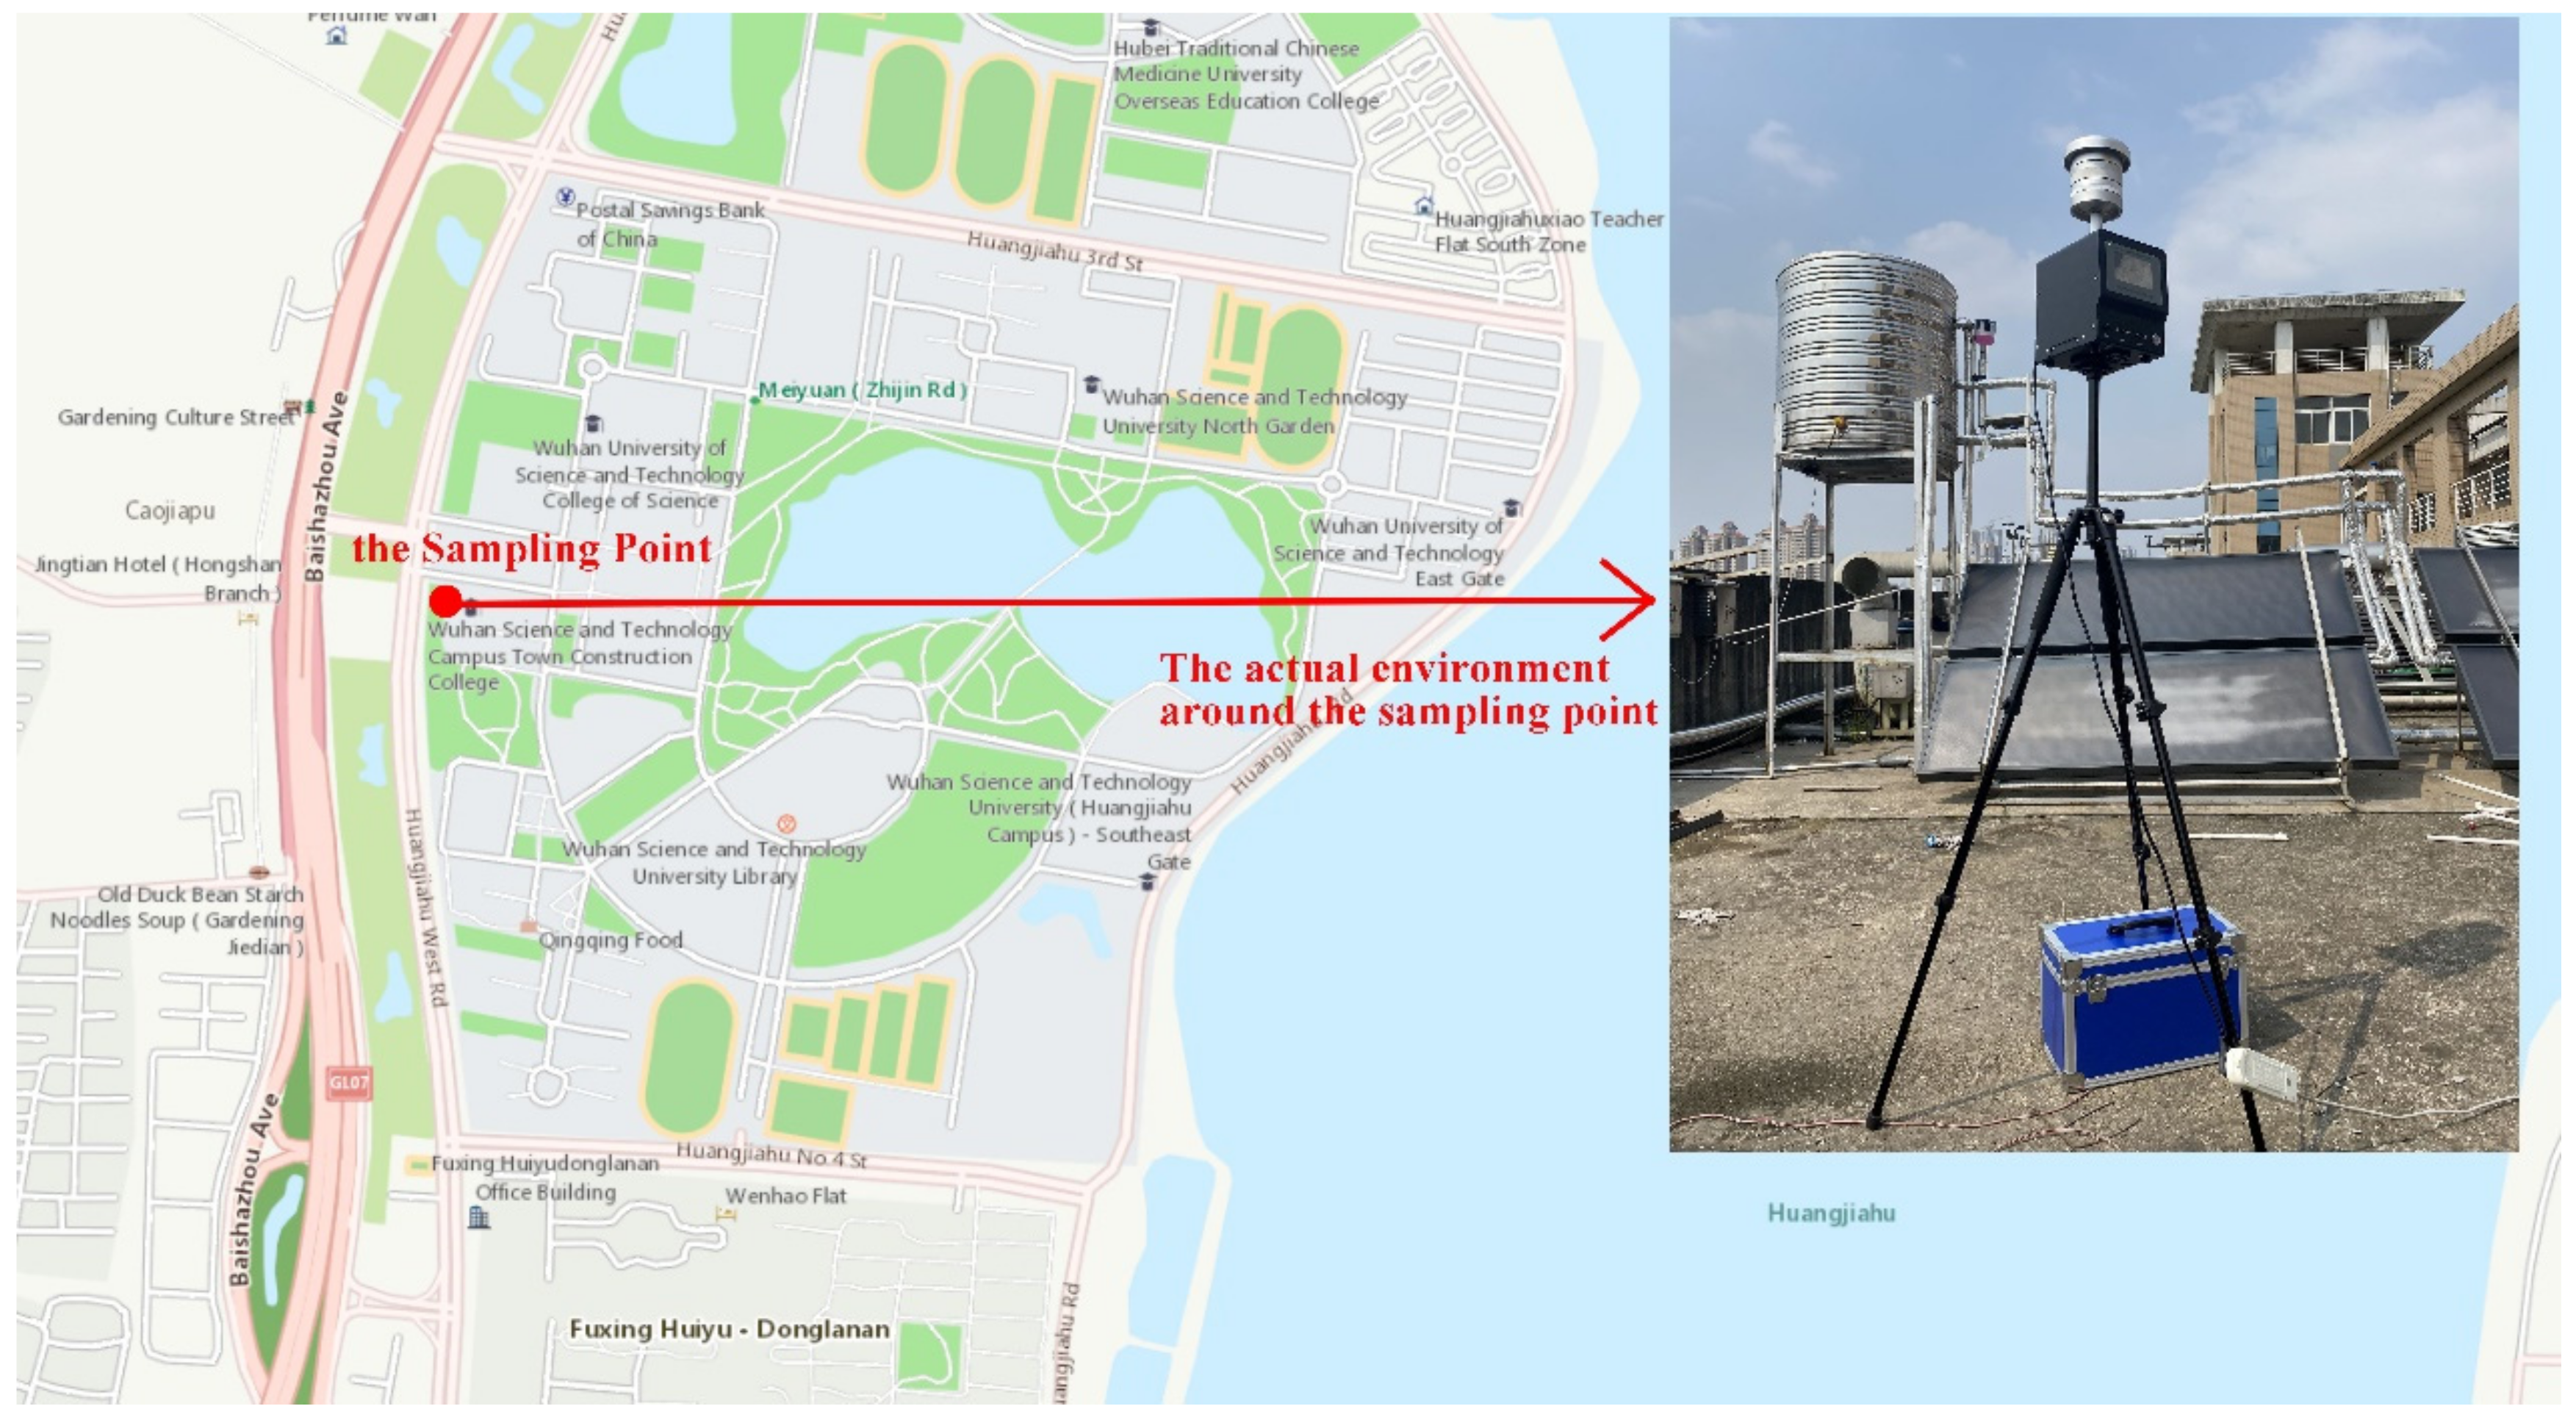
Wuhan has a long history of industrial development. With the continuous development of the economy, its urban construction scale is becoming larger and larger. In recent years, the research on aerosol particles in the urban area of Wuhan has gradually become one of the research hotspots in this field. The location of this study is near the Baishazhou Avenue of Wuhan city, which is one of the busiest transportation roads in Wuhan. Although the relevant departments have made great progress in environmental treatment here in recent years (adding green isolation belt and other measures), there is still aerosol particle pollution, especially in winter and spring, with the increase of pollutant content and the interaction between various pollutant emission sources (automobile exhaust, dust and industrial emission, etc.). Although many scholars and research teams have studied the source analysis of aerosol particles in Wuhan, due to regional differences, as well as differences in the traffic environment and the natural environment, it is more difficult to analyze the pollutant source. Therefore, it is necessary to study the source analysis of particulate matter in the typical area of the Huangjiahu area.
Figure 1 shows the specific location of the sampling point. It is located on the environmental test outdoor platform (114.24° E, 30.44° N) on the roof of the third floor of the fifth teaching building of Wuhan University of science and technology. Horizontal height is 15 m away from the ground and is less disturbed by ground dust. There is a wide green plant coverage area between Baishazhou Avenue, Huangjiahu West Road and the sampling point. The selection of this point is representative.
2.2. Sample Collection and Storage
The DL-6100 medium-flow atmospheric particulate matter sampler has been used for sampling. The working point of the sampler is 100 L/min with an error of no more than 2%. It is equipped with PM10 cutter and PM2.5 cutter, and the cutting particle size is Da50 = 2.5 + 0.2 μm. The geometric standard deviation of the collection efficiency is σg = 1.2 + 0.1 μm. Other performance and technical indicators are in line with HJ/T93-200 regulations. The filter membrane used for sampling is the quartz fiber filter membrane, with a diameter of 90 mm, and the interception efficiency of the filter membrane for 0.3 μm standard particles is not less than 99.7%. Before sampling, the quartz filter membrane is burned in a muffle furnace at a temperature of 500 °C for 4 h. After burning, it is placed in a chamber with a constant temperature and humidity for balance for 24 h. It is also weighed and recorded during this time. The collection time of each sample is 20 h. After the sample is collected, it is balanced again in a constant temperature and humidity chamber for 24 h, is also weighed and recorded, and then placed in a closed refrigeration at 4 °C until detection.
2.3. Analysis Method
The detection instruments used in this paper include Fourier transform infrared spectrometer (FTIR), ICS-2000 Ion Chromatograph (IC), energy dispersive X-ray fluorescence spectrometer (XRF) to qualitatively and quantitatively analyze the functional groups, water-soluble anions and inorganic elements in the sample.
2.3.1. Fourier Transform Infrared Spectrometer Measurement
FTIR can qualitatively analyze the functional groups contained in the sample. By comparing and analyzing the infrared spectra of standard materials, it can effectively determine the types of substances contained in the sample [
21,
22]. In environmental analysis, FTIR can effectively identify substances with infrared characteristics, such as nitric oxide, nitrogen dioxide, nitrogen oxides, sulfur dioxide, chlorofluorocarbons and so on. In order to reduce the influence of filter membrane, blank filter membrane pressure sheet can be made to eliminate interference. FTIR of Perkin Elmer Frontier is used to scan the sample tablet. The wavelength scanning range of the instrument is 4000–400 cm
−1, the scanning times is 32, and the resolution is 4 cm
−1. In order to reduce the experimental error, each sample is tested twice. Through the analysis of FTIR, the functional groups and chemical bonds contained in the collected PM2.5 particles can be identified, so as to judge the types of substances in the particles. We collected a total of 12 sample sets from 26 April to 24 May. The sample numbers and sampling times are shown in
Table 1.
2.3.2. Ion Chromatography Measurement
The water-soluble ions in PM2.5 are measured quantitatively by IC to obtain the specific content of water-soluble ions in atmospheric particles. One quarter of the filter membrane sample is used to measure the content of water-soluble ions. 100 mL pure water is added to the sample to immerse the filter membrane. Cover it and soak it for 30 min, and then put it into an ultrasonic cleaner to vibrate and extract for 20 min. After the extraction process is completed, filter it with an air extraction filtration device, and then use the filtrate with 0.45 μm aqueous microporous blue membrane syringe filter, manually inject the sample into the ion chromatograph for detection.
In this study, ICS-2000 Ion Chromatograph is used. Firstly, six different concentrations of labeled stock solutions are equipped. The standard solutions of six concentrations are successively injected into the ion chromatograph, and the peak area (or peak height) is recorded. Then, the standard curve is drawn with the peak area of each ion as the ordinate and the standard concentration as the abscissa. Finally, the concentration of each ion is calculated according to the peak area (peak height) of the sample.
Table 2 presents the standard curves of four anions.
2.3.3. X-ray Fluorescence Spectrometry Measurement
The X-ray fluorescence spectrometer of Perkin Elmer Frontier energy dispersion model is used to quantitatively analyze the inorganic elements in the sample. The atoms of the elements are excited by high-energy radiation to cause the transition of inner electrons, and emit X-rays with a certain special wavelength. The element content can be measured quantitatively according to this characteristic.
A circular knife with a diameter of 47 mm is used to cut a filter membrane disc with a diameter of 47 mm. The element content in the particulate sample is calculated according to Formula (1):
where,
A represents the area loaded with particles on the filter membrane,
I represents the X-ray fluorescence intensity of the target element in the sample filter membrane,
I0 represents the X-ray fluorescence intensity of the target element in the blank filter membrane,
b is the slope of the calibration curve,
V is the sampling volume in the standard state, and
ρ is the content of the target element in the particle sample.
3. Research Results
3.1. Analysis of General Characteristics of Pollutants in Wuhan from 2017 to 2021
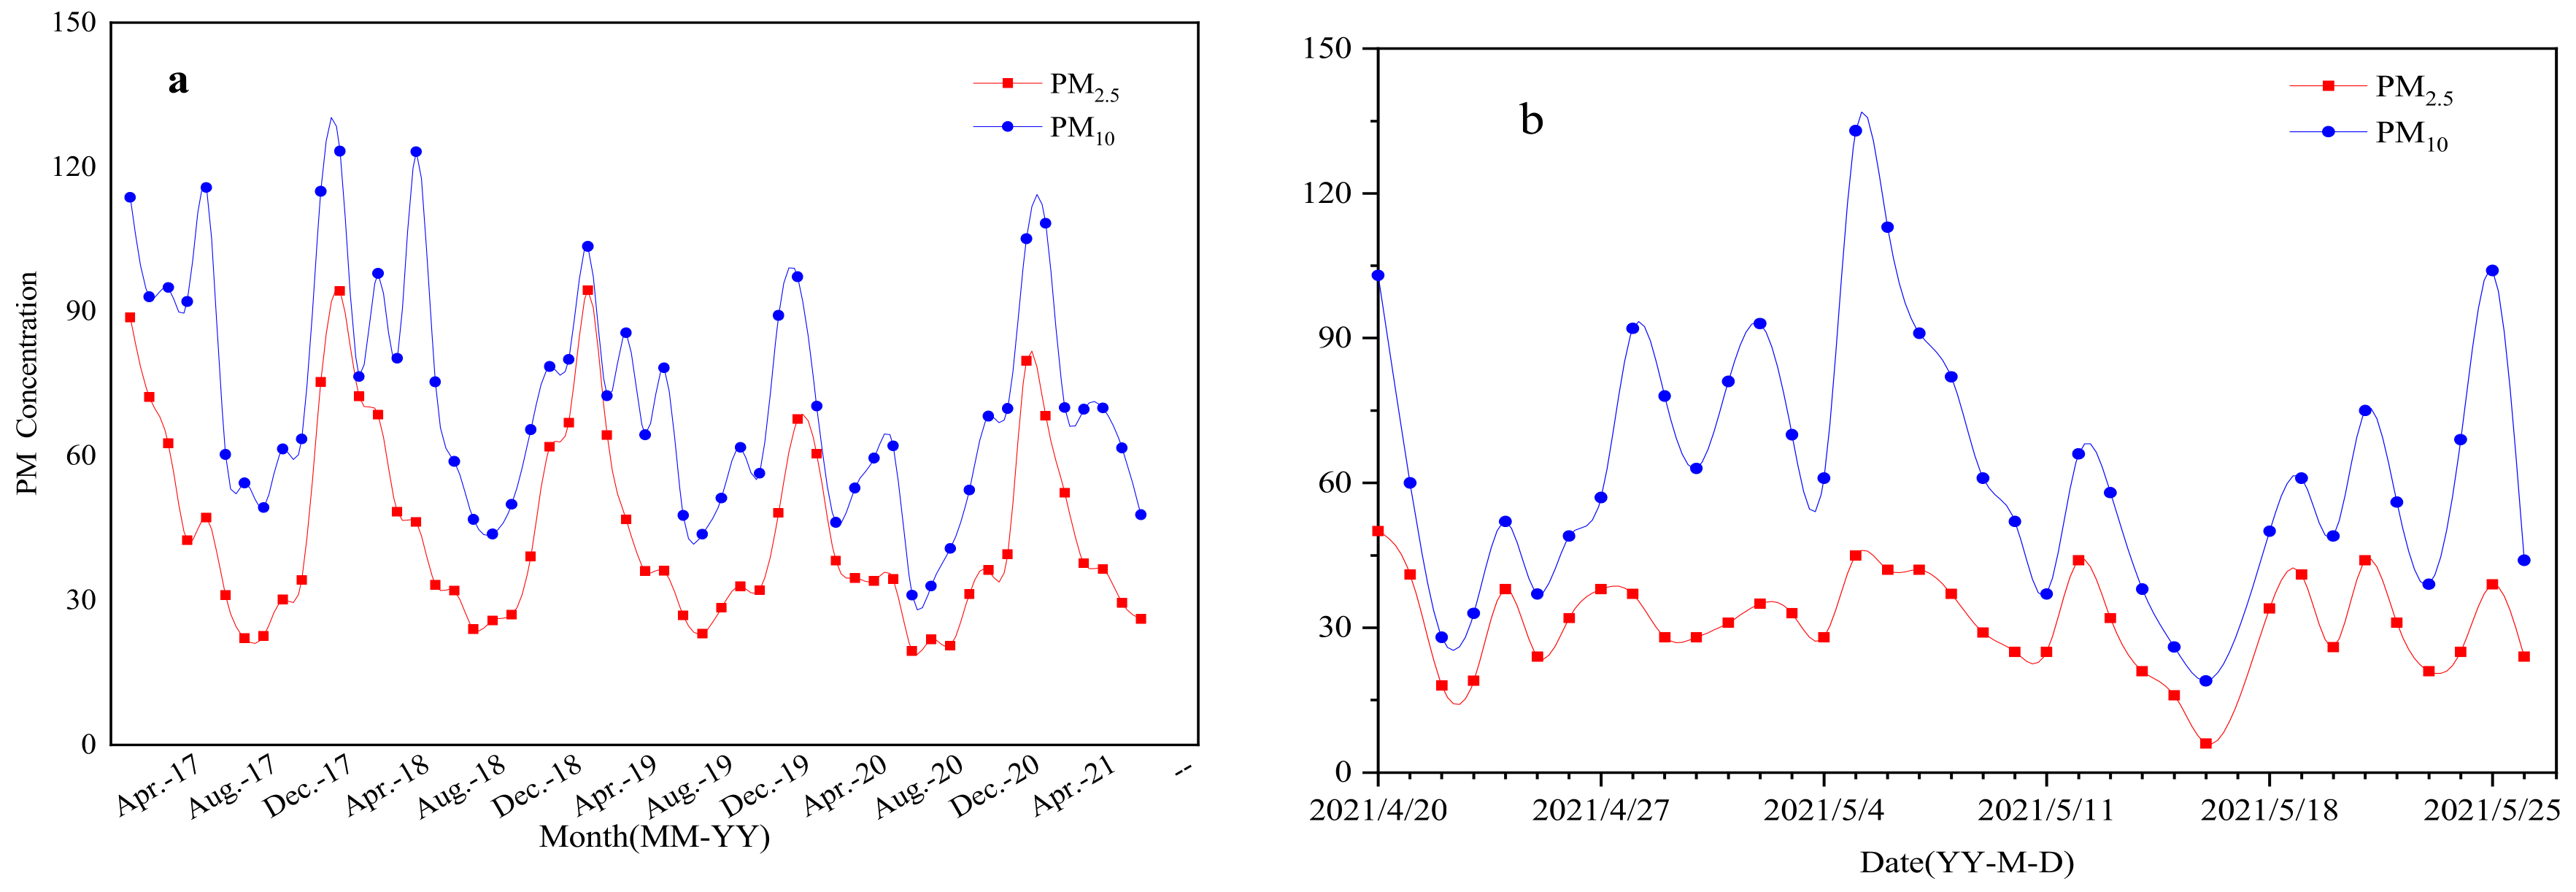
The average daily concentration data of PM2.5 and PM10 in Wuhan from January 2017 to July 2021 are from Tianyun big data website [
23]. The average monthly particle concentration changes during this period are shown in
Figure 2a, the average daily particle concentration changes during the sampling period are shown in
Figure 2b. Both PM2.5 and PM10 show obvious seasonal changes: the seasonal change of PM2.5 is mainly reflected in the higher concentration in winter and lower in spring, summer and autumn, the main trend of seasonal variation is: Winter (December to February of the following year) > spring (March to May) > autumn (June to August) > summer (September to November). The seasonal variation characteristics of PM10 are the same as PM2.5. The concentration of particulate matter in summer is the season with lower concentration in a year, and the seasonal variation is mainly reflected in winter > spring > autumn > summer. The main reasons for this seasonal change are as follows:
(1) Wuhan is a subtropical monsoon humid climate region. In late spring and early summer, the cold air flow slows down and the hot air flow in the South picks up, which will cause frequent gale and rain or continuous cloudy and rainy weather in Wuhan. Therefore, the air quality in Wuhan is significantly improved. With the continuous rise of temperature, the surface humidity decreases, and dust is easy to be hoisted in windy weather, which further increases the content of atmospheric particulate matter. At the same time, from March to May, the dusty weather in the North increased, and the particles diffused with the atmospheric circulation, which made a certain contribution to the increase of particle content in Wuhan, which may be the main reason for a short recovery of PM10 in spring;
(2) In summer, it is hot and rainy, accompanied by strong winds, which has a good dilution effect on the diffusion of particulate matter and reduces the residence time of particulate matter in the atmosphere. In summer, plants grow luxuriantly and the leaf area increases, which is also conducive to the adsorption of atmospheric particulate matter, resulting in the retention of atmospheric particulate matter and reducing the content of particulate matter in the air [
24]. In autumn and winter, leaves wither, plant photosynthesis decreases, and the retention of atmospheric particulate matter decreases accordingly. In winter, Wuhan is obviously affected by the winter monsoon climate, and the daytime is short, which leads to the strengthening of long wave radiation at night. Especially in the sunny and less windy climate, an atmospheric inversion layer is formed, which weakens the diffusion ability of particulate matter. In addition, the air temperature in winter is low and dry, which is conducive to the secondary winding of ground dust. Secondly, due to the centralized heating in some areas of Wuhan in winter, the emission of pollutants has increased, resulting in a high concentration of particulate matter in winter.
3.2. Aerosol Composition Analysis by FTIR
In
Figure 3, the infrared spectra of 28 April, 30 April and 6 May in 2021 are shown. The infrared spectra of these days include almost all the functional groups and chemical bonds contained in the samples during the sampling period. The approximate composition of the particulate matter can be obtained by analyzing infrared spectroscopy. In this study, the main groups of organic matter contained in the sample are OH and C=C. OH and C=C were found in all samples; NO
3− and SO
42− are the main ions in inorganic salts, which are mainly generated by some chemical reactions of NO
x and SO
x in the atmosphere [
25]. The common oxides found in the samples are SiO
2, MnO
2, Fe
3O
4 and MgO et al. And almost all samples contain SiO
2. In addition to sample 6, MnO
2 exists in other samples, and MgO exists in samples 3, 4, 5, 6, 7 and 8. NH
4+ and CO
32− were not detected during the test. The reason may be that the sample is not frozen and insulated during sample delivery, resulting in its volatilization, and other ions will not volatilize, so the specific content can be measured accurately.
3.3. Ion Chromatographic Analysis of Aerosol Particles
According to the measurement results of Fourier transform infrared spectroscopy, SO
42−, NO
3−, Cl
− and F
− ions in PM2.5 were detected by IC. The concentration data of four anions are shown in
Figure 4. It can be seen that the concentration of the four ions during the sampling period from large to small is: SO
42− > NO
3− > Cl
− > F
−, and the mass concentrations are: 9.166 ± 4.151 μg/m
3, 2.548 ± 2.384 μg/m
3, 0.658 ± 0.317 μg/m
3, 0.042 ± 0.017 μg/m
3.
SO
42− mainly comes from the conversion of SO
2 in the atmosphere. As the radiation intensity in summer increases, the photochemical reaction increases, resulting in an increase in the mass concentration of SO
42− [
26]. The concentration of SO
42− is related to the oxidation efficiency of SO
2. The Sulfur conversion rate is usually expressed by SOR, and its calculation formula is:
where,
is the mass concentration of SO
42−,
is the mass concentration of SO
2. When there is only one pollutant in the atmosphere, SOR < 0.1; when SOR > 0.1, it means that the SO
2 in the atmosphere may undergo a photochemical reaction. Through calculation, during the sampling period, the SOR was less than 0.1, indicating that during the sampling period, the SO
2 in the atmosphere may not undergo a photochemical reaction, or the intensity of the photochemical reaction may not be large.
By analyzing the correlation between the ions, we can get the consistency between the ion sources [
27]. The correlation coefficient of SO
42− and NO
3− is 0.76, which can indicate that their source characteristics are similar, and the main source is fossil fuel combustion. In addition, the mass ratio of SO
42− and NO
3− can be used to compare the contribution of stationary sources (such as coal) and mobile sources (such as automobile exhaust) to the amount of S and N in the atmosphere. During the sampling period, the changes in the ratio of SO
42− to NO
3− are shown in
Figure 5. The ratios are all less than 1, indicating that during the sampling period, the emission sources from mobile sources are less than those from stationary sources.
3.4. Source Apportionment by XRF and Enrichment Factor Analysis
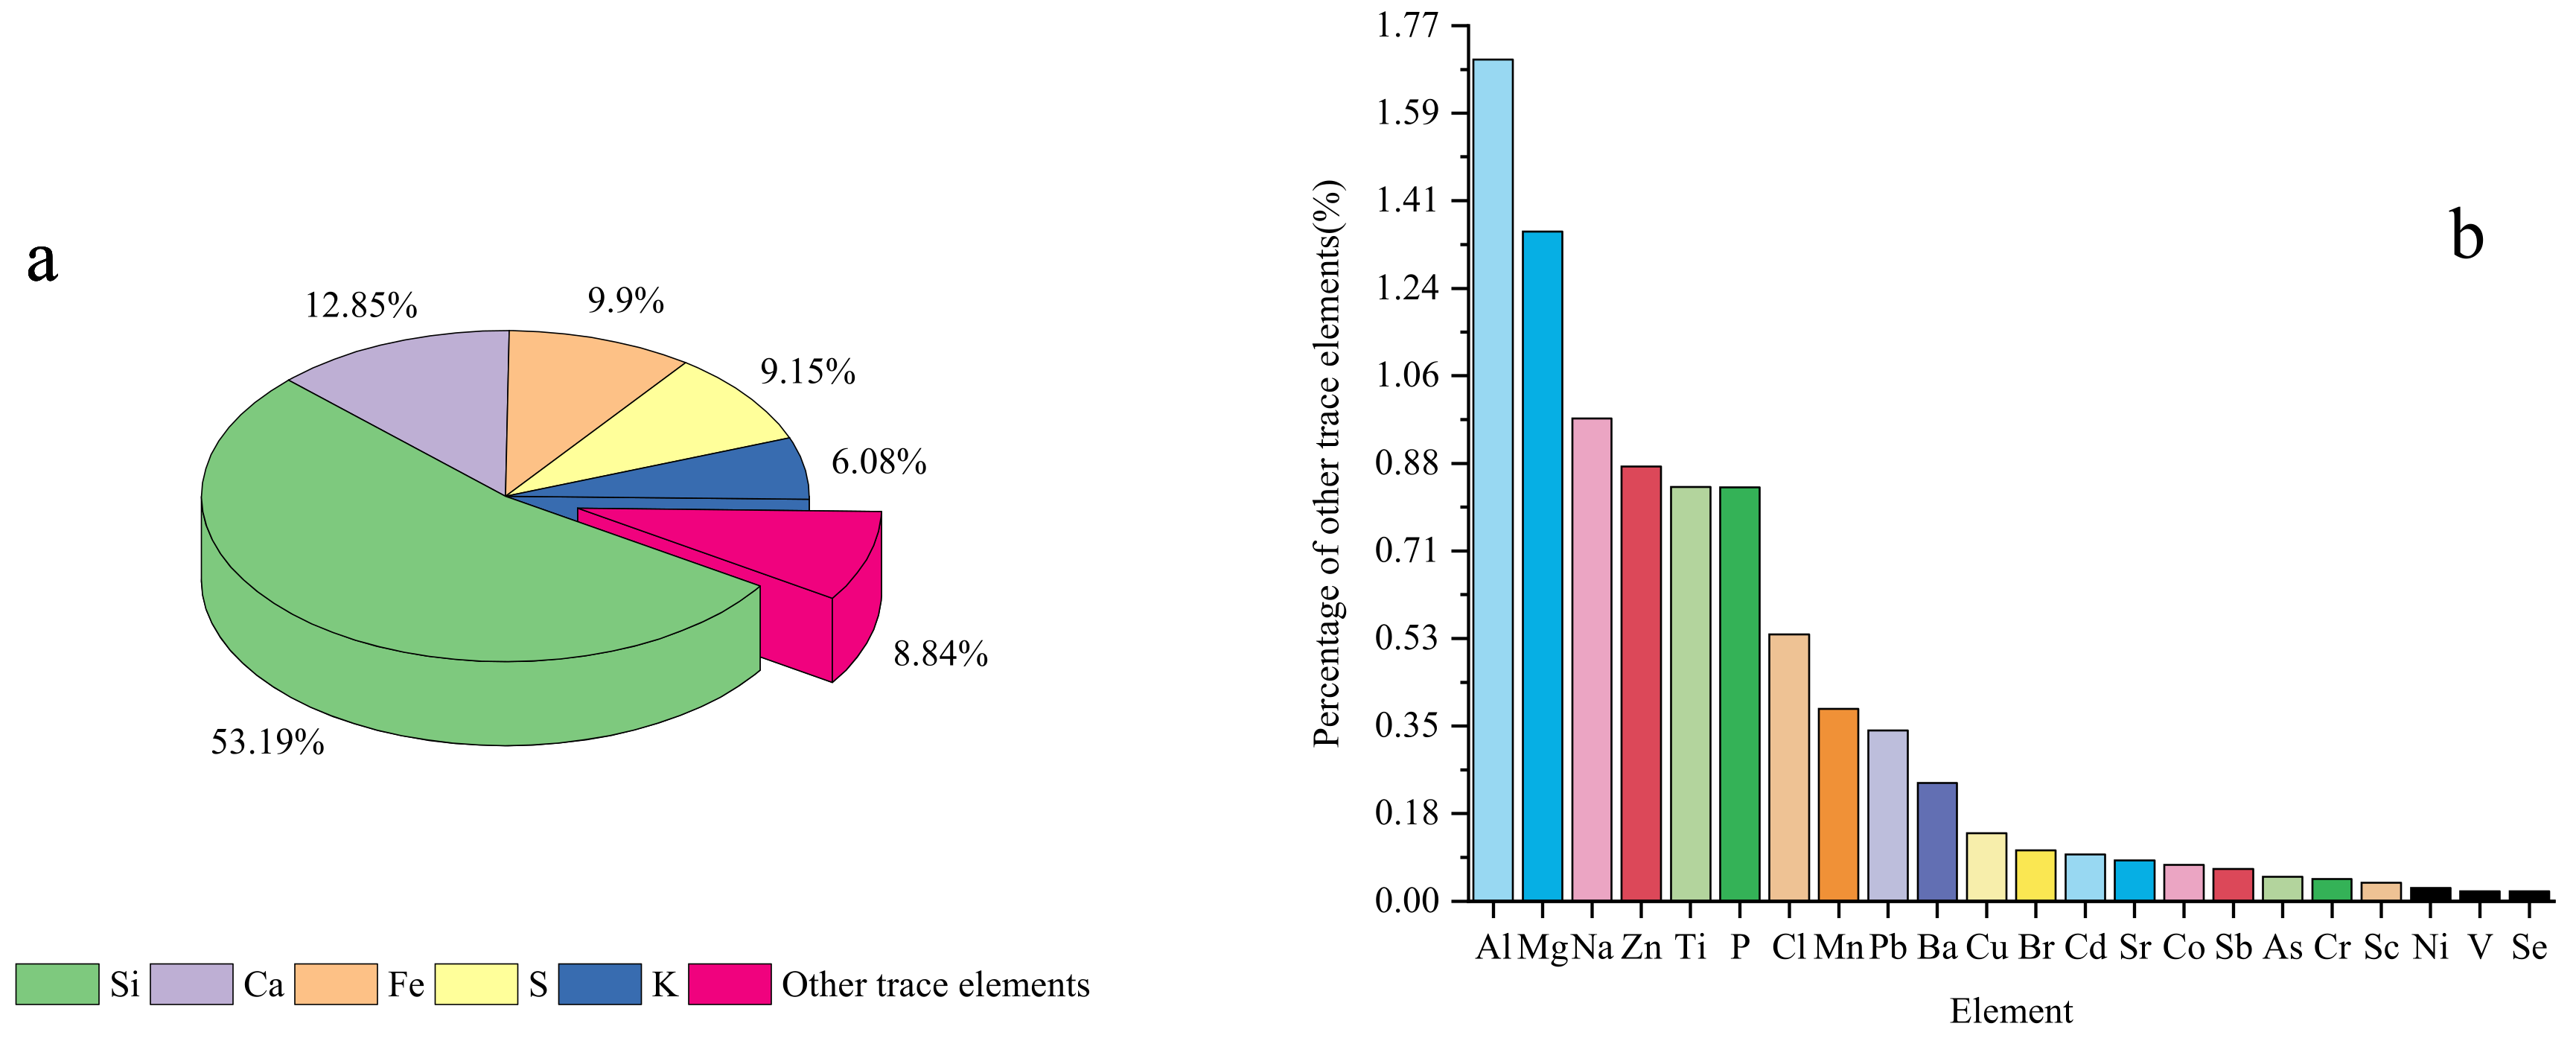
XRF was used to further analyze the elemental composition of the 12 samples collected. The analysis results are shown in the
Figure 6. Among all the detected elements, Si has the highest proportion in the sample, accounting for 53.19%, followed by Ca, Fe, S, K and other trace elements accounted for 12.85%, 9.9%, 9.15%, 6.08% and 8.84% respectively.
Figure 6a shows the proportion of each element, and
Figure 6b shows the proportions of the relative contents of other trace elements. Based on the XRF analysis results, the enrichment of each element was analyzed by enrichment factor analysis.
Enrichment factor analysis is an effective means to analyze the source and degree of pollutants in the environment. Enrichment factor can reflect the enrichment degree of elements in atmospheric particulate matter relative to elements in the surface of the earth’s crust, so as to evaluate the influence degree of natural and man-made sources of various elements [
27,
28,
29]. The enrichment factor method is used to analyze the elements of PM2.5 in the atmosphere to determine the enrichment pollution status of each element, which can be used for more in-depth analysis. The calculation formula of the enrichment factor is as follows:
where,
represents the enrichment factor of the element,
represents the content of the target element, and
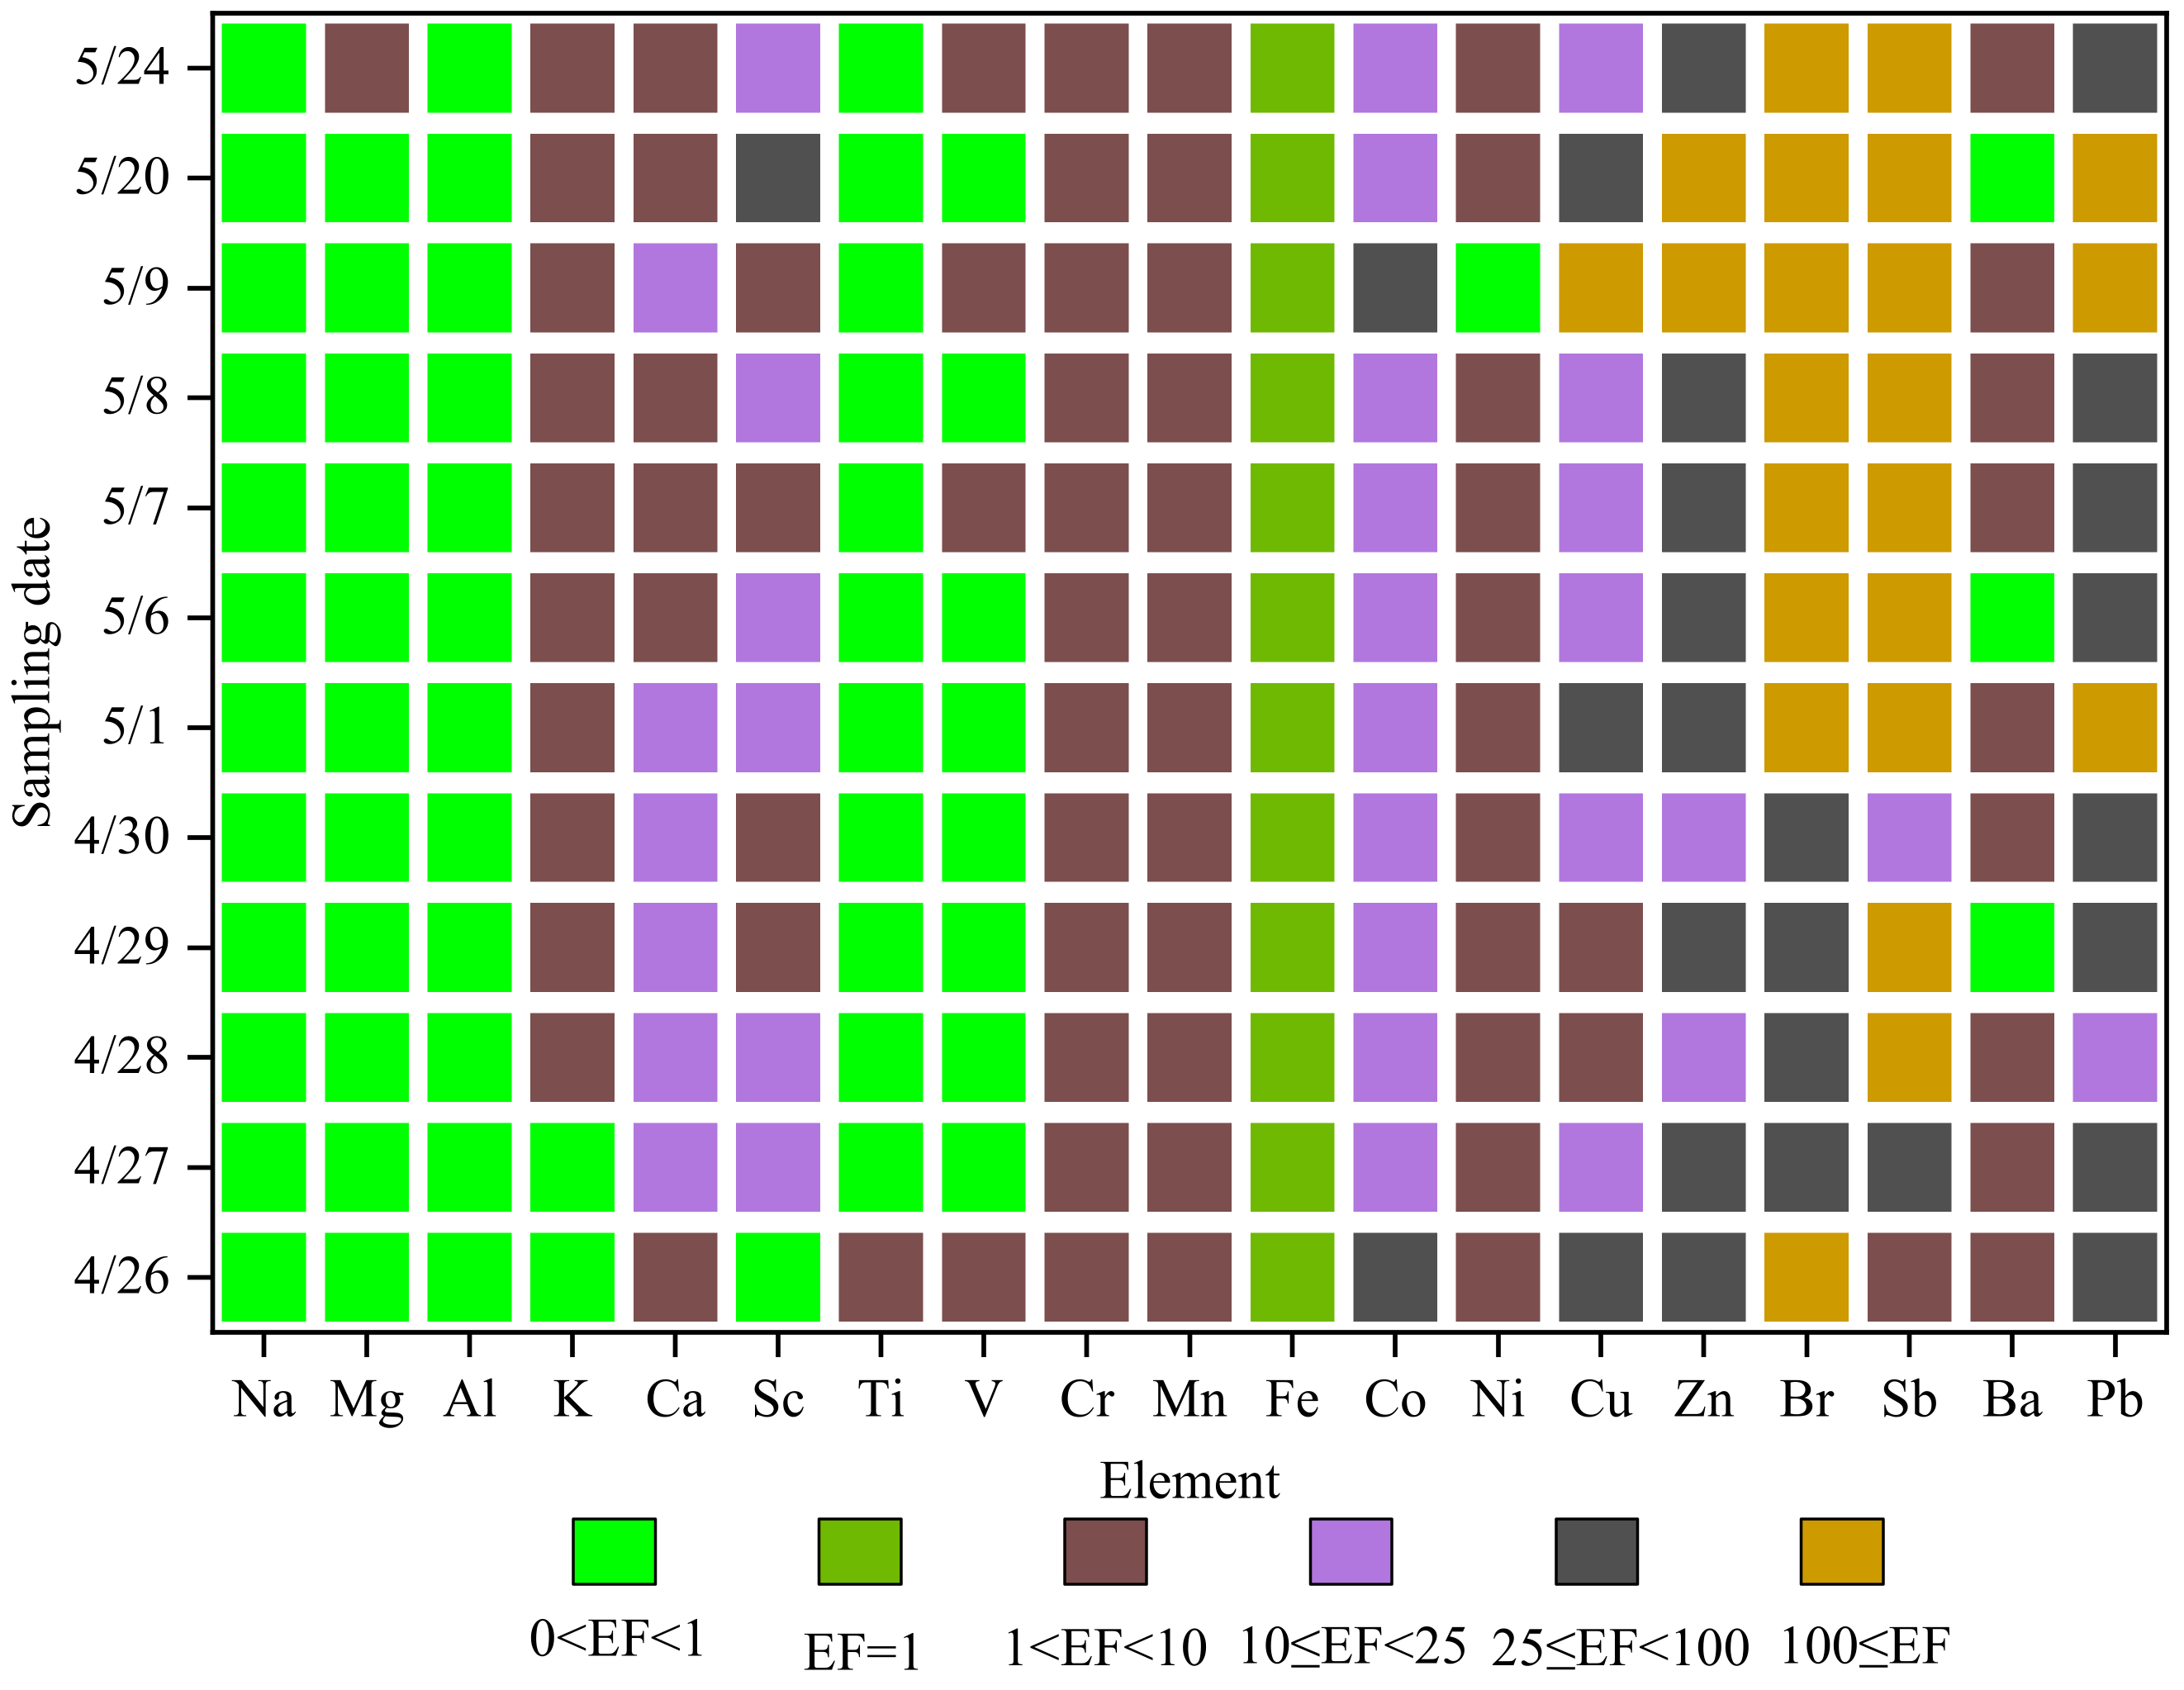
represents the content of the reference element. Generally, low volatile elements commonly exist in the earth’s crust with less anthropogenic pollution sources, good chemical stability and high accuracy of analysis results are selected as reference elements. Fe, Al, Si, Ti and Sc are widely used internationally. In this study, Fe element is selected as the reference element and the soil element in layer A of Hubei Province is selected as the background value of the study. If EF ≤ 1, it means no pollution, indicating that the element is mainly a natural source, such as rock weathering, dust winch, etc.; 1 < EF < 10, indicating that the element has both natural and man-made sources; EF > 10 indicates that the enrichment degree of this element is high, mainly from man-made pollution. The higher the value of EF, the more likely it is to come from man-made pollution.
The enrichment factors are shown in
Figure 7. The enrichment factors of Na, Mg, Al, Ti and V are between 0 and 1, indicating that these elements are mainly derived from materials in the earth’s crust. The enrichment factors of K, Cr, Mn, Ni and Ba are between l and 10, and these elements are affected by both man-made sources and natural sources. The enrichment factors of Ca, Sc, Cu and Co are mostly between 10 and 25, indicating that these elements are mainly polluted by humans. The enrichment factors of Br, Pb, Sb and Zn are basically greater than 25, and the enrichment factors of these elements are 246.43 ± 168.81, 133.28 ± 115.03, 403.305 ± 396.18 and 90.67 ± 67.01, respectively. Especially for Br and Sb, the enrichment factors are all more than 100, and the enrichment is very serious, indicating that these elements are particularly polluted by humans; Zn, Br, and Pb mainly come from coal combustion, automobile exhaust, garbage incineration and other man-made pollution [
19,
30]. It can be seen that during the sampling period, Zn, Pb and other elements are seriously polluted by coal combustion, automobile exhaust and garbage incineration.
3.5. Inferences about Emission Sources
The main work of this study is to detect the environmental sample PM2.5 based on FTIR, IC and XRF, and conduct multiple analyses combined with the atmospheric environmental data from Tianyun big data website [
23] to determine the chemical composition and main source of atmospheric particulate matter. The chemical composition of atmospheric particulate matter is qualitatively analyzed by FTIR to determine the general types of collected samples. The specific components in the collected samples are quantitatively analyzed by IC and XRF, and the changes of pollution sources during sampling are further evaluated by enrichment factor analysis.
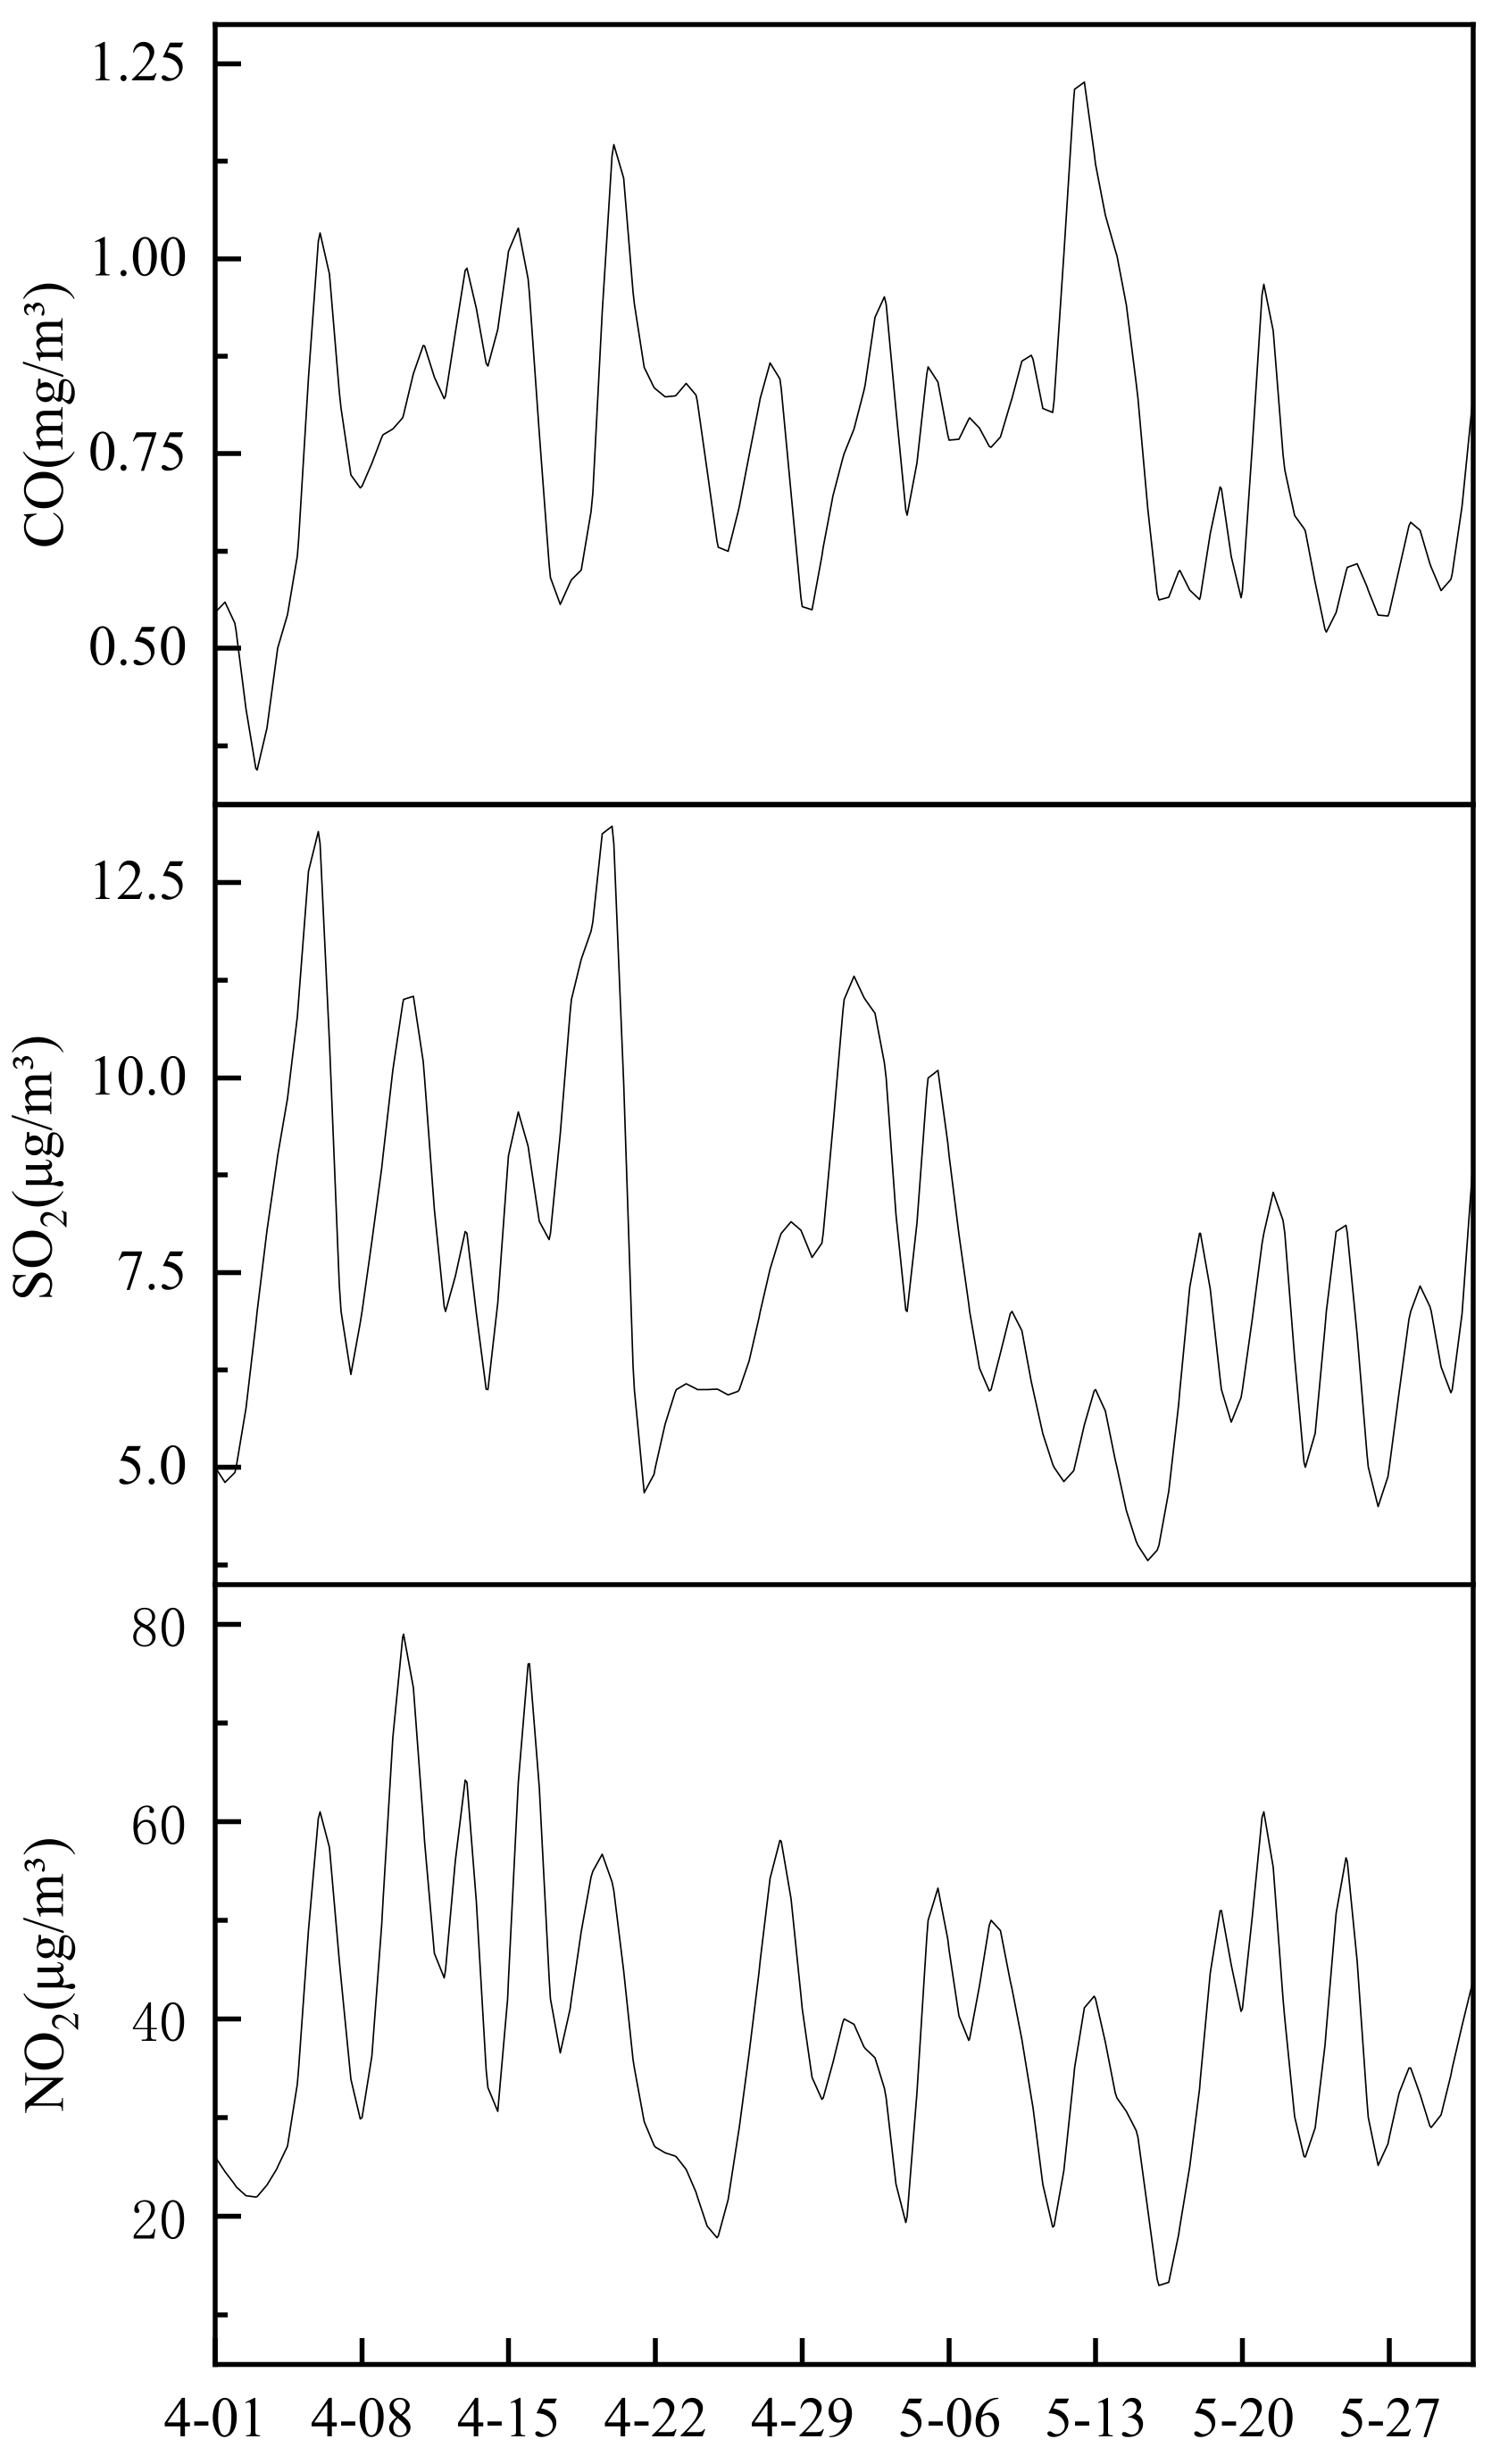
At the same time, the concentrations of CO, SO
2 and NO
2 from Tianyun big data website [
23] are analyzed to obtain the general characteristics of particulate pollution. It can be seen from
Figure 8 that the peak concentration of CO, SO
2 and NO
2 has decreased slightly since April. The main sources are industrial and mining enterprises, transportation, household stoves, heating boilers, setting off fireworks, charcoal burning and smoking. Based on the previous analysis of PM2.5 emission sources in Wuhan, combined with the relevant information of Wuhan Environmental Quality annual report, it can be inferred that most of CO, SO
2 and NO
2 in Wuhan’s atmosphere may be generated by transportation. This is very consistent with the results of the enrichment factor analysis. Elements such as Br, Pb, and Zn are the main enriched elements during the sampling period. The enrichment factor has been at a high level (above 100). The high enrichment of these elements also reflects the mechanism. The exhaust emissions of motor vehicles cause serious pollution to the environment. At the same time, during this period, the concentration of PM2.5 was basically maintained at about 50 μg/m
3, and the concentration of PM10 was basically kept below 110 μg/m
3, and the environmental quality was relatively good.
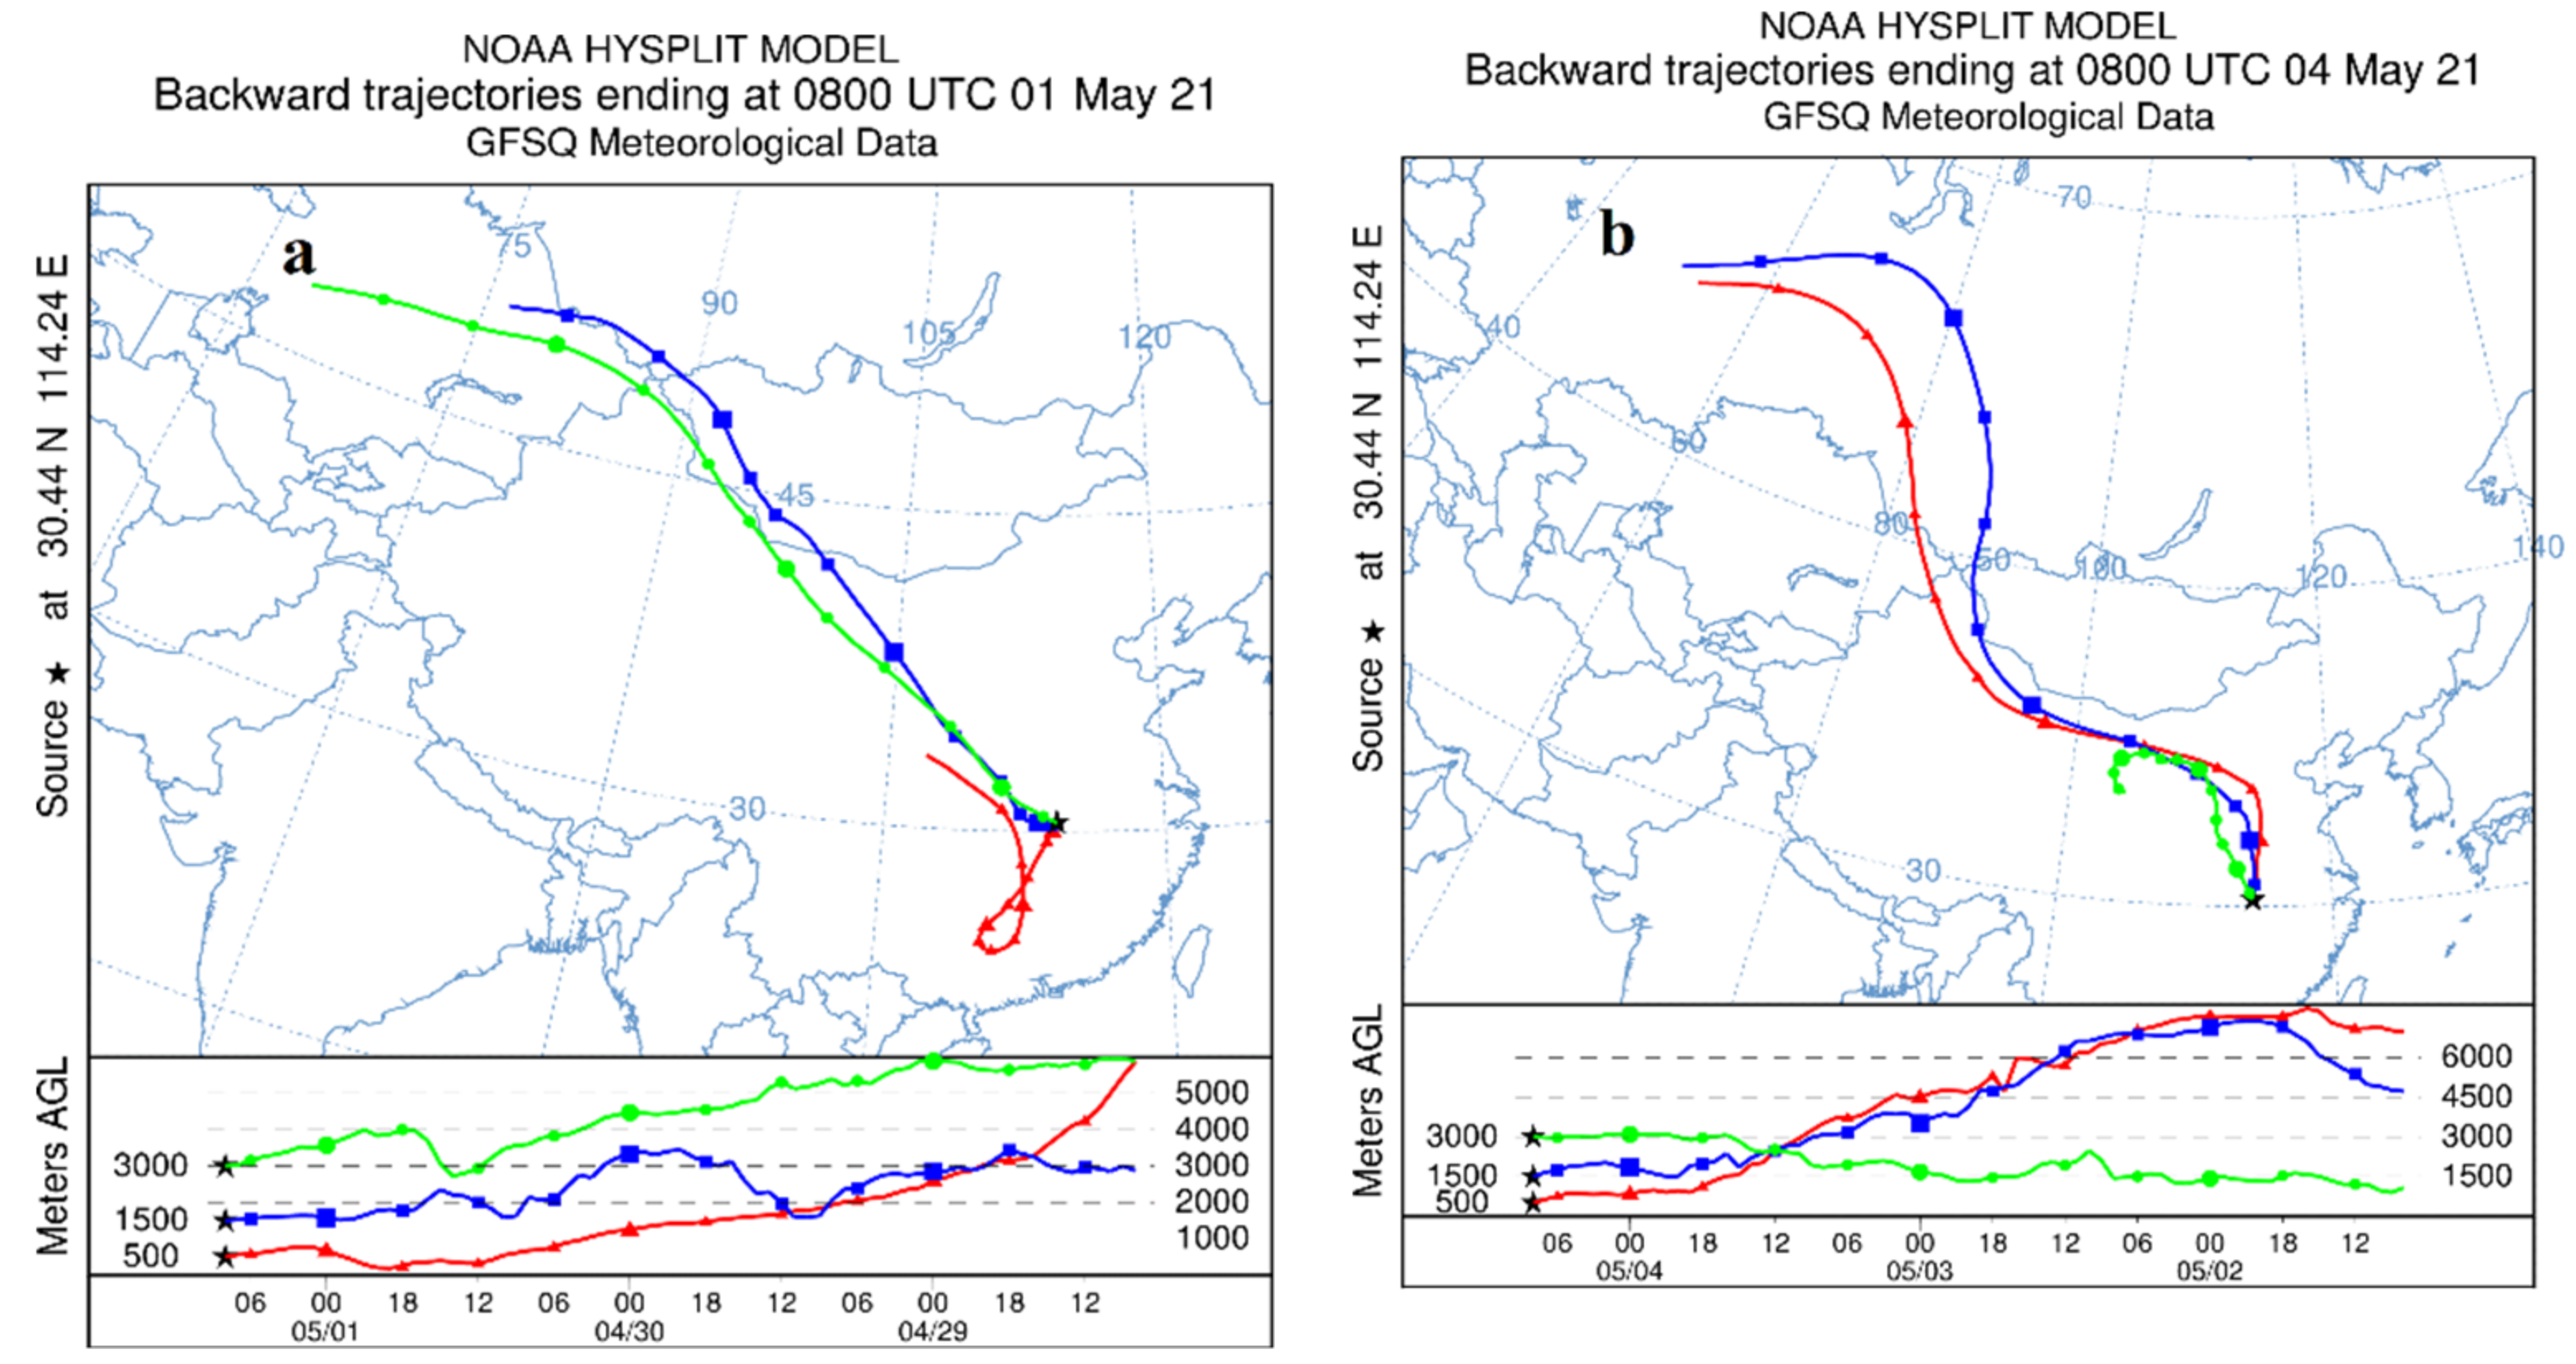
In order to further determine the source of aerosol particulate matter, the online model of HYSPLIT [
31,
32] was used to conduct a 72-h backward trajectory analysis to survey the source of atmospheric particulate matter in Wuhan on 1 May 2021 (
Figure 9a) and 4 May 2021 (
Figure 9b). The backward trajectory is shown in
Figure 9. Through the backward trajectory diagram, it can be found that during the sampling period, Wuhan was mainly affected by the air currents from the Siberia, Inner Mongolia, and Loess Plateau regions of Russia. The bare land in the Siberia region of Russia and the sandstorm in the north may be affected. It is the main source of soil dust. At the same time, the hot and humid air from the south will also bring some pollutants to the Wuhan area. During this period, the enrichment of Mg, Sc, Ni, Cu and other elements may also be related to this.
4. Conclusions
The aim of this study is to investigate the chemical composition and characterization for PM2.5 from Huangjiahu area of Wuhan city, some experimental setups, i.e., FTIR, IC, and XRF have been used. The sampling period is from 26 April to 24 May 2021. Also coupling with Wuhan’s atmospheric environmental data and the chemical composition of particulate matter, the changes of emission sources have been analyzed. The followings are the main conclusions:
(1) During the sampling period, the concentration range of PM2.5 was 33.52 ± 8.5 μg/m3, and the concentration range of PM10 was 81.0 ± 32 μg/m3. The results show that the air quality in Wuhan was well during the sampling period.
(2) According to the measurement and analysis data of FTIR and XRF instruments, the collected samples are mainly composed of organic matter, inorganic ions, oxides, and 20 kinds of elements (C, O, Na, Mg, Al, Si, P, S and other elements), which obviously come from coal combustion, industrial pollutant emissions and automobile exhaust.
(3) Through the analysis of the oxidation efficiency of SO42−, the results show that the oxidation efficiency in the atmosphere is low during the sampling period, indicating that the photochemical reaction is weak. Correlation analysis of SO42−/NO3− shows that the sources of SO42−, NO3− are consistent, and the main source is the burning of fossil fuel. Meanwhile, the analysis results of the ratio of the mass concentrations of the two show that during the sampling period, the mobile source emission sources are less than the stationary source emission sources.
(4) The enrichment factor analysis method has been provided, and the aim is to analyze main enriched elements, such as Br, Pb, Sb, Zn based on XRF measurement. The enrichment factors of these elements range are 246.43 ± 168.81, 133.28 ± 115.03, 403.305 ± 396.18, 90.67 ± 67.01 respectively. The results show that these elements were extremely polluted by humans during the sampling period, and their main source was vehicle exhaust emissions.
Author Contributions
Conceptualization, M.C.; investigation, F.C.; methodology, F.C.; writing—original draft, Q.M.; writing—review & editing, M.C. All authors have read and agreed to the published version of the manuscript.
Funding
This work was supported by the National Natural Science Foundation of China (Grant No. 51876147).
Institutional Review Board Statement
Not applicable.
Informed Consent Statement
Not applicable.
Data Availability Statement
Not applicable.
Acknowledgments
This work was supported by the National Natural Science Foundation of China (Grant No. 51876147). The authors gratefully acknowledge the NOAA Air Resources Laboratory (ARL) for the provision of the HYSPLIT transport and dispersion model, as well as the READY website.
Conflicts of Interest
The authors declare no conflict of interest.
References
- He, Z.; Dong, C.; Liang, D.; Mao, J. A weightedsum-of-gray soot-fractal-aggregates model for nongray heat radiation in the high temperature gassoot mixture. J. Quant. Spectrosc. Radiat. Transf. 2021, 260, 107431. [Google Scholar] [CrossRef]
- Mao, Q.; Huang, C.; Chen, Q.; Zhang, H.; Yuan, Y. Satellite-based identification of aerosol particle species using a 2D-space aerosol classification model. Atmos. Environ. 2019, 219, 117057. [Google Scholar] [CrossRef]
- Mao, Q. Recent developments in geometrical configurations of thermal energy storage for concentrating solar power plant. Renew. Sustain. Energy Rev. 2016, 59, 320–327. [Google Scholar] [CrossRef]
- Mao, Q.; Zhang, H.; Chen, Q.; Huang, C.; Yuan, Y. Satellite-based assessment of direct aerosol radiative forcing using a Look-up table established through AERONET observations. Infrared Phys. Technol. 2019, 102, 103017. [Google Scholar] [CrossRef]
- Mao, Q.; Huang, C.; Zhang, H.; Chen, Q.; Yuan, Y. Performance of MODIS Aerosol Products under annual/seasonal scales and different air conditions over China. Sci. China Technol. Sci. 2021, 64, 774–784. [Google Scholar] [CrossRef]
- Bu, X.; Xie, Z.; Liu, J.; Wei, L.; Wang, X.; Chen, M.; Ren, H. Global PM2.5-attributable health burden from 1990 to 2017: Estimates from the Global Burden of disease study 2017. Environ. Res. 2021, 197, 111–123. [Google Scholar] [CrossRef]
- Chai, G.; He, H.; Sha, Y.; Zhai, G.; Zong, S. Effect of PM2.5 on daily outpatient visits for respiratory diseases in Lanzhou, China. Sci. Total Environ. 2019, 649, 1563–1572. [Google Scholar] [CrossRef] [PubMed]
- Jain, V.; Dey, S.; Chowdhury, S. Ambient PM2.5 exposure and premature mortality burden in the holy city Varanasi, India. Environ. Pollut. 2017, 226, 182–189. [Google Scholar] [CrossRef] [PubMed]
- Huang, W.; Pang, Y.; Luo, X.; Chen, Q.; Wu, L.; Tang, M.; Hong, Y.; Chen, J.; Jin, L. The cytotoxicity and genotoxicity of PM2.5 during a snowfall event in different functional areas of a megacity. Sci. Total Environ. 2020, 741, 140267. [Google Scholar] [CrossRef] [PubMed]
- Santoso, M.; Lestiani, D.D.; Damastuti, E.; Kurniawati, S.; Kusmartini, I.; Atmodjo, D.P.D.; Sari, D.K.; Muhtarom, T.; Permadi, D.A.; Hopke, P.K. Long term characteristics of atmospheric particulate matter and compositions in Jakarta, Indonesia. Atmos. Pollut. Res. 2020, 11, 2215–2225. [Google Scholar] [CrossRef]
- Zhang, C.; Zou, Z.; Chang, Y.; Zhang, Y.; Wang, X.; Yang, X. Source assessment of atmospheric fine particulate matter in a Chinese megacity: Insights from long-term, high-time resolution chemical composition measurements from Shanghai flagship monitoring supersite. Chemosphere 2020, 251, 126598. [Google Scholar] [CrossRef]
- Li, X.; Yan, X.; Wu, T.; Zhang, X.; Yu, H. Risks and phyto-uptake of micro-nano size particulates bound with potentially toxic metals in Pb-contaminated alkaline soil (NW China): The role of particle size fractions. Chemosphere 2021, 272, 129508. [Google Scholar] [CrossRef] [PubMed]
- Xie, C.; Yan, L.; Liang, A.; Che, S. Understanding the washoff processes of PM2.5 from leaf surfaces during rainfall events. Atmos. Environ. 2019, 214, 116844. [Google Scholar] [CrossRef]
- Khuzestani, R.B.; Schauer, J.J.; Wei, Y.; Zhang, Y.; Zhang, Y. A non-destructive optical color space sensing system to quantify elemental and organic carbon in atmospheric particulate matter on Teflon and quartz filters. Atmos. Environ. 2017, 149, 84–94. [Google Scholar] [CrossRef]
- Chang, D.Y.; Lelieveld, J.; Steil, B.; Yoon, J.; Yum, S.S.; Kim, A.-H. Variability of aerosol-cloud interactions induced by different cloud droplet nucleation schemes. Atmos. Res. 2021, 250, 105367. [Google Scholar] [CrossRef]
- Cheng, H.; Wang, Z.; Feng, J.; Chen, H.; Zhang, F.; Liu, J. Carbonaceous species composition and source apportionment of PM (2.5) in urban atmosphere of Wuhan. Ecol. Environ. 2012, 21, 1574–1579. (In Chinese) [Google Scholar]
- Querol, X.; Zhuang, X.; Alastuey, A.; Viana, M.; Lv, W.; Wang, Y.; Lopez, A.; Zhu, Z.; Wei, H.; Xu, S. Speciation and sources of atmospheric aerosols in a highly industrialised emerging mega city in central China. J. Environ. Monit. 2016, 8, 1049–1059. [Google Scholar] [CrossRef]
- Huang, F.; Zhou, J.; Li, H.; Chen, N. Analysis of Causes and Sources of Typical Air Pollution Events in Summer and Winter in Wuhan City. Res. Environ. Sci. 2020, 33, 280–288. (In Chinese) [Google Scholar]
- Chen, Q.; Huang, C.; Xiao, T.; Yuan, Y.; Mao, Q.; Tan, H. Characterization of atmospheric aerosols and source apportionment analyses in urban Harbin, northeast China. Infrared Phys. Technol. 2019, 103, 103109. [Google Scholar] [CrossRef]
- Zhang, Y.; Lang, J.; Cheng, S.; Li, S.; Zhou, Y.; Chen, D.; Zhang, H.; Wang, H. Chemical composition and sources of PM1 and PM2.5 in Beijing in autumn. Sci. Total Environ. 2018, 630, 72–82. [Google Scholar] [CrossRef]
- Elcoroaristizabal, S.; Amigo, J.M. Near infrared hyperspectral imaging as a tool for quantifying atmospheric carbonaceous aerosol. Microchem. J. 2021, 160, 105619. [Google Scholar] [CrossRef]
- Coury, C.; Dillner, A.M. ATR-FTIR characterization of organic functional groups and inorganic ions in ambient aerosols at a rural site. Atmos. Environ. 2009, 43, 940–948. [Google Scholar] [CrossRef]
- Tianyun Big Data Website. Available online: https://www.ebd120.com/ (accessed on 30 May 2021).
- Li, X.; Zhang, T.; Sun, F.; Song, X.; Zhang, Y.; Huang, F.; Yuan, C.; Yu, H.; Zhang, G.; Qi, F.; et al. The relationship between particulate matter retention capacity and leaf surface micromorphology of ten tree species in Hangzhou, China. Sci. Total Environ. 2021, 771, 144812. [Google Scholar] [CrossRef]
- Kumar, S.; Raman, R.S. Inorganic ions in ambient fine particles over a National Park in central India: Seasonality, dependencies between SO42−, NO3−, and NH4+, and neutralization of aerosol acidity. Atmos. Environ. 2016, 143, 152–163. [Google Scholar] [CrossRef]
- Zhao, K.; Liu, X.; Hui, L.; He, Q.; Zhong, Y.; Yan, J. Characteristics and Sources of Water-Soluble Ions of PM2.5 in Winter in Urumqi. J. Desert Res. 2015, 35, 707–714. (In Chinese) [Google Scholar]
- Niu, Y.; Wang, F.; Liu, S.; Zhang, W. Source analysis of heavy metal elements of PM2.5 in canteen in a university in winter. Atmos. Environ. 2021, 244, 117879. [Google Scholar] [CrossRef]
- Cable, E.; Deng, Y. Trace Elements in Atmospheric Wet Precipitation in the Detroit Metropolitan Area: Levels and Possible Sources. Chemosphere 2018, 210, 1091–1098. [Google Scholar] [CrossRef] [PubMed]
- Cáceres, J.O.; Sanz-Mangas, D.; Manzoor, S.; Pérez-Arribas, L.V.; Anzano, J. Quantification of particulate matter, tracking the origin and relationship between elements for the environmental monitoring of the Antarctic region. Sci. Total Environ. 2019, 665, 125–132. [Google Scholar] [CrossRef]
- Liu, L.; Liu, Y.; Wen, W.; Liang, L.; Ma, X.; Jiao, J.; Guo, K. Source identification of trace elements in PM2.5 at a rural site in the north china plain. Atmosphere 2020, 11, 179. [Google Scholar] [CrossRef] [Green Version]
- Rolph, G.; Stein, A.; Stunder, B. Real-time Environmental Applications and Display system: READY. Environ. Model. Softw. 2017, 95, 210–228. [Google Scholar] [CrossRef]
- Real-Time Environmental Application and Display System. Available online: https://www.ready.noaa.gov/index.php (accessed on 4 May 2021).
| Publisher’s Note: MDPI stays neutral with regard to jurisdictional claims in published maps and institutional affiliations. |
© 2021 by the authors. Licensee MDPI, Basel, Switzerland. This article is an open access article distributed under the terms and conditions of the Creative Commons Attribution (CC BY) license (https://creativecommons.org/licenses/by/4.0/).


