Article

Evolution, Transport Characteristics, and Potential Source Regions of PM2.5 and O3 Pollution in a Coastal City of China during 2015–2020

1
School of Geographic Sciences, Nantong University, Nantong 226019, China
2
Shanghai Aerospace Electronic Technology Institute, Shanghai 201100, China
3
Nanjing Atmospheric Environment and Green Development Research Institute, Nanjing 210044, China
*
Author to whom correspondence should be addressed.
Atmosphere 2021, 12(10), 1282; https://doi.org/10.3390/atmos12101282
Submission received: 19 August 2021 / Revised: 24 September 2021 / Accepted: 28 September 2021 / Published: 1 October 2021
(This article belongs to the Special Issue Interaction between Air Pollution and Urban Boundary Layer)

Abstract

:
The evolution, transport characteristics, and potential source regions of PM2.5 and O3 were investigated from 1 January 2015 to 31 December 2020 in the coastal city of Nantong. The annual mean PM2.5 concentration declined obviously over the entire study period, and was 34.7 μg/m3 in 2020. O3 had a relatively smooth decreasing trend, but rebounded greatly during 2017 when the most frequent extreme high-temperature events occurred. Similar trends were observed for PM2.5 and O3 polluted hours. No PM2.5-O3 complex air pollution happened in 2019 and 2020, likely suggesting the preliminary results from the implementation of emission controls. Notable differences in transport pathways and frequencies were observed from the backward trajectory clusters in four seasons in Nantong. Clusters with the largest percentage of polluted PM2.5 and O3 trajectories were transported mostly over short distances rather than long distances. Analysis involving the potential source contribution function (PSCF) and concentration weighted trajectory (CWT) showed that PM2.5 polluted sources were from the adjacent western and northwestern provinces, whereas the influence of eastern marine sources was relatively small. O3 had a greatly different spatial distribution of polluted source regions from PM2.5, mostly covering the North China Plain, the Bohai Sea, and the Yellow Sea.

1. Introduction

Fine particulate matter (PM2.5) and ozone (O3) are two of the largest contributors to air pollution in the tropospheric atmosphere due to their impact on human health, environmental degradation, vegetation production, and climate change [1,2,3]. Complex emissions and adverse meteorological conditions normally led to high PM2.5 and O3 concentrations [4,5,6]. Apart from directly emitted particulate matter, both ground-level PM2.5 and O3 are mainly secondary pollutants. Secondary PM2.5 and O3 share similar precursors (e.g., nitrogen oxides (NOx) and volatile organic compounds (VOCs)) in photochemical reactions [7,8]. Besides, the secondary PM2.5 is also formed by coagulation and nucleation of chemicals from direct emissions. Given the big challenge of controlling both PM2.5 and O3 pollution due to their highly nonlinear secondary formation, reducing emissions of NOx or VOCs for PM2.5 control might lead to unexpected adverse effects on O3 in the photochemical processes [8,9]. In addition, air pollution might worsen due to regional, long-range transport and unfavorable meteorology conditions, even when local emissions are reduced. Thus, both pollutants are of great concern for regional air pollution improvement.
Currently, eastern China is an industrial and urbanized area with the densest population and highest emissions nationwide [10,11]. Due to the complex formation of PM2.5 and O3 from multiple sources and precursors, integrated tackling of these two pollutants has become one of the largest challenges facing this region. Although PM2.5 concentrations have declined in this region compared with previous years after stringent pollution mitigation measures taken since 2013, severe air pollution events still occur under some stagnant weather conditions [12]. In addition, O3 showed an increasing trend, especially during the summers in the past few years [13,14].
Numerous studies have been conducted to explore the evolution and transport characteristics of PM2.5 and O3, as well as the influence of meteorological conditions in eastern China. However, most of these studies focused on megacities such as Shanghai, Nanjing, and Hangzhou which were severely polluted [15,16,17,18,19,20,21]. Few studies of PM2.5 and O3 have been performed in less polluted cities such as Nantong in this region. Nantong is one of many fast-growing coastal cities with a population of 7.72 million in Jiangsu Province, and is adjacent to Shanghai in the south across the Yangtze River. As with other cities in eastern China, Nantong is also suffering problems of PM2.5 and O3 complex air pollution with its rapid growth of industrialization. However, there have only been very limited studies focused on pollutant characteristics and their relationship with meteorological conditions over short periods of one year or less in Nantong [22]. To achieve better synergic control strategies for the pollution of PM2.5 and O3 in Nantong, it is urgent to strengthen the understanding of their long-term pollution characteristics, transport pathways, and potential source regions.
To fill the knowledge gap, in this study an insight into the evolution, transport characteristics, and potential source regions of ground-level PM2.5 and O3 in Nantong during the 2015–2020 period was presented. The evolution of individual air pollutants, as well as nonattainment complex air pollution, were investigated. The transport pathways and potential source regions of PM2.5 and O3 were identified and synthetically analyzed using the backward trajectory cluster, the potential source contribution function (PSCF), and concentration weighted trajectory (CWT). Consequently, these results will provide an important basis for exploring efficient strategies to control both PM2.5 and O3 pollution in Nantong.

2. Data and Methods

2.1. Site Location

Air pollutants of PM2.5 and O3 in the coastal city of Nantong from 2015 to 2020 were investigated here (Figure 1). Located on the north wing of the Yangtze River estuary, and with 206 km of coastline, Nantong (32.01° N, 120.86° E) is one of the vital coastal port cities to foreign investment since the beginning of reform and opening up in Jiangsu Province, located at the Middle-Lower Yangtze Plain. At present, Nantong is one of the many fast-growing and traditionally industrial cities, with its gross domestic product breaking the 1-trillion-yuan threshold in 2020. However, atmospheric environmental problems have brought much attention in the city with the rapid development. Besides, Nantong has a humid subtropical climate, with four distinct seasons influenced by complex climate systems such as seasonal monsoons and changeable weather, which contribute to a substantial influence on air pollutant emissions, formation, and transport pathways.

2.2. Data and Analysis Methods

Real-time, hourly concentrations of air pollutants, including PM2.5 and O3, at seven national air quality monitoring stations in Nantong were published on an online platform by the China National Environmental Monitoring Centre (CNEMC), while historical data are not openly available. Thus, we used historical data of PM2.5 and O3 from 1 January 2015 to 31 December 2020 by one provider (https://quotsoft.net/air/archived, accessed on 10 June 2021). A sanity check was conducted on the hourly data at individual sites to remove problematic data points before calculating average concentrations and parameters. The citywide hourly mean concentrations of PM2.5 and O3 were calculated by averaging hourly data at all sites in the city, which were used in the analysis, as well as daily, monthly, and annual mean concentrations. The three-hourly meteorological data containing the wind, temperature, and humidity were obtained from the US National Centers for Environment Prediction’s Global Data Assimilation System (ftp://arlftp.arlhq.noaa.gov/pub/archives/gdas1, accessed on 10 June 2021) with a grid resolution of 1° × 1°.
To explore the influence of air mass transport on PM2.5 and O3, 72-h air-mass backward trajectories at 500 m arrival height above ground level were calculated by the Hybrid Single-Particle Lagrangian Integrated Trajectory model (HYSPLIT) [23]. This height was chosen to represent a well-mixed convective boundary layer for regional investigation [24,25]. The model was set as four times a day at the starting times of 0:00, 6:00, 12:00, and 18:00 local time during the study period. The number of trajectories was 2164 in spring, 2184 in summer, 2160 in autumn and 2144 in winter over the entire study period. The multiple backward trajectories were clustered in four seasons using Euclidean distance in this study. The most representative cluster number was determined as five using the “eye ball” method in the TrajStat software by plotting the percent change in total spatial variance (TSV) against the number of clusters. This graph first presented a monotonic increase, and thereafter a sudden increase. The cluster number before the first sudden increase was chosen for the clustering process [26,27]. PM2.5 and O3 concentrations were grouped according to the seasonal trajectory clusters. The hourly PM2.5 and O3 concentrations of 75 μg/m3 and 200 μg/m3 were defined as the “polluted” thresholds referring to the Ambient Air Quality Standard (GB3095—2012), respectively [28]. PM2.5-O3 was defined as the complex air pollution event with mean PM2.5 concentration exceeding 75 μg/m3 and O3 exceeding 200 μg/m3 simultaneously.
The potential source areas in different seasons were determined using the potential source contribution function (PSCF) and concentration-weighted trajectory (CWT) methods combining with pollutant concentrations of the receptor site [29]. The investigated area was divided into 1° × 1° small grid cells (i × j) with equal size in both methods. The PSCF value of the ijth cell was defined as:
P S C F i j = m i j / n i j
where nij represents the total number of trajectory endpoints falling in the ijth cell, and mij is the number of endpoints when the receptor concentrations exceeded the threshold criterion set at the mean concentrations of PM2.5 and O3 of each season in Nantong (Table 1). The areas with higher PSCF values denoted the greater probability of potential source locations.
However, the PSCF method failed to distinguish the grid cells with the same PSCFij when the pollutant concentrations slightly or prominently exceeded the threshold criterion. The CWT method was used to overcome this limitation [30,31]. In the CWT method, a weighted average of pollutant concentration was assigned to each grid cell, as follows:
C W T i j = l = 1 M C l τ i j l l = 1 M τ i j l
where M and l represent the total number of trajectories and the index of the trajectory, respectively. Cl represents the observed pollutant concentration with trajectory l arriving in cell ij. τijl is the time spent by trajectory l in the ijth cell. Additionally, an arbitrary weight function (Wij) was applied to minimize the uncertainty of PSCF and CWT values resulting from small nij values. The Wij was expressed as:
W i j = 1.00 ,        n i j > 3 n a v e 0.70 ,        2 n a v e < n i j 3 n a v e 0.42 ,        n a v e < n i j 2 n a v e 0.05 ,        n i j n a v e
where nave denotes the average value of the endpoints in each cell. Thus, the weighted PSCF and CWT values were computed as follows:
W P S C F i j = P S C F i j × W i j
W C W T i j = C W T i j × W i j

3. Results and Discussion

3.1. Evolution Characteristics of PM2.5 and O3

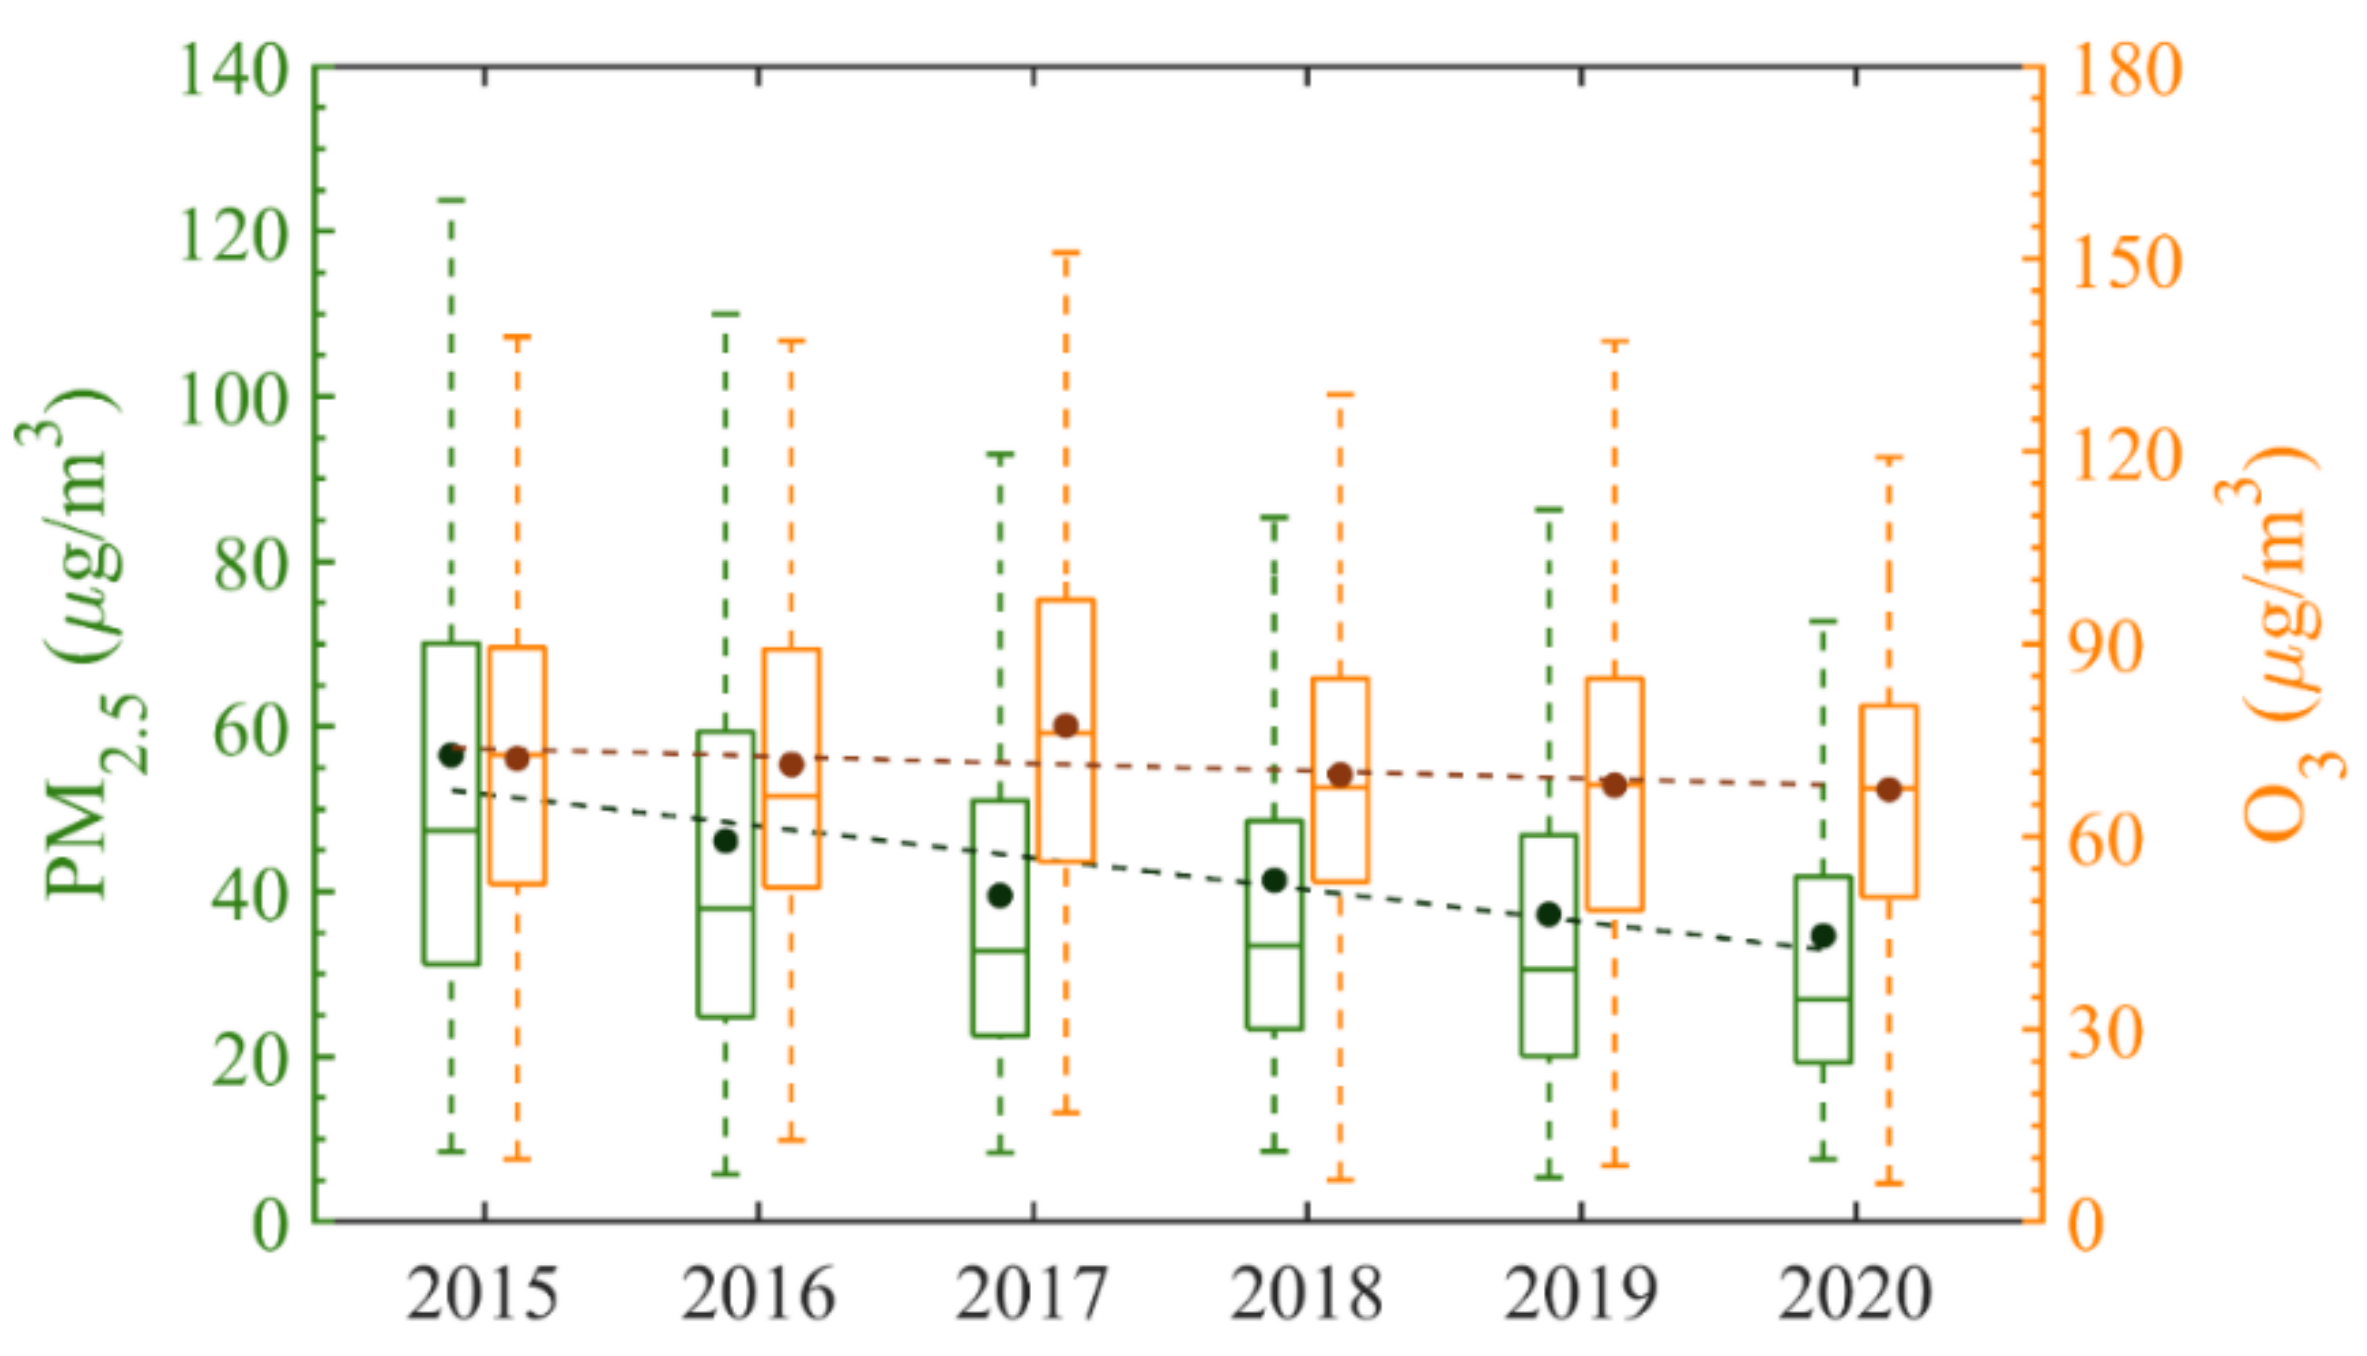
The evolution trends of annual pollutant concentrations in Nantong were investigated first (Figure 2 and Table 2). From 2015 to 2020, PM2.5 and O3 presented a net decreasing trend of −3.7 μg/m−3 and −1.2 μg/m−3 per year, respectively. Very different evolution characteristics were observed for PM2.5 and O3. PM2.5 declined obviously and steadily over the entire period except for a slight rebound in 2018, while O3 in 2017 bounced back to levels higher than those in 2015, which was attributed to the most frequent extreme high-temperature events (14 days above 35 ℃) that year. These results are consistent with a previous study [32]. In addition, the O3 trend was relatively smooth over the six years. Although considerable reductions of PM2.5 were observed, pollution control measures did little to O3 due to its complicated nonlinear photochemistry formation, which relied on precursor diagnosis and meteorological conditions. Notably, in 2020, the average PM2.5 concentration was down to 34.7 μg/m3 below the minimum safe level of 35 μg/m3 according to ambient air quality standards for residential areas, which was likely due to the drastically reduced emission of primary air pollutants by lockdown measures during the COVID-19 outbreak between January and February 2020 [33].
The long-term variations of mean PM2.5 and O3 concentrations in different seasons were investigated as well (Figure 3). The mean PM2.5 concentrations decreased in all seasons over the entire study period except for the rebound in autumn of 2018 related to the unfavorable diffusion conditions of low wind speeds, high relative humidity, and inversion layers. Among the four seasons, the highest concentrations with the most obvious declination of PM2.5 was observed in winter. However, the decline of PM2.5 slowed down in recent years. In addition, compared with PM2.5, the O3 concentrations first increased then decreased in all seasons with peak values in 2017 (spring, summer, winter) or 2018 (autumn) but changed slightly in general. Higher concentrations with larger fluctuations were observed in summer and spring than in autumn and winter. Those results were consistent with the yearly patterns shown in Figure 2.
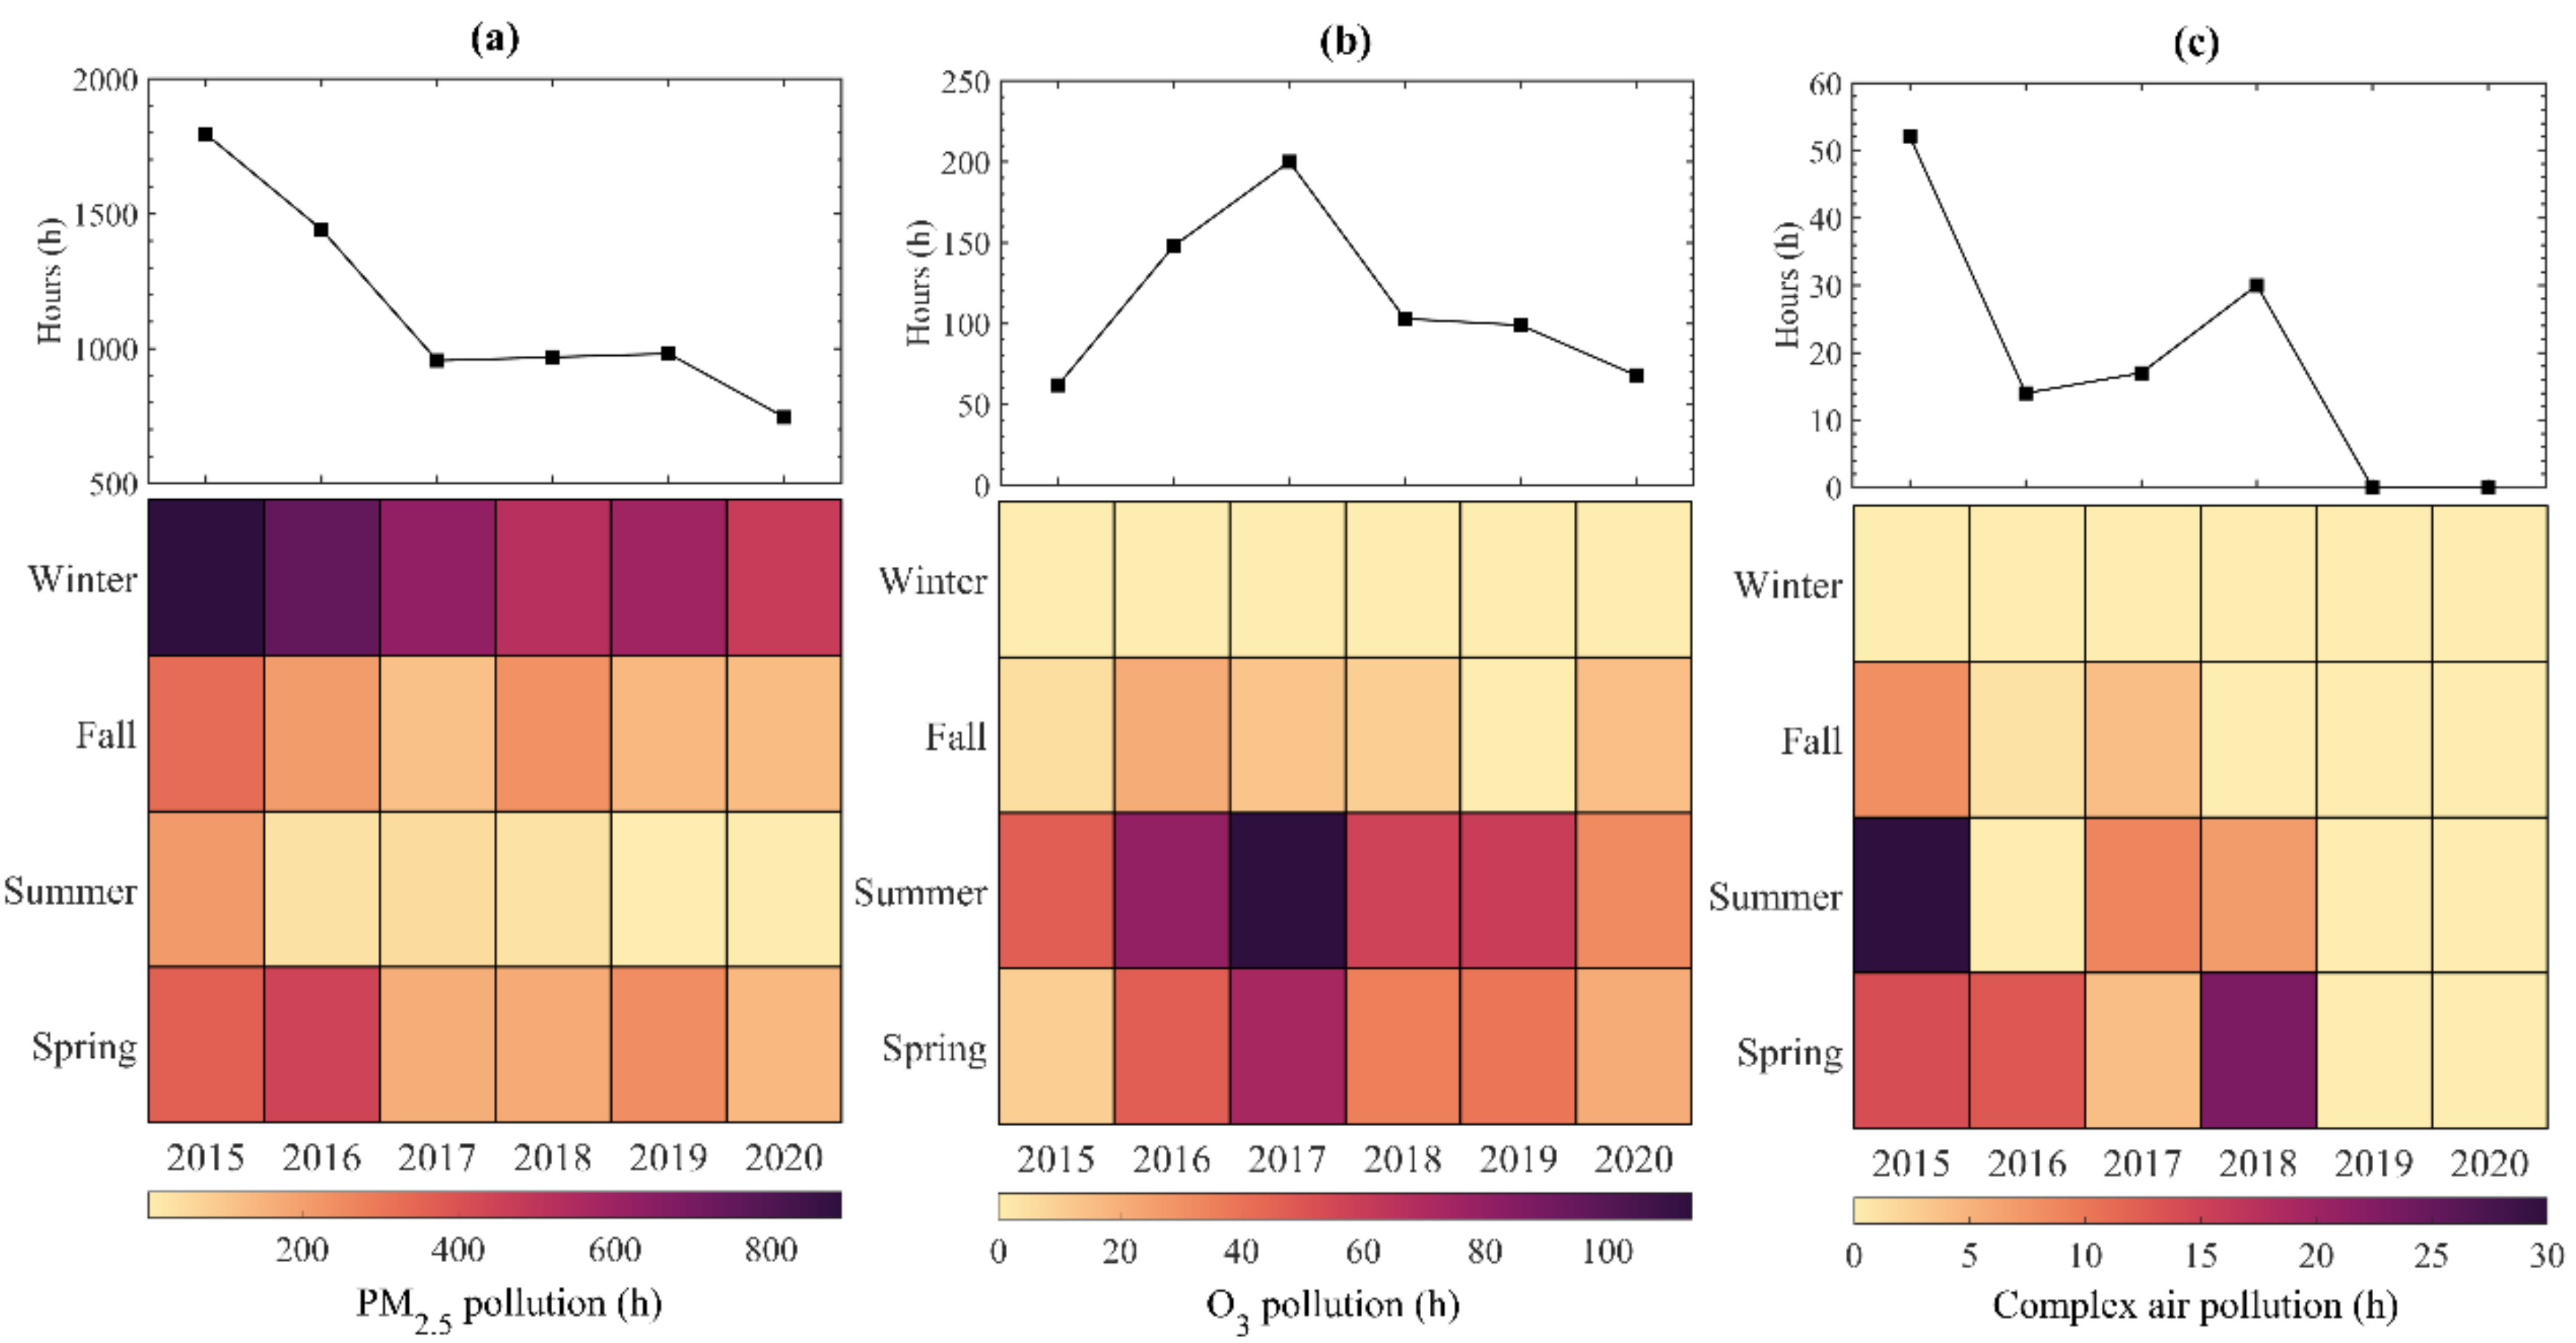
Figure 4 shows the evolution of polluted hours of PM2.5, O3, and PM2.5-O3 during different seasons from 2015 to 2020. Generally, hours of PM2.5 polluted hours had sharply decreasing trends from 1795 h to 746 h over the entire period, with a seasonal pattern peaking in winter likely resulting from unfavorable meteorological conditions, followed by spring and fall. However, O3 initially increased then decreased, peaking with 200 h in 2017. Unlike PM2.5, O3 and PM2.5-O3 polluted hours occurred most frequently in summer and none were in winter, which mostly depended on the intensity of solar radiation. PM2.5-O3 complex air pollution represented a declining trend with fluctuations, rebounding sometimes such as summer in 2017 and spring in 2018 when the consecutive extreme high-temperature events happened. It is remarkable that no complex polluted hours occurred in 2019 and 2020 all year round, indicating the air pollution controls, as yet, were imperfectly achieved but already having an effect.

3.2. Transport Characteristics

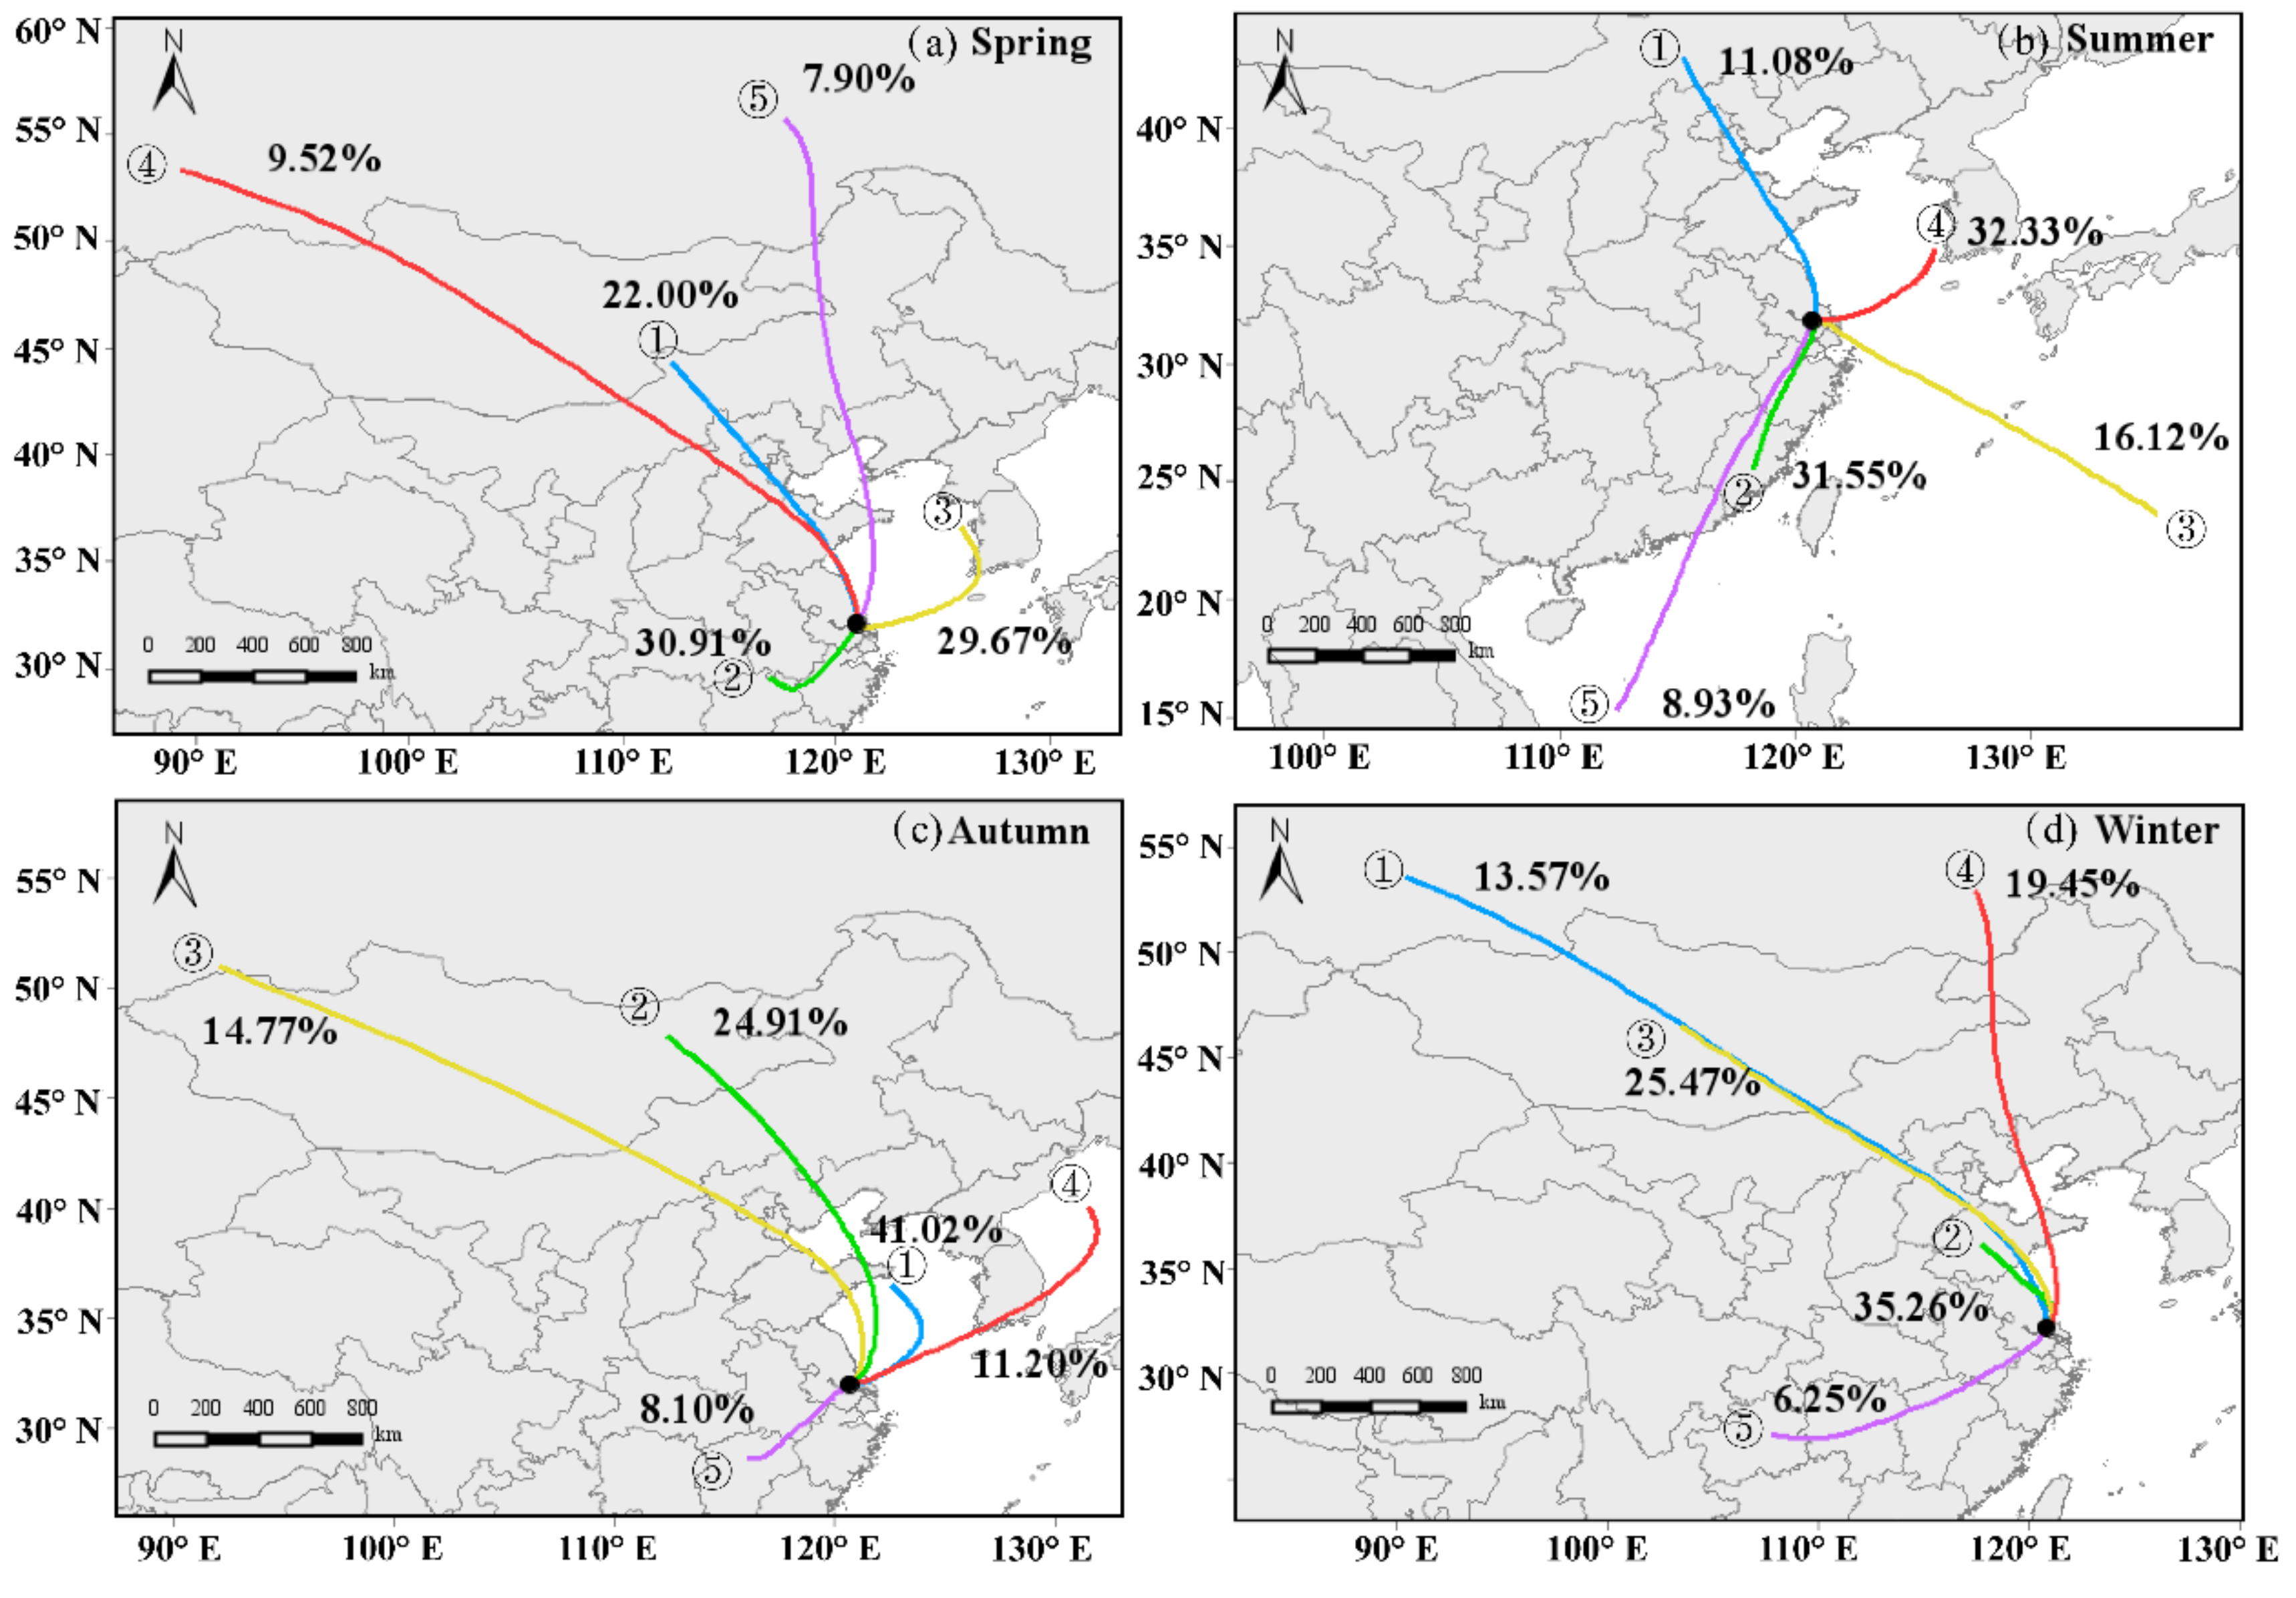
To identify the transport pathways of air masses, back trajectory clustering was utilized. Five major cluster pathways and corresponding statistical results for each season over the entire period were shown in Figure 5 and Table 3. Generally, longer trajectories corresponded to higher velocity of air mass movement. The ratios of clusters during four seasons were relevant to the seasonal monsoons in Nantong, with a prevailing northerly wind in winter, a prevailing southerly wind in summer, and a transition in spring and autumn. In addition, variable weather conditions had a substantial impact as well.
In spring, cluster 2 was the predominant pollution pathway accounting for 46.62% (59.57%) of PM2.5 (O3) polluted trajectories, respectively, followed by cluster 3. In addition, the mean PM2.5 concentration of cluster 2 was the highest among all clusters at 53.66 μg/m−3, while cluster 1 had the maximum mean O3 concentration at 87.00 μg/m−3. Cluster 2 air masses were short-range sources moving slowly from the nearby industrial provinces of Zhejiang and Jiangxi to the southwest likely picking up considerable anthropogenic aerosols. Cluster 3 originated from South Korea and then traveled southerly over the Yellow Sea. Clusters 1, 4, and 5 represented long-range transport and fast-moving trajectories from Russia and Inner Mongolia with air masses containing soil and dust.
In summer, clusters 2 and 5 were both from the southwest, but traveled short and long pathways from nearby provinces and the South China Sea, respectively. Air masses in cluster 3 were the cleanest with the lowest PM2.5 and O3 loadings (16.77 ± 9.10 μg/m3, 50.32 ± 37.50 μg/m3) originating from the Pacific Ocean directly. In general, southerly clusters 2, 3, and 5 contributed 56.60% of all trajectories, which were consistent with the prevailing southerly monsoon. Cluster 4 was from South Korea and passed over the Yellow Sea. Cluster 1 came from inner Mongolia, passing through multiple provinces before arriving at Nantong. In addition, clusters 1 and 2 contributed the largest percentage (80.00%) of polluted O3 trajectories in summer (Table 3). Air masses of most clusters in summer had relatively lower PM2.5 and higher O3 concentrations than those in other seasons.
In autumn, all clusters except cluster 5 with a total ratio of 91.90% gathered trajectories from the north. Among all clusters, cluster 1 had the highest ratio of trajectories (41.02%) and polluted PM2.5 and O3 trajectories (38.24% and 46.67%), which originated from the Yellow Sea. Cluster 5 originated from Jiangxi Province, passed through Anhui Province with the lowest ratio of trajectories, however, it had the highest mean PM2.5 concentration at 63.83 μg/m−3. Cluster 3 and 4 were free of O3 polluted trajectories, with air masses from the Mongolia and Japan Sea, respectively.
In winter, north and northwest clusters prevailed, comprising 93.75%. The cluster 1, 3 and 2 were from similar northwest directions but distinct transport distances. Among these clusters, the 2nd cluster showed the greatest occurrence probability as well as ratios of polluted PM2.5 trajectories. Besides, the cluster 2 originated from Shandong Province with shorter trajectories, likely picking up more local and anthropogenic air masses. Notably, although cluster 5 had higher PM2.5 concentrations than cluster 2, it had a limited impact on PM2.5 concentrations in Nantong due to its least ratio among all clusters. There was no O3 pollution event in winter on account of the unfavorable weather conditions for photochemical reactions.
Given the above, the main factors impacting the PM2.5 and O3 polluted trajectories in each season of Nantong were sources from nearby short-distance rather than long-distance. Additionally, as a coastal city, marine air masses played a very important role as well as those from the adjacent provinces.

3.3. PSCF and CWT Modeling of Source Regions

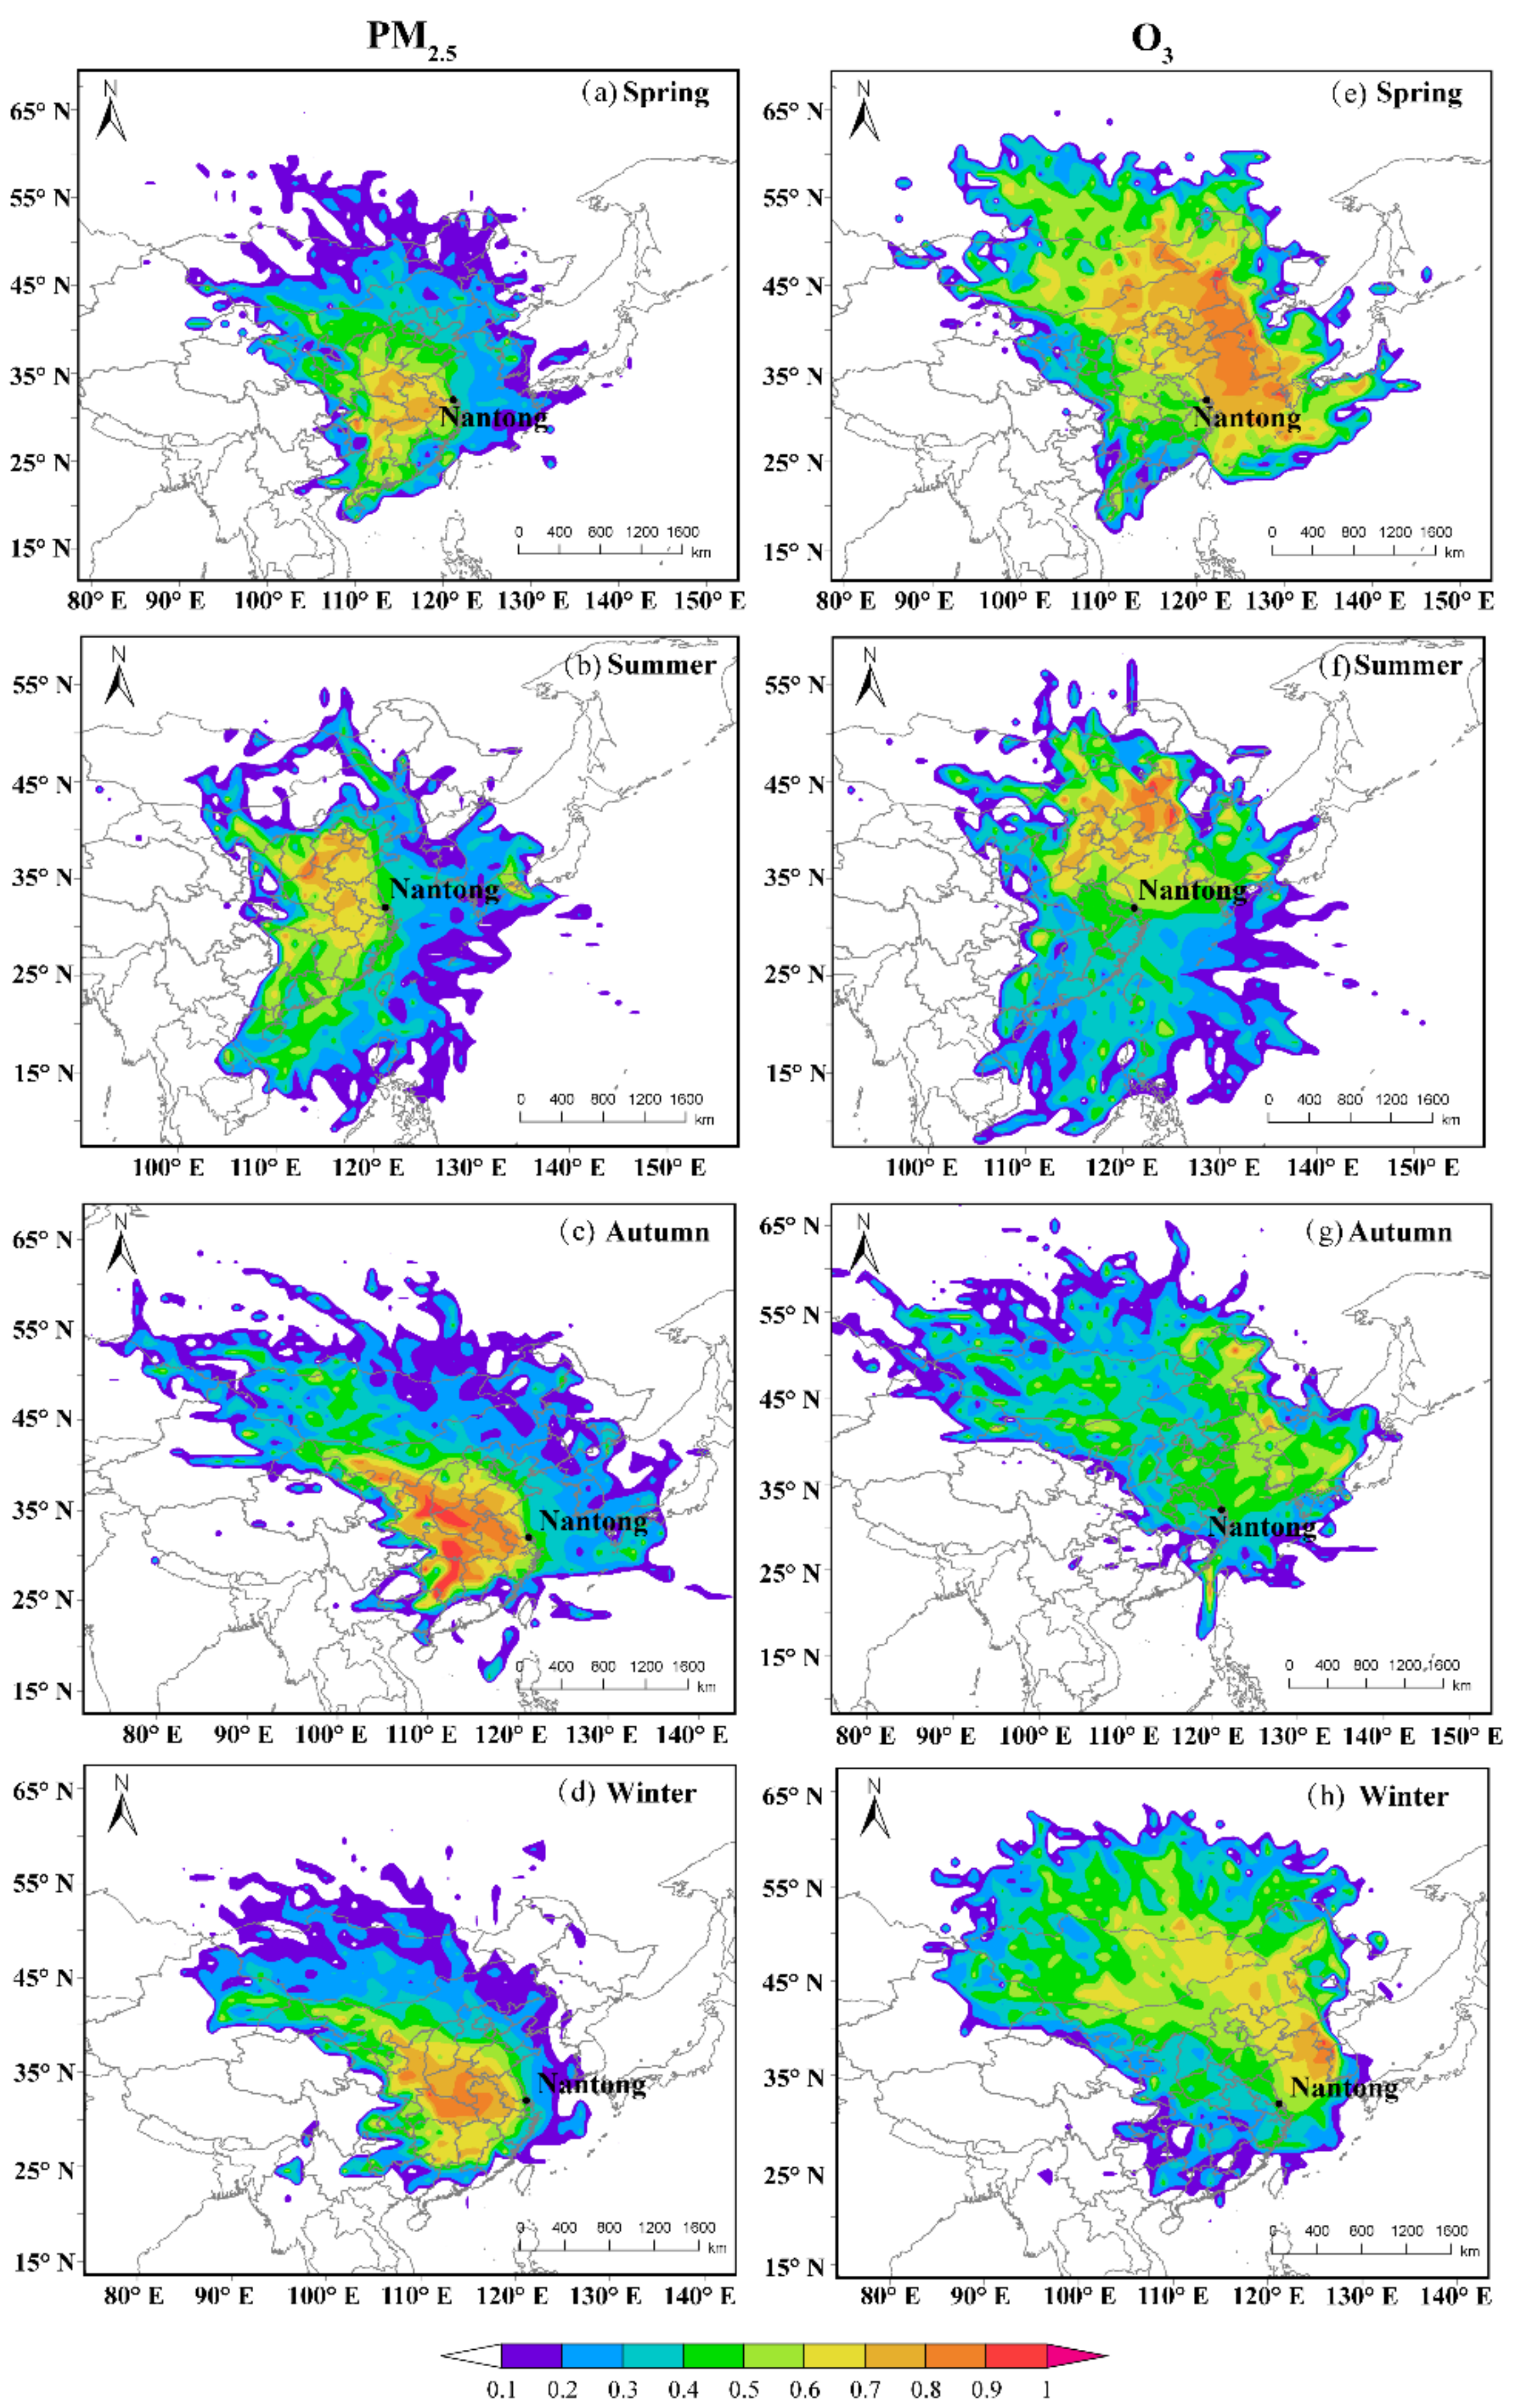
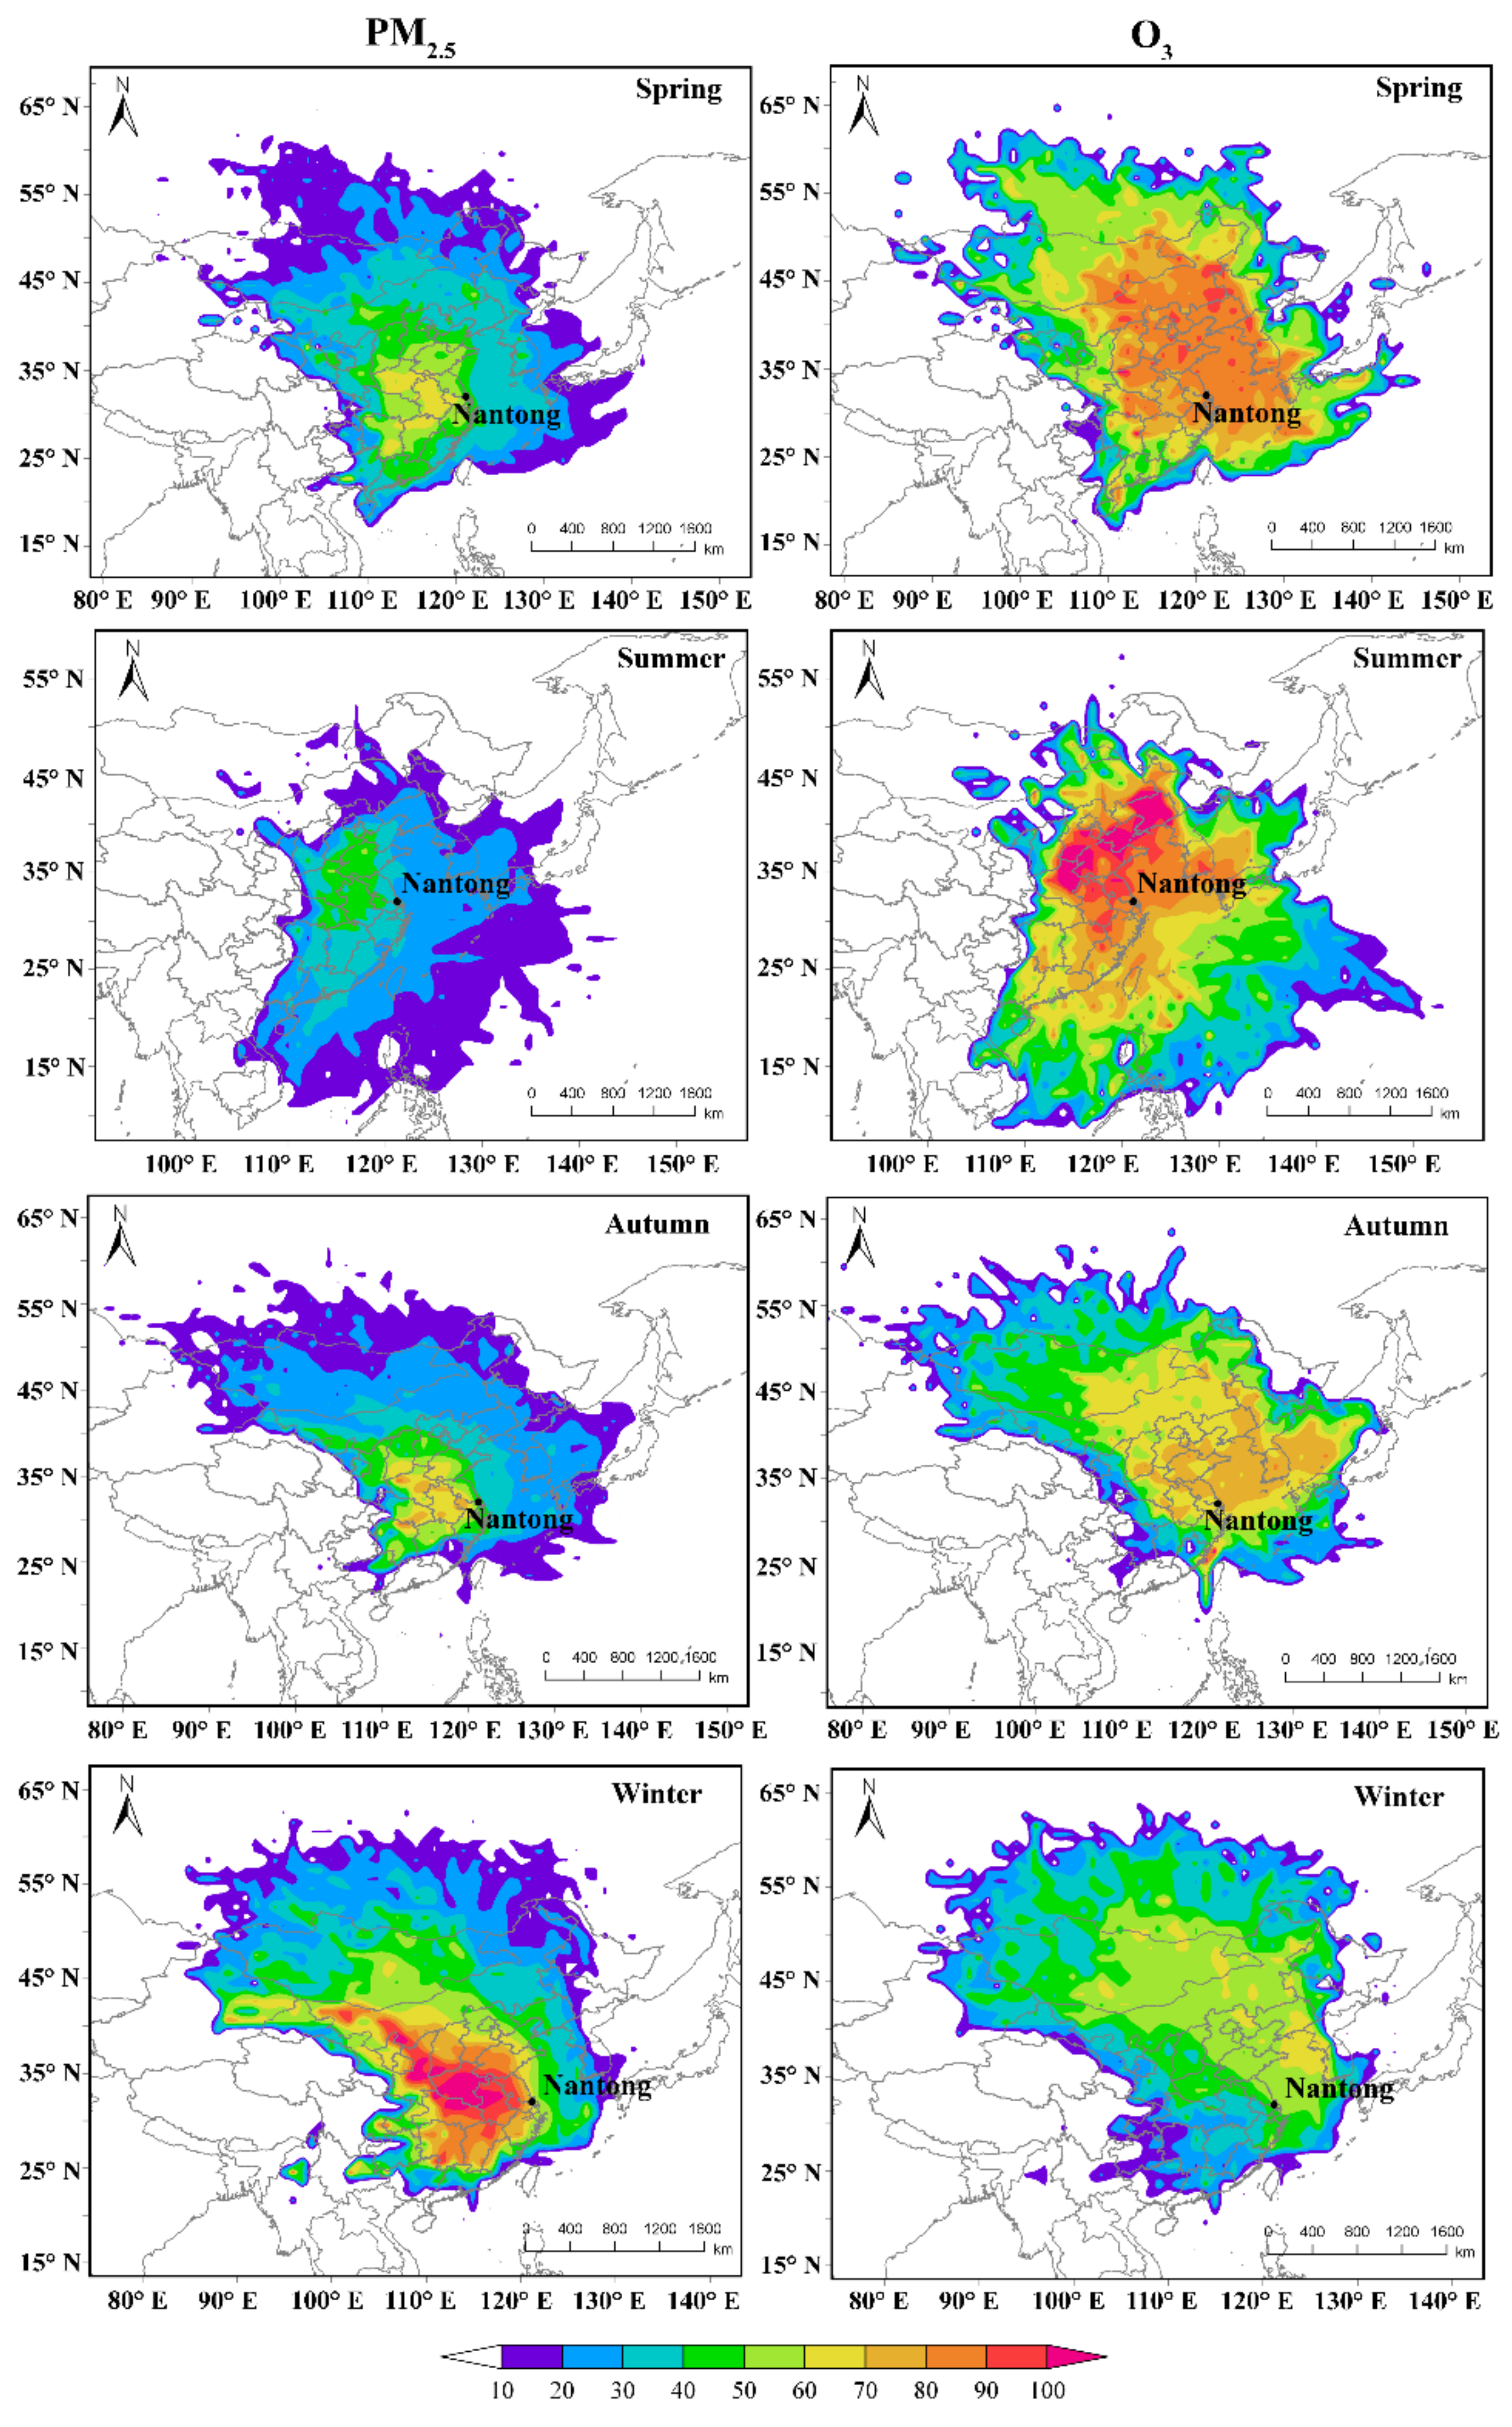
Figure 6 and Figure 7 show the PSCF and CWT results for different seasons in Nantong. As an auxiliary, the CWT values can help quantify the relative contribution of pollutants in each grid compensating for the weakness of PSCF. Generally, the greater PSCF and CWT values denoted higher contributions to PM2.5 and O3 concentrations.
For PM2.5, in all seasons, source regions from the western adjacent provinces were with higher PSCF (>0.6) and CWT (>60 μg/m−3) values, compared to the marine source areas with lower PSCF (<0.3) and CWT (<30 μg/m−3) values. As a result, the main factors impacting the PM2.5 pollution in Nantong were sources from inland areas, covering the Anhui, Henan, Hubei, Shanxi, and Shaanxi Province, and as far as inner Mongolia, rather than marine areas. Most of the potential source domains were distributed from southeast to northwest clockwise in all seasons, which were consistent with the prevailing wind direction. The largest domain of potential sources exceeding the mean concentration of PM2.5 occurred in autumn according to the PSCF results, followed by winter, then spring and summer. However, the CWT analysis indicated that the concentrations of potential sources were the greatest exceeding 100 μg/m−3 in winter. Therefore, a comprehensive analysis using both the PSCF and CWT values is necessary. Besides, polluted air masses mostly came from the northwesterly clusters contributing 84.32% of all polluted trajectories in winter (Table 3).
The O3 potential source regions had a similar pattern with PM2.5 in terms of the whole distribution area. However, the locations of more polluted source regions were much different. In addition to the source regions from the North China Plain, air masses over the Bohai Sea and the Yellow Sea also contributed a great deal to O3 concentrations in Nantong. It was likely due to the transport of O3 and its precursors by the transition between land and sea breeze circulation near the northern industrial coastal cities, which is consistent with the results of previous studies [34,35,36]. The severely polluted source regions varied seasonally. The polluted trajectories traveled roughly northwest-southeast, in spring, autumn and winter. Unlike these seasons, major severe sources of O3 in summer came mostly from the southwest to northeast clockwise with the largest polluted area and the greatest values exceeding 100 μg/m−3. Meanwhile, these areas accounted for 97.5% of the polluted trajectories in summer as shown in Table 3.

4. Conclusions

A comprehensive characterization of evolution, transport, and potential source regions of PM2.5 and O3 were investigated from 1 January 2015 to 31 December 2020 in Nantong. The annual evolution of PM2.5(O3) concentrations and corresponding trends of pollution hours were presented in detail. The transport pathways and potential source regions of PM2.5 and O3 were identified and determined by cluster analysis, PSCF, and CWT methods, respectively. The major conclusions were as follows:
The annual mean PM2.5 concentration declined obviously from 56.5 μg/m3 to 34.7 μg/m3 over the entire study period. O3 had a relatively smooth decreasing trend, but rebounded greatly during 2017 when the most frequent extreme high-temperature events occurred. Similar trends were observed for PM2.5-O3 polluted hours with some fluctuations, with a sharp decrease from 2015 to 2016 and then an increase to the peak values in 2018. No PM2.5-O3 complex polluted event happened in 2019 and 2020 indicating the preliminary effect of the implementation of emission controls.
Notable differences in transport pathways and frequencies were observed in four seasons in Nantong. Air masses of most clusters in summer had the lowest (highest) PM2.5 (O3) concentrations than those in other seasons. Clusters with the largest percentage of polluted PM2.5 and O3 trajectories were from the southwest adjacent provinces in spring and summer, but the northwest adjacent provinces in winter and the northeast ocean near Nantong in autumn, which was mostly short-distance sources rather than long-distance transport sources.
The PSCF method mainly focused on sources identification to calculate and describe possible source locations while the CWT method can distinguish the source strength more easily by assigning the concentrations values at the receptor site. The PSCF and CWT results showed that PM2.5 sources in Nantong were from the adjacent western and northwestern provinces with higher PSCF (>0.6) and CWT (>60 μg/m−3) values, and the influence of marine sources was relatively small with lower PSCF (<0.3) and CWT (<30 μg/m−3) values. The O3 potential source regions had a similar distribution pattern but significantly different polluted source regions with PM2.5. Apart from the source regions of O3 from the North China Plain, potential sources from the Bohai Sea and the Yellow Sea also contributed a great deal, which is attributed to transport of O3 and its precursors by the transition between land and sea breeze circulation near the northern industrial coastal cities. In addition, the severely polluted source regions of PM2.5 and O3 varied seasonally. Polluted air masses of PM2.5 mostly came from the northwesterly clusters contributing 84.32% of all polluted trajectories in winter, while major severe sources of O3 from the southwest to northeast clockwise accounted for 97.5% of the polluted trajectories in summer.
The results presented here suggest that, despite the effort made, control of PM2.5 and O3 emissions from the adjacent provinces will further play a significant role in achieving compliance with the air quality standard in Nantong. Nonetheless, a detailed further investigation of the impact of meteorological conditions on pollution transport pathways is still needed, which will provide an important scientific basis to explore efficient air pollution reduction strategies.

Author Contributions

Conceptualization, M.L.; methodology, M.L.; data curation and investigation, M.L. and B.W.; validation, A.H.; writing-original draft preparation, M.L.; writing—review and editing, J.C. All authors have read and agreed to the published version of the manuscript.

Funding

This work was supported by the Research Startup Foundation of Nantong University (No. 03081212) and the Nantong Basic Scientific Research Program (No. JC2020167).

Data Availability Statement

Long-term air quality monitoring datasets in Shanghai and Hefei analyzed during the current study are archived at https://quotsoft.net/air/ (accessed on 10 June 2021). The meteorological data were obtained from the US National Centers for Environment Prediction’s Global Data Assimilation System (ftp://arlftp.arlhq.noaa.gov/pub/archives/gdas1, accessed on 10 June 2021).

Acknowledgments

The authors acknowledge the China National Environmental Monitoring Centre (CNEMC) and NOAA for the data that they kindly provided.

Conflicts of Interest

The authors declare no conflict of interest.

References

  1. Zheng, G.J.; Duan, F.K.; Su, H.; Ma, Y.L.; Zheng, B.; Zhang, Q.; Huang, T.; Kimoto, T.; Chang, D.; Pöschl, U.; et al. Exploring the severe winter haze in Beijing: The impact of synoptic weather, regional transport and heterogeneous reactions. Atmos. Chem. Phys. 2015, 15, 2969–2983. [Google Scholar] [CrossRef] [Green Version]
  2. Li, G.; Bei, N.; Cao, J.; Huang, R.; Wu, J.; Feng, T.; Wang, Y.; Liu, S.; Zhang, Q.; Tie, X.; et al. A possible pathway for rapid growth of sulfate during haze days in China. Atmos. Chem. Phys. 2017, 17, 3301–3316. [Google Scholar] [CrossRef] [Green Version]
  3. Silver, B.; Reddington, C.L.; Arnold, S.R.; Spracklen, D.V. Substantial changes in air pollution across China during 2015–2017. Environ. Res. Lett. 2018, 13, 114012. [Google Scholar] [CrossRef]
  4. Wang, P.; Guo, H.; Hu, J.; Kota, S.H.; Ying, Q.; Zhang, H. Responses of PM2.5 and O3 concentrations to changes of meteorology and emissions in China. Sci. Total Environ. 2019, 662, 297–306. [Google Scholar] [CrossRef]
  5. Li, L.; Lu, C.; Chan, P.W.; Zhang, X.; Yang, H.; Lan, Z.; Zhang, W.; Liu, Y.; Pan, L.; Zhang, L. Tower observed vertical distribution of PM2.5, O3 and NOx in the Pearl River Delta. Atmos. Environ. 2020, 220, 117083. [Google Scholar] [CrossRef]
  6. Du, W.; Dada, L.; Zhao, J.; Chen, X.; Daellenbach, K.R.; Xie, C.; Wang, W.; He, Y.; Cai, J.; Yao, L.; et al. A 3D study on the amplification of regional haze and particle growth by local emissions. NPJ Clim. Atmos. Sci. 2021, 4, 1–8. [Google Scholar] [CrossRef]
  7. Lu, X.; Zhang, S.; Xing, J.; Wang, Y.; Chen, W.; Ding, D.; Wu, Y.; Wang, S.; Duan, L.; Hao, J. Progress of air pollution control in China and its challenges and opportunities in the ecological civilization era. Engineering 2020, 6, 1423–1431. [Google Scholar] [CrossRef]
  8. Xiang, S.; Liu, J.; Tao, W.; Yi, K.; Xu, J.; Hu, X.; Liu, H.; Wang, Y.; Zhang, Y.; Yang, H.; et al. Control of both PM2.5 and O3 in Beijing-Tianjin-Hebei and the surrounding areas. Atmos. Environ. 2020, 224, 117259. [Google Scholar] [CrossRef]
  9. Zhao, S.; Yin, D.; Yu, Y.; Kang, S.; Qin, D.; Dong, L. PM2.5 and O3 pollution during 2015–2019 over 367 Chinese cities: Spatiotemporal variations, meteorological and topographical impacts. Environ. Pollut. 2020, 264, 114694. [Google Scholar] [CrossRef]
  10. Gao, W.; Tie, X.; Xu, J.; Huang, R.; Mao, X.; Zhou, G.; Chang, L. Long-term trend of O3 in a mega City (Shanghai), China: Characteristics, causes, and interactions with precursors. Sci. Total Environ. 2017, 603, 425–433. [Google Scholar] [CrossRef]
  11. Qin, Y.; Li, J.; Gong, K.; Wu, Z.; Chen, M.; Qin, M.; Huang, L.; Hu, J. Double high pollution events in the Yangtze River Delta from 2015 to 2019: Characteristics, trends, and meteorological situations. Sci. Total Environ. 2021, 792, 148349. [Google Scholar] [CrossRef]
  12. Jia, M.; Zhao, T.; Cheng, X.; Gong, S.; Zhang, X.; Tang, L.; Liu, D.; Wu, X.; Wang, L.; Chen, Y. Inverse relations of PM2.5 and O3 in air compound pollution between cold and hot seasons over an urban area of east China. Atmosphere 2017, 8, 59. [Google Scholar] [CrossRef] [Green Version]
  13. Li, K.; Jacob, D.J.; Liao, H.; Shen, L.; Zhang, Q.; Bates, K.H. Anthropogenic drivers of 2013–2017 trends in summer surface ozone in China. Proc. Natl. Acad. Sci. USA 2019, 116, 422–427. [Google Scholar] [CrossRef] [Green Version]
  14. Yang, G.; Liu, Y.; Li, X. Spatiotemporal distribution of ground-level ozone in China at a city level. Sci. Rep. 2020, 10, 1–12. [Google Scholar] [CrossRef] [PubMed]
  15. Wu, J.; Xu, C.; Wang, Q.; Cheng, W. Potential sources and formations of the PM2.5 pollution in urban Hangzhou. Atmosphere 2016, 7, 100. [Google Scholar] [CrossRef] [Green Version]
  16. Ding, A.J.; Fu, C.B.; Yang, X.Q.; Sun, J.N.; Zheng, L.F.; Xie, Y.N.; Herrmann, E.; Nie, W.; Petäjä, T.; Kerminen, V.M. Ozone and fine particle in the western Yangtze River Delta: An overview of 1 yr data at the SORPES station. Atmos. Chem. Phys. 2013, 13, 5813–5830. [Google Scholar] [CrossRef] [Green Version]
  17. Zeng, J.; Zhang, L.; Yao, C.; Xie, T.; Rao, L.; Lu, H.; Liu, X.; Wang, Q.; Lu, S. Relationships between chemical elements of PM2.5 and O3 in Shanghai atmosphere based on the 1-year monitoring observation. J. Environ. Sci. 2020, 95, 49–57. [Google Scholar] [CrossRef]
  18. Miao, Y.; Che, H.; Zhang, X.; Liu, S. Relationship between summertime concurring PM2.5 and O3 pollution and boundary layer height differs between Beijing and Shanghai, China. Environ. Pollut. 2021, 268, 115775. [Google Scholar] [CrossRef]
  19. Cheung, V.T.; Wang, T. Observational study of ozone pollution at a rural site in the Yangtze Delta of China. Atmos. Environ. 2001, 35, 4947–4958. [Google Scholar] [CrossRef]
  20. Liu, L.; Duan, Y.; Li, L.; Xu, L.; Yang, Y.; Cu, X. Spatiotemporal trends of PM2. 5 concentrations and typical regional pollutant transport during 2015–2018 in China. Urban Clim. 2020, 34, 100710. [Google Scholar] [CrossRef]
  21. Yu, S.; Zhang, Q.; Yan, R.; Wang, S.; Li, P.; Chen, B.; Liu, W.; Zhang, X. 2014: Origin of air pollution during a weekly heavy haze episode in Hangzhou, China. Environ. Chem. Lett. 2014, 12, 543–550. [Google Scholar] [CrossRef]
  22. Miao, M.; Wu, H.; Zhu, Y.; Yang, M.; Zhang, Q.; Yuan, J. Variation characteristics of atmospheric pollutants’ concentration and its relations with meteorological factors in Nantong City. Sci. Technol. Eng. 2020, 20, 9248–9254. [Google Scholar]
  23. Pongkiatkul, P.; Oanh, N.T.K. Assessment of potential long-range transport of particulate air pollution using trajectory modeling and monitoring data. Atmos. Res. 2007, 85, 3–17. [Google Scholar] [CrossRef]
  24. Begum, B.A.; Kim, F.; Jeong, C.H.; Lee, D.W.; Hopke, P.K. Evaluation of the potential source contribution function using the 2002 Quebec forest fire episode. Atmos. Environ. 2005, 39, 3719–3724. [Google Scholar] [CrossRef]
  25. Sigler, J.M.; Lee, X. Recent trends in anthropogenic mercury emission in the northeast United States. J. Geophy. Res. 2006, 111, 1–11. [Google Scholar] [CrossRef] [Green Version]
  26. Wang, L.; Liu, Z.; Sun, Y.; Ji, D.; Wang, Y. Long-range transport and regional sources of PM2.5 in Beijing based on long-term observations from 2005 to 2010. Atmos. Res. 2015, 157, 37–48. [Google Scholar] [CrossRef]
  27. Guan, Q.; Yang, Y.; Luo, H.; Zhao, R.; Pan, N.; Lin, J. Transport pathways of PM10 during the spring in northwest China and its characteristics of potential dust sources. J. Clean. Prod. 2019, 237, 117746. [Google Scholar] [CrossRef]
  28. Mao, Z.; Xu, J.; Yang, D.; Yu, Z.; Zhai, Y.; Zhou, G. Analysis of characteristics and meteorological causes of PM2.5-O3 compound pollution in Shanghai. Chin. Environ. Sci. 2019, 37, 2730–2738. [Google Scholar]
  29. Wang, Y.Q.; Zhang, X.Y.; Draxler, R.R. TrajStat: GIS-based software that uses various trajectory statistical analysis methods to identify potential sources from long-term air pollution measurement data. Environ. Modell. Softw. 2009, 24, 938–939. [Google Scholar] [CrossRef]
  30. Romshoo, S.A.; Bhat, M.A.; Beig, G. Particulate pollution over an urban Himalayan site: Temporal variability, impact of meteorology and potential source regions. Sci. Total Environ. 2021, 799, 149364. [Google Scholar] [CrossRef]
  31. Hsu, Y.K.; Holsen, T.M.; Hopke, P.K. Comparison of hybrid receptor models to locate PCB sources in Chicago. Atmos. Environ. 2003, 37, 545–562. [Google Scholar] [CrossRef]
  32. Zhao, H.; Zheng, Y.F.; Xiao-Yun, W.U. Atmospheric compound pollution characteristics and the effects of meteorological factors in Jiangsu Province. Chin. Environ. Sci. 2018, 38, 2830–2839. [Google Scholar]
  33. Li, L.; Li, Q.; Huang, L.; Wang, Q.; Zhu, A.; Xu, J.; Liu, Z.; Li, H.; Shi, L.; Li, R.; et al. Air quality changes during the COVID-19 lockdown over the Yangtze River Delta Region: An insight into the impact of human activity pattern changes on air pollution variation. Sci. Total Environ. 2020, 732, 139282. [Google Scholar] [CrossRef] [PubMed]
  34. Kitada, T.; Kitagawa, E. Numerical analysis of the role of sea breeze fronts on air quality in coastal and inland polluted areas. Atmos. Environ. 1990, 4, 1545–1559. [Google Scholar] [CrossRef]
  35. Mangia, C.; Schipa, I.; Tanzarella, A.; Conte, D.; Marra, G.P.; Miglietta, M.M.; Rizza, U. A numerical study of the effect of sea breeze circulation on photochemical pollution over a highly industrialized peninsula. Meteorol. Appl. 2010, 17, 19–31. [Google Scholar] [CrossRef]
  36. Bei, N.; Zhao, L.; Wu, J.; Li, X.; Feng, T.; Li, G. Impacts of sea-land and mountain-valley circulations on the air pollution in Beijing-Tianjin-Hebei (BTH): A case study. Environ. Pollut. 2018, 234, 429–438. [Google Scholar] [CrossRef]
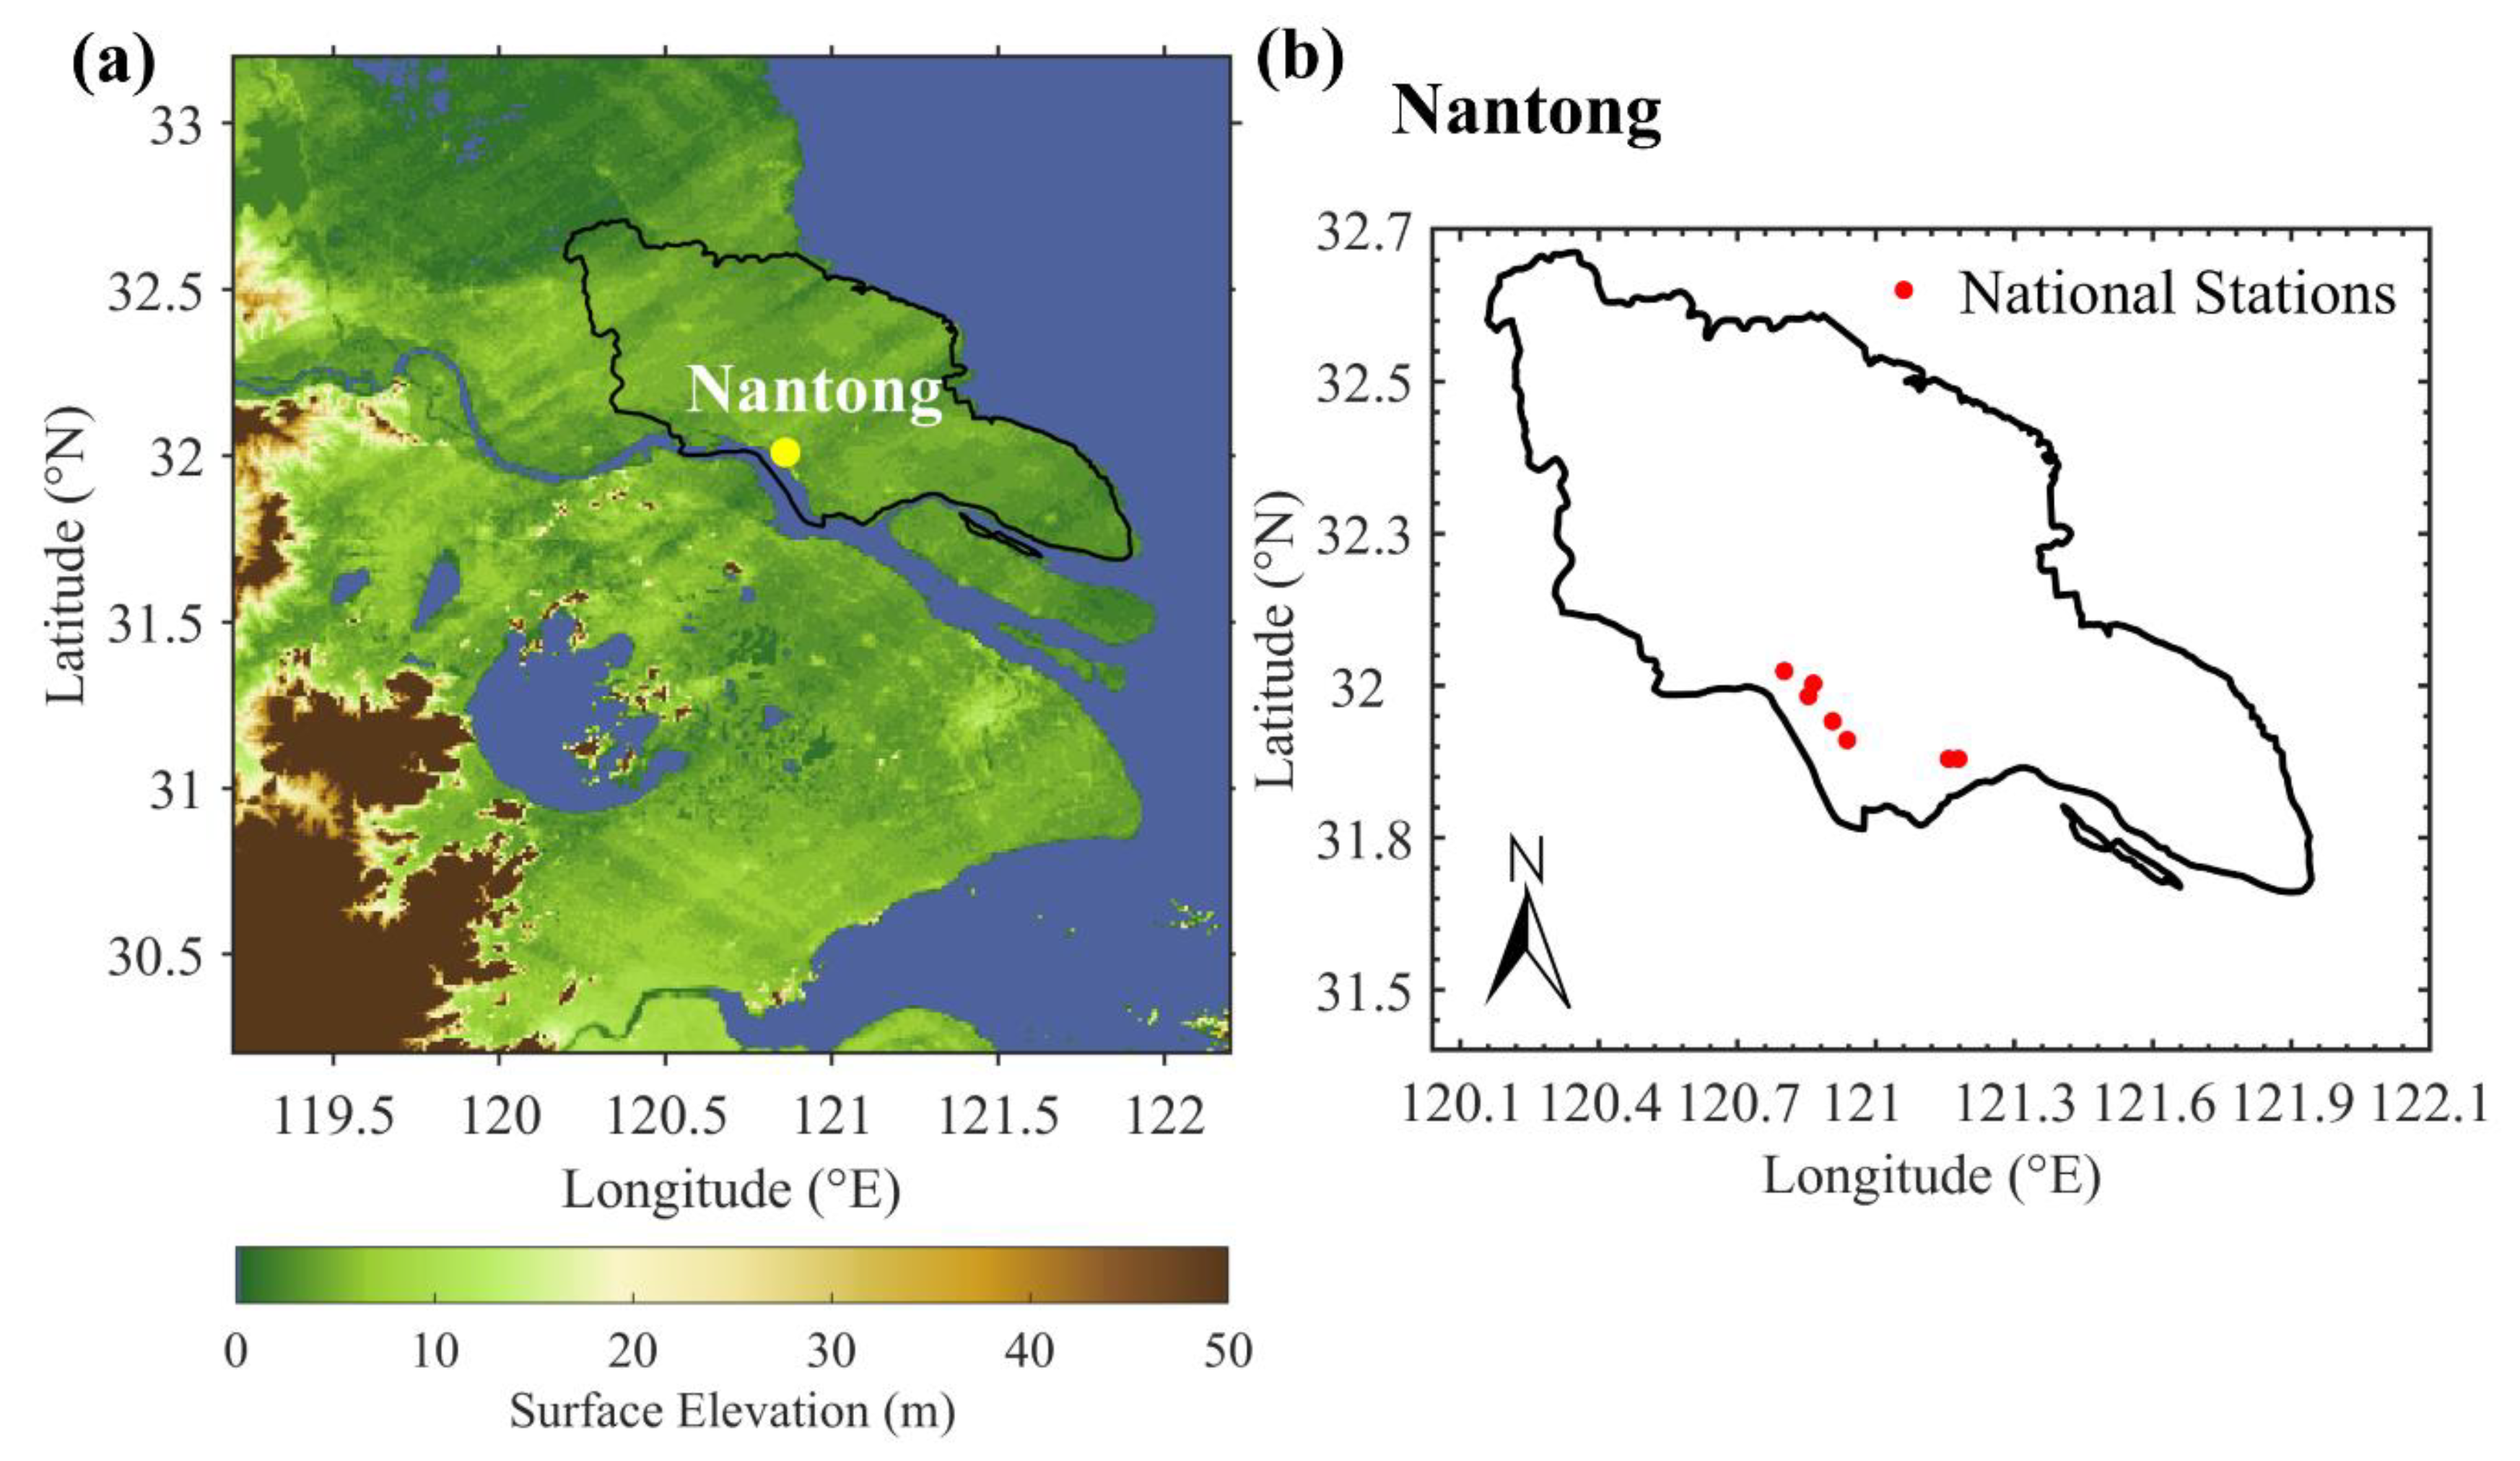
Figure 1. (a) Map showing the locations of Nantong (yellow circle) and (b) the locations of national air quality stations (red circles) in Nantong.
Atmosphere 12 01282 g001
Figure 2. Annual variations of PM2.5 and O3 concentrations in Nantong during the 2015–2020 period. On each box, the central mark shows the median, and the bottom and top edges of the box mark the 25th and 75th percentiles, respectively. The solid dots represent the annual mean values. Dashed lines show the long-term trends of pollutants.
Atmosphere 12 01282 g002
Figure 3. Annual variations of mean (a) PM2.5 and (b) O3 concentrations in different seasons in Nantong during the 2015–2020 period.
Atmosphere 12 01282 g003
Figure 4. The upper panels represent the total pollution hours of (a) PM2.5, (b) O3, and (c) PM2.5-O3 each year. The lower panels represent the evolution of corresponding air pollution hours in different seasons from 2015 to 2020 in Nantong.
Atmosphere 12 01282 g004
Figure 5. Mean backward trajectory clusters in (a) spring, (b) summer, (c) autumn, and (d) winter from 2015 to 2020 in Nantong. The number of each cluster and corresponding ratios are also shown. The black dot denotes the location of Nantong. The line colors are used to clarify transport pathways from different clusters.
Atmosphere 12 01282 g005
Figure 6. The PSCF maps of the potential sources of PM2.5 and O3 in spring (a,e), summer (b,f), autumn (c,g), and winter (d,h) for the entire period during 2005–2010 in Nantong. The black dot denotes Nantong.
Atmosphere 12 01282 g006
Figure 7. The CWT maps of the potential sources of PM2.5 and O3 in in spring (a,e), summer (b,f), autumn (c,g), and winter (d,h) for the entire period during 2005–2010 in Nantong. The black dot denotes Nantong.
Atmosphere 12 01282 g007
Table 1. The average concentrations of PM2.5 and O3 in each season over the entire study period used as threshold criteria in the PSCF method.
SpringSummerAutumnWinter
PM2.5 (μg/m−3)43293662
O3 (μg/m−3)62787052
Table 2. Annual mean concentrations (unit: μg/m−3), standard deviations (unit: μg/m−3) and corresponding linear trends (lr) of PM2.5 and O3 (unit: μg/m−3/year) from 2015 to 2020.
201520162017201820192020lr
PM2.556.5 ± 36.146.1 ± 29.339.5 ± 23.841.4 ± 28.837.2 ± 23.534.7 ± 24.0−3.9
O372.2 ± 26.771.2 ± 28.177.3 ± 28.269.6 ± 25.268.0 ± 25.167.3 ± 22.1−1.2
Table 3. Statistical results of the air pollutant concentrations for each cluster in the four seasons of Nantong. The Ratio denotes the percentage of trajectory numbers in all trajectories of each cluster, and P_Ratio is the percentage of polluted trajectory numbers in each cluster.
SeasonClusterRatio
(%)
PM2.5O3
Mean ± Std
(μg/m3)
P_Ratio
(%)
Mean ± Std
(μg/m−3)
P_Ratio
(%)
Spring122.0018.89 ± 30.5030.6187.00 ± 45.3725.53
230.9153.66 ± 31.2246.6277.14 ± 55.9759.57
329.6735.84 ± 21.5314.2382.57 ± 36.828.51
49.5236.89 ± 26.877.4780.04 ± 38.296.38
57.9026.95 ± 17.711.0782.15 ± 28.270.00
Summer111.0835.83 ± 24.4326.76101.6 ± 54.821.25
231.5534.54 ± 20.0238.0382.02 ± 64.6358.75
316.1216.77 ± 9.101.4150.32 ± 37.502.50
432.3327.70 ± 17.7729.5884.34 ± 38.7210.00
58.9325.31 ± 14.784.2360.47 ± 51.537.50
Autumn141.0238.35 ± 27.0838.2472.31 ± 40.4546.67
224.9133.27 ± 24.5420.1066.16 ± 34.7626.67
314.7734.06 ± 25.9311.2759.31 ± 30.120.00
411.2025.38 ± 17.942.4571.49 ± 31.810.00
58.1063.83 ± 42.2027.9460.15 ± 52.7526.67
Winter113.5750.48 ± 38.698.9856.88 ± 25.320.00
235.2677.40 ± 50.3550.0849.24 ± 30.170.00
325.4763.46 ± 45.7225.2750.98 ± 28.020.00
419.4537.37 ± 30.216.2456.76 ± 23.300.00
56.2579.27 ± 39.009.4432.57 ± 27.850.00
Publisher’s Note: MDPI stays neutral with regard to jurisdictional claims in published maps and institutional affiliations.