Abstract
The atmospheric chemistry constituents of nitrogen dioxide (NO2), sulphur dioxide (SO2) and carbon monoxide (CO) are associated with air pollution and climate change. In sub-Saharan Africa, a lack of sufficient ground-based and aircraft observations has, for a long time, limited the study of these species. This study thus utilized satellite observations as an alternative source of data to study the abundance of these species over the East African region. The instruments used included the Ozone Monitoring Instrument (OMI), the Atmospheric InfraRed Sounder (AIRS), and the TROPOspheric Monitoring Instrument (TROPOMI). An investigation of trends in the data series from 2005 to 2020 was carried out using the sequential Mann-Kendall test while the Pearson correlation coefficient was used to compare the data records of the instruments. The analysis revealed no trend in NO2 (p > 0.05), a decreasing trend in SO2 (p < 0.05), a decreasing trend (p < 0.05) in CO closer to the surface (850 hPa to 500 hPa) and an increasing trend (p < 0.05) in CO higher up in the atmosphere (400 hPa to 1 hPa). There is likely a vertical ascent of CO. The correlation between the instrument records was 0.54 and 0.77 for NO2 and CO, respectively. Furthermore, seasonal fires in the savanna woodlands were identified as the major source of NO2 and CO over the region, while cities such as Kampala, Nairobi, and Bujumbura and towns such as Dar es Salaam and Mombasa were identified as important NO2 hotspots. Similarly, the active volcano at Mt. Nyiragongo near Goma was identified as the most important SO2 hotspot.
1. Introduction
Air pollution is one of the outstanding environmental concerns in the world today, affecting both developed and developing regions [1,2]. In 2016 alone, it accounted for 4.2 million deaths globally, because of its association with stroke, lung cancer, ischemic heart disease, acute lower respiratory disease and chronic obstructive pulmonary disease [3]. This pollution often takes the form of particulate matter (PM2.5 and PM10), nitrogen oxide (NO), nitrogen dioxide (NO2), sulphur dioxide (SO2), carbon monoxide (CO), and ozone (O3). This study only focused on three species, that is, NO2, SO2 and CO.
In East Africa, the important sources of these pollutants include biomass burning in the savanna, which is mostly carried out to clear land and to destroy crop residue, although it is at times triggered naturally by lightning [4,5]. The other sources are volcanic eruptions (specifically for SO2) and incomplete fossil fuel combustion in activities tagged to the local economy. These include transportation, manufacturing, and electricity generation. Domestic activities such as rubbish burning, cooking with charcoal, briquettes or firewood also emit these gases locally [5,6,7]. In the dry seasons, December to February and June to August, long-range winds may transport these gases from neighbouring regions into East Africa, adding to the observed gas abundances over the region [5].
NO2, SO2 and CO are also categorized under short-lived climate forcers because of the radiative forcing they induce in the atmosphere through the formation of other chemical species. NO2 and SO2 are precursors for nitrate and sulphate aerosols, respectively, both of which induce a net cooling effect. CO is a precursor for tropospheric ozone, which induces a net warming effect. These species also have short atmospheric lifetimes, realistically, days to a few months. SO2 resides in the atmosphere for 2 days while for NO2 that time is longer at 1 to 10 days and CO has the longest residence time of 30 to 90 days. This lifetime can change depending on the species height in the atmosphere [8,9]. This is why these gases are increasingly gaining attention in climate discussions [10,11].
Since cities are a hub for economic activity, they are often associated with higher emissions of these short-lived climate forcers / air pollutants than their surrounding regions. Consequently, cities have been the target for most studies exploring the abundances of these gases. Over East Africa, these cities include Kampala [12,13], Nairobi [14,15] and Dar es Salaam [16], which have expanded over the past two decades [17,18]. Now, however, it might be important to also study the overall regional distribution of these gases, in addition to the city-scale studies. This is because long-range wind transportation can shift significant gas amounts out of cities and spread them into neighbouring areas [19]. Furthermore, given the increasing importance of these gas species in understanding regional climates, having regional-scale studies as well is more meaningful than having city-scale studies alone.
Understanding the long-term trends of these gas species over East Africa is useful for inferring the region’s emission patterns and trends in air pollution, for studying the regional climate change driven by such short-lived climate forcers and for informing both climate and air quality policy. However, there are limited studies that have explored the trends of East Africa’s NO2, SO2, and CO over a long period of time. The major hindrance has been a lack of consistent observational records covering the entire region. To fill this gap, some observation campaigns have been set-up. These include; the Rwanda Climate Observatory, which started making observations in May 2015 [5] and Clean Air Nairobi, whose observations started in May 2016 [14]. However, these data are not yet sufficient to infer the long-term, spatially representative trends of these gases over the East African region.
In this study, therefore, satellite observations are utilized to study the long-term trends of NO2, SO2, and CO over the region of East Africa. Records from two chemistry-focused satellite instruments are used for each gas species, these are the Ozone Monitoring Instrument (OMI) [20,21] for NO2 and SO2 observations from 2005 to 2020, the Atmospheric InfraRed Sounder (AIRS) [22] for CO observations from 2005 to 2020, and the TROPOspheric Monitoring Instrument (TROPOMI) [23] for observations of all the three gases from 2018 to 2020. OMI and AIRS were useful to ensure ample temporal coverage of the historical period, while TROPOMI records were included in the analysis as a complementary data source, especially since it has newer technology and makes observations at a higher spatial resolution than OMI and AIRS. These datasets have an advantage over the existing ground-based measurements because they cover the entire spatial extent of the region, which is currently not yet possible with the existing ground-based observation network.
The objectives of this study were to determine the trend in NO2, SO2, and CO over East Africa between 2005 and 2020 and to compare the observations of TROPOMI with those of the longer-serving instruments, OMI and AIRS. The association of these chemistry species with meteorological variables was also investigated. The rest of this paper is organized as follows: Section 2 is the methodology section which includes a description of the study region, the satellite instruments from which data were collected and the methods of analysis. In Section 3, the important findings of the study are presented, and the major conclusions are summarized in Section 4.
2. Methodology
2.1. Study Region
This study focused on five countries in the East African region: Uganda, Kenya, Tanzania, Rwanda and Burundi (Figure 1). Politically, however, South Sudan is considered part of this region. The five countries were selected because they have the same bimodal rainfall regime and South Sudan was excluded because it has a unimodal rainfall regime, which is distinct from the other five countries [24]. The combined population of the region is estimated at 177.2 million inhabitants, gaining annual increments at a rate of 2.9% [25]. Such regions of sub-Saharan Africa are projected to be one of the important emission sources of short-lived climate and air pollutants toward the end of the century [26], making it prudent to start investigating the existing abundances of such species over the region.
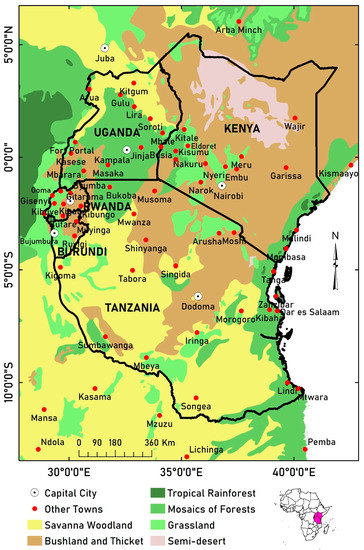
Figure 1.
Map of East Africa showing its vegetation cover along with the capital cities and other towns.
2.2. Data
2.2.1. NO2 and SO2 from the Ozone Monitoring Instrument (OMI)
OMI is a spectrometer aboard the Aura satellite operated by the National Aeronautics and Space Administration (NASA). Since July 2004, OMI has provided near global coverage of critical trace gases and aerosols, such as NO2, SO2, HCHO, O3 and OCIO, on a 24-h basis. These observations are retrieved from measurements of solar irradiance scattered by atmospheric components via three wavelength channels consisting of both the ultraviolet and visible spectrum (~270–500 nm). The observations are made at a spatial resolution of 13 × 24 km2 at nadir [20,21]. The NO2 product utilized in this study is version 4.0 of the OMI tropospheric NO2 vertical column density (VCD) with improved cloud (30% cloud screened) and surface treatments and comes in units of molecules/cm2 [27]. These data have a slant column density (SCD) uncertainty of ~0.8 × 10¹⁵ molecules/cm2 [28]. This study also utilized version 2 of the OMI anthropogenic SO2 (OMISO2 v2) VCD which has been tested and shown to have ~ 0.15–0.3 Dobson Units (DU) margin of uncertainty in the slant column densities (SCD) over the region of interest [29]. Daily quantities of both NO2 and SO2 from OMI for the time range 2005 to 2020 were downloaded from the GIOVANNI data handle of NASA (https://giovanni.gsfc.nasa.gov/; accessed on 7 June 2021) at a spatial resolution of 0.25° (~27.5 km). The analysis was then made based on area averages over the entire region.
2.2.2. CO from the Atmospheric InfraRed Sounder (AIRS)
AIRS is both a spectrometer and radiometer aboard NASA’s Aqua satellite, which was launched in May 2002. It operates within a spectral range of 3.7–15.4 µm to make direct measurements of temperature and atmospheric chemistry species such as CH4, O3 and CO. It also contributes to atmospheric measurements of cloud properties and humidity [22]. This study utilized version 7.0 of the AIRS CO product in the daytime/ascending orbit which gives the CO mole fraction in the air in units of parts per billion by volume (ppbv). Data over the entire study region for the period 2005 to 2020 were downloaded from the GIOVANNI data handle of NASA at a daily temporal resolution and a spatial resolution of 1° × 1° (~110 km) [30]. Before analysis, the data were summed up for 22 atmospheric levels, from 850 hPa to 1 hPa to obtain the total column amount. The levels, 1000 hPa and 925 hPa that are associated with the boundary layer were excluded from the analysis because they had no data. AIRS has a limitation of not sensing the lowest part of the troposphere where biomass burning occurs. Consequently, the AIRS CO data used here is underestimated.
2.2.3. NO2, SO2 and CO data from the TROPOspheric Monitoring Instrument (TROPOMI)
TROPOMI is a spectrometer aboard the Sentinel-5 Precursor satellite operated by the European Space Agency (ESA). TROPOMI started operation in October 2017, and it makes global measurements of critical atmospheric trace gases such as NO2, SO2, O3, CO, HCHO, and CH4 along with cloud properties via four (4) wavelength bands: ultraviolet, visible, near infrared and shortwave infrared, all ranging from ~270–2385 nm. The measurements are made daily at a spatial resolution of 3.5 × 7 km2 at nadir [23], but since 6th August 2019, the resolution has been improved to 3.5 × 5.5 km2. This study utilized the level 3 offline products for NO2, SO2 and CO from 2018 to 2020. These were all downloaded from Google Earth engine [31] in units of mol/m2 and a spatial resolution of 3.5 × 7 km2 for NO2 and SO2 and 7 × 7 km2 for CO. In the analysis of NO2 and CO, the content downloaded were multiplied by the factor 6.02214 × 10¹⁹ to obtain quantities in units of molecules/cm2 while for SO2, it was multiplied by 2241.15 to obtain a quantity in Dobson Units (DU). Quality control has already been applied to these data, and a quality assurance value (qa_value) ranging from 0 (very poor) to 1 (very good) appended. For the NO2 data used, the qa_value was above 0.75, while for SO2 and CO the qa_value was above 0.5. Since the SO2 data observed over regions with low SO2 emissions can have negative vertical column values in some instances, only SO2 columns above −0.001 mol/m2 were used as recommended by the data providers [32].
2.2.4. Meteorological Observations
The rainfall observations used in this study were based on the Climate Hazards Group Infrared Precipitation with Stations (CHIRPS). This dataset is a hybrid combination between satellite and ground-based rainfall observations at a spatial resolution of 0.05° (~5 km) [33]. These data were downloaded for the period 2005 to 2020 from Google earth engine [31]. The temperature data on the other hand were based on version 6 of the MODIS land surface temperature observations, which are also available at a spatial resolution of 0.05° (~5 km) [34]. These data were downloaded from NASA’s data handle, GIOVANNI.
2.3. Methods
In this study, temporally averaged maps for each species were compared to each other for the two instruments used per species. On the other hand, the spatially averaged timeseries data were analysed using Pearson correlation to show the association in the instrument records. This was discussed along with the seasonal variations. Before investigating the trends, the data were decomposed in order to isolate the de-seasonalized component from the seasonal and residual components. The trends were then determined by applying the non-parametric sequential Mann-Kendall test to the de-seasonalized timeseries of the species. This test has been adequately described by Shikwambana et al. [35]. In this study, it was used to reveal the direction, strength and significance of the trends at a 95% confidence level.
3. Results and Discussion
3.1. Spatial Distribution of NO2, SO2 and CO and Comparison of Satellite Data Records
Figure 2 shows the atmospheric abundances of NO2, SO2 and CO averaged by time, along with the correlation coefficients calculated using records of the two instruments used per gas species. Data from matching time periods were used in this analysis. For NO2 this was 1 July 2018 to 31 December 2020, for SO2 this was 7 December 2018 to 31 December 2020 and for CO it was 1 July 2018 to 31 December 2020. It is evident that each of the two satellite instruments used per species observed a similar spatial distribution pattern and the major difference was in the observed column amounts. TROPOMI’s higher resolution offers an added advantage of isolating the emission hotspots.
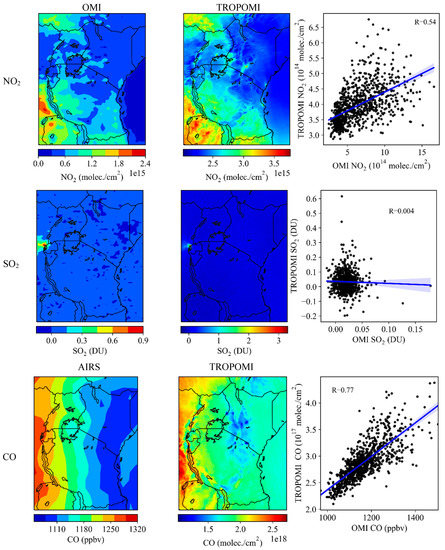
Figure 2.
Spatial distribution of NO2, SO2 and CO as observed by OMI, AIRS and TROPOMI along with the correlations between the instrument records.
For NO2, both instruments show that the concentrations were higher in Uganda and Tanzania compared to the other countries. More specifically, the higher NO2 amounts were in the areas of northern Uganda and western and southern Tanzania. OMI observed between 0.6 × 10¹⁵ and 1.5 × 10¹⁵ molecules/cm2, while TROPOMI observed between 2.5 × 10¹⁵ and 3.3 × 10¹⁵ molecules/cm2. This NO2 distribution is most likely associated with the savanna fires at the surface as the distribution matches the location of the savanna woodlands (Figure 1). TROPOMI also observed NO2 concentrated within the capital cities such as Kampala (Uganda), Nairobi (Kenya), and Bujumbura (Burundi), and towns like Dar es Salaam (Tanzania) and Mombasa (Kenya). The amounts were between ~2.8 × 10¹⁵ and 3.7 × 10¹⁵ molecules/cm2. A similar pattern was observed outside the region, in cities like Juba (South Sudan) and Kasama (Zambia). This is due to the concentration of fossil fuel combustion activities within these urban locations. Overall, regardless of the matching spatial distribution observed by both instruments, TROPOMI measures higher NO2 vertical column densities (VCD) than OMI, making the correlation, R = 0.54. This suggests that peak values are not occurring on the same days in the two datasets.
The concentration of SO2 was very low over most of the region, typically below 0.15 DU and 0 DU in OMI and TROPOMI measurements, respectively (Figure 2). The negative values denote clear sky measurements in areas with low SO2 amounts. The only outstanding emission source for SO2 was near Goma (Democratic Republic of Congo), a town neighbouring Rwanda in the north (Figure 1). This is primarily because of the existence of an active volcano at Mt. Nyiragongo which is about 15 km from Goma. It is an open-vent volcano with a lava lake at the top and it continuously emits SO2 [36,37]. Overall, TROPOMI observed higher SO2 column amounts than OMI.
Since TROPOMI makes CO measurements as totals of the entire atmospheric column, the AIRS CO data were summed up for 22 atmospheric levels, from 850 hPa at the bottom to 1 hPa at the top of the atmosphere. The summed data were then compared with TROPOMI. The instruments records showed a strong correlation; R = 0.77. The spatial distribution showed that CO is most concentrated on the western side of the region and least concentrated on the eastern side. Uganda, Rwanda, Burundi and Tanzania are the largest contributors of CO in the region. This pattern matches the location of the savanna woodlands (Figure 1) which implies that the savannah fires are the most important emission source of CO over the region. The results also suggest that NO2 and CO are emitted from the same combustion processes of the savanna fires.
3.2. Seasonal Variation
Figure 3 shows the seasonal variation of the NO2, SO2 and CO, along with rainfall and temperature. These were plotted using the entire 16-year data record for OMI and AIRS and a 2-year data record for TROPOMI. The variations are based on spatial averages over the entire region, and since some parts of the East African region have very low abundances of these species, the spatial averages tend to be lower than temporal averages on which the maps in Figure 2 are based.

Figure 3.
Seasonal variation of NO2 (a), SO2 (b), CO (c,d) along with rainfall (e) and temperature (f). The vertical bars show the monthly standard deviations.
The abundances of NO2 and CO are highest during the months of July to October and December to February, which coincides with the fire seasons over the African continent [5]. Their variation also shows a higher sensitivity to the meteorological parameters than is seen in SO2. NO2 and CO show an inverse response to rainfall. The abundances of these species are lowest during the first rain season, March to May. During that season, NO2 does not exceed 5 × 10¹⁴ molecules/cm2, while CO is below 1150 ppbv (OMI) or 2.8 × 10¹⁷ molecules/cm2 (TROPOMI). During the dry season, June to September, the abundances of these species are higher. NO2 reaches peak concentrations of about 11 × 1014 molecules/cm2 while CO reaches to about 1238 ppbv (OMI) or 3.06 × 10¹⁷ molecules/cm2 (TROPOMI). After this period, their abundances start declining as the second rain season sets in from October to December. This inverse association between these chemistry species and rainfall is because the prolonged occurrence of rainfall events during its peak seasons creates conditions that do not allow ample time for the woodlands and grasslands to dry-up enough, to the level that they can ignite [38].
Furthermore, NO2 and CO have a trajectory that matches that of temperature. The high abundances occur during the months with higher temperatures, January to March and August to November, when temperatures are typically above 34 °C. On the other hand, low abundances occur during months with lower temperatures, that is, April to July, when temperatures are below 32.5 °C. This association with low temperatures is, however, more pronounced for CO than it is for NO2.
SO2 shows some variation over different months of the year. The OMI observations show the amounts to be between ~0.02 and 0.03 DU, while the TROPOMI observations show slightly higher amounts, between ~0.01 and 0.07 DU.
3.3. Long-Term Trend of NO2, SO2 and CO
Figure 4 shows the records of the three chemistry species based on observations from OMI for NO2 and SO2 and AIRS for CO. TROPOMI data were excluded because of their short temporal coverage, which were not sufficient to infer long-term trends. Since the daily data were too noisy, monthly averages were also plotted to give a clearer direction of the trend. For NO2, the daily average was between a minimum of ~2.3 × 10¹⁴ molecules/cm2 and a maximum of 22.7 × 10¹⁴ molecules/cm2, while the monthly average was between ~4 × 10¹⁴ and 10 × 1014 molecules/cm2. NO2 peaks twice in each year, that is, August to September and in December. The latter peak extends into January of the following year.
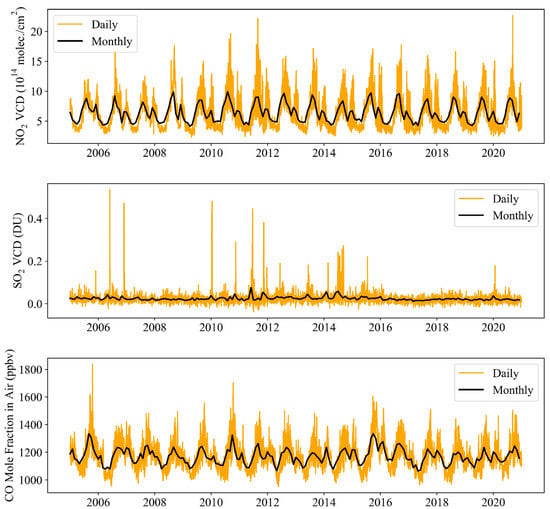
Figure 4.
Daily and monthly area averages of NO2 (top), SO2 (middle) and CO (bottom) taken over the entire region.
For SO2, the daily average for the majority of the period was up to a maximum of ~0.2 DU, however there were a few extreme events that ranged between ~0.22 DU and 0.55 DU. Coincidentally, some of them occurred within the months with overall higher SO2 amounts that exceeded a monthly average 0.05 DU. These months included June and November of 2011 and February, June and July of 2014, and they caused notable spikes in the monthly timeseries (Figure 4). The overall monthly SO2 average was between ~0.01 and 0.08 DU.
For CO, the daily average was between a minimum of 953 ppbv and a maximum of 1839 ppbv, while the monthly average was between 1064 ppbv and 1335 ppbv. CO also peaks twice a year, that is, January to February and September to October. Importantly, the peak seasons of NO2 and CO overlap in September and January, both of which are fire seasons in the tropical savanna [4].
Figure 5 shows the decomposed monthly timeseries for each of the species. For NO2, the two-peak pattern is re-echoed to be August to September and in December. The August peak had more than twice the gas abundance of the December peak. The de-seasonalized series shows that the three outstanding periods of NO2 abundance occur from June to October of 2010, March to December of 2012 and June to August of 2015. For SO2, the most outstanding period was from April to July of 2014 followed by November 2011 and May 2012. For CO, the two-peak pattern is clarified to occur in September–October and January to February, with the first peak having ~ 60 ppbv more CO than the second peak. The most outstanding period with high CO abundance was November 2015 to April 2016. Importantly, the most prominent peaks in NO2 and CO simultaneously occur in September, suggesting that it could be the most intense month for the savanna fires.
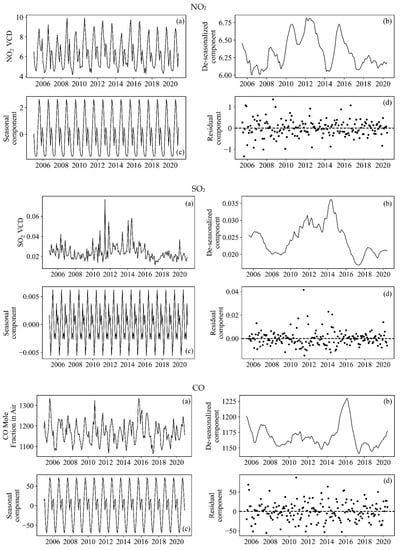
Figure 5.
Decomposed time series of NO2 (×1014 molecules/cm2), SO2 (DU) and CO (ppbv). All units labelled (a) are the monthly series, (b) are the de-seasonalized components, (c) are the seasonal components and (d) are the residual components.
Table 1 is a summary of the results of the sequential Mann-Kendall test applied to the de-seasonalized timeseries of each species. The results show that there was no trend in NO2 (p > 0.05), while CO and SO2 had decreasing trends (p < 0.05). Since Mt. Nyiragongo is the dominant SO2 hotspot in the region, the overall decreasing trend is most likely associated with the processes going on within it. Arellano et al. [36] reported a decreasing trend in SO2 at this volcano and attributed it to degassed magma sinking down into the volcano’s conduit.

Table 1.
A summary of the Mann-Kendall test statistics for the de-seasonalized timeseries of NO2, SO2 and CO at 95% confidence level.
A further analysis of the CO vertical profile revealed significant trends at specific heights (Figure 6 and Table 2). For levels closer to the surface, that is, 850 hPa to 500 hPa, which had the highest CO abundances, there was a decreasing trend (p < 0.05) which has been illustrated with the Mann-Kendall statistics for the 850 hPa level (Figure 6a and Table 2). For levels starting at 400 hPa to 70 hPa and those from 50 hPa to 1 hPa, there was an increasing trend (p < 0.05), and this has been illustrated using the Mann-Kendall statistics for the 150 hPa and 3 hPa levels, respectively (Figure 6b, c and Table 2). This trend is however stronger for the levels, 400 hPa to 70 hPa than it is for 50 hPa to 1 hPa. These CO trends could be due to the vertical uplift of CO from the boundary layer into the free atmosphere by the action of deep convective updrafts [39,40]. Figure 6d shows the average abundance of CO for the 22 atmospheric levels. The highest CO amounts are found closer to the surface because that is the most important location for biomass burning events.
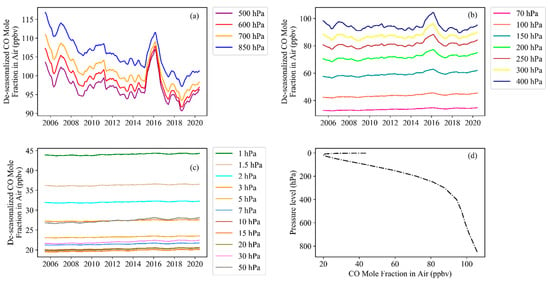
Figure 6.
CO trend for 22 pressure levels in the atmosphere (a–c) along with the CO vertical profile (d) for the period 2005 to 2020.

Table 2.
A summary of the Mann-Kendall test statistic for CO at heights of 850 hPa, 150 hPa and 3 hPa.
3.4. Analysis of SO2 Extreme Years
For the SO2 timeseries which exhibited a significant trend (Table 1), further analysis was carried out considering the five months with the highest monthly average SO2 amounts. These were June and November of 2011 and February, June and July of 2014, which all had SO2 monthly averages exceeding 0.05 DU (Figure 5). Coincidentally, these months were within the years with the highest SO2 amounts, that is, 2011 and 2014. Since the beginning of the OMI observation campaign, in the East African region, these two years were recorded to have the highest SO2 amounts (Figure 7).
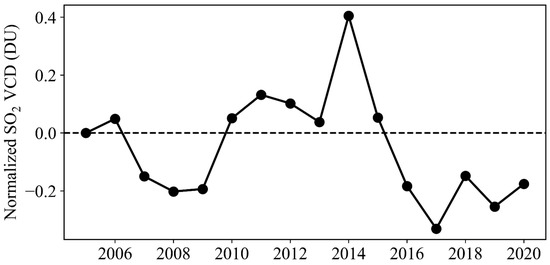
Figure 7.
Relative change in SO2 over East Africa, normalized based on the year 2005.
The spatial distribution of SO2 during these months is presented in Figure 8 and it shows that the active volcano, Mt. Nyiragongo located near the border town of Goma stands out as an SO2 hotspot during all the months, but most especially in June 2014 when the SO2 amount exceeded 10 DU. The seasonal variation of SO2 emitted from this volcano (Figure 9) shows that the peak emissions occur during the months of May to August. Importantly, this volcano emits much higher SO2 amounts whenever it erupts, and such was the case in the most recent eruption that occurred on 22nd May 2021 [41]. Figure 8 shows that the region closest to the volcano had SO2 amounts between ~8 and 15 DU and the region of north western Tanzania had SO2 amounts of up to ~6 DU.
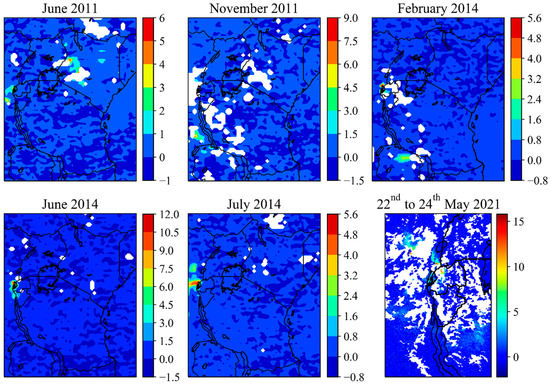
Figure 8.
Spatial distribution of boundary layer SO2 (in Dobson Units; DU) for the months with the highest monthly average SO2 amounts, along with that observed by TROPOMI during the eruption of May 2021. The white areas are missing data.
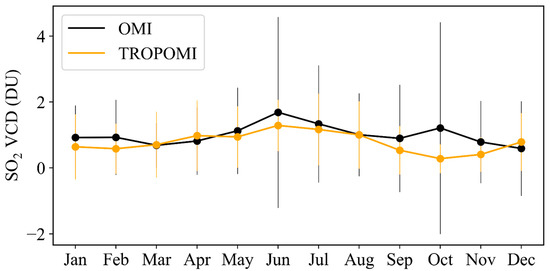
Figure 9.
Seasonal variation of SO2 emitted from Mt. Nyiragongo.
In June 2011, the regions of western and central Kenya also added to the observed SO2 amounts by ~1 to 5 DU. The underlying reason is not yet clear, however, since no such distribution is observed in the other months, then this could be due to a one-off SO2 related emission event that occurred during that month within this region. For example, fires set off by fuel leakages along the oil pipelines from Eldoret and Kisumu through Nairobi can emit SO2 due to combustion of the sulphur-rich fuel. Such an event occurred in 2011 [42]. In June 2014, Bujumbura, the capital city of Burundi also added to the observed SO2 amounts over the region by ~1.5 to 4.5 DU.
4. Conclusions
In this study, satellite data records were used to investigate the trend of NO2, SO2 and CO over the East African region. Along with this, the study also made comparisons between the satellite records and investigated the association that these three species have with rainfall and temperature. The major conclusions are summarized below.
(1) The major source of NO2 and CO over the East African region are the fires that occur in the savanna woodlands. The observed spatial distribution of these species perfectly matches the spatial extent of the savanna. Cities and towns are also important emission sources of NO2 in East Africa and its neighbouring regions. These cities include Kampala, Nairobi, Bujumbura, and Juba, and the towns include Dar es Salaam, Mombasa and Kasama. Furthermore, the active volcano at Mt. Nyiragongo near Goma is the single most important source of SO2 in East Africa.
(2) There was no trend in NO2 over the 16-year period investigated. Perhaps there has not yet occurred any significant shift in the savanna fires. In addition to this, though there has been an expansion in the cities within East Africa over the past two decades, it seems not to have translated into a significant increase in the NO2 abundance over the region. There was an overall decreasing trend in SO2 over the region which is attributed to internal events within Mt. Nyiragongo. Degassed magma is reported to be sinking further down into the volcano’s conduit [37]. CO exhibited a decreasing trend from 850 hPa to 500 hPa and an increasing trend for the levels above, that is, 400 hPa to 1 hPa. The increasing trend was stronger from 400 hPa to 70 hPa than from 50 hPa to 1 hPa. There is likely to be vertical ascent of CO from the boundary layer into the free atmosphere. This uplift has been seen in other regions such as east Asia [39] and India [40].
(3) NO2 and CO are suppressed during rainfall seasons because the consecutive rainfall events do not allow enough time for the savanna woods and grass to dry up sufficiently for ignition to happen.
(4) Finally, despite the time difference in the technology, the satellite observations had consistent spatial agreement in the distribution of the gases. TROPOMI’s higher resolution, however, gives it an added advantage of isolating the emission hotspots, and this cements its position as one of the most important instruments for observing atmospheric chemistry, both now and in the coming future.
Author Contributions
Conceptualization, R.O.; methodology, R.O., I.M. and J.N.-N.; formal analysis, R.O.; writing—original draft preparation, R.O.; writing—review and editing, I.M. and J.N.-N.; visualization, R.O.; supervision, I.M. and J.N.-N.; project administration, J.N.-N.; funding acquisition, R.O. and J.N.-N. All authors have read and agreed to the published version of the manuscript.
Funding
This research was funded by the International Development Research Centre (IDRC) and Swedish International Development Cooperation Agency (SIDA) through the Artificial Intelligence for Development (AI4D) program that is run by the African Centre for Technology Studies (ACTS).
Data Availability Statement
The data used in this study are freely available for download from the GIOVANNI data handle of NASA (https://giovanni.gsfc.nasa.gov/; accessed on 7 June 2021) and Google Earth Engine (https://earthengine.google.com/; accessed on 8 June 2021).
Conflicts of Interest
The authors declare no conflict of interest. The funders had no role in the design, execution and writing of this study.
References
- Schneider, P.; Lahoz, W.A.; van der A, R. Recent Satellite-Based Trends of Tropospheric Nitrogen Dioxide over Large Urban Agglomerations Worldwide. Atmos. Chem. Phys. 2015, 15, 1205–1220. [Google Scholar] [CrossRef]
- Singh, A.; Avis, W.R.; Pope, F.D. Visibility as a Proxy for Air Quality in East Africa. Environ. Res. Lett. 2020, 15, 084002. [Google Scholar] [CrossRef]
- World Health Organization. Burden of Disease from Ambient Air Pollution for 2016; World Health Organization: Geneva, Switzerland, 2018. [Google Scholar]
- Cahoon, D.R.; Stocks, B.J.; Levine, J.S.; Cofer, W.R.; O’Neill, K.P. Seasonal Distribution of African Savanna Fires. Nature 1992, 359, 812–815. [Google Scholar] [CrossRef]
- Dewitt, H.L.; Gasore, J.; Rupakheti, M.; Potter, K.E.; Prinn, R.G.; Ndikubwimana, J.D.D.; Nkusi, J.; Safari, B. Seasonal and Diurnal Variability in O3, Black Carbon, and CO Measured at the Rwanda Climate Observatory. Atmos. Chem. Phys. 2019, 19, 2063–2078. [Google Scholar] [CrossRef]
- Wamoto, J.M. Determination of NOx and SO2 Concentration Levels in Nairobi City, Kenya by Use of Passive Samplers. Master’s Thesis, Jomo Kenyatta University of Agriculture and Technology, Juja, Kenya, 2010. [Google Scholar]
- Bateebe, I.P. Investigation of Probable Pollution from Automobile Exhaust Gases in Kampala City, Uganda. Master’s Thesis, KTH Royal Institute of Technology, Stockholm, Sweden, 2011. [Google Scholar]
- Myhre, G.; Shindell, D.; Bréon, F.-M.; Collins, W.; Fuglestvedt, J.; Huang, J.; Koch, D.; Lamarque, J.-F.; Lee, D.; Mendoza, B.; et al. Anthropogenic and natural radiative forcing. In Climate Change 2013: The Physical Science Basis. Contribution of Working Group I to the Fifth Assessment Report of the Intergovernmental Panel on Climate Change; Stocker, T.F., Qin, D., Plattner, G.-K., Tignor, M., Allen, S.K., Boschung, J., Nauels, A., Xia, Y., Bex, V., Midgley, P.M., Eds.; Cambridge University Press: Cambridge, UK; New York, NY, USA, 2013. [Google Scholar]
- Seinfeld, J.H.; Pandis, S.N. Atmospheric Chemistry and Physics: From Air Pollution to Climate Change, 3rd ed.; John Wiley & Sons, Inc.: Hoboken, NJ, USA, 2016. [Google Scholar]
- Stohl, A.; Aamaas, B.; Amann, M.; Baker, L.H.; Bellouin, N.; Berntsen, T.K.; Boucher, O.; Cherian, R.; Collins, W.; Daskalakis, N.; et al. Evaluating the Climate and Air Quality Impacts of Short-Lived Pollutants. Atmos. Chem. Phys. 2015, 15, 10529–10566. [Google Scholar] [CrossRef]
- Aamaas, B.; Berntsen, T.K.; Fuglestvedt, J.S.; Shine, K.P.; Collins, W.J. Regional Temperature Change Potentials for Short-Lived Climate Forcers Based on Radiative Forcing from Multiple Models. Atmos. Chem. Phys. 2017, 17, 10795–10809. [Google Scholar] [CrossRef]
- Katushabe, C.; Kumaran, S.; Masabo, E. Fuzzy Based Prediction Model for Air Quality Monitoring for Kampala City in East Africa. Appl. Syst. Innov. 2021, 4, 44. [Google Scholar] [CrossRef]
- Kirenga, B.J.; Meng, Q.; Van Gemert, F.; Aanyu-Tukamuhebwa, H.; Chavannes, N.; Katamba, A.; Obai, G.; Van Der Molen, T.; Schwander, S.; Mohsenin, V. The State of Ambient Air Quality in Two Ugandan Cities: A Pilot Cross-Sectional Spatial Assessment. Int. J. Environ. Res. Public Health 2015, 12, 8075–8091. [Google Scholar] [CrossRef] [PubMed]
- DeSouza, P.; Nthusi, V.; Klopp, J.M.; Shaw, B.E.; Ho, W.O.; Saffell, J.; Jones, R.; Ratti, C. A Nairobi Experiment in Using Low Cost Air Quality Monitors. Clean Air J. 2017, 27, 12–42. [Google Scholar] [CrossRef]
- Mutai, B.; Muthama, J.; Ng’ang’a, J.; Ngaina, J. Analysis of the Temporal Evolution of Total Column Nitrogen Dioxide and Ozone over Nairobi, Kenya Using Daily OMI Measurements. Ethiop. J. Environ. Stud. Manag. 2015, 8, 530–540. [Google Scholar] [CrossRef][Green Version]
- Othman, O.C. Roadside Levels of Ambient Air Pollutants: SO2, NO2, NO, CO and SPM in Dar Es Salaam City. Tanzania J. Nat. Appl. Sci. 2010, 1, 202–210. [Google Scholar]
- Guma, P.K. The Governance and Politics of Urban Space in the Postcolonial City: Kampala, Nairobi and Dar Es Salaam. Africa Rev. 2016, 8, 31–43. [Google Scholar] [CrossRef]
- Mundia, C.N. Nairobi metropolitan area. In Urban Development in Asia and Africa; Springer: Singapore, 2017; pp. 293–317. [Google Scholar] [CrossRef]
- Tan, W.; Liu, C.; Wang, S.; Liu, H.; Zhu, Y.; Su, W.; Hu, Q.; Liu, J. Long-Distance Mobile MAX-DOAS Observations of NO2 and SO2 over the North China Plain and Identification of Regional Transport and Power Plant Emissions. Atmos. Res. 2020, 245, 105037. [Google Scholar] [CrossRef]
- Levelt, P.F.; Joiner, J.; Tamminen, J.; Veefkind, J.P.; Bhartia, P.K.; Zweers, D.C.S.; Duncan, B.N.; Streets, D.G.; Eskes, H.; Van Der, R.A.; et al. The Ozone Monitoring Instrument: Overview of 14 Years in Space. Atmos. Chem. Phys. 2018, 18, 5699–5745. [Google Scholar] [CrossRef]
- Levelt, P.F.; Van Den Oord, G.H.J.; Dobber, M.R.; Mälkki, A.; Visser, H.; De Vries, J.; Stammes, P.; Lundell, J.O.V.; Saari, H. The Ozone Monitoring Instrument. IEEE Trans. Geosci. Remote Sens. 2006, 44, 1093–1100. [Google Scholar] [CrossRef]
- Aumann, H.H.; Chahine, M.T.; Gautier, C.; Goldberg, M.D.; Kalnay, E.; McMillin, L.M.; Revercomb, H.; Rosenkranz, P.W.; Smith, W.L.; Staelin, D.H.; et al. AIRS/AMSU/HSB on the Aqua Mission: Design, Science Objectives, Data Products, and Processing Systems. IEEE Trans. Geosci. Remote Sens. 2003, 41, 253–264. [Google Scholar] [CrossRef]
- Veefkind, J.P.; Aben, I.; McMullan, K.; Förster, H.; de Vries, J.; Otter, G.; Claas, J.; Eskes, H.J.; de Haan, J.F.; Kleipool, Q.; et al. TROPOMI on the ESA Sentinel-5 Precursor: A GMES Mission for Global Observations of the Atmospheric Composition for Climate, Air Quality and Ozone Layer Applications. Remote Sens. Environ. 2012, 120, 70–83. [Google Scholar] [CrossRef]
- Nicholson, S.E. Climate and Climatic Variability of Rainfall over Eastern Africa. Rev. Geophys. 2017, 55, 590–635. [Google Scholar] [CrossRef]
- East African Community. East African Community Facts and Figures 2019; East African Community: Arusha, Tanzania, 2019. [Google Scholar]
- Lund, M.T.; Aamaas, B.; Stjern, C.W.; Klimont, Z.; Berntsen, T.K.; Samset, B.H. A Continued Role of Short-Lived Climate Forcers under the Shared Socioeconomic Pathways. Earth Syst. Dyn. 2020, 11, 977–993. [Google Scholar] [CrossRef]
- Lamsal, L.N.; Krotkov, N.A.; Vasilkov, A.; Marchenko, S.; Qin, W.; Fasnacht, Z.; Joiner, J.; Choi, S.; Haffner, D.; Swartz, W.H.; et al. Ozone Monitoring Instrument (OMI) Aura Nitrogen Dioxide Standard Product Version 4.0 with Improved Surface and Cloud Treatments. Atmos. Meas. Tech. 2021, 14, 455–479. [Google Scholar] [CrossRef]
- Marchenko, S.; Krotkov, N.A.; Lamsal, L.N.; Celarier, E.A.; Swartz, W.H.; Bucsela, E.J. Revising the Slant Column Density Retrieval of Nitrogen Dioxide Observed by the Ozone Monitoring Instrument. J. Geophys. Res. 2015, 120, 5670–5692. [Google Scholar] [CrossRef]
- Li, C.; Krotkov, N.A.; Leonard, P.J.T.; Carn, S.; Joiner, J.; Spurr, R.J.D.; Vasilkov, A. Version 2 Ozone Monitoring Instrument SO2 Product (OMSO2 V2): New Anthropogenic SO2 Vertical Column Density Dataset. Atmos. Meas. Technol. 2020, 13, 6175–6191. [Google Scholar] [CrossRef]
- AIRS Project. Aqua/AIRS L3 Daily Standard Physical Retrieval (AIRS-Only) 1 Degree × 1 Degree V7.0; Goddard Earth Sciences Data and Information Services Center (GES DISC): Greenbelt, MD, USA, 2019. [Google Scholar] [CrossRef]
- Gorelick, N.; Hancher, M.; Dixon, M.; Ilyushchenko, S.; Thau, D.; Moore, R. Google Earth Engine: Planetary-Scale Geospatial Analysis for Everyone. Remote Sens. Environ. 2017, 202, 18–27. [Google Scholar] [CrossRef]
- Copernicus. Sentinel-5P OFFL SO2: Offline Sulphur Dioxide. Available online: https://developers.google.com/earth-engine/datasets/catalog/COPERNICUS_S5P_OFFL_L3_SO2#description (accessed on 17 August 2021).
- Funk, C.; Peterson, P.; Landsfeld, M.; Pedreros, D.; Verdin, J.; Shukla, S.; Husak, G.; Rowland, J.; Harrison, L.; Hoell, A.; et al. The Climate Hazards Infrared Precipitation with Stations—A New Environmental Record for Monitoring Extremes. Sci. Data 2015, 2, 1–21. [Google Scholar] [CrossRef]
- Wan, Z.; Hook, S.; Hulley, G. MYD11C3 MODIS/Aqua Land Surface Temperature/Emissivity Monthly L3 Global 0.05Deg CMG V006 [Data Set]; NASA EOSDIS Land Processes DAAC: Sioux Falls, SD, USA, 2015. [Google Scholar] [CrossRef]
- Shikwambana, L.; Mhangara, P.; Mbatha, N. Trend Analysis and First Time Observations of Sulphur Dioxide and Nitrogen Dioxide in South Africa Using TROPOMI/Sentinel-5 P Data. Int. J. Appl. Earth Obs. Geoinf. 2020, 91, 102130. [Google Scholar] [CrossRef]
- Dingwell, A.; Rutgersson, A.; Claremar, B.; Arellano, S.; Yalire, M.M.; Galle, B. Seasonal and Diurnal Patterns in the Dispersion of SO2 from Mt. Nyiragongo. Atmos. Environ. 2016, 132, 19–29. [Google Scholar] [CrossRef]
- Arellano, S.; Yalire, M.; Galle, B.; Bobrowski, N.; Dingwell, A.; Johansson, M.; Norman, P. Long-Term Monitoring of SO2 Quiescent Degassing from Nyiragongo’s Lava Lake. J. Afr. Earth Sci. 2017, 134, 866–873. [Google Scholar] [CrossRef]
- Nelson, D.M.; Verschuren, D.; Urban, M.A.; Hu, F.S. Long-Term Variability and Rainfall Control of Savanna Fire Regimes in Equatorial East Africa. Glob. Chang. Biol. 2012, 18, 3160–3170. [Google Scholar] [CrossRef] [PubMed]
- Ding, K.; Liu, J.; Ding, A.; Liu, Q.; Zhao, T.L.; Shi, J.; Han, Y.; Wang, H.; Jiang, F. Uplifting of Carbon Monoxide from Biomass Burning and Anthropogenic Sources to the Free Troposphere in East Asia. Atmos. Chem. Phys. 2015, 15, 2843–2866. [Google Scholar] [CrossRef]
- Chandra, N.; Venkataramani, S.; Lal, S.; Sheel, V.; Pozzer, A. Effects of Convection and Long-Range Transport on the Distribution of Carbon Monoxide in the Troposphere over India. Atmos. Pollut. Res. 2016, 7, 775–785. [Google Scholar] [CrossRef]
- Madowo, L. Mount Nyiragongo: Stunning Images Show Volcano Spewing Gray Ash—CNN Video. Available online: https://edition.cnn.com/videos/world/2021/05/31/drc-congo-goma-mount-nyiragongo-madowo-lkl-intl-hnk-vpx.cnn (accessed on 28 June 2021).
- Mutiga, M. Pipeline Fire Kills Dozens in Nairobi Slum. Available online: https://www.theguardian.com/world/2011/sep/12/pipeline-fire-nairobi-slum (accessed on 21 August 2021).
Publisher’s Note: MDPI stays neutral with regard to jurisdictional claims in published maps and institutional affiliations. |
© 2021 by the authors. Licensee MDPI, Basel, Switzerland. This article is an open access article distributed under the terms and conditions of the Creative Commons Attribution (CC BY) license (https://creativecommons.org/licenses/by/4.0/).