Article

ATmospheric LIDar (ATLID): Pre-Launch Testing and Calibration of the European Space Agency Instrument That Will Measure Aerosols and Thin Clouds in the Atmosphere

1
European Space Agency–ESTEC, 2200 AG Noordwijk, The Netherlands
2
Airbus Defense and Space, CEDEX 4, 31402 Toulouse, France
*
Author to whom correspondence should be addressed.
Atmosphere 2021, 12(1), 76; https://doi.org/10.3390/atmos12010076
Submission received: 30 November 2020 / Revised: 23 December 2020 / Accepted: 23 December 2020 / Published: 6 January 2021
(This article belongs to the Special Issue Lidar Remote Sensing Techniques for Atmospheric Aerosols)

Abstract

:
ATLID (ATmospheric LIDar) is the atmospheric backscatter Light Detection and Ranging (LIDAR) instrument on board of the Earth Cloud, Aerosol and Radiation Explorer (EarthCARE) mission, the sixth Earth Explorer Mission of the European Space Agency (ESA) Living Planet Programme. ATLID’s purpose is to provide vertical profiles of optically thin cloud and aerosol layers, as well as the altitude of cloud boundaries, with a resolution of 100 m for altitudes of 0 to 20 km, and a resolution of 500 m for 20 km to 40 km. In order to achieve this objective ATLID emits short duration laser pulses in the ultraviolet, at a repetition rate of 51 Hz, while pointing in a near nadir direction along track of the satellite trajectory. The atmospheric backscatter signal is then collected by its 620 mm aperture telescope, filtered through the optics of the instrument focal plane assembly, in order to separate and measure the atmospheric Mie and Rayleigh scattering signals. With the completion of the full instrument assembly in 2019, ATLID has been subjected to an ambient performance test campaign, followed by a successful environmental qualification test campaign, including performance calibration and characterization in thermal vacuum conditions. In this paper the design and operational principle of ATLID is recalled and the major performance test results are presented, addressing the main key receiver and emitter characteristics. Finally, the estimated instrument, in-orbit, flight predictions are presented; these indicate compliance of the ALTID instrument performance against its specification and that it will meet its mission science objectives for the EarthCARE mission, to be launched in 2023.

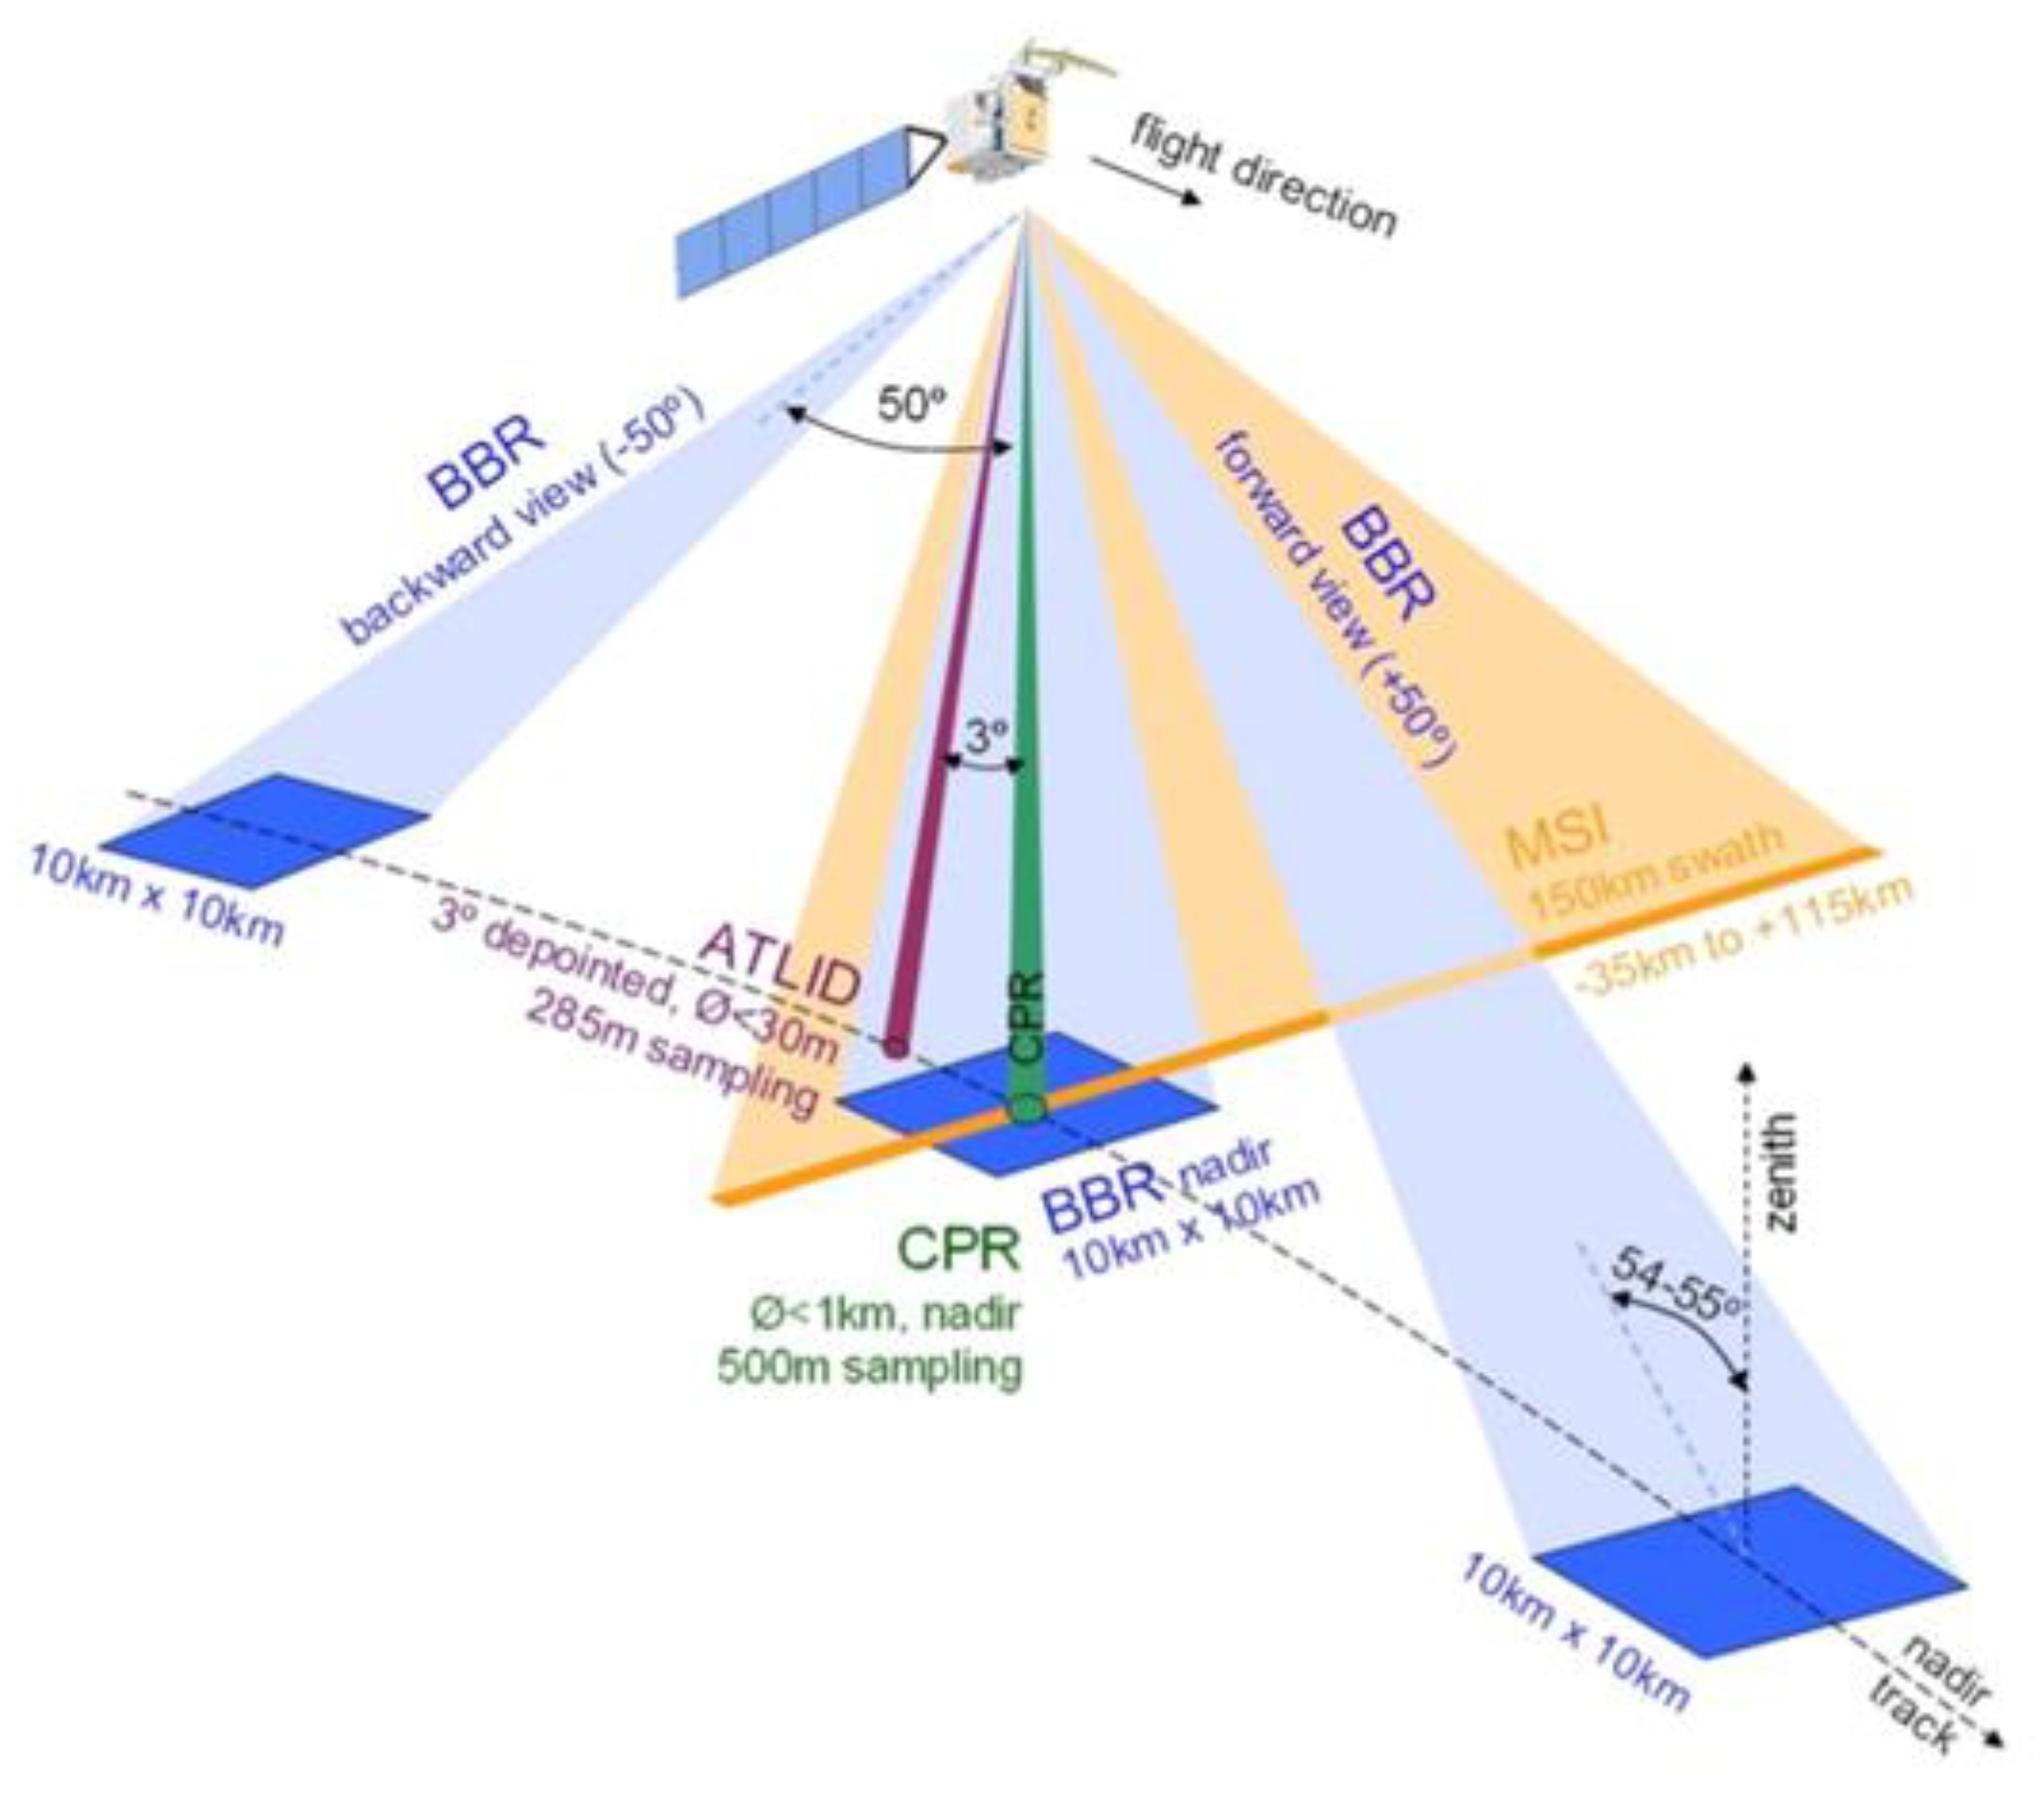
1. Introduction: The EarthCARE mission

EarthCARE [1,2,3,4,5] is a joint collaborative mission of ESA and Japan Aerospace Exploration Agency (JAXA) with the objective to improve our understanding of the cloud-aerosol-radiation interactions and Earth radiative balance, so that they can be modelled with better reliability in climate and numerical weather prediction models [6]. To provide atmospheric observations globally, the EarthCARE satellite (Figure 1), will be placed in a Sun-synchronous orbit with a repeat cycle of 25 days. A low average altitude to ground of 408 km has been selected in order to enhance the performance of the two active instruments. The quasi-polar orbit will allow to cover all latitudes from equator to ±83°.
The EarthCARE payload consists of four instruments that will, in a synergetic manner, retrieve vertical profiles of clouds and aerosols, and the characteristics of the radiative and micro-physical properties, to determine flux gradients within the atmosphere as well as top of atmosphere radiance and flux. Specifically, EarthCARE scientific objectives are:
  • Observation of the vertical profiles of natural and anthropogenic aerosols on a global scale, their radiative properties and interaction with clouds;
  • Observation of the vertical distributions of atmospheric liquid water and ice on a global scale, their transport by clouds and their radiative impact;
  • Observation of cloud distribution (‘cloud overlap’), cloud precipitation interactions and the characteristics of vertical motions within clouds;
  • Retrieval of profiles of atmospheric radiative heating and cooling through the combination of the retrieved aerosol and cloud properties.
EarthCARE payload comprises three instruments provided by ESA: a High Spectral Resolution UV ATmospheric LIDar (ATLID) [7,8,9,10,11], a Multi-spectral Imager (MSI) and a Broad-Band Radiometer (BBR) [12]; and the Cloud Profiling Radar (CPR) [13] with Doppler capability, provided by JAXA. The two active payloads, a LIDAR and a radar, penetrate into clouds and collect data, at a microscopic level, on atmospheric constituents and their movement. 3D scene construction will be used to derive radiative transfer products from the active instrument observation data and models. Calculated radiances and fluxes can then be compared against the BBR measurements of radiated thermal versus reflected solar fluxes at the top of the atmosphere; conversion to flux is performed analytically using Angular Dependence Models and the three BBR views [14]. The Multi-spectral Imager provides contextual information about the relatively small scenes observed by the active instruments, as well as providing spectral scene content to aid with un-filtering the BBR data. The combined dataset will be an evolution of the existing observations of the A-Train satellites CloudSat, Cloud–Aerosol LIDAR and Infrared Pathfinder Satellite Observations (CALIPSO), and Aqua. On one hand, the impacts of climate change can be further monitored. On the other hand, the advanced payloads will provide aerosol-cloud and radiation measurements to further refine their modelling of direct and indirect effects on the radiative budget [15]. Co-registration of the multi-instrument payload data is a key aspect for the mission. The instrument viewing geometry can be seen in Figure 2, which illustrates the satellite ground track, the CPR beam at normal nadir, the ATLID beam de-pointed backward by 3° to reduce any specular reflection, the across track swath of the MSI with its offset in the anti-sun direction to mitigate sun-glint and finally the 3 BBR views in nadir, forward and backward directions required to retrieve the top of atmosphere emitted flux.

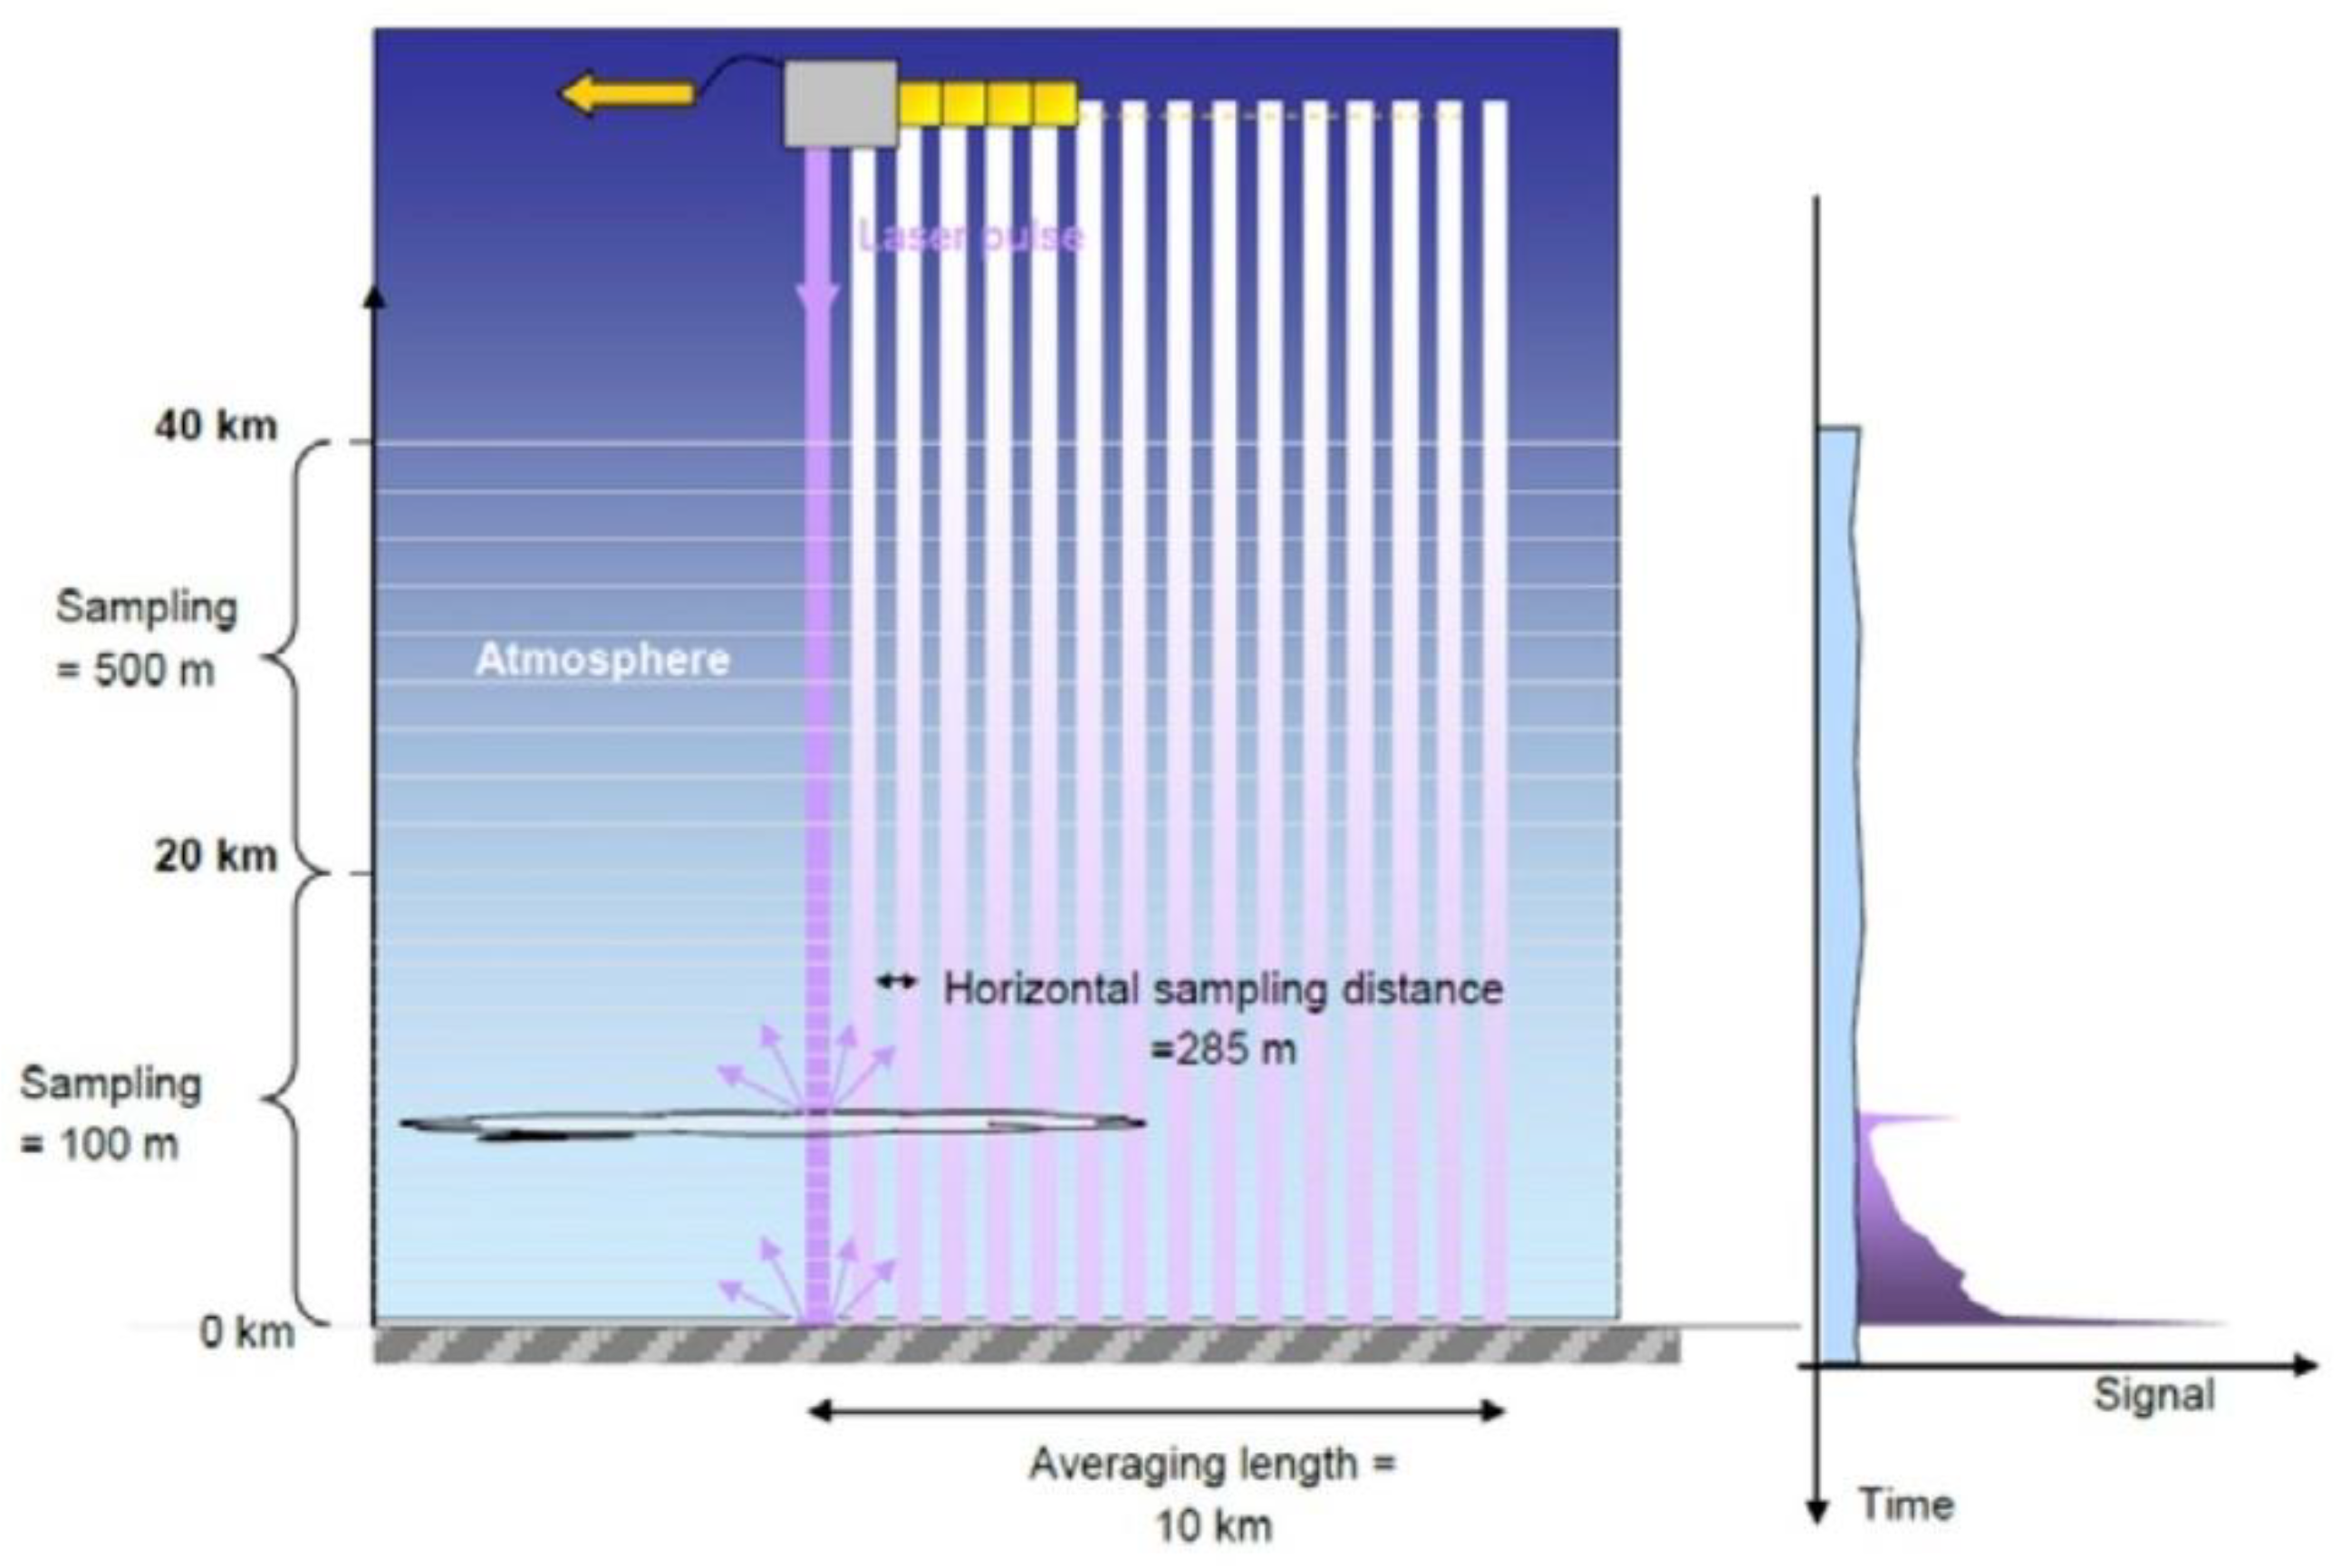
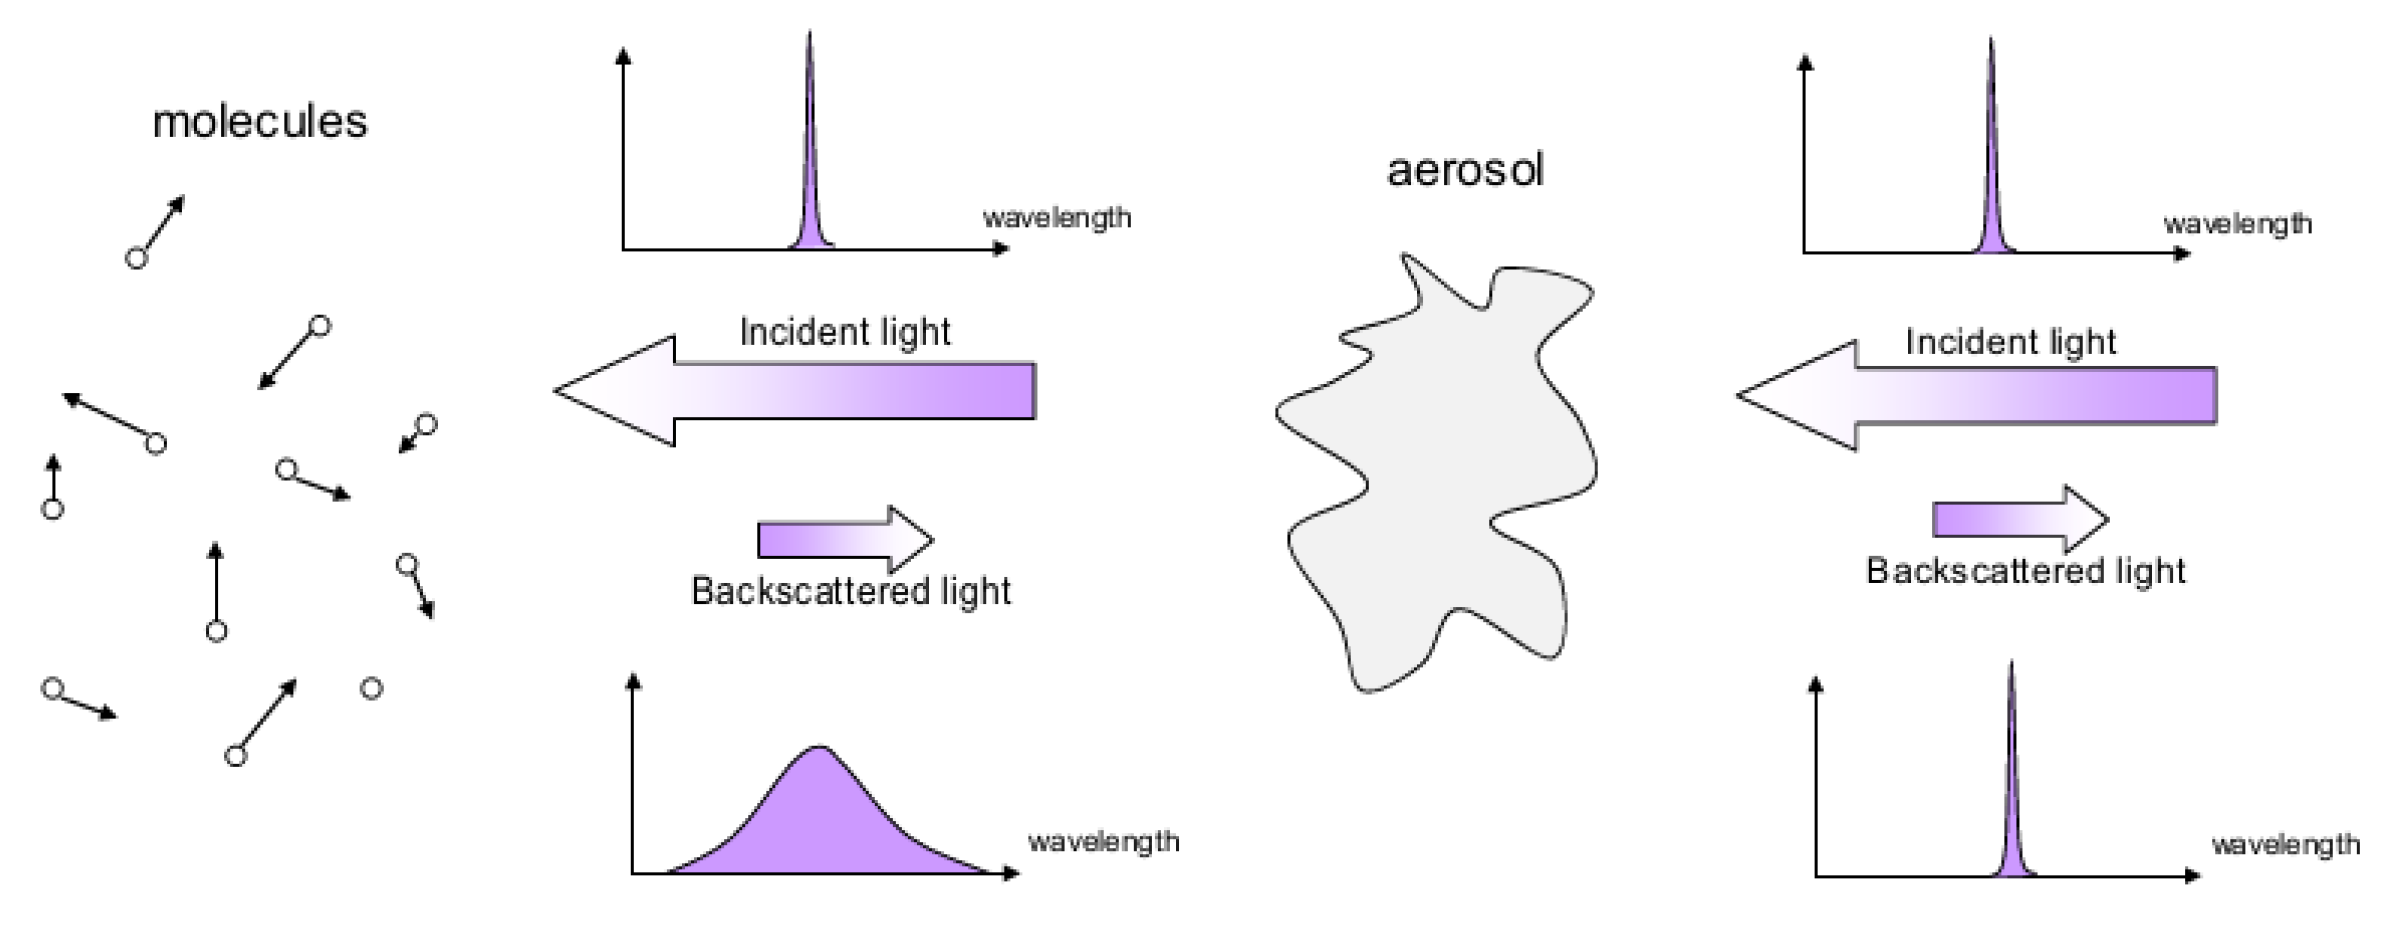
2. ATLID Measurement Principle

ATLID is a high spectral Resolution LIDAR (HSRL), operating in the ultraviolet spectral domain (355 nm), which takes advantage of the distinct interactions of light with molecules and aerosols that lead to different spectra scattering effects. Whereas the Brownian motion of molecules induces a wide broadening of the incident light spectrum, the scattering with an aerosol does not affect the spectral shape of the incident light. Consequently, a simple means of separating the backscattering contributions of aerosols and molecules consists of filtering the backscattered spectrum with a high spectral resolution filter centred on the laser emitted wavelength. In this way the instrument is able to separate the relative contribution of aerosol (Mie) and molecular (Rayleigh) scattering, which allows the retrieval of the aerosol optical depth. Co-polarised and cross-polarised components of the Mie scattering contribution are also separated and measured on dedicated channels. While CALIPSO is missing the HSRL capability to determine directly the extinction-to-backscatter ratio, Aeolus is not equipped to determine the particle depolarisation ratio. Therefore, ATLID will allow for the first time aerosol typing (e.g., smoke and dust) based on measured intensive particle properties. The operating wavelength in the UV spectral range was selected as the molecular scattering is high enough to measure more accurately extinction profiles and aerosols/thin clouds thickness and because laser technology (Nd:YAG laser with frequency tripling conversion) is available for operation in this spectral region. Additionally, eye safety versus field of view dimension were also taken into consideration for the selected operational wavelength.
As displayed in Figure 3, ATLID measures atmospheric profiles, in a direction close to the nadir, with a vertical resolution of about 100 m from ground to an altitude of 20 km, and of 500 m from altitude 20 km to 40 km. The instrument transmitter emits short laser pulses with a repetition rate of 51 Hz, corresponding to about 285 m spatial sampling for a local accumulation of two shots, along the horizontal track of the satellite. Atmospheric, backscattered photons are collected by ATLID receiver using a 620 mm diameter telescope.

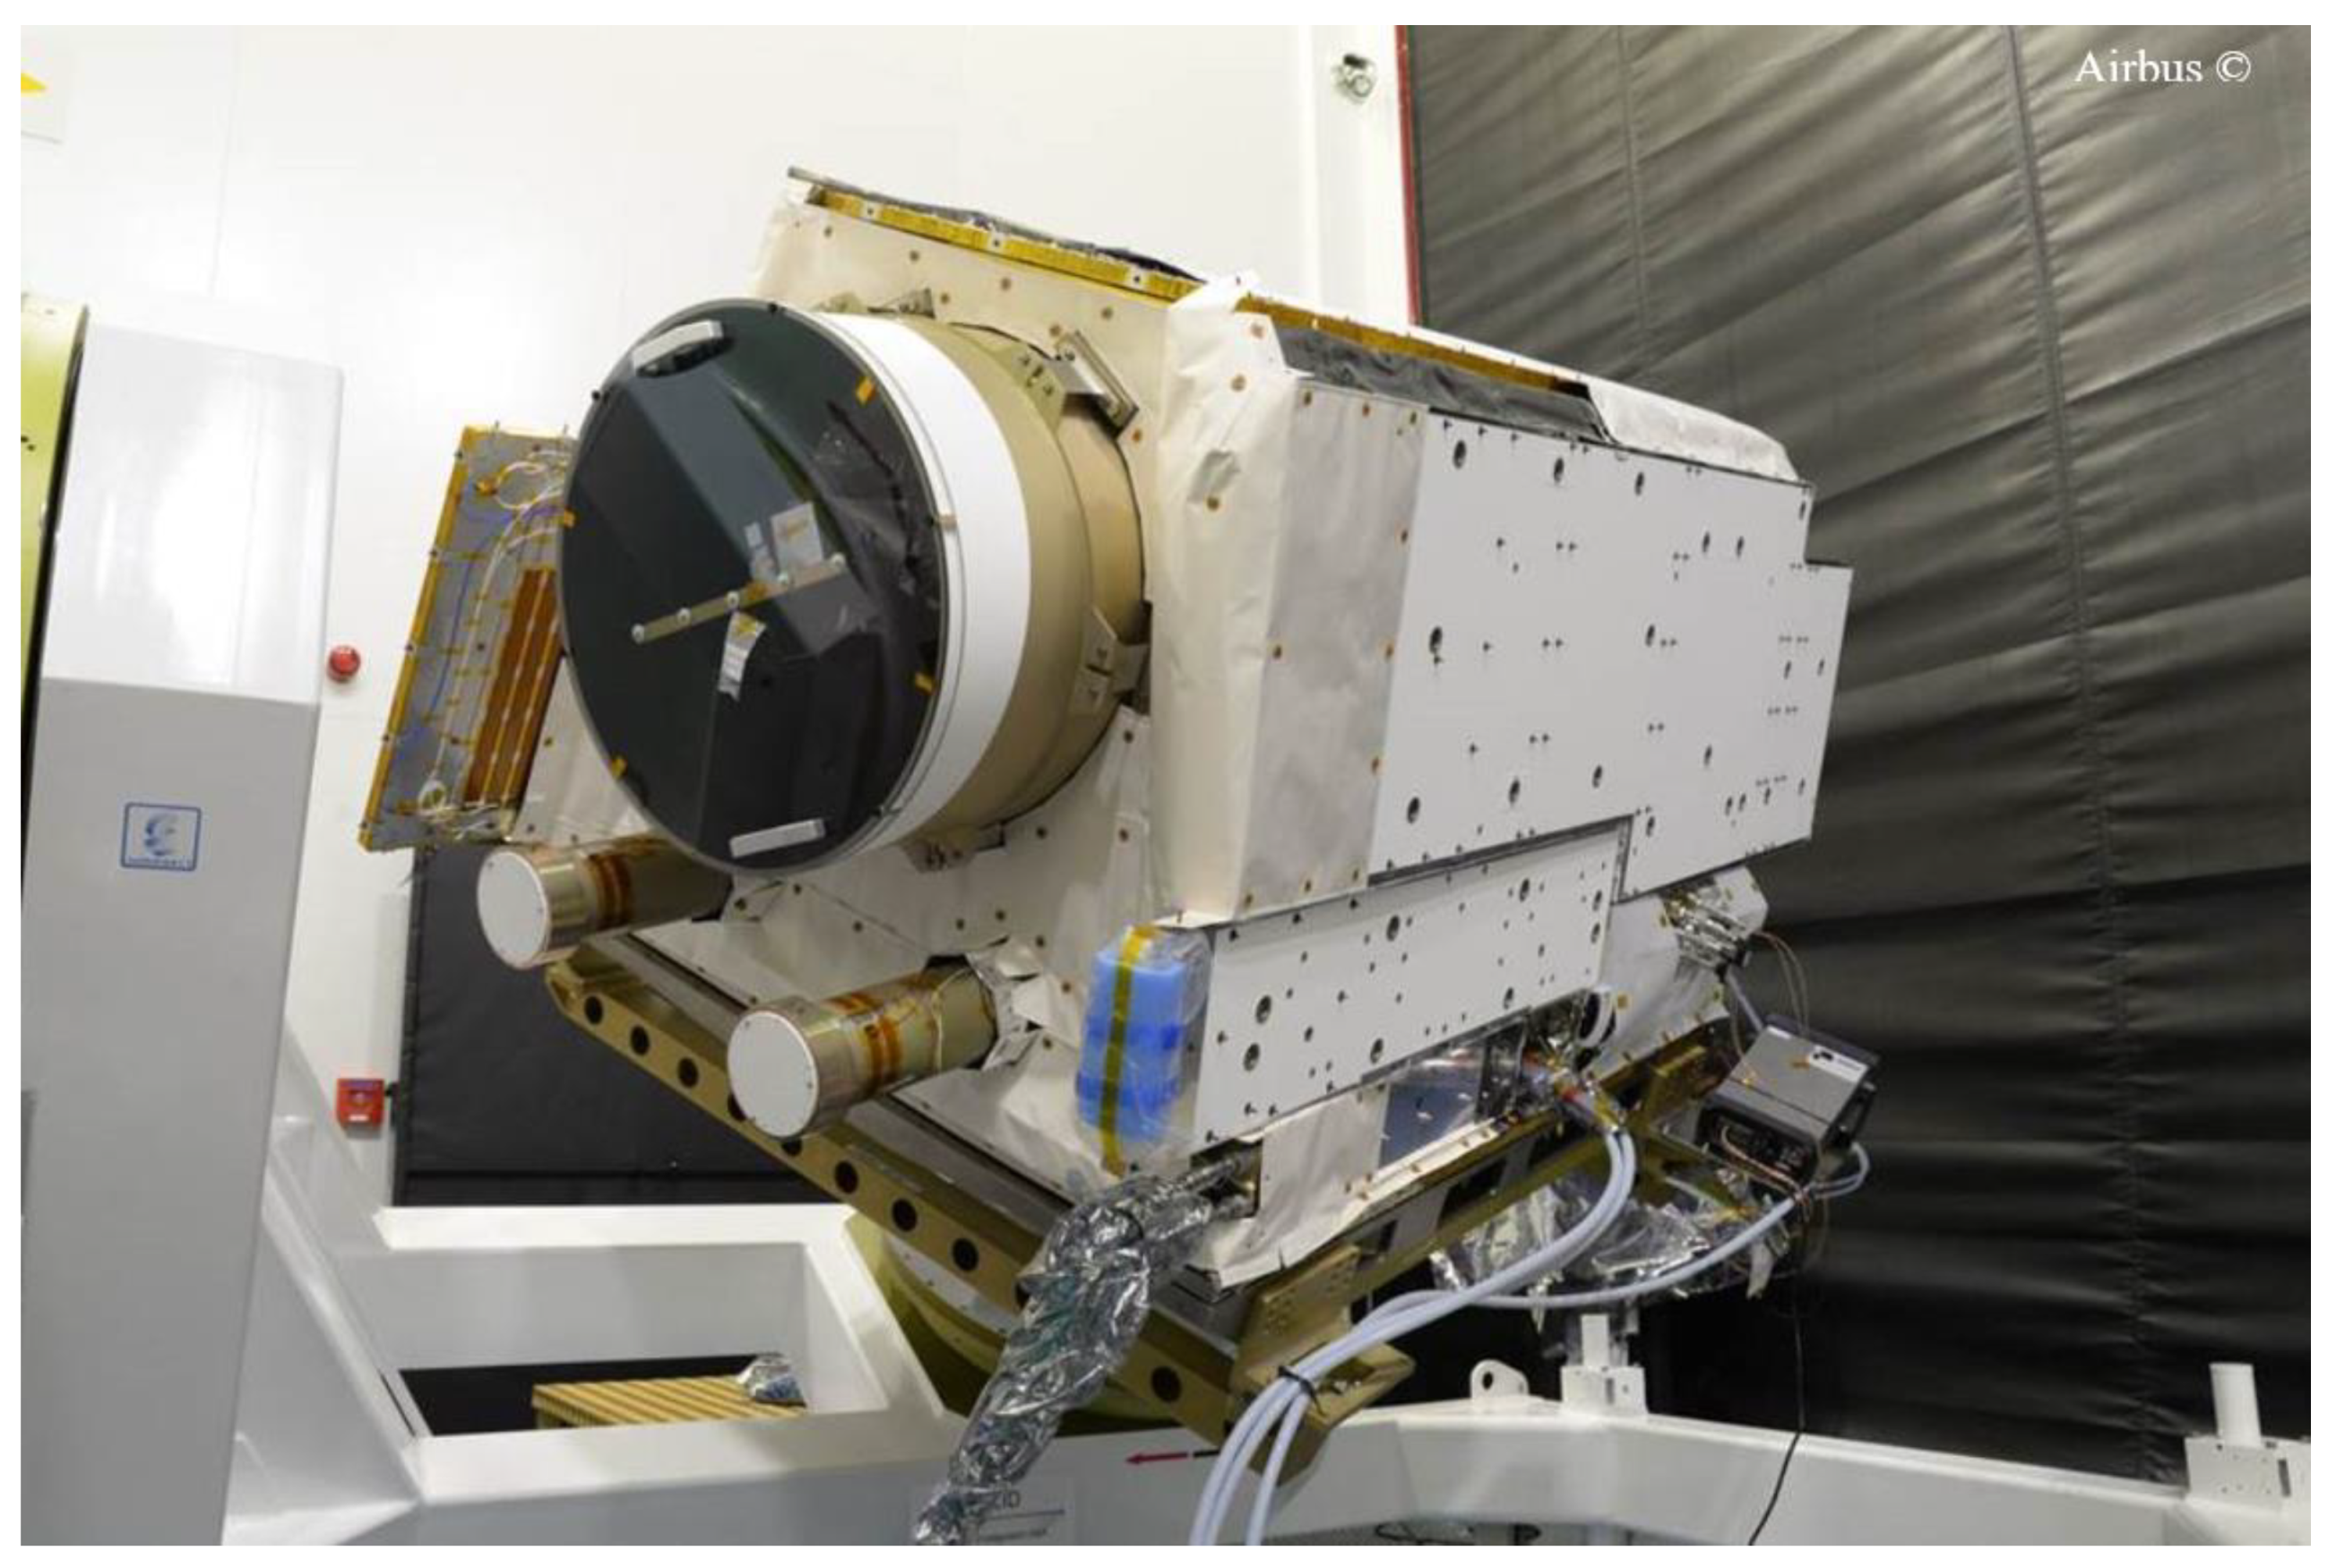
3. ATLID Instrument Design

Airbus Defence and Space in Toulouse was responsible for the design, assembly and test of ATLID. The instrument was designed as a self-standing instrument, as seen in Figure 4, thereby reducing the mechanical coupling between instrument/platform interfaces and allowing better flexibility in the satellite integration sequence.
ATLID instrument development is based on a proto-flight model (PFM) approach: critical sub-systems such as laser transmitter, beam expander, beam steering mechanism and detector front-end have been subject to specific efforts in terms of early breadboards, electrical models or qualification models to minimise risks. The instrument is based on a bi-static architecture consisting of two independent main sections, the emitter chain and the receiver chain. ATLID functional architecture can be seen in Figure 5.
On the emitter chain, the Transmitter Assembly (TxA), designed and manufactured by LEONARDO (Pomezia, Italy), is the laser source for the ATLID LIDAR. It comprises a power laser Head (PLH), seeded via a fibre optic by a reference laser head (RLH), and its associated transmitter laser electronics (TLE). There are two fully redundant transmitters (in cold redundancy), each including both laser heads (PLH and RLH) and electronics (TLE). The PLH design is based on a diode-pumped tripled Nd:Yag laser, providing a high energy pulse at 355 nm. In the nominal measurement mode it is operated in steady-state mode with 51 Hz pulse repetition frequency (PRF). While the laser transmitter is largely inheriting from the Aladin instrument development for the AEOLUS mission [15], a significant evolution has been achieved by the fact that the ATLID PLH is sealed and pressurised in order to improve its tolerance to laser-induced contamination. Both TxA flight models, nominal and redundant units, demonstrated compliance with the main requirements: pulse energy >35 mJ, pulse duration <35 ns and laser beam divergence < 300 µrad (<45 µrad after Emission Beam Expander).
At the heart of the receiver chain the High Spectral Resolution Etalon (HSRE), developed by RUAG Space (Zurich, Switzerland), differentiates and filters the Mie and Rayleigh components of the backscatter signal, routing these (including splitting co-polarised from cross polarised light) towards the relevant detection channels. The key performance requirement of the HSRE is achieving high UV transmittance on the Mie co-polarised channel with a full-width-half-maximum (FHWM) of 0.3 pm. The unit concept is based on a Fabry-Perot (FP) etalon, used in combination with polarisation beam-splitters (PBS) and quarter-wave plates. The Fabry-Perot etalon acts as a filter, transmitting only the narrow Mie signal and reflecting the wider Rayleigh signal.
The instrument implements a co-alignment control loop, making use of a Beam Steering Mirror (BSM) at transmitter chain level and a Co-Alignment Sensor (CAS) at receiver chain level, in order to track and ensure that the emitted laser beam is aligned with the receiver field of view. This active alignment approach allows to correct for structural, thermo-elastic deformations that could be expected after launch or in orbit.

4. ATLID Performance Test Overview

4.1. Performance Verification Approach

The LIDAR performance verification consists of the analysis of recordings of the instrument receiver response to an atmospheric echo simulation and of the validation of instrument transmitter characteristics. The LIDAR instrument is tested in ambient for all performances that are not sensitive to air to vacuum effects: timing calibrations, detection alignment and functional operations, such as receiver to transmitter co alignment functions (Figure 6 right). Then final tests are performed in a thermal vacuum test chamber (Figure 6 left), where real flight conditions are reproduced; in this way performance is evaluated according to actual thermal control stability. Also, vacuum conditions can affect optical coating phase shifts, change their characteristics and impact instrument performance.
A limited set of key performance indicators are also measured at various stages of the satellite campaign on ground (in ambient conditions), in order to check the performance health of the ATLID, for instance upon delivery, after integration onto the satellite platform, before and after tests at satellite level. A dedicated in vacuum check of performance is also made during the satellite level thermal vacuum campaign.

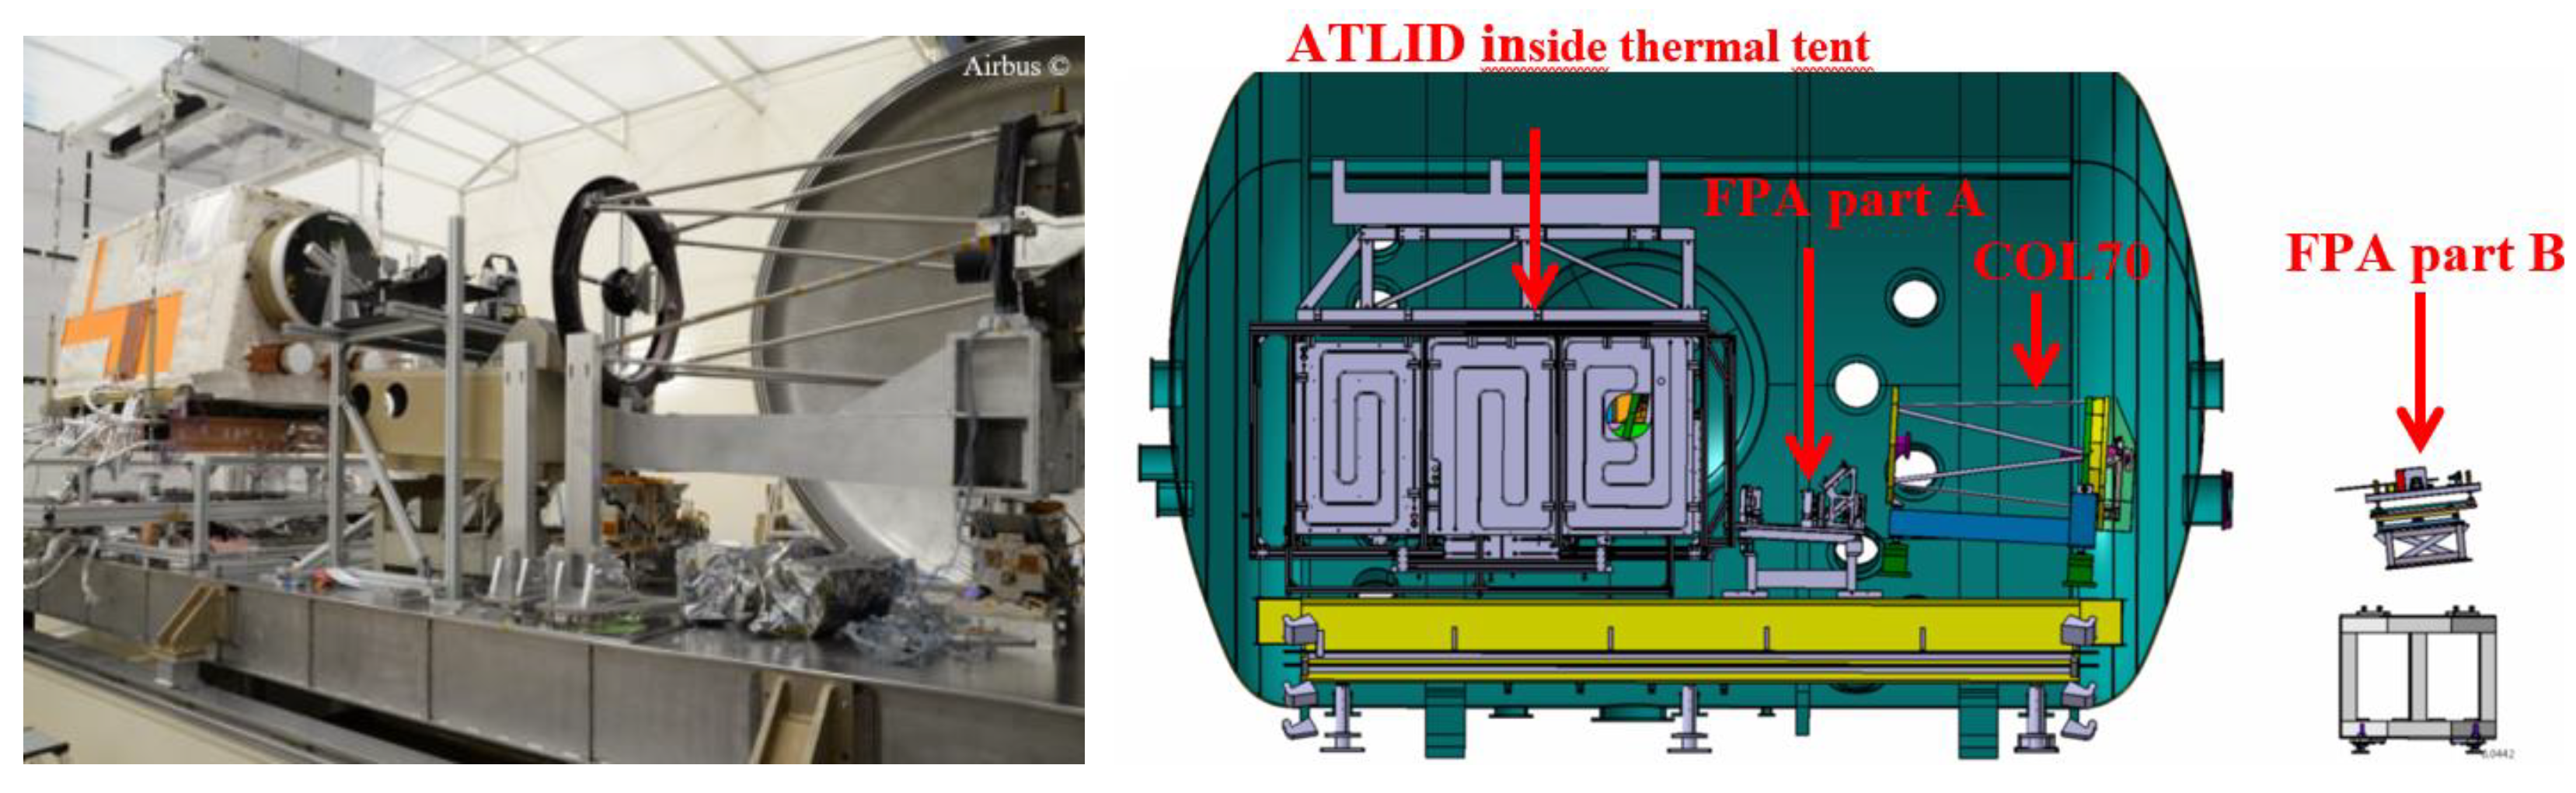
4.2. Receiver Measurement Setup

The instrument’s high sensitivity to the simulated echo characteristics shall be discriminated from the possible bias or instabilities of the test setup. The simulated echo source is a tuneable laser coupled to an optical system that control its divergence, line of sight, wavelength, polarisation and pulse timings. Any uncontrolled variation of these parameters will induce a performance variation that will degrade the test accuracy.
The measurement setup used for the instrument characterisation is shown in Figure 6. It transmits a beam of the simplified atmospheric echo:
  • Generated by a frequency-tripled, Nd:YAG, narrow-band Optical Ground Support Equipment (OGSE), UV laser (source-pack outside the vacuum chamber), which is fibre-coupled;
  • Through part B of OGSE FPA (OGSE multi-purpose focal plane assembly, outside the vacuum chamber, detailed in Figure 6), which allows for laser beam parameters adjustment, including polarisation, line-of-sight and radiometric level, and then free path;
  • Through OGSE collimator COL70 (70 cm diameter, inside the vacuum chamber); up to ATLID telescope input.

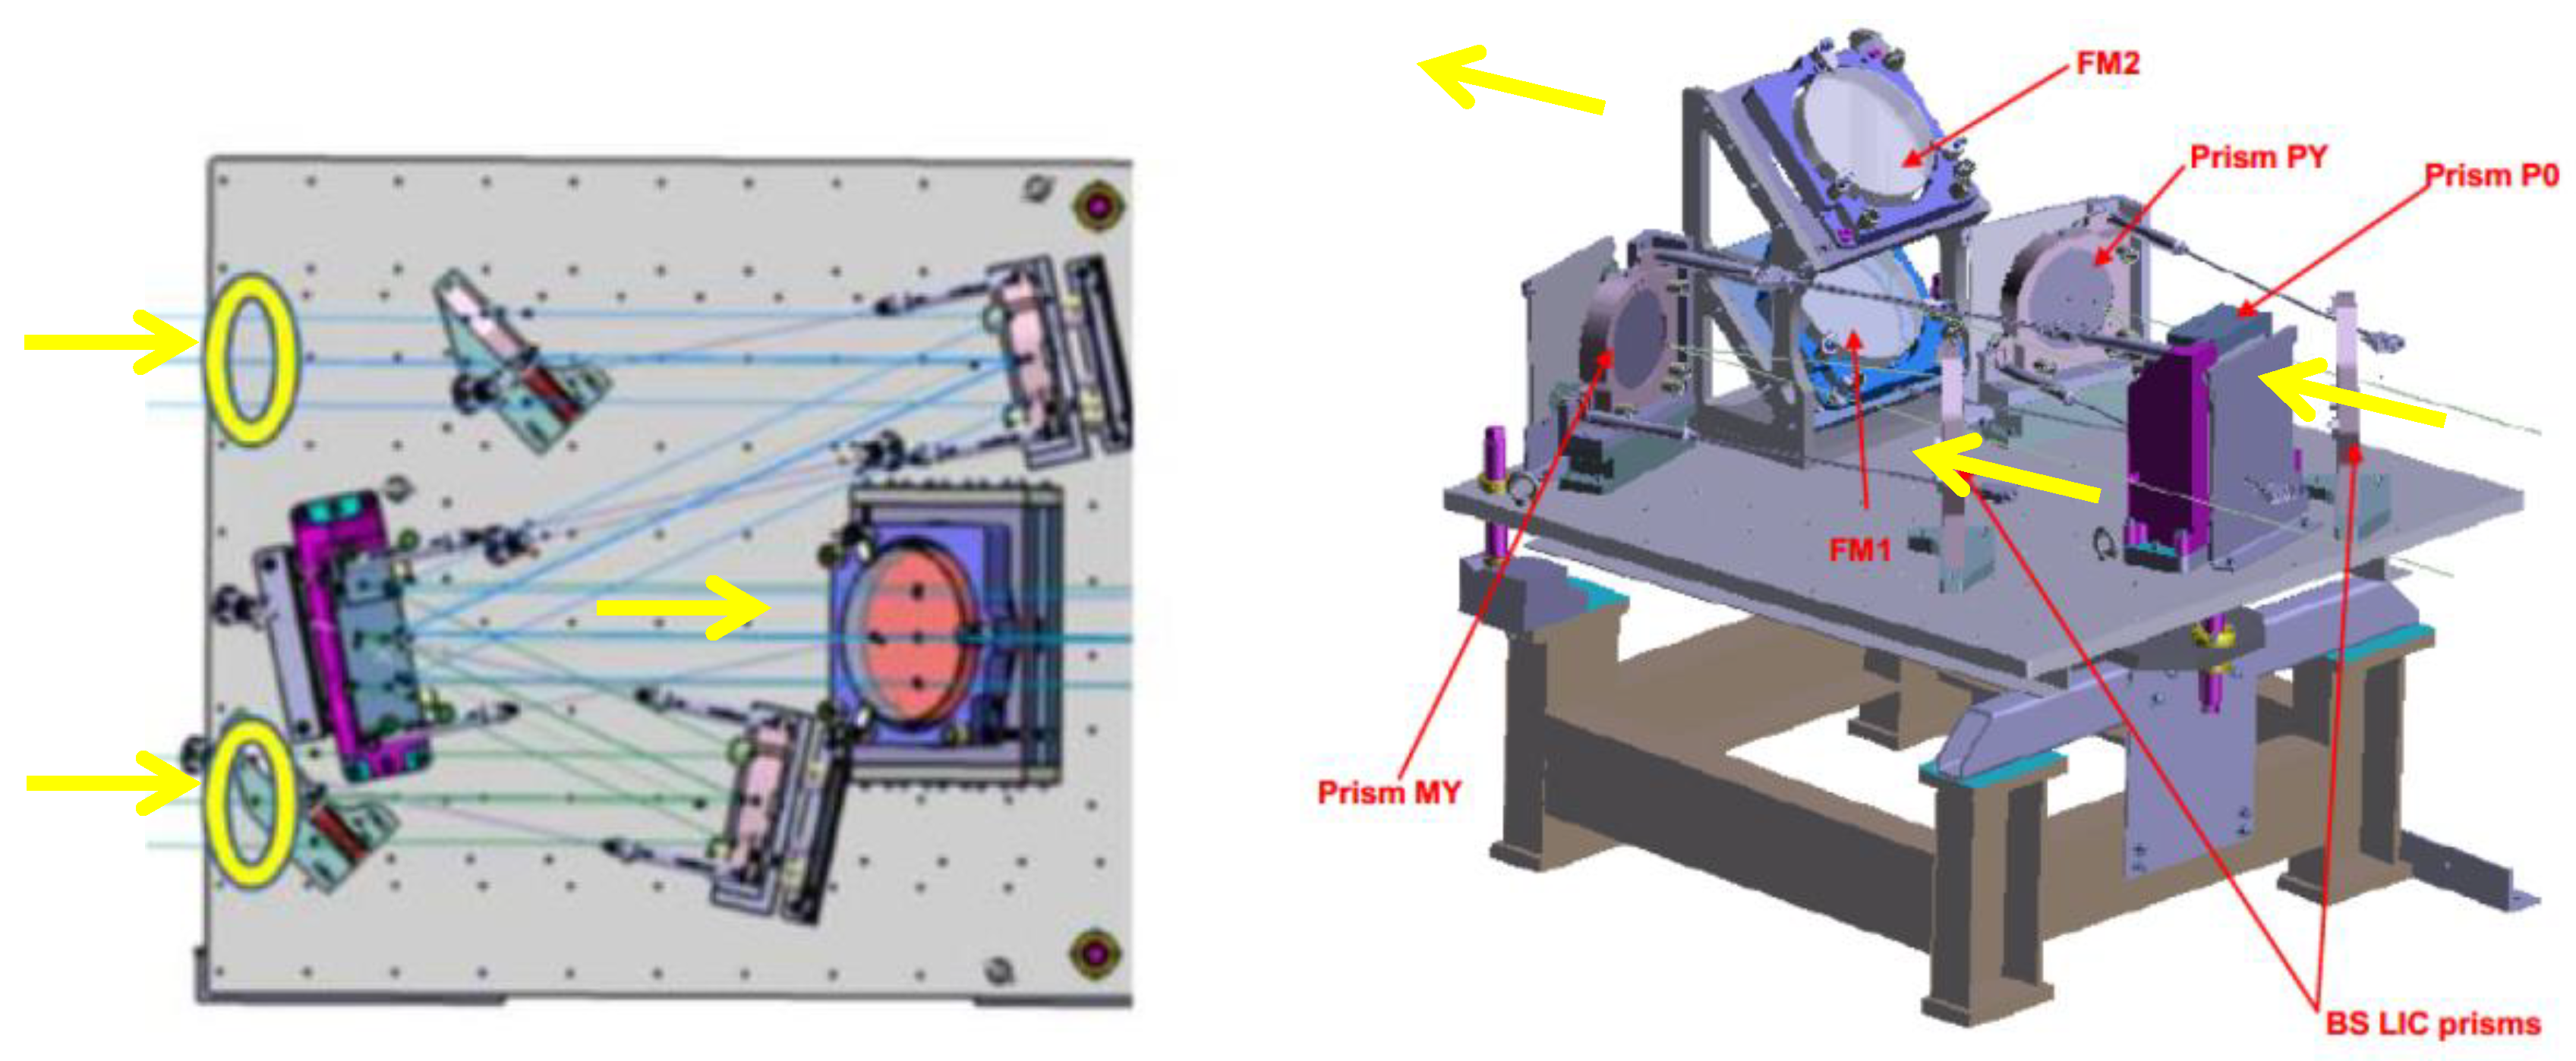
4.3. Transmitter Measurement Setup

The two ATLID emitters have been characterised in terms of:
(1)
Laser pulse energy;
(2)
Laser beam divergence.
The additional measurement setup used for the characterisation is shown in Figure 7 and indicated with FPA part A in Figure 6 (left). It can collect the radiation from both nominal and redundant lasers (yellow circles) into single path toward COL70 inside the vacuum chamber. Laser A beam (bottom circle) is reflected on front side of P0, while laser B beam (top circle) is going through prism P0 and is reflected on back side. The wedge angle of this prism is sufficiently large to avoid any parasitic images within the FF (Far Field) image pattern (<100 µrad). A camera system is placed at the output of COL70 system, outside the vacuum chamber on FPA part B, as per Figure 6.

5. Test Results

5.1. Transmitter Test Results

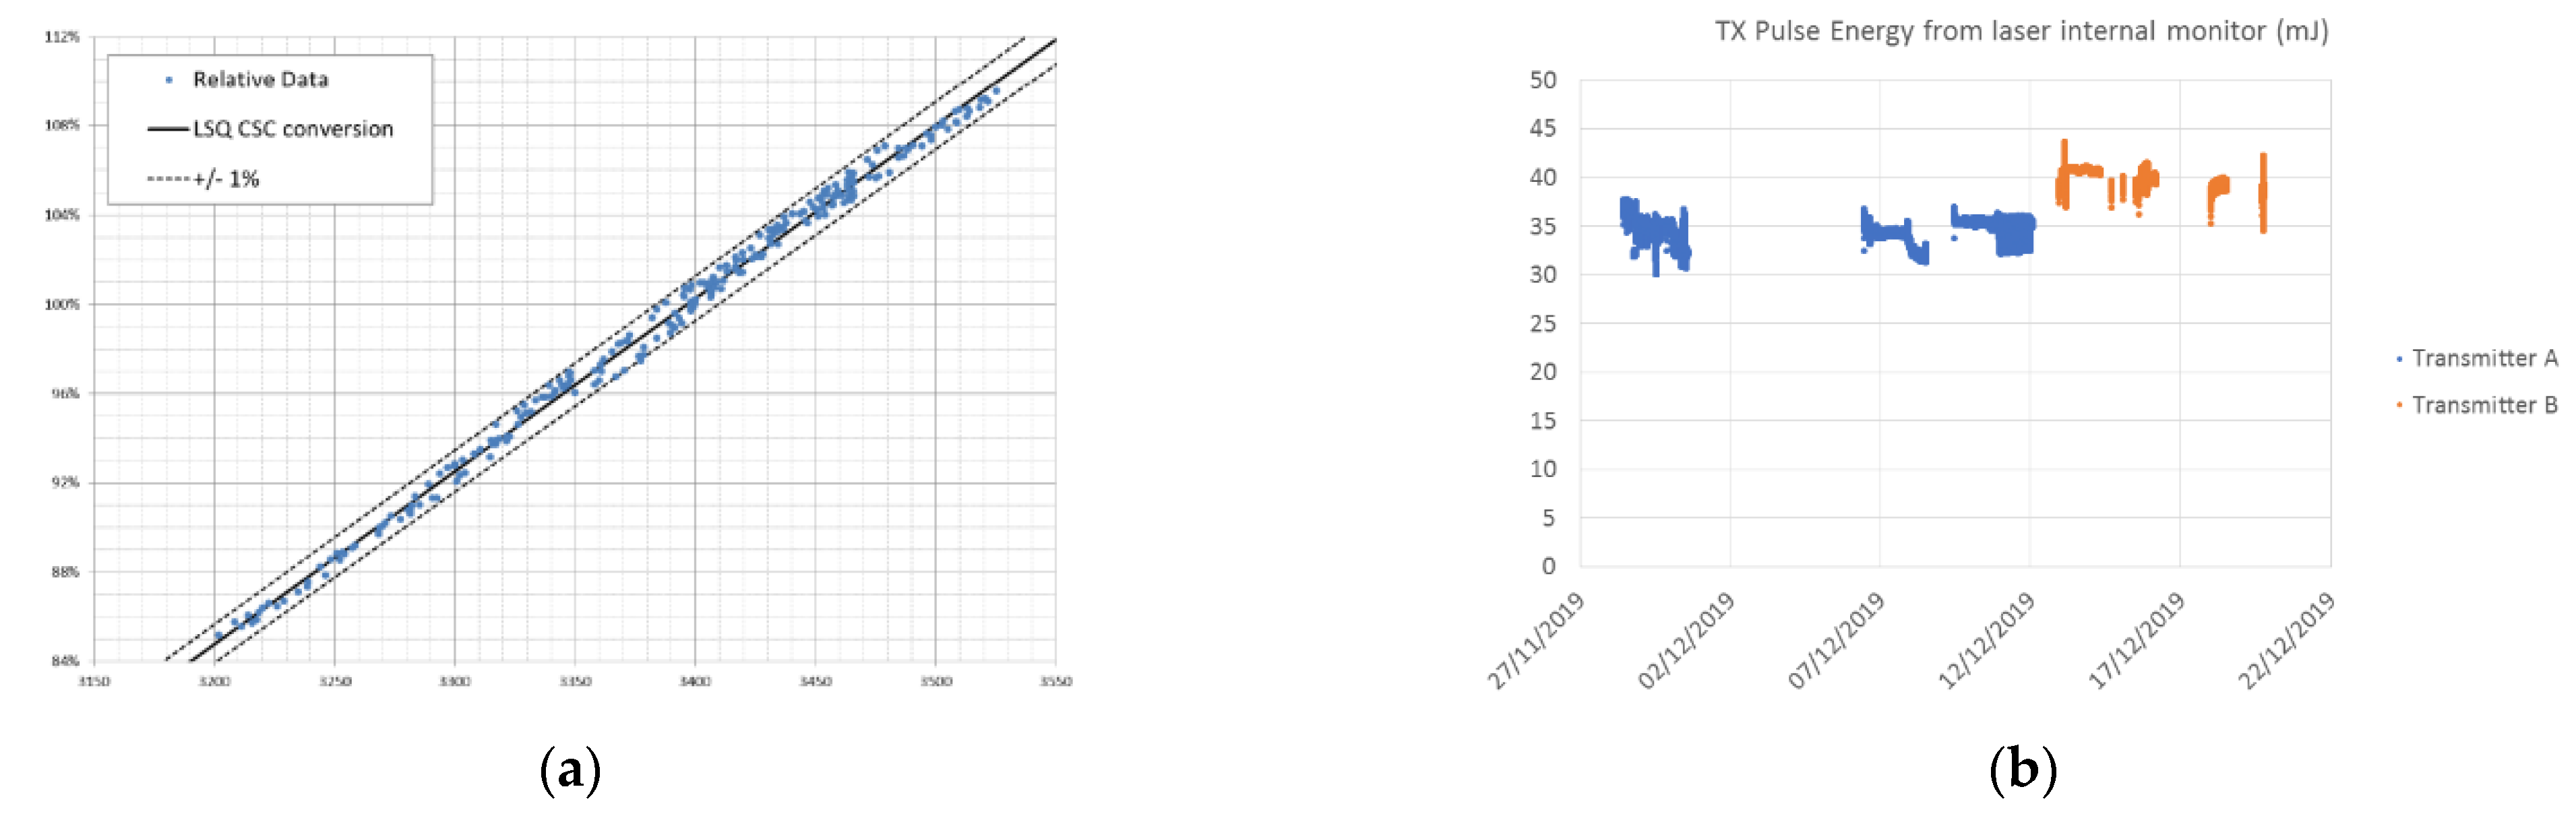
5.1.1. Laser Pulse Energy

The objective was to estimate the energy knowledge via the internal laser photodiode monitoring. To this purpose, the absolute energy was measured before Thermal Vacuum (TVAC) test, acquiring the entire laser beam spot. For TVAC test two additional photodiodes were installed and calibrated on the OGSE, one on its main bench (FPA part B) and one inside the vacuum chamber behind a partially reflective mirror (FPA part A). These two sensors aimed at providing a measurement reference external to the laser, all along the laser optical path, during the whole TVAC test.
An example result of the telemetry calibration is shown in Figure 8a. Figure 8b shows the overall, internal photodiode reading during the entire test, for both emitters: energies between 35 and 40 mJ were reached.

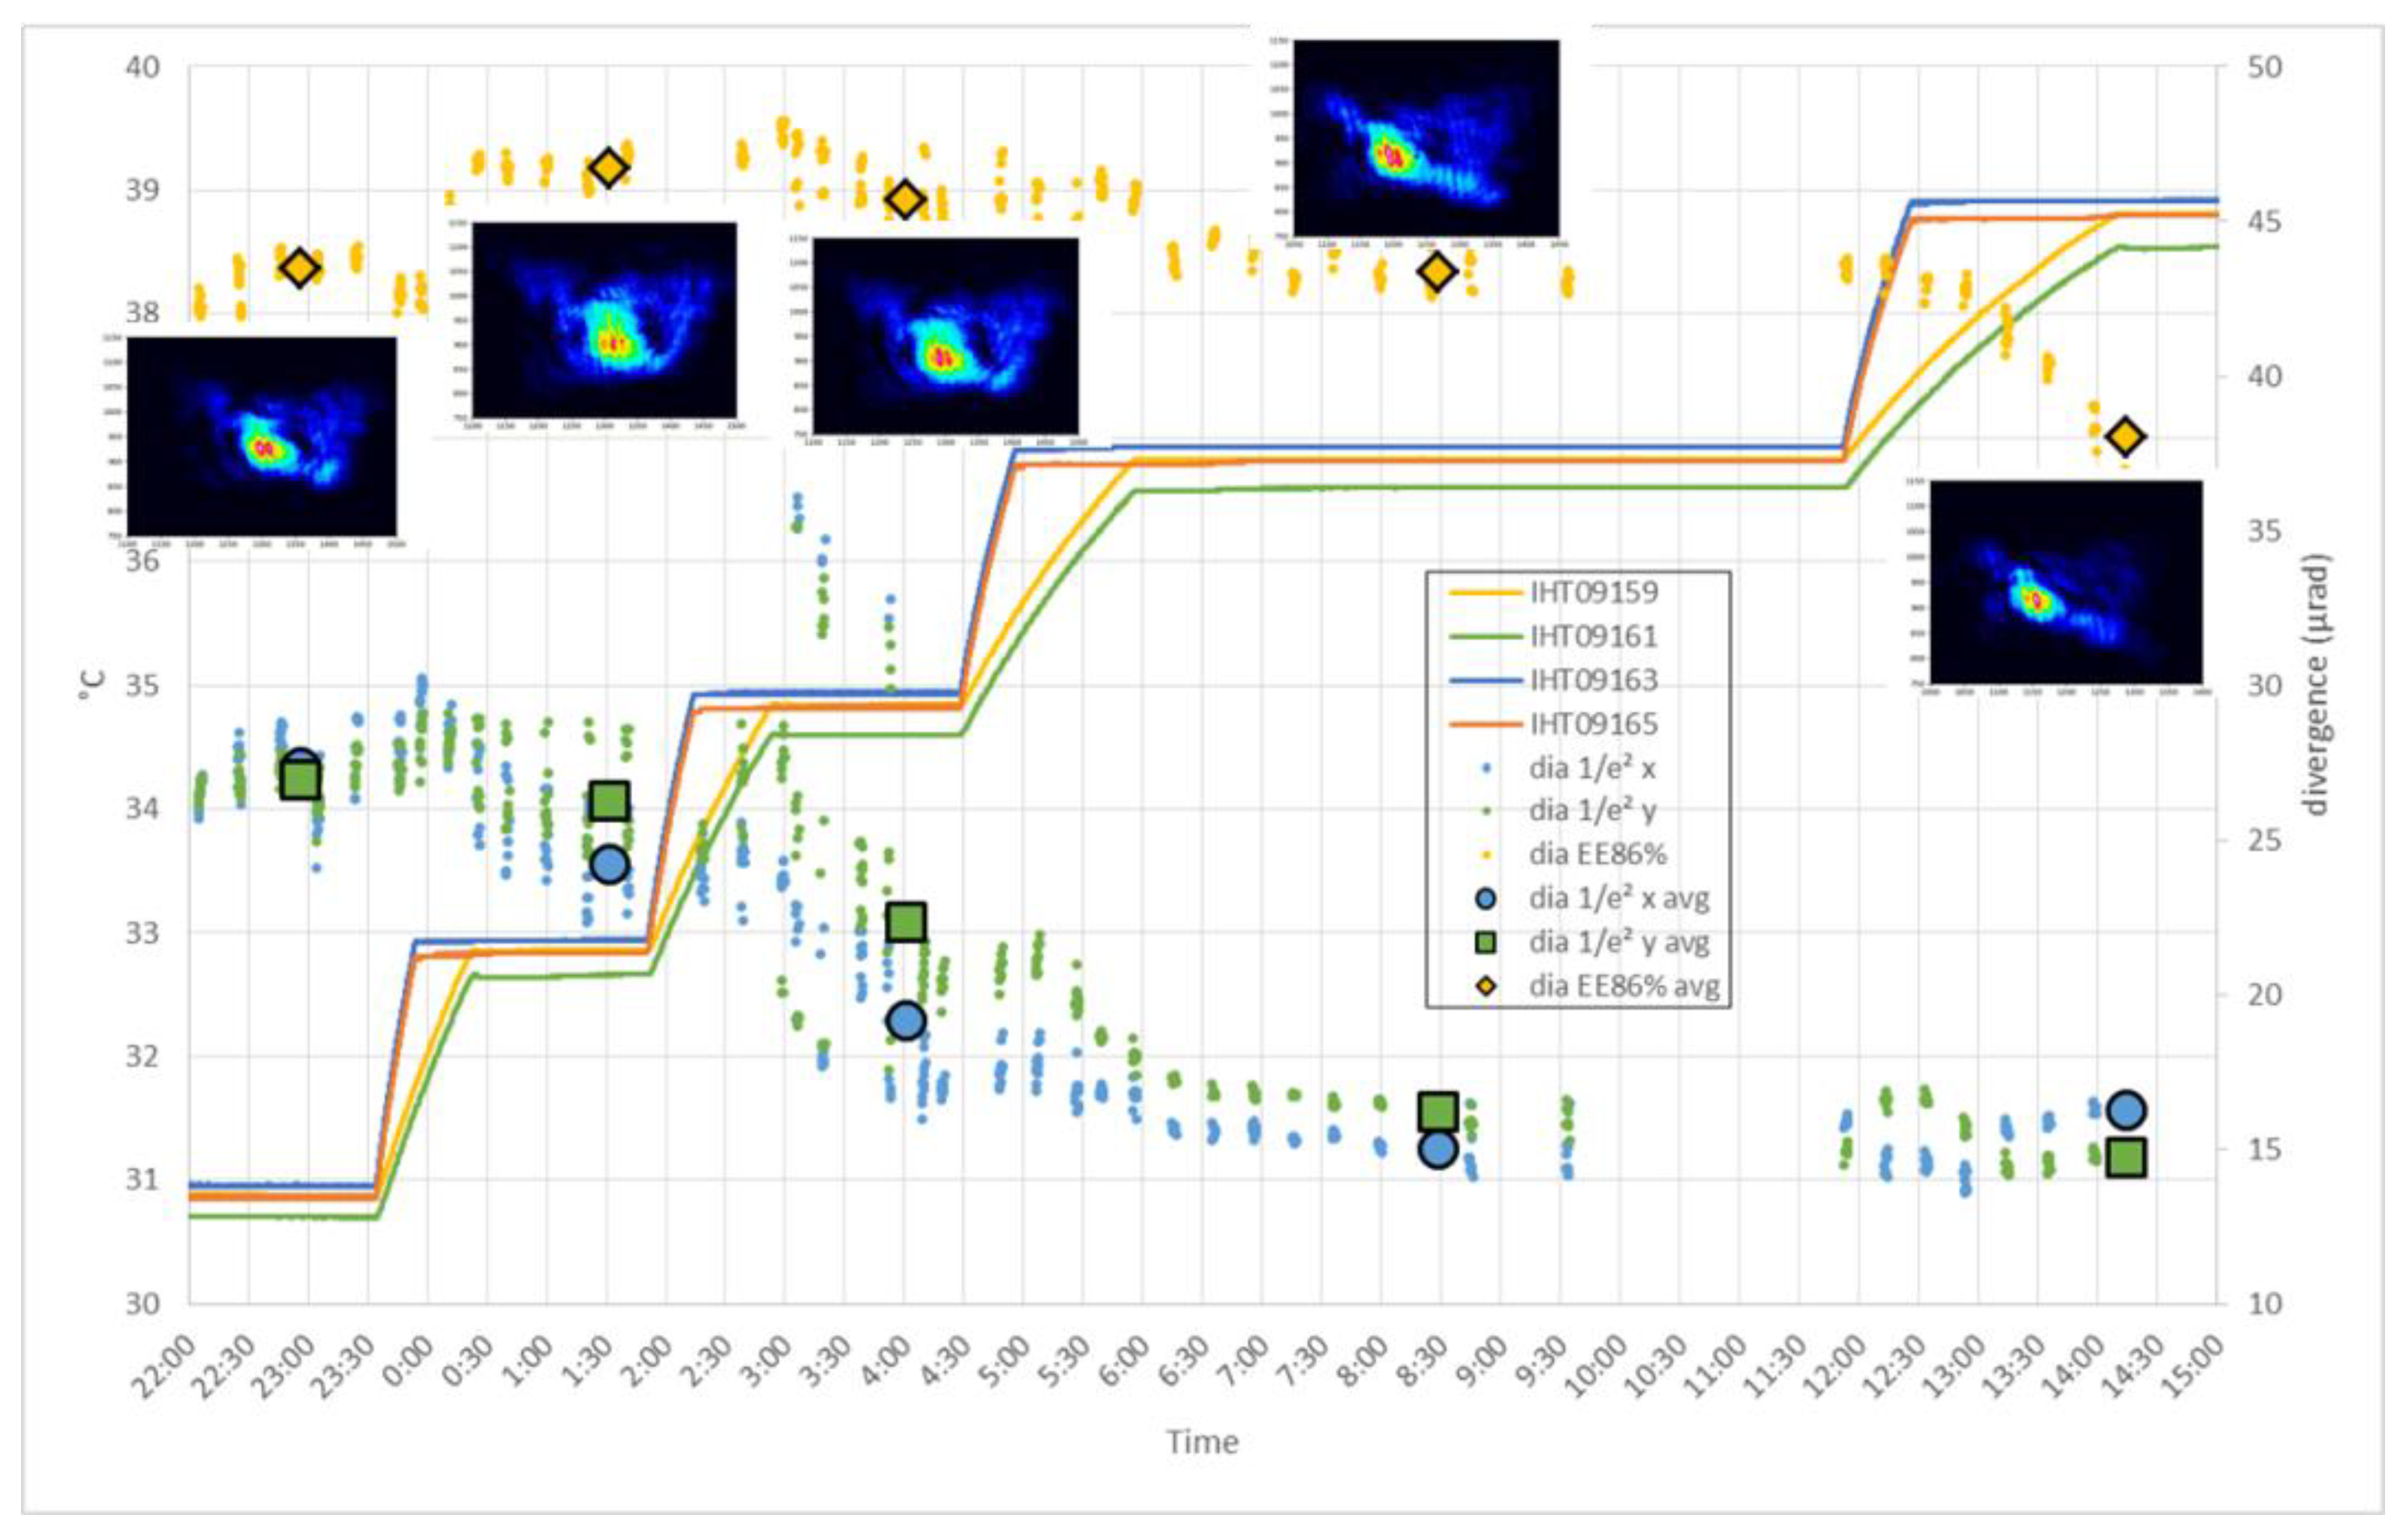
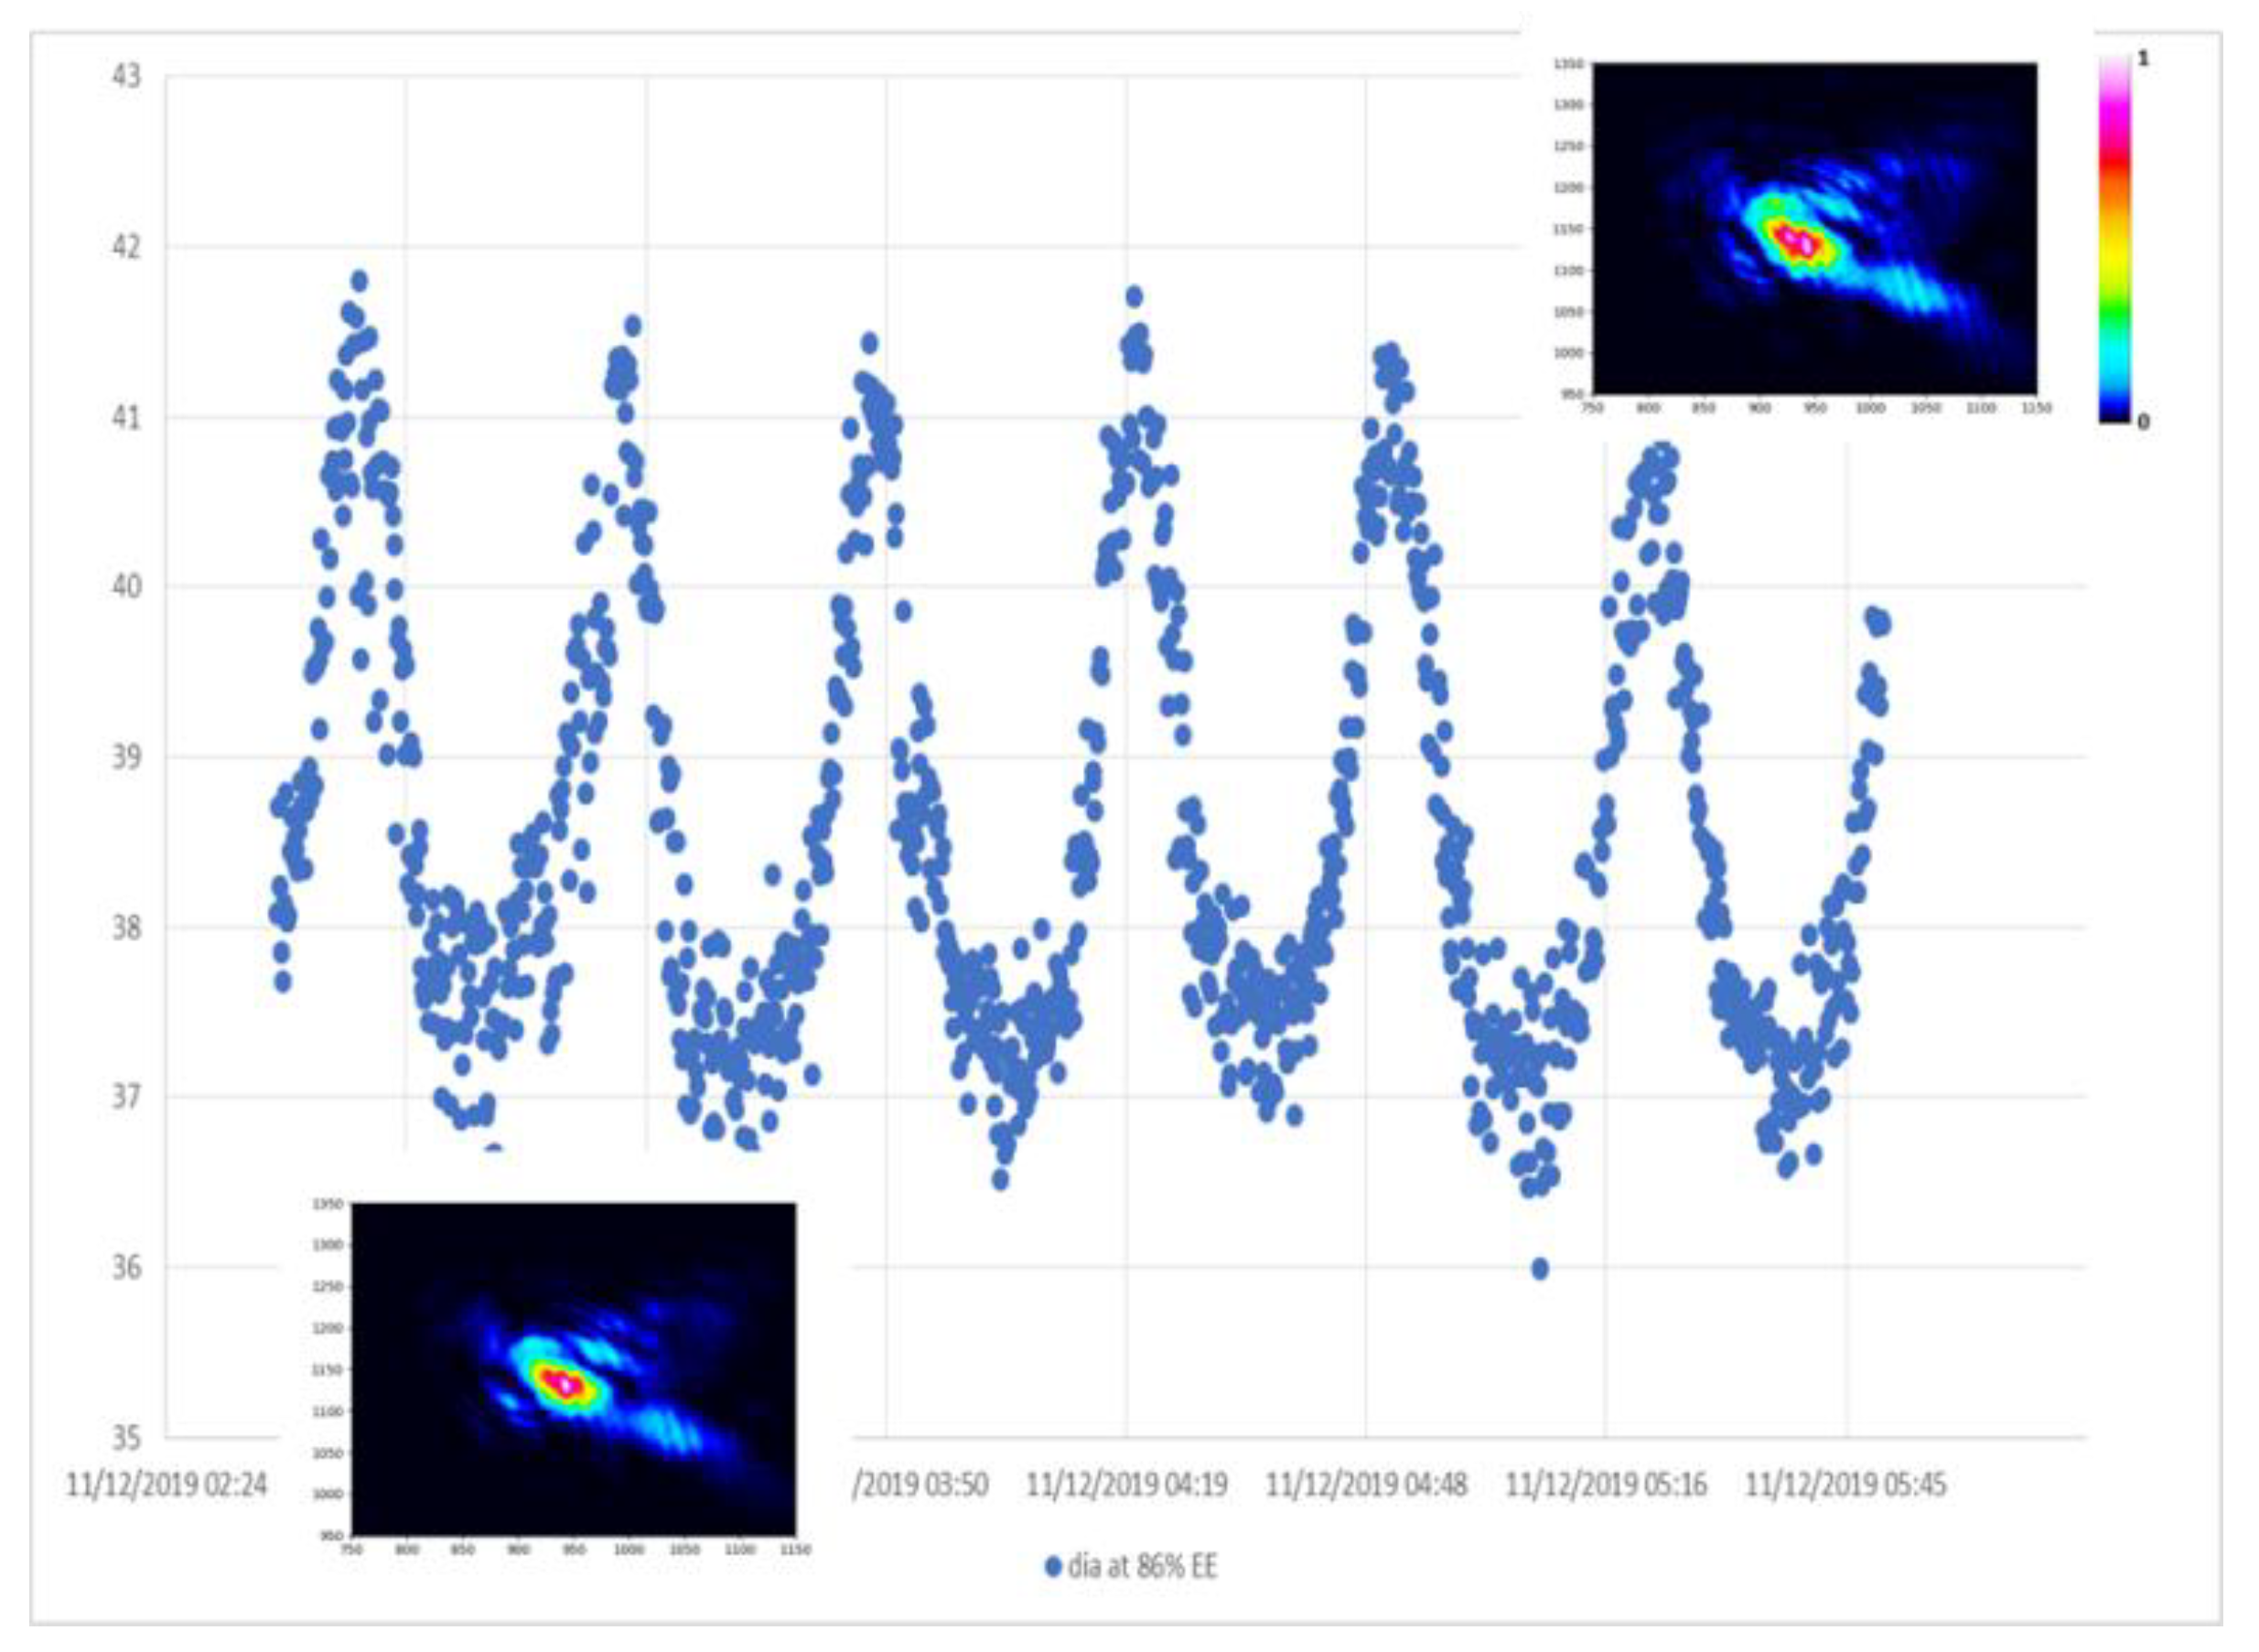
5.1.2. Laser Beam Divergence

With this test a measurement of the far field pattern (FFP) of the emitted laser beams was performed, thanks to the imaging capability of the COL70 collimator OGSE. The measurements were performed in vacuum, collecting OGSE images on a shot-to-shot basis (instantaneous FFP). Post processing averaging was done to compute integration over an equivalent of 10 km horizontal span. Additional measurements were also done to verify the capability to thermally adjust the external beam expander (EBEX) defocus and to quantify the thermal sensitivity; in this second phase, emission defocus calibration (EDC) mode is commanded, inducing a slow scan of EBEX temperature. A special test procedure is used to optimise the number of steps (down to 4 or 5 steps) for this ground test, in order to reduce test duration compared to a finer stepping in flight.
Figure 9 shows the far field measurement results during EDC; as expected, the divergence is in the 15–45 µrad range (with angular resolution lower than 2 µrad and accuracy within ±5 µrad). Far field pattern images are reported in the figure in correspondence to the different tests’ EBEX temperatures.
The FFP was also acquired during the simulation of orbital cycle effects, i.e., for a ±1 °C temperature oscillation on the transmitter thermal interface. Figure 10 shows the evolution of encircled energy divergence during about 6 cycles. The FF images corresponding to the minimum and maximum temperatures are reported inside the plot.

5.2. Radiometric Tests

The ATLID receiver has been characterised in terms of:
  • Polarisation
  • Field-Of-View
  • Radiometric stability
  • Dark current

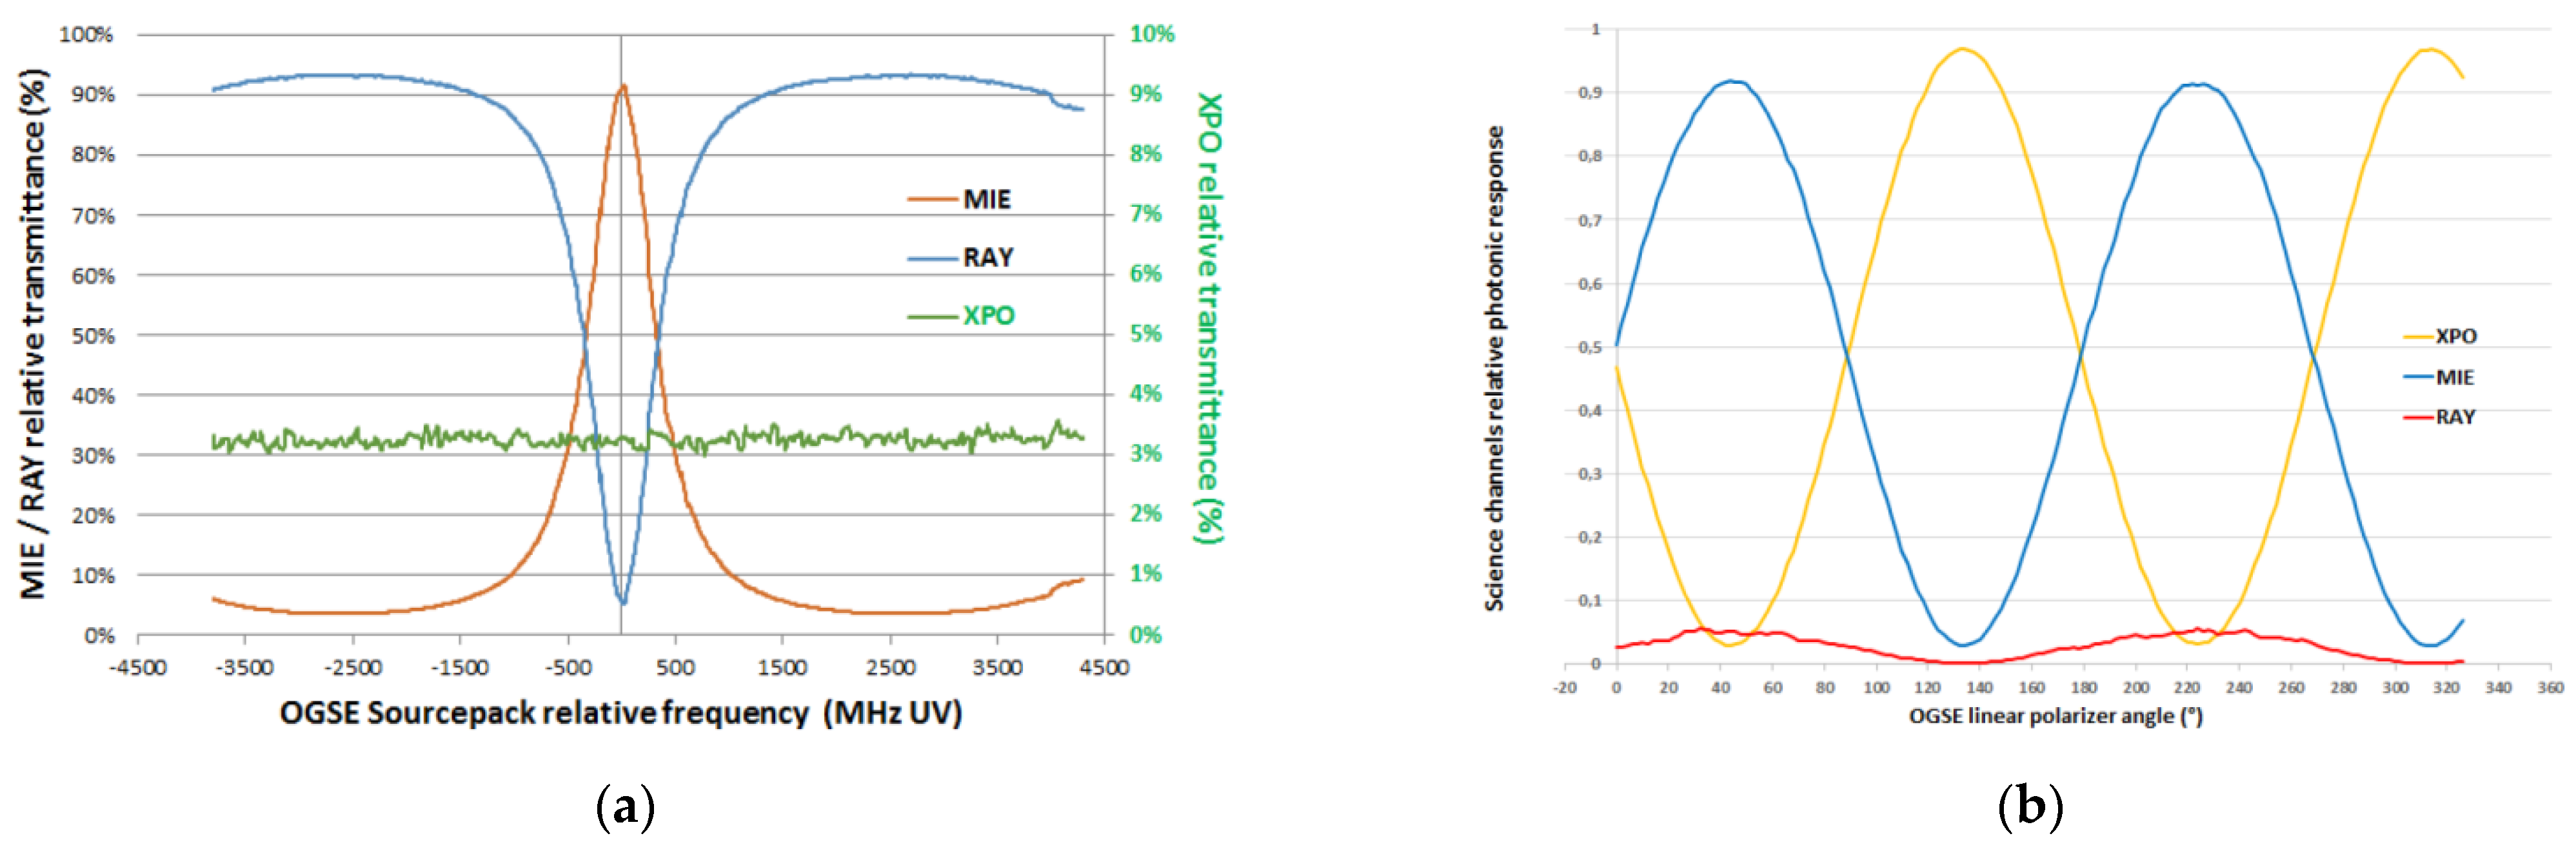
5.2.1. ATLID Receiver Polarisation Characterisation

The objective here was to characterise the response of the ATLID receiver for each of the three channels, for both polarisation axes, and over at least one free spectral range of HSRE. To this purpose, the OGSE (Figure 11) emission line-of-sight is centred in instrument field-of-view, radiometric level is adjusted to be in the instrument measurement dynamic, and:
  • Scans of the OGSE laser wavelength are performed, for vertical and horizontal linear polarisation directions, and the channels’ relative responses are extracted;
  • Rotations of the OGSE beam linear polarisation orientation are performed, for OGSE source-pack laser wavelength set at HSRE response peak, and the channels’ relative responses are extracted.

5.2.2. ATLID Field-of-View Characterisation

The objective here was to evaluate the reception field-of-view angular diameter, in order to assess the collecting solid angle of the instrument. The same test shall also permit to the reference receiver line-of-sight with respect to the co-alignment sensor. To this purpose, the OGSE emission line-of-sight is scanned around the centre of the instrument field-of-view, radiometric level is adjusted to be in the instrument measurement dynamic, and the channels’ responses are extracted and normalised. The angular width of the normalised response gives the angular diameter of the instrument reception field-of-view, as can be seen in Figure 12.

5.2.3. ATLID Radiometric Stability Characterisation

The objective was to characterise the relative instrument response variation for each of the three science channels, with varying environment. To this purpose, the OGSE emission line-of-sight is centred in the instrument field-of-view, OGSE laser wavelength is set at HSRE response peak and the thermal environment in the vacuum tank is managed in order to describe the equivalence of the foreseen orbital thermal cycle. The channels’ signals are extracted and their stabilities during thermal cycle are calculated. As the OGSE frequency drift during the measurement contributes to signal variation during the test, its contribution is calculated and accounted for in the measured radiometric stability assessment, in order to assess the impact of thermal cycle only.

5.2.4. ATLID Dark Current Characterisation

The objective was to record the dark signal map and the dark noise in operational conditions at a −30 °C setpoint for the detector CCD. To this purpose, the OGSE does not emit any signal and ATLID is in dark current calibration (DCC) mode. The output of this test allows filling the calibration database to be provided with the instrument and to be used by the EarthCARE ground processer. The dark noise all along the atmospheric profiles is below the defined 2.2 e- rms success criteria for all channels, validating the ATLID performance model budgeted value.

6. ATLID Performance Update and Flight Prediction Overview

6.1. Performance Analysis

The performance prediction is made using the test results obtained with an artificial, atmospheric echo simulation to reconstruct the instrument performance; as shown above during the instrument testing, no direct atmospheric test is performed. In particular, the test source spectrum is a monochromatic, monomode, longitudinal laser line at 355 nm, while in flight the received backscattered signal spectrum will be broadened by Rayleigh backscattering superimposed onto a variable Mie spectrum line (see Figure 13).
Also, the echo will be partially depolarised by the atmospheric scene; for example, Sahara aerosols can depolarise up to 30% of the polarised light.
The instrument performance model is updated based on the instrument test results shown above. In particular, the receiver channel cross talks are verified and calibrated. This concerns at first the polarisation cross talk characteristic between co polar and cross polar channels that is checked via input beam of pure Co polarisation, or pure Cross polarisation. The spectral cross talk is also confirmed, by verifying the instrument spectrum response of the HSRE. The cross talk correction needs are shown in Figure 14.

6.2. Performance Summary

Table 1 shows the ATLID instrument radiometric characteristics predicted for flight and Table 2 shows the ATLID detection performance.
Table 3 shows the derived ATLID LIDAR performance of backscatter absolute retrieval accuracy, based on the relative retrieval accuracy on each channel and the absolute calibration of the LIDAR constant. The accuracy is given at 10 km altitude, on a 10 km horizontal integration length, for three types of scenes:
  • a sub visible cirrus: faint cirrus at the limit of instrument detection, β = 8 × 10⁻⁷ sr−1 m−1
  • a thin cirrus: β = 1.4 × 10⁻⁵sr−1m−1
  • a depolarisation cirrus: cirrus with 10% depolarisation ratio, βpar = 2.6 × 10⁻⁵ sr−1 m−1 and βper = 2.6 × 10⁻⁶ sr−1 m−1

7. ATLID Verification Closure and Lessons Learnt

Instrument performance verification steps have been completed as shown above. Following the environmental qualification and calibration at instrument level, ATLID has been integrated onto the EarthCARE satellite in March 2020 and will undergo satellite level thermal vacuum testing in 2022.
Lessons learnt from previous LIDAR experience on ALADIN have shown the importance of prediction of the long-term evolution of the laser properties. The lifetime elements of the laser are the 808 nm pump diode aging, the high fluence coatings and the laser housing pressure. The laser diodes have undergone life testing, to demonstrate their longevity in accordance with the requirements of ATLID flight unit ground testing and mission lifetime.
In addition, one other lesson learnt from ALADIN is the verification of the CCD dark current map stability. A “hot pixel” phenomena is observed on ALADIN, whereby random pixels exhibit an elevated signal level, with the number of hot pixels increasing over time [16]; this forces Aeolus satellite to have to compensate the effect with an additional, regular calibration that was not foreseen before flight. ATLID pixel level CCD behaviour has been characterised under flight-like operational parameters and the dark current values do not present the same level of defect, with no hot pixels seen; this is due to a different CCD control sequence, which reduces the time that the charge resides in the CCD by a factor of 10. Nevertheless, the pixel responses will be monitored and checked again once in satellite thermal vacuum operation, where flight dark current value can be recorded with the nominal −30 °C operating temperature.

8. Conclusions

Since the completion of the full instrument assembly in 2019 [9], ATLID has been subjected to an ambient performance test campaign [10,11], followed by a successful environmental qualification test campaign, including performance calibration and characterisation in thermal vacuum conditions. ATLID has been successfully operated as a self-standing instrument and all performance aspects, including transmitter and receiver characteristics, have been found to be in line with targeted expectations and compliant with all major science, in-flight, end of life, performance requirements. This includes under worst case scenarios, where is assumed instrument performance degradation as well as operation in less favourable orbital points regarding sun illumination conditions. The instrument has been delivered to the EarthCARE industrial Prime for assembly and integration onto EarthCARE satellite platform, a task that was completed in May 2020 (Figure 15). Instrument and platform interface verifications are now approaching an end, with the execution of the last performance checks and functional testing at system level. With the completion of the foreseen platform qualification test campaign and flight acceptance review in 2022, the launch of EarthCARE satellite in March 2023, and the first 6 months of in-orbit commissioning phase, ATLID will be ready to start its 3 year long mission, to measure aerosols and thin clouds from space. Data from ATLID is expected to provide a major contribution to the earth observation science community’s understanding of the cloud-aerosol-radiation interaction and Earth radiative balance, and in development of more reliable climate and numerical weather prediction models.

Author Contributions

Formal analysis, investigation, and data curation, T.K., B.C., T.B., P.B.; writing—original draft preparation, J.P.d.C., G.d.V., P.B., T.B., B.C.; writing—review and editing, K.W., K.G., T.K.; supervision, G.d.V., J.P.d.C.; project administration, A.L., K.W., F.C. All authors have read and agreed to the published version of the manuscript.

Funding

This development was funded by European Space Agency, Earth Explorers Programme.

Institutional Review Board Statement

Not applicable.

Informed Consent Statement

Not applicable.

Data Availability Statement

The data presented in this study are available on request from the corresponding author. The data are not publicly available due to commercial reasons.

Acknowledgments

First of all, the authors want to thank their teams for the outstanding dedication and commitment over the last years. The permanent interest from the science community, as well as the support from ESA member states, has been highly appreciated.

Conflicts of Interest

The authors declare no conflict of interest.

References

  1. EarthCARE—Clouds, Aerosols and Radiation Explorer. Available online: http://esamultimedia.esa.int/docs/SP_1279_1_EarthCARE.pdf (accessed on 5 January 2021).
  2. Lefebvre, A.; Hélière, A.; Albiñana, A.P.; Wallace, K.; Maeusli, D.; Lemanczyk, J.; Lusteau, C.; Nakatsuka, H.; Tomita, E. EarthCARE mission, overview, implementation approach and development status. In Earth Observing Missions and Sensors: Development, Implementation, and Characterization IV; International Society for Optics and Photonics: Bellingham, WA, USA, 2016; Volume 9881. [Google Scholar]
  3. Hélière, A.; Wallace, K.; Carmo, J.P.D.; Lefebvre, A. Earth Cloud, Aerosol and Radiation Explorer optical payload development status. In Sensors, Systems, and Next-Generation Satellites XXI; International Society for Optics and Photonics: Bellingham, WA, USA, 2017; Volume 10423. [Google Scholar]
  4. Lefebvre, A. EarthCARE mission: Approaching launch. In Proceedings of the IEEE International Geoscience and Remote Sensing Symposium (IGARSS) 2018, Valencia, Spain, 23–27 July 2018. [Google Scholar]
  5. Wehr, T.; Eisinger, M.; Koopman, R.; Lefebvre, A.; Maeusli, D.; Wallace, K.; Pereira Do Carmo, J.; Livschitz, J.; Maksym, S. Status of ESA’s EarthCARE Mission Preparation. In Proceedings of the IEEE International Geoscience and Remote Sensing Symposium (IGARSS) 2020, Waikoloa, HI, USA, 19–24 July 2020. [Google Scholar]
  6. Illingworth, A.J.; Barker, H.W.; Beljaars, A.; Ceccaldi, M.; Chepfer, H.; Clerbaux, N.; Cole, J.; Delanoë, J.; Domenech, C.; Donovan, D.P.; et al. The EarthCARE Satellite: The Next Step Forward in Global Measurements of Clouds, Aerosols, Precipitation, and Radiation. Bull. Am. Meteorol. Soc. 2015, 1311–1322. [Google Scholar] [CrossRef] [Green Version]
  7. Hélière, A.; Wallace, K.; Carmo, J.P.D.; Lefebvre, A.; Eisinger, M.; Wehr, T. A Development status of the EarthCARE Mission and its atmospheric Lidar. In Earth Observing Systems XXI; International Society for Optics and Photonics: Bellingham, WA, USA, 2016; Volume 9972. [Google Scholar]
  8. Carmo, J.P.D.; Chassat, F.; Hélière, A.; Toulemont, Y.; Lefevre, A. ATLID, ESA atmospheric lidar: Manufacture and test results of instrument units. In Proceedings of the International Conference on Space Optics (ICSO) 2016, Biarritz, France, 18–21 October 2016. [Google Scholar]
  9. De Villele, G.; Carmo, J.P.D.; Helière, A.; Lefebvre, A.; Barbaro, L.; Belhadj, T.; Chassat, F.; Corselle, B.; Evin, R.; Feral, M.; et al. ATLID, ESA Atmospheric LIDAR: Integration of instrument and tests. In Proceedings of the International Conference on Space Optics (ICSO) 2018, Chania, Greece, 9–12 October 2018. [Google Scholar]
  10. Carmo, J.P.D.; De Villele, G.; Helière, A.; Wallace, K.; Lefebvre, A.; Chassat, F. ATLID, ESA Atmospheric backscatter LIDAR for the ESA EarthCARE Mission. Counc. Eur. Aerosp. Soc. CEAS Space J. 2019, 11, 423–435. [Google Scholar] [CrossRef]
  11. Pereira do Carmo, J.; Wallace, K.; Lefebvre, A. Flight LIDAR development and qualification for the ESA Earth Cloud Aerosol and radiation explorer (EarthCARE) mission. In Proceedings of the IEEE International Geoscience and Remote Sensing Symposium (IGARSS) 2020, Waikoloa, HI, USA, 19–24 July 2020. [Google Scholar]
  12. Wallace, K.; Hélière, A.; Lefebvre, A.; Eisinger, M.; Wehr, T. Status of ESA’s EarthCARE mission, passive instruments payload, In Earth Observing Systems XXI; International Society for Optics and Photonics: Bellingham, WA, USA, 2016; Volume 9972. [Google Scholar]
  13. Tomiyama, N.; Tomita, E.; Furukawa, K.; Nakatsuka, H.; Seki, Y.; Aida, Y.; Okada, K.; Maruyama, K.; Ishii, Y.; Ohno, Y.; et al. EarthCARE/CPR development status and performance. In Remote Sesning of Clouds and Atmosphere XXV; International Society for Optics and Photonics: Bellingham, WA, USA, 2020; Volume 11531. [Google Scholar]
  14. Domenech, C.; Donovan, D.P.; Barker, H.W.; Bouvet, M.; Lopez-Baeza, E. Improvement of broadband radiance to flux conversion by using the synergy between active and passive remote sensing instruments. In SPIE Remote Sensing, Florence, Italy; International Society for Optics and Photonics: Bellingham, WA, USA, 2007; Volume 6745. [Google Scholar]
  15. Straume, A.G.; Rennie, M.; Isaksen, L.; de Kloe, J.; Marseille, G.J.; Stoffelen, A.; Flament, T.; Stieglitz, H.; Dabas, A.; Huber, D.; et al. ESA’s space-based Doppler wind lidar mission Aeolus—First wind and aerosol product assessment results. In Proceedings of the EPJ Web Conference, Moscow, Russia, 16–20 November 2020. [Google Scholar] [CrossRef]
  16. Weiler, F.; Kanitz, T.; Wernham, D.; Rennie, M.; Huber, D.; Schillinger, M.; Saint-Pe, O.; Bell, R.; Parrinello, T.; Reitebuch, O. Characterisation of dark current measurements of the ACCDs used on-board Aeolus satellite. Atmos. Meas. Tech. Discuss. 2020. [Google Scholar] [CrossRef]
Figure 1. Artist’s view of the EarthCARE satellite in-orbit. Reproduced with permission of European Space Agency.
Atmosphere 12 00076 g001
Figure 2. EarthCARE payload viewing geometry.
Atmosphere 12 00076 g002
Figure 3. ATLID atmospheric measurement principle.
Atmosphere 12 00076 g003
Figure 4. ATLID on trolley after completion of its integration. Reproduced with permission of Airbus ©.
Atmosphere 12 00076 g004
Figure 5. ATLID functional architecture.
Atmosphere 12 00076 g005
Figure 6. ATLID test configuration in vacuum chamber, with FPA (Focal Plane Assemblies) parts A&B and collimator COL70. Reproduced with permission of Airbus ©.
Atmosphere 12 00076 g006
Figure 7. FPA part A, OGSE periscope setup for TxA beam collection into COL70. Reproduced with permission of Airbus ©.
Atmosphere 12 00076 g007
Figure 8. Example of Energy measurements performed during TVAC via the internal laser photodiode: (a) Energy telemetry calibration plotting calibrated detector measurement of emitter energy (y) against internal laser photodiode (x); (b) Overview of Energy measurements during the entire vacuum phase (mJ).
Atmosphere 12 00076 g008
Figure 9. Far field measurement results during EDC; the variation of beam divergence (right scale) is measured and averaged for various EBEX temperatures (thermistor readings on the (left scale)). The yellow diamonds indicate averaged divergence measurements at 86% encircled energy, with associated camera acquired far field pattern images overlaid. The blue circles and green squares indicate averaged measurement, in x and y, of angular width at 1/e2 of maximum. The solid lines indicate thermistor acquired temperature measurements.
Atmosphere 12 00076 g009
Figure 10. Far field measurement results during simulation of orbital cycles (±1 °C on the laser); the variation of beam divergence (left scale, diameter of 86% encircled energy) plotted over time (overlaid, camera acquired far field images).
Atmosphere 12 00076 g010
Figure 11. Example of polarisation measurements performed during TVAC; channels’ relative responses versus: (a) OGSE frequency scan; (b) OGSE linear polarisation rotation.
Atmosphere 12 00076 g011
Figure 12. Example of instrument field-of-view characterisation measurements performed during TVAC; channels’ normalised responses vs. OGSE Line-of-Sight scan.
Atmosphere 12 00076 g012
Figure 13. Illustration of the backscattered spectrum.
Atmosphere 12 00076 g013
Figure 14. Illustration of signal cross talks and need for cross talk corrections.
Atmosphere 12 00076 g014
Figure 15. ATLID integrated on EarthCARE satellite platform. Reproduced with permission of Airbus ©.
Atmosphere 12 00076 g015
Table 1. ATLID radiometric characteristics.
Radiometric CharacteristicsATLIDUnit
Receiver field of view66.5 1µrad
Telescope diameter620mm
Solar background filter equivalent bandwidth710pm
Mie Co Polar transmission EOL 245%
Mie Cross Polar transmission EOL 243%
Rayleigh transmission EOL 243%
(molecular to molecular channel 3) C_mm75%
(molecular to particle channel 3) C_mp25%
(particular to molecular channel 3) C_pm16%
(particular to particular channel 3) C_pp84%
Laser pulse energy35mJ
Pulse repetition frequency51Hz
Transmitter field of view36µrad
Transmitter EOL transmission89%
Transmitter polarisationLinear-
1 value predicted in flight is different from ground measured value due to gravity focusing effects; 2 End of life value without etalon transmission; 3 photo flux ratio characteristics of HSRE.
Table 2. ATLID detection performance.
Detection PerformanceATLIDUnit
Vertical resolution from 0 to 20 km100m
Vertical resolution from 20 km to 40 km500m
Vertical cross talk4.5% on 500 m, 11% on 100 m
Computed quantum efficiency 79/75/79 1%
Linearity<+/−1 2
<+/−2 3
%
Noise worst case2.2e- rms
Dynamic margin on channel vs. predicted worst signal18/5/12 1%
1 (MieCoPo/MieCross/Rayleigh); 2 from 10 e- to the top; 3 from 1 e- to 10 e-.
Table 3. ATLID LIDAR retrieval accuracy.
LIDAR Absolute Backscatter Retrieval Accuracy 10 km Horizontal IntegrationTypical BOLWorst Case EOLUnit
Mie Co Polar on sub visible cirrus: β = 8 × 10⁻⁷ sr−1 m−13148%
Mie Co Polar on thin cirrus: β = 1.4 × 10⁻⁵ sr−1 m−168%
Mie Cross polar on depol. cirrus: β = 2.6 × 10⁻⁶ sr−1 m−11923%
Rayleigh (above cirrus 10 km)1217%
Publisher’s Note: MDPI stays neutral with regard to jurisdictional claims in published maps and institutional affiliations.

