Article

Organic Compounds and Suspended Particulate Matter in Snow of High Latitude Areas (Arctic and Antarctic)

by
Inna A. Nemirovskaya
and
Vladimir P. Shevchenko
*
Shirshov Institute of Oceanology, Russian Academy of Sciences (IO RAS), Moscow 117997, Russia
*
Author to whom correspondence should be addressed.
Atmosphere 2020, 11(9), 928; https://doi.org/10.3390/atmos11090928
Submission received: 17 July 2020 / Revised: 23 August 2020 / Accepted: 24 August 2020 / Published: 30 August 2020
(This article belongs to the Special Issue Interaction of Air Pollution with Snow and Seasonality Effects)

Abstract

:
Long-term studies of suspended particulate matter (SPM) and organic compounds (OCs)—Corg, lipids, hydrocarbons (aliphatic—AHCs and polycyclic aromatic—PAHs), and chlorophyll a in the snow cover of the Arctic (Franz Victoria Trough, Mendeleev Rise, White Sea) and Antarctica (in the coastal waters on fast ice and on the mainland near Russian stations) were generalized. It was shown that in the Arctic, the influence of continental air masses leads to an increase in OCs in snow. Therefore, despite the fact that the Franz Victoria Trough and the Mendeleev Rise are at the same latitude (82° N), the OCs content in the snow in the region of the Mendeleev Rise was lower for aliphatic hydrocarbons 5 and 14–18 μg/L. In the White Sea, the AHC content in the snow and the upper layers of the ice in the mouth of the Severnaya Dvina River and in the Kandalaksha Bay was higher than that in the lower layers of the ice and sharply decreased with distance from the emission sources. As a result, the snow was supplied mainly by pyrogenic PAHs. In the Antarctica, the lowest OCs levels in atmosphere were found in areas where coastal hills are covered with snow. The maximum SPM and AHCs concentration was found in the sludge (SPM—to 4.37 mg/L, AHC—to 33 μg/L). An increase in the concentration of OCs and SPM in snow sampled on the continent took place in the areas of stations and oases (St. Novolazarevskaya) where the predominance of mineral particles in the SPM was registered. In the area of the operating stations, mainly low molecular weight PAHs with the dominance of petroleum PAHs were found in the SPM of snow and in mosses.

1. Introduction

Snow and ice make a significant contribution to the suspended matter cycle including anthropogenic particles in high-latitude water areas in comparison with other climatic zones [1]. Snow accumulates solid particles and solutes from the atmosphere. Therefore, snow can be considered as a pump, taking both natural and anthropogenic organic and inorganic components from the atmosphere. The amount of matter in snow is primarily determined by its amount in the atmosphere. Atmospheric circulation plays a crucial role in the transport of aerosol particles including long-range transport [2,3].
Snow persists on the surface of the soil and drifting ice, unlike rain, which goes into the soil or flows from the surface of the ice. Thus, snow records all atmospheric precipitation during the snowy season [4]. The obtained quantitative estimates of microbial processes convincingly show that the ice cover of the Arctic is a specific, complex biogeochemical barrier, where the processes of organic matter (OM) entry and destruction are balanced [5].
The formation of snow cover is the indicator of a spatial heterogeneity of climate warming, according to which precipitation increases with increasing air temperature and increasing, to a certain limit, snow reserves [6,7]. Therefore, there is a weakening of the meridional temperature gradient between the tropics and the retreating boundary of the snow cover. Thus, the meridional heat transfer to the north is weakened. As a result, there is a warming of air over the surface freed from snow and over part of the remaining snowy continents.
Antarctica, surrounded by the ocean, is the geographical opposite of the Arctic. Due to annual melting, the Antarctic sea ice is thinner than the Arctic sea ice [8]. The uneven distribution of snow on the surface of the ice in combination with the processes of infiltration of sea water leads to the formation of ice layers with a distinctive crystalline structure and physico-mechanical properties.
In the atmosphere and cryosphere as well as in aquatic and terrestrial environments, a significant impact from particles derives from their ability to transport toxic pollutants attached to their surfaces [9]. According to the degree of anthropogenic influence on the formation of the snow-ice cover, there are the background areas (relatively remote from anthropogenic sources) and impact areas (distinguished by aeolian material from closely located industrial centers). Snow and ice contain organic compounds (OCs) of various origins, and their study in snow makes it possible to trace their intake with atmospheric transport.
The Arctic and Southern Oceans as well as their seas make a significant contribution to the stability of Earth’s climate, global carbon circle, and biogeochemical processes, which are characterized by peculiar sedimentation conditions and the presence of unique biological species that make up an essential element of biological diversity.
The main goals of this article are to generalize the results of long-term studies of suspended particulate matter (SPM) and organic compounds (OCs)—organic carbon (Corg), lipids, hydrocarbons (aliphatic—AHCs and polycyclic aromatic—PAHs), and chlorophyll a in the snow cover of the Arctic and Antarctica. The novelty of this article lies in the fact that one article summarizes the results of long-term studies of suspended matter and organic compounds in the snow cover of the Arctic and Antarctic using both published data of the authors and their colleagues, and new results.

2. Methods of the Studies

Special care was taken to prevent contamination during sample collection and analysis [10]. Snow and ice were collected in pre-washed plastic bags. Snow samples were taken from the surface of the ice in the windward direction from a research vessel or other source of local pollution with a plastic bucket into pre-washed plastic bags. The snow melting lasted 1–1.5 days. The ice core was cut out using a hand held titanium tubular corer (d = 14.5 cm). The ice was cut into blocks with a titanium saw in accordance with its structure and put into special cans for melting. Therefore, 5–8 cores were taken to obtain the required amount of melted water. The melted water was further analyzed using a procedure applied to the seawater samples.
Samples of “young” forms of ice were taken on board using a special triangular mesh screen (1 mm2) recommended for sampling the surface microlayer. The suspended particulate matter (SPM) was extracted from the water by membrane filtration that was preliminarily washed with a weak solution of extra pure hydrochloric acid (HCl) and then with bidistilled water polycarbonate nuclear filters (pore diameter of 0.45 µm) under 0.4 atm vacuum and concentrations were then determined gravimetrically. To determine the concentrations of OCs, the samples of melted snow, ice, and under-ice water were filtered with GF/F glass-fiber filters (0.7 µm) that were calcined for 6 h at 450 °C. A preweighed nuclear filter of 47 mm diameter with 0.45 µm pores was used to determine the amount and composition of the SPM.
All solvents were of high purity qualification. Methylene chloride was used to extract lipids from the water and SPM. The individual AHCs fractions were separated with hexane by means of column chromatography on silica gel. The concentrations of lipids and AHCs (before and after the chromatography, respectively) were determined by IR spectroscopy using an IR Affinity 1 (Shimadzu, Japan). A mixture of isooctane, hexadecane, and benzene (37.5, 37.5, and 25 vol%, respectively) was used as a standard. The sensitivity of the procedure amounted to 3 µg/mL of the extract [10,11].
The content and composition of polycyclic aromatic hydrocarbons (PAHs) were determined by the method of high performance liquid chromatography (HPLC) on a LC-20 Prominence liquid chromatograph (Shimadzu, Japan). An Envirosep PP column was used at 40 °C in a thermostat under gradient conditions (up to 50 to 90% in a volume of acetonitrile in water). A 1 cm3/min flow rate of the eluent was used, and a RF 20A fluorescent detector with programmed wavelengths of absorption and excitation. The calculations were performed by means of LC Solution software. The equipment was standardized with individual PAHs and their mixtures manufactured by Supelco Co. As a result, the key polyarenes recommended for studying the pollution of marine objects [12] were identified.
The organic carbon in the samples of the SPM was determined by dry combustion with an AH-7560 analyzer (Russia) [13]. A filter or its fragment was placed into a porcelain crucible; then common procedures for determining Corg in bottom sediments were used. The sensitivity amounted to 6 µg of carbon in a sample at a precision of 3–6%.
The composition of the SPM in snow and ice was determined with a VEGA 3 SEM scanning electron microscope manufactured by TESCAN Co. (Brno, Czech Republic).

3. Results

3.1. Arctic

Precipitation in the Central Arctic, as a rule, falls in solid form and forms a stable snow cover on drifting ice. The duration of occurrence of snow cover near the North Pole exceeds 320 days a year, and near the summer position of the edge of drifting ice, it is 60–70 days less. The average snow depth on the perennial ice of the Central Arctic Basin is 30–40 cm [6]. In the Arctic seas, it is about one and a half times less, since in the seas, the ice on which snow lays is formed only at the end of October—the beginning of November. The supply of a significant portion of matter from the atmosphere is associated with snow, not only in the form of a thin suspension (aerosol), but also in the form of solutions. The ice cover becomes an aerosol accumulator, its additional long-range (thousands of km) carrier. Therefore, the Arctic is becoming a global trap for aerosol matter that passes into water and bottom sediments in depot centers on the border of ice and temperate zones (on ice melting fronts) [1].

3.1.1. Background Areas

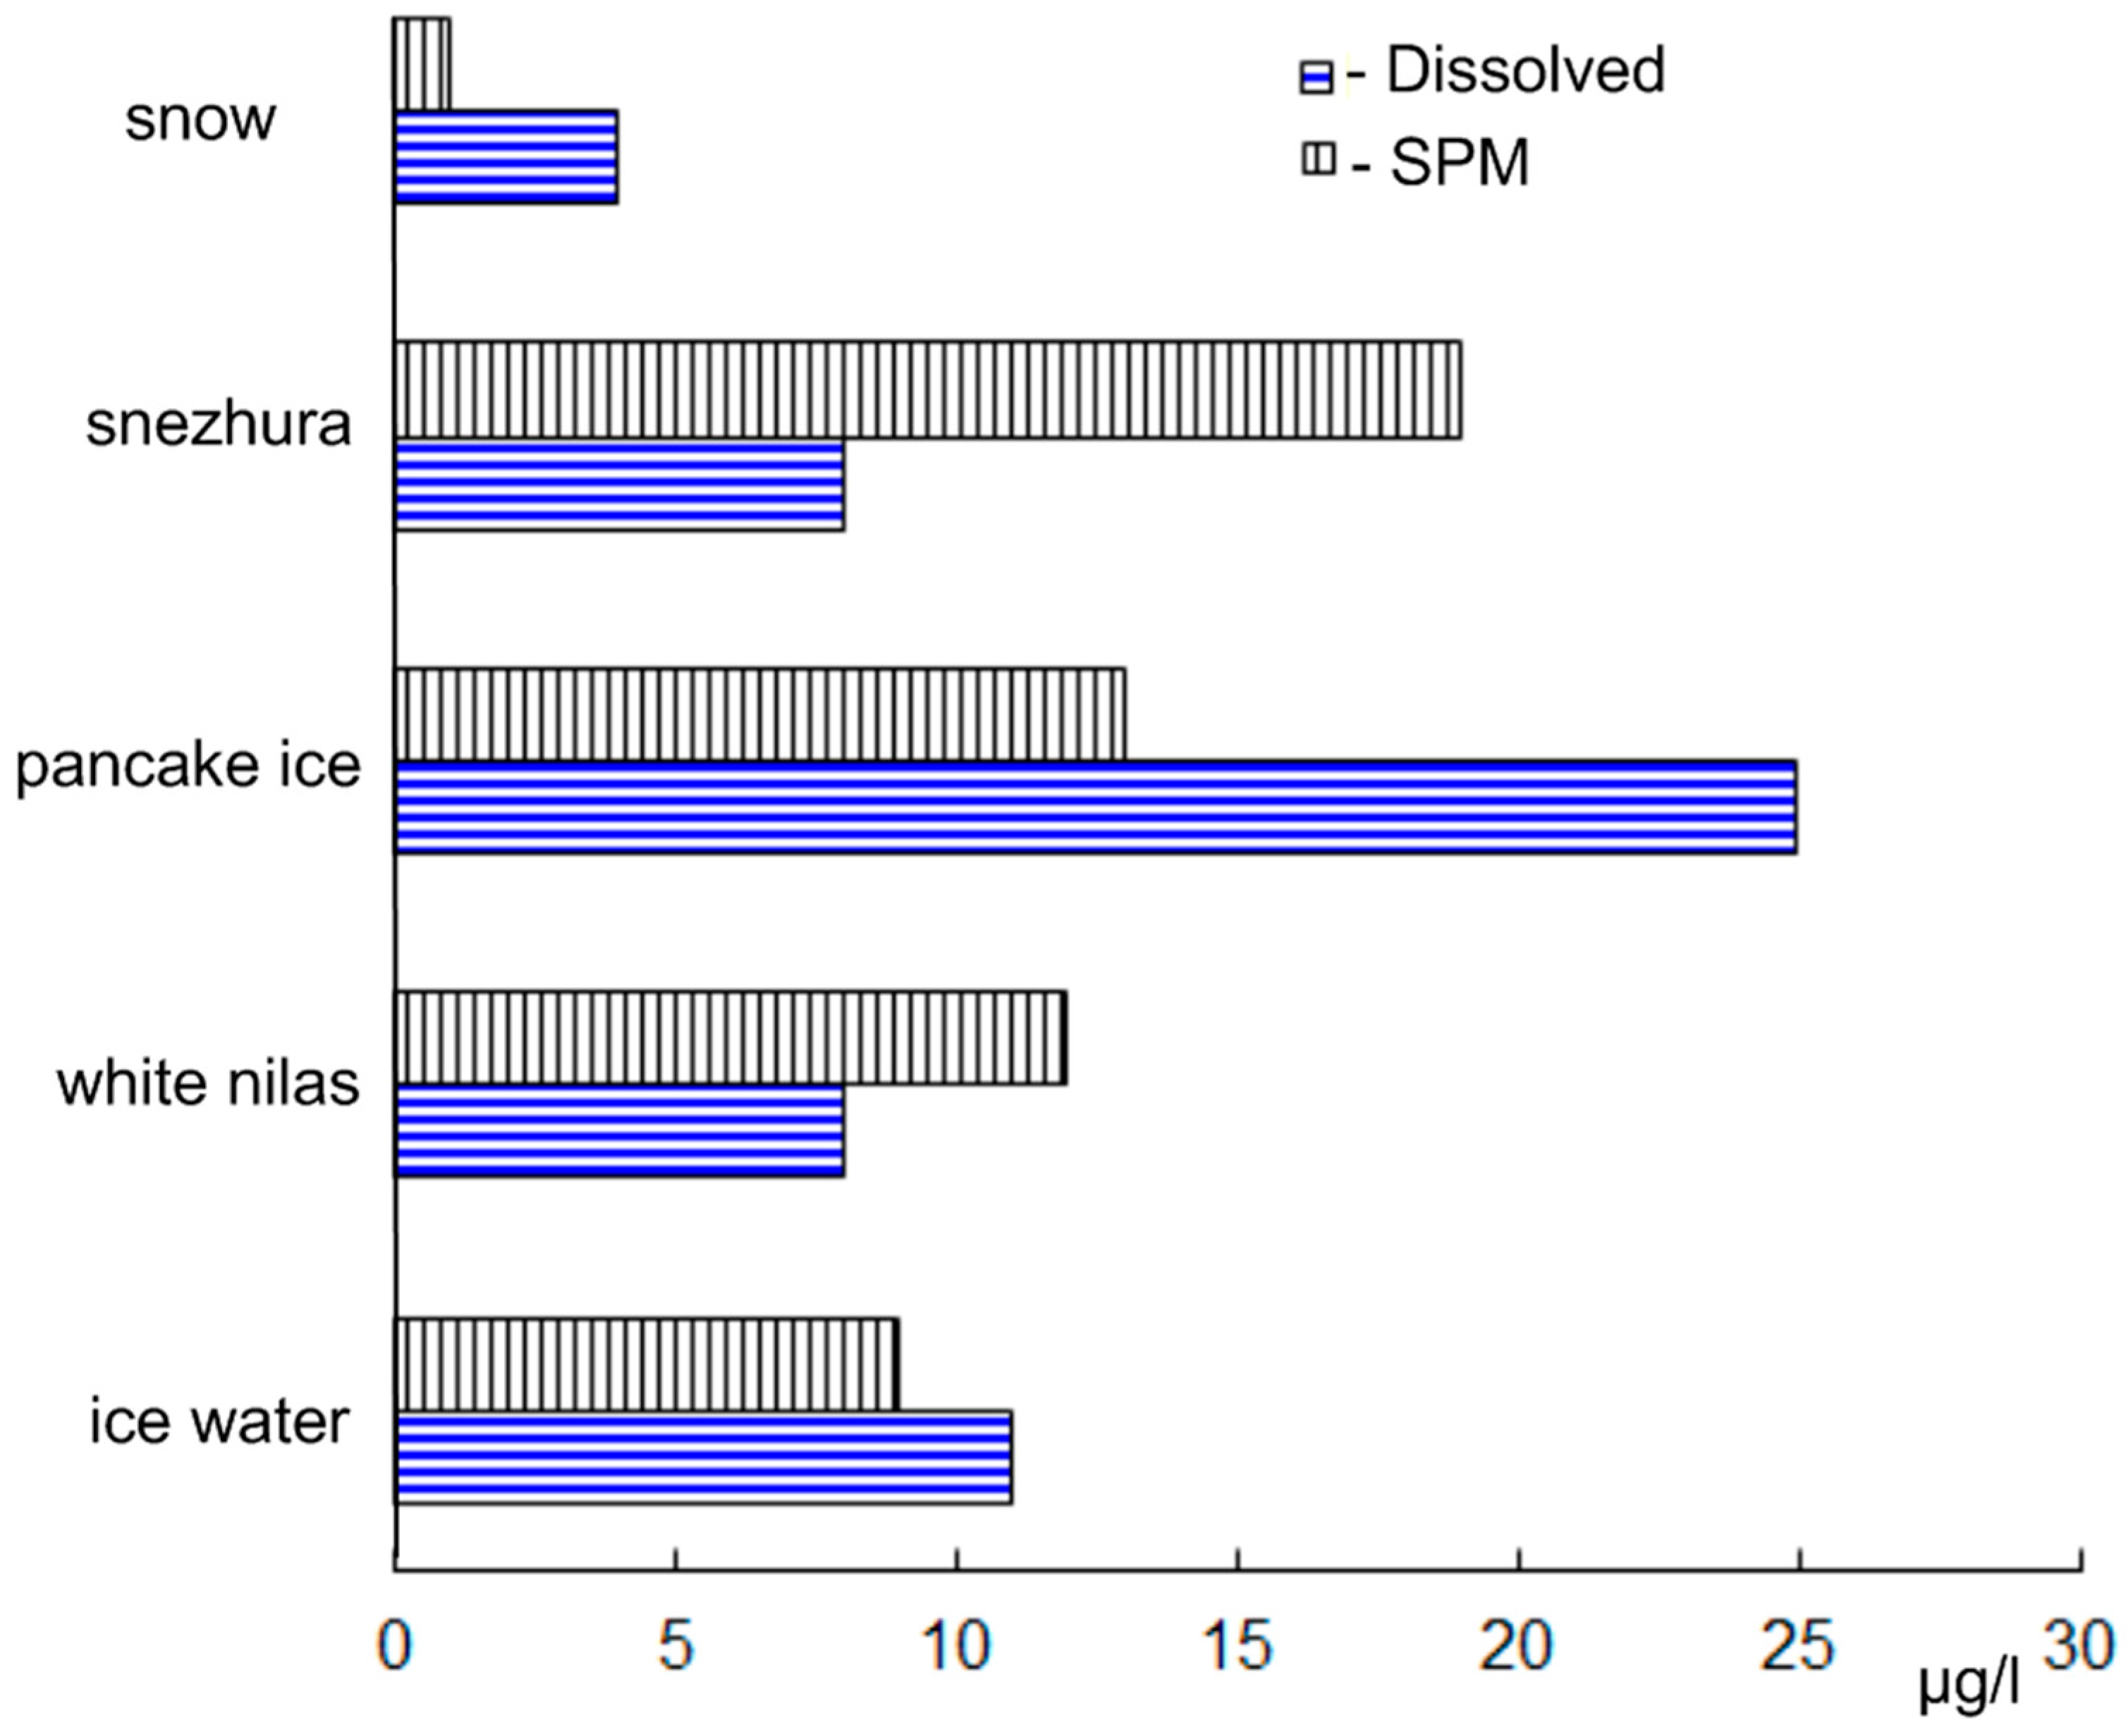
In snow in the northern part of the Barents Sea near Franz Joseph Land (Franz Victoria Trough), the average AHC concentration in dissolved and suspended forms (for AHCs, respectively, 5 and 6 μg/L and for PAHs, 2 and 3 ng/L, Table 1) is lower than in under-ice water. Even during snowfall, when the most intense release of various compounds from the atmosphere occurs, there was no increase in AHC concentration (Figure 1).
The composition of alkanes and PAHs in snow samples is rather uniform, as evidenced by the ratios of molecular markers (Table 1). Among the alkanes of snow, high-molecular compounds prevailed, with an almost equal ratio of even and odd homologs (CPI23-35 = 1.1–1.2). The composition of PAHs was dominated by fluoranthene—the most stable and phenanthrene—the most common of the unsubstituted identified polyarenes [14]. Pericondensed pyrogenic PAHs pyrene and benzo (a) pyrene were minor components.
Comparable hydrocarbon concentrations were determined in melt ponds, lakes arising on the ice during their summer melting (Table 1). Usually in melt ponds, a redistribution of the substance melting from snow and ice occurs [15]. A significant amount of autochthonous phytoplankton, formed during the summer bloom as well as in polynias is added to it. Therefore, higher concentrations of lipids and hydrocarbons could be expected in the melt ponds. However, in September, during the period of the Arctic autumn, when the melt ponds were already covered with ice, the autochthonous OM formation stops, which, apparently, causes such a low content.

3.1.2. Impact Areas (White Sea)

The White Sea is not covered with ice all year round. February and March are characterized by steady coastal ice from 40 to 80 cm thick (57 cm on average) [16,17,18]. Unlike the Arctic perennial ice, the seasonal coastal ice is formed of the water-snow ice, which is characterized by high porosity, special isotropic structure, and, hence, considerable water cut [18,19,20,21,22]. Therefore, the upper layer of the ice cores consist usually of mat ice of snow origin, and the lower layer is formed by water-bearing crystalline ice. In some cases, the lower part of the ice is colored brown due to the abundance of diatom algae.
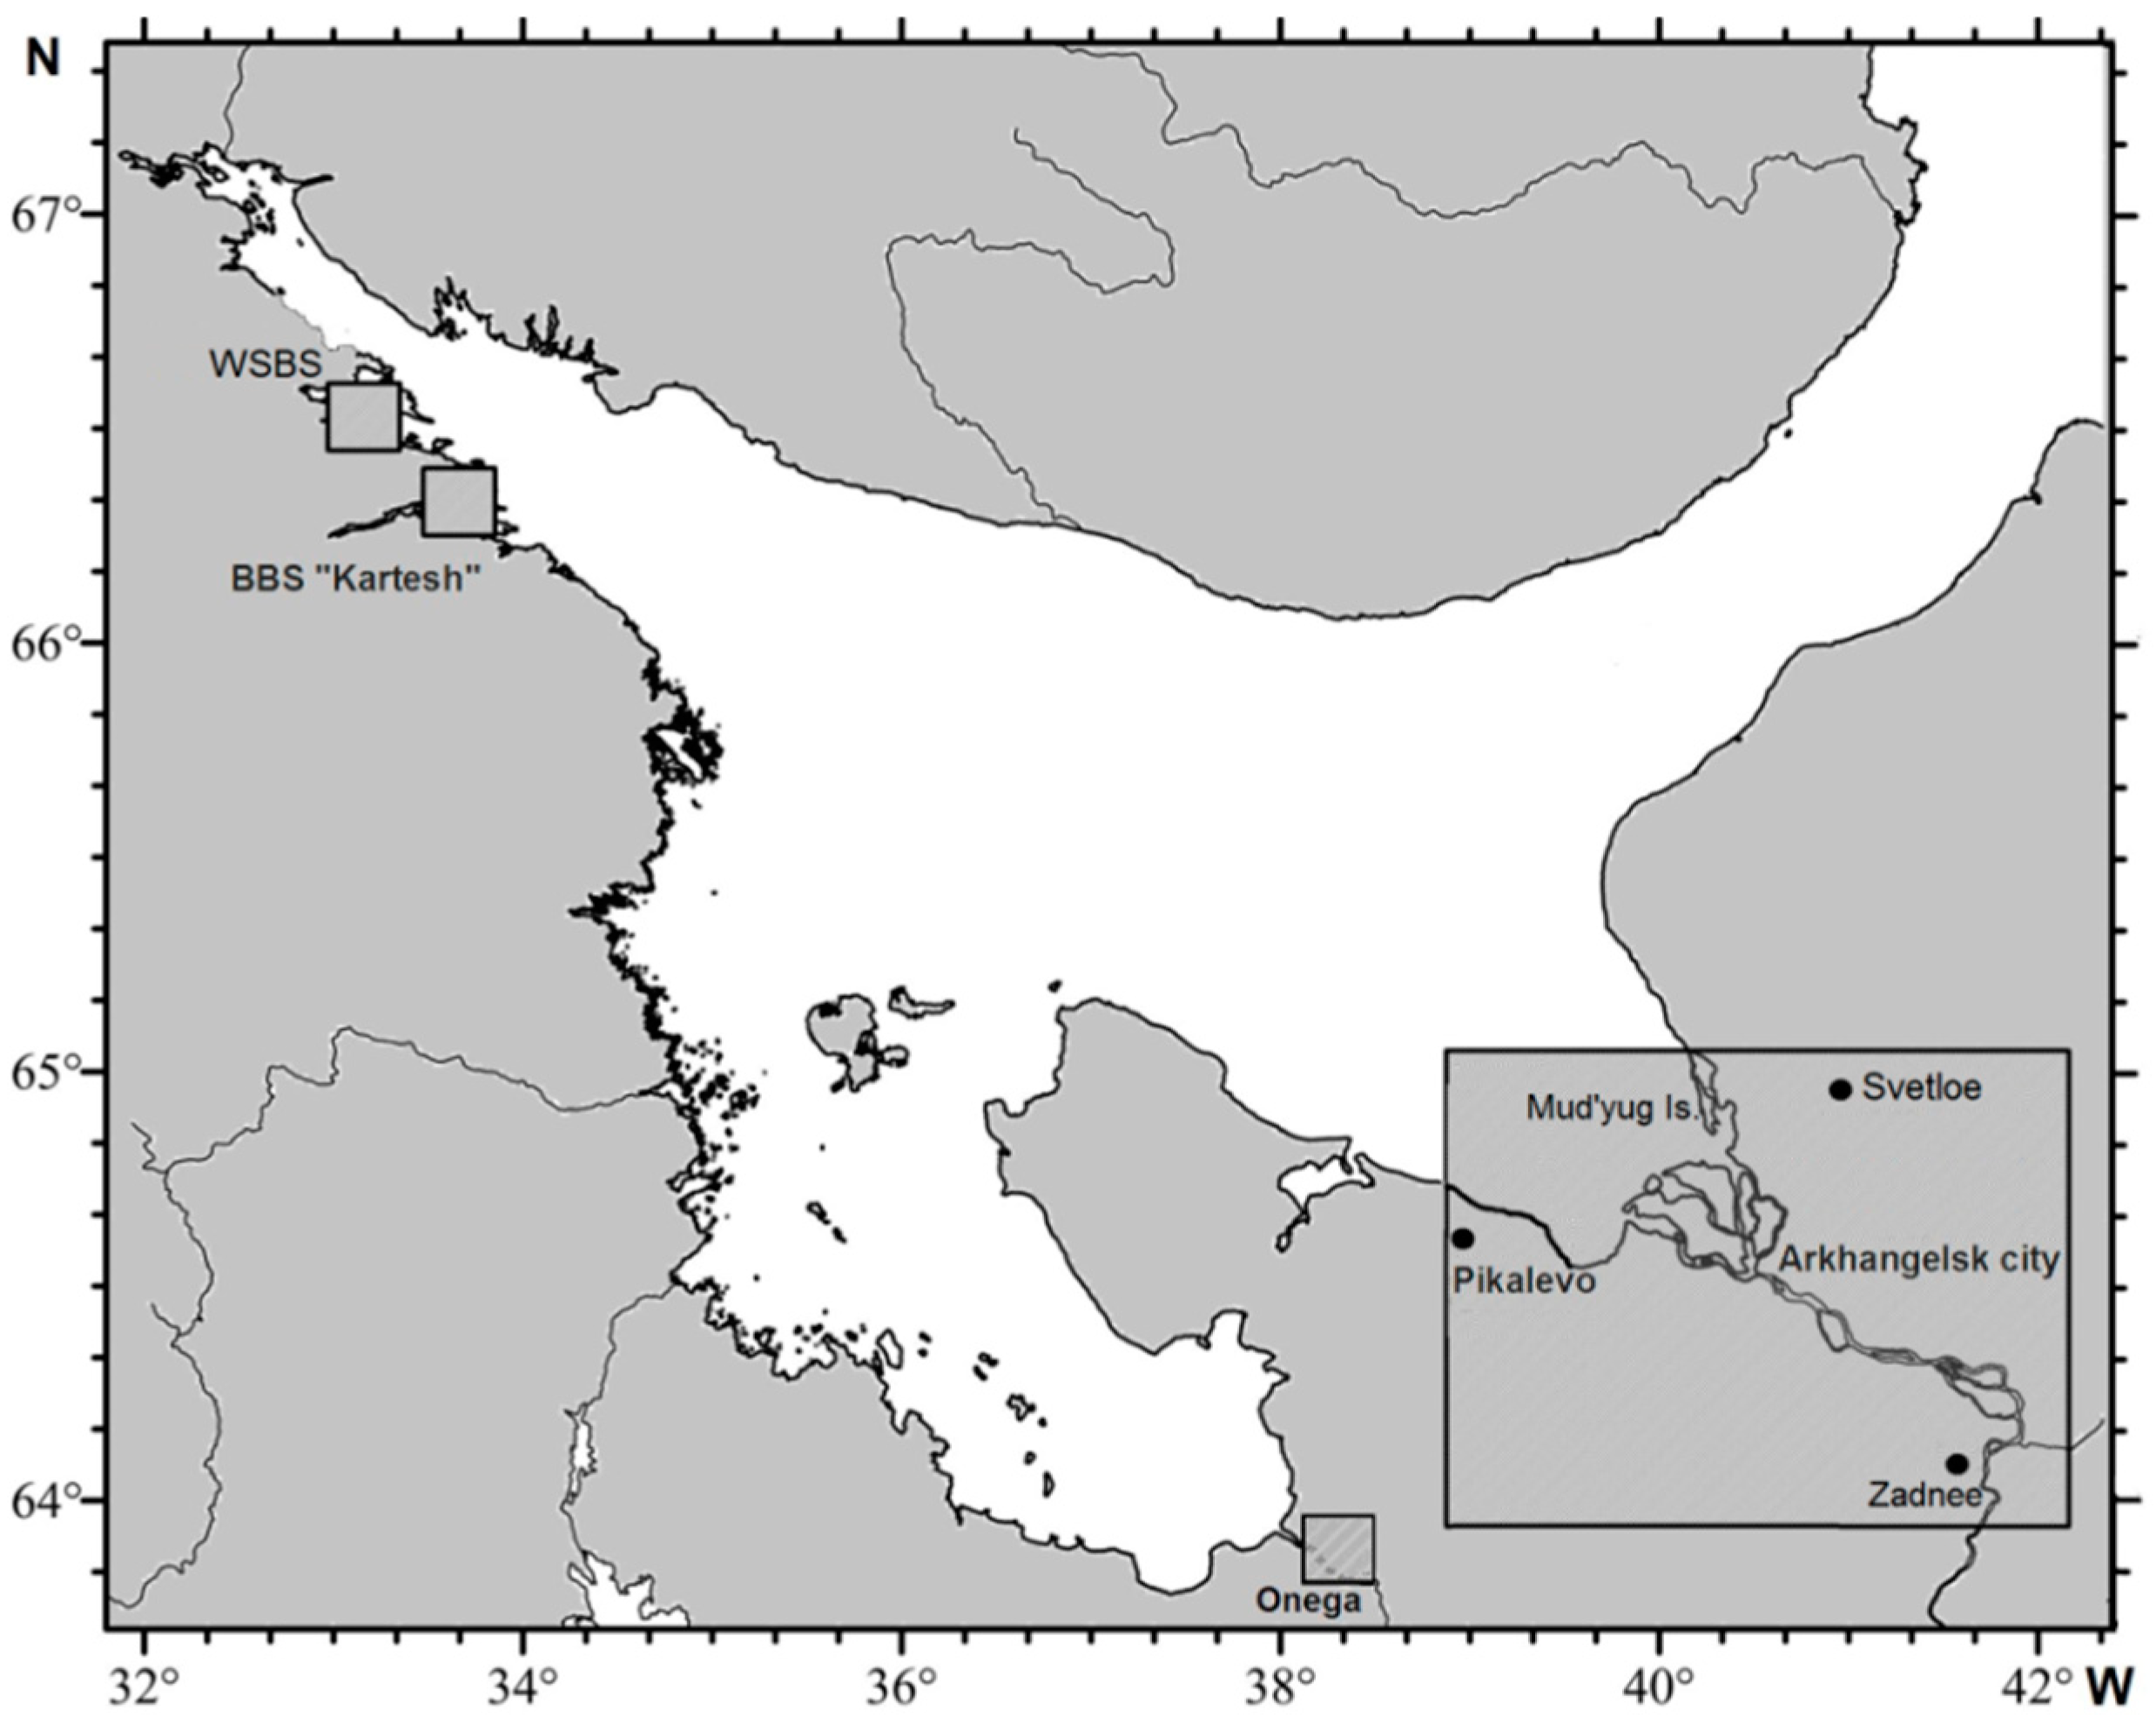
To research the behavior of AHCs in the presence of a snow-ice cover, the studies were performed in the areas of the White Sea with different anthropogenic pressure. These were Rugozerskaya Bay in the vicinity of the Pertsov White Sea Biological Station of Lomonosov Moscow State University and the Cape Kartesh area near the White Sea Biological Station of Zoological Institute Russian Academy of Sciences at the periphery of Kandalaksha Bay, the mouth of Onega river and the area in the mouth of Severnaya Dvina river near the city of Arkhangelsk (lakes near Arkhangelsk) (Figure 2).
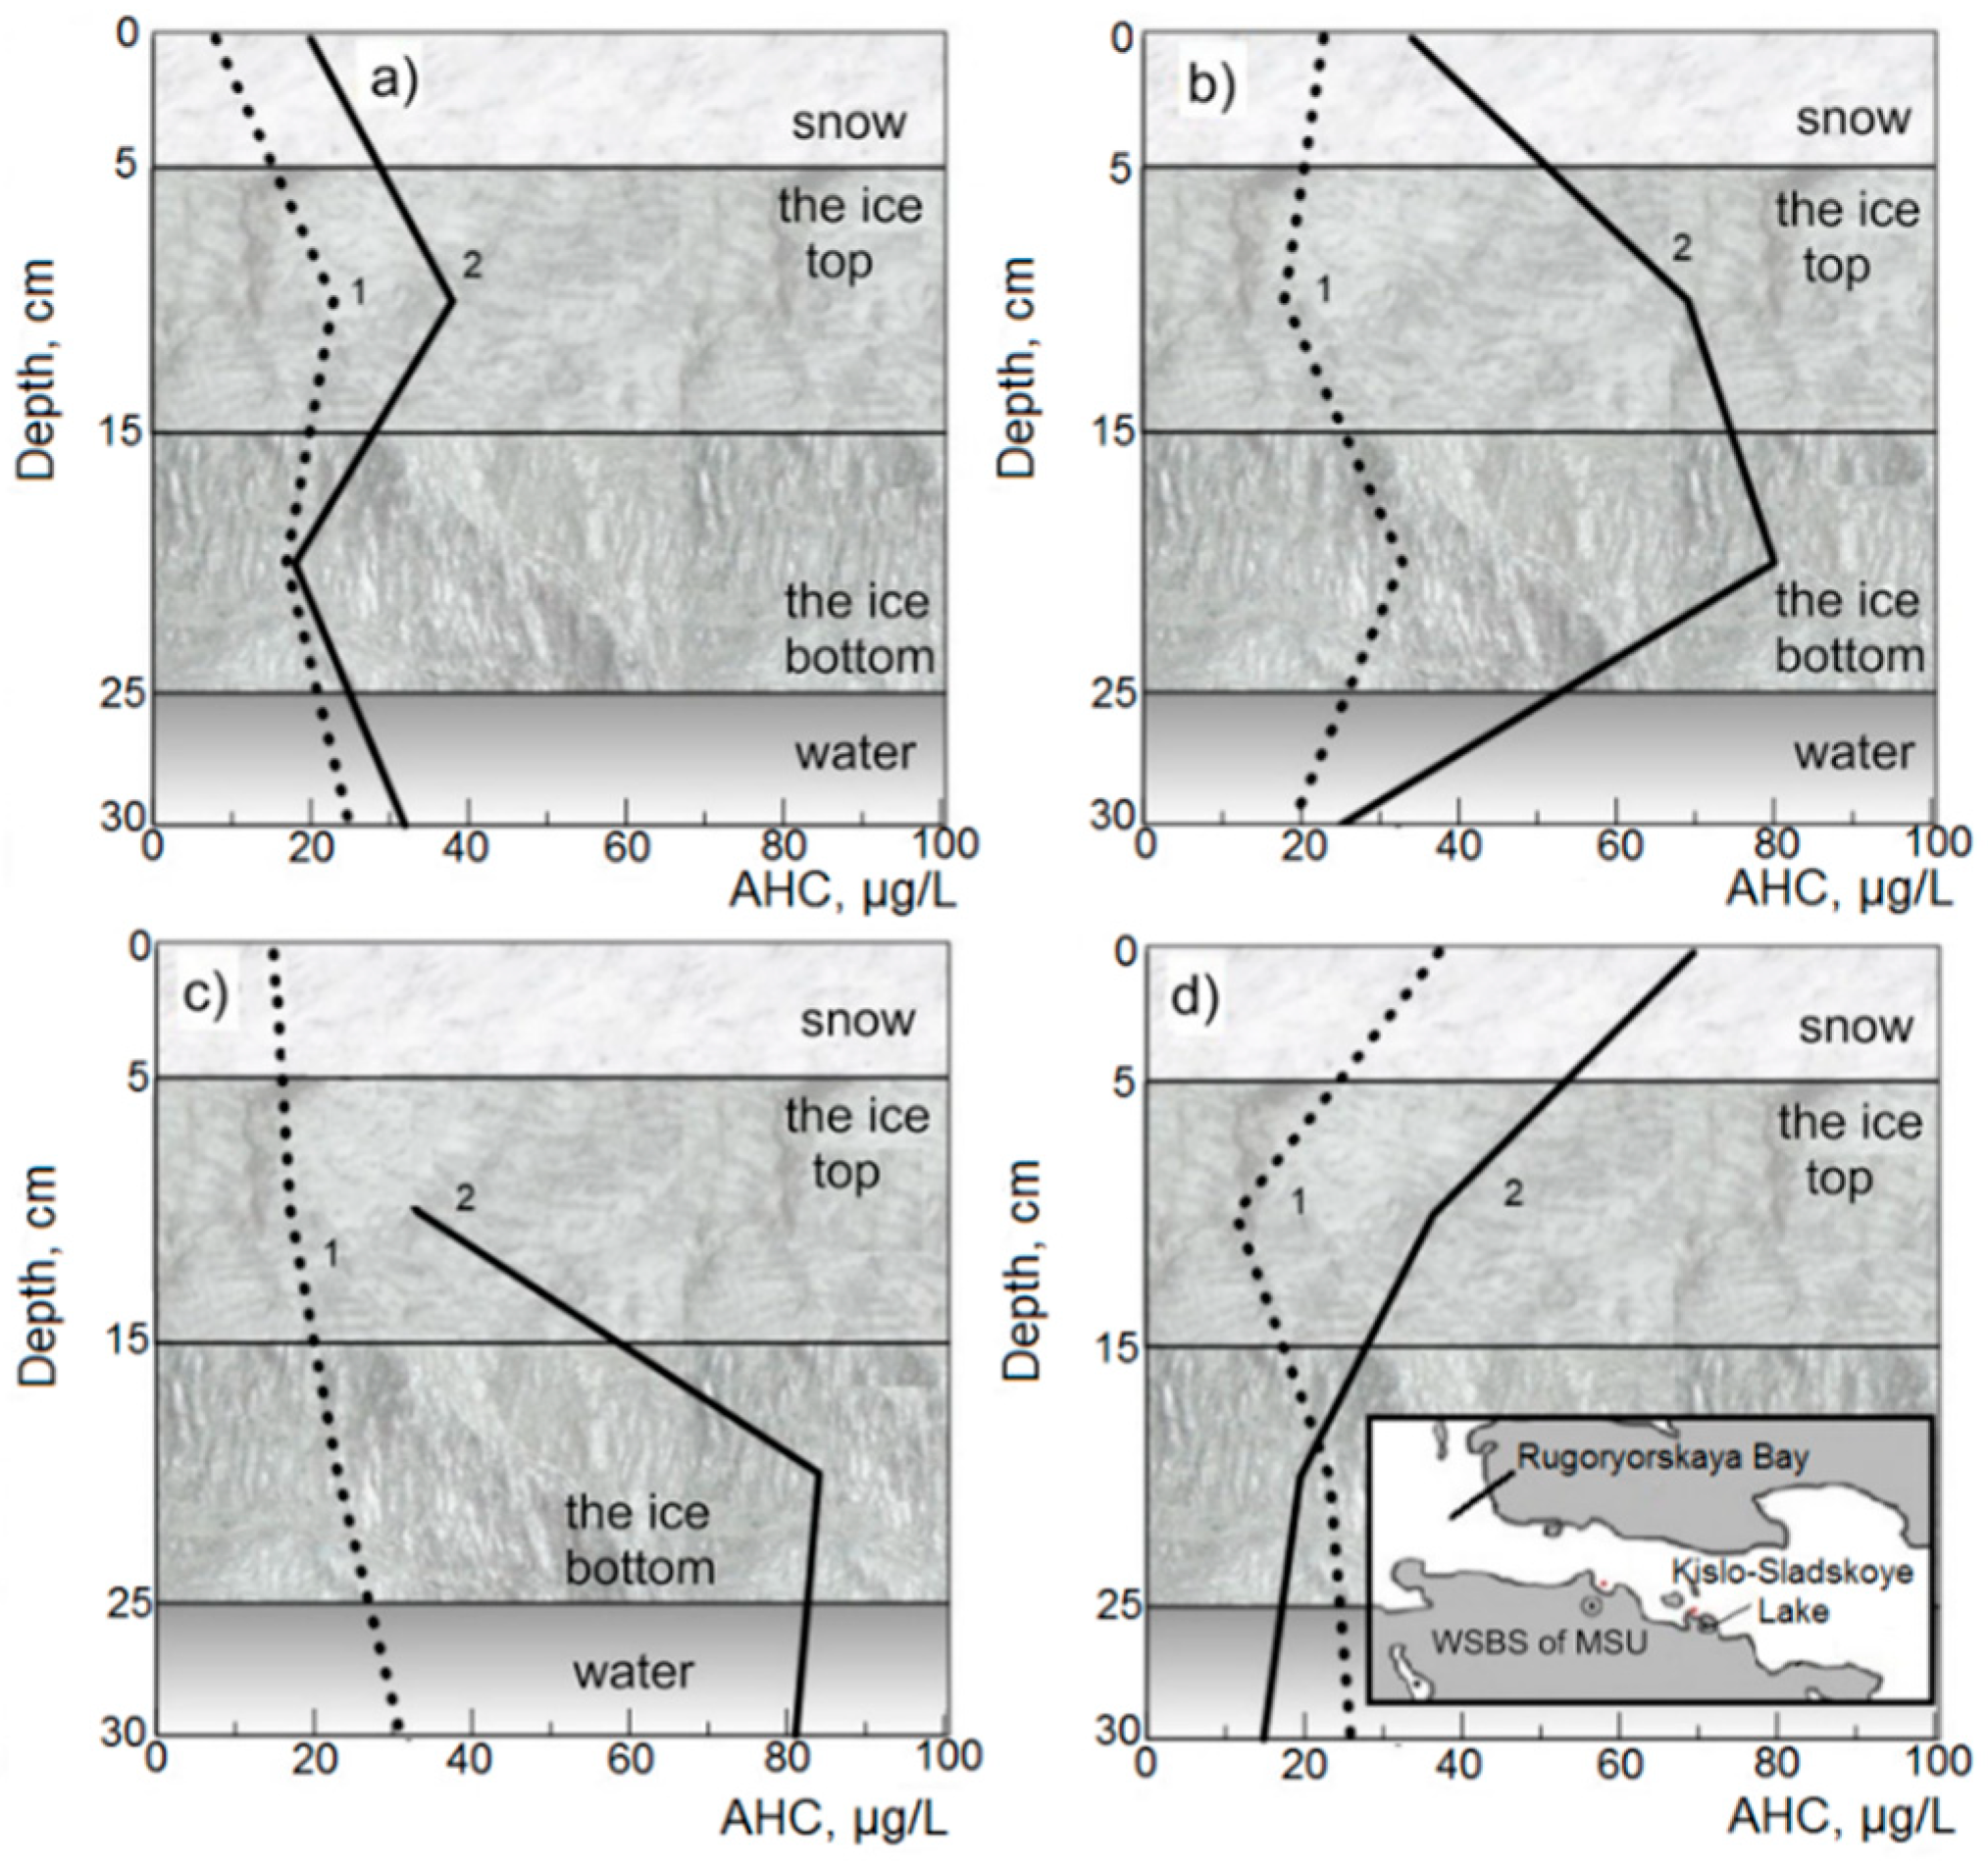
In the Rugozerskaya Bay, research was conducted in different years, but almost at the same time (late January–early February) and in the same areas (Kislo-Sladkoe Lake and the White Sea Biological Station of Moscow State University (WSBS) (Figure 3). AHC concentrations were lower in the snow of Kislo-Sladkoe Lake (St. 1, 66°32.9′ N, 33°8.125′ E), located at a distance 1.5 km from the WSBS, than at St. 2 (66°33.206′ N, 33°6.279′ E) located at the pier of WSBS. The territory of WSBS refers to the zone of increased humidity and is characterized by a long, relatively warm winter, lasting approximately 4–4.5 months from mid-November to March. Precipitations vary from 450 to 650 mm per year. Winds of the southwestern and western directions, which capture aerosols from Europe, prevail throughout the year [23,24].
The concentration of pollutants in the Arctic atmosphere rises from November to March due to the heating of dwellings. Therefore, the AHC content in snow in February in Rugozerskaya Bay varied in the range of 8 to 46 μg/L, and in March between 40 and 92 μg/L. However, their concentrations were lower than those in another area of Kandalaksha Bay in the Chupa Bay near Cape Kartesh in March 2004 of 80–239 μg/L [25].
SPM in the snow of Rugozerskaya Bay contained (according the scanning electron microscopy) mineral particles and diatom algae (Cocconeis, Naviscula, Nitzschia, Thalassionema), plant spores, and combustion products (fly ash and black carbon). Content of combustion products, as a rule, showed good correlation to that of PAHs because pyrene was dominant in their composition.
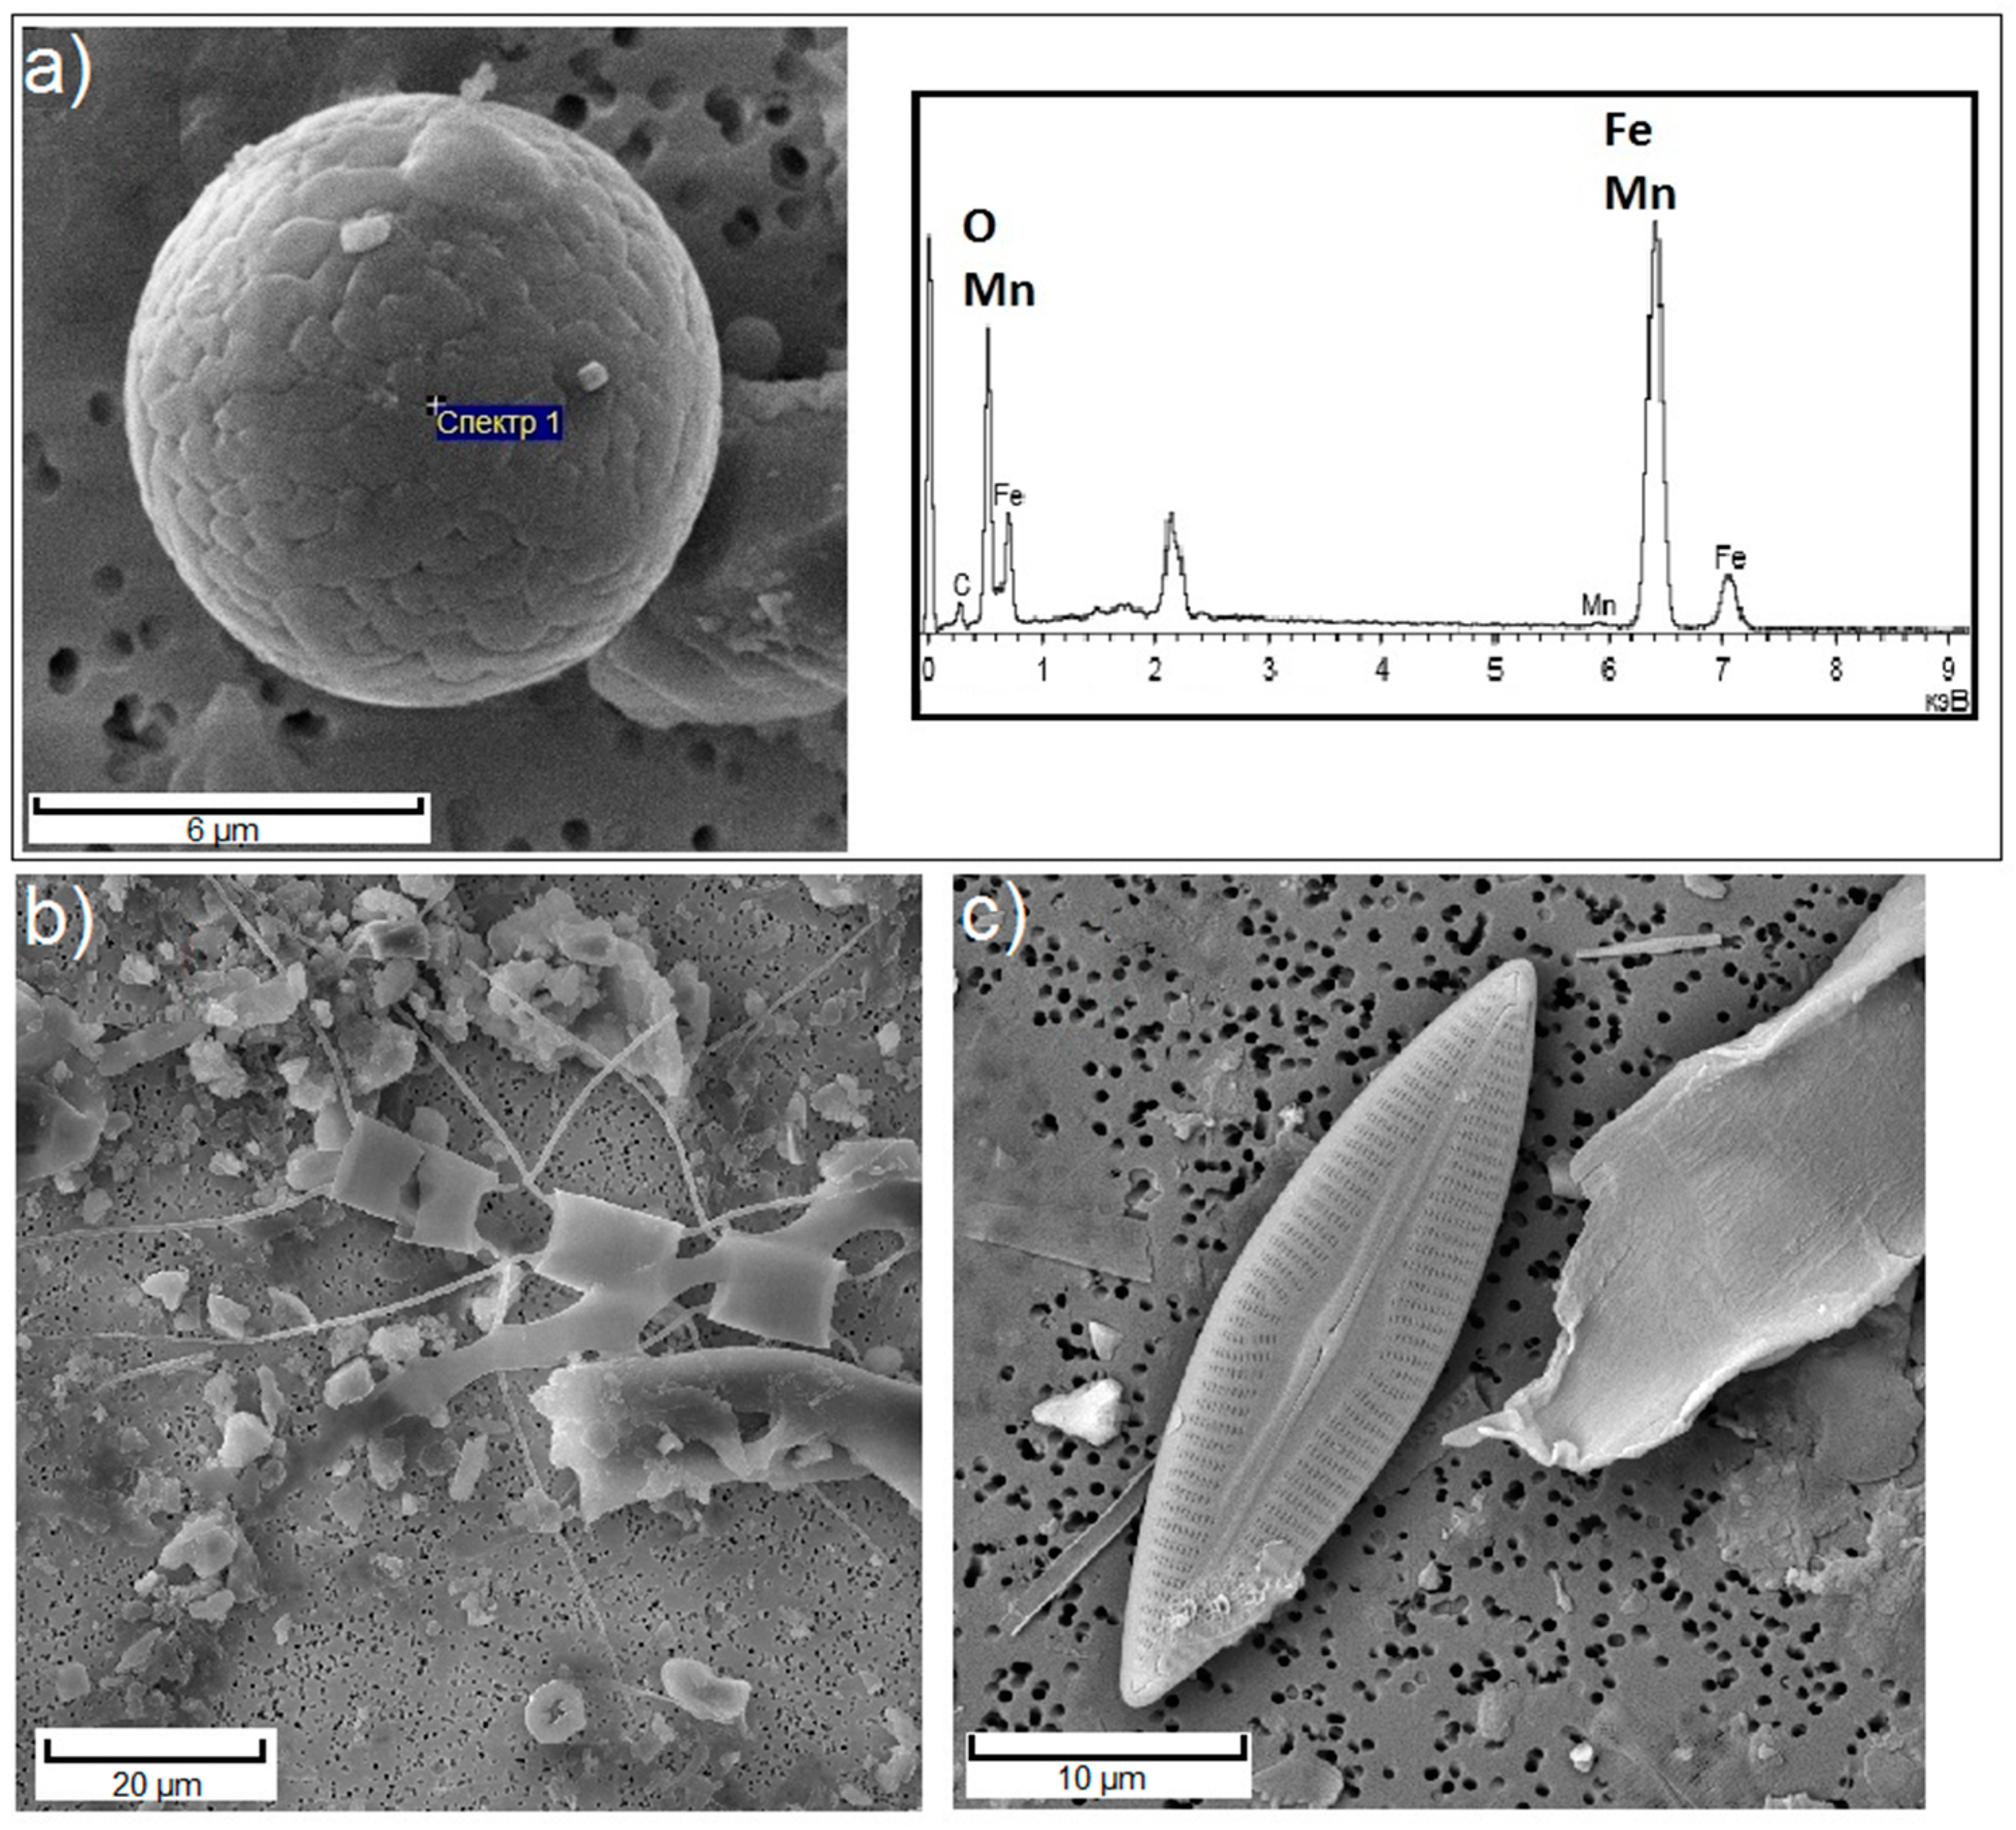
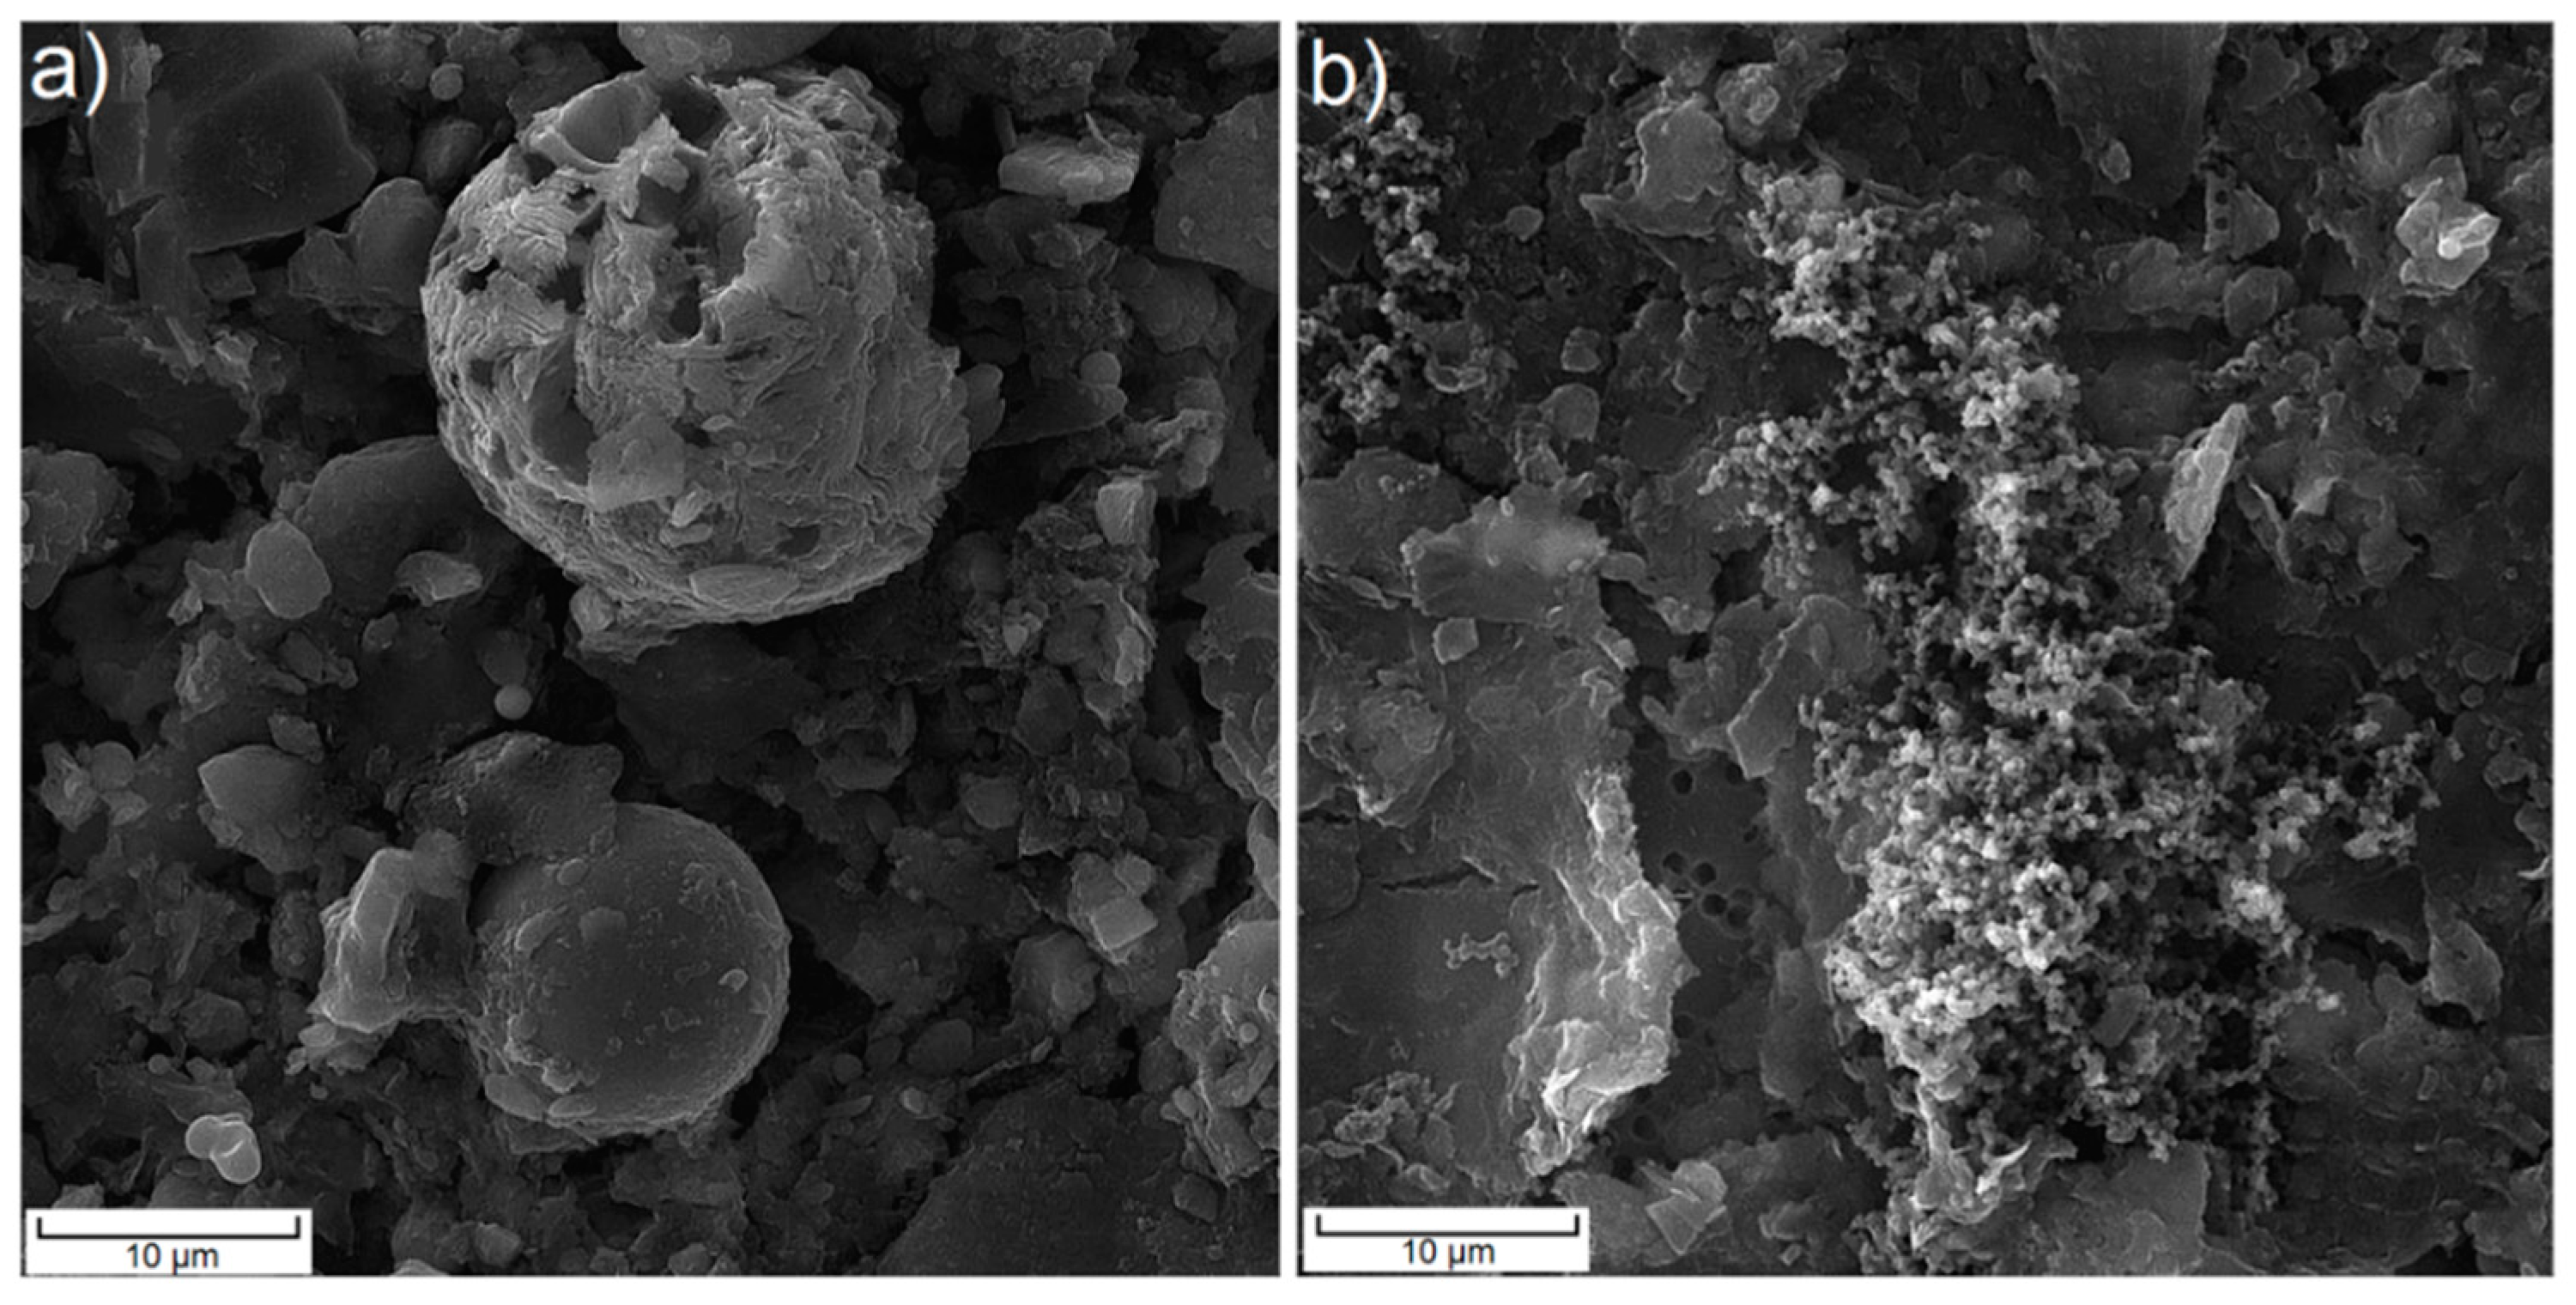
At the mouth of the Severnay Dvina, the SPM in the snow was higher than in Kandalaksha Bay and sharply decreased with distance from the emission sources. In March 2015, the concentration of SPM in the snow of the city of Arkhangelsk between the Yakhtklub District and Port Ekonomiya differed from 0.74 to 116.79 mg/L and the AHCs from 27 to 616 μg/L. Significantly lower concentrations of AHCs (20 μg/L, 5.9 μg/mg SPM) were in snow near the coast of Mud’yug Island. As part of the SPM in the snow scale, mineral particles and diatoms were found (Figure 4).
At the mouth of the Severnay Dvina, lower AHC concentrations were established in February of 5–83 μg/L compared with March of 83–583 μg/L (2007) and 27–616 μg/L (2015).
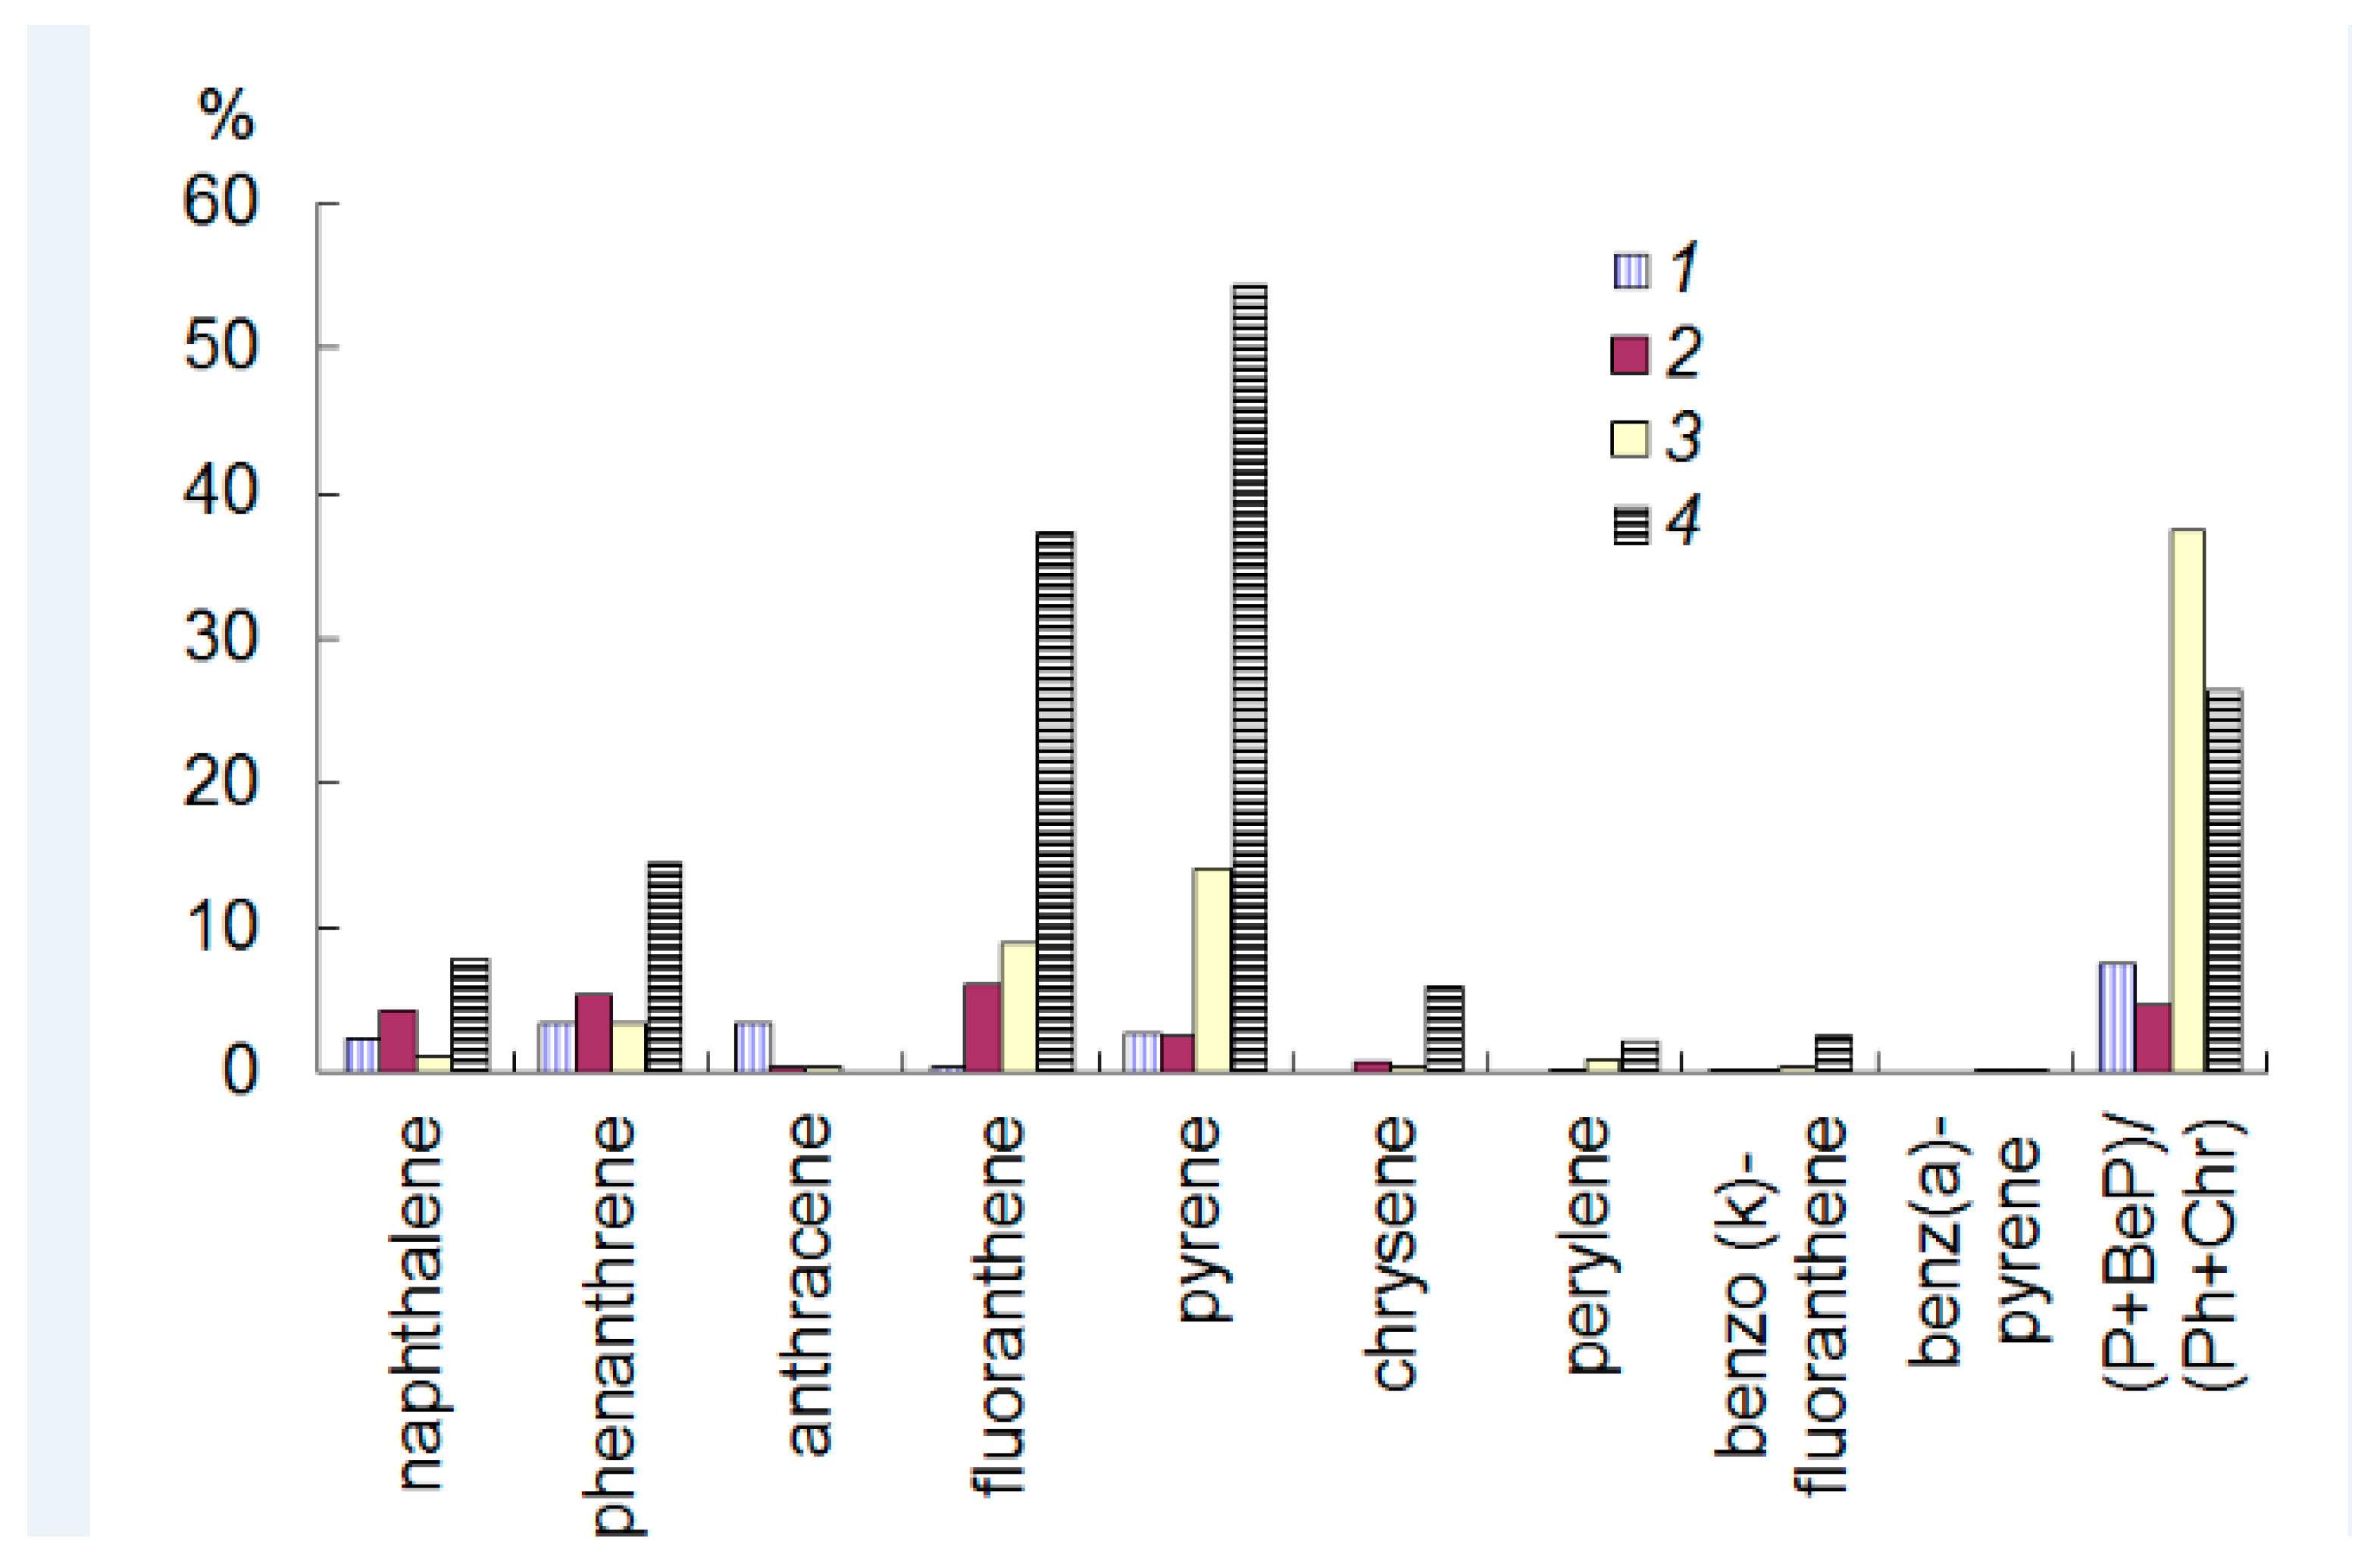
Distribution of PAHs in this region also confirms their intake from the atmosphere, because their content (98–216 ng/L) was higher in SPM from snow than in the surface waters (13–48 ng/L). The data from the snow-ice cover in Arkhangelsk city confirm that fact as well, because there was a decrease in the PAH concentrations moving from snow to ice and to surface water. In snow, the content of pyrene (P) is close to the content of fluoranthene (FL) of 55 and 66 ng/L, respectively, which may indicate fresh contamination with pyrogenic PAHs (i.e., markers in the PAH of snow SPM in the Arkhangelsk region indicate an anthropogenic pyrogenic origin (Figure 5)). The pyrene/perylene (P/PL) ratio in snow and ice changed in the range of 1.04–3.33. PL is polyarene of a geochemical background, which has a predominantly terrigenous origin [25,26]. In contrast, in water, where pyrogenic compounds were smaller, the ratio of P/PL varied from 0.23 to 0.49.
In 2016 and 2017, samples of snow were taken on the lakes around Arkhangelsk—Pikalevo, Svetloe, and Zadnee (Figure 2, inset, Arkhangelsk region). SPM in the snow had a black color, since it consisted of ashes, soot, and other anthropogenic particles (Figure 6). The maximum amount of AHCs (1605 μg/L) and PAHs (125 ng/L) was established in the snow about Svetloe Lake, and the minimum AHCs (98 μg/L and PAHs 15 ng/L) in the snow cover of Zadnee Lake, located at a distance from Arkhangelsk to the southeast.
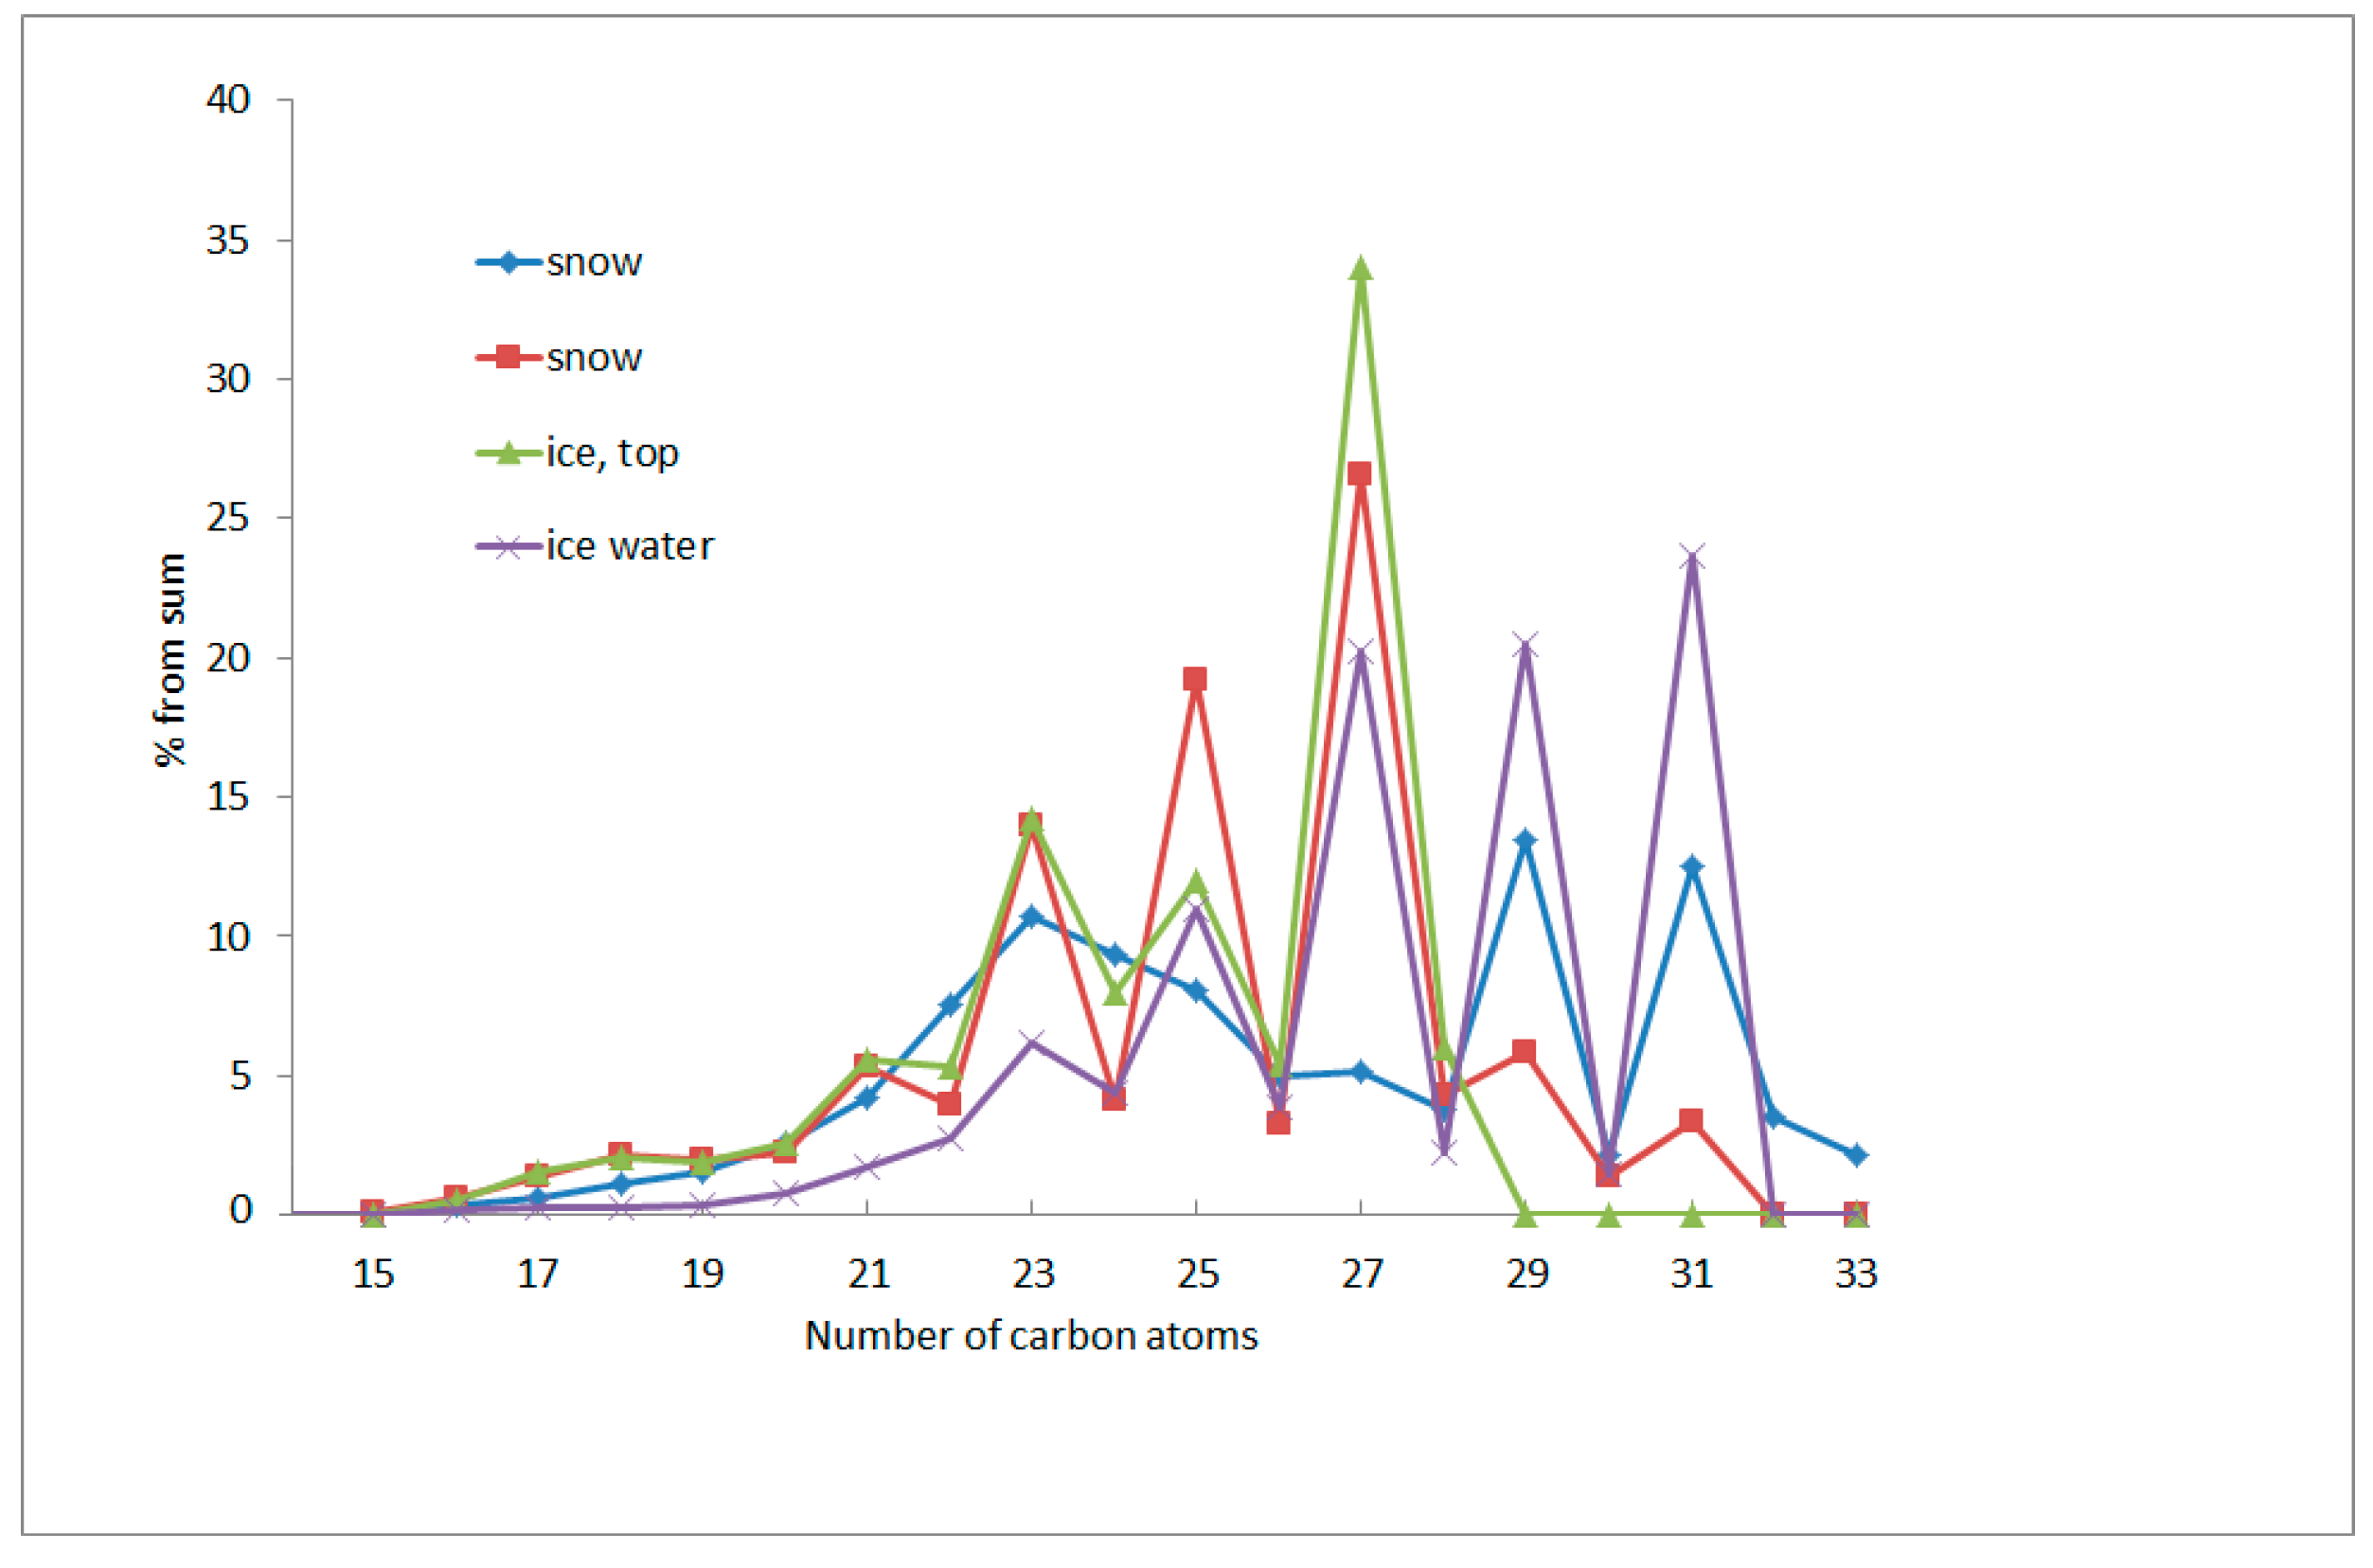
In 2017, in the snow of Pikalevo Lake, the concentration of AHCs differed almost nine times (31–260, on average 94, σ =7 1 μg/L). High-molecular terrigenous alkanes (the ratio of light to heavy homologues were 0.22–0.37) prevailed in the composition of AHCs in snow and weathered oil compounds in the low-molecular region (Figure 7).
The phases of the moon play a great role in the distribution of OCs and SPM in snow and ice in the White Sea. The concentrations of SPM in snow and ice during the high tide (0.22 and 1.03 mg/L) and low tide (2.25 and 1.55 mg/L) were significantly different (in 2–7 times) of the Onega River mouth and AHC concentrations remained constant—23 μg/L. In the White Sea, the thickness of snow and ice is comparable [15]. Therefore, the ice sinks into the water under the pressure of snow, and hence, the variability of the concentrations in different phases of the moon was observed more significantly in the upper layer of snow ice (Figure 8). The content of AHCs was determined by the concentration of SPM, since there was a correlation between these compounds r = 0.55 (n = 8).
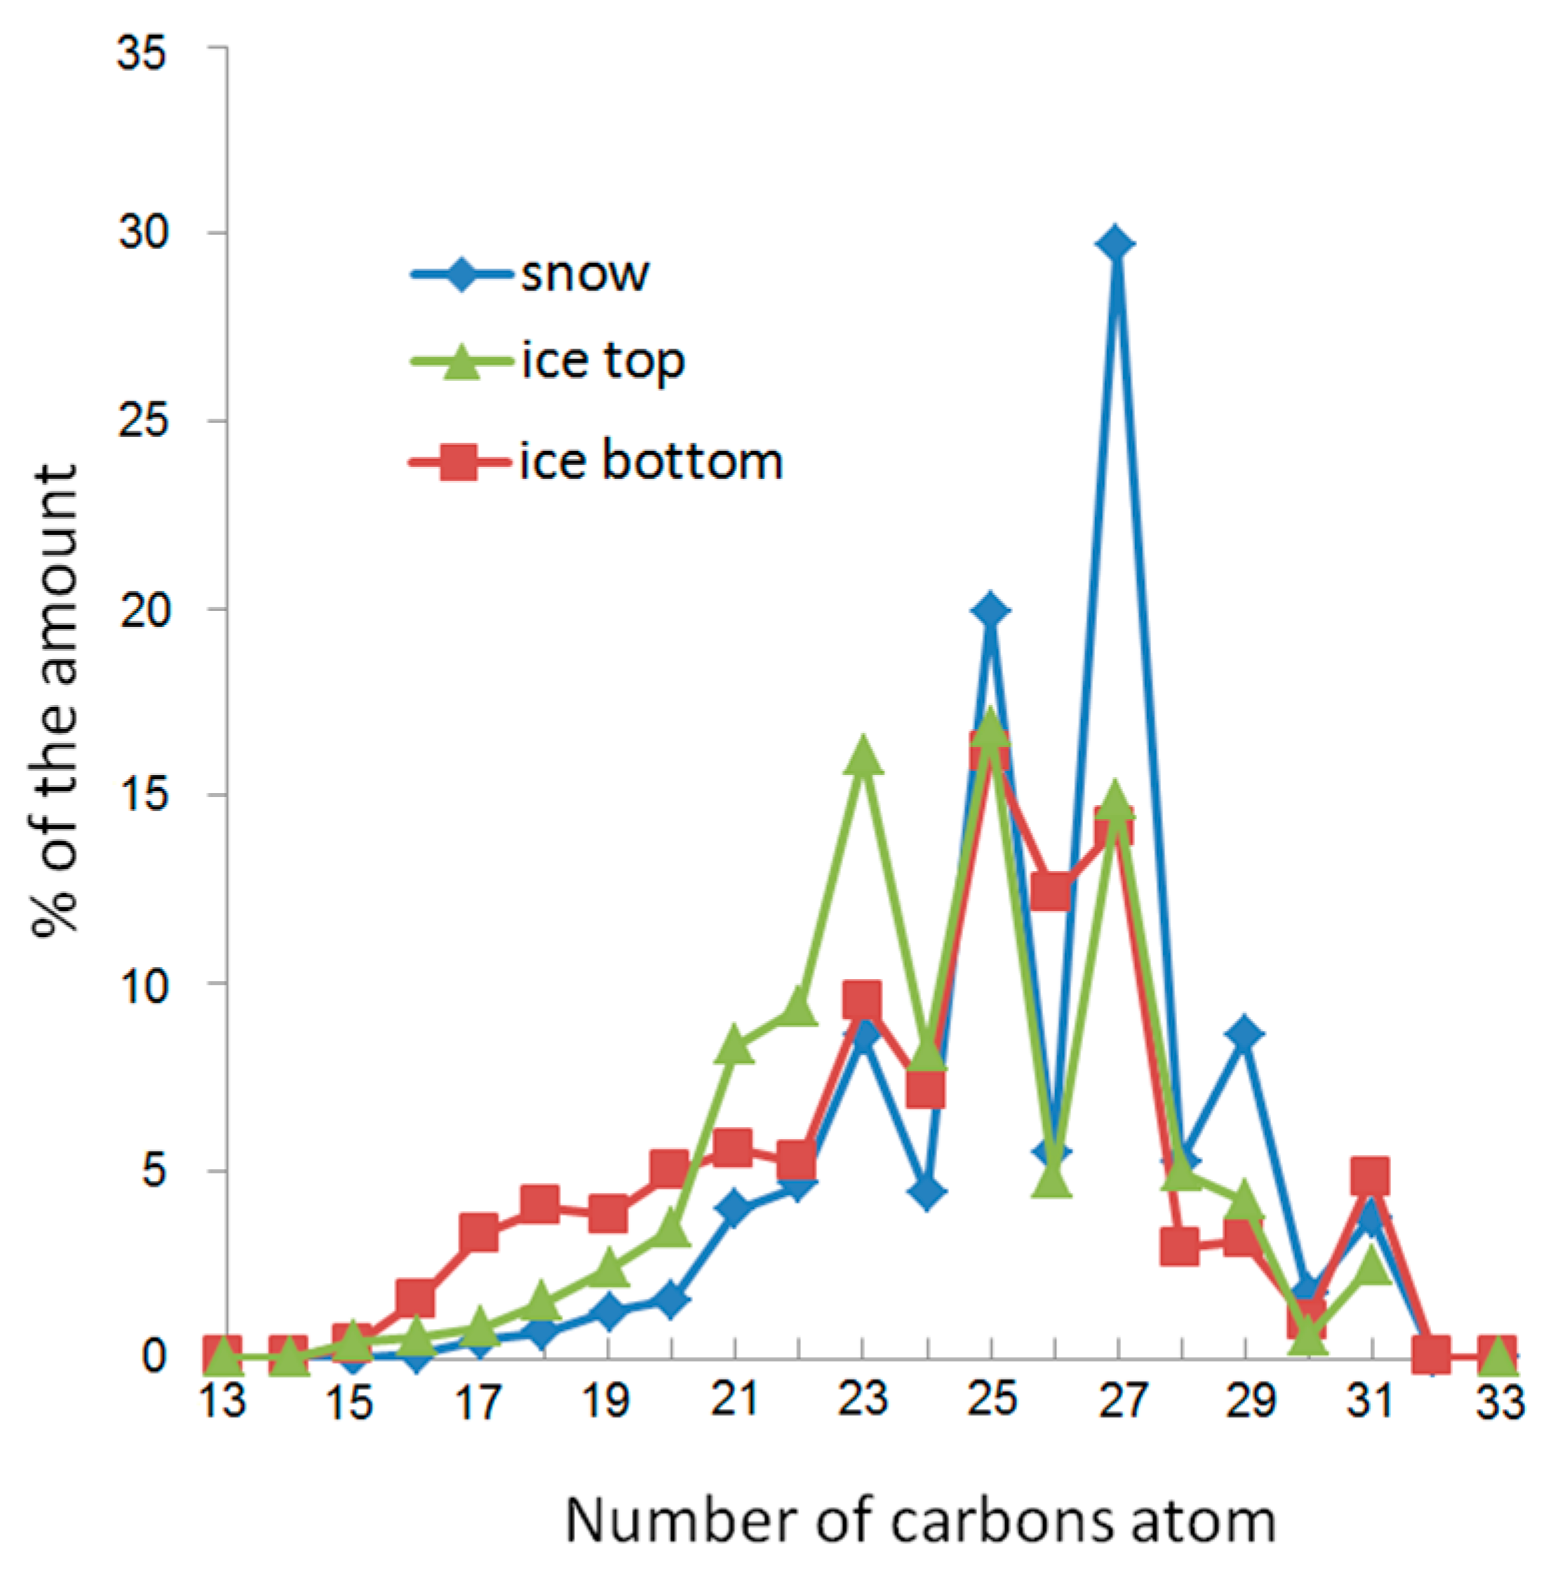
The composition of the alkanes in snow and ice was of the same type (Figure 9). A smooth distribution of homologues was observed in the low-molecular part, which is typical for weathered petroleum products, so the ratio of pristane/phytane (i-C19/i-C20) fluctuated in the range 0.25–0.36. In the high-molecular part, uneven terrigenous alkanes predominated. The carbon preference index (CPI) varied in the range 4.23–1.93, with a maximum in snow. The minimum of this ratio was confined to the lower part of the ice because of the biogenic nature of the AHCs at the ice–water boundary.

3.2. Antarctic

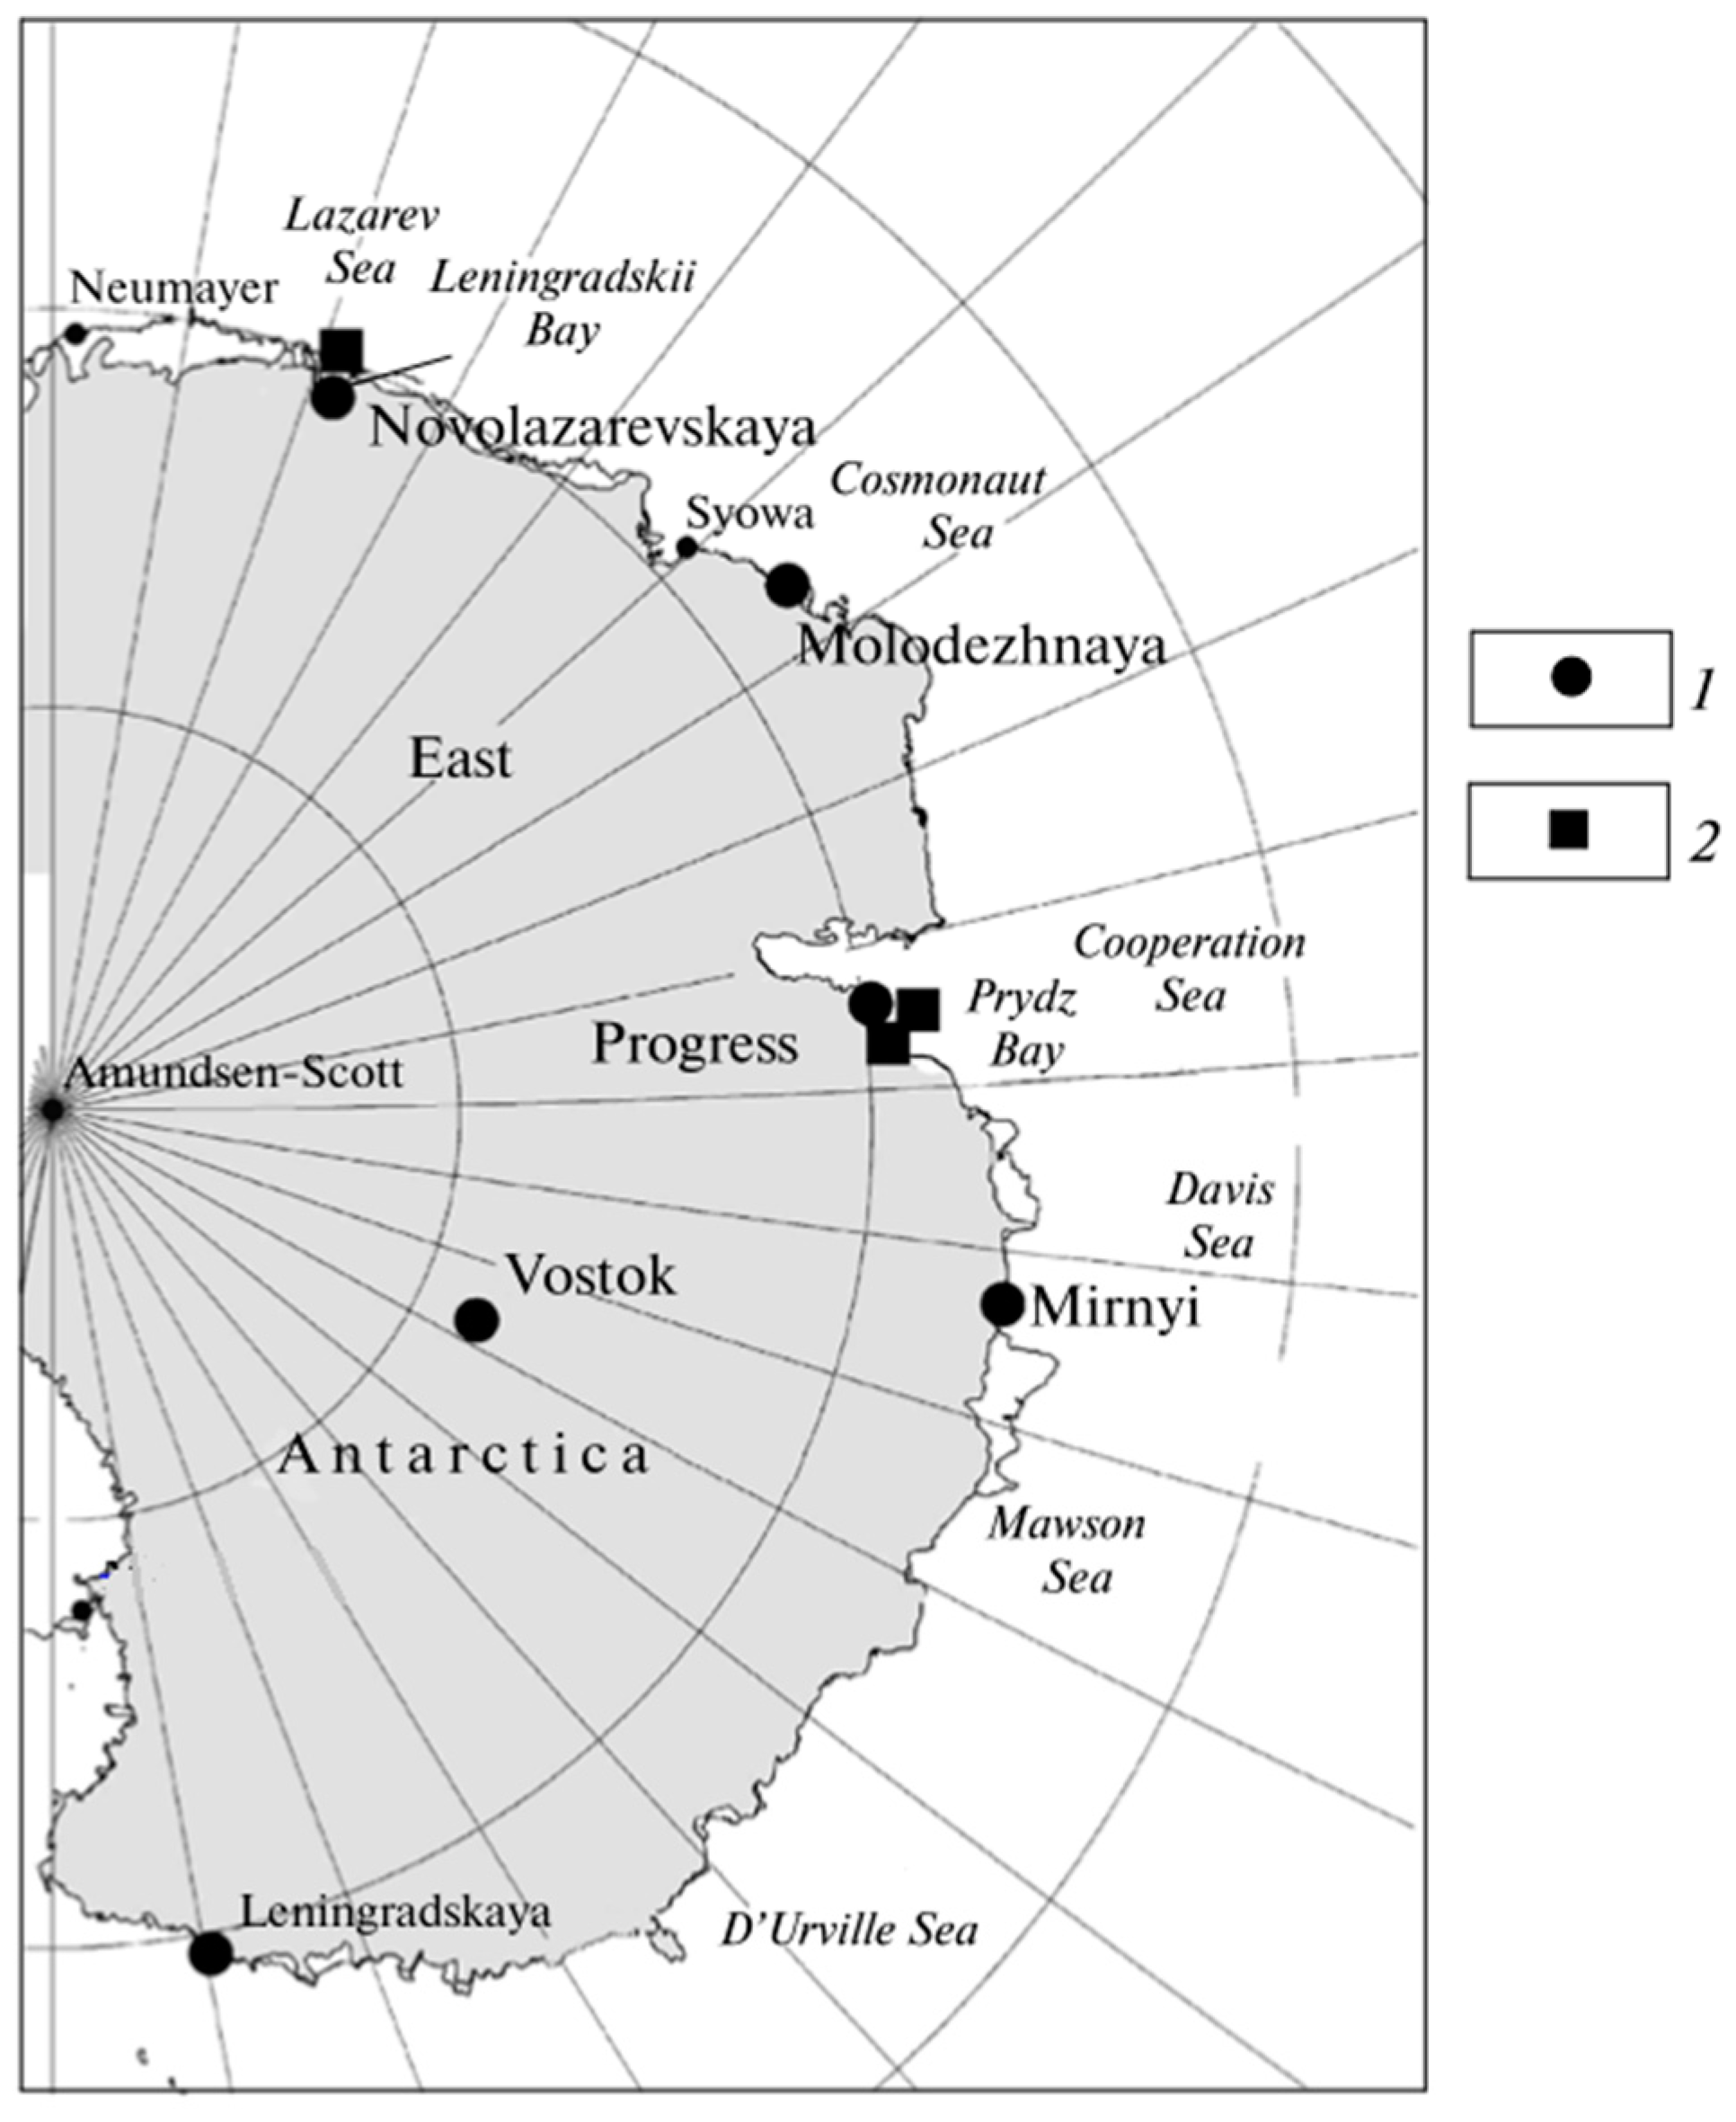
The location of Russian stations and the main areas of our work in the Antarctic region and on the mainland are shown in Figure 10. In the snow collected on the fast ice of Pryds Bay, the content of AHCs was below the limit of their detection by the methods we used, and even lower than in the Arctic Ocean in the region of the Mendeleev Rise, at the inaccessibility pole of the Northern Hemisphere (chapter on the Arctic).
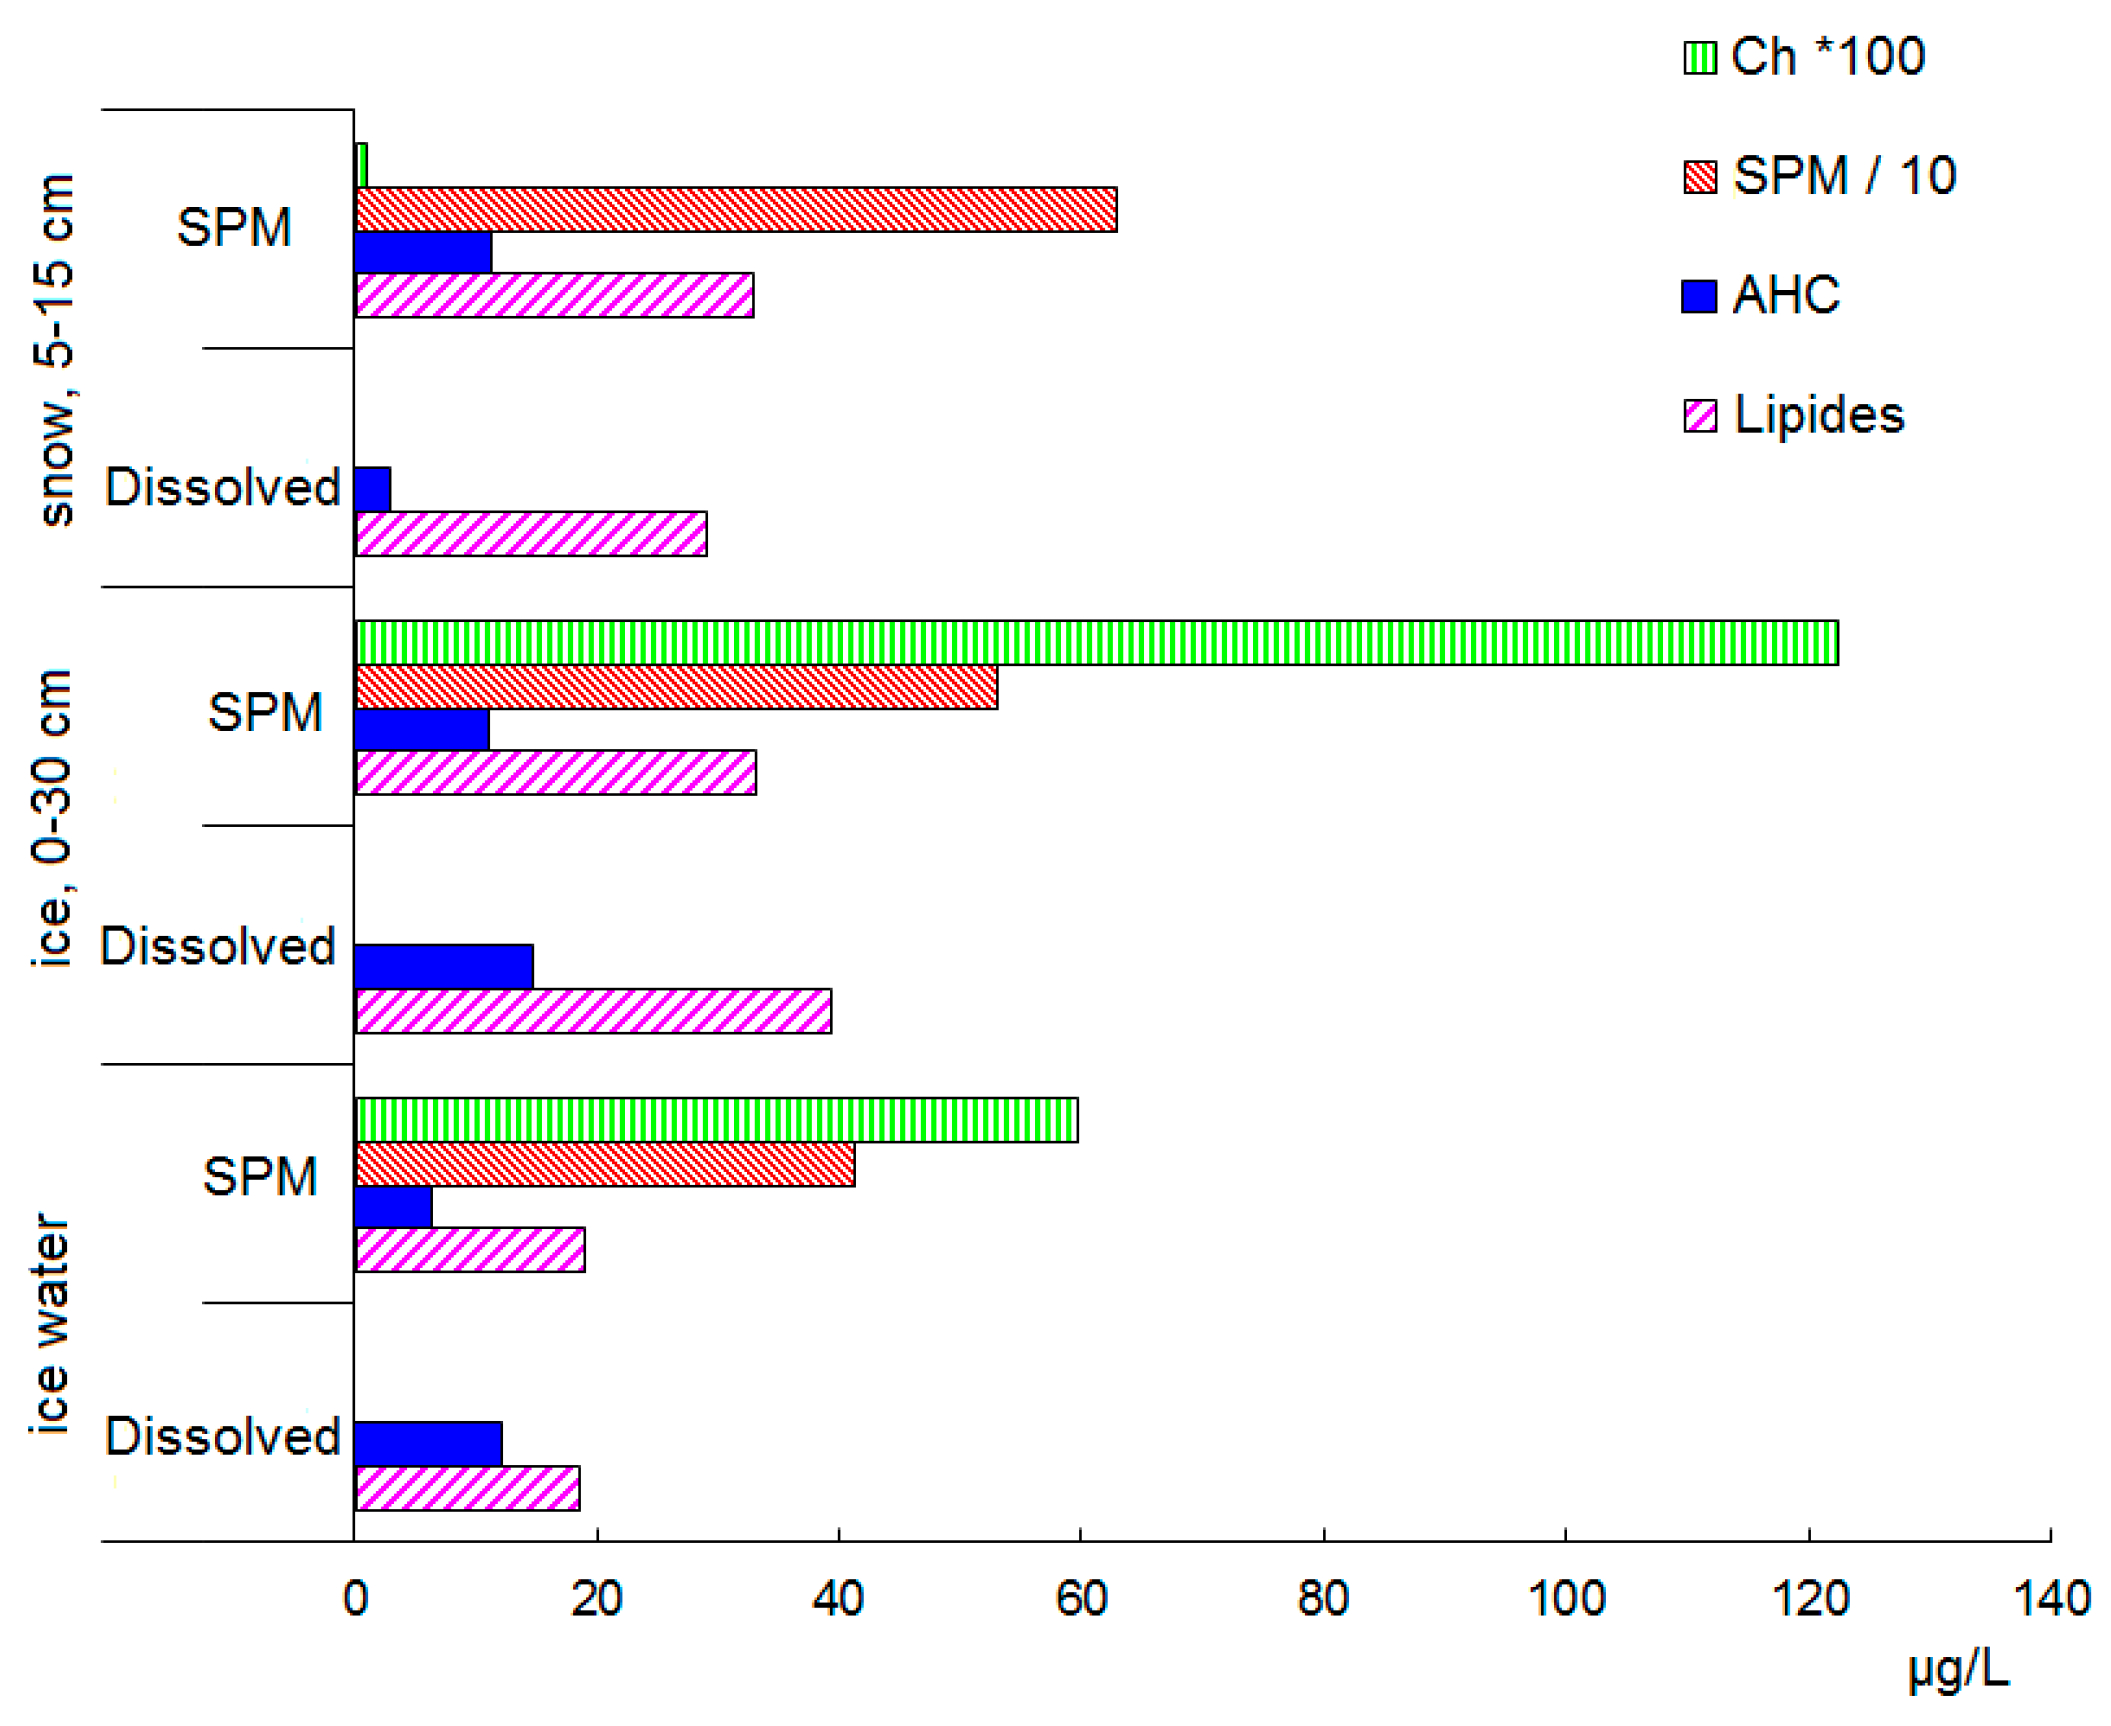
When snow falls on the sea water surface and not on ice, it appears as a snezhura from which a sludge is formed later. Its thickness can reach several centimeters, and the concentration of all OCs in it is increased in comparison with the underlying water (Figure 11). Under the influence of wind, this layer either collapses into the open sea, or accumulates near the islands and in the iceberg accumulation zones, forming a sludge [27].
At low temperatures of air and water, the sludge does not melt, it is frozen and is turned into young ice, which during a period of calm covers the entire coastal part of the sea. In this case, the particulate matter is suspended in the ice layer from the surface micro-layer of water, which leads to its mechanical concentration and an increase in the concentration of suspended forms of OCs. Therefore, the accumulation of SPM and the associated OCs was observed in the snezhura and pancake ice (Figure 11).
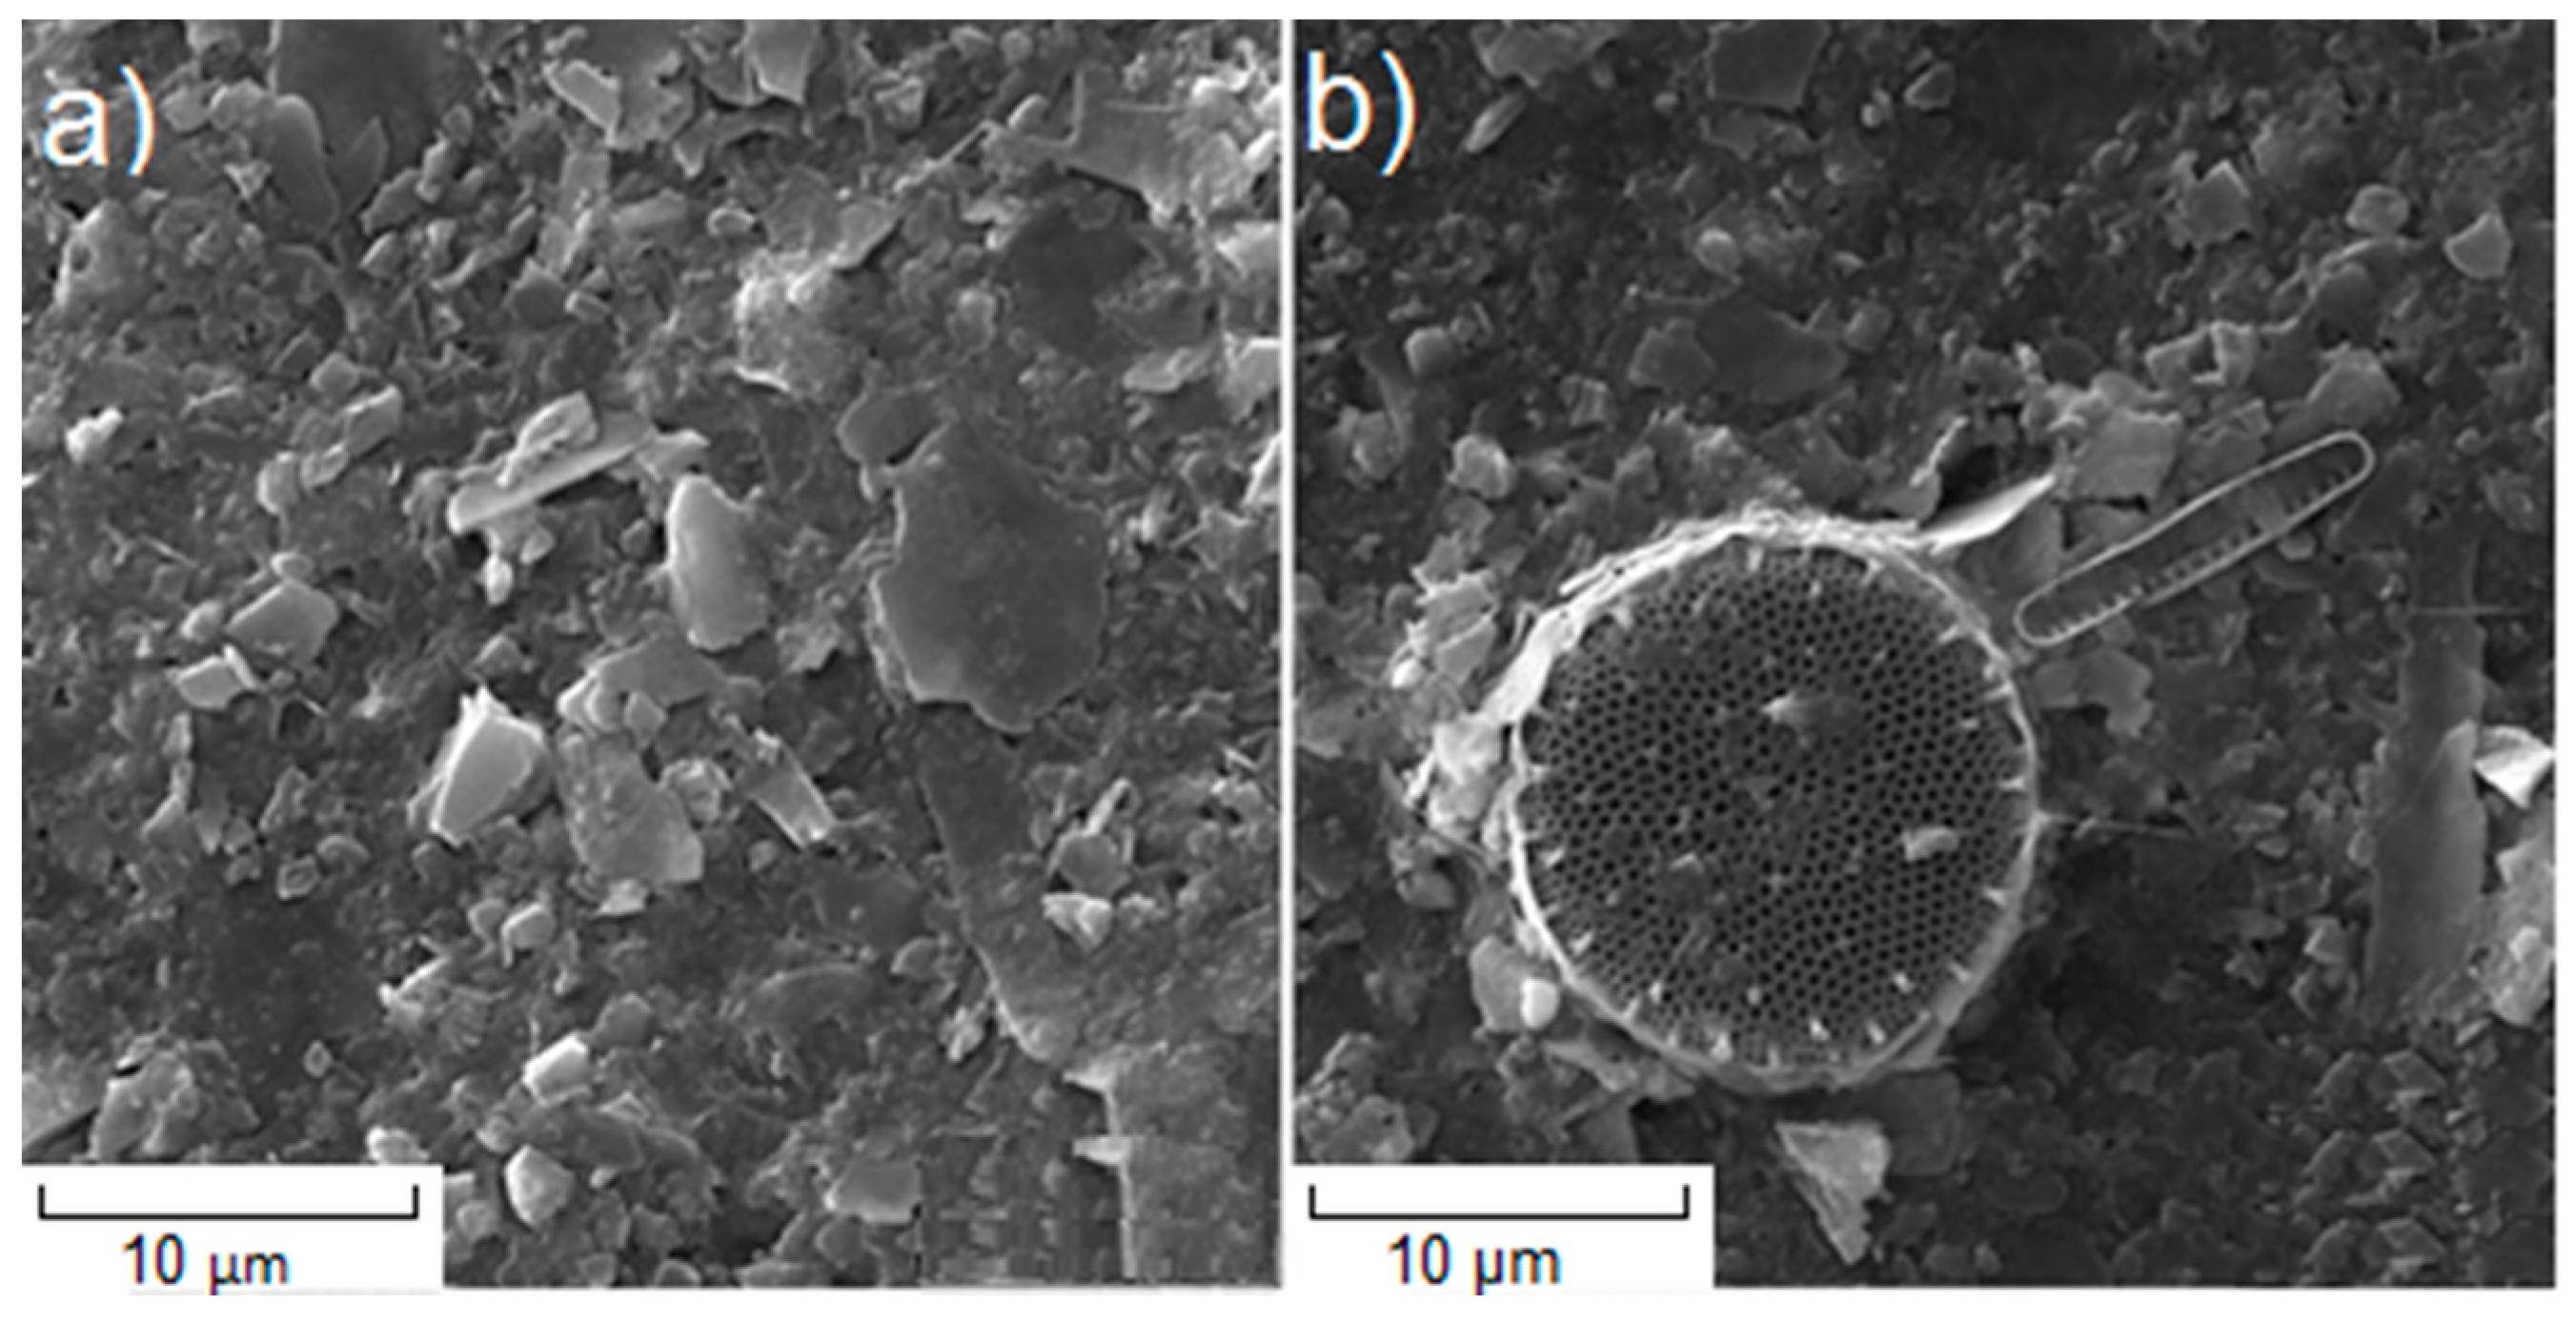
The absence of snow on the coastal hills in the Nella Fjord, Pruds Bay led to high concentrations of the compounds studied (Table 2). In hummocks of this region, at a suspension concentration of 0.67–2.44 mg/L, the AHC content in the suspension was as 10–60 μg/L and chlorophyll a was 0.15–0.29 µg/L. The low chlorophyll a was due to the predominance of suspended mineral particles over biogenic ones, which was confirmed by the material examination under a scanning electron microscope (Figure 12).
The AHC content in snow was also quite low at conserved stations. The concentration of AHCs in snow at conserved St. Molodezhnaya was equal to 22 μg/L (Table 3), increasing up to 56 μg/L in snow on ice in the area of the R/V “Akademik Fedorov”. The maximum concentration was St. Bellingshausen of 195 μg/L, where snow only partially covered the soil.
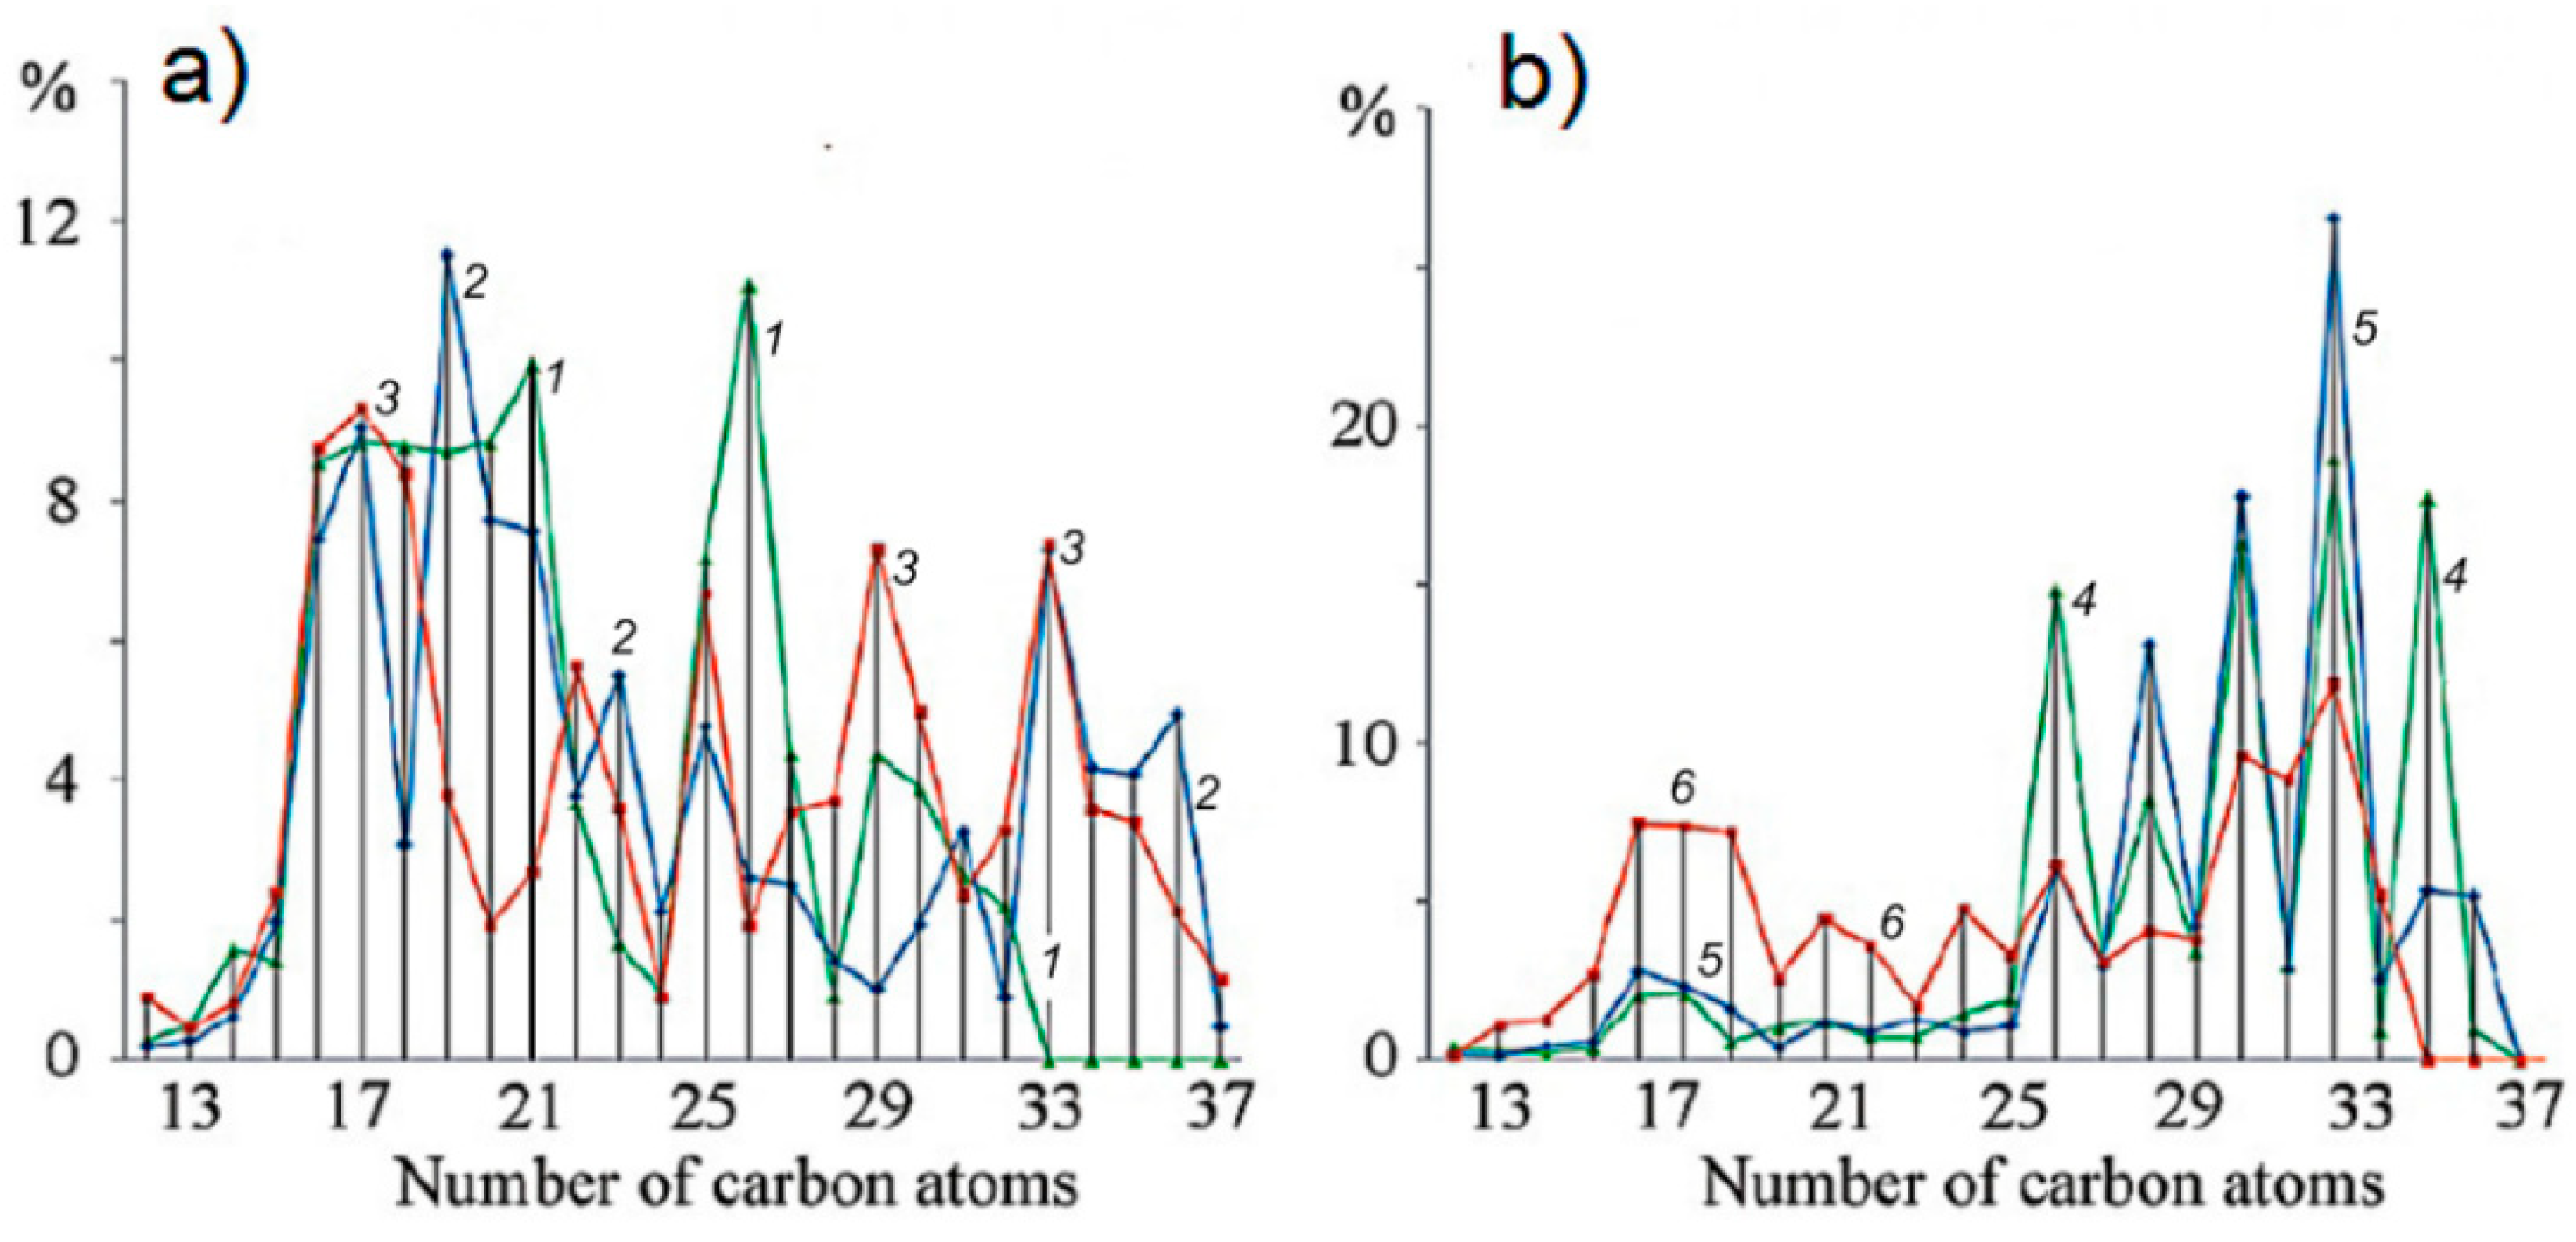
In the SPM of snow at St. Molodezhnaya, light alkanes prevailed (Table 4), since the ratio ΣC12–24/ΣC25–37 was >1 (63–65% of the total). In the snow near the lakes at St. Novolazarevskaya, the high molecular weight terrigenous odd alkanes dominated. Moreover, the proportion of light homologs increased to 48%, due to a small maximum at n-C16–C17, and on Verhnee Lake of up to 50%. Algae in Verhnee Lake were detected, the presence of which, together with the SPM activated the autochthonous AHC formation. To the greatest extent, the influence of terrigenous alkanes was characteristic for the snow of Geodezistov Lake (Figure 13, curve 6), where at the maximum AHC content (124 μg/L), the proportion of high molecular weight homologs reached 87%, and the CPI value was 6.63.
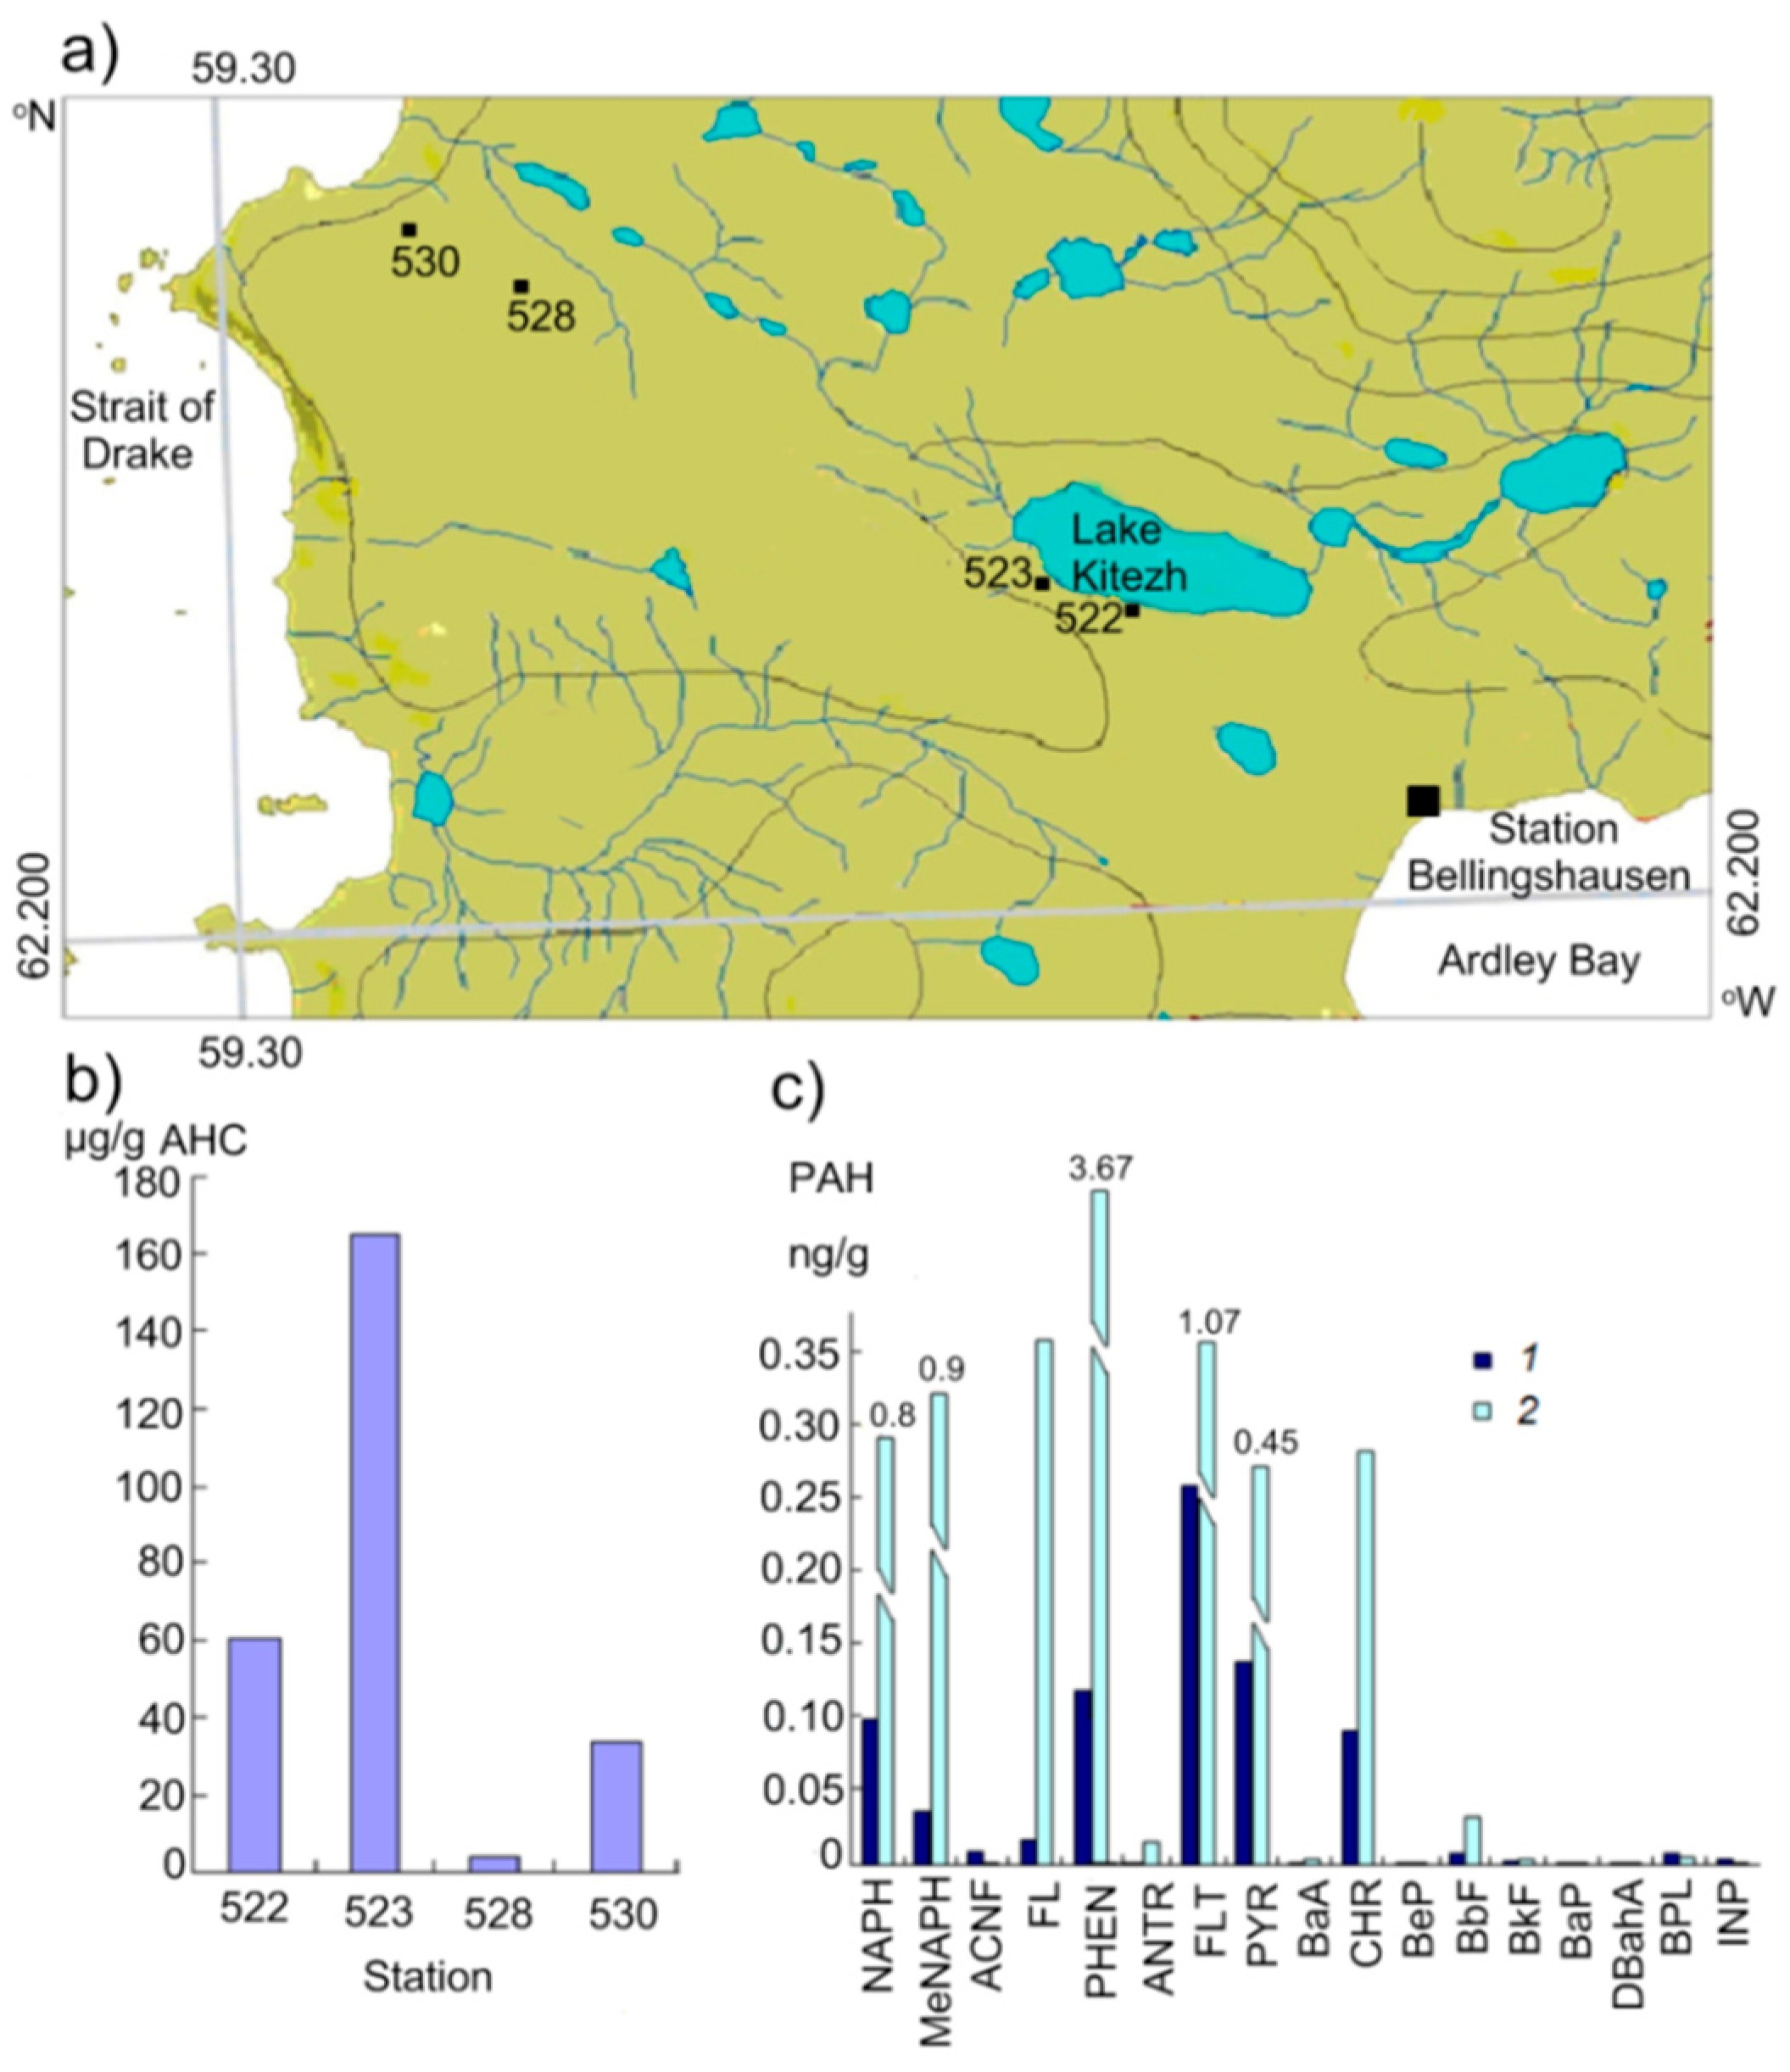
Unusual distribution of SPM and OCs was found in the snow-ice cover of the Kitezh Lake at St. Bellingshausen [28]. The snow here contained a lot of SPM of mineral origin (due to weathering of soils unprotected by snow). The maximum content of SPM was contained in the sludge (7.02 mg/L), the particles of which were accumulated during the freezing. Despite the relatively high concentration of Corg in SPM (61 μg/L), AHC concentrations remained low (5–7 μg/L), that is, other OCs were formed, not AHCs.
Significant interannual variability in the concentrations of all the studied compounds in the snow-ice cover was observed in the snow of Stepped Lake (Pruds Bay), located between the Russian St. Progress and the Chinese St. Zongshan (Table 3). In 2008, in the snow layer of 11–20 cm, the OC concentrations were almost four times higher than in the layer of 0–10 cm (freshly fallen snow). PAHs in these snow layers differed by almost two times, 467–959 ng/L, respectively. PAHs are mainly formed during the burning of fossil fuels [26,29]. In the composition of PAHs in the upper layer of snow, the proportion of natural compounds phenanthrene and chrysene was 62%, and in the lower, it was only 23%. The composition of PAHs in the upper ice layer also indicated the effect of pyrogenic compounds, since the PL/P = 0.74 (PL—fluoranten, P—pyrene).
In March 2010, the AHC content in the SPM of snow of Stepped Lake, when compared to 2008, increased to 56 µg/L, and then decreased by 2010. In March 2012, a SPM in snow on the lake was also characterized by low concentrations of chlorophyll a (0.01 μg/L) and a decrease compared to previous years with concentrations of SPM (0.67 mg/L), lipids (33 μg/L), and AHCs (15 μg/L). The lowest concentrations of OCs and SPM was detected in 2014 (Table 3, Figure 14), that is, aerosol releases from the atmosphere affect the distribution of SPM and OCs in snow.
An increase in OC concentrations occurs in mosses that accumulate organic compounds from the atmosphere [30]. AHCs changed in 2012 in the moss region of St. Bellingshausen in the range of 24–601 μg/g (Table 3, Figure 15b).
In 2019, the range of concentration AHC variability was lower: from 18 μg/g (Glubokoye Lake, St. Novolazarevskaya) to 142 μg/g (Norma Lake, St. Bellingshausen).
The contribution of AHC to Corg in moss at Novolazarevskaya Station varied within 0.13–10.5%, whereas it made up just 0.02–0.10% at Bellingshausen Station. This was caused by the high concentration of Corg (8.98–20.22%) in moss at Bellingshausen Station as the temperature rise there is accompanied by the active development of vegetation cover. In many samples, n-C23 dominated, but the chromatogram configuration was close (Figure 16b). The ratio of low- to high-molecular homologs was smaller and the values of CPI in the high-molecular region, which did not exceed 3.88 (Table 4).
The composition of PAHs in moss samples was close (Figure 16c): at total concentrations of 19–83 ng/g, only low molecular weight homologs were determined with two maxima for 1-methylnaphthalene and phenanthrene. The H/1H ratio fluctuated in the range of 0.11–0.14, and the proportion of naphthalenes was 63–68%, which indicated the effect of oil arenas.

4. Discussion

Snow scavenges aerosols from the atmosphere (including contaminants). SPM of snow defines the atmosphere in winter when adjacent lands are covered with snow and river and seas with ice, so aerosol matter input from the catchment area and sea surface is minimized; hence long-range (hundreds or thousands of kilometers) atmospheric transport of matter is particularly important. Snow cover has a number of features that make it a good indicator of ecosystem conditions [31,32,33,34,35]. Sampling of whole cores of snow cover (accumulated from the first snowfall until sampling) allows for the determination of the accumulation rates per unit area (i.e., flux of aerosol and dissolved aeolian matter) and therefore obtained quantitative and qualitative characterization of aeolian matter input to surface of the sea and catchment area. Two types of areas are distinguished by degree of the anthropogenic aerosols’ influence on snow cover composition: (1) the impacted areas (subjected to significant aeolian input from the closely located industrial centers) and (2) background regions (relatively remote from anthropogenic sources) [23].
Precipitation in the Central Arctic, as a rule, falls in solid form and forms a stable snow cover on drifting ice. The duration of occurrence in the polar region exceeds 320 days a year, and near the summer position of the edge of drifting ice is 60–70 days less. The average snow depth on the perennial ice of the Central Arctic Basin is 30–40 cm [6]. In the Arctic seas, it is about 1.5 times less, since in the seas the ice on which snow lays is formed only at the end of October—the beginning of November. The supply of a significant portion of matter sediment from the atmosphere is associated with snow, not only in the form of a thin suspension (aerosol), but also in the form of solutions. The ice cover becomes an aerosol accumulator, its additional long-range (thousands of km) carrier. Therefore, the Arctic is becoming a global trap for aerosol matter that passes into water and bottom sediments in depocenters—on the border of ice and temperate zones (on ice melting fronts) [1,35]. In pack ice, freezing of particles occurs many times, and aerosol particles of snow gradually enter their thickness and enter sea water only after melting, this exposure often lasts up to 10–15 years [31,36,37].
In the distribution of cryosols in the ice of the Central Arctic, two zones of accumulation of sedimentary material are distinguished: in the roof of the ice field, where insoluble particles brought in by snow are accumulated, and in the bottom of the ice, where newly formed ice captures suspended matter from under the ice water [38].
According to our data, despite the fact that the Franz Victoria Trough area and the Mendeleev Rise area are located at the same latitude in the Arctic Ocean ≈82° N, snow in the northern part of the Barents Sea was characterized by higher concentrations of AHCs having a terrigenous nature, compared with snow from the Mendeleev Rise, located outside the continental air masses. The influence of snow cover leads to the fact that the upper ice layers contain higher concentrations of Corg than the lower ones [39].
Based on electron microscopy data, insoluble particles contained in the Arctic’s snow and ice cover consist mainly of organic matter (phytoplankton test fragments, spores, pollen, diatom algae, single celled animals, etc.) and mineral particles (mineral grains and clay aggregates) [38]. For the snow cover, terrestrial soils are the main source of mineral particles. In winter, when the surface of the Arctic is covered by ice and snow, the main contribution is made by long-range transport including anthropogenic particles; their aeolian transport has been observed in nearly all the areas of the Arctic up to the North Pole [4,23]. The snow cover of the Earth’s high latitudes is an auspicious collector of both mineral and biogenic particles. Accumulating on the surface of the snow cover, they are preserved well and become fossilized with time. The lithogenic component in the snow cover is subordinate to the biogenic component and is represented by individual mineral grains. For the snow cover, the lithogenic component averages 20%; for the ice cover, 25%. Thus, the biogenic component predominates both in the snow (80%) and ice cover (75%) [38]. The snow cover of the Earth’s high latitudes is an auspicious collector of both mineral and biogenic particles. Accumulating on the surface of the snow cover, they are preserved well and become fossilized with time. The lithogenic component in the snow cover is subordinate to the biogenic component and is represented by individual mineral grains.
To analyze the qualitative and quantitative composition of atmospheric aerosol in the area of the White Sea, it is convenient to use the approach performed in [40,41] and improved in [42], which is based on the statistical processing of the spatial distribution of backward trajectories of air masses into this area during 10 years or more. Such a method allows us to study the averages (generalized over a long-term period) of the characteristics of both the arrival of air masses into the studied region and the impurities carried by it, and the processes of precipitation of atmospheric impurities onto the underlying surface [43]. The average composition of the aerosols in the atmosphere over the White Sea is qualitatively assessed from the ratio of aerosols of different types (marine, continental, arctic, arid) in different seasons and for the year. Besides analyzing the contributions to the composition of the aerosol of different anthropogenic constituents from the industry of European cities and regions, the average anthropogenic impact of these sources on the atmosphere and ground-based environmental objects of the studied area was quantified. According to the data on precipitation along the trajectories of the air near the observation site, the following estimates were obtained for the average precipitation values over the White Sea in different months: 25, 19, 67, and 42 mm/month for January, April, July, and October, respectively [23]. These values correspond to an annual precipitation of about 460 mm/year and fit well into the range of values from 300 to 600 mm/year (depending on the specific site) typical for the White Sea region [44].
The OCs content in the atmosphere of the White Sea coastal areas were increased in the winter. The aerosol measurements indicated a higher abundance of particles of all grain size distributions [45]. As a result, AHCs were concentrated in snow and in the upper layer of the ice, especially in the mouth of the Severnaya Dvina River. The precipitating snowflakes were characterized by the good ability to clean the atmosphere from the aerosol matter. In other words, there is a functioning pump that evacuates the aerosol particles of the far-distant transfer, which contain both natural and anthropogenic, organic and inorganic components, and transports them to the seawater surface or the ice cover [1]. Therefore, the OC content was higher in the snow than in ice and under-ice water, which shows the OC supply from the atmosphere with aerosols. The concentrations of all the OCs increased in the aquatic area of Arkhangelsk in comparison with the Pinega River region. The growth of the AHC concentrations in the ice cover of the Dvina Bay was caused by their absorption from the polluted under-ice water, in which the average content in the dissolved fraction was very high (>50 µg/L). In this case, the fraction of AHCs in the lipid composition amounted up to 87%.
During the winter–spring period, the pollutants were supplied to the rivers due to the washout from the banks. The water regime of the rivers of the Severnaya Dvina drainage basin is mainly determined by the snowy feed [31]. The ice mostly accumulates the pollutants occurring already in the basin and distinctly decreases the natural self-purification capacity of the basins because its surfaces above and under the water may adsorb oil [46]. Probably, within high concentrations in water (up to 280 µg/L), the AHCs are transferred into the ice with the liquid phase from the under-ice water (up to 402 µg/L). The ice formation proceeds within a small water-air temperature gradient, the ice becomes porous (up to 100 cm3/kg), and its lower layers acquire increased sorption properties [47]. Moreover, the porosity increases the result of the oil migration through the mass of the multiyear ice. This causes a considerable decrease of the mechanical strength of the ice. Under the interaction of the oil and the one-year ice during the spring–summer period, the rapid migration of the oil takes place [48].
The mechanism of the ice growth from above is characteristic for coastal ice. Therefore, the AHC content in the snow and the upper layers of the ice in the mouth of the Severnaya Dvina River and in the Kandalaksha Bay was higher than that in the lower layers of the ice (2010).
Formerly, the maximum degree of AHC concentration was found in the sludge formed on the marine surface under a heavy snowfall [49]. The cake ice and the ice crust also contained more OCs than the subglacial water. The growth of accumulation in the particulate matter was registered for the hydrophobic low-soluble compounds characterized by a high affinity with the “water–atmosphere” and “water–solid particles of particulate matter” interfaces. Under a sea disturbance, the water softens the ice and dually affects its structure: the number of canals and capillaries in ice increase and their diameters enlarge, characterized by a high affinity with the “water–atmosphere” and “water–solid particles of particulate matter” interfaces. Under a sea disturbance, the water softens the ice and dually affects its structure: the number of canals and capillaries in ice increase and their diameters enlarge [47]. Water, with waves on the surface, softens the ice and has a double effect on its structure: it increases the number of channels and capillaries in the ice, and also expands their diameter [47]. This intensifies the exchange processes between water and ice. This intensifies the exchange processes between the water and ice. The concentrations of HCs in the fresh forms of ice become comparable to those in the surface microlayer captured by the ice during the freezing [10]. Due to this, the AHC content in the upper layer of ice (17–143 µg/L in the particulate matter) in the coastal areas of the White Sea is higher than that in the background areas of the Arctic and Antarctic (6–28 µg/L).
The lower layer of ice was characterized by both the mechanical concentrating of the OCs including the AHCs, and the photosynthesis of algae on the ice–water interface promoting the production of these compounds [10,39]. The SPM of the lower layer of ice was characterized by biological diversity. The studies of a population of the seasonal ice in the White Sea revealed that the greatest abundance of bacteria was peculiar to the upper and medium layers of the ice of snowy genesis in early winter and to the lower layers of aquatic genesis in the spring [19]. At the end of March, the maximum of the bacterial abundance was in the lowest layer of ice a few cm thick. As a result, the AHC concentrations in the lower layer of the one-year coastal ice of the White Sea sampled in early winter might be less (19 µg/L on average, the mouth of the Severnaya Dvina River, 2008) than those in the multiyear coastal ice of the background regions (139 µg/L on average, Antarctica, Prudz Bay, 2010).
In coastal areas of the Antarctica, the sea salts coming from ocean waters serve as the main source of atmospheric pollution [32] as well as the specific Antarctic flora and microorganisms. Aeolian transport of terrigenous AHCs (in the form of residues of higher terrestrial vegetation) from the American and African continents is insignificant. Therefore, in the coastal areas of Antarctica, there is a minimal amount of aerosol particles in the atmosphere compared to other areas. The authors’ data coincided with the results obtained before in the area of the Mirny Station in Antarctica, where aerosol particles >1 nm were not observed as a rule [50]. The weakening of meridional processes in winter reduces the inflow of sea air to the glacier, thus leading to a still greater decrease in the concentration of fine particles in surface aerosol.
Our data showed that the mean aerosol concentrations in the fraction of 0.3–1.0 µm for different regions (2019) increased in the following sequence (particle/L): the area of Antarctica (6182) < South Atlantic (9130) < Cape Town–Antarctic section (17338) < North Atlantic (24236) [51]. It is noteworthy that the aerosol particle concentration in the open ocean at the Cape Town–Antarctic section depended on the speed of wind, which blows them out of the sea surface (r = 0.82 was the coefficient of correlation between wind speed and the number of particles). At the section near the Antarctic coast, the correlation was much lower (r = 0.34), most likely due to the flow of aerosol particles from the continent. In the Southern Hemisphere, the maximum concentrations of aerosol particles were registered in the northern arid part of the section (from Cape Town to the Southern Ocean, off the African coast). It is apparently caused by the influence of aeolian flows from the African continent and by the features of their circulation at 50°S. The aerosol inflow from Patagonia leads to the increase in their concentration in the South Atlantic Ocean [52].
Oil pollution across Antarctica is low compared with other regions of the world, concentrated at sites of human activity near rare ice-free coastal areas. It occurs from a range of activities including the national Antarctic programs, tourism, and fishing. Historic sources exist from abandoned infrastructure and stations, vehicle wrecks, waste disposal sites, waste water discharge, and past whaling activities. The oil pollution of the Antarctic environment has changed as well as the residual properties and toxicities resulting from differing degrees of weathering and degradation. All human activities in this area are associated with fuel overload and consumption. Oil spills occur at many Antarctic stations [53,54]. In addition, in the Antarctic, despite the insignificant intensity of shipping, ship accidents also occur, information about which mainly relates to western, more navigable areas. The majority of available data on the oil HCs in the Antarctic ecosystem refer to the western region, particularly to the Antarctic Peninsula [53,54,55,56,57].
However, the ice regime in the western and eastern parts of the continent is different. The temporary global warming affects for the most part the glaciers of West Antarctica. In East Antarctica, they continue to grow, which is an important positive factor in the development of the environment [58].
A study of the effect of long-range atmospheric transport on the PAH levels in the snow of West Antarctica showed that this source does not significantly contribute to snow pollution [55,56]. Strong western winds blowing in winter from 40–60° S isolate the continent from long-range atmospheric transport. Therefore, outside the settlement, significant snow pollution does not occur. The main sources of PAH pollution are regional research stations and ocean transport, mainly tourism.
Despite this, our results on the composition of PAHs in snow coincided with those obtained in snow on the Ekstrom Shelf Ice in the Weddell Sea [55] where PAH concentrations in snow varied within the range of 26–197 ng/L. The most prevailing substances were determined to be naphthalene, 1- and 2-methylnaphthaltne acenaphthylene, acenaphthene, and phenanthrene, with naphthalene accounting for an overall mean of 82% of total PAH.
In the areas of oases, the concentrations of OC (except for chlorophyll a) and suspended matter in snow samples were several times higher than in other regions of the continent due to the input of particles blown out by strong winds from local soils [28]. The interannual variability of concentration of AHCs in the snow cover in the area of the Novolazarevskaya Station is associated with interannual variability of strong winds typical for the Schirmacher Oasis [59]. Their concentration in the area of Novolazarevskaya Station varied within 72–124 μg/L in 2019. However, the concentration of AHCs in SPM in snow depended not exclusively on the concentration of suspended matter, because no relations in their values occurred. In particular, in 2012, the maximum concentration of AHCs was determined at Novolazarevskaya Station in snow near Verkhnee Lake: 360 μg/L at the concentration of SPM equal to 0.78 mg/L. In contrast, the concentration of AHCs in snow on Stantsionnoe Lake were equal to 22 μg/L at the concentration SPM of 4.15 mg/L [28]. However, as well as in 2019, natural biogenic compounds with the maximum for n-C17 dominated in the alkanes’ composition in snow nearby the Verkhnee Lake. The continental lakes, despite their low biological productivity, are the hearths of life [60]. Algae whose presence favored the formation of different organic compounds including AHCs were detected in the Verkhnee Lake.

5. Conclusions

Snow cover in the high latitudes of the Earth functions as a collector of both mineral and biogenic and anthropogenic particles. Accumulating in the snow cover, these particles are well preserved in the upper layer of ice.
In the Arctic, the snow fluxes of OC are largely influenced by the continental air masses. Therefore, in the Arctic Ocean, the lowest OC concentrations in snow are detected on drifting sea ice in the area of the Mendeleev Rise. In Antarctica, the lowest OCs levels were found in areas where coastal hills are covered with snow.
The predominance of mineral particles contributes to the low OC content in the SPM of the snow. At the initial stage of ice formation, the concentrations of particulate matter and OCs in it increased due to the effect of the so called “ice pump” [31]. This phenomenon is caused by the incorporation of neuston from the surface microlayer and windy onset of algae in the slush ice bands. The coastal ice showed a regular increase in the concentration of SPM and OCs toward the ice–water boundary.
The long-term studies of the snow-ice cover of the White Sea show the considerable variability of the AHC concentrations from year to year. Their decrease in the last years is probably related to the reduction of the industrial activity. The low fraction of AHCs among the other OCs was caused by the composition of atmospheric emissions. As a result, the pyrogenic polyarenes were mostly supplied in the snow cover.
The snow cover serves as a sink pool for the aerosol pollutants supplied from the atmosphere and the marine surface (the effect of “blotting paper”). Therefore, the concentrations of AHCs in the snow of the White Sea are higher than those in the background areas. The distribution of the markers within the PAH composition in the snow-ice cover shows the local fallout of the bulk of the pollutants.
In the areas of oases, the concentrations of OC (except for chlorophyll a) and suspended matter in snow samples were several times higher than in other regions of the continent due to the input of particles blown out by strong winds from local soils. The interannual variability of concentration of AHCs in the snow cover in the area of the Novolazarevskaya Station was associated with interannual variability of strong winds typical for the Schirmacher Oasis.
In the solid fraction of snow and mosses in the area of the operating stations, low-molecular weight PAHs with the dominance of petroleum hydrocarbons were mostly found.

Author Contributions

I.A.N. collected snow samples in the Arctic (Franz Victoria Trough and Mendeleev Rise area) and Antarctica, V.P.S. collected snow samples in the Arctic (the White Sea and its catchment basin); I.A.N. analyzed organic compounds; V.P.S. took part in study of suspended particulate matter; I.A.N. and V.P.S. interpreted the results and made the layout of the article. All authors have read and agreed to the published version of the manuscript.

Funding

The results of the studies were obtained within the state task (No. 0128-2019-0011); sampling in the White Sea region and sample treatment were supported by the Russian Foundation for Basic Research (grant 19-05-00938); and summary of the results by the Russian Scientific Foundation (project No. 19-17-00234).

Acknowledgments

The authors are grateful to Belorukov S.K., Bulokhov A.V., and Demidenko N.A. for their assistance in sampling, Boev A.G. and Khramtsova A.V. for assistance in conducting the analyses, and to Gordeev V.V., Demina L.L., and Novigatsky A.N. for their valuable comments and advice when discussing the results. The authors are grateful to the comments of the anonymous reviewers whose effort and suggestions have helped to make this a stronger contribution.

Conflicts of Interest

The authors declare no conflict of interest.

References

  1. Lisitzin, A.P. Modern concepts of sedimentation in the oceans and seas. Ocean as a natural recorder of geospheres’ interaction. In The World Ocean; Lobkovsky, L.I., Lisitzin, A.P., Neiman, V.G., Romankevich, E.A., Flint, M.V., Yakovenko, O.I., Eds.; Nauchnyi Mir: Moscow, Russia, 2014; Volume 2, pp. 331–571. ISBN 978-5-91522-344-7. (In Russian) [Google Scholar]
  2. Mandrioli, P.; Negrini, M.G.; Cesari, G.; Morgan, G. Evidence for long range transport of biological and anthropogenic aerosol particles in the atmosphere. Grana 1984, 23, 43–53. [Google Scholar] [CrossRef]
  3. Currie, L.A.; Kessler, J.D.; Fletcher, R.A.; Dibb, J.A. Long range transport of biomass aerosol to Greenland: Multi-spectroscopic investigation of particles deposited in the snow. J. Radioanal Nucl. Chem. 2005, 263, 399–411. [Google Scholar] [CrossRef]
  4. Shevchenko, V.P. The Effect of Aerosols on the Environment and Marine Sedimentation in the Arctic; Nauka: Moscow, Russia, 2006; ISBN 5-02-032656-9. (In Russian) [Google Scholar] [CrossRef]
  5. Savvichev, A.S.; Rusanov, I.I.; Mitskevich, I.N.; Bairamov, I.T.; Lein, A.Y.; Lisitzin, A.P. Features of biogeochemical processes of the carbon cycle in the water column, bottom sediments, ice and snow cover of the Barents Sea. In Experience of System Oceanologic Studies in the Arctic; Lisitzin, A.P., Vinogradov, M.E., Romankevich, E.A., Eds.; Nauchnyi Mir: Moscow, Russia, 2001; pp. 394–408. ISBN 5-89176-160-2. (In Russian) [Google Scholar]
  6. Voskresensky, A.I.; Petrov, L.S. Climate features. In Arctic and Southern Oceans; Treshnikov, A.E., Salnikov, S.S., Eds.; Nauka: Leningrad, Russia, 1985; pp. 45–64. (In Russian) [Google Scholar]
  7. Kitaev, L.M. Spatio-temporal variability of snow depth in the Northern Hemisphere. Meteorol. Hydrol. 2002, 5, 20–25. (In Russian) [Google Scholar]
  8. Melnikov, I.A. Winter production of sea ice algae in the western Weddell Sea. J. Mar. Systems. 1998, 17, 195–205. [Google Scholar] [CrossRef]
  9. Rose, N.L.; Ruppel, M. Environmental archives of contaminant particles. In Environmental Contaminants, Developments in Paleoenvironmental Research 18; Blais, J.M., Rosen, M., Smol, J.P., Eds.; Springer: Dordrecht, The Netherlands, 2015; pp. 187–221. [Google Scholar]
  10. Nemirovskaya, I.A. Oil in the Ocean (Pollution and Natural Flows); Nauchnyi Mir: Moscow, Russia, 2013; 432p, ISBN 978-5-91522-352-2. (In Russian) [Google Scholar]
  11. Korshenko, A. (Ed.) Marine Water Pollution. Annual Report 2018; Nauka: Moscow, Russia, 2019; 190p. (In Russian) [Google Scholar] [CrossRef]
  12. Savinov, V.; Larsen, L.H.; Green, N.; Korneev, O.; Rybalko, A.; Kochetkov, A. Monitoring of Hazardous Substances in the White Sea and Pechora Sea: Harmonisation with OSPAR’s Coordinated Environmental Monitoring Programme (CEMP); Akvaplan-niva: Tromsø, Norway, 2011; 71p, APN 414.5124. [Google Scholar]
  13. Lyutsarev, S.V. Determination of organic carbon in marine bottom sediments by dry burning method. Oceanology 1986, 26, 704–708. (In Russian) [Google Scholar]
  14. Melnikov, I.A. Ecosystems of Arctic Sea Ice; IORAN: Moscow, Russia, 1989. (In Russian) [Google Scholar] [CrossRef]
  15. Melnikov, I.A. Antarctic Sea Ice Ecosystems: A Comparative Analysis. In Arctic and Antarctic; Nauka: Mocow, Russia, 2003; Volume 36, pp. 149–164. (In Russian) [Google Scholar]
  16. Zubov, N.N. Ice of the Arctic; Glavsevmorput: Moscow, Russia, 1944; Volume 360. (In Russian) [Google Scholar]
  17. Pantyulin, A.N. Glaciation and ice of the White Sea according to observation data. In The White Sea System; Lisitzin, A.P., Ed.; Nauchnyi Mir: Moscow, Russia, 2012; Volume 2, pp. 120–131. ISBN 978-5-91522-319-5. (In Russian) [Google Scholar]
  18. Sazhin, A.F.; Ratkova, T.N. Population of seasonal ice of the White Sea. In The White Sea System; Lisitzin, A.P., Ed.; Nauchnyi Mir: Moscow, Russia, 2012; Volume 2, pp. 201–224. ISBN 978-5-91522-319-5. (In Russian) [Google Scholar]
  19. Sazhin, A.F.; Ratkova, T.N.; Kosobokova, K.N. Population of the coastal ice of the White Sea in the early spring period. Oceanology 2004, 44, 92–100. [Google Scholar]
  20. Cherepanov, N.V.; Kozlovsky, A.M. Typing of Antarctic sea ice according to the conditions of their formation. Probl. Arctic Antarct. 1973, 42, 55–58. (In Russian) [Google Scholar]
  21. Cherepanov, N.V.; Fedotov, V.I.; Tyshko, K.P. The crystal structure of sea ice. In Sea Ice; Gidrometeoizdat: St. Petersburg, Russia, 1997; pp. 36–37. (In Russian) [Google Scholar]
  22. Shevchenko, V.P.; Filippov, A.S.; Novigatsky, A.N.; Gordeev, V.V.; Goryunova, N.V.; Demina, L.L. Dispersed sedimentary matter of freshwater and sea ice. In The White Sea System; Lisitzin, A.P., Ed.; Nauchnyi Mir: Moscow, Russia, 2012; Volume 2, pp. 169–201. ISBN 978-5-91522-319-5. (In Russian) [Google Scholar]
  23. Shevchenko, V.P.; Lisitsyn, A.P.; Vinogradova, A.A.; Starodymova, D.P.; Korobov, V.B.; Novigatsky, A.N.; Kokryatskaya, N.M.; Pokrovsky, O.S. Dispersed sedimentary matter of the atmosphere. Biogeochemistry of the Atmosphere, Ice and Water of the White Sea: The White Sea Environment Part I. In The Handbook of Environmental Chemistry; Springer: Berlin/Heidelberg, Germany, 2018; Volume 81, pp. 9–46. [Google Scholar] [CrossRef]
  24. Nemirovskaya, I.A. Organic Compounds in the snow-ice cover of the White Sea. Biogeochemistry of the Atmosphere, Ice and Water of the White Sea: The White Sea Environment Part I. In The Handbook of Environmental Chemistry; Springer: Berlin/Heidelberg, Germany, 2018; Volume 81, pp. 291–311. [Google Scholar] [CrossRef]
  25. Venkatesan, M.J. Occurrence and possible sources of perylene in marine sediments—A review. Mar. Chem. 1988, 25, 1–27. [Google Scholar] [CrossRef]
  26. Tolosa, I.; Mora, S.; Sheikholeslami, M.R.; Villeneuve, J.-P.; Bartocci, J.; Cattini, C. Aliphatic and aromatic hydrocarbons in coastal Caspian Sea sediments. Mar. Pollut. Bul. 2004, 48, 44–60. [Google Scholar] [CrossRef]
  27. Buinitsky, V.K. Sea Ice and Icebergs of Antarctica; LSU: Leningrad, Russia, 1973. (In Russian) [Google Scholar]
  28. Nemirovskaya, I.A.; Kravchishina, M.D.; Rejepova, Z.Y. Organic compounds and suspension in snow-ice covers and soils in the vicinities of the Russian Antarctic stations. Ice Snow 2015, 55, 114–126. [Google Scholar] [CrossRef]
  29. AMAP (Arctic Monitoring and Assessment Programme). Sources, Inputs and Concentrations of Petroleum Hydrocarbons, Polycyclic Aromatic Hydrocarbons, and other Contaminants Related to Oil and Gas Activities in the Arctic; AMAP: Oslo, Norway, 2007; Chapter 4; ISBN 978-82-7971-048-6. [Google Scholar]
  30. Bardin, V.I.; Korokevich, E.S.; Lebedev, V.L. Atlas of the Antarctic; Tolstikov, E.I., Avsyuk, G.A., Korotkevich, E.S., Eds.; Gidrometeoizdat: Leningrad, Russia, 1969; Volume 2. (In Russian) [Google Scholar]
  31. Lisitzin, A.P. Sea-Ice and Iceberg Sedimentation in the World Ocean. Recent and Past; Springer: Berlin/Heidelberg, Germany, 2002; 563р. [Google Scholar] [CrossRef]
  32. Vasilenko, V.N.; Nazarov, I.M.; Fridman, S.D. Monitoring of Snow Cover Pollution; Gidrometeoizdat: Leningrad, Russia, 1985. (In Russian) [Google Scholar]
  33. Boyarkina, A.P.; Baikovsky, V.V.; Vasiliev, N.V.; Glukhov, G.G.; Medvedev, M.A.; Pisareva, L.F.; Rezchikov, V.I.; Shelud’ko, S.I. Aerosols in Natural Archives of Siberia; Tomsk State University Publishers: Tomsk, Russia, 1985. (In Russian) [Google Scholar]
  34. Lisitzin, A.P. Oceanic Sedimentation: Lithology and Geochemistry; American Geophysical Union: Washington, DC, USA, 1996; 400p, ISBN 087590243X. [Google Scholar]
  35. Lisitzin, A.P. Marine ice-rafting as a new type of sedimentogenesis in the Arctic and novel approaches to studying sedimentary processes. Russ. Geol. Geophys. 2010, 51, 12–47. [Google Scholar] [CrossRef]
  36. Eicken, H.; Reimnitz, E.; Alexandrov, V.; Martin, T.; Kassens, H.; Viehoff, T. Sea-ice processes in the Laptev Sea and their importance for sediment export. Cont. Shelf Res. 1997, 17, 205–233. [Google Scholar] [CrossRef] [Green Version]
  37. Pfirman, S.; Wollenburg, I.; Thiede, J.; Lange, M. Lithogenic sediment on Arctic pack ice: Potential aeolian flux and contribution to deep sea sediments. In Paleoclimatology and Paleometeorology: Modern and Past Patterns of Global Atmospheric Transport; Kluwer Academic Publishers: Dordrecht, The Netherlands, 1989; pp. 463–493. [Google Scholar] [CrossRef]
  38. Novigatsky, A.N.; Lisitzin, A.P. Concentration, composition, and fluxes of dispersed sedimentary material in the snow and Iie cover of the polar Arctic. Oceanology 2019, 59, 406–410. [Google Scholar] [CrossRef]
  39. Nemirovskaya, I.A.; Novigatskii, A.N. Hydrocarbons in the snow and ice cover and waters of the Arctic Ocean. Geochem. Int. 2003, 41, 585–594. [Google Scholar]
  40. Vinogradova, A.A. Anthropogenic pollutants in the Russian Arctic atmosphere: Sources and sinks in spring and summer. Atmos. Environ. 2000, 34, 5151–5160. [Google Scholar] [CrossRef]
  41. Vinogradova, A.A.; Ponomareva, T.Y. Atmospheric transport of anthropogenic impurities to the Russian Arctic (1986–2010). Atmos. Ocean Opt. 2012, 25, 414–422. [Google Scholar] [CrossRef]
  42. Vinogradova, A.A. Distant evaluation of the influence of air pollution on remote areas. Izvestiya Atmos. Ocean Phys. 2015, 51, 712–722. [Google Scholar] [CrossRef]
  43. Hirdman, D.; Sodemann, H.; Eckhardt, S.; Burkhart, J.F.; Jefferson, A.; Mefford, T.; Quinn, P.K.; Sharma, S.; Ström, J.; Stohl, A. Source identification of short-lived air pollutants in the Arctic using statistical analysis of measurement data and particle dispersion model output. Atmos. Chem. Phys. 2010, 10, 669–693. [Google Scholar] [CrossRef] [Green Version]
  44. Vasil’ev, L.Y.; Vodovozova, T.E. Climate. In The White Sea System. Natural Environment of the Catchment Area of the White Sea; Lisitzin, A.P.I., Nemirovskaya, I.A., Shevchenko, V.P., Eds.; Nauchnyi Mir: Moscow, Russia, 2010; pp. 50–69. (In Russian) [Google Scholar]
  45. Nazarenko, Y.; Rangel-Alvarado, R.B.; Kos, G.; Kurien, U.; Ariya, P.A. Novel aerosol analysis approach for characterization of nanoparticulate matter in snow. Environ. Sci. Pollut. Res. 2017, 24, 4480–4493. [Google Scholar] [CrossRef]
  46. AMAP (Arctic Monitoring and Assessment Program). Pollution of Arctic: A Report on Environmental Conditions in Arctic; AMAP: St. Petersburg, Russia, 1998; 188p. (In Russian) [Google Scholar]
  47. Gershuni, G.Z.; Zhukhvitskii, E.M. Convective Stability of Incompressible Fluid; Nauka: Moscow, Russia, 1972; 392p. (In Russian) [Google Scholar] [CrossRef]
  48. Izmailov, V.V. Transport and Transformation of Oil Pollution of the Arctic Ocean; Gidrometeoizdat: St. Petersburg, Russia, 1999; 139p, ISBN 5-286-01251-5. (In Russian) [Google Scholar]
  49. Nemirovskaya, I.A.; Kravchishina, M.D. Biogeochemical features of the distribution of organic compounds and particulate matter in the snow-ice cover in East Antarctica. Geochem. Int. 2015, 53, 430–440. [Google Scholar] [CrossRef]
  50. Radionov, V.F.; Sveshnikov, A.M. Microstructure parameters of aerosol particles on the East Antarctic Coast. In Newsletter of the Russian Antarctic Expedition; Gidrometeoizdat: Saint Petersburg, Russia, 1999; Volume 119, pp. 64–72. (In Russian) [Google Scholar]
  51. Nemirovskaya, I.A. Organic compounds in the Antarctic coastal ecosystem. Russ. Meteorol. Hydrol. 2020, 45, 105–117. [Google Scholar] [CrossRef]
  52. Nemirovskaya, I.A. Sedimentary Matter and Organic Compounds in the Aerosols and Surface Waters along the Transatlantic Section. Geochem. Int. 2017, 55, 367–379. [Google Scholar] [CrossRef]
  53. Balks, M.R.; Paetzold, R.F.; Kimble, J.H. Effects of hydrocarbons spills on the temperature and moisture regimes of Creosols in the Ross Sea region. Antarct. Sci. 2002, 14, 319–326. [Google Scholar] [CrossRef] [Green Version]
  54. Kim, M.; Kennicutt, M.C., II; Qian, Y. Molecular and stable carbon isotopic characterization of PAH contaminants at McMurdo Station, Antarctica. Mar. Pollut. Bull. 2006, 52, 1585–1590. [Google Scholar] [CrossRef] [PubMed]
  55. Kukucka, P.; Lammel, G.; Dvorská, A. Contamination of Antarctic snow by polycyclic aromatic hydrocarbons dominated by combustion sources in the polar region. Environ. Chem. 2010, 7, 504–513. [Google Scholar] [CrossRef] [Green Version]
  56. Na, G.; Gao, Y.; Li, R.; Gao, H.; Ye, J.; Zhang, Z. Occurrence and sources of polycyclic aromatic hydrocarbons in atmosphere and soil from 2013 to 2019 in the Fildes Peninsula, Antarctica. Mar. Pollut. Bull. 2020, 156, 111–173. [Google Scholar] [CrossRef]
  57. Préndez, M.; Barra, C.; Toledo-Neira, C.; Richter, P. Alkanes and polycyclic aromatic hydrocarbons in marine surficial sediment near Antarctic stations at Fildes Peninsula, King George Island. Antarct. Sci. 2011, 578–588. [Google Scholar] [CrossRef] [Green Version]
  58. Kotlyakov, V.M. 137 years after the discovery of Antarctica. Russ. Meteorol. Hydrol. 2020, 45, 5–13, ISSN 0130-2906. [Google Scholar]
  59. Richter, W.; Bormann, P. Weather and climate. In The Schirmacher Oasis, Queen Maud Land, East Antarctica and its Surrounding; Bormann, P., Fritzsche, D., Eds.; Justus Perthes Verlag: Gotha, Germany, 1995; pp. 207–220. [Google Scholar]
  60. Abakumov, U.V. The Sources and Composition of Humus in Some Soils of West Antarctica. Eurasian Soil Sci. 2010, 43, 499–508. [Google Scholar] [CrossRef]
Figure 1. Distribution of AHC concentrations in snow and upper layer of ice in the areas of the Franz Victoria Trough and the Mendeleev Rise.
Atmosphere 11 00928 g001
Figure 2. The main areas of snow and ice cover sampling in the White Sea: WSBS—vicinity of the Pertsov White Sea Biological Station of Lomonosov Moscow State University, Rugozerskaya Bay (stations 1 and 2 are inside this box); BBS “Kartesh”—vicinity of the White Sea Biological Station of Zoological Institute RAS near cape Kartesh; Onega—mouth of Onega river; area of mouth of Severnaya Dvina river mouth near Arkhangelsk.
Atmosphere 11 00928 g002
Figure 3. Distribution of aliphatic hydrocarbons in the snow-ice cover of Rugozerskaya Bay: (a) 2010, (b) 2012, (c) 2015, (d) 2016; 1—Kislo-Sladkoe Lake, 2—WSBS.
Atmosphere 11 00928 g003
Figure 4. The composition of the SPM in snow (data from a scanning electron microscope): (a) Slag and its composition obtained using the attachment, a microanalyzer to a scanning electron microscope, (b) diatomic and mineral particles; (c) diatoms and organic tissue (Port Ekonomiya).
Atmosphere 11 00928 g004
Figure 5. The content of PAHs in SPM and molecular markers in the snow-ice cover at the station in the mouth of Severnaya Dvina (March 2007): 1—snow, 2—ice top, 3—ice bottom, 4—near the coast of the Mud’yug Island (whole ice core).
Atmosphere 11 00928 g005
Figure 6. The composition of the SPM in snow in Pikalevo Lake (scanning electron microscope data). (a) The fly ash of liquid fuel with a loose nosy surface and aluminosilicate coal ash of a thermal power plant with a smooth spherical surface; (b) loose aggregate of soot particles.
Atmosphere 11 00928 g006
Figure 7. Composition of the alkane in snow, ice, and ice water of Pikalevo Lake, 2017.
Atmosphere 11 00928 g007
Figure 8. Distribution of the 1—SPM, 2—Corg, and 3—AHCs in the snow-ice cover of the Onega River mouth in February 2017.
Atmosphere 11 00928 g008
Figure 9. Composition of alkanes in the snow-ice cover of the Onega River mouth in low tide in February 2017.
Atmosphere 11 00928 g009
Figure 10. Map of Antarctica: 1—location of Russian stations, 2—sampling localities.
Atmosphere 11 00928 g010
Figure 11. AHC redistribution between dissolved and SPM forms in the “young ice”.
Atmosphere 11 00928 g011
Figure 12. The composition of SPM in the fjord area of Prude Bay: (a) Nella (mainly mineral particles) and (b) Sunny (mainly nutrient particles) Fiords.
Atmosphere 11 00928 g012
Figure 13. The composition of alkanes (% of total) in the snow samples at ((a), 1, 2) Molodezhnaya and Novolazarevskaya stations: (3) Glubokoe Lake, ((b), 4, 5)) Geodezistov Lake, and (6) Verkhnee Lake.
Atmosphere 11 00928 g013
Figure 14. Changes in the concentrations of organic compounds and suspensions in the snow-ice cover of Stepped Lake in 2012.
Atmosphere 11 00928 g014
Figure 15. Sampling scheme in the vicinity of Bellingshausen Station, 2012 (a), composition AHCs in moss (b) and composition of polycyclic aromatic hydrocarbons in moss (c).
Atmosphere 11 00928 g015
Figure 16. The composition of moss from Bellingshausen Station (2019): (a) the location of the sampling areas at Bellingshausen station, (b) the concentration of n-alkanes (% of total): 13—Glubokoe Lake shore; 4—Norma Lake shore; (c) PAH concentration: 5, 6—Glubokoe Lake shore. N–Naphthalene, N1—1-methylNaphthalene, N2—2-methylNaphthalene, ACN—Acenaphthene. FLR– fluoranthene. Ph—Phenanthrene, AN—Anthracene, Fl—Fluorantent, P—Pyrene.
Atmosphere 11 00928 g016
Table 1. The content and composition of aliphatic HCs and PAHs in the snow and the upper part of the ice.
ObjectFormAHCsPAHs
N *Σ, μg/LL/H *CPI23-35N *Σ, ng/L FL ** P + BP
FL + PPh + Ch
Arctic Ocean, Mendeleev Rise
SnowDissolv.751.11.2220.640.54
SPM550.71.2230.650.28
Melt pond Dissolv.440.81.1280.820.63
SPM481.21.22170.700.88
Ice 0–25Dissolv.461.21.1460.850.73
cmSPM461.31.24210.930.45
Northern Barents Sea, Franz Victoria Trough
SnowDissolv.8141.31.78300.640.66
SPM2180.32.22500.701.35
Ice Dissolv.1251.81.211100.920.10
0–50 cmSPM11480.31.91470.620.39
* L/H = Σ(C15–C22)/Σ(C23–C35); ** FL—fluorantent, P—pyrene, BP—benz (a) pyrene, Ph—phenanthrene, Ch—chrysene.
Table 2. The concentration of SPM and OCs in the fast snow-ice cover.
Description SamplesSPM, mg/LCorgChl a* Pheo a Lipids Dissol./SPMAHCs Dissol./SPM
µg/L
Lazareva Sea, Alasheeva Aiord (67°34′ S, 46°05′ E), 2008
Snezhura 9/1052/6
Ice water14/1811/9
Lazareva Sea, Atka Fiord (70°32′ S, 08°07′89″ E), 2010
Sludge4.37612.8954.41426/2813/19
Sludge1.51742.2823.82831/6117/33
Ice water0.39240.3470.22814/197/14
Cooperation Sea (67°40′042″ S, 51°194′ E), 2010
Pancake ice0.52430.2360.20411/446/31
Ice water0.35180.0440.0339/186/10
Prudes Bay, Talla Fiord (64°04′32″ S, 70°39′48″ E), 2014
Snow, 0-5 cm0.80250.0300.020/11/4
Ice, 0-20 cm1.05200.0520.018/10/5
Lazarev Sea, Leningradskii Fiord (70°03′486″ S, 12°22′59″ E), 2012
Snow, 5–15 cm0.1290011/185/11
Ice, 0–30, cm0.3250.1905.90112/279/13
Note: * pheophytin a-% of the sum of the concentrations of chlorophyll a and pheofetin a.
Table 3. The distribution of organic compounds and SPM in the snow-ice cover and in moss in the area of the Antarctic stations (in mosses, the concentration of AHC in μg/g, and Corg in %).
Study AreaObjectHorizon, cmLipidesAHCChl aCorgSPM, mg/L
µg/L
Station Molodezhnaya, 67°40′ S, 45°51′ E
Lagernoe Lake, 2010Snow
Ice
0–5
0−30
10/17 *
11/33
7/12
8/20
0.008
0.041
16
0.32
0.33
2019Snow0–10–/47–/280.0250
Snow0–10–/82–/560.1050.87
Observatory Mirny, 66°34′ S, 93°00′ E
2010Firn0−1017/186/80.00900.09
Ice0−3015/1207/730.2321320.23
Ice barrier station Novolazarevskaya, 70°03′ S, 11°35′ E
2010Snow0−1018/3320/100.004780.18
Ice0−3016/129/70.052.10.23
Station Novolazarevskaya, 70°46′ S, 11°50′ E
Stantsionnoe Lake, 2012Snow0−1531/429/220.011664.15
Ice0−2524/638/250.052781.84
Verkhnee Lake, 2012Snow5−1522/4109/3600.073235.20.78
Ice0−8018/6410/350.04224.40.68
Verkhnee Lake, 2019Snow0–10N.d.**/53N.d./350.1022180.982
Glubokoe Lake, 2019Snow0−10N.d./88N.d./720.0451251.06
Geodezistov Lake, 2019
Area around the station
Firn0−10N.d./180N.d./1240.147713.0.998
Snow
Moss
0–10
N.d./75
N.d./40
18–89
0.072
297
3.33–9.21
1.519
Station Progress, Stepped Lake, 69°22′97″S, 76°22′65″E
2008Snow ***0−1049/3337/22N.d.N.d.1.55
Snow ***10−2031/13426/82««3.12
Ice0−2050/11942/50««4.30
2010Snow ***5−1033/7422/560.005«1.00
Ice0−2550/11942/500.025«0.37
2012Snow5−1529/3311/150.01017.60.67
Ice0−3039/3312/151.220.90.50
2014Snow5−15/31/100.002N.d.0.21
Ice0−60/20/60.008«0.50
Station Bellingshausen 62°10′59′′ S, 58°57′00′′ E
Kitezh Lake, 2012
Area around the station, 2012
Area around the station, 2019
Snow ***0−2014/357/190.203734.21
Suga0−310/145/70.230617.02
Ice0−2015/247/120.18201.81
Moss

Moss
304–1640
24–601
18–142

15.50–26.87
8.62–17.28

*** snow on the Lake.
Table 4. The parameters of alkanes in SPM in snow and moss in different regions of the Antarctic.
StationStudy AreaAHCs, µg/LPr/Ph CPI Σ(C12–24)Dominating Peaks
Σo/ΣeC12–24C25–37Σ(C25–37)
Snow
MolodezhnayaGlubokoe Lake28.20.620.970.931.021.77C17, C19, C21
Promernoe Lake56.480.71.451.451.461.6C19, C20, C21
Glubokoe Lake72.40.721.150.831.620.97C27, C29, C31
Geodexistov Lake124.20.334.350.826.630.15C27, C29, C31
Verkhnee Lake40.20.422.780.623.880.17C25, C27, C29, C31
Prilednikovoe Lake34.270.81.150.861.520.91C16, C17, C25
Moss
Novolazarevsk-aya56 (soil under moss)31.550.482.821.643.360.28C25, C27, C29, C31
5522.880.312.172.162.191.02C19, C21, C23
5627.880.772.591.564.600.89C21, C23, C25
6149.210.852.061.383.881.28C19, C21, C23
Glubokoe-1 Lake84.280.603.272.153.640.22C27, C29, C31
BelligshausenGlubokoe-2 Lake40.140.382.472.013.111.04C21, C23, C25, C27
Glubokoe-4 Lake49.940.421.781.312.280.74C23, C25, C27, C29
Norma-1 Lake29.780.501.791.232.831.08C25, C27, C29
Norma-2 Lake87.813.731.631.262.331.29C21, C23, C25, C27
Norma-3 Lake142.141.182.011.243.240.84C21, C23, C25, C27
Station 01-246.090.361.500.882.200.66C17, C19, C21