Sampling, Filtering, and Analysis Protocols to Detect Black Carbon, Organic Carbon, and Total Carbon in Seasonal Surface Snow in an Urban Background and Arctic Finland (>60° N)


Abstract
1. Introduction
2. Materials and Methods
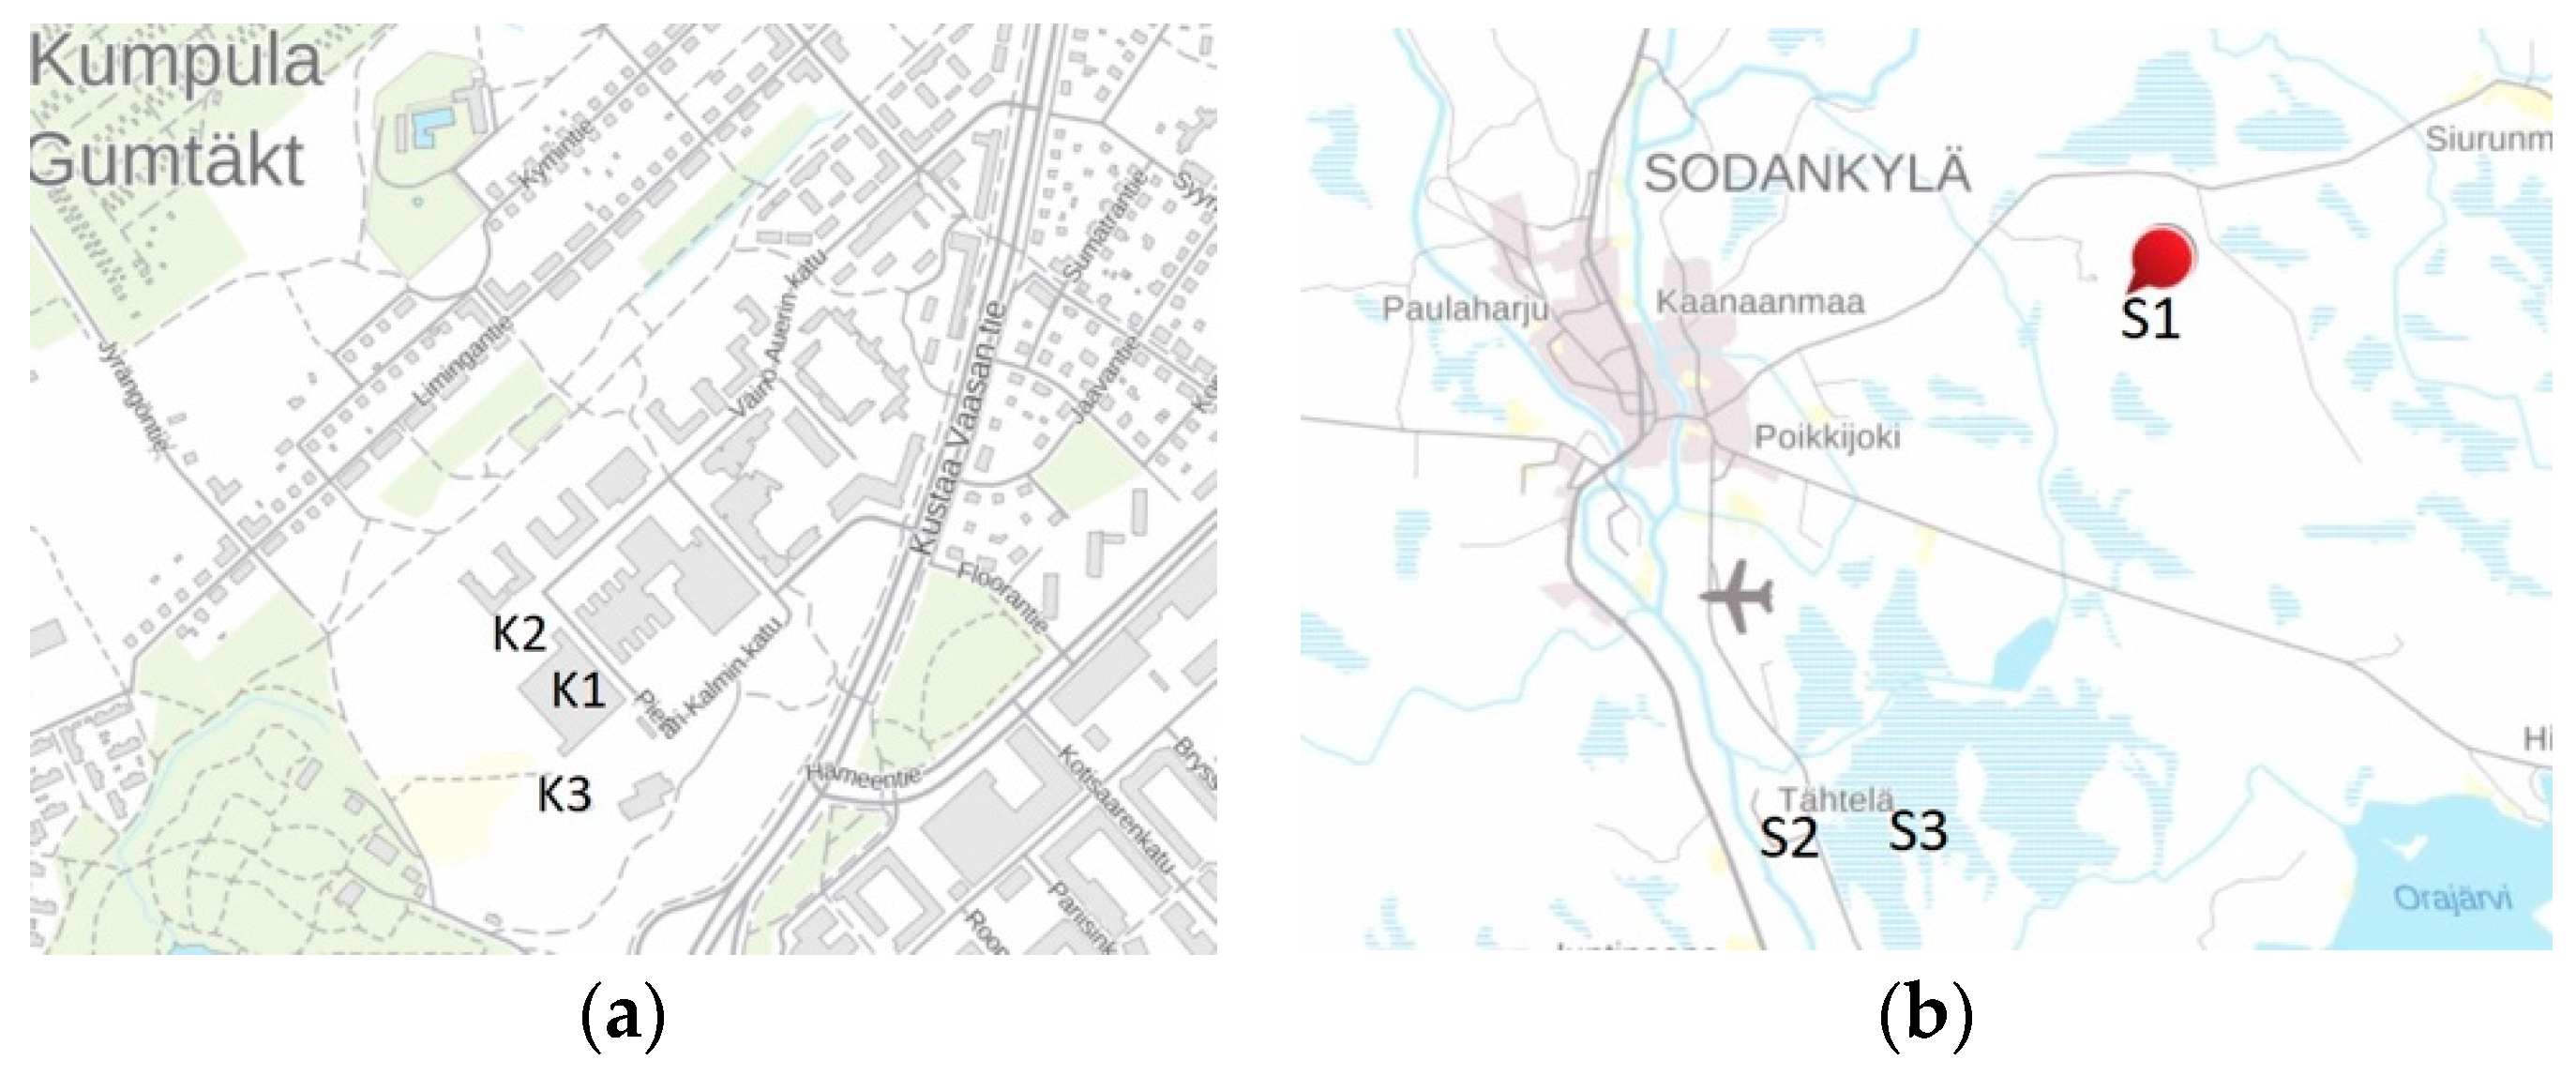
2.1. Site Description
2.2. Snow Sampling and Sample Storage
2.3. Melting and Filtering
2.4. OCEC Analysis
2.5. Analysis Protocols
2.6. Laboratory Experiments
- (1)
- errors due to carbon remaining in the sampling bags when removing the sample (i.e., not rinsing the sample bag);
- (2)
- errors due to carbon remaining in the melt container (i.e., not rinsing the melting container);
- (3)
- errors due to filter leaking or wetting (i.e., large amounts of water passing through the filter);
- (4)
- errors using the sample and/or reference filter with the upper side down, filtering, and measuring.
2.6.1. Bag Rinsing
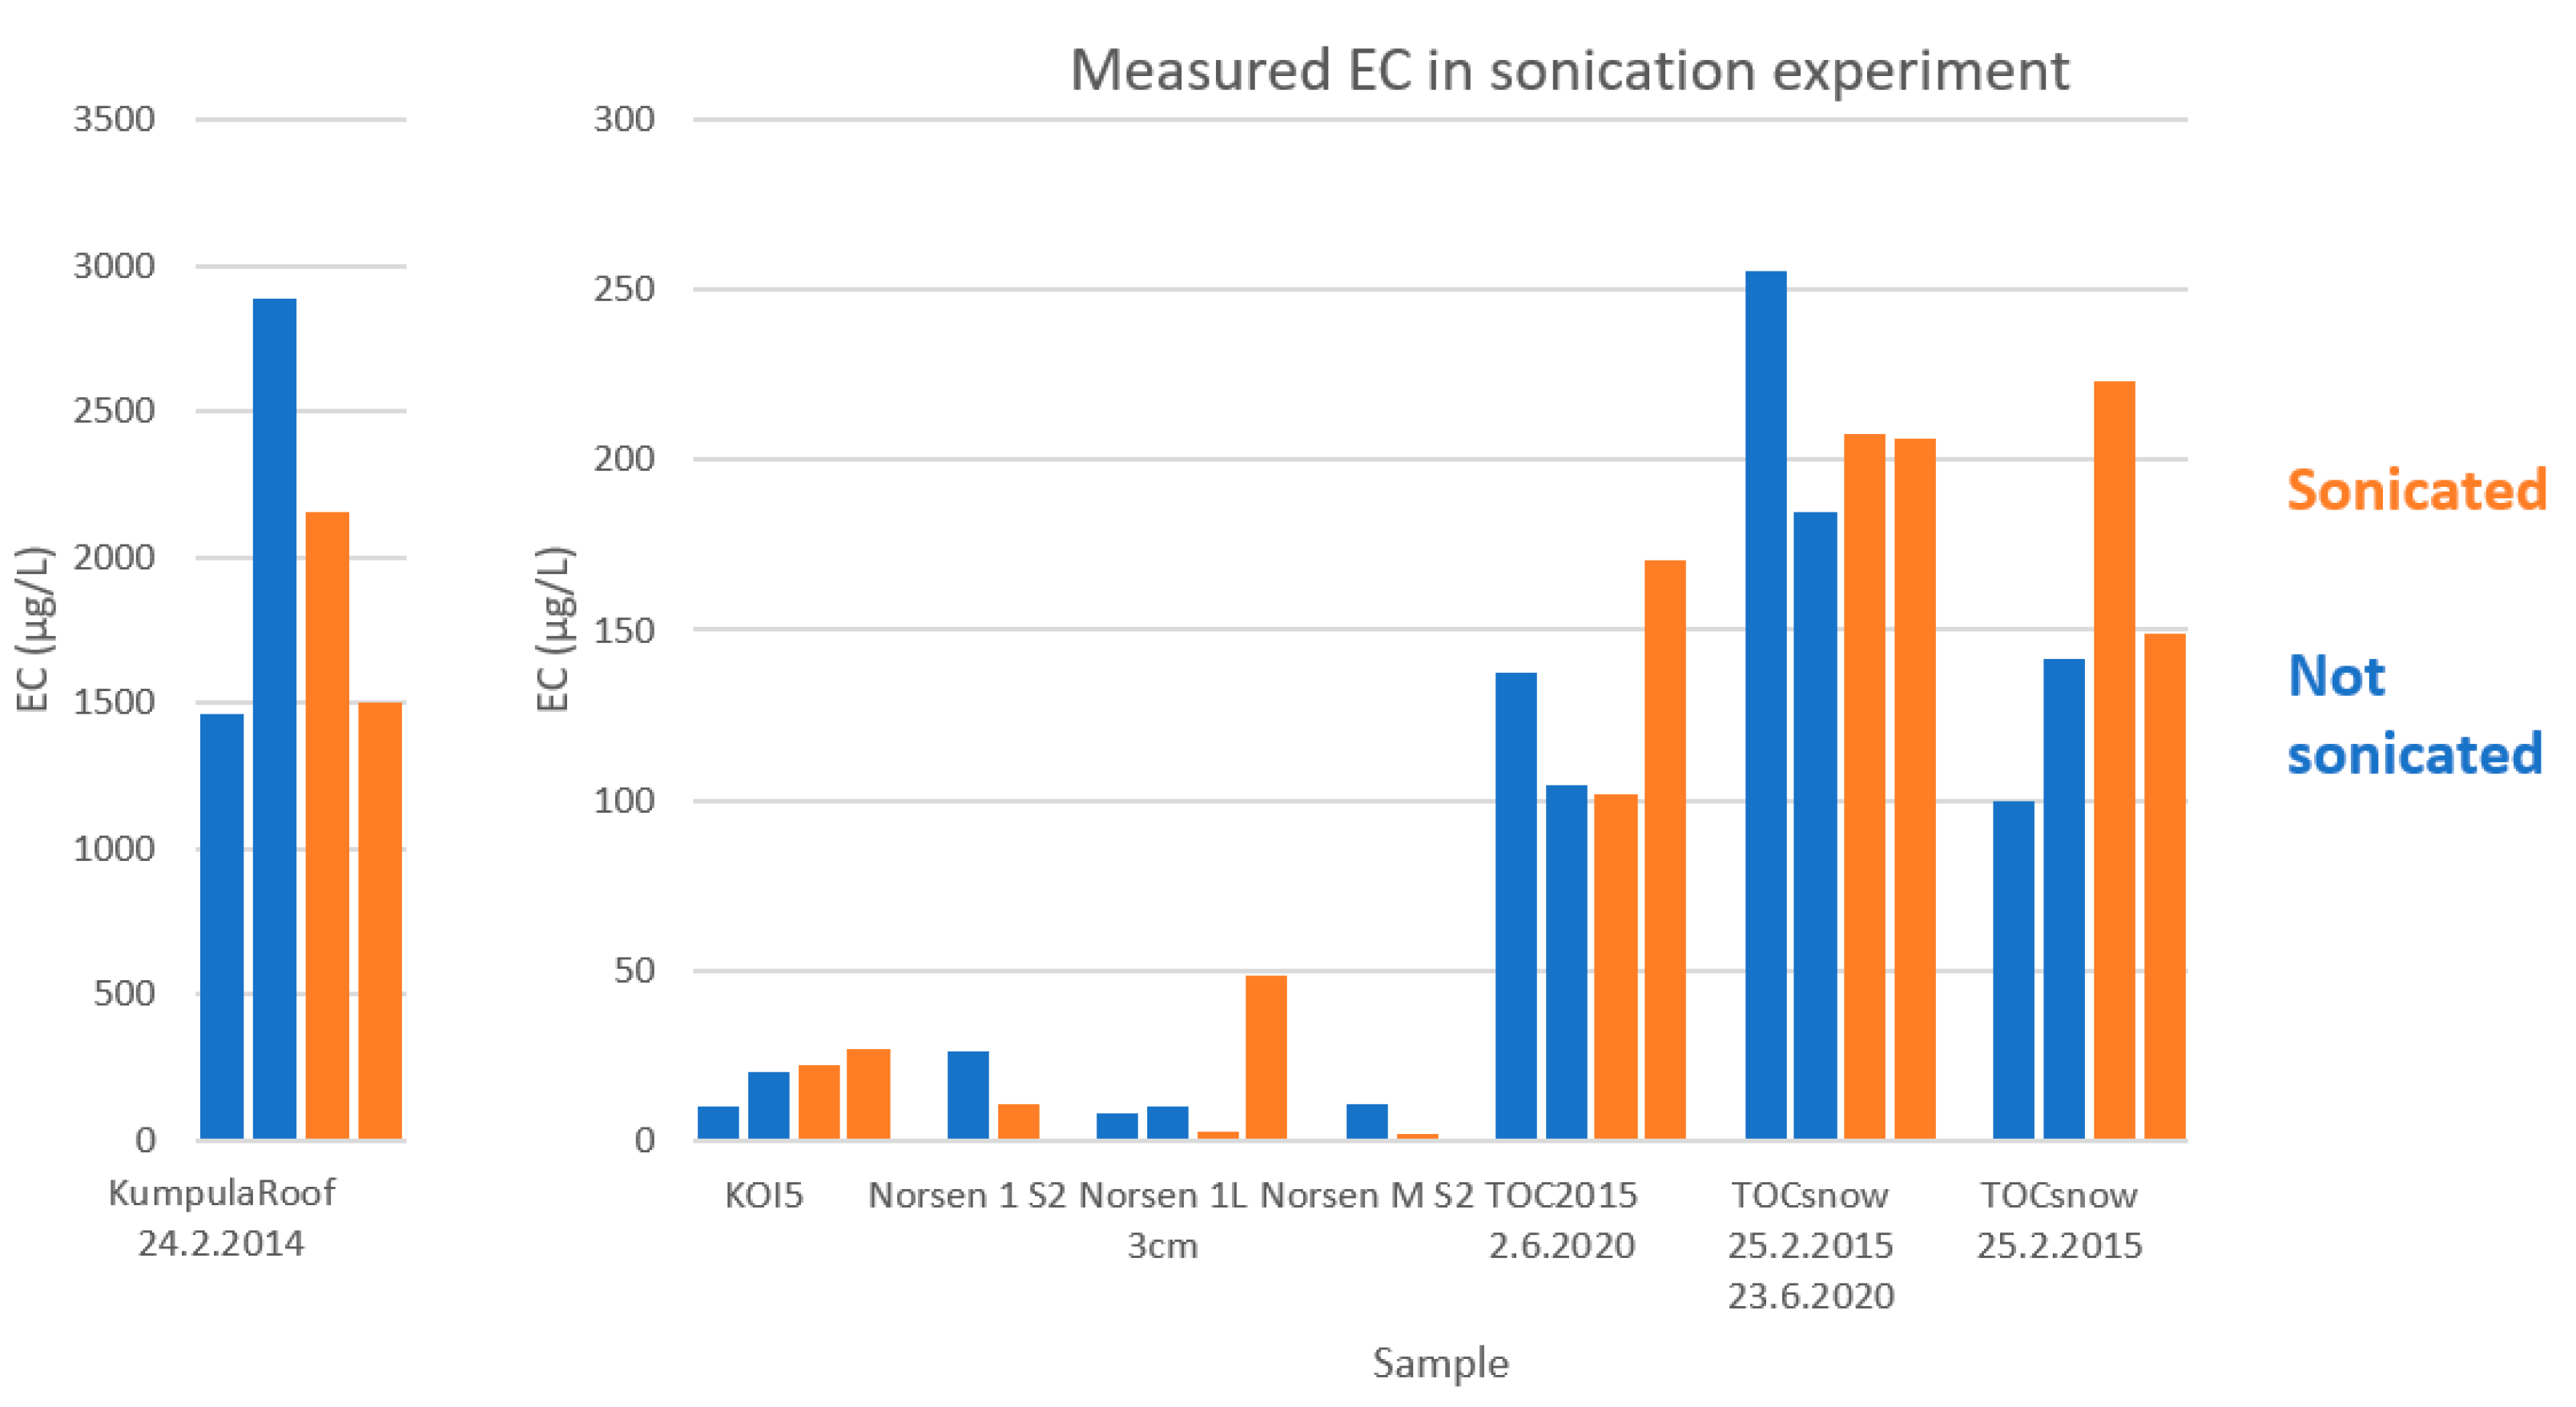
2.6.2. Sonication
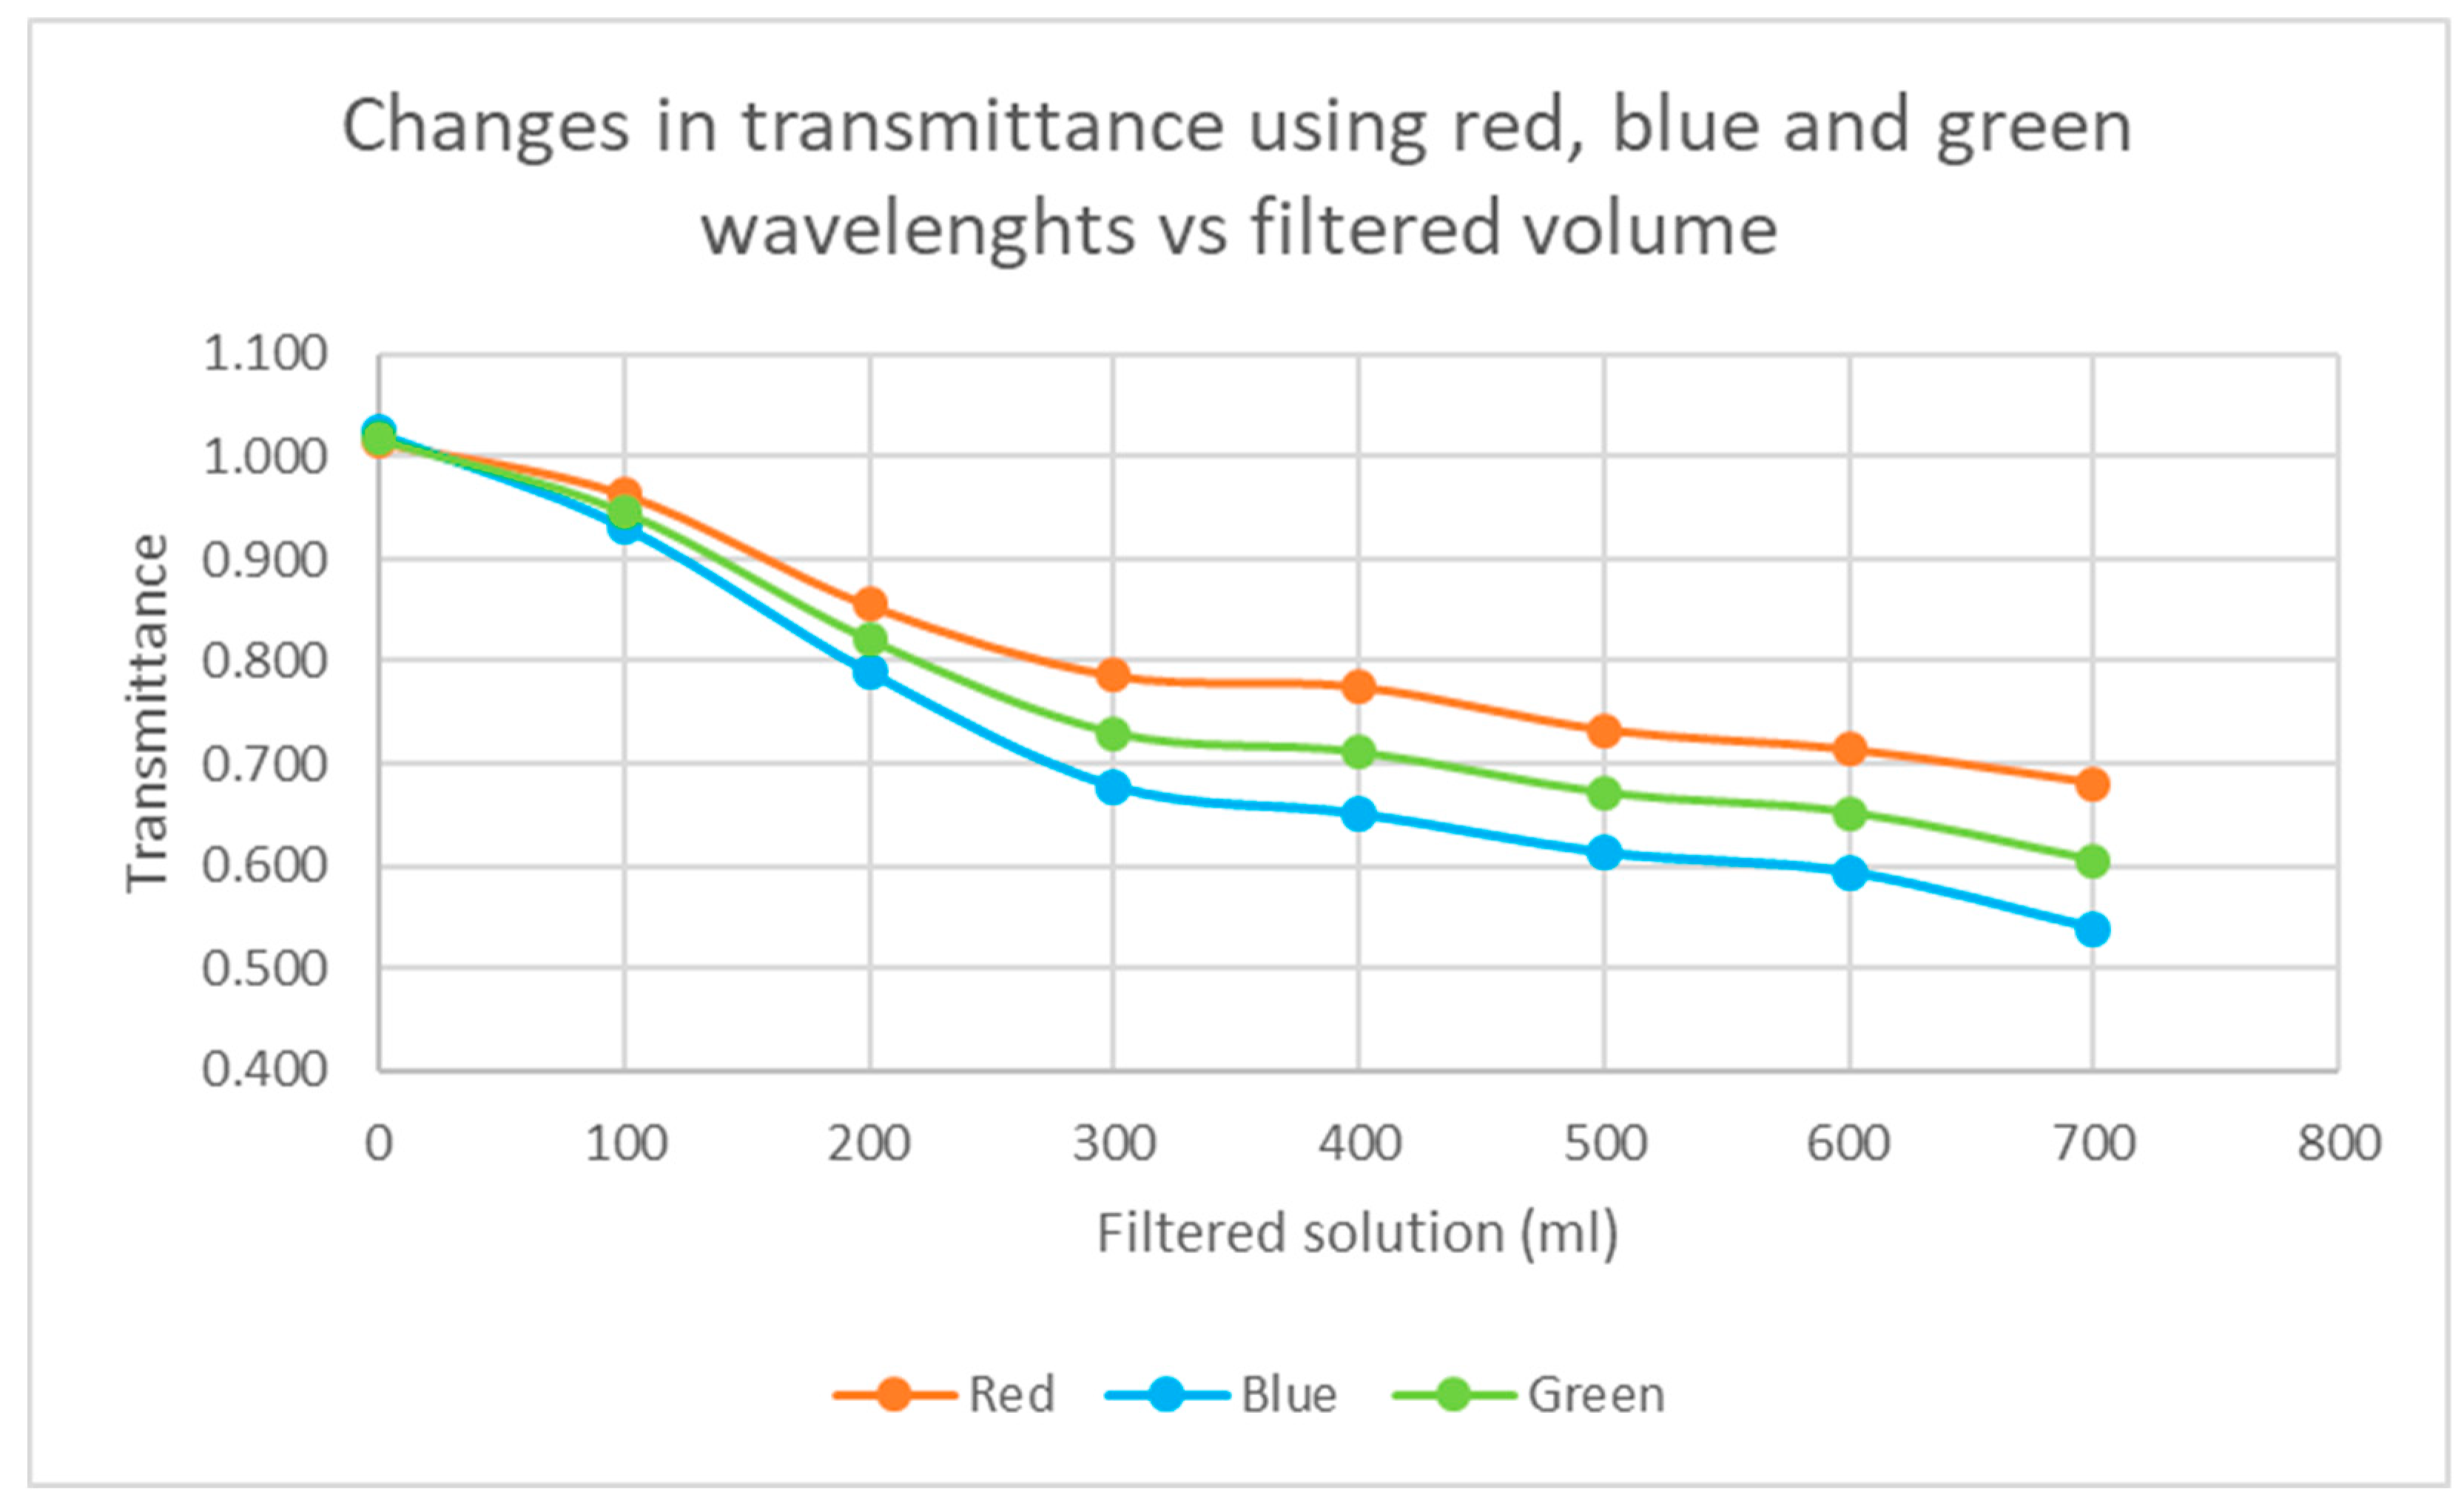
2.6.3. Filter Wetting
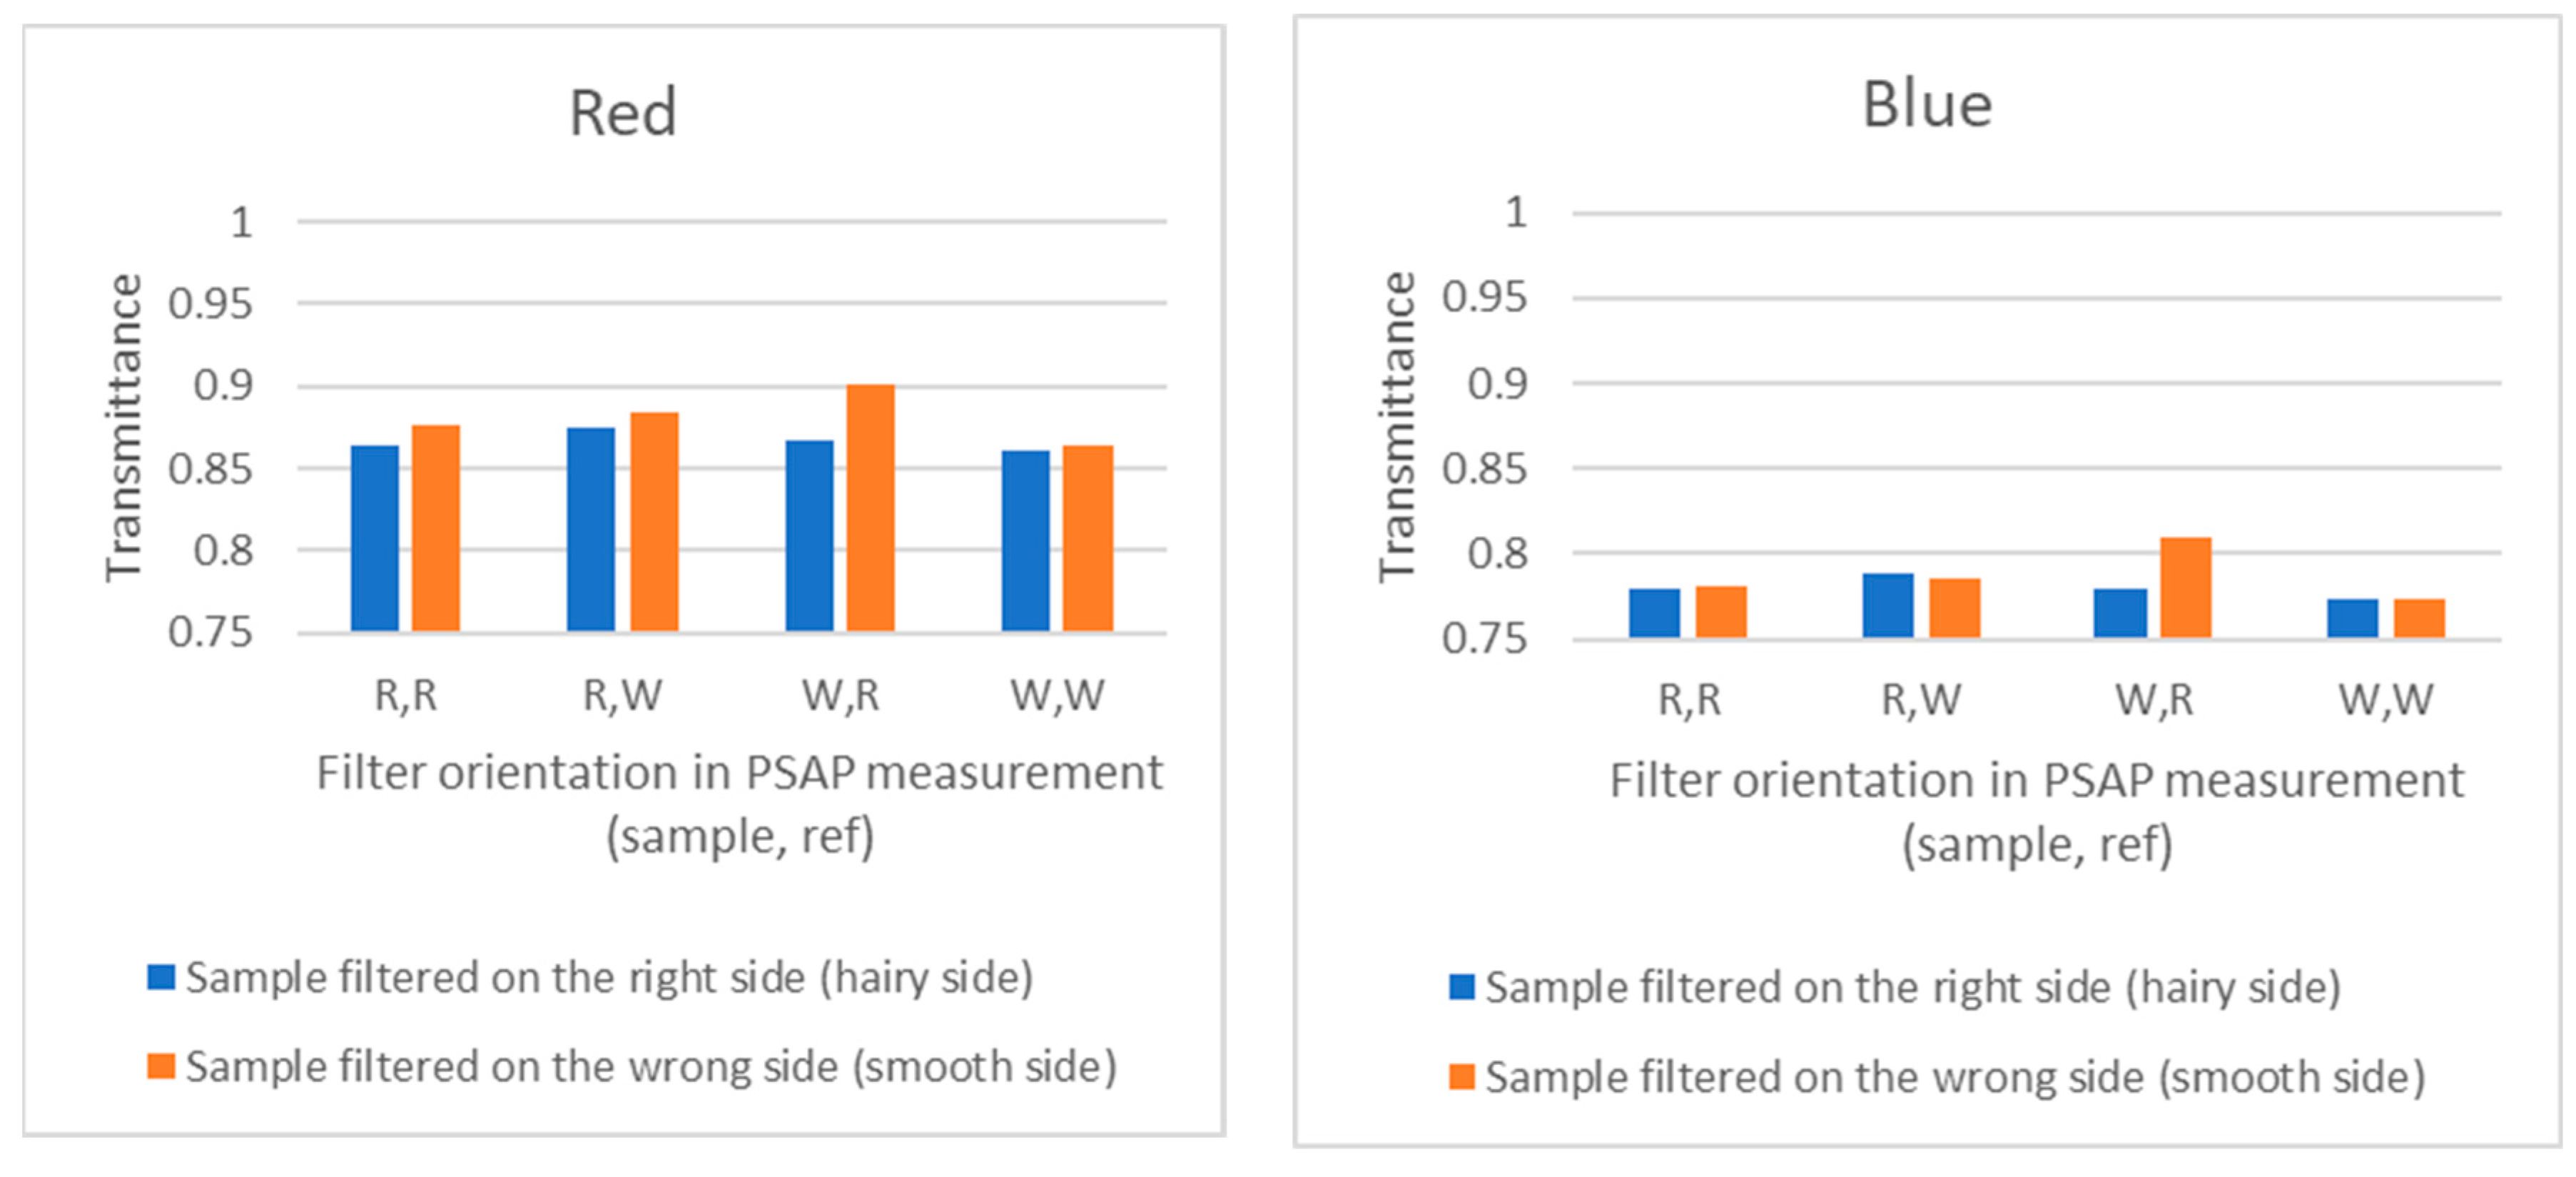
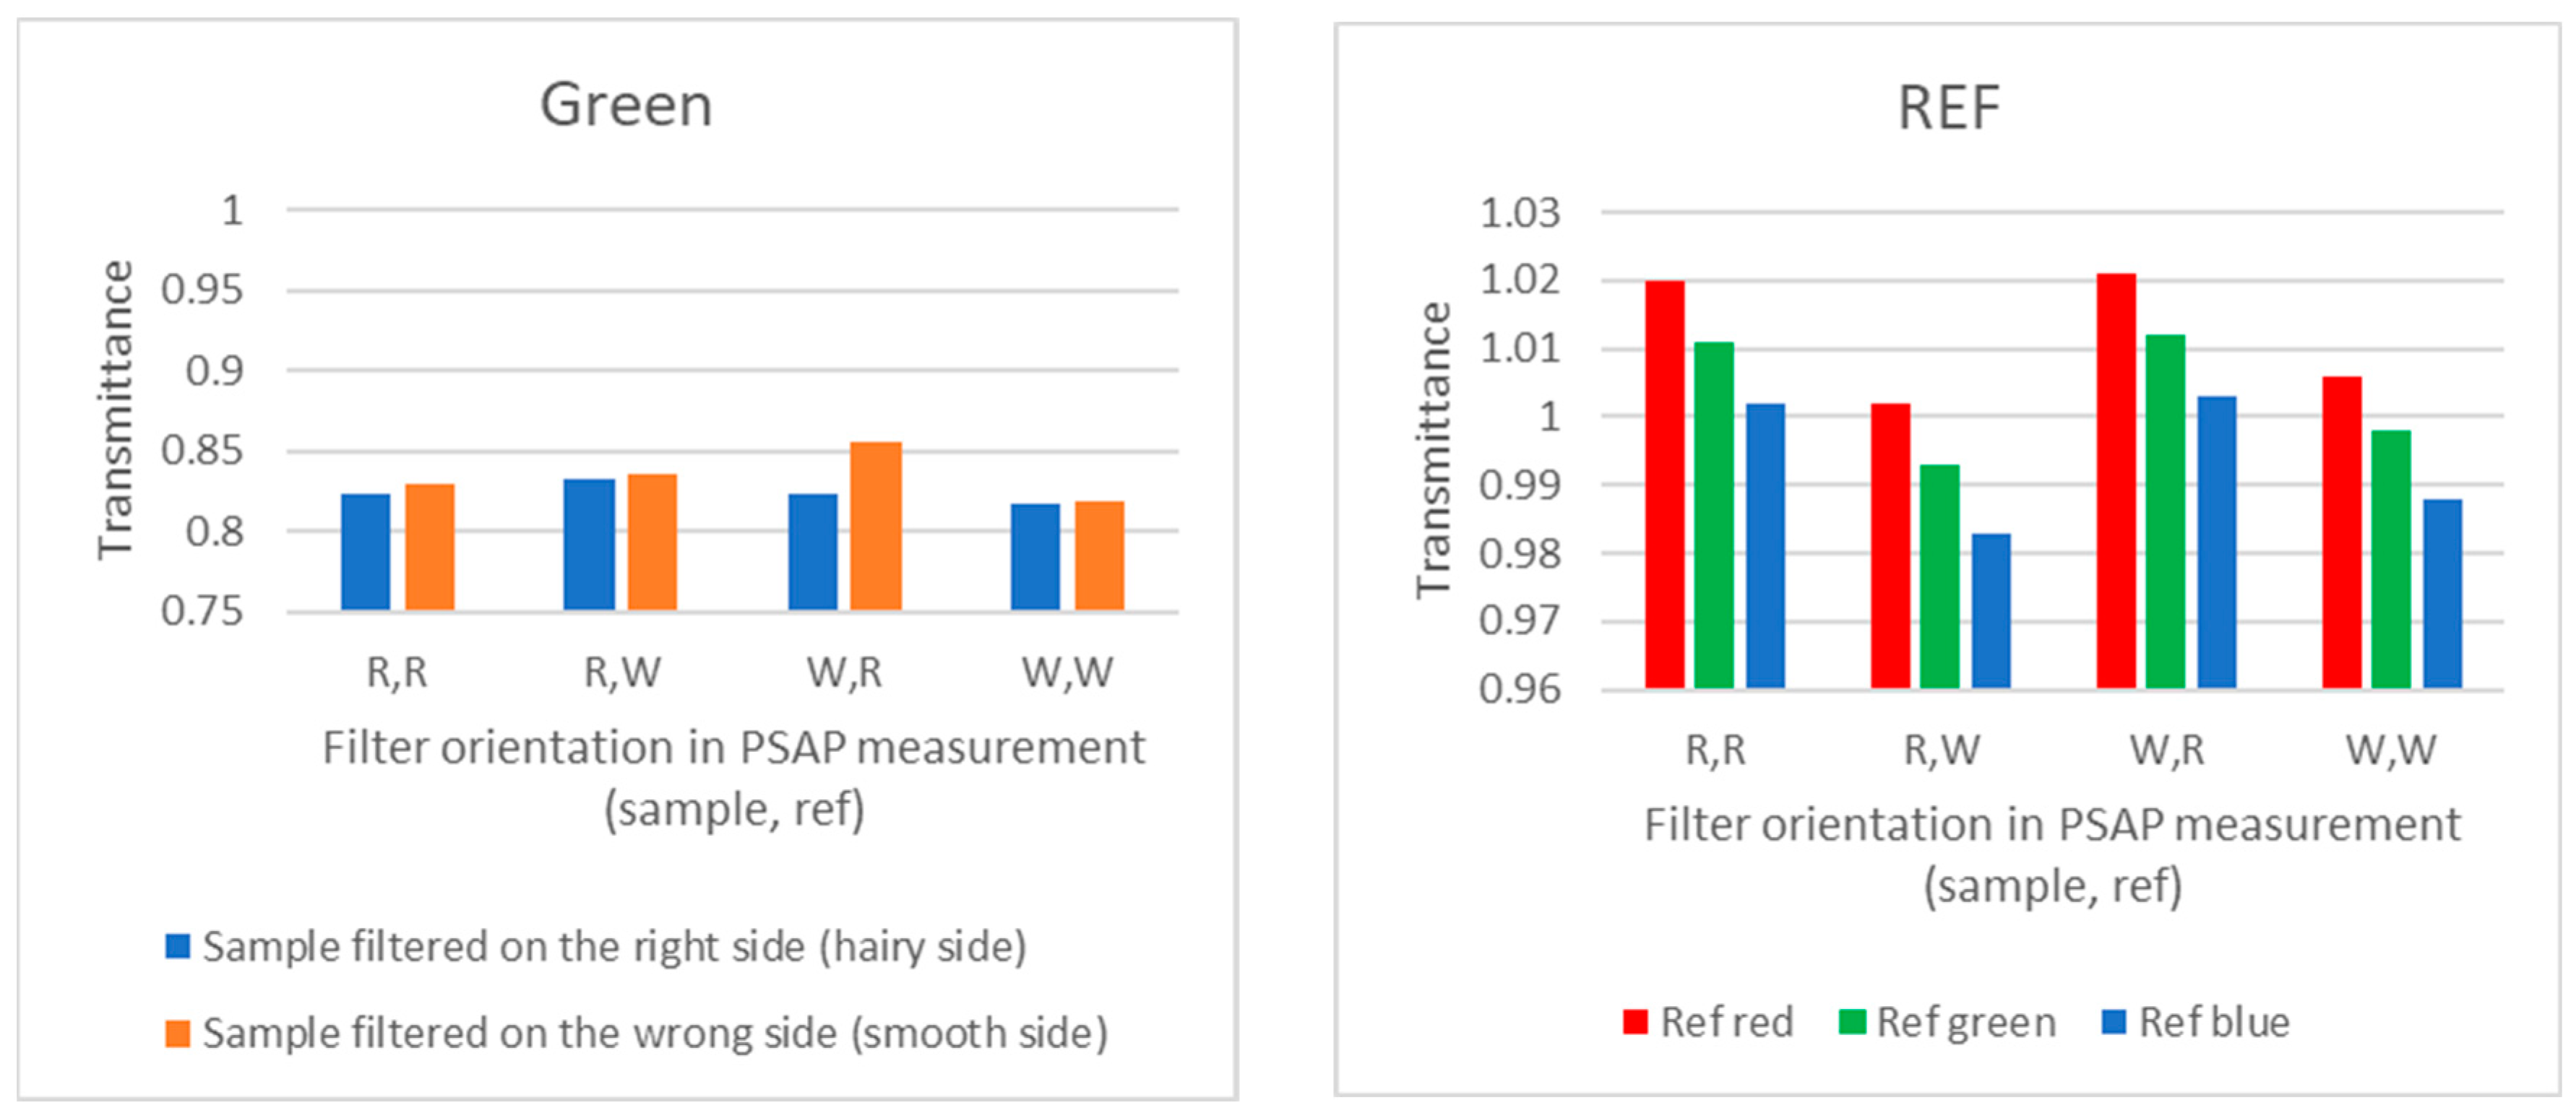
2.6.4. Filter Wrong Side up
3. Results
3.1. Carbon in Snow
3.2. Rinsing Sampling Bags
3.3. Sonication
3.4. Filter Wetting
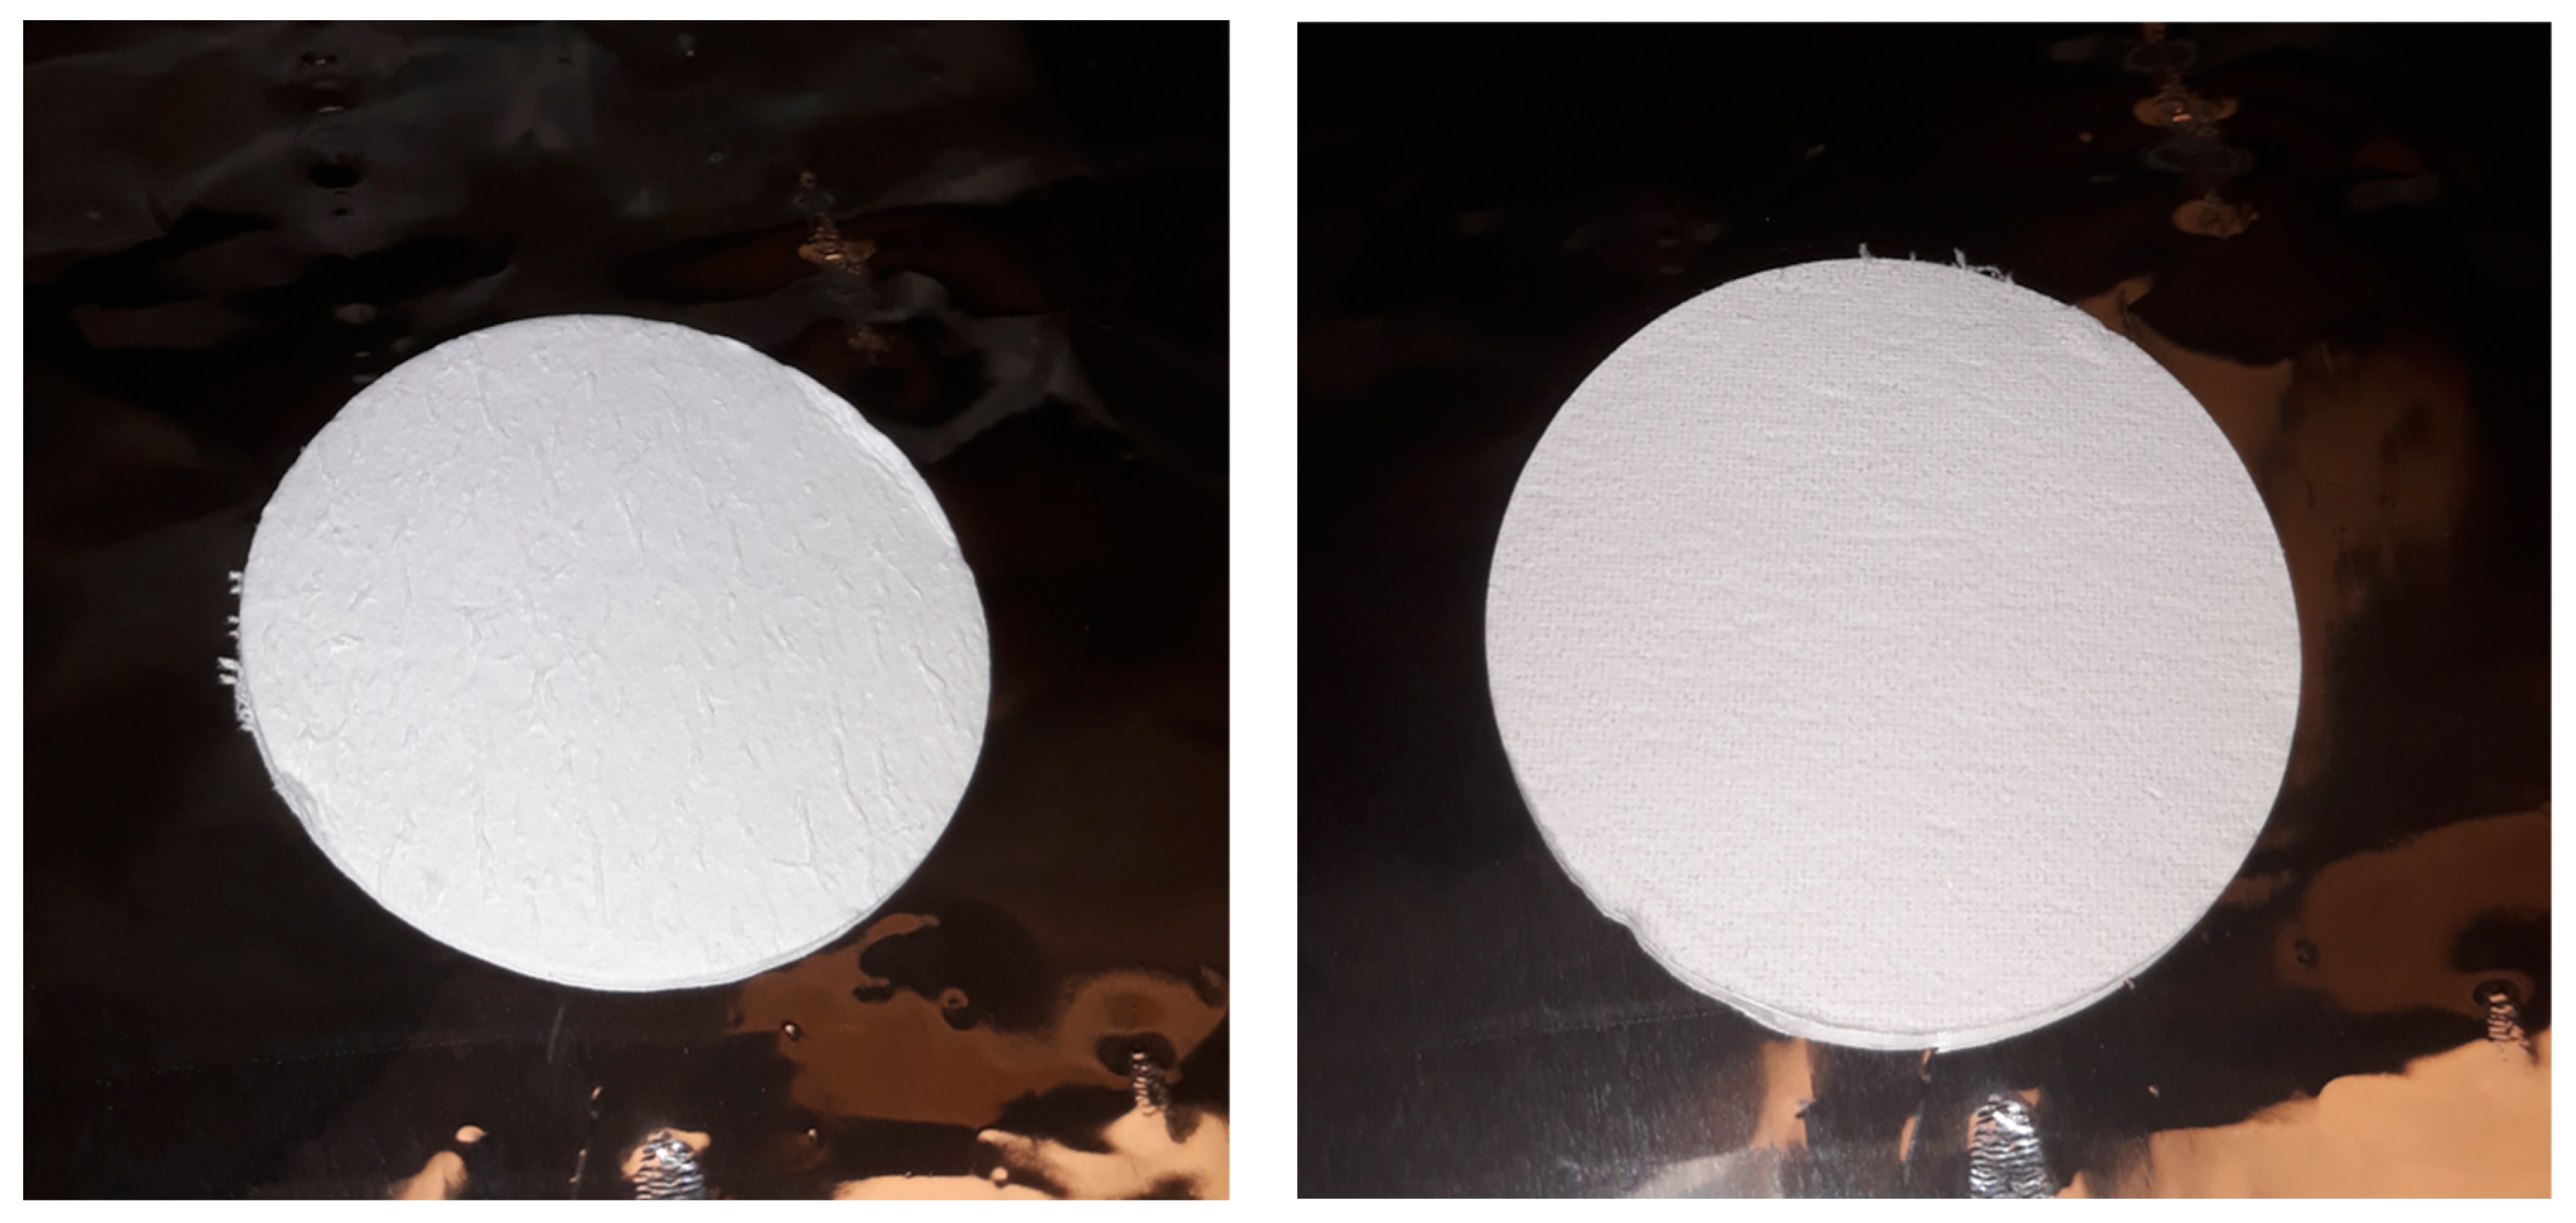
3.5. The “Wrong-Side-Up Filter” Tests
4. Discussion
5. Conclusions
Supplementary Materials
Author Contributions
Funding
Acknowledgments
Conflicts of Interest
List of Abbreviations
| BC | Black Carbon |
| OC | Organic Carbon |
| TC | Total Carbon |
| OCEC analysis | Thermal Optical Carbon Analysis |
| EC | Elemental Carbon |
| HULIS | Humic Like Substances |
| WMO | World Meteorological Organization |
| SNORTEX | “Snow Reflectance Transition Experiment”, Sodankylä |
| SnowAPP | “Modelling of the Snow microphysical-radiative interaction and its APPlications” campaign, Sodankylä |
| GPS | Global Positioning System |
| MilliQ-water | Ultra-purified water |
| ppb | Parts per billion |
| CO2 | Carbon Dioxide |
| FID | Flame Ionization Detector |
| EUSAAR2 | A protocol used in thermal optical carbon analysis (EUropean Supersites for Atmospheric Aerosol Research) |
| NIOSH 870 | A protocol used in thermal optical carbon analysis (National Institute of Occupational Safety and Health) |
| IMPROVE, IMPROVE A | A protocol used in thermal optical carbon analysis (Interagency Monitoring of Protected Visual Environments) |
| PSAP | Particle Soot Absorption Photometer |
| I | Light intensity |
| I0 | Initial light intensity |
| τ | Optical depth |
| REF | Reference |
| SoS | “Soot on Snow” campaign, Sodankylä |
| CMBC | Black carbon mass concentration |
| ISSW | Integrating Sphere/Integrating Sandwich Spectrometer |
| SP2 | Single Particle Soot Photometer |
| RT-modeling | Radiative Transfer -modeling |
| rBC | Refractive Black Carbon |
| eBC | Equivalent Black Carbon |
| Measurement places | |
| FMI | Finnish Meteorological Institute |
| SMEARIII | Urban background station (Helsinki, Finland) |
| GAW | Global Atmospheric Watch station (Sodankylä-Pallas, Finland) |
| KO | Kommattivaara (Sodankylä, Finland) |
| TOC | Impurities on Snow experiment, FMI, Kumpula |
| NorSEN | Nordkalotten Satellite Evaluation co-operation Network NorSEN-mast area, FMI, Sodankylä |
References
- Bond, T.C.; Doherty, S.J.; Fahey, D.W.; Forster, P.M.; Berntsen, T.; DeAngelo, B.J.; Flanner, M.G.; Ghan, S.; Kärcher, B.; Koch, D.; et al. Bounding the role of black carbon in the climate system: A scientific assessment. J. Geophys. Res. Atmos. 2013, 118, 5380–5552. [Google Scholar] [CrossRef]
- AMAP. Black Carbon and Ozone as Arctic Climate Forcers; Arctic Monitoring and Assessment Programme (AMAP): Oslo, Norway, 2015; vii + 116 p; ISBN 978/82/7971/092/9. [Google Scholar]
- IPCC. IPCC Special Report on the ocean and Cryosphere in a Changing Climate; Pörtner, H.-O., Roberts, D.C., Masson-Delmotte, V., Zhai, P., Tignor, M., Poloczanska, E., Mintenbeck, K., Alegría, A., Nicolai, M., Okem, A., et al., Eds.; Intergovernmental Panel on Climate Change: Geneva, Switzerland, 2019; in press; Available online: https://www.ipcc.ch/srocc/ (accessed on 13 May 2020).
- Forsström, S.; Ström, J.; Pedersen, C.A.; Isaksson, E.; Gerland, S. Elemental carbon distribution in svalbard snow. J. Geophys. Res. 2009, 114, D19. [Google Scholar] [CrossRef]
- Doherty, S.J.; Grenfell, T.C.; Forsström, S.; Hegg, D.L.; Brandt, R.E.; Warren, S.G. Observed vertical redistribution of black carbon and other insoluble light-absorbing particles in melting snow. J. Geophys. Res. Atmos. 2013, 118, 5553–5569. [Google Scholar] [CrossRef]
- Meinander, O.; Kazadzis, S.; Arola, A.; Riihelä, A.; Räisänen, P.; Kivi, R.; Kontu, A.; Kouznetsov, R.; Sofiev, M.; Svensson, J.; et al. Spectral albedo of seasonal snow during intensive melt period at Sodankylä, beyond the Arctic Circle. Atmos. Chem. Phys. 2013, 13, 3793–3810. [Google Scholar] [CrossRef]
- Meinander, O.; Kontu, A.; Virkkula, A.; Arola, A.; Backman, L.; Dagsson-Waldhauserová, P.; Järvinen, O.; Manninen, T.; Svensson, J.; de Leeuw, G. Brief communication: Light-absorbing impurities can reduce the density of melting snow. Cryosphere 2014, 8, 991–995. [Google Scholar] [CrossRef]
- Meinander, O.; Kontu, A.; Kouznetsov, R.; Sofiev, M. Snow Samples Combined with Long-Range Transport Modeling to Reveal the Origin and Temporal Variability of Black Carbon in Seasonal Snow in Sodankylä (67° N). Front. Earth Sci. 2020, 8, 13. [Google Scholar] [CrossRef]
- Peltoniemi, J.I.; Gritsevich, M.; Hakala, T.; Dagsson-Waldhauserova, P.; Arnalds, O.; Anttila, K.; Hannula, H.-R.; Kivekas, N.; Lihavainen, H.; Meinander, O.; et al. Soot on Snow experiment: Bidirectional reflectance factor measurements of contaminated snow. Cryosphere 2015, 9, 2323–2337. [Google Scholar] [CrossRef]
- Svensson, J.; Virkkula, A.; Meinander, O.; Kivekäs, N.; Hannula, H.-R.; Järvinen, O.; Peltoniemi, J.; Gritsevich, M.; Heikkilä, A.; Kontu, A.; et al. Soot-doped natural snow and its albedo—results from field experiments. Boreal Environ. Res. 2016, 21, 481–503. [Google Scholar]
- Svensson, J.; Ström, J.; Kivekäs, N.; Dkhar, N.B.; Tayal, S.; Sharma, V.P.; Jutila, A.; Backman, J.; Virkkula, A.; Ruppel, M.; et al. Light-absorption of dust and elemental carbon in snow in the Indian Himalayas and the Finnish Arctic. Atmos. Meas. Tech. 2018, 11, 1403–1416. [Google Scholar] [CrossRef]
- Boy, M.; Thomson, E.S.; Acosta Navarro, J.-C.; Arnalds, O.; Batchvarova, E.; Bäck, J.; Berninger, F.; Bilde, M.; Brasseur, Z.; Dagsson-Waldhauserova, P.; et al. Interactions between the atmosphere, cryosphere, and ecosystems at northern high latitudes. Atmos. Chem. Phys. 2019, 19, 2015–2061. [Google Scholar] [CrossRef]
- Dagsson-Waldhauserova, P.; Meinander, O. Editorial: Atmosphere-cryosphere interaction in the Arctic, at high latitudes and mountains with focus on transport, deposition and effects of dust, black carbon, and other aerosols. Front. Earth Sci. 2019, 7, 337. [Google Scholar] [CrossRef]
- Dagsson-Waldhauserova, P.; Meinander, O. (Eds.) Atmosphere-Cryosphere Interaction in the Arctic, at High Latitudes and Mountains with Focus on Transport, Deposition and Effects of Dust, Black Carbon, and Other Aerosols; Frontiers Media SA: Lausanne, Switzerland, 2020; ISSN 1664/8714. ISBN 978/2/88963/504/7. [Google Scholar] [CrossRef]
- Hagler, G.S.W.; Bergin, M.H.; Smith, E.A.; Dibb, J.E. A summer time series of particulate carbon in the air and snow at Summit, Greenland. J. Geophys. Res. 2007, 112, D21309. [Google Scholar] [CrossRef]
- France, J.L.; Reay, H.J.; King, M.D.; Voisin, D.; Jacobi, H.; Beine, H.J.; Anastasio, C.; MacArthur, A.; Lee-Taylor, J. Hydroxyl radical and NOx production rates, black carbon concentrations and light-absorbing impurities in snow from field measurements of light penetration and nadir reflectivity of on-shore and offshore coastal Alaskan snow. J. Geophys. Res. 2012, 117, D00R12. [Google Scholar] [CrossRef]
- Voisin, D.; Jaffrezo, J.-L.; Houdier, S.; Barret, M.; Cozic, J.; King, M.D.; France, J.L.; Reay, H.J.; Grannas, A.; Kos, G.; et al. Carbonaceous species and HUmic LIke Substances (HULIS) in Arctic snowpack during OASIS field campaign in Barrow. J. Geophys. Res. 2012, 117, D00R19. [Google Scholar] [CrossRef]
- Gallet, J.C.; Björkman, M.; Larose, C.; Luks, B.; Martma, T.; Zdanowics, C. (Eds.) Protocols and Recommendations for the Measurement of Snow Physical Properties, and Sampling of Snow for Black Carbon, Water Isotopes, Major Ions and Micro-Organisms; Norwegian Polar Institute: Kortrapport, Tromsø, Norway; ISBN 978/82/7666/415/7. (printed); Available online: http://www.npolar.no (accessed on 6 July 2020).
- Ingersoll, G.P.; Campbell, D.; Mast, M.A.; Clow, D.W.; Nanus, L.; Frakes, B. Snowpack Chemistry Monitoring Protocol for the Rocky Mountain Network; Narrative and Standard Operating Procedures. Administrative Report; United States Geological Service (USGS): Reston, VA, USA, 2009.
- Järvi, L.; Hannuniemi, H.; Hussein, T.; Junninen, H.; Aalto, P.P.; Hillamo, R.; Mäkelä, T.; Keronen, P.; Siivola, E.; Vesala, T.; et al. The urban measurement station SMEAR III: Continuous monitoring of air pollution and surface-atmosphere interactions in Helsinki, Finland. Bor. Env. Res. 2009, 14, 86–109. [Google Scholar]
- Leppänen, L.; Kontu, A.; Hannula, H.-R.; Sjöblom, H.; Pulliainen, J. Sodankylä manual snow survey program. Geosci. Instrum. Method. Data Syst. 2016, 5, 163–179. [Google Scholar] [CrossRef]
- Sturm, M.; Holmgren, J. A seasonal snow cover classification system for local to global applications. J. Climate 1995, 8, 1261–1283. [Google Scholar] [CrossRef]
- Roujean, J.-L.; Manninen, T.; Sukuvaara, T.; Peltoniemi, J.; Kaasalainen, S.; Hautecoeur, O.; Lahtinen, P.; Riihelä, A.; Siljamo, N.; Lötjönen, M.; et al. SNORTEX: Remote sensing measurement of snowmelt in European boreal forest. iLEAPS Newsl. 2010, 9, 56–58. Available online: http://www.ileaps.org/index.php?option=comphocadownload\&view=category\&id=3:\&Itemid=81 (accessed on 6 July 2020).
- Pirazzini, R.; Petri Räisänen, J.L.; Terhikki Manninen, T.A.; Ghislain Picard, T.P.; Martin Schneebeli, M.P.; Masashi Niwano, H.-R.H.; Kati Anttila, A.K.; Leena Leppänen, P.F.E.L.; Amy Macfarlane, O.M.; Ines Olivier, T.A.; et al. Improvement of The Snow Albedo Retrieval Combining Optical And Microwave Sensors: Ground-based Observations From The SnowAPP Campaign (Sodankylä, Finland). In Proceedings of the Abstracts of the 9th EARSeL Workshop on Land Ice and Snow, Remote Sensing of the Cryosphere, Monitoring What Is Vanishing, Bern, Switzerland, 3—5 February 2020; p. 28. Available online: http://www.earsel.org/SIG/Snow-Ice/files/Abstracts_EARSEL_LandIceSnow_2020.pdf (accessed on 6 July 2020).
- Brown, R.J.; Beccaceci, S.; Butterfield, D.M.; Quincey, P.G.; Harris, P.M.; Maggos, T.; Panteliadis, P.; John, A.; Jedynska, A.; Kuhlbusch, T.A.J.; et al. Standardisation of a European measurement method for organic carbon and elemental carbon in ambient air: Results of the field trial campaign and the determination of a measurement uncertainty and working range. Environ. Sci. Process Impacts 2017, 19, 1249–1259. [Google Scholar] [CrossRef]
- CEN-TC264. European Committee for Standardisation, EN 16909:2017, Ambient Air—Measurement of Elemental Carbon (EC) and Organic Carbon (OC) Collected on Filters; CEN: Brussels, Belgium, 2017. [Google Scholar]
- Birch, M.E.; Cary, R.A. Elemental carbon-based method for monitoring occupational exposures to particulate diesel exhaust. Aerosol. Sci. Technol. 1996, 25, 221–241. [Google Scholar] [CrossRef]
- Krecl, P.; Ström, J.; Johansson, C. Carbon content of atmospheric aerosols in a residential area during the wood combustion season in Sweden. Atmos. Environ. 2007, 41, 6974–6985. [Google Scholar] [CrossRef]
- Virkkula, A.; Ahlquist, N.C.; Covert, D.S.; Arnott, W.P.; Sheridan, P.J.; Quinn, P.K.; Coffman, D.J. Modification, Calibration and a Field Test of an Instrument for Measuring Light Absorption by Particles. Aerosol Sci. Tech. 2005, 39, 68–83. [Google Scholar] [CrossRef]
- Meinander, O. Effects of Black Carbon and Icelandic Dust on Snow Albedo, Melt and Density. Ph.D. Thesis, Finnish Meteorological Institute Contributions, Helsinki, Finland, 2016. [Google Scholar]
- Meinander, O.; Kontu, A.; Lakkala, K.; Heikkilä, A.; Ylianttila, L.; Toikka, M. Diurnal variations in the UV albedo of arctic snow. Atmos. Chem. Phys. 2008, 8, 6551–6563. [Google Scholar] [CrossRef]
- Wang, X.; Doherty, S.J.; Huang, J. Black carbon and other light-absorbing impurities in snow across Northern China. J. Geophys. Res. 2013, 118, 1471–1492. [Google Scholar] [CrossRef]
- Aamaas, B.; Bøggild, C.E.; Stordal, F.; Berntsen, T.; Holmén, K.; Strom, J. Elemental carbon deposition to Svalbard snow from Norwegian settlements and long-range transport. Tellus 2011, 63, 340–351. [Google Scholar] [CrossRef]
- Chow, J.C.; Watson, J.G.; Crow, D.; Lowenthal, D.H.; Merrifield, T. Comparison of IMPROVE and NIOSH carbon measurements. Aerosol Sci. Technol. 2001, 34, 23–34. [Google Scholar] [CrossRef]
- Giannoni, M.; Giulia, C.; Massimo, C.; Alessandra, C.; Franco, L.; Tania, M.; Silvia, N. A comparison between thermal-optical transmittance elemental carbon measured by different protocols in PM2.5 samples. Sci. Total Environ. 2016, 571, 195–205. [Google Scholar] [CrossRef]
- Svensson, J.; Ström, J.; Hansson, M.; Lihavainen, H.; Kerminen, V.M. Observed metre scale horizontal variability of elemental carbon in surface snow. Environ. Res. Lett. 2013, 8, 034012. [Google Scholar] [CrossRef][Green Version]


| EUSAAR 2 | IMPROVE A | |||
|---|---|---|---|---|
| Atmosphere | Temperature (°C) | Time (s) | Temperature (°C) | Time (s) |
| He | 200 | 120 | 140 | 150–580 |
| He | 300 | 150 | 280 | 150–580 |
| He | 450 | 180 | 480 | 150–580 |
| He | 650 | 180 | 580 | 150–580 |
| He | 0 | 30 | - | - |
| He/O2 | 500 | 120 | 580 | 150–580 |
| He/O2 | 550 | 120 | 740 | 150–580 |
| He/O2 | 700 | 70 | 840 | 150–580 |
| He/O2 | 850 | 80 | - | - |
| He/O2 | - | - | - | - |
| He/O2 | - | - | - | - |
| Sample ID | Place | Sampling Day | OC [ppb] | EC [ppb] | TC [ppb} |
|---|---|---|---|---|---|
| TOC (AoS-2015 experiment) | Kumpula Dynamicum fenced area | 6 February 2015 | 1838.4 | 164.3 | 2002.7 |
| Kumpula Roof | Kumpula Dynamicum Measurement Roof | 24 February 2014 | 8719.4 | 2071.3 | 10,790.7 |
| NorSEN 1 L | Sodankylä NorSEN mast | 23 March 2010 | 608.6 | 21.9 | 630.5 |
| NorSEN 1S | Sodankylä NorSEN Mast | 23 March 2010 | 3046.6 | 18.8 | 3065.4 |
| NorSEN M | Sodankylä NorSEN Mast | 23 March 2010 | 423.2 | 6.7 | 429.8 |
| KOI5 | Sodankylä Kommattivaara | 23 March 2010 | 2873.9 | 20.6 | 2894.5 |
| SnowAPP | Sodankylä site next to SnowAPP field | 18 March 2019 | 627.7 | 1.5 | 629.2 |
| Method | Measures | Benefits | Drawbacks |
|---|---|---|---|
| OCEC | OC, EC, TC | Detects BC, OC, and TC. TC is correct (=OC + EC). Only a small filter piece sample is used for analysis; the rest of the filter remains. European standard for atmospheric EC. Easy to filter during field work conditions. Easy to transport filters to laboratory | OC/EC ratio may depend on the protocol, as EC is based on determination of the split point. The sample is destroyed. |
| SP2 | rBC | Counts single particles. Traceable to rBC mass (ambient BC and calibration standard). It is not interfered by other compounds. | Possible breakdown of particles if the sample is pre-treated with ultrasound. Difficult to transport snow to the analysis. Destroys the sample. Data analysis is a challenge. |
| Optical methods (ISSW, PSAP) | eBC | The sample is not destroyed. Accurate if only BC is present and no other absorbing impurities. | Influence of other absorbing particles can be difficult to separate, as the measured absorption is transformed to BC using constants that may vary according to the place/chemical compounds of the sample. |
| Gravimetry | Total load | The more accurate, the larger the load. The sample is retained. | Not accurate enough for cleaner snow. Cannot separate BC from dust. |
© 2020 by the authors. Licensee MDPI, Basel, Switzerland. This article is an open access article distributed under the terms and conditions of the Creative Commons Attribution (CC BY) license (http://creativecommons.org/licenses/by/4.0/).
Share and Cite
Meinander, O.; Heikkinen, E.; Aurela, M.; Hyvärinen, A. Sampling, Filtering, and Analysis Protocols to Detect Black Carbon, Organic Carbon, and Total Carbon in Seasonal Surface Snow in an Urban Background and Arctic Finland (>60° N). Atmosphere 2020, 11, 923. https://doi.org/10.3390/atmos11090923
Meinander O, Heikkinen E, Aurela M, Hyvärinen A. Sampling, Filtering, and Analysis Protocols to Detect Black Carbon, Organic Carbon, and Total Carbon in Seasonal Surface Snow in an Urban Background and Arctic Finland (>60° N). Atmosphere. 2020; 11(9):923. https://doi.org/10.3390/atmos11090923
Chicago/Turabian StyleMeinander, Outi, Enna Heikkinen, Minna Aurela, and Antti Hyvärinen. 2020. "Sampling, Filtering, and Analysis Protocols to Detect Black Carbon, Organic Carbon, and Total Carbon in Seasonal Surface Snow in an Urban Background and Arctic Finland (>60° N)" Atmosphere 11, no. 9: 923. https://doi.org/10.3390/atmos11090923
APA StyleMeinander, O., Heikkinen, E., Aurela, M., & Hyvärinen, A. (2020). Sampling, Filtering, and Analysis Protocols to Detect Black Carbon, Organic Carbon, and Total Carbon in Seasonal Surface Snow in an Urban Background and Arctic Finland (>60° N). Atmosphere, 11(9), 923. https://doi.org/10.3390/atmos11090923