Article

Atmospheric Heavy Metal Deposition in North Macedonia from 2002 to 2010 Studied by Moss Biomonitoring Technique

by
Lambe Barandovski
1,2,
Trajče Stafilov
3,*,
Robert Šajn
4,
Marina Frontasyeva
2 and
Katerina Bačeva Andonovska
5
1
Faculty of Natural Sciences and Mathematics, Institute of Physics, Ss. Cyril and Methodius University, POB 162, 1000 Skopje, Macedonia
2
Frank Laboratory of Neutron Physics, Joint Institute for Nuclear Research, Moscow Region, 141980 Dubna, Russia
3
Faculty of Natural Sciences and Mathematics, Institute of Chemistry, Ss Cyril and Methodius University, POB 162, 1000 Skopje, North Macedonia
4
Geological Survey of Slovenia, Dimičeva 14, 1000 Ljubljana, Slovenia
5
Research Center for Environment and Materials, Academy of Sciences and Arts of the Republic of North Macedonia MANU, Krste Misirkov 2, 1000 Skopje, North Macedonia
*
Author to whom correspondence should be addressed.
Atmosphere 2020, 11(9), 929; https://doi.org/10.3390/atmos11090929
Submission received: 27 July 2020 / Revised: 18 August 2020 / Accepted: 27 August 2020 / Published: 30 August 2020

Abstract

:
Moss biomonitoring technique was used for a heavy-metal pollution study in Macedonia in the framework of the International Cooperative Program on Effects of Air Pollution on Natural Vegetation and Crops (UNECE IPC Vegetation). Moss samples (n = 72) were collected during the summers of 2002, 2005, and 2010. The contents of 41 elements were determined by neutron activation analysis, atomic absorption spectrometry, and inductively coupled plasma atomic emission spectrometry. Using factor and cluster analyses, three geogenic factors were determined (Factor 1, including Al, As, Co, Cs, Fe, Hf, Na, Rb, Sc, Ta, Th, Ti, U, V, Zr, and rare-earth elements–RE; Factor 4 with Ba, K, and Sr; and Factor 5 with Br and I), one anthropogenic factor (Factor 2, including Cd, Pb, Sb, and Zn), and one geogenic-anthropogenic factor (Factor 3, including Cr and Ni). The highest anthropogenic impact of heavy metal to the air pollution in the country was from the ferronickel smelter near Kavadraci (Ni and Cr), the lead and zinc mines in the vicinity of Makedonska Kamenica, Probištip, and Kriva Palanka in the eastern part of the country (Cd, Pb, and Zn), and the former lead and zinc smelter plant in Veles. Beside the anthropogenic influences, the lithology and the composition of the soil also play an important role in the distribution of the elements.

1. Introduction

Elements and compounds that are released into the environment and damage the biosphere (soil, water, air) are treated as pollutants—regardless of whether they come from natural processes on the Earth’s surface or human activities [1,2,3]. Atmospheric emissions, due to their widespread dispersion and exposure to living organisms, pose a major risk to human health [4,5]. The representation of pollutants is mostly dependent on the source of emissions, the amount of the released substances, their composition, state of matter, altitude, and weather conditions season, amount of atmospheric sediments, air currents, precipitation, acidity, temperature, humidity; the rate of deposition depends on several factors, such as meteorology wind velocity, relative humidity, and temperature; particle shape and size, and the chemical forms of the elements [1,2,6,7].
The monitoring of potentially toxic air pollutants has a significant role in understanding the spatial and temporal distribution of these pollutants; it serves as a tool in planning to reduce their harmful effects. Biomonitoring is a method to obtain quantitative information about certain characteristics of the biosphere. Among the most often used biomonitors are mosses, liches, grasses, etc. [5,7,8,9,10].
For more than 50 years, terrestrial mosses have been successfully used to monitor and map the atmospheric deposition of trace metals in many parts of the world [9,10,11,12,13,14,15,16,17,18,19,20,21]. Mosses are characterized by a small change in the morphology during the growing season. Due to their adaptability, mosses are widespread under different environmental conditions [22,23].
Global sources of pollution of the environment include activities, such as exploitation of natural resources and their processing through adequate technological processes, as well as non-ecological waste management. In this respect, the area of Macedonia does not deviate from the global average. In former Yugoslavia, Macedonia was an important producer of metals, such as copper, steel, ferroalloys, lead, zinc, cadmium, nickel, silver, and gold. Long-term mining and mining-related activities have led to the pollution of the environment, as reported in several studies [2,3,22,24,25,26,27,28,29,30,31,32,33,34,35,36,37,38,39,40,41,42,43,44,45,46].
For the first time in Macedonia, a heavy metal air pollution study, covering all the area of the country, was made in 2002 using mosses as biomonitors. In 2005 and 2010, the study followed the framework of the United Nations Economic Commission for Europe International Co-operative Program on Effects of Air Pollution on Natural Vegetation and Crops with heavy metals in Europe (UNECE ICP Vegetation). The first results of the air pollution biomonitoring research with heavy metals have increased the interest in applying biomonitoring with mosses that are focused on individual critical regions in Macedonia [37]. Investigations were conducted in the area of the Bučim copper mine in the vicinity of the town of Radoviš [27,40], in the area of ferronickel smelter plant near the town of Kavadarci (Ni and Cr) [30,47]; in the eastern parts of the country near Pb-Zn mines and flotation plants “Toranica” [3,41], “Zletovo” [39,42], and “Sasa” [42,43]. The study was also conducted in the vicinity of the abandoned As-Sb-Tl mine “Allchar” on the Kožuf Mountain [35], as well as in the surroundings of the thermoelectric coal-fired power plants in Bitola and Kičevo [48,49,50].
The aims of the paper are to monitor the temporal trends of elements and groups of elements related to air pollution trends by comparing the results of the three moss surveys in 2002, 2005, and 2010 in Macedonia. This study verifies the pollution sources identified with the first national survey performed in 2002 to distinguish anthropogenic from natural sources, to identify the deposition patterns over the entire study area, and to make the data available so that it can be compared with results of further surveys.

2. Materials and Methods

2.1. Study Area

The Republic of Macedonia is situated in the central part of the Balkan Peninsula (Figure 1) with an area of 25,713 km2 between latitudes 40° and 43° N and between longitudes 20° and 23° E. Geographically, the investigated area is clearly defined by a central valley formed along the Vardar River, which is surrounded by mountain ranges. The country boasts 16 mountains higher than 2000 m, although most of its area lies between 500 and 1000 m. The lowest point (44 m) indicates an area on the cross point of the Vardar River; the highest point (2764 m) is the peak of Korab mountain [51]. Most of the population (2.057 million), lives in urban areas, and more than a quarter live in the capital city of Skopje [52].
The Republic of North Macedonia has three climatic types, due to specific natural and geographical features. The northern parts of the country are characterized by the mildly continental climate, while the area along the valleys of the Vardar River typically has a Mediterranean climate. There is also a mountainous climate, which is dominant in the mountainous region of the country. All three types of climate that spread and partly intertwine through the country have an impact on the properties of the individual seasons between regions. Winters are milder in the eastern areas, and summers are hotter and drier in the western areas [53].
The average annual precipitation varies from 500 to 600 mm in the central and eastern areas along the valley of the Vardar River to 1400 mm in the western mountainous area. The area with the least precipitation is between the Ovče Pole, Tikveš, and the Štip basins. Usually, the wind blows from the north/northwest toward the south/southeast or vice versa. However, the directions of the winds in various parts of Macedonia are heavily dependent on the orographic conditions. The average speed of the winds in the country is 6 m/s [53].
The country is enriched by reserves of several ores. The industrial sector represents 31.9 of Gross Domestic Product (GDP), while the agriculture sector represents 18.9%. The main industrial activities are situated in Skopje (steel and ferroalloys production and steel processing), Radoviš (copper mine and flotation), Veles (abandoned lead-zinc and cadmium smelter), Kavadarci (ferronickel smelter), Tetovo (abandoned ferrochrome smelter and present ferrosilicon smelter), and Kičevo and Bitola (thermoelectric power plants, where the lignite fuel is used). Three Pb-Zn mines and flotation plants are located (Sasa, Toranica, Zletovo) in the eastern part of the country; a previously active As-Tl-Sb mine “Allchar” is in the southern part of Macedonia. These active and abandoned industrial facilities have led to environmental pollution in the nearby and distant areas with different heavy metals, reported by several studies [24,25,26,27,28,29,30,31,32,33,34,35,36,37,38,39,40,41,42,43,44,45,47,48,49,50] and those studies realized recently [46,54,55,56,57,58,59].
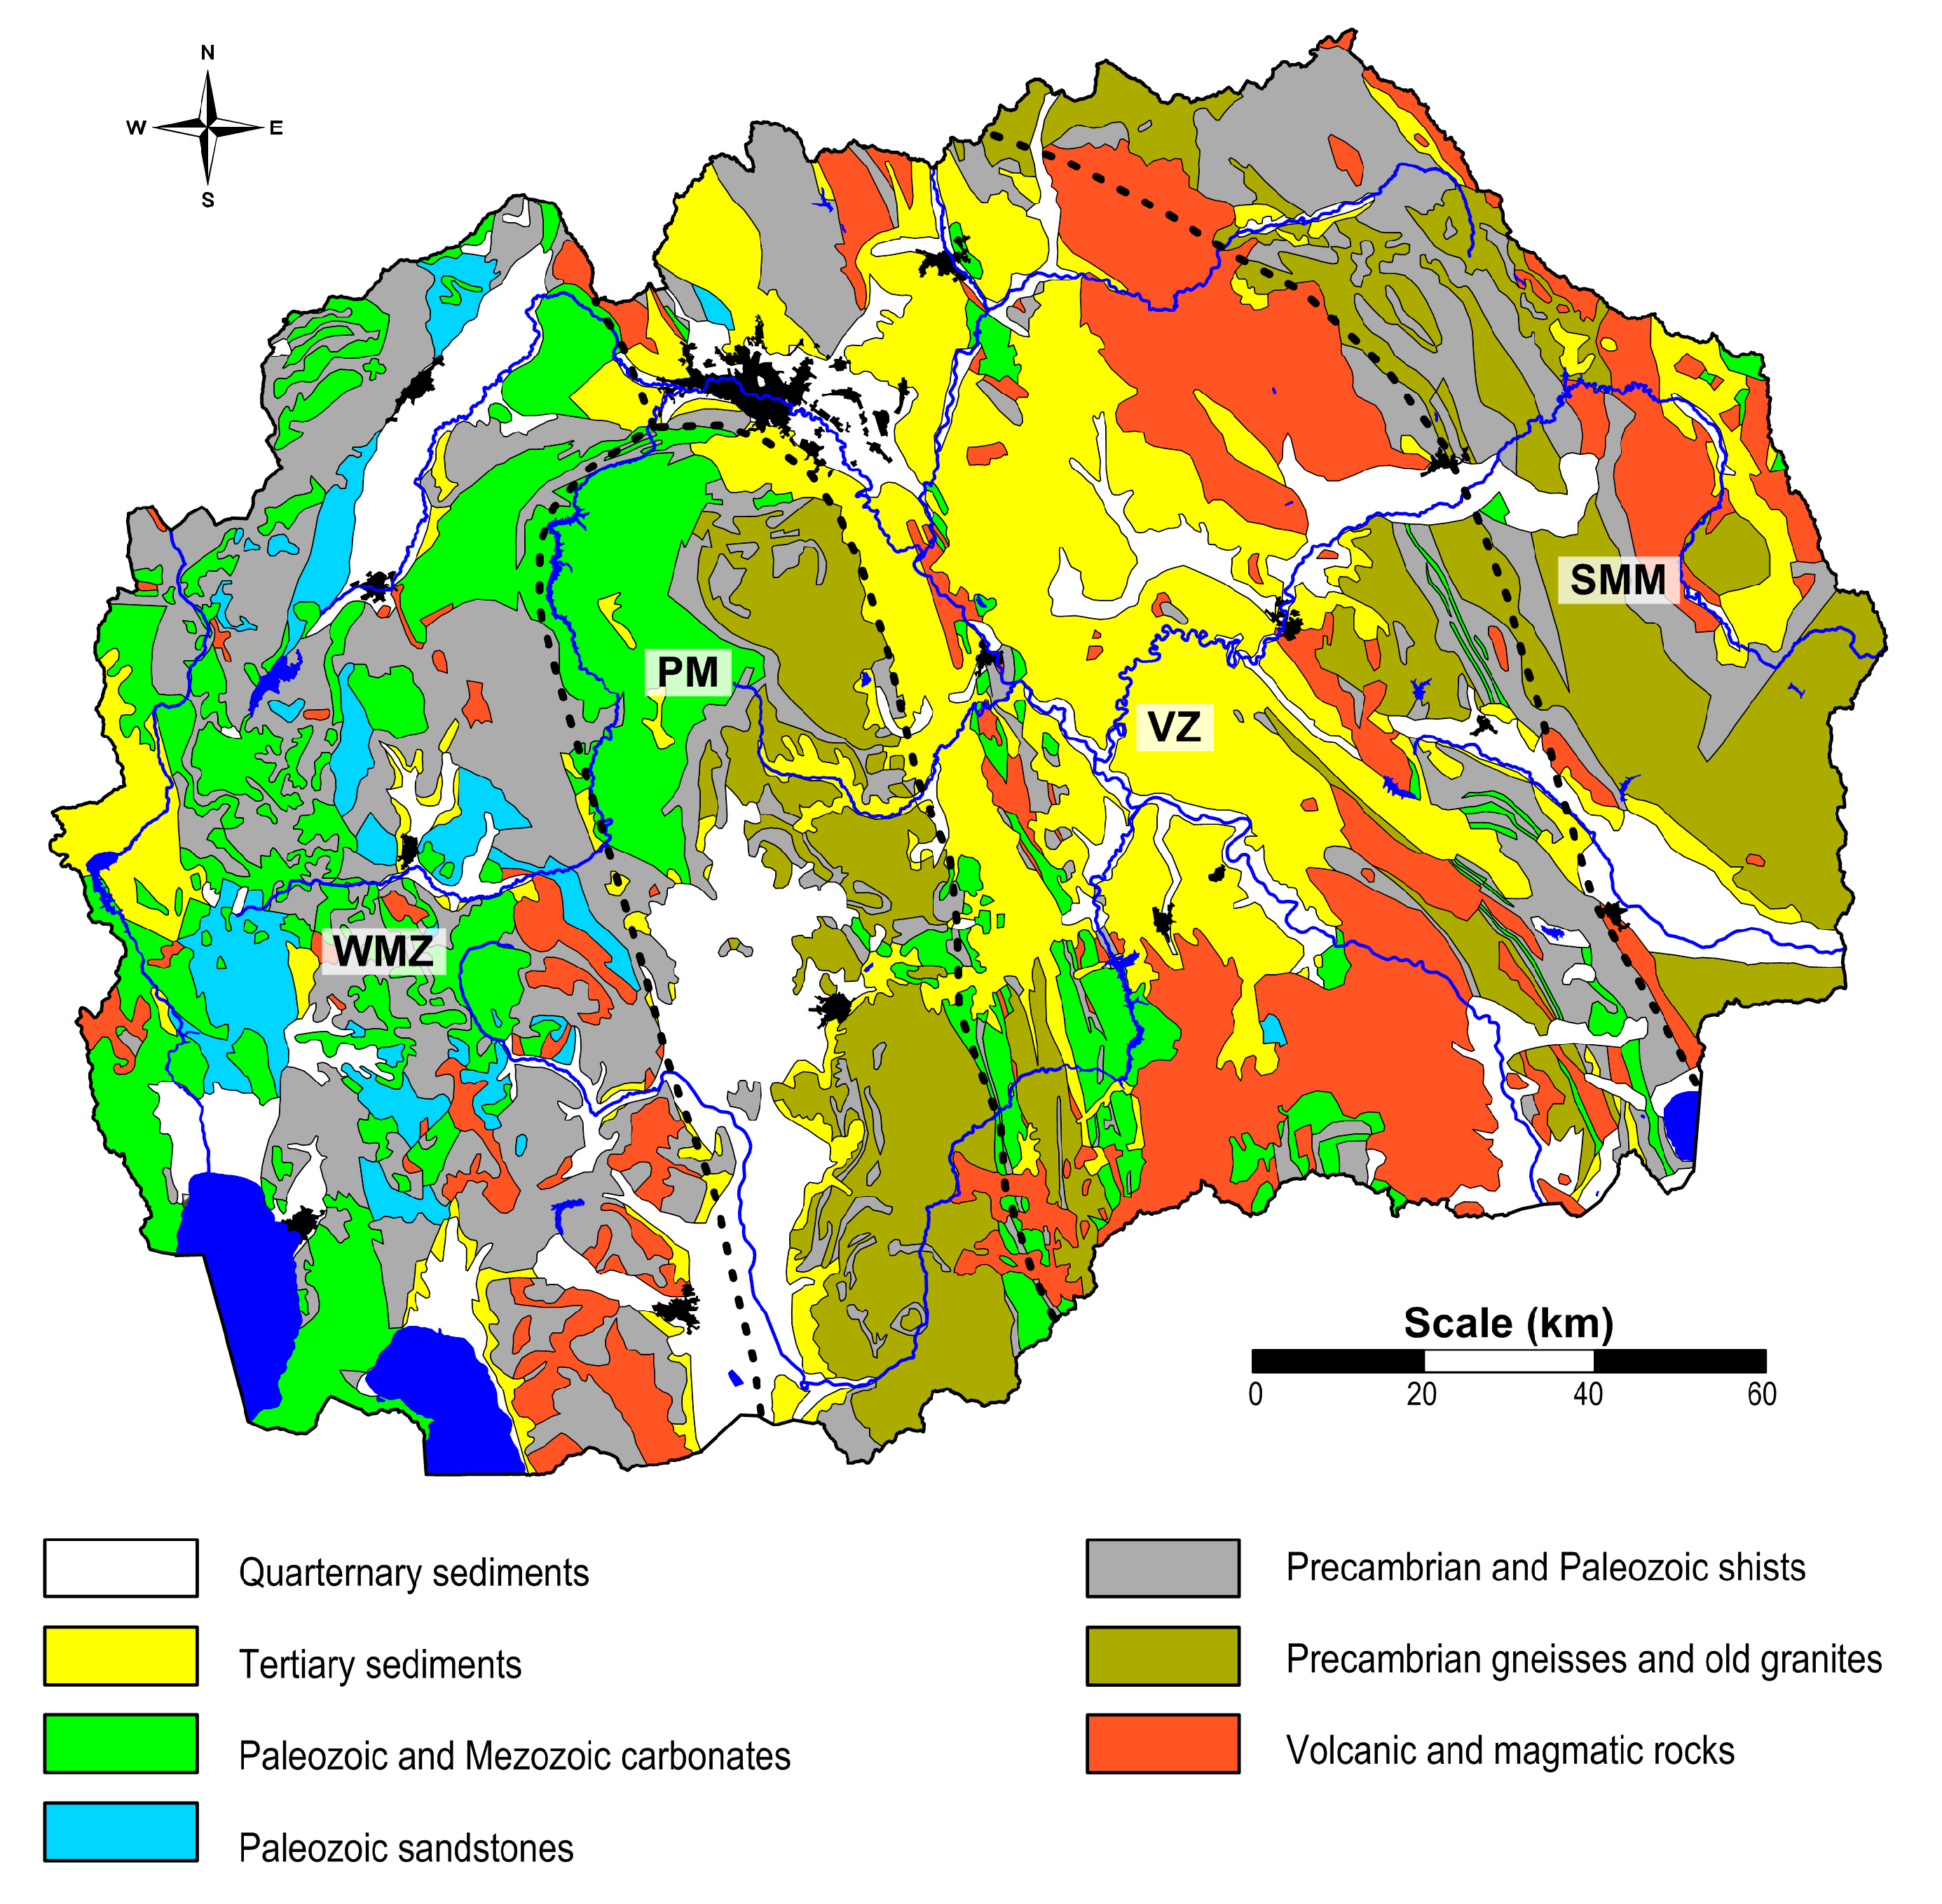
Macedonia is constituted by several geotectonic units that were formed during different geological periods; these are generally spread out in NNW-SSE to N-S direction [44,59]. Contacts of units are marked by regional faults managed by the Laramide compression (Laramide orogeny phase) [44]. The country lies on four major tectonic units (Figure 2): The Serbo-Macedonian massif (SMM), the Vardar zone (VZ), the Pelagonian massif (PM), and the West-Macedonian zone (WMZ) [60,61]. The SMM and PM form the oldest complexes in which highly metamorphic Proterozoic rocks have developed; the area is characterized by widespread Riphean-Cambrian, Paleozoic, Mesozoic, and Cenozoic rocks [44]. The WMZ is lithologically composed of low-grade metamorphic rocks, and anchi-metamorphic Paleozoic rocks and migmatites, Triassic and Jurassic sediments, and migmatites, and Tertiary sediments [44]. The VZ is a large and important lineament structure of the Balkan Peninsula [61]; it represents an area where a continuous thinning of the continental crust had occurred, and where, during the Lower Jurassic, it completely transited into the rift zone [44].

2.2. Sampling and Sample Preparation

In this study, datasets from three different moss surveys were used for comparison among them. The first moss survey aiming to monitor heavy metal air pollution was carried out in 2002 in the entire territory of Macedonia. For this reason, samples from 72 sites of three moss species Hypnum cupressiforme, Homalothecium lutescens, and Homalothecium sericeum were collected from September to October [1,2]. The contents of 41 elements (Na, Mg, Al, Cl, K, Ca, Sc, Ti, V, Cr, Mn, Fe, Co, Ni, Cu, Zn, As, Se, Br, Rb, Sr, Zr, Mo, Ag, Cd, In, Sb, I, Cs, Ba, La, Ce, Sm, Eu, Tb, Hf, Ta, W, Au, Th, and U) in each sample were analyzed either by neutron activation analysis or by atomic absorption spectrometry. The next survey was conducted from August to September 2005; samples of Hypnum cupressiforme and Homalothecium lutescens were taken at the same 72 sites. Using neutron activation analysis and atomic absorption spectrometry, the content of 38 elements (Al, As, Ba, Br, Ca, Cd, Ce, Co, Cr, Cs, Cu, Dy, Eu, Fe, Hf, Hg, K, La, Mg, Mn, Mo, Na, Ni, Rb, Sb, Sc, Se, Sm, Sr, Ta, Tb, Th, U, V, W, Yb, Zn, and Zr) were determined in each sample [32]. The third moss survey was conducted in August and September 2010 at the same 72 locations, where the same moss species were collected as in the moss survey carried out in 2005. In addition to the techniques used in previous surveys, the atomic emission spectrometry with inductively coupled plasma (ICP-AES) was also used to determine 41 elements (Al, As, Au, Ba, Br, Ca, Cd, Ce, Cl, Co, Cr, Cs, Cu, Dy, Eu, Fe, Hf, Hg, I, K, La, Mg, Mn, Mo, Na, Ni, Pb, Rb, Sb, Sc, Se, Sm, Sr, Ta, Tb, Th, Ti, U, V, W, Zn, and Zr) in the samples [22,33].
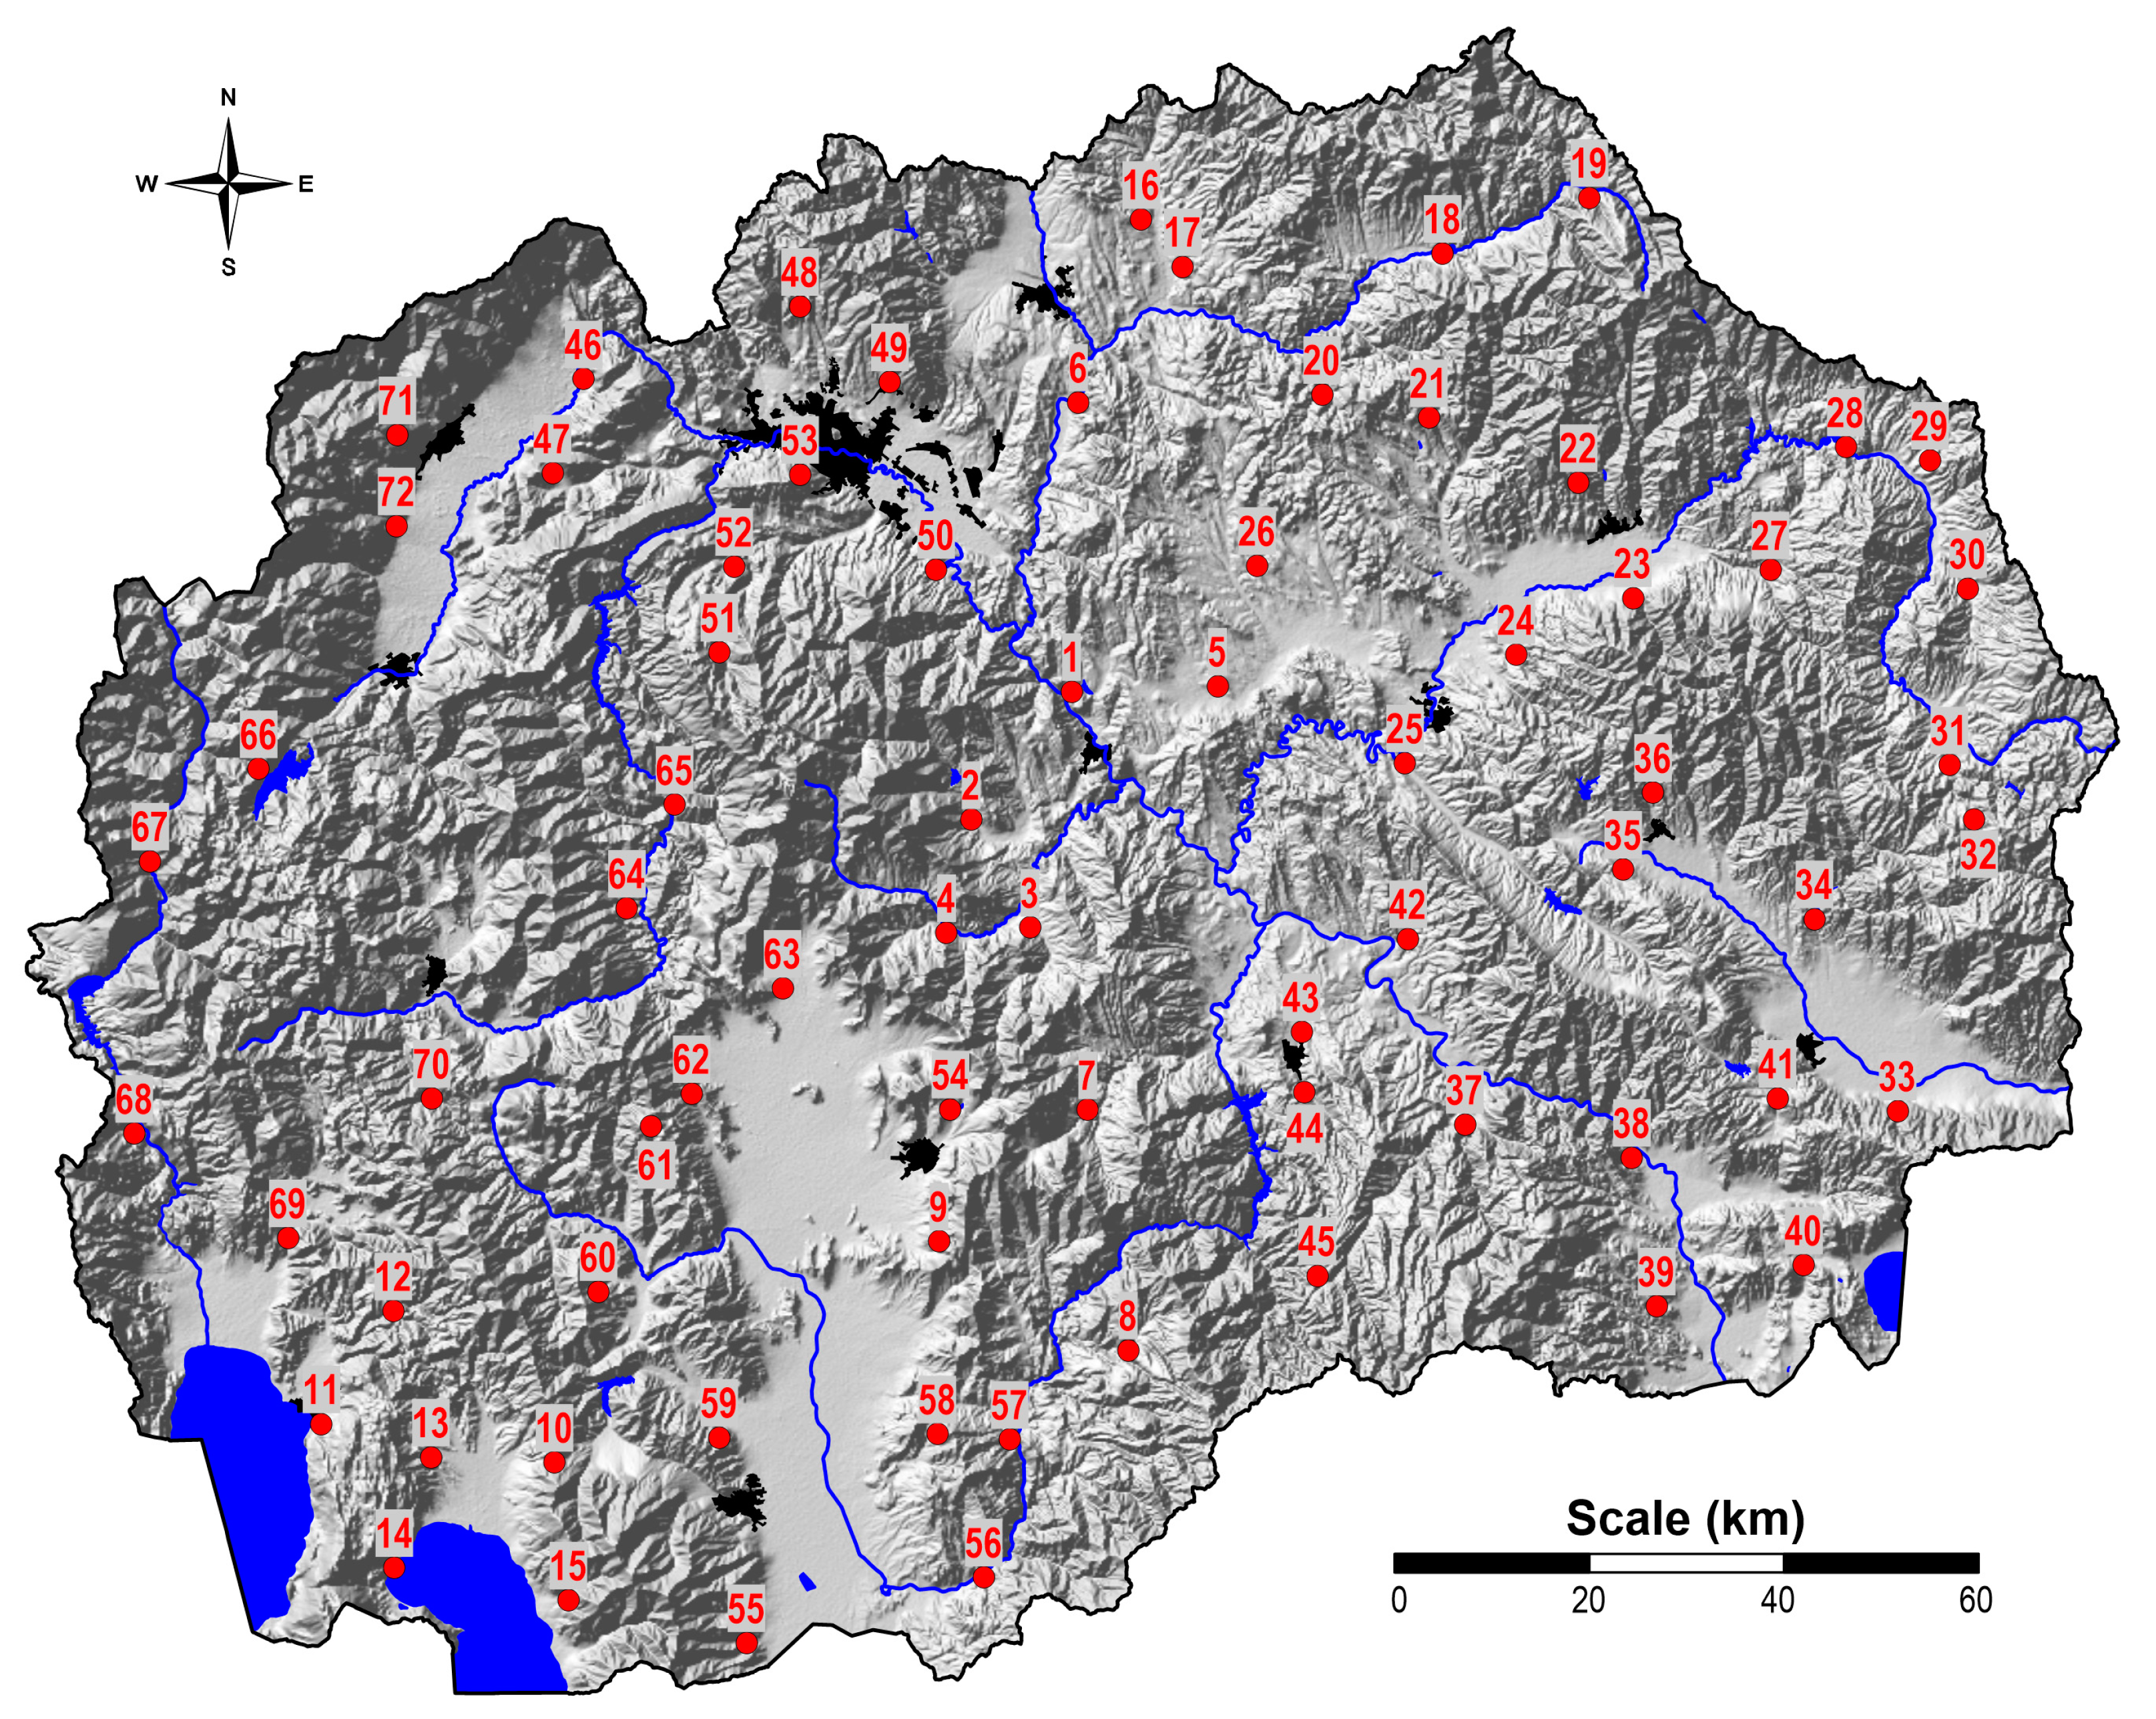
To enable a comparison between individual surveys, the sampling locations mostly overlap (Figure 3), and the same biotope conditions were used. The sampling in 2002 followed the principles of European moss surveys [14,62]. In 2005, sampling was performed according to the guidelines of the ICP Vegetation Program—monitoring manual for the 2005/2006 survey, and the procedure used in the previous European moss surveys [63]. In 2010, the sampling followed the principles of the Convention on Long-Range Transboundary Ari Pollution (CLRTAP) and the International Cooperative Program on Effects of Air Pollution on Natural Vegetation and Crops monitoring manual for 2010/2011 survey and the procedure used in the previous European moss surveys [64].
In each sampling year, the samples were collected at least 300 m from a major road and populated area, and at least 100 m from small roads and single houses. Each sample was a mix of five to ten sub-samples taken from 50 m × 50 m. Sampling and sample handling was performed using separate polyethylene gloves for each sample, to prevent any contamination of the samples. Samples were properly marked and stored in paper bags. In cases where more than one moss species was collected at the same sampling site, the interspecies comparison showed no essential differences within error estimates.
Samples were brought to the laboratory where they were cleaned from extraneous material (litter and dead leaves) and dried to a constant weight for 48 h at 30–40 °C. Green-brown parts of the moss shoots represented the last three years of the moss growth and were selected to be subjected to the analysis of pollutant content. For neutron activation analysis (NAA), atomic absorption spectrometry (AAS), and atomic emission spectrometry with inductively coupled plasma (ICP-AES), the moss samples were prepared according to the description from previous studies, where quality control data are also given [2,22,32].

2.3. Statistical Methods

Data on chemical analyses obtained from previous studies [1,2,22,32,33] are used in the proposed report. To compare the results between different datasets, and simultaneously perform parametric and non-parametric statistical methods, the statistical software Statistica 13 (StatSoft, Inc., Tulsa, OK, USA) was used [65,66].
Since the datasets were non-normally distributed, a Box-Cox transformation was performed [67]. Box-Cox transformed values were used later in the analysis of variance (ANOVA). This analysis represents an important tool in assessing the differences in selected elements according to the sampling campaign. With the assist of bivariate statistics, the correlation of content of chemical elements between individual moss samples according to the sampling campaign was initially established, which was then substantiated by statistical tests (t-test and F-test). The use of t-test and F-test allows the assessment of the statistical significance of differences between the accumulation values measured in different exposure periods. The enrichment ratio (ER) was used to assess the selected elements measured in various sampling campaigns. The ER is defined as the ratio of a grade of an element in some areas according to the natural abundance of the metal [68].
To investigate the degree of association of the chemical elements in the moss samples, the Pearson correlation coefficient I was used [69]. Using the correlation coefficient, the correlation degree (linear dependence) between two random variables or sets of random variables was calculated. A good association between the elements was assumed for r between 0.5 and 0.7, while a strong association was determined if r values ranged between 0.7 and 1.0. The elements with small values of the correlation coefficient were omitted from the matrices.
Based on the matrix of correlation coefficients, multivariate cluster, and R-mode factor analysis, the associations of chemical elements were revealed [70,71,72]. In this case, the values in a range of 0.5 to 0.7 were a good association, while the values in the range of 0.7 to 1.0 were a strong association. The multivariate statistical cluster and factor analyses were performed on 27 selected elements (Al, As, Co, Cs, Fe, Hf, Na, Rb, Sc, Ta, Th, Ti, U, V, Zr, Cd, Pb, Sb, Zn, Cr, Ni, Ba, K, Sr, Br, I, and rare-earth elements (RE)). Some elements were excluded from the analysis because they did not show a sensible connection with other chemical elements, or did not satisfy the criteria of dimension variables based on several observations. For factor analysis purposes, the variables were standardized to a zero mean [70,71,73]. Subsequently, based on characteristics of the 27 individual elements, five synthetic variables were designed (Factor 1—F1 to Factor 5—F5), which account for 81.8% of the total variability of the treated elements. The variables with factor loadings higher than 0.6 were assumed to contribute significantly to a given factor.
For the construction of maps showing the spatial distribution of factor scores and maps displaying the distribution of heavy metals in moss samples, universal kriging with the linear variogram interpolation method was applied [70]. For interpolation, the basic grid cell size was 1 × 1 km. Seven classes (0–10, 10–25, 25–40, 40–60, 60–75, 75–90, and 90–100) of the percentile values of the distribution of interpolation values were defined. The visualization (mapping) of data was performed using several software packages: Statistica 13 (StatSoft, Inc., Tuls, OK, USA), QGIS (#), and Surfer 17 (Golden Software, Inc., Golden, CO, USA).

3. Results and Discussion

The results of descriptive statistics to all assessed elements (aluminum, arsenic, barium, bromine, cadmium, cerium, cobalt, chromium, cesium, europium, iron, hafnium, iodine, potassium, lanthanum, sodium, nickel, lead, rubidium, antimony, scandium, samarium, strontium, tantalum, terbium, thorium, titanium, uranium, vanadium, zinc, and zirconium) in the 72 samples are shown in Table 1. The mean, median, minimum, and maximum contents were calculated for all 31 chemical elements (Al, As, Ba, Br, Cd, Ce, Co, Cr, Cs, Eu, Fe, Hf, I, K, La, Na, Ni, Pb, Rb, Sb, Sc, Sm, Sr, Ta, Tb, Th, Ti, U, V, Zn, and Zr) for the three sets of samples (Table 1). The results of the ANOVA and ER with respect to the sampling campaign are given in Table 2.
In Table 1, the mean values, median values, and the interval ranges for the contents of all 31 selected elements used for comparison between moss surveys measurements are introduced. Generally, the medians of the elements decreased according to the sampling campaign. However, there are some exceptions. The median content of Ni content from 2005 (5.8 mg/kg) and 2010 (4.3 mg/kg) was higher than in 2002 (2.5 mg/kg), which is related to reactivation and increasing the production capacity of the ferronickel smelter near Kavadarci in 2004 [33].
A similar trend can be observed for Cd and Pb. The higher values of these two elements in 2005 than in 2002 can be explained by pollution associated with the polluted soil and the existence of an open slag waste dump in the vicinity of the abandoned lead-zinc smelter near the town of Veles [24]. In contrast, the lower median values of Cd and Pb measured in 2010 compared with those obtained in 2002 and 2005 can be explained by the closure of the lead-zinc smelter in Vales in 2003.
The presence of iodine and bromine as an association of these two elements (halogens) is primarily due to marine influence. Along the valley, the Vardar River, the Jugo wind blows from the northern parts of Africa across the Aegean Sea and brings with itself particles enriched with these two elements, which could be subsequently trapped in mosses [74]. The titanium also does not follow a declining trend over the years. The values of Ti from 2005 are higher than in 2002, which can be related to the increased mining activities in the copper flotation plant near Radoviš [22].
Al, As, Ba, Ce, Co, Cs, Eu, Fe, Hf, La, Na, Rb, Sc, Sm, Ta, Tb, Th, U, V, and Zr represent the typical crustal composition. However, it cannot be overlooked the significant fall of some median values of elements according to the sampling campaign. One possible explanation in this case study could be related to the intensity of precipitation and leaching of trapped particles from the mosses, reducing the values by as much as 20%, according to previous studies [75]. In eight regions in Macedonia, the precipitation increased between 2005 and 2010, which further confirms the aforementioned study [76,77].
The differences in the measurements of individual elements, according to the sampling campaign, were supported by the ANOVA analysis. The t-test was used to compare the values of the elements obtained in two different sampling campaigns (Table 2). There were no significant differences between the contents of particular elements measured in 2002 and 2005, which means that all mining and metallurgy activities continuously operated within the same capacity during that period; there were also no natural changes. There were significant differences between the contents of elements measured in 2002 vs. 2010 and the contents of elements obtained in 2005 vs. 2010, respectively, related to either natural or anthropogenic influences. This was then also confirmed by the F-test, which showed that there are significant differences in element values in all three moss surveys.
The enrichment ratio (ER) for all selected 31 elements is given in Table 2. The highest enrichment ratio is found for Ni (2.34) in moss samples from 2002 compared with those from 2005 (Table 2). High values of Ni were a consequence of the increased workload in ferronickel smelter in the vicinity of Kavadarci in 2004. The highest enrichment ratio was found for Br (1.96), which is a marine halogen. The Aegean Sea is less than 60 km from the southern state border, and the wind blowing from the northern parts of Africa across the Aegean Sea brings halogen-enriched particles. Over the years, the wind may be strengthened, increasing the content of Br in mosses [78].
For a better visibility, the matrix of correlations coefficients was divided into two matrices. Table A1 is a matrix of correlation coefficient of 16 selected naturally distributed elements; Table A2 is a matrix of correlation coefficients of 11 selected elements. In both matrices, the Box-Cox transformed values were used.
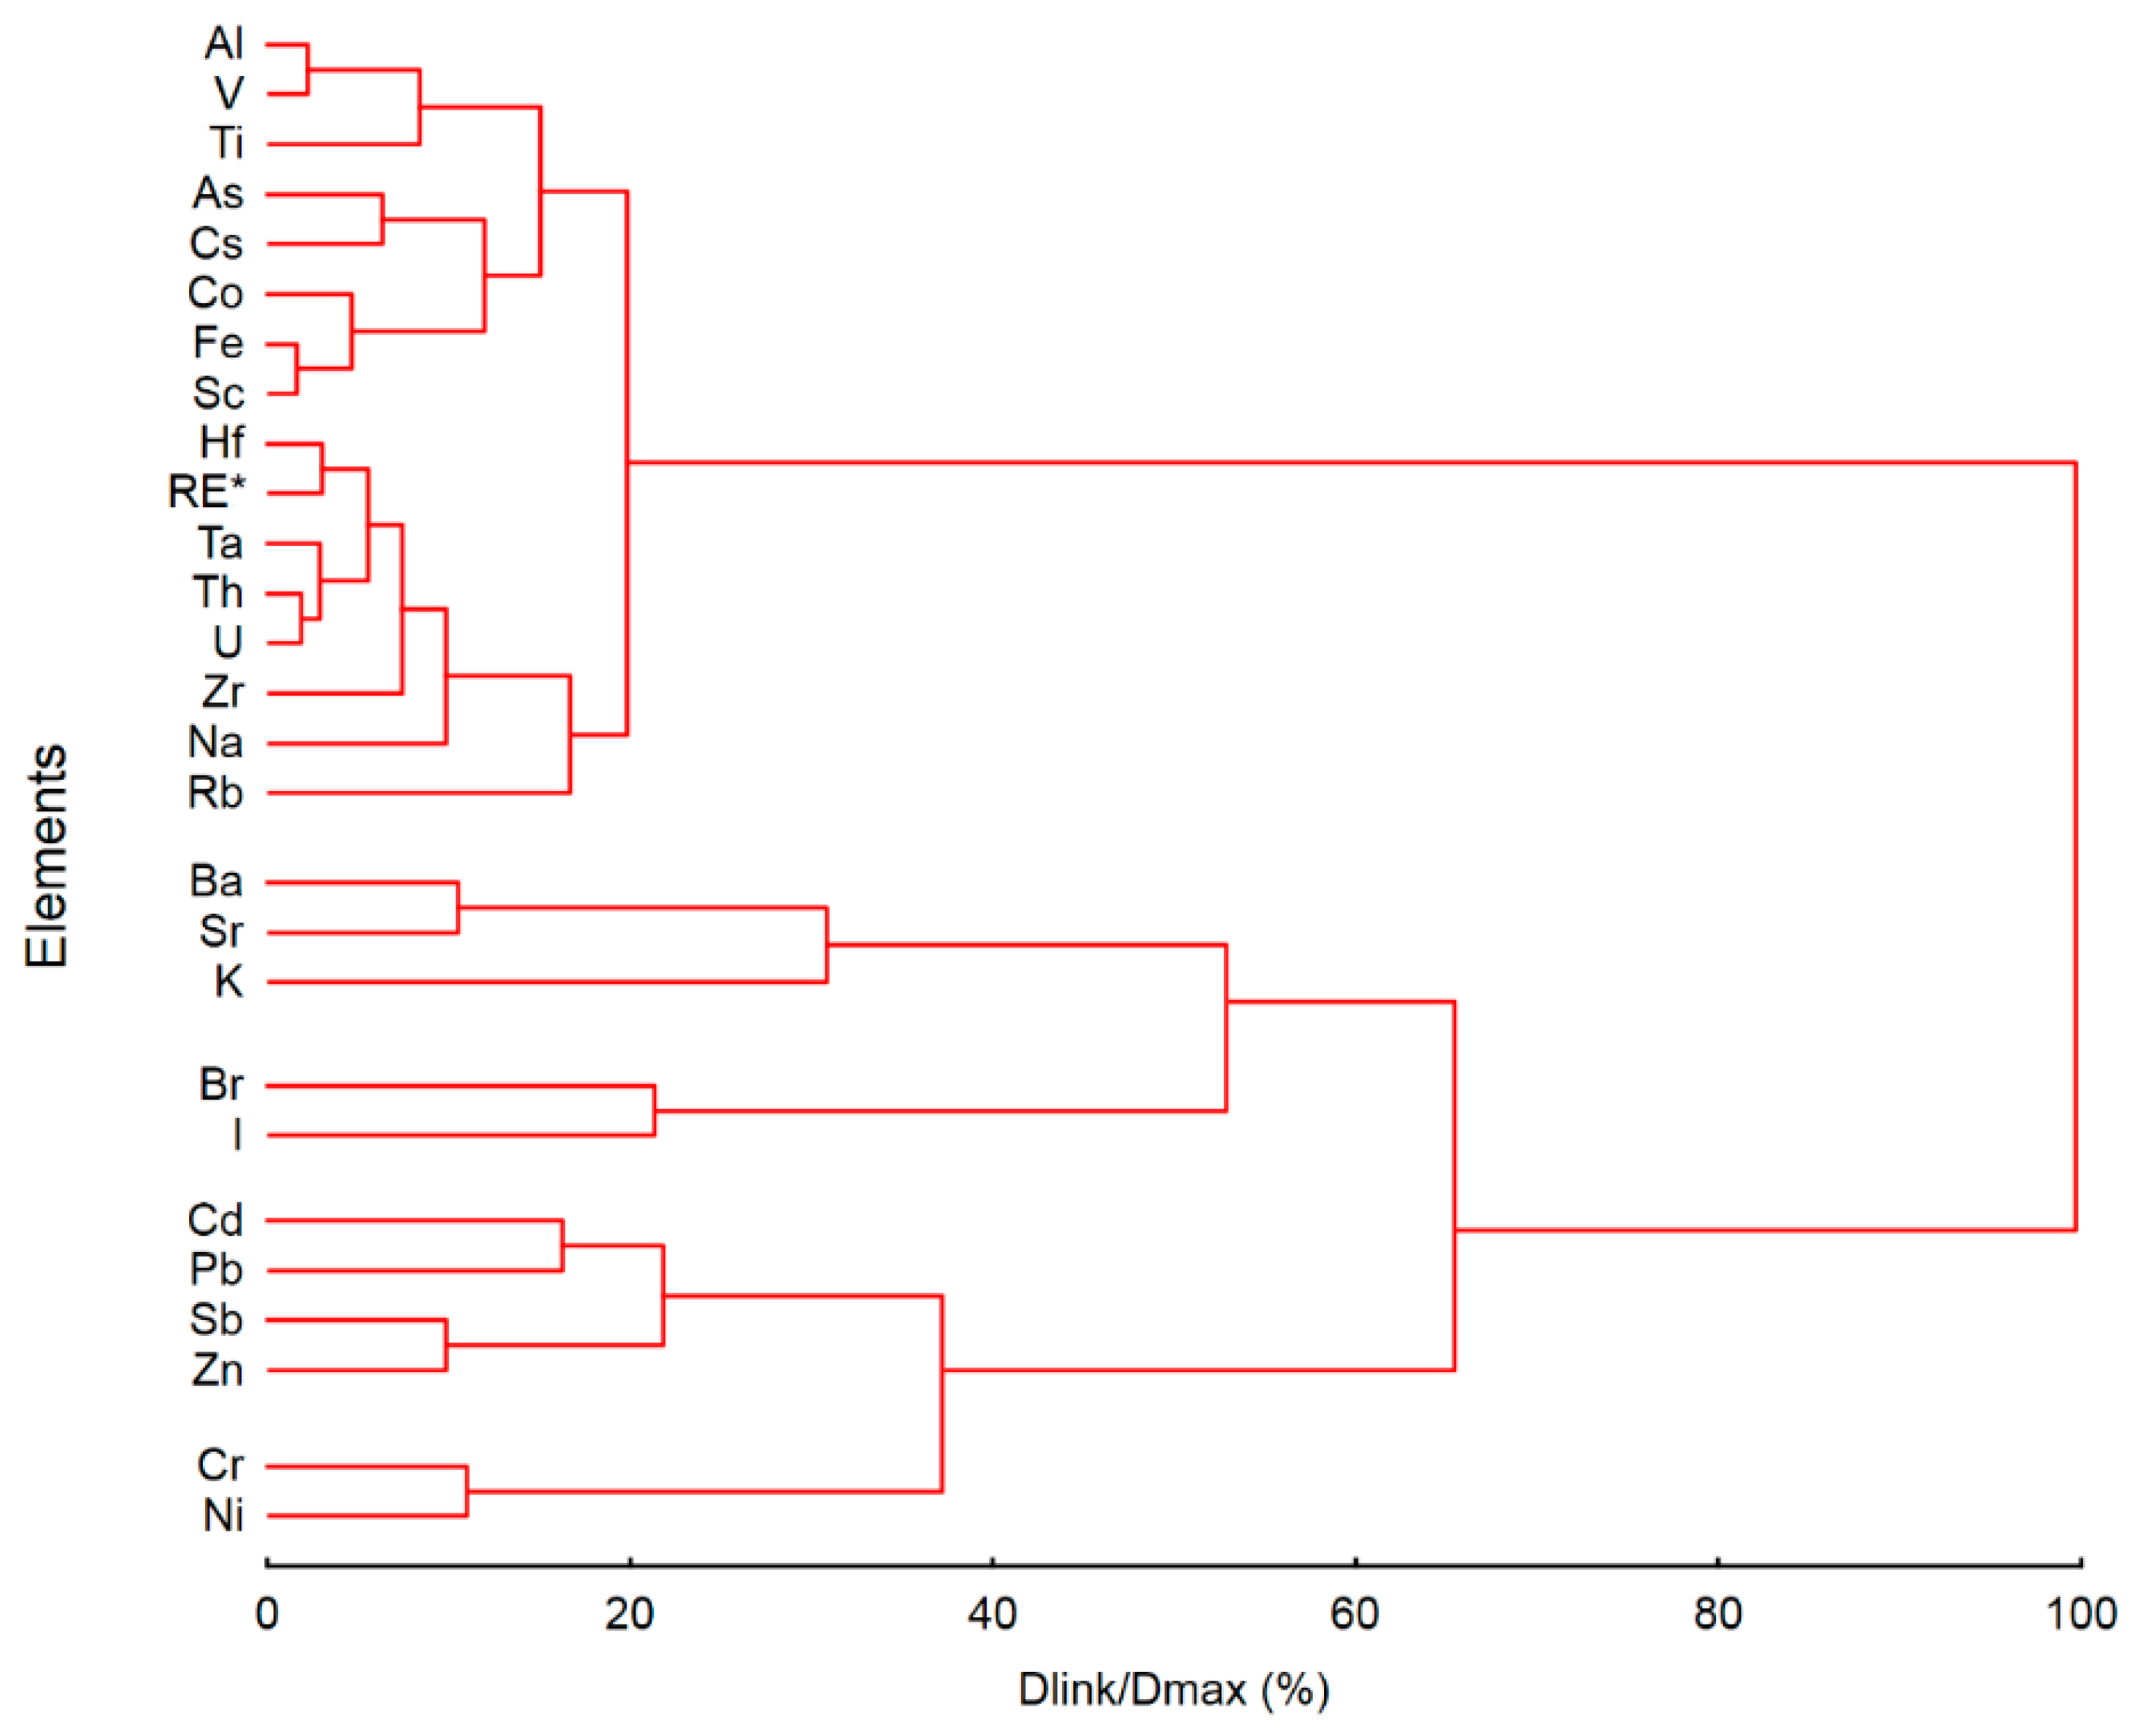
Three geogenic, one anthropogenic association, and one mixed (geogenic-anthropogenic) geochemical associations were established as a result of a visual inspection of the similarities of the spatial distribution of element patterns, a comparison of basic statistical parameters, the correlation coefficient matrices (Table A1 and Table A2), and the results of multivariate analyses (cluster and factor analysis). Variables or samples with similar behavior were combined into the cluster according to the Pearson correlation coefficient. The results are presented in a dendrogram, which was performed to show the results of the hierarchical cluster analysis of 27 selected elements (Figure 4); and with factor analysis, where the grouping of the elements into five groups was performed (Table 3). The same classification trend into the factor score or cluster can be seen in both analyses. Four elements were excluded from the clustering because of the absence of similarity linkage.
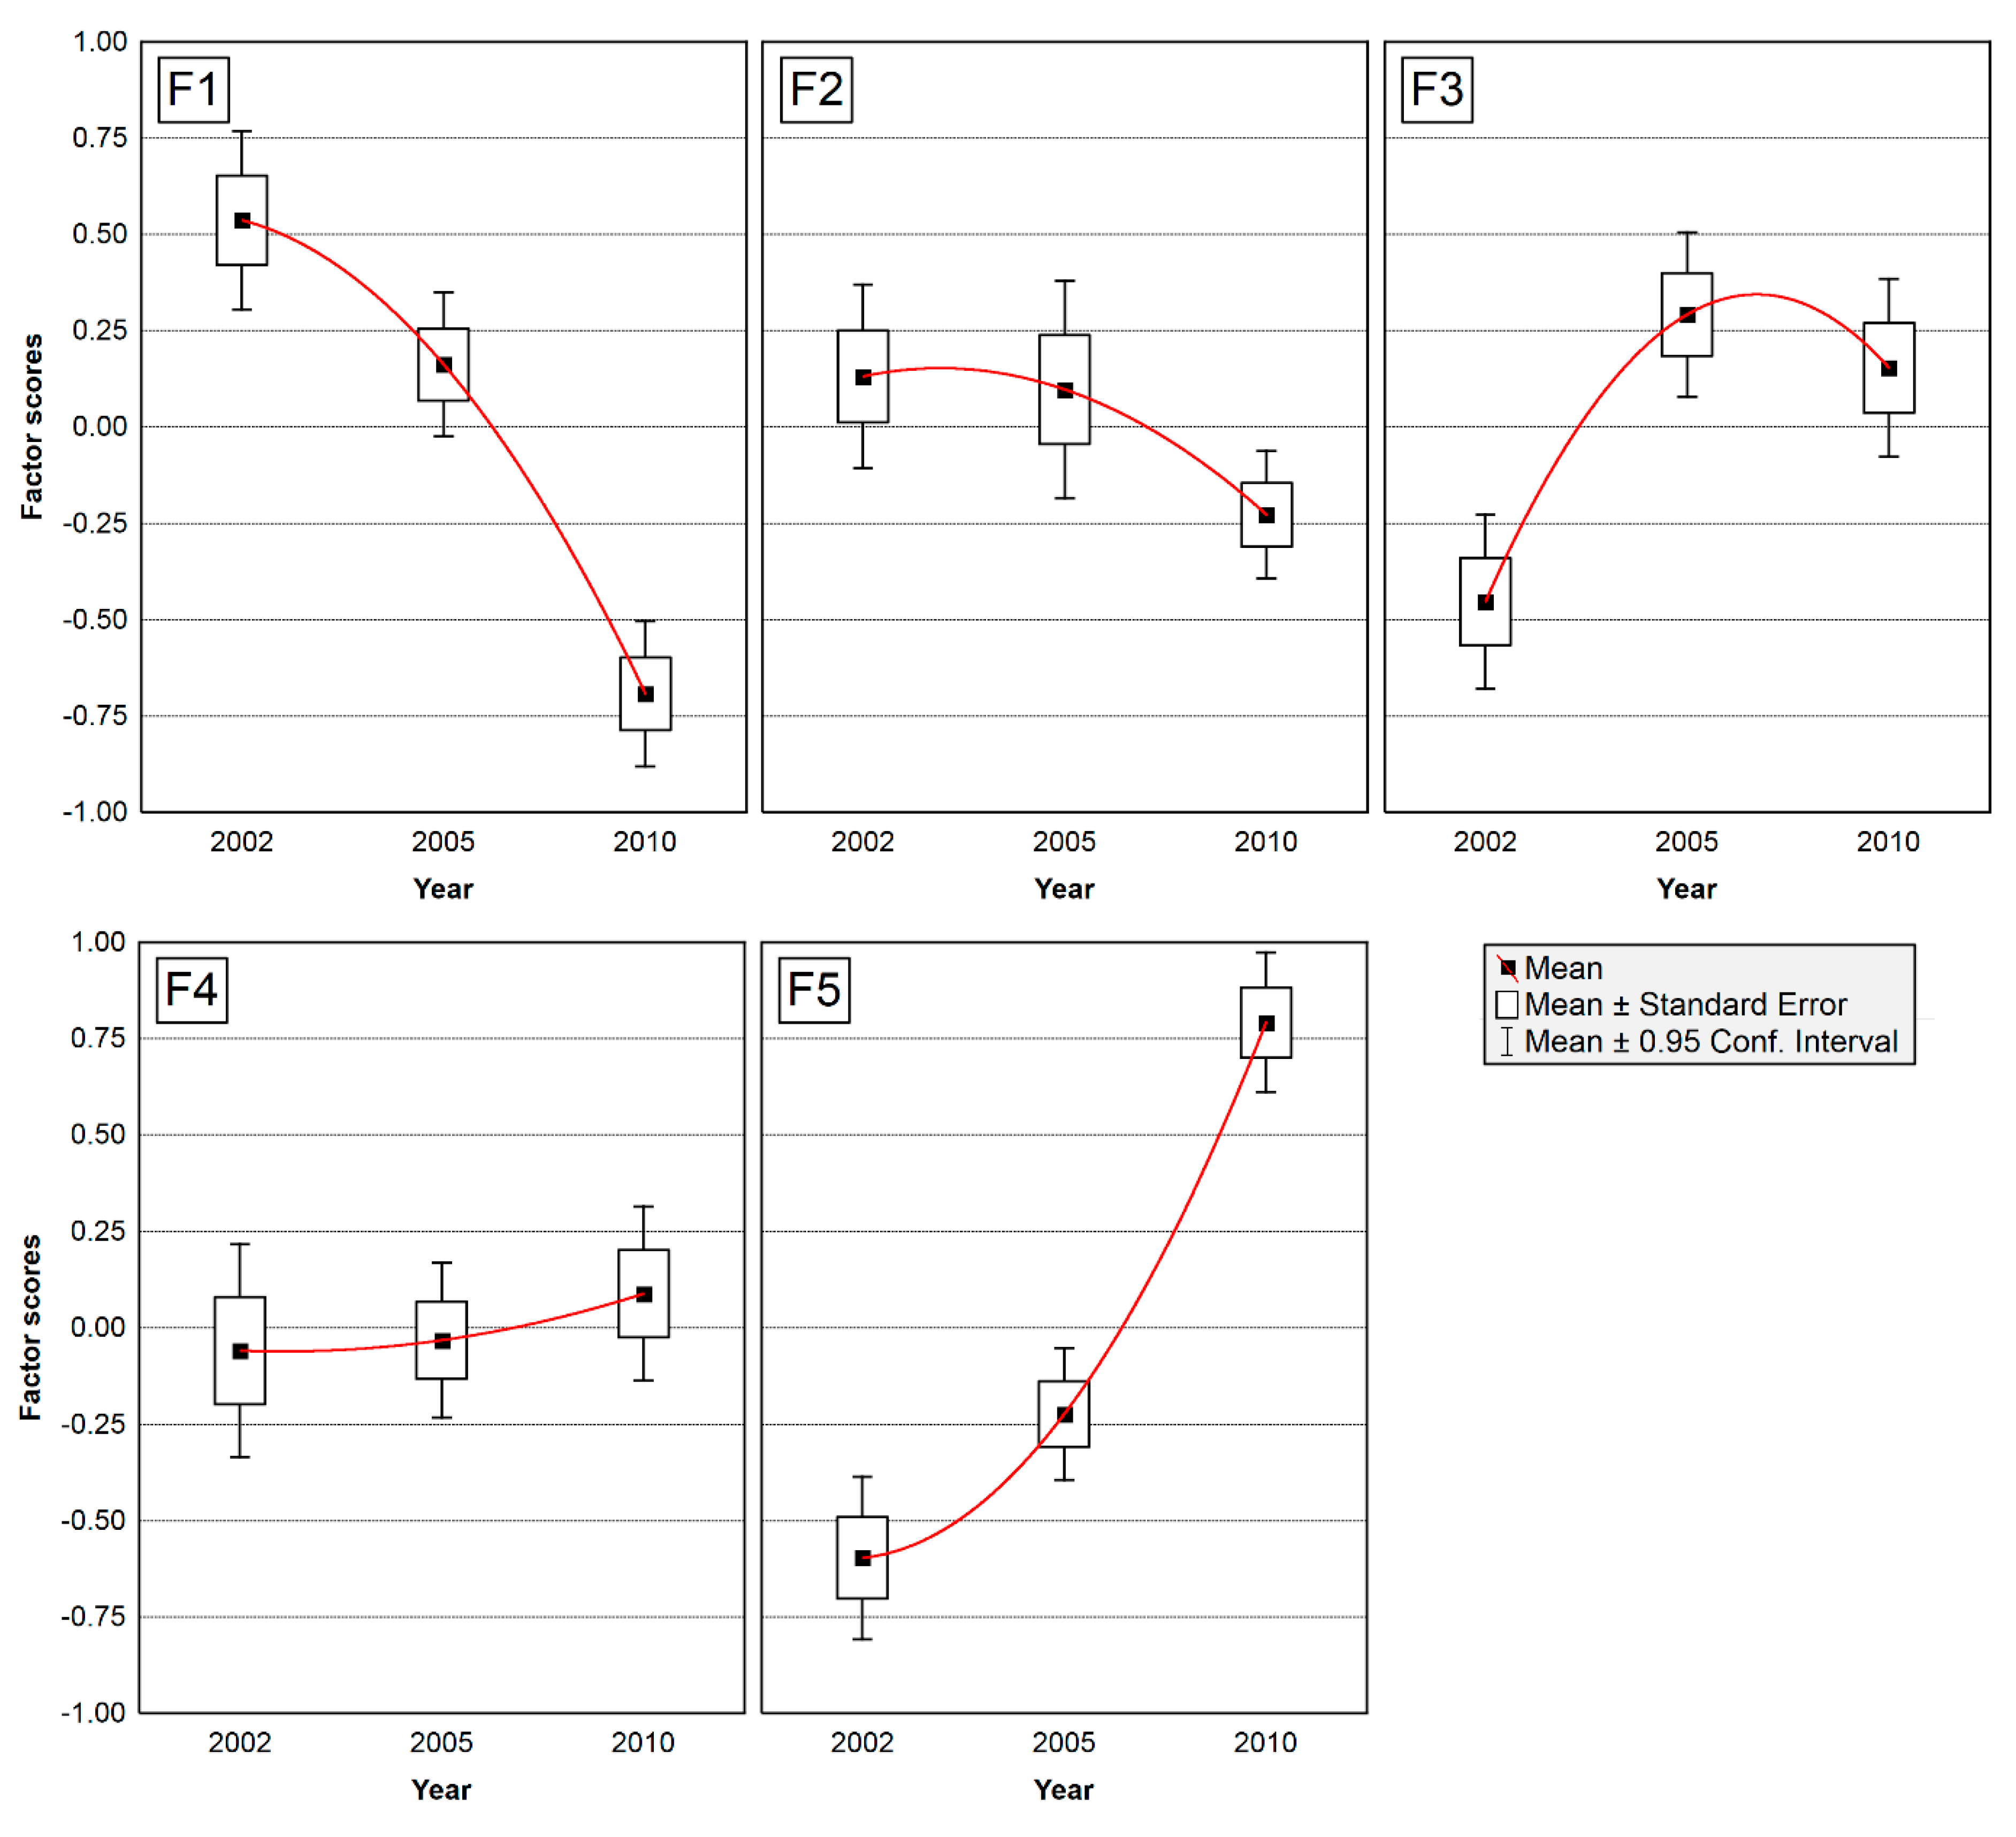
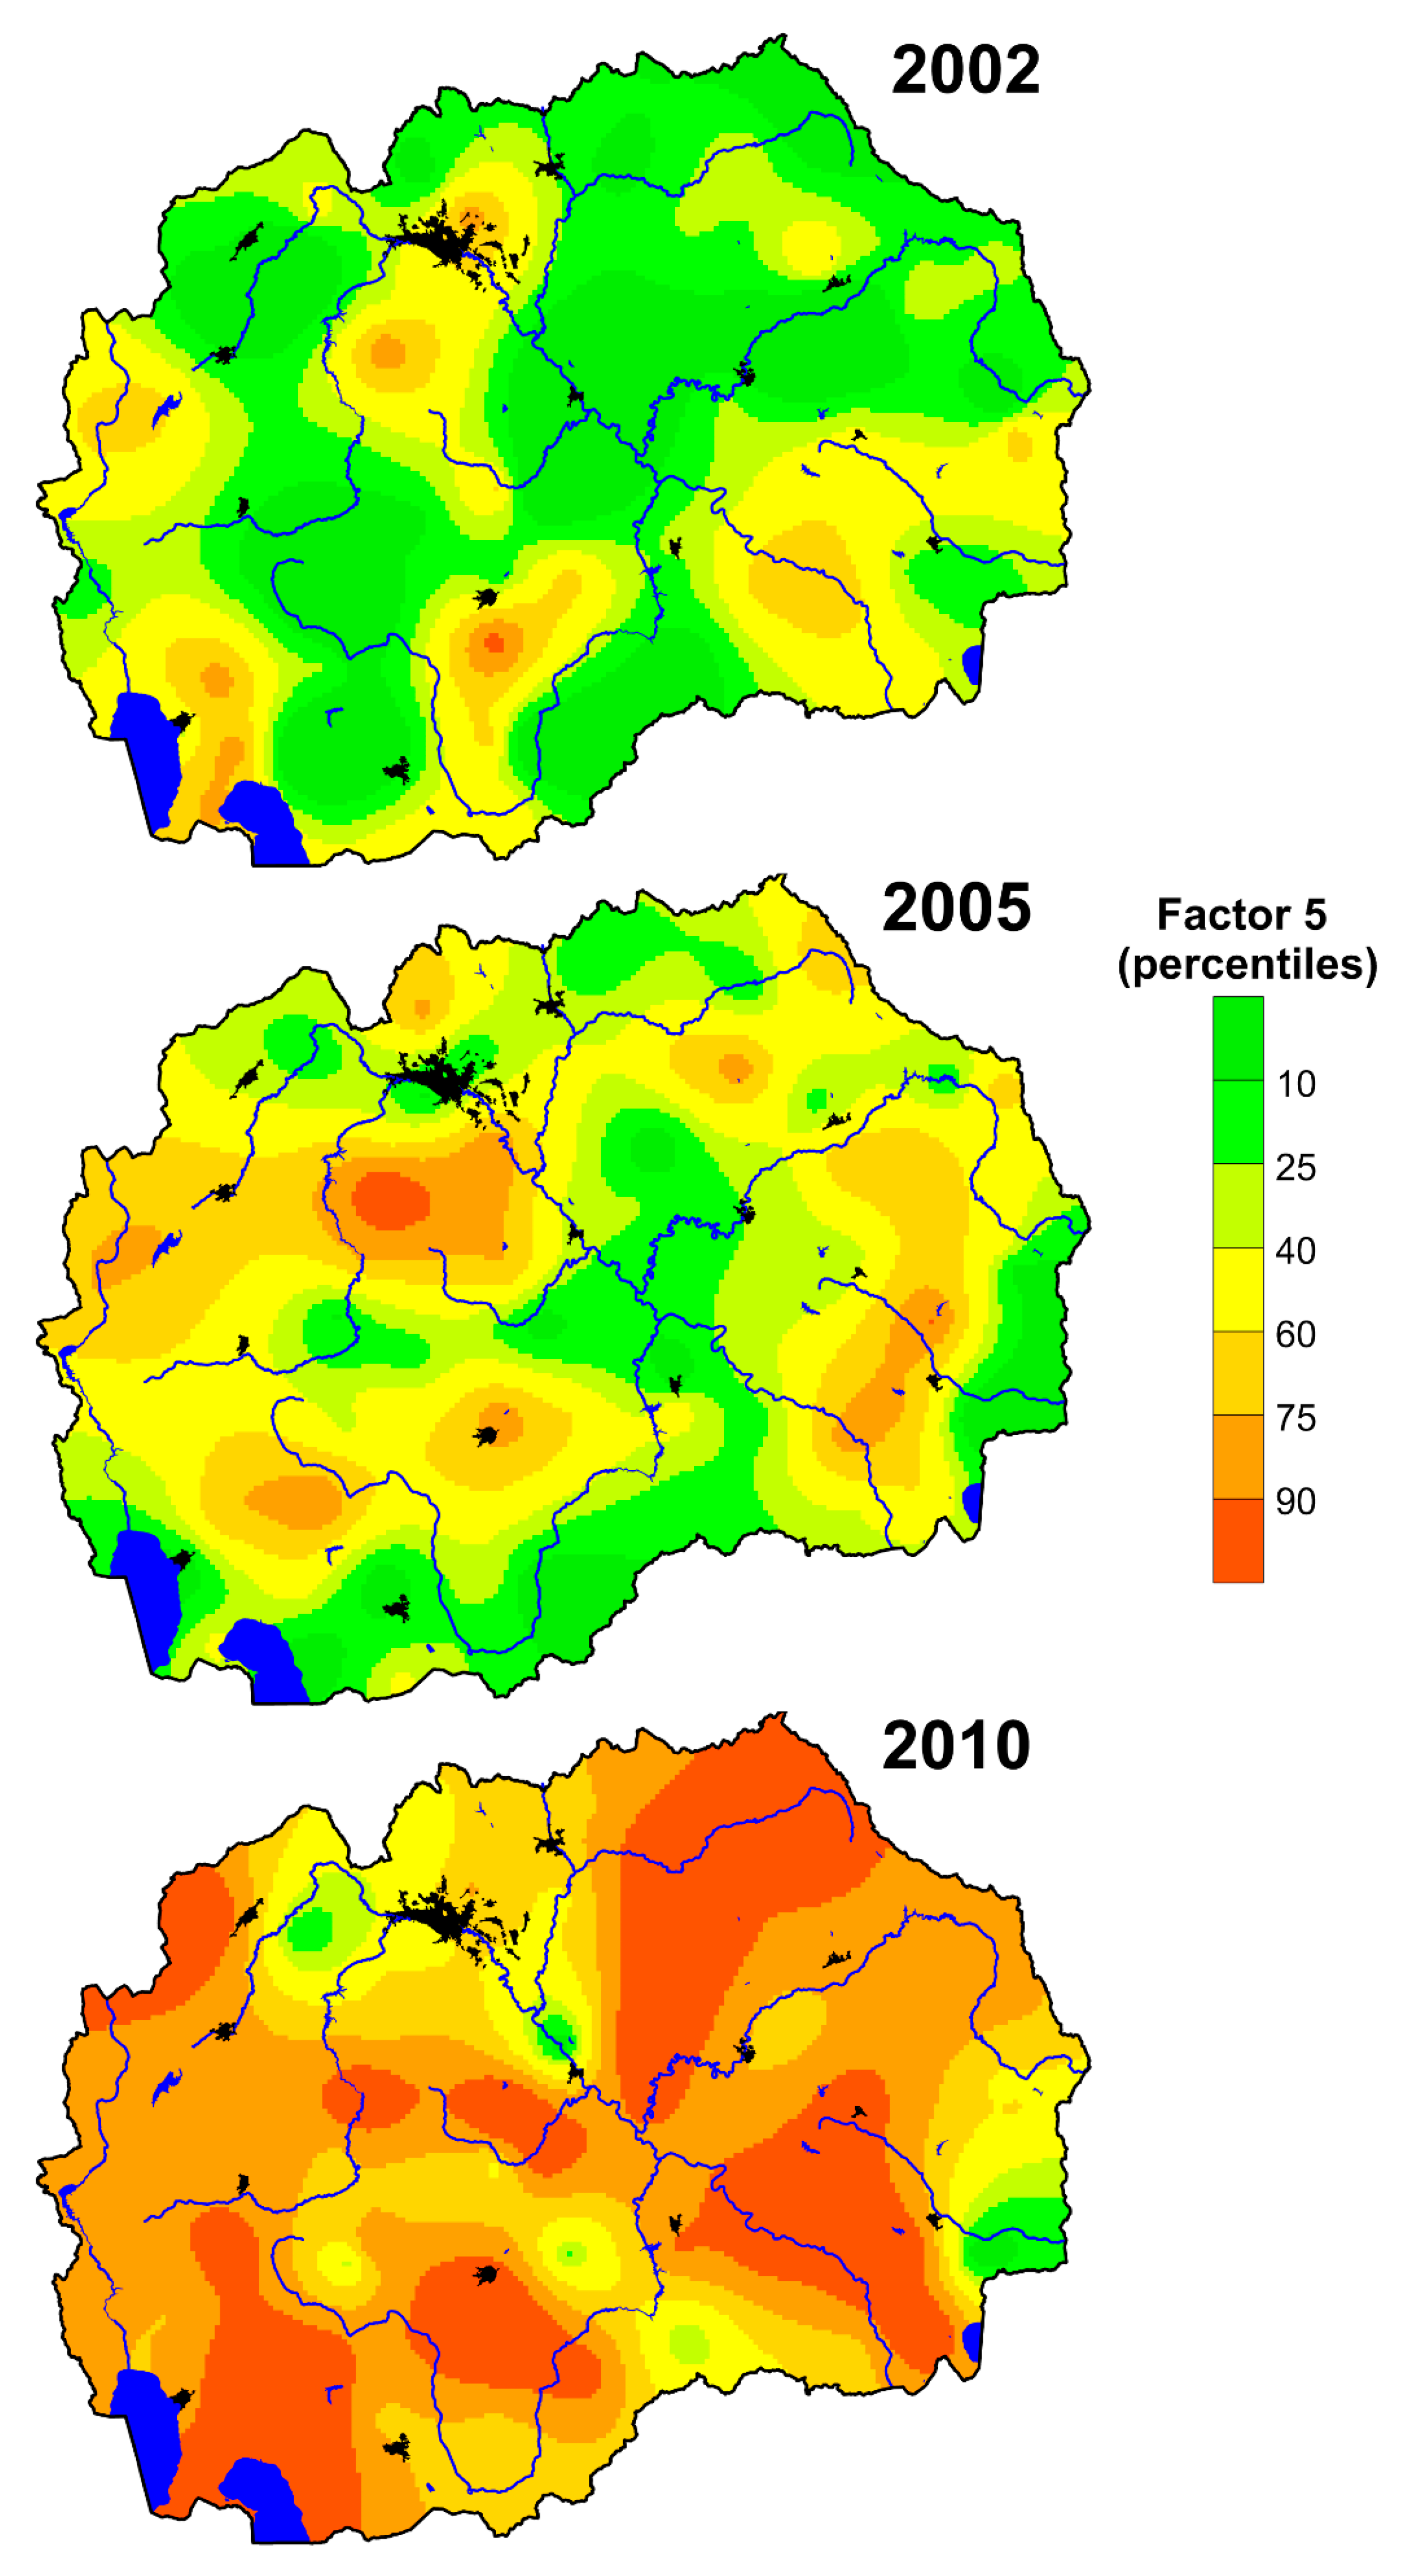
The obtained factors were also compared according to the sampling campaigns (2002/2005/2010) (Figure 5). The largest changes were observed in Factor 1 and Factor 5. Factor 1 falls sharply according to the sampling campaign; the opposite trend is observed at Factor 5. Both factors illustrate the geogenic association of chemical elements, which is related to the climatic variables. Factor 3 follows a concave pattern with the highest values obtained in 2005, which coincides with the reactivation of the ferronickel smelter in Kavadarci in 2004. Factor 2 slightly declined, which can be related to the closure of Pb-Zn mine in Veles in 2003. The geogenic association Factor 4 shows almost no changes, which means there were no significant natural changes.
The matrix of factor loadings is shown in Table 3. Combined, the five factors explain 81.8% of the variability of the threatening elements. Factor 1 (F1) represents the strongest factor, with 47.3% of the total variability. This group of elements represents the geogenic group of elements. Factor 2 (F2) is the second strongest factor, with 10.4% of the total variability. This factor is associated with elements Pb, Zn, and Cd and represents the anthropogenic elements. The third factor (F3) explains 8.6% of total variability and includes elements of Cr and Ni, whose distribution can be natural or anthropogenic. Factor (F4) represents 8.5% of total variability and includes elements that show natural distribution. Factor 5 (F5) explains 7% of total variability and includes Br and I.
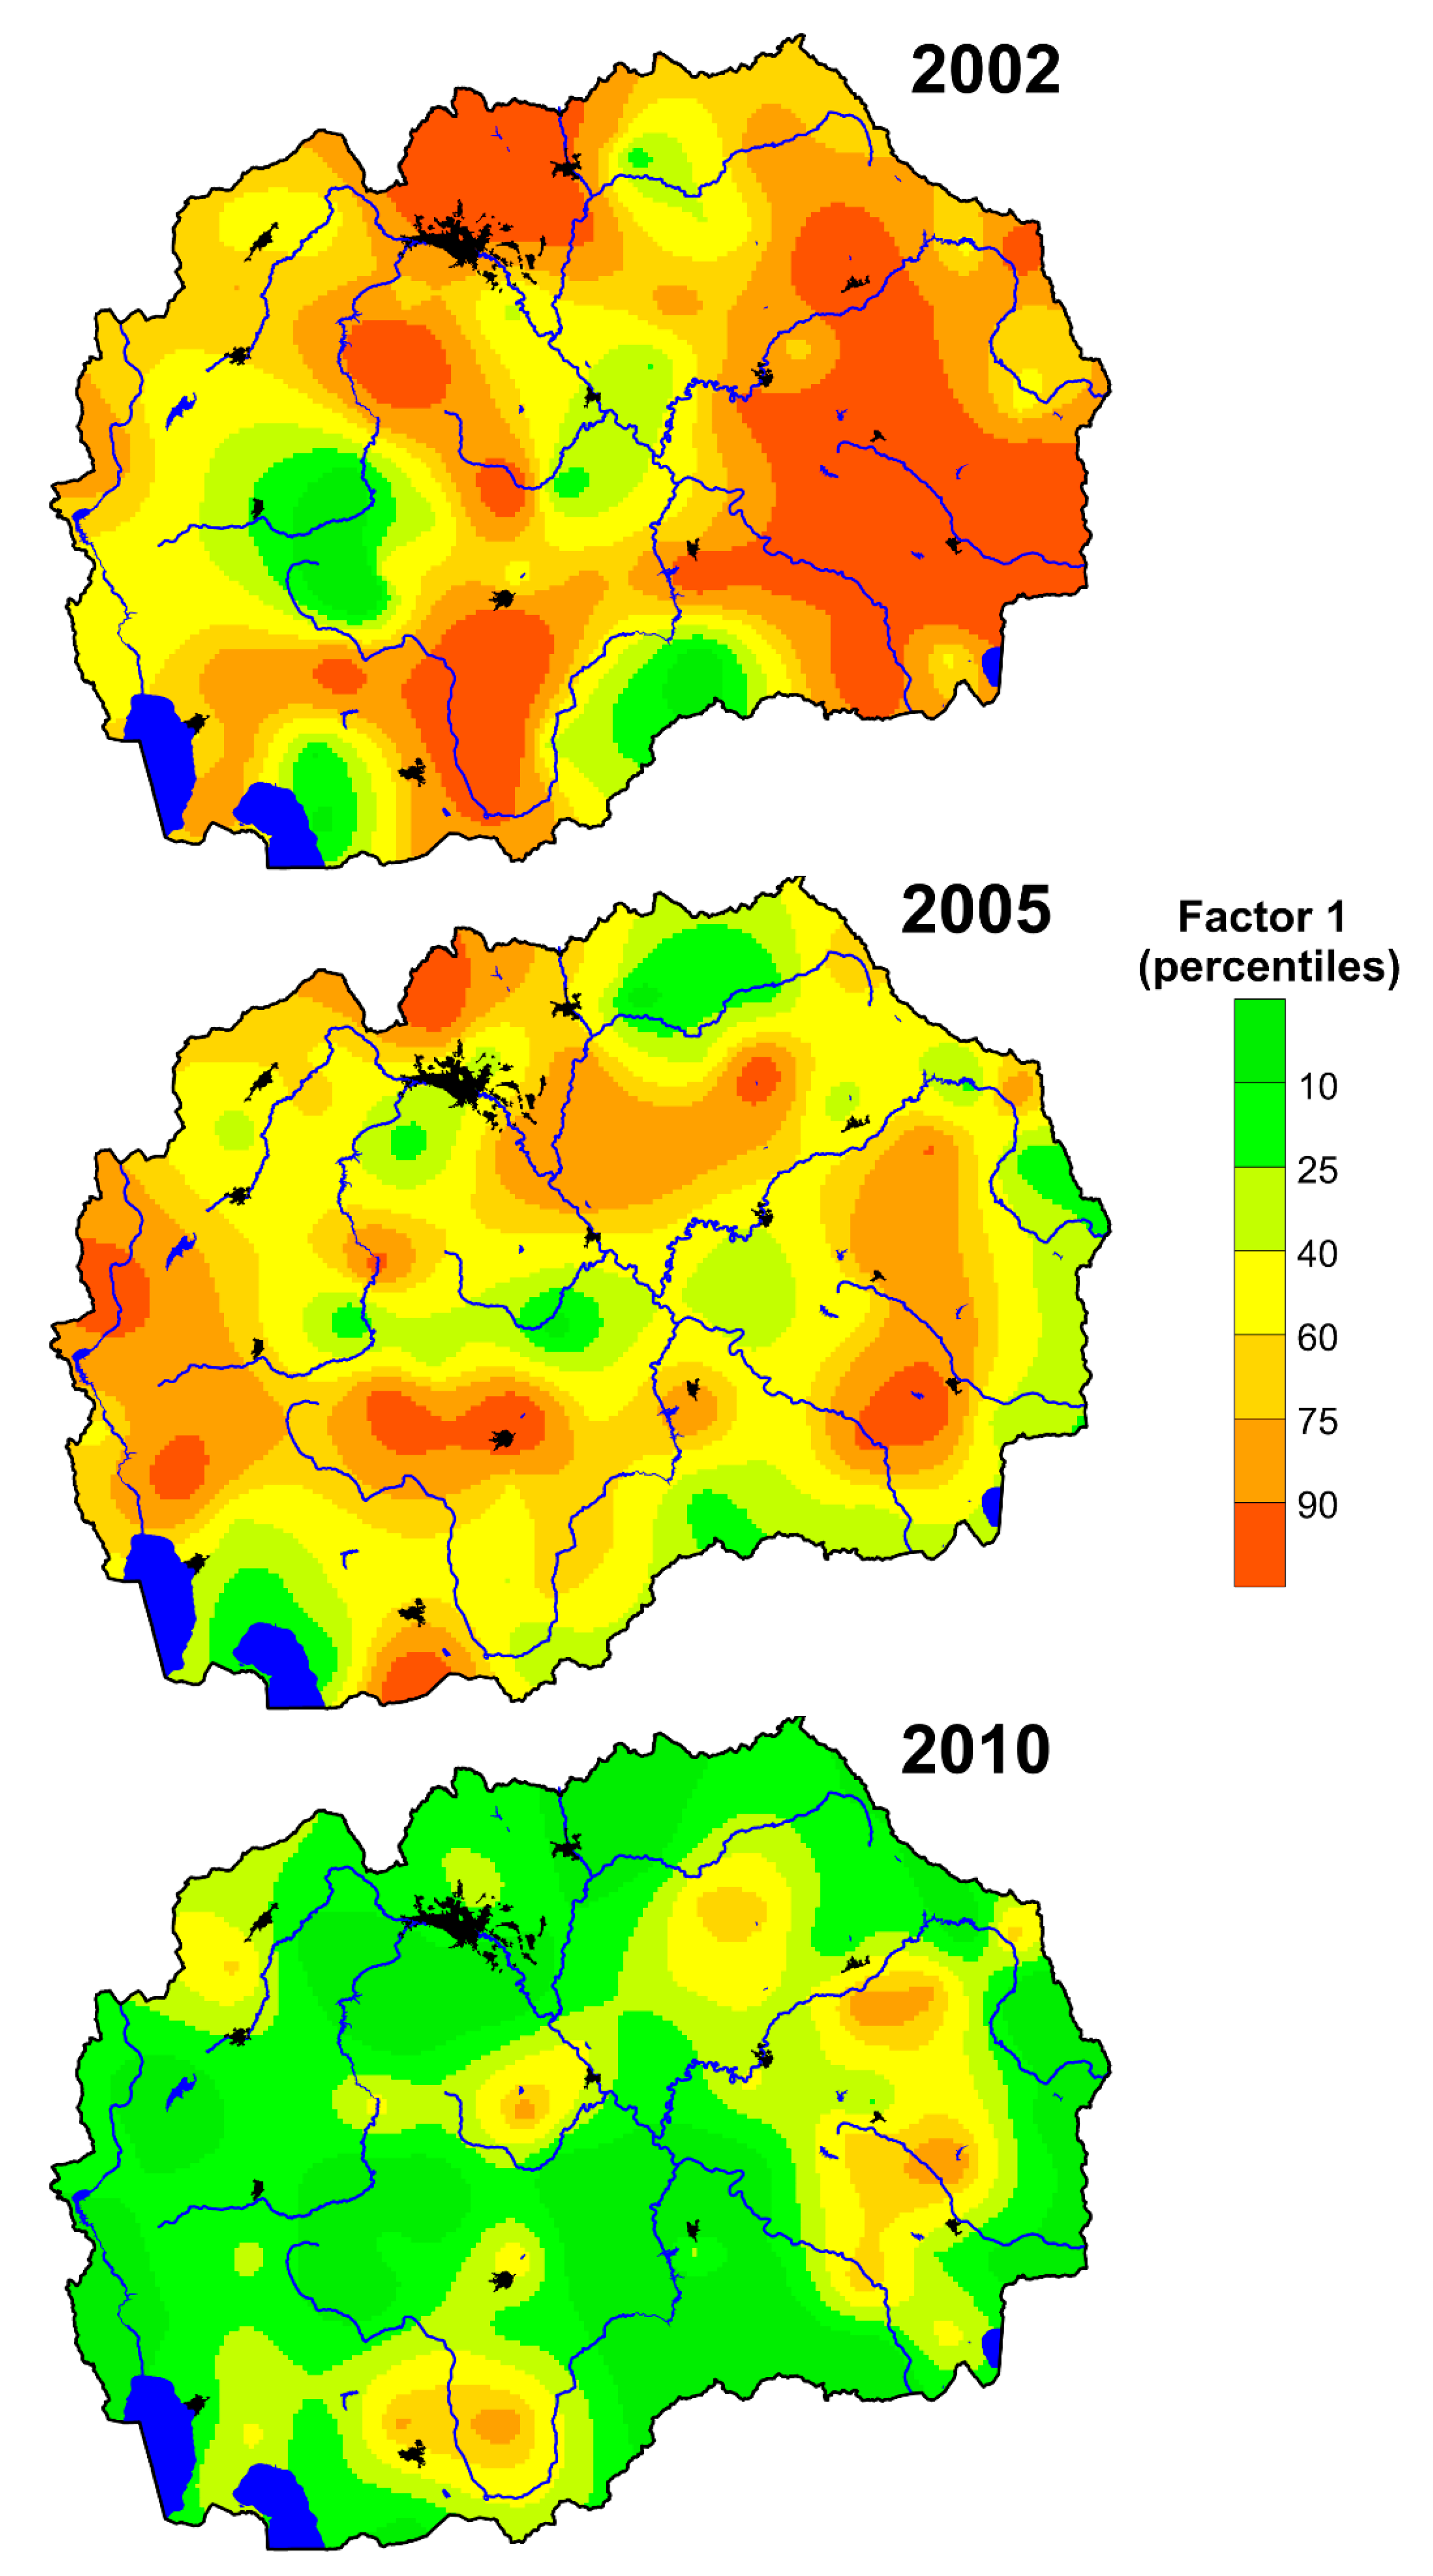
Association of Al, As, Co, Cs, Fe, Hf, Na, Rb, Sc, Ta, Th, Ti, U, V, Zr, and RE (Factor 1) represents the typical crustal components that are significantly influenced by the mineral particles that are carried into the atmosphere and later trapped in the moss samples by the wind. Generally, the highest content of these elements was detected in samples collected in the vicinity of Precambrian and Paleozoic shales. Shales decomposed under the influence of various weather conditions, and the minerals of these elements are released into the environment. The annual precipitation is the lowest in the regions of Tikveš, Štip, and Ovče Pole, which leads to erosion of decomposed shales by wind and significantly affects the spread of mineral particles [6]. In other words, the distribution of elements from these groups is independent of urban and industrial areas, but depended on the geological background. The median values of some of these elements have changed over the sampling campaign (Table 1), mostly decreasing, which can also be seen from the spatial distribution of Factor 1 (Figure 5 and Figure 6).
This can be supported by the presence of Al in this group. Aluminum compounds are insoluble in water, and the total content of Al in various biological systems originates from dust pollution [79]. Similarly, the presence of iron in the samples originated from dust particles. The highest content of Fe was found in samples collected from the central part of the country, in an area with the smallest annual precipitation and low vegetation, where the land is susceptible to various erosion factors. For the same reasons, the influence of the steel smelter in Skopje on the content of these elements in the samples was not to be observed.
There was a declining trend in the content of elements grouped into Factor 1, according to the sampling campaign (Figure 5). In 2002, the highest concentrations of the Factor 1 elements were found in moss samples, collected in the regions of Bitola, Strumica, Radoviš, and Skopje. The high values of these elements (especially uranium) in the samples collected in the Serbo-Macedonian massif and the Pelagonia massif (Figure 6) can be explained by the existence of uranium ore deposits in these regions [44,59]. The second peak of these elements (mostly related to U and Th) was detected in the samples taken in the southwestern part of the country near Bitola, which can be related to fly ash emissions from a thermoelectric power plant in Bitola, where lignite was used as fuel. It is also related to transboundary pollution from several thermoelectric power plants in northern Greece [2]. The uranium-rich granite deposits in the Strumica region can also affect the presence of high values of uranium [44,59]. During the exploitation of these granites, uranium-reach dust particles may be released into the environment in considerable amounts, trapped by the moss [2].
The high representation of these elements, especially Al, Sc, Ti, V in the vicinity of Radoviš, can be related to the activities of the copper mine and flotation plant Bučim [27,28,37,80]. High values of these elements (Sb, Fe, and Co) near Tetovo and Kavadraci are related to the previously active ferrochrome smelter in Tetovo and current activity near Kavadarci (ferronickel smelter) [2,79,81].
In 2005, the anomalies were no longer so clear. The anomaly can be seen along the Radika River in Western Macedonia where Neogene clastic sediments predominate [44]. Higher contents of elements from that group were also found in the vicinity of Galičica, due to the Mesozoic carbonate rocks that occur in these areas. Furthermore, areas with high contents of the element group in Factor 1 were found in the area south of Skopje, and in the vicinity of Prilep both areas with Proterozoic metamorphic rocks from the Pelagonian massif [8]. The median values are mostly lower than the median values of the same elements measured in 2002.
The median values for these elements were lowest in 2010 (Figure 5). According to the State statistical office in 2011 and 2013, the precipitation in eight regions in Macedonia was greater in 2010 than in 2005. However, the central part of the country is characterized by low plant cover and the lowest amount of precipitation, which means these areas are most exposed to erosion, and suspension of soil material [22].
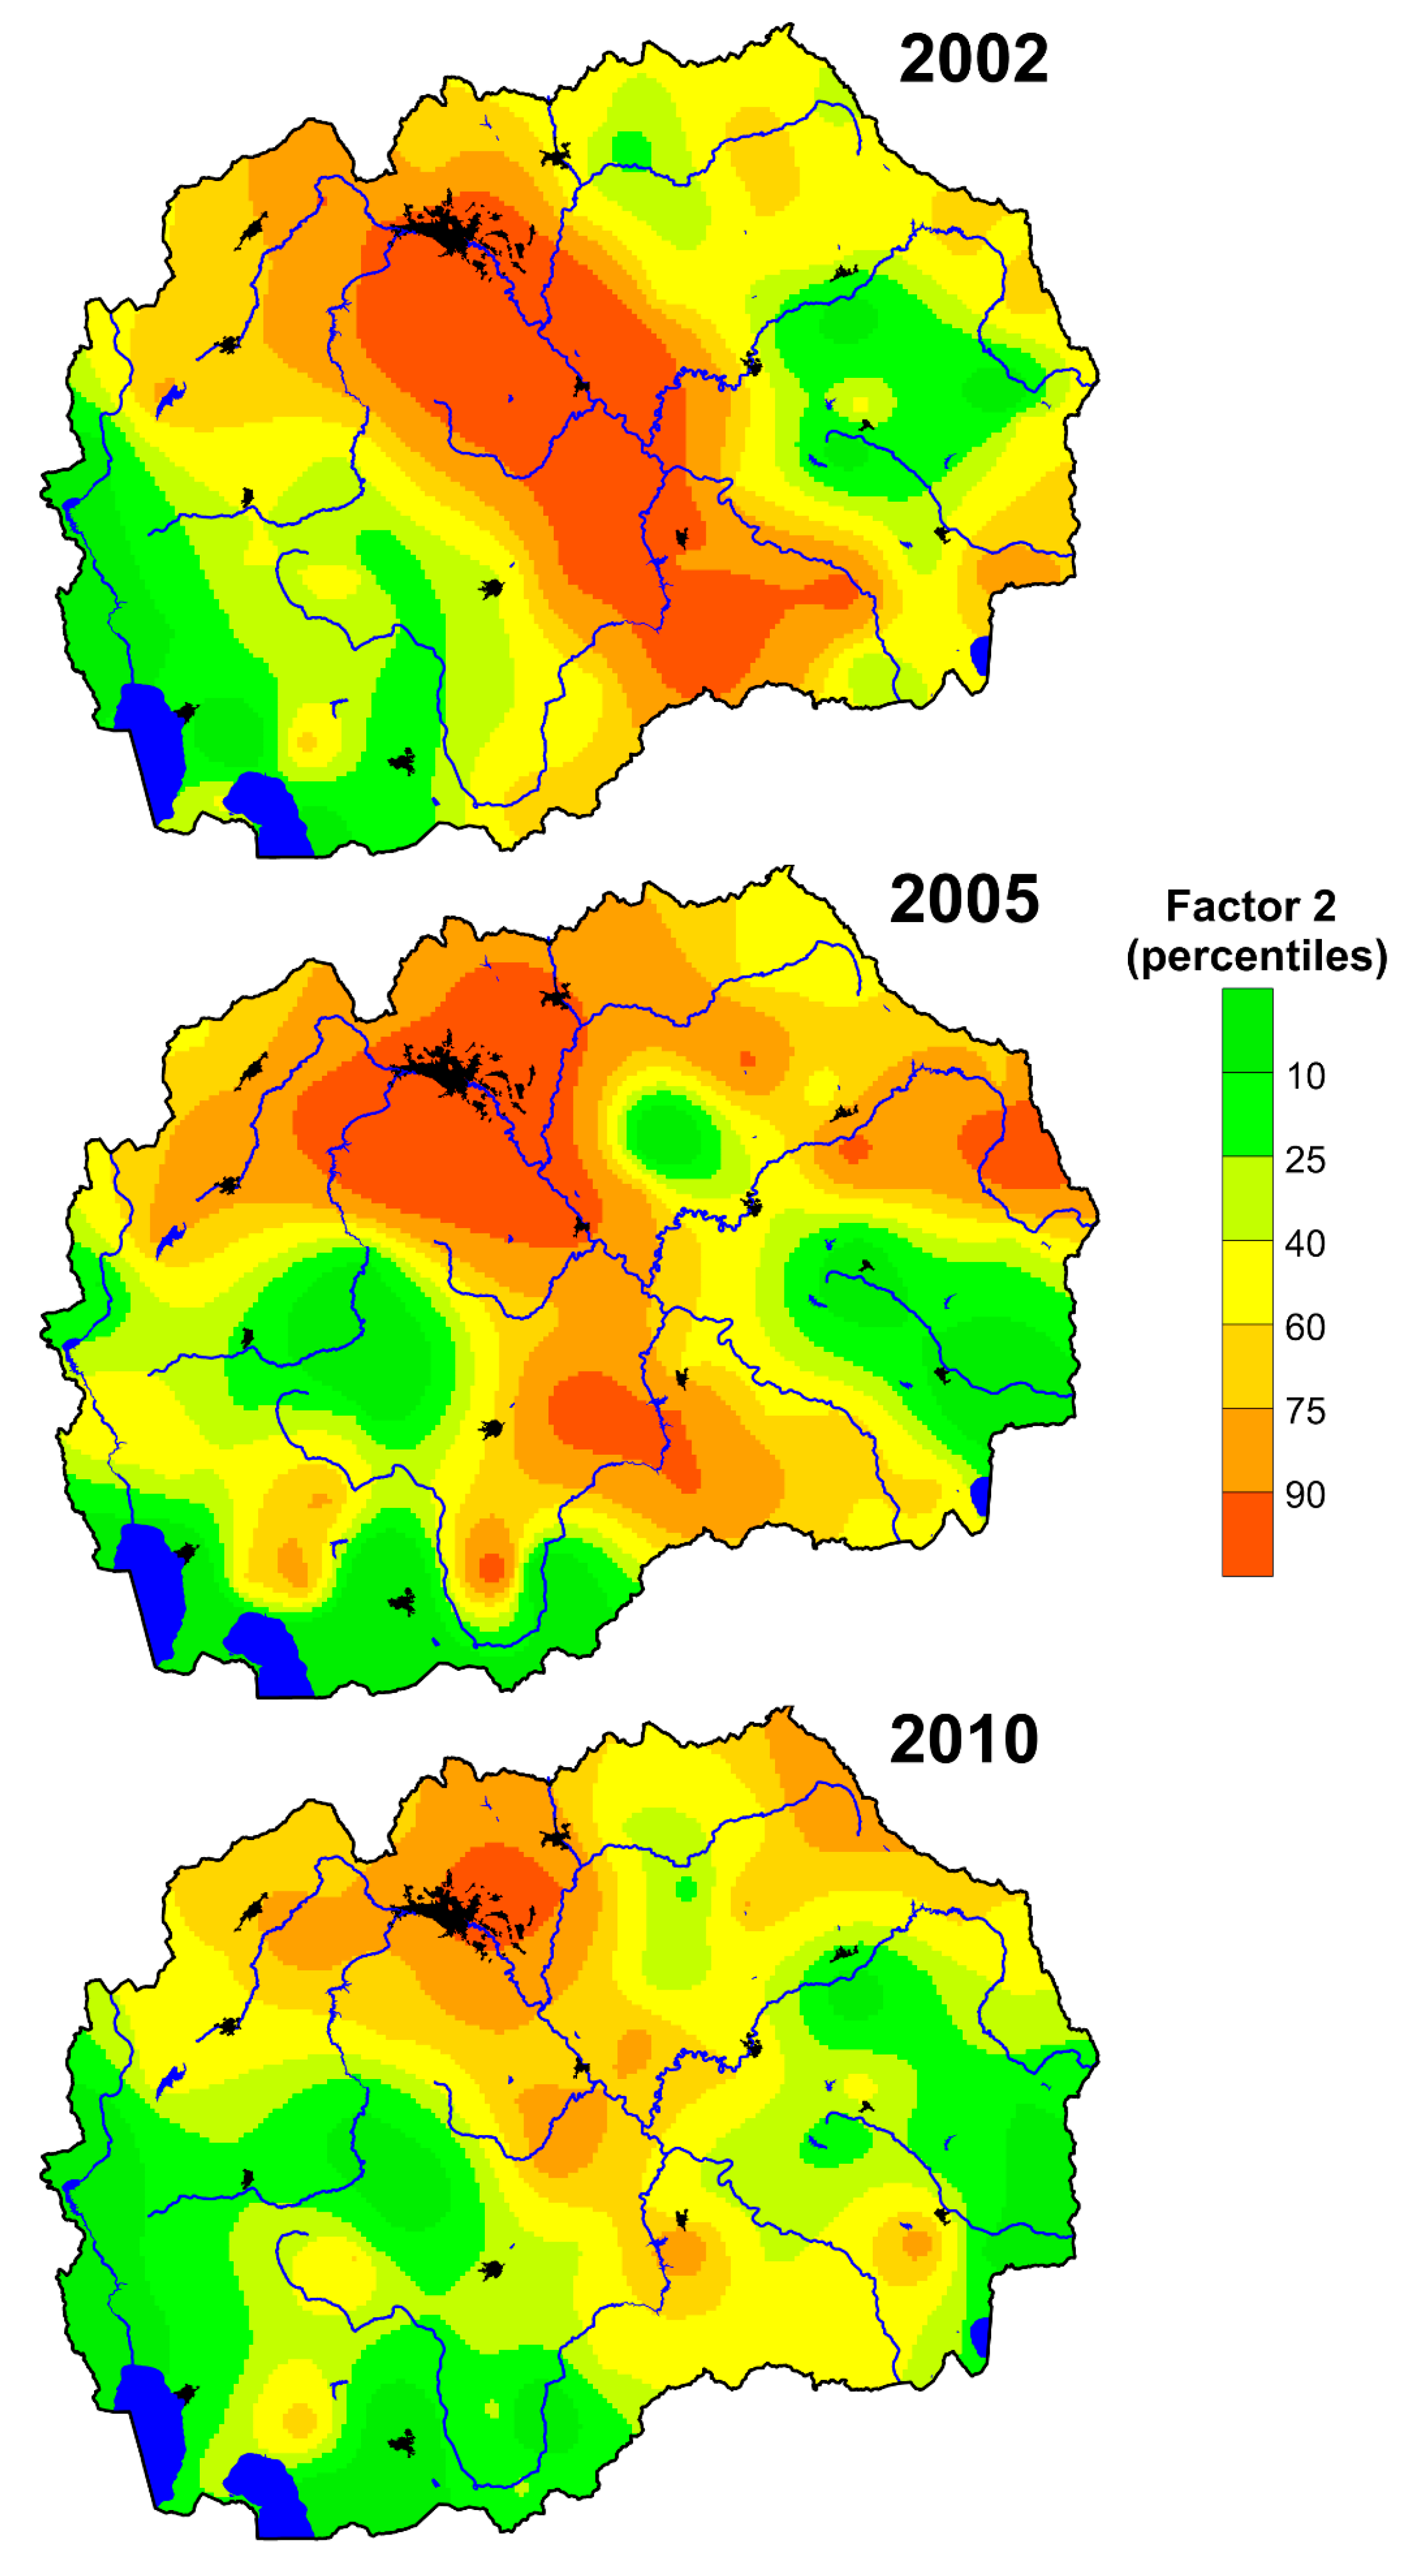
The spatial distribution of Factor 2 (Cd-Pb-Sb-Zn) was not influenced by lithological background and is mainly connected with a lead-zinc smelter (Figure 7). Factor 2 was directly related to the dust from the flotation tailings at the mines and from the soils that are spread into the atmosphere by the winds, leading to the atmospheric distribution of these elements [3,39,41,42,43]. Air pollution decreased over the years, even though the drop in the content of elements in Factor 2 was not as clear as in Factor 1 (Figure 5). In 2002, the enrichment with these elements can be seen along the Vardar River valley, which extends from Skopje to Veles and continues southeastward toward Greece. Due to the frequent flow of air masses in both directions in summer and winter, there was an accelerated diversification of emissions from industry. In 2002, the pollution was mostly connected with the lead and zinc smelter plant in Veles–which had operated until 2003 and with the steel-work smelter in Skopje [2].
In 2005, the ER of the elements from Factor 2 is still connected with pollution by the lead and zinc smelter plant in Veles despite its closure in 2003. The high values in 2005 for these elements are also partly associated with the steel-work smelter in Skopje [32]. Leaded gasoline, which was widely used during that period, could also be a possible source of lead in the surface-atmosphere of Macedonia [32]. In contrast with the moss survey in 2002, enrichment with these elements in 2005 was also observed in the area of Bitola in the eastern part of the country. According to the previous study, the Neogene vulcanites were characterized by the natural enrichment of Cd in the region of Berovo-Vladimirovo [42].
In 2010, due to the reactivation of Pb-Zn mines (Sasa, Toranica, Zletovo), the enrichment of Cd and Zn were observed in the eastern part of Macedonia. In the period of 2001/2002 until 2006/2007, the mines were not active, but they were reactivated in 2006 (Sasa) and 2007 (Toranica, Zletovo). In the area of the mines, there were millions of tons of waste material, which can be dispersed into the biosphere by the wind [41,42,43,82]. Furthermore, the enrichment in 2010 was also observed in the area of the steel-work smelter in Skopje. In the surveys from 2010, the contents of Cd and Pb decreased because of the reduced use of leaded gasoline for cars [8].
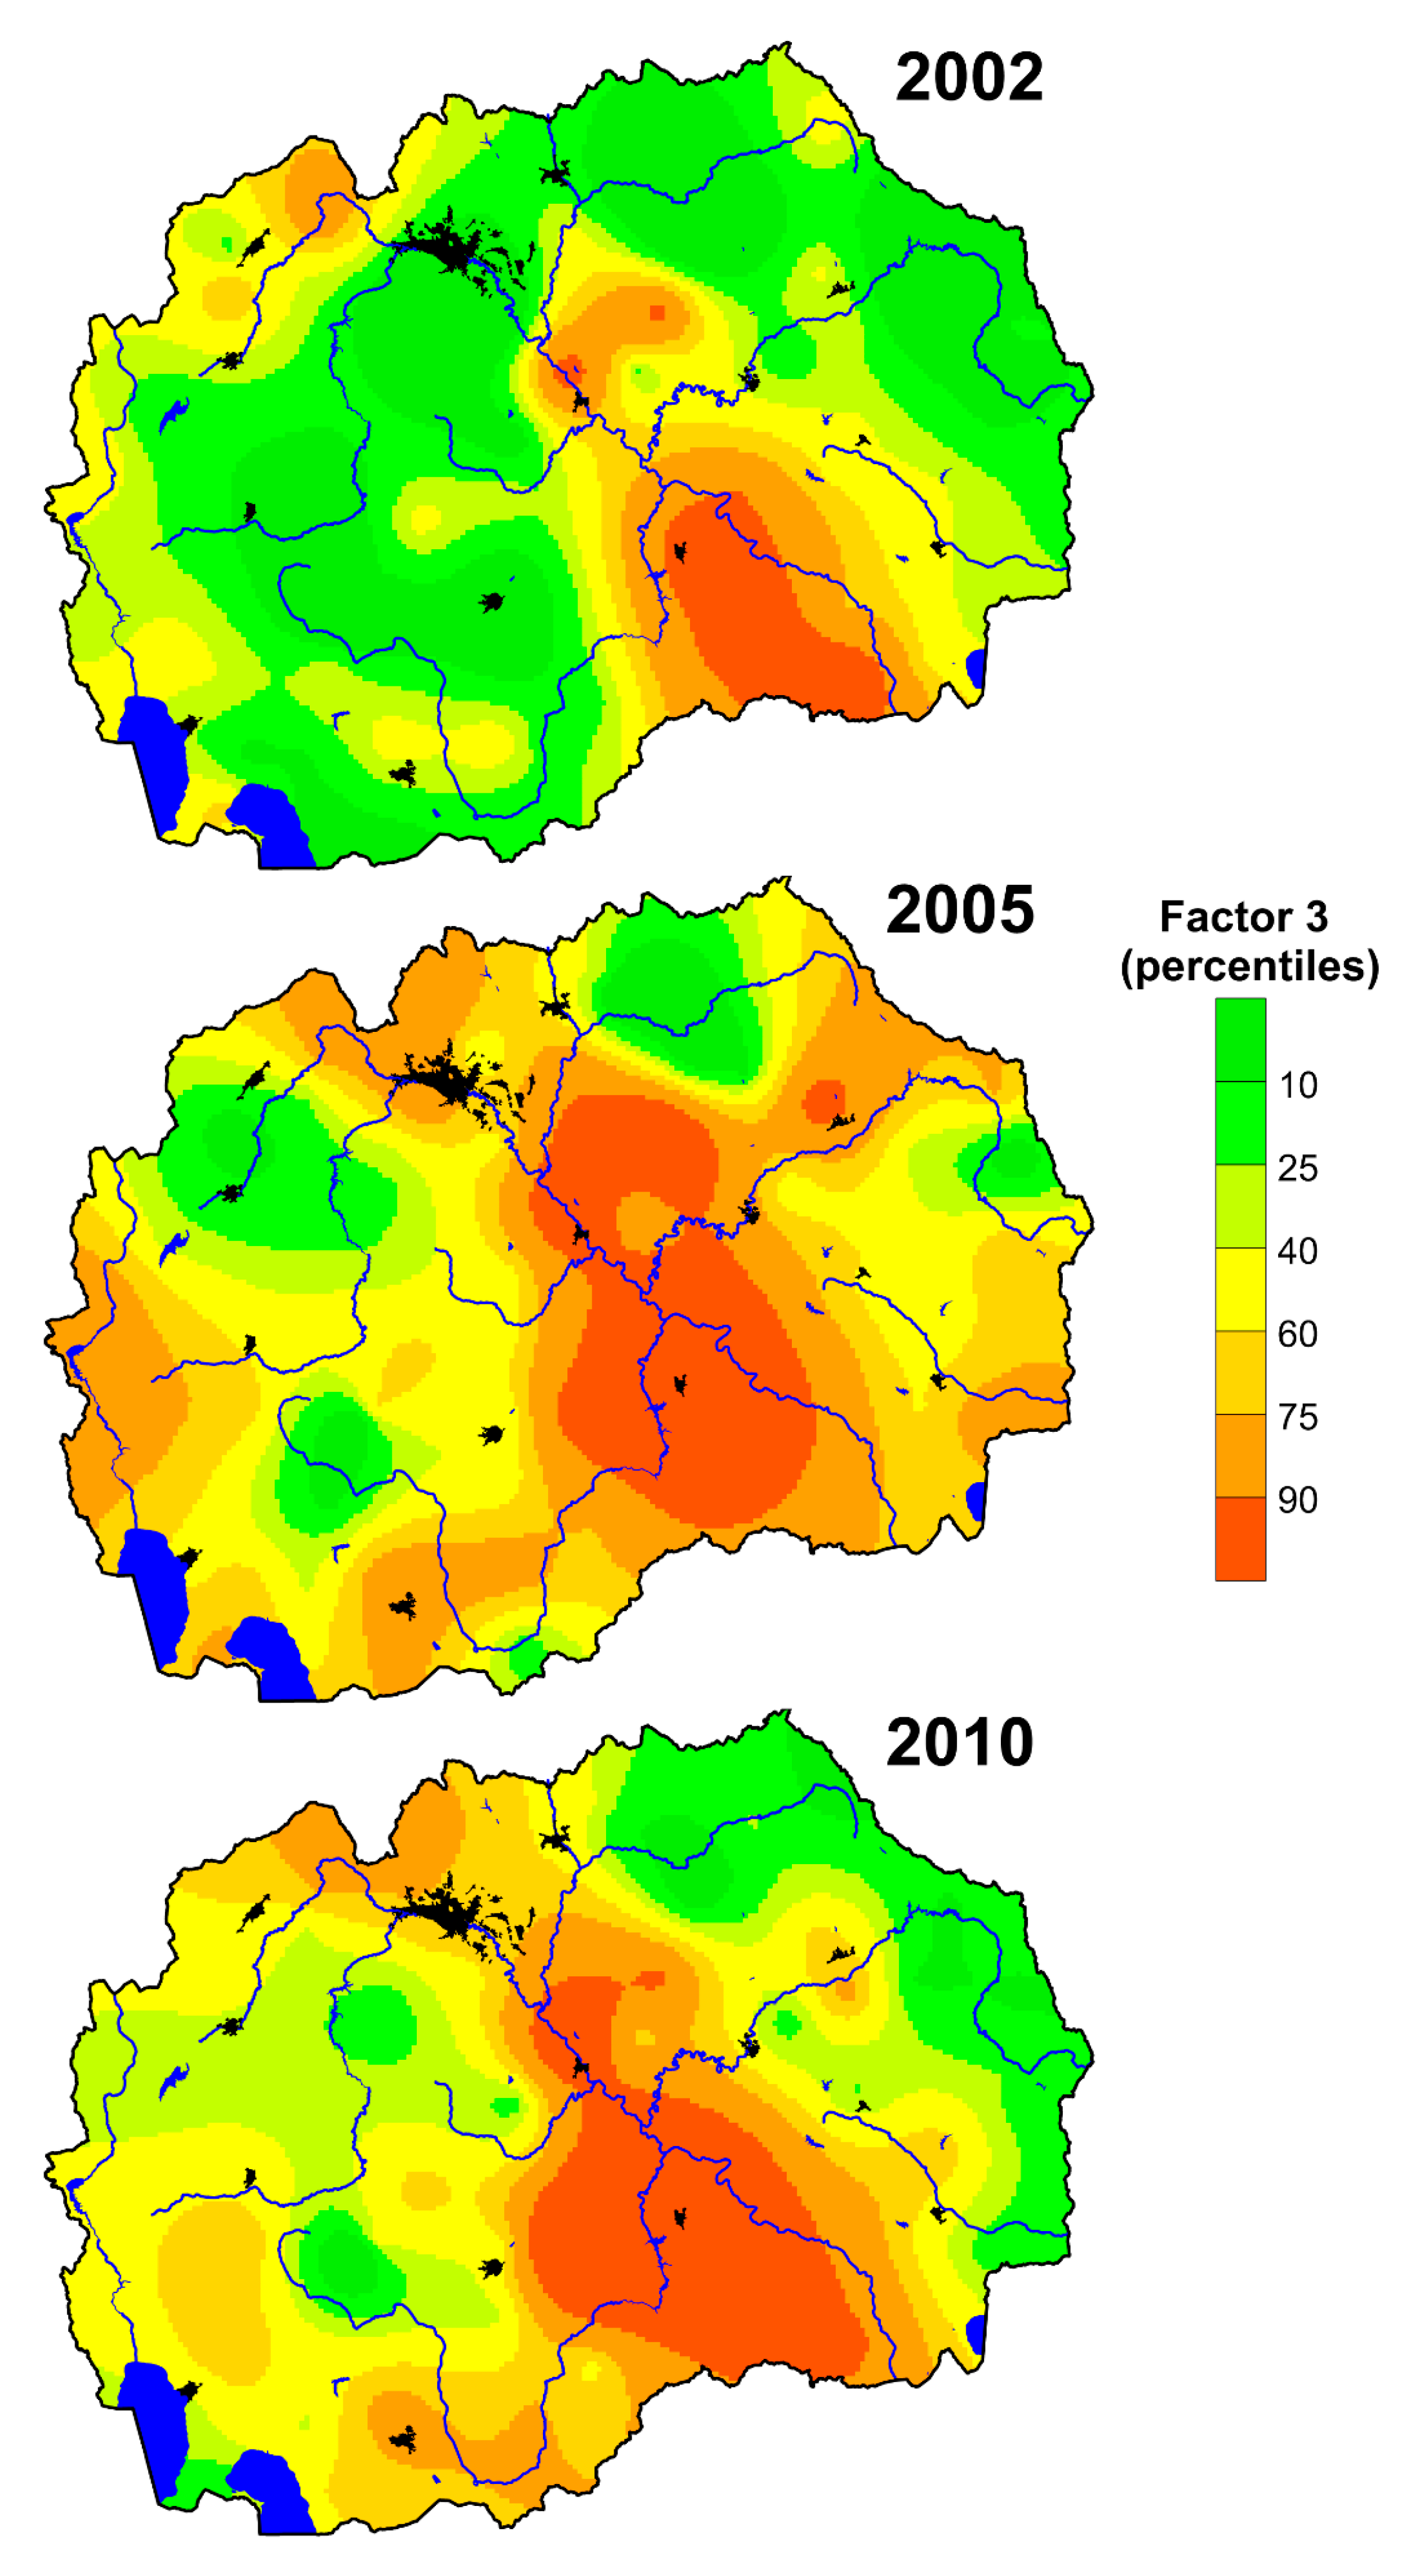
Factor 3 (Ni, Cr) contains elements that are usually associated with air pollution, but also influenced by a natural factor, such as the lithological background (Figure 8). The enrichment of nickel is geogenic, reaching the locality of Groot near the town of Vales in the central part of the country. This location also has Paleogene flysch sediments and Neogene sediments, whose particles can be spread by the wind along the valleys of the Vardar River and Crna River [53]. Similar findings have also been made in previous studies in Macedonia [25,30,81]. The main anthropogenic source of these elements is related to the Kavadarci region and includes the ferronickel smelter, the slag dump, and the open pit nickel mine [25,30,31,82]. Generally, the high chromium content belongs to the region near Tetovo, an area of a previous ferrochromium smelter and a slag deposit near the high-melting ferrochromium plant [2].
There were fluctuations in the contents of Ni and Cr, according to the sampling campaign (Figure 5). The lowest contents were observed in 2002; the highest was in 2005. In samples from moss surveys in 2002, the element contents from the association Factor 3 were related to the geogenic distribution associated with Paleogene flysch sediments and Neogene sediments. The high content was also be observed in the area of Tetovo and Kavadarci, which were associated with a previous ferrochrome smelter and the abandoned ferronickel smelter, respectively. Values for Ni in 2005 were much higher than the values for 2002, which was related to reactivation and increasing production capacity of the ferronickel smelter near Kavadarci in 2004 [30,33,80]. Since 2005, the factory has increased its ore processing capacity, as it also extracts material from Albania, Turkey, and Indonesia [34]. However, the contents of Ni and Cr in the mosses collected in 2010 slightly decreased, which can be linked to a renewed decline in the production capacity at the smelter.
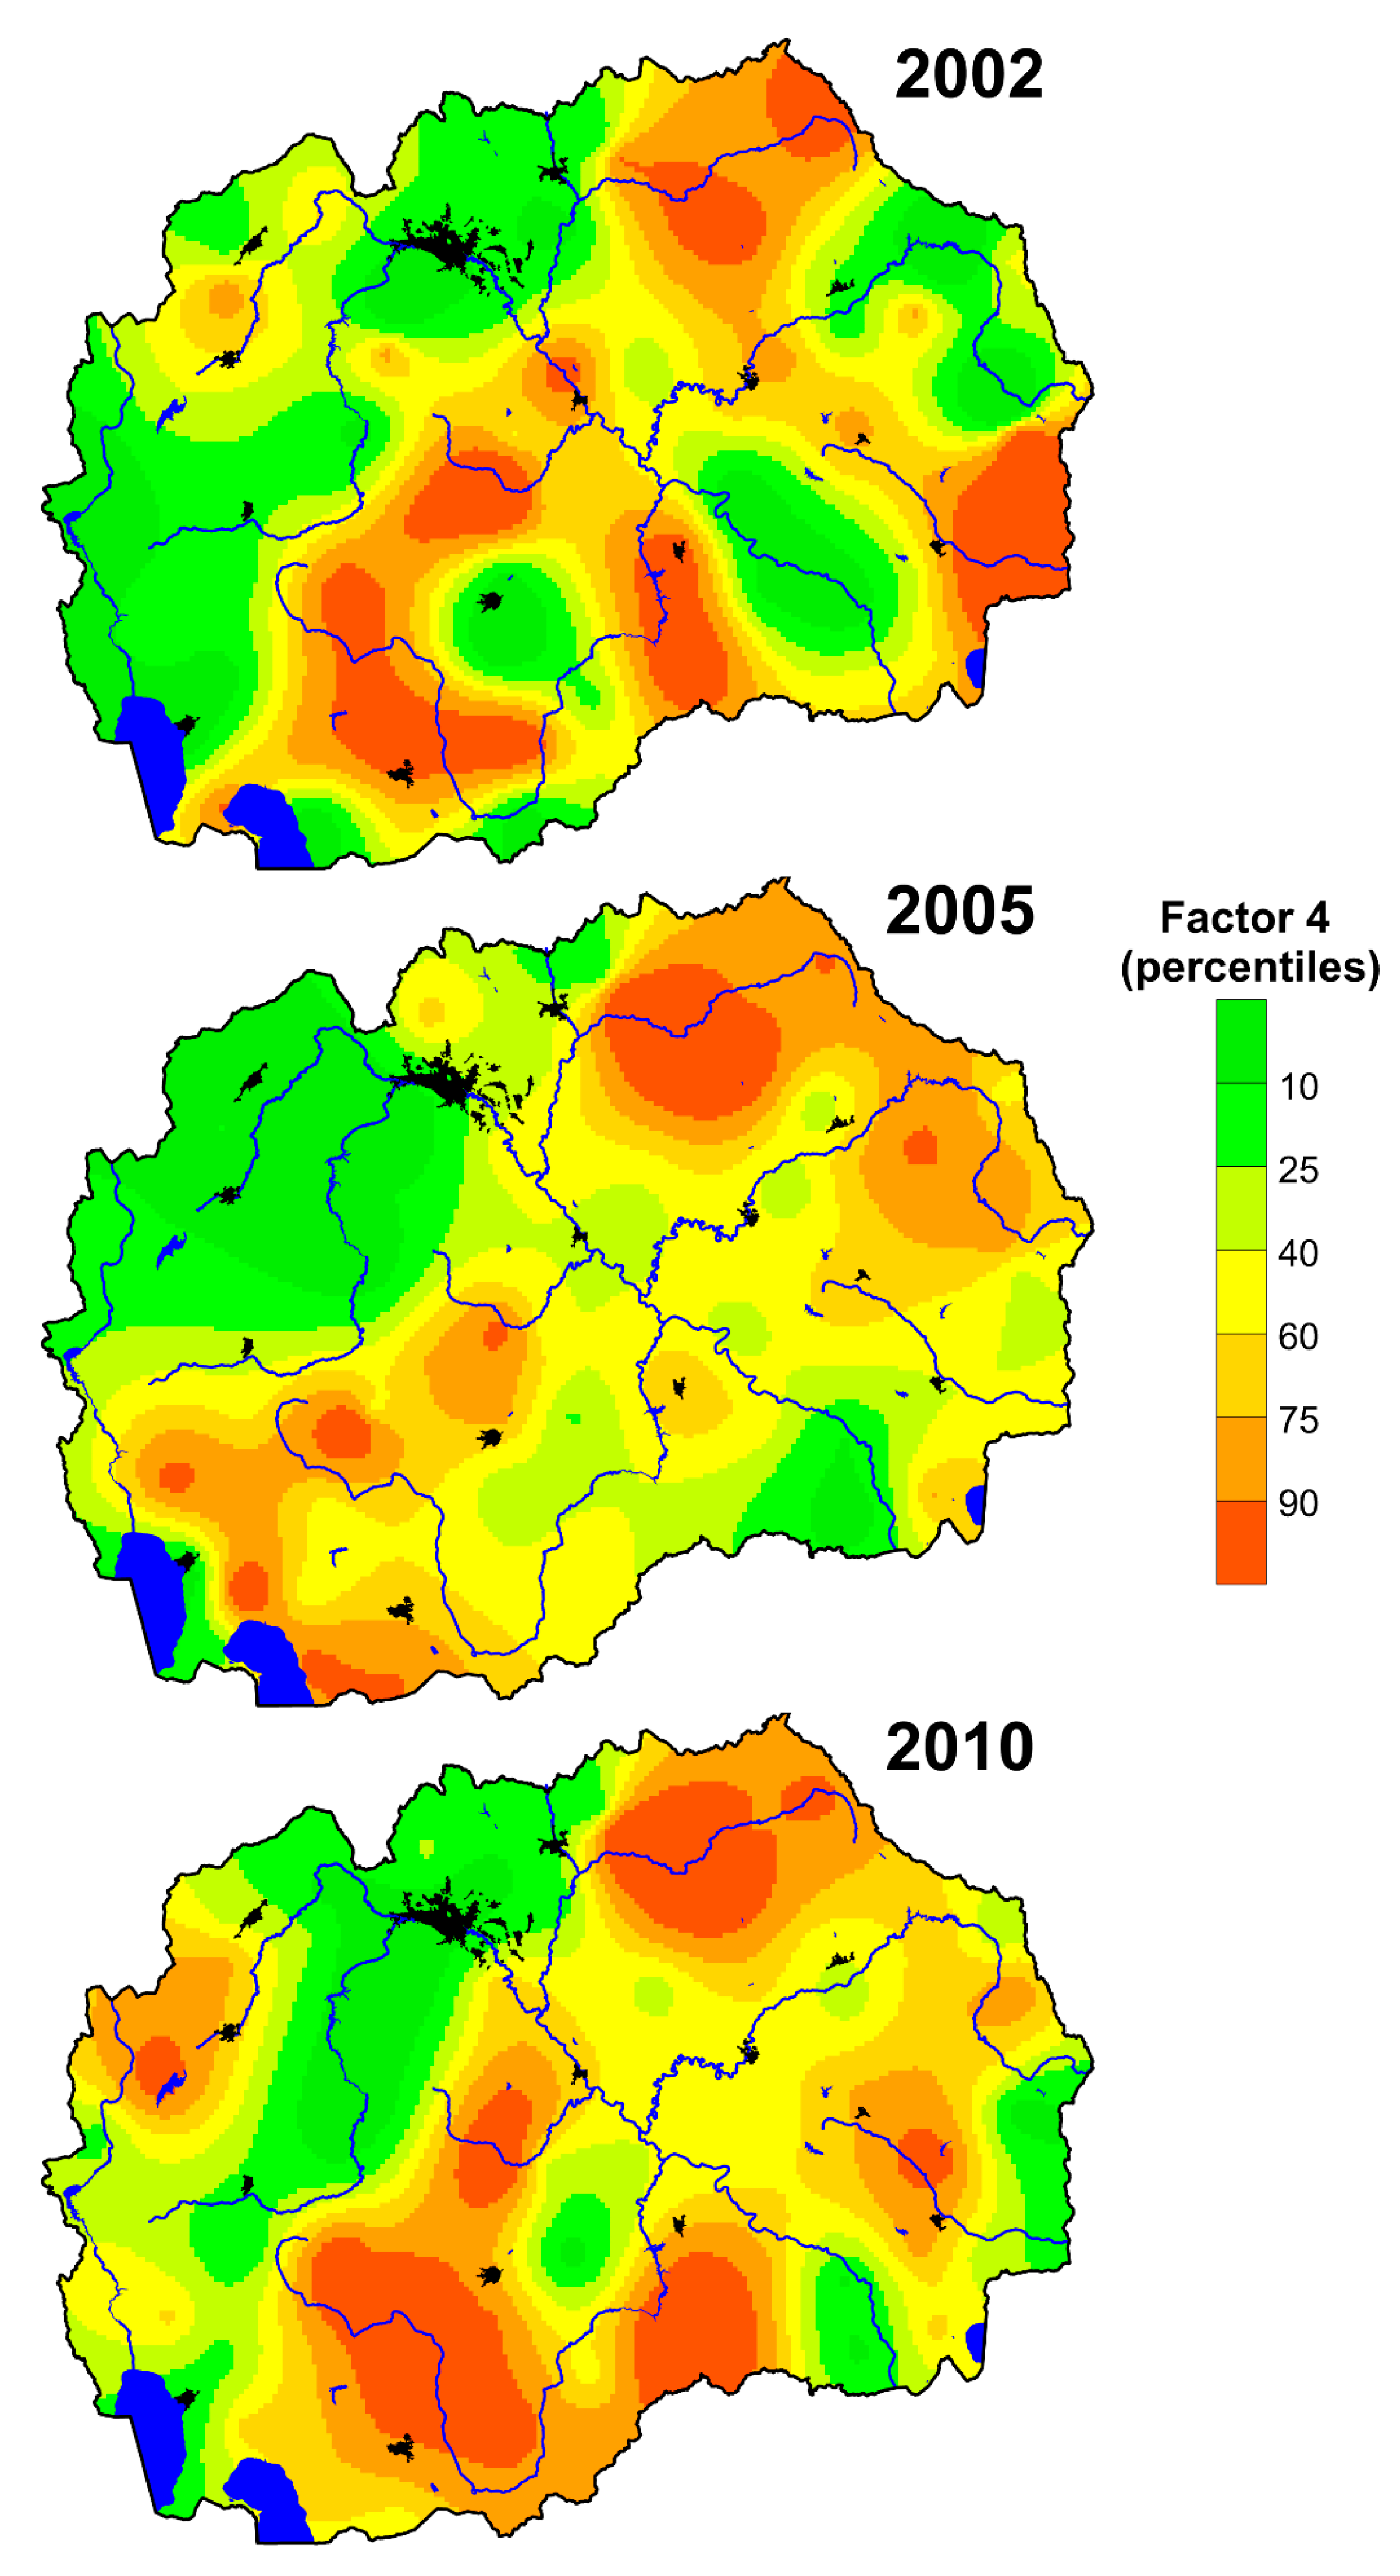
Factor 4 (Ba, K, Sr) is the association of elements that are naturally distributed and whose distribution is not related to industrial and urban activities (Figure 9). The contents of these elements are practically unaltered. The elements are enriched in areas of felsic volcanic rocks (andesite) and their pyroclastic rocks. The contents of these elements slightly increased according to the sampling campaign. In 2002 the enrichment was observed in Kratovo, Ovče Pole, and Kavadarci, where Neogene (Ng) magmatic rock and Paleogene cluster dominates. Another maximum was linked to the southern Macedonia (Kožuf and Mariovo regions) and Strumica area where rocks of Quaternary (Q) sediments dominated. In 2005, the highest values of these elements were found in the area of Kratovo (rocks of Neogene volcanism) [44]; in 2010, the spatial distribution was similar to the distribution from 2002.
Factor 5 (Br, I) includes elements primarily affected by marine influence [74]. Along the Vardar River valley during the winter period, the Jugo wind blows from the northern parts of Africa across the Mediterranean and the Aegean Sea. Consequently, an exponential decrease of Br and I with the distance from the coastline was observed. This phenomenon has already been studied in Norway, where high contents of halogens were observed in soils and mosses corresponding to an exponential decline with distance from the coastline [74,83]. The limestone and dolomite (Paleozoic and Mesozoic carbonates) present in the western part of Macedonia are enriched in iodine, which also explains the elevated values of these elements in the mosses [32]. In 2010, the contents of Br and I were the highest, which means that the wind was stronger in 2010 (Figure 10).

4. Conclusions

The moss analysis is a valuable method for monitoring atmospheric deposition of trace elements in Macedonia mainly because it provides a cheap, effective alternative to deposition analysis for identification of areas at risk from high atmospheric deposition fluxes of heavy metals and can play an important role in identifying spatial and temporal trends in atmospheric heavy metal pollution across the country. In this contribution, the results of three air pollution moss surveys of heavy metals are presented and compared. The first systematic study of heavy metals atmospheric pollution using the moss technique was concluded in 2002 [1,2]. This study was followed by two more samplings in 2005 [32] and 2010 [6,22], collecting moss samples from the same locations. In this study, the results of chemical analyses obtained from the aforementioned studies were statistically processed using bivariate and multivariate statistical techniques. By the comparison of all three moss surveys, it can be concluded that some of the potentially toxic elements (Cd, Co, Ni, Pb, Ti, Zn) have increased in content in moss samples from 2002 to 2005, but decreased in 2010. Increased values were also observed for Br in 2005 compared to 2010, and for I in 2005 and 2010 compared to 2002.
The largest anthropogenic impact of air pollution with heavy metals was found in the vicinity of the ferronickel smelter near Kavadarci (Ni and Cr), the abandoned lead-zinc smelter near Vales, and the lead and zinc mines in the vicinity of Macedonska Kamenica, Probištip, and Kriva Palanka (Cd, Pb, and Zn). According to factor analysis, three geogenic associations following the lithology and the composition of the soil (Factor 1, which includes Al, As, Co, Cs, Fe, Hf, Na, Rb, Sc, Ta, Th, Ti, U, V, Zr, and RE; Factor 4 with Ba, K, and Sr; Factor 5 with I and Br), one geogenic-anthropogenic association (Factor 3 with Cr and Ni), and one anthropogenic (Factor 2, which includes Cd, Pb, Sb, and Zn) association were obtained.
According to the sampling campaign (2002/2005/2010), the content of elements associated with Factor 1 and Factor 5 changed the most. Factor 1 decreased considerably according to the sampling campaign, while the opposite trend was observed for Factor 5. These two factors show geogenic distribution, mostly related to natural background and weather conditions. The contents of the elements combined in Factor 3 increased from moss surveys from 2002 to 2005 and fall slightly in 2010. This coincides with the reactivation of a ferronickel smelter in Kavadarci in 2004. Factor 2 slightly declined, according to the sampling campaign, which may be related to the closure of the Pb-Zn mine in Vales in 2003. The geogenic association in Factor 4 shows almost no changes.
The largest anthropogenic impact of air pollution with potentially toxic metals was the ferronickel smelter plant in the vicinity of Kavadarci (Ni and Cr), as well as three reactivated lead and zinc mines near the towns of Probištip, Makedonska Kamenica and Kriva Palanka (Cd, Pb, and Zn). The distribution of analyzed elements in the Republic of Macedonia was also related to the lithology and the composition of the soil.
This work is essential for monitoring future trends at a high spatial resolution and provides a useful tool for possible modeling the atmospheric deposition fluxes. Environmental monitoring programs, such as the moss survey are also appropriate to regulatory bodies of the country, with the aim to prevent the quality of the environment from deteriorating or ensure that its quality is improved.

Author Contributions

Conceptualization, T.S.; Data curation, R.Š. and K.B.A.; Investigation, L.B., T.S., M.F. and K.B.A.; Methodology, M.F.; Software, R.Š.; Writing—original draft, R.Š.; Writing—review & editing, L.B. and T.S. All authors have read and agreed to the published version of the manuscript.

Funding

This research received no external funding.

Conflicts of Interest

The authors declare no conflict of interest.

Appendix A

Table A1. Matrix of correlation coefficients (n = 216), a group of 16 selected principally natural distributed elements).
AlAsCoCsFeHfNaRbScTaThTiUVZrRE*
Al1.00
As0.761.00
Co0.790.731.00
Cs0.830.830.771.00
Fe0.880.790.900.831.00
Hf0.870.740.780.820.901.00
Na0.770.640.700.740.760.781.00
Rb0.630.540.510.720.580.640.671.00
Sc0.890.800.890.860.960.900.790.591.00
Ta0.870.740.780.850.840.900.820.720.891.00
Th0.890.780.770.880.860.900.800.720.880.941.00
Ti0.840.570.690.660.770.730.620.510.750.700.711.00
U0.880.780.770.860.850.880.840.710.870.920.950.721.00
V0.940.760.800.800.850.790.740.580.890.820.810.790.811.00
Zr0.810.670.700.770.800.870.780.660.830.870.840.650.820.781.00
RE*0.910.770.810.830.910.920.770.680.910.880.920.750.900.840.831.00
n = total number of samples from the three sampling campaigns; Values in the range of 0.5–0.7 (good association) are underlined, and in the range 0.7–1.0 (strong association) are bolded; Box-Cox transformed values used. RE*–an average of standardized values of analyzed rare-earth elements: Ce, Eu, La, Sm, and Tb.
Table A2. Matrix of correlation coefficient (n = 216), a group of 11 selected elements, natural and anthropogenic elements.
BaBrCdCrIKNiPbSbSrZn
Ba1.00
Br0.161.00
Cd0.040.111.00
Cr0.290.190.211.00
I0.250.530.120.341.00
K0.50−0.150.060.15−0.071.00
Ni0.160.180.330.710.410.011.00
Pb0.120.080.570.320.250.010.321.00
Sb0.20−0.070.410.500.190.170.380.611.00
Sr0.720.140.100.340.190.440.290.120.171.00
Zn0.17−0.060.510.490.120.330.450.610.740.151.00
Values in the range 0.5–0.7 (good association) are underlined, and in the range 0.7–1.0 (strong association) are bolded; Box-Cox transformed values used.

References

  1. Barandovski, L.; Cekova, M.; Frontasyeva, M.V.; Pavlov, S.S.; Stafilov, T.; Steinnes, E.; Urumov, V. Air Pollution Studies in Macedonia Using the Moss Biomonitoring Technique, NAA, AAS, and GIS technology. Frank Lab. Neutron Phys. 2006. preprint. [Google Scholar]
  2. Barandovski, L.; Cekova, M.; Frontasyeva, M.V.; Pavlov, S.S.; Stafilov, T.; Steinnes, E.; Urumov, V. Atmospheric deposition of trace element pollutants in Macedonia studied by the moss biomonitoring technique. Environ. Monit. Assess. 2008, 138, 107–118. [Google Scholar] [CrossRef] [PubMed]
  3. Angelovska, S.; Stafilov, T.; Šajn, R.; Balabanova, B. Geogenic and anthropogenic moss responsiveness on lithological elements distribution around Pb-Zn ore deposit. Arch. Environ. Contam. Toxicol. 2016, 70, 487–505. [Google Scholar] [PubMed]
  4. Loppi, S.; Giomarelli, B.; Bargagli, R. Lichens and mosses as biomonitors of trace elements in a geothermal area (Mt. Amiata, Central Italy). Cryptogr. Mycol. 1999, 20, 119–126. [Google Scholar] [CrossRef]
  5. Kłos, A.; Ziembik, Z.; Rajfur, M.; Dołhańczuk-Śródka, A.; Bochenek, Z.; Bjerke, J.W.; Tommervik, H.; Zagajewski, B.; Ziółkowski, D.; Jerz, D.; et al. Using moss and lichens in biomonitoring of heavy-metal contamination of forest areas in southern and north-eastern Poland. Sci. Total Environ. 2018, 627, 438–449. [Google Scholar] [CrossRef] [PubMed]
  6. Barandovski, L. Use of passive biomonitoring and neutron activation analysis for deposition monitoring of trace elements in the air in the Republic of Macedonia. Ph.D. Thesis, Ss Cyril and Methodius University, Skopje, North Macedonia, 2014; 102p. (In Macedonian). [Google Scholar]
  7. Lazo, P.; Stafilov, T.; Qarri, F.; Allajbeu, S.; Bekteshi, L.; Frontasyeva, M.; Harmens, H. Spatial distribution and temporal trend of airborne trace metal deposition in Albania studied by moss biomonitoring. Ecol. Indic. 2019, 101, 1007–1017. [Google Scholar] [CrossRef]
  8. Stafilov, T.; Šajn, R.; Barandovski, L.; Bačeva, K.A.; Malinovska, S. Moss biomonitoring of atmospheric deposition study of minor and trace elements in Macedonia. Air Qual. Atmos. Health 2018, 11, 137–152. [Google Scholar] [CrossRef]
  9. Szczepaniak, K.; Biziuk, M. Aspects of the biomonitoring studies using mosses and lichens as indicators of metal pollution. Environ. Res. 2003, 93, 221–230. [Google Scholar] [CrossRef]
  10. Wróbel, Ł.; Dołhańczuk-Śródka, A.; Kłos, A.; Ziembik, Z. The activity concentration of post-Chernobyl 137Cs in the area of the Opole Anomaly (southern Poland). Environ. Monit. Assess. 2015, 187, 1–7. [Google Scholar] [CrossRef]
  11. Dołhańczuk-Śródka, A.; Ziembik, Z.; Kříž, J.; Hyšplerova, L.; Wacławek, M. Pb-210 isotope as a pollutant emission indicator. Ecol. Chem. Eng. S 2015, 22, 73–81. [Google Scholar]
  12. Groet, S.S. Regional and local variations in heavy metal concentrations of bryophytes in the northeastern United States. Oikos 1976, 27, 445–456. [Google Scholar] [CrossRef]
  13. Percy, K.E. Heavy metal and sulphur concentrations in Sphagnum magellanicum Brid. in the maritime provinces, Canada. Water Air Soil Pollut. 1982, 19, 341–349. [Google Scholar]
  14. Rühling, Å.; Steinnes, E. Atmospheric Heavy Metal Deposition in Europe 1995–1996; Nordic Council of Ministers: Copenhagen, Denmark, 1998. [Google Scholar]
  15. Wolterbeek, H.T. Biomonitoring of trace element air pollution: Principles, possibilities and perspectives. Environ. Pollut. 2002, 120, 11–21. [Google Scholar] [CrossRef]
  16. Lee, C.S.L.; Li, X.; Zhang, G.; Peng, X.; Zhang, L. Biomonitoring of trace metals in the atmosphere using moss (Hypnum plumaeforme) in the Nanling Mountains and the Pearl River Delta, Southern China. Atmos. Environ. 2005, 39, 397–407. [Google Scholar] [CrossRef] [Green Version]
  17. Elias, C.; Fernandes, E.A.N.; França, E.J.; Bacchi, M.A.; Tagliaferro, F.S. Native bromeliads as biomonitors of airborne chemical elements in a Brazilian resting forest. J. Radioanal. Nucl. Chem. 2008, 278, 423–427. [Google Scholar] [CrossRef]
  18. Harmens, H.; Norris, D.A.; Steinnes, E.; Kubin, E.; Piispanen, J.; Alber, R.; Aleksiayenak, Y.; Blum, O.; Coşkun, M.; Dam, M.; et al. Mosses as biomonitors of atmospheric heavy metal deposition: Spatial and temporal trends in Europe. Environ. Pollut. 2010, 158, 3144–3156. [Google Scholar] [CrossRef]
  19. Harmens, H.; Norris, D.A.; Sharps, K.; Mills, G.; Alber, R.; Aleksiayenak, Y.; Blum, O.; Cucu-Man, S.M.; Dam, M.; De Temmerman, L.; et al. Heavy metal and nitrogen concentrations in mosses are declining across Europe whilst some “hotspots” remain in 2010. Environ. Pollut. 2015, 200, 93–104. [Google Scholar] [CrossRef] [Green Version]
  20. Harmens, H.; Buse, A.; Büker, P.; Norris, D.; Mills, G.; Williams, B. Heavy metal concentrations in European mosses: 2000/2001 survey. J. Atmos. Chem. 2004, 49, 425–436. [Google Scholar] [CrossRef]
  21. Steinnes, E.; Uggerud, H.T.; Pfaffhuber, K.A.; Berg, T. Atmospheric Deposition of Heavy Metals in Norway—National Moss Survey 2015. M–595; Norwegian Institute for Air Research: Trondheim, Norway, 2016. [Google Scholar]
  22. Barandovski, L.; Frontasyeva, M.V.; Stafilov, T.; Šajn, R.; Ostrovnaya, T.M. Multi-element atmospheric deposition in Macedonia studied by the moss biomonitoring technique. Environ. Sci. Pollut. Res. 2015, 22, 16077–16097. [Google Scholar] [CrossRef]
  23. Mahapatra, B.; Dhal, N.K.; Dash, A.K.; Panda, B.P.; Panigrahi, K.C.S.; Pradhan, A. Perspective of mitigating atmospheric heavy metal pollution: Using mosses as biomonitoring and indicator organism. Environ. Sci. Pollut. Res. 2019, 26, 29620–29638. [Google Scholar] [CrossRef]
  24. Stafilov, T.; Šajn, R.; Pančevski, Z.; Boev, B.; Frontasyeva, M.V.; Strelkova, L.P. Heavy metal contamination of surface soils around a lead and zinc smelter in the Republic of Macedonia. J. Hazard. Mater. 2010, 175, 896–914. [Google Scholar] [CrossRef] [PubMed]
  25. Stafilov, T.; Šajn, R.; Boev, B.; Cvetković, J.; Mukaetov, D.; Andreevski, M.; Lepitkova, S. Distribution of some elements in surface soil over the Kavadarci Region, Republic of Macedonia. Environ. Earth Sci. 2010, 61, 1515–1530. [Google Scholar] [CrossRef]
  26. Stafilov, T.; Aliu, M.; Šajn, R. Arsenic in surface soils affected by mining and metallurgical processing in K. Mitrovica Region, Kosovo. Int. J. Environ. Res. Public Health 2010, 7, 4050–4061. [Google Scholar] [CrossRef] [PubMed]
  27. Balabanova, B.; Stafilov, T.; Bačeva, K.; Šajn, R. Biomonitoring of atmospheric pollution with heavy metals in the copper mine vicinity located near Radoviš. Republic of Macedonia. J. Environ. Sci. Health A 2010, 45, 1504–1518. [Google Scholar] [CrossRef]
  28. Balabanova, B.; Stafilov, T.; Šajn, R.; Bačeva, K. Distribution of chemical elements in attic dust as reflection of lithology and anthropogenic influence in the vicinity of copper mine and flotation. Arch. Environ. Contam. Toxicol. 2011, 6, 173–184. [Google Scholar] [CrossRef] [Green Version]
  29. Bačeva, K.; Stafilov, T.; Šajn, R.; Tănăselia, C.; Iić Popov, S. Distribution of chemical elements in attic dust in the vicinity of ferronickel smelter plant. Fresenius Environ. Bull. 2011, 20, 2306–2314. [Google Scholar]
  30. Bačeva, K.; Stafilov, T.; Šajn, R.; Tănăselia, C. Moss biomonitoring of air pollution with heavy metals in the vicinity of a ferronickel smelter plant. J. Environ. Sci. Health A 2012, 47, 645–656. [Google Scholar] [CrossRef]
  31. Balabanova, B.; Stafilov, T.; Šajn, R.; Bačeva, K. Characterisation of heavy metals in lichen species Hypogymnia physodes and Evernia prunastri due to biomonitoring of air pollution in the vicinity of copper mine. Int. J. Environ. Res. Public Health 2012, 6, 779–792. [Google Scholar]
  32. Barandovski, L.; Frontasyeva, M.V.; Stafilov, T.; Šajn, R.; Pavlov, S.; Enimiteva, V. Trends of atmospheric deposition of trace elements in Macedonia by the moss biomonitoring technique. J. Environ. Sci. Health A 2012, 47, 2000–2015. [Google Scholar] [CrossRef]
  33. Barandovski, L.; Stafilov, T.; Šajn, R.; Frontasyeva, M.V.; Bačeva, K. Air pollution study in Macedonia using a moss biomonitoring technique, ICP-AES, and AAS. Maced. J. Chem. Chem. Eng. 2013, 32, 89–107. [Google Scholar] [CrossRef] [Green Version]
  34. Boev, B.; Stafilov, T.; Bačeva, K.; Šorša, A.; Boev, I. Influence of a nickel smelter plant on the mineralogical composition of attic dust in the Tikveš Valley, Republic of Macedonia. Environ. Sci. Pollut. Res. 2013, 20, 3781–3788. [Google Scholar] [CrossRef] [PubMed]
  35. Bačeva, K.; Stafilov, T.; Šajn, R.; Tănăselia, C. Air dispersion of heavy metals in vicinity of the As-Sb-Tl abounded mine and responsiveness of moss as a biomonitoring media in small scale investigations. Environ. Sci. Pollut. Res. 2013, 20, 8763–8779. [Google Scholar] [CrossRef] [PubMed]
  36. Stafilov, T.; Šajn, R.; Alijagić, J. Distribution of arsenic, antimony, and thallium in soil in Kavadarci and its surroundings, Republic of Macedonia. Soil Sediment Contam. 2013, 22, 105–118. [Google Scholar] [CrossRef]
  37. Stafilov, T. Environmental pollution with heavy metals in the Republic of Macedonia. Contrib. Sect. Nat. Math. Biotechnol. Sci. MASA 2014, 35, 81–119. [Google Scholar] [CrossRef] [Green Version]
  38. Bačeva, K.; Stafilov, T.; Matevski, V. Bioaccumulation of heavy metals by endemic viola species from the soil in the vicinity of the As-Sb-Tl mine “Allchar”, Republic of Macedonia. Int. J. Phytoremediat. 2014, 16, 347–365. [Google Scholar] [CrossRef]
  39. Balabanova, B.; Stafilov, T.; Šajn, R. Variability assessment for multivariate analysis of elemental distributions due to anthropogenic and geogenic impact in lead-zinc mine and flotation environ (moss sampling media). Geol. Maced. 2014, 28, 35–41. [Google Scholar]
  40. Balabanova, B.; Stafilov, T.; Šajn, R.; Bačeva, K. Comparison of response of moss, lichens and attic dust to geology and atmospheric pollution from copper mine. Int. J. Environ. Sci. Technol. 2014, 11, 517–528. [Google Scholar] [CrossRef]
  41. Angelovska, S.; Stafilov, T.; Šajn, R.; Bačeva, K.; Balabanova, B. Moss biomonitoring of air pollution with heavy metals in the vicinity of Pb-Zn mine “Toranica” near the town of Kriva Palanka. Modern Chem. Appl. 2014, 2, 1–6. [Google Scholar]
  42. Balabanova, B.; Stafilov, T.; Šajn, R.; Tănăselia, C. Multivariate extraction of dominant geochemical markers for 69 elements deposition in Bregalnica River Basin, Republic of Macedonia (moss biomonitoring). Environ. Sci. Pollut. Res. 2016, 23, 22852–22870. [Google Scholar] [CrossRef]
  43. Balabanova, B.; Stafilov, T.; Šajn, R.; Bačeva Andonovska, K. Quantitative assessment of metal elements using moss species as biomonitors in downwind area of lead-zinc mine. J. Environ. Sci. Health A 2017, 52, 290–301. [Google Scholar] [CrossRef]
  44. Stafilov, T.; Šajn, R. Geochemical Atlas of the Republic of Macedonia; Faculty of Natural Sciences and Mathematics, Sc. Cyril and Methodius University: Skopje, North Macedonia, 2016. [Google Scholar]
  45. Stafilov, T.; Šajn, R.; Arapčeska, M.; Kungulovski, I.; Alijagić, J. Geochemical properties of topsoil around the coal mine and thermoelectric power plant. J. Environ. Sci. Health A 2018, 53, 793–808. [Google Scholar] [CrossRef] [PubMed]
  46. Stafilov, T.; Špirić, Z.; Glad, M.; Barandovski, L.; Bačeva Andonovska, K.; Šajn, R.; Antonić, O. Study of nitrogen pollution in the Republic of North Macedonia by moss biomonitoring and Kjeldahl method. J. Environ. Sci. Health A 2020, 55, 759–764. [Google Scholar] [CrossRef] [PubMed]
  47. Bačeva, K.; Stafilov, T.; Šajn, R. Biomonitoring of nickel air pollution near the city of Kavadraci, Republic of Macedonia. Ecol. Protect. Environ. 2009, 12, 57–69. [Google Scholar]
  48. Dimovska, B.; Stafilov, T.; Šajn, R.; Tănăselia, C. Moss biomonitoring of air pollution with arsenic in Bitola and the Environs, Republic of Macedonia. Geol. Maced. 2013, 27, 5–11. [Google Scholar]
  49. Dimovska, B.; Stafilov, T.; Šajn, R.; Bačeva, K. Distribution of lead and zinc in soil over the Bitola region, Republic of Macedonia. Geol. Maced. 2014, 28, 87–91. [Google Scholar]
  50. Stafilov, T.; Šajn, R.; Sulejmani, F.; Bačeva, K. Geochemical properties of topsoil around the open coal mine and Oslomej thermoelectric power plant R.; Macedonia. Geol. Croat. 2014, 67, 33–44. [Google Scholar] [CrossRef]
  51. Blouet, B.W. The EU and Neighbors: A Geography of Europe in Modern World; John Wiley & Sons: New York, NY, USA, 2008. [Google Scholar]
  52. Environmental Statistics, State Statistical Office of the Republic of Macedonia, Skopje, 2019. Available online: http://www.stat.gov.mk/Publikacii/ZivotnaSredina2019.pdf (accessed on 18 August 2020).
  53. Lazarevski, A. Climate in Macedonia; Kultura: Skopje, North Macedonia, 1993. (In Macedonian) [Google Scholar]
  54. Balabanova, B.; Stafilov, T.; Šajn, R. Enchasing anthropogenic element trackers for evidence of long-term atmospheric depositions in mine environ. J. Environ. Sci. Health A 2019, 54, 988–998. [Google Scholar] [CrossRef] [Green Version]
  55. Tomovski, D.; Bačeva Andonovska, K.; Šajn, R.; Karadjov, M.; Stafilov, T. Distribution of chemical elements in sediments and alluvial soils from the Crna Reka river basin. Geol. Maced. 2019, 33, 125–145. [Google Scholar]
  56. Vasilevska, S.; Stafilov, T.; Šajn, R. Distribution of trace elements in sediments and soil from Crn Drim River Basin, Republic of Macedonia. SN Appl. Sci. 2019, 1, 1–16. [Google Scholar] [CrossRef] [Green Version]
  57. Stafilov, T.; Šajn, R.; Ahmeti, L. Geochemical characteristics of soil of the city of Skopje, Republic of Macedonia. J. Environ. Sci. Health A 2019, 54, 972–987. [Google Scholar] [CrossRef]
  58. Stafilov, T.; Šajn, R.; Mickovska, I. Distribution of chemical elements in soil from Crn Drim River basin, Republic of Macedonia. Contrib. Sect. Nat. Math. Biotech. Sci. MASA 2019, 40, 73–92. [Google Scholar] [CrossRef]
  59. Stafilov, T.; Šajn, R. Spatial distribution and pollution assessment of heavy metals in soil from the Republic of North Macedonia. J. Environ. Sci. Health A 2019, 54, 1457–1474. [Google Scholar] [CrossRef] [PubMed]
  60. Dumurdzanov, N.; Serafimovski, T.; Burchfiel, B.C. Cenozoic tectonics of Macedonia and its relation to the South Balkan extensional. Geosphere 2005, 1, 1–22. [Google Scholar] [CrossRef]
  61. Jovanovski, G.; Boev, B.; Makreski, P. Minerals from the Republic of Macedonia with an Introduction to Mineralogy; Macedonian Academy of Sciences and Arts: Skopje, North Macedonia, 2012. [Google Scholar]
  62. ICP Vegetation Coordination Centre. ICP Vegetation Experimental Protocol for the 2001 Season; ICP Vegetation Coordination Centre: Bangor, UK, 2001. [Google Scholar]
  63. Harmens, H. (Ed.) Heavy Metals in European Mosses: 2005/2006 Survey—Monitoring Manual; International Cooperative Programme on Effects of Air Pollution on Natural Vegetation and Crops, Centre for Ecology and Hydrology: Bangor, UK, 2005. [Google Scholar]
  64. Harmens, H. (Ed.) Heavy Metals in European Mosses: 2010 Survey—Monitoring Manual; International Cooperative Programme on Effects of Air Pollution on Natural Vegetation and Crops, Centre for Ecology and Hydrology: Bangor, UK, 2010. [Google Scholar]
  65. Snedecor, G.W.; Cochran, W.G. Statistical Methods; The Iowa State University Press: Ames, IA, USA, 1967. [Google Scholar]
  66. Hollander, M.; Wolfe, D.A. Nonparametric Statistical Methods, 2nd ed.; Wiley: New York, NY, USA, 1999. [Google Scholar]
  67. Box, G.E.P.; Cox, D.R. An analysis of transformations. J. R. Stat. Soc. Ser. B 1962, 26, 211–252. [Google Scholar] [CrossRef]
  68. Shoji, T. Enrichment ratio-tonnage diagrams for resource assessment. Nat. Resour. Res. 2002, 11, 273–287. [Google Scholar] [CrossRef]
  69. La Maitre, R.W. Numerical Petrology, Statistical Interpretation of Geochemical Data; Elsevier: Amsterdam, The Netherlands, 1982; p. 281. [Google Scholar]
  70. Davis, J.C. Statistic and Data Analysis in Geology; Willey: New York, NY, USA, 1986; p. 646. [Google Scholar]
  71. Reimann, C.; Filzmoser, P.; Garrett, R.G. Factor analysis applied to regional geochemical data: Problems and possibilities. Appl. Geochem. 2002, 17, 185–206. [Google Scholar] [CrossRef]
  72. Templ, M.; Filzmoser, P.; Reimann, C. Cluster analysis applied to regional geochemical data: Problems and possibilities. Appl. Geochem. 2008, 23, 2198–2213. [Google Scholar] [CrossRef]
  73. Filzmoser, P.; Garrett, R.G.; Reimann, C. Multivariate outlier detection in exploration geochemistry. Comput. Geosci. 2005, 31, 579–587. [Google Scholar] [CrossRef]
  74. Frontasyeva, M.V.; Steinnes, E. Marine gradients of halogens in moss studied by epithermal neutron activation analysis. J. Radioanal. Nucl. Chem. 2004, 261, 101–106. [Google Scholar] [CrossRef]
  75. Čeburnis, D.; Steinnes, E.; Kveitkus, K. Estimation of metal uptake efficiencies from precipitation in mosses in Lithuania. Chemosphere 1999, 38, 445–455. [Google Scholar] [CrossRef]
  76. State Statistical Office of the Republic of Macedonia. Environmental Statistics; State Statistical Office of the Republic of Macedonia: Skopje, North Macedonia, 2011.
  77. State Statistical Office of the Republic of Macedonia. Environmental Statistics; State Statistical Office of the Republic of Macedonia: Skopje, North Macedonia, 2013.
  78. De Agostini, A.; Cortis, P.; Cogoni, A. Monitoring of air pollution by moss bags around an oil refinery: A critical evaluation over 16 years. Atmpshere 2020, 11, 272. [Google Scholar] [CrossRef] [Green Version]
  79. Pais, I.; Jones, J.B. The Handbook of Trace Elements; St. Lucie Press: Boca Raton, FL, USA, 1997. [Google Scholar]
  80. Stafilov, T.; Šajn, R.; Balabanova, B.; Bačeva, K. Distribution of heavy metals in attic and deposited dust in the vicinity of copper ore processing and ferronickel smelter plants in the Republic of Macedonia. In Dust: Sources, Environmental Concerns and Control; Wouters, L.B., Pauwels, M., Eds.; Nova Science Publishers: Hauppauge, NY, USA, 2012; pp. 57–98. [Google Scholar]
  81. Stafilov, T.; Šajn, R.; Boev, B.; Cvetković, J.; Mukaetov, D.; Andreevski, M. Geochemical Atlas of Kavadarci and the Environs; Faculty of Natural Sciences and Mathematics: Skopje, North Macedonia, 2008. [Google Scholar]
  82. Stafilov, T.; Peeva, L.; Nikov, B.; de Koning, A. Industrial hazardous waste in the Republic of Macedonia. In Applied Environmental Geochemistry—Anthropogenic Impact on Human Environment in the SE Europe; Šajn, R., Žilbert, G., Alijagić, J., Eds.; Geological Survey of Slovenia: Ljubljana, Slovenia, 2009; pp. 108–112. [Google Scholar]
  83. Steinnes, E.; Frontasyeva, M.V. Marine gradients of halogens in soil studied by epithermal neutron activation analysis. J. Radioanal. Nucl. Chem. 2002, 253, 173–177. [Google Scholar] [CrossRef]
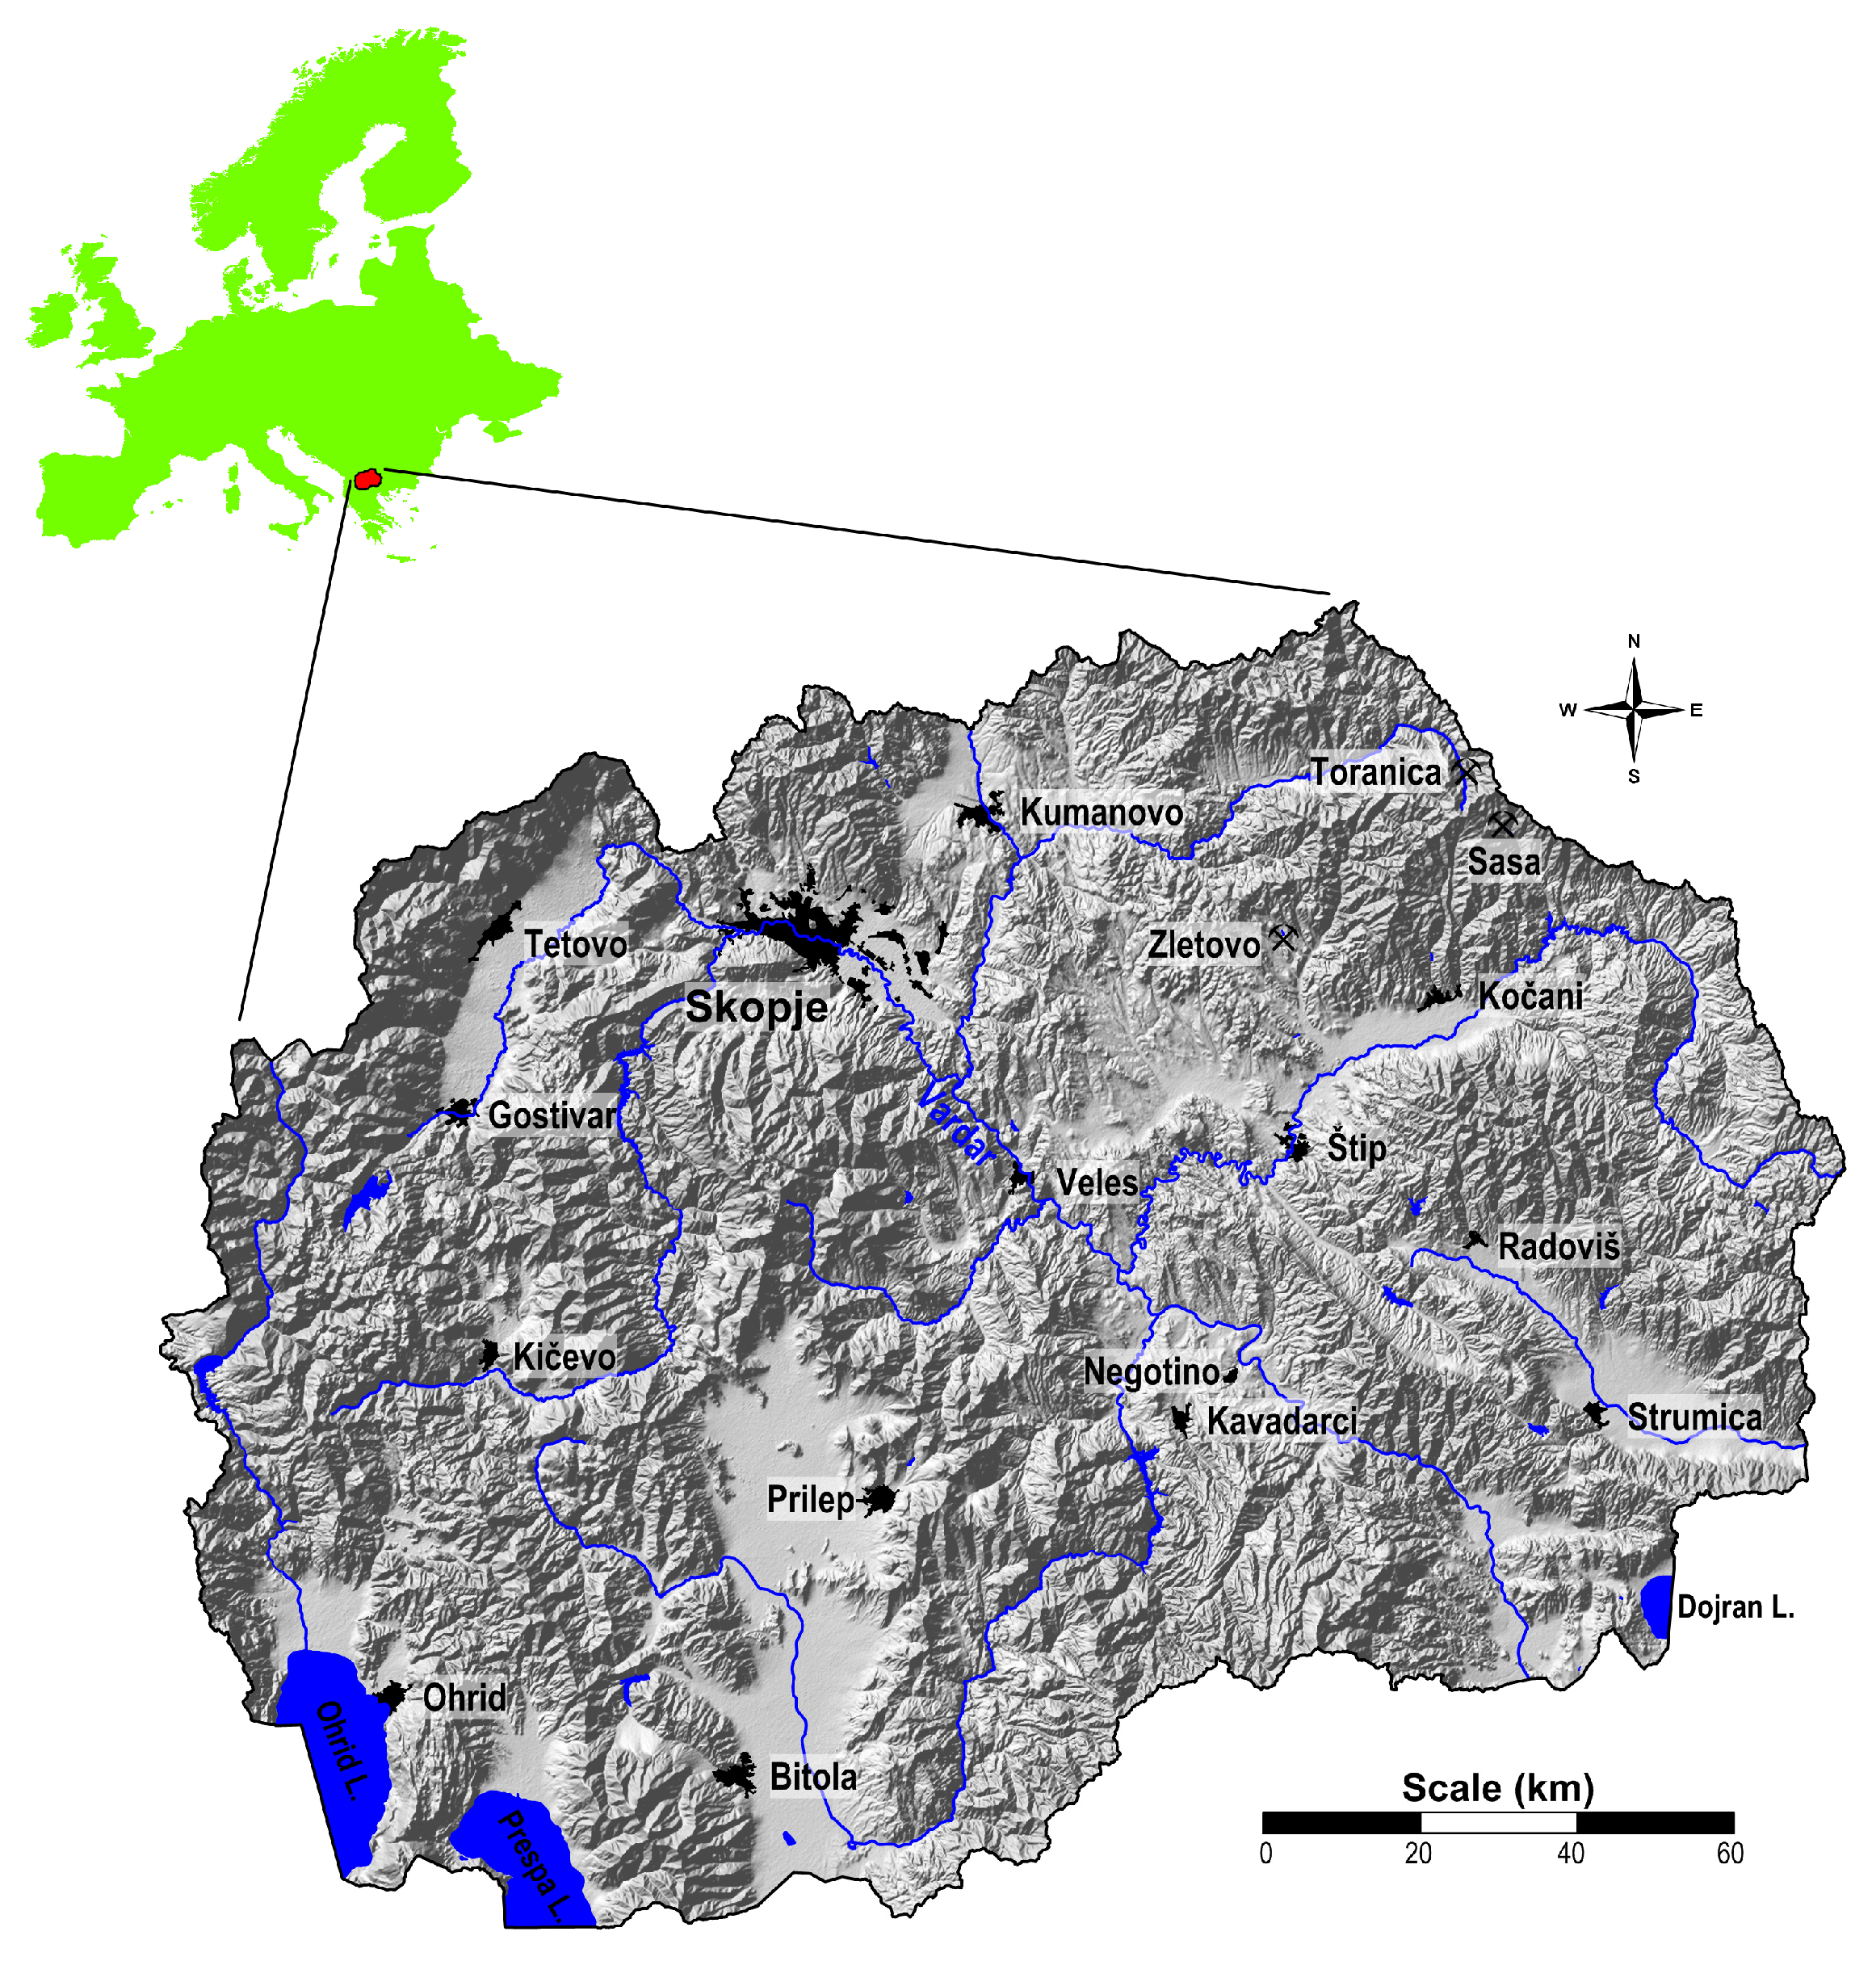
Figure 1. Map of the Republic of Macedonia.
Atmosphere 11 00929 g001
Figure 2. Lithological map of Macedonia (simplified according to a Geological map of SFR Yugoslavia, 1970). Dashed lines represent the areas of the major tectonic units: West-Macedonian zone (WMZ), Pelagonian massif (PM), Vardar zone (VZ), and Serbo-Macedonian massif (SMM).
Atmosphere 11 00929 g002
Figure 3. Location of sampling points.
Atmosphere 11 00929 g003
Figure 4. Cluster analysis dendrogram—element relationship (n = 216, 27 selected elements). RE*—Average of the standardized values of analyzed rare-earth elements: Ce, Eu, La, Sm, and Tb.
Atmosphere 11 00929 g004
Figure 5. Box plots of factor scores (st. values) according to the sampling campaign. F1–F5—factor loadings.
Atmosphere 11 00929 g005
Figure 6. Spatial distribution of F1 factor scores (Al-As-Co-Cs-Fe-Hf-Na-Rb-Sc-Ta-Th-Ti-U-V-Zr-RE*).
Atmosphere 11 00929 g006
Figure 7. Spatial distribution of F2 factor scores (Cd-Pb-Sb-Zn).
Atmosphere 11 00929 g007
Figure 8. Spatial distribution of F3 factor scores (Ni-Cr).
Atmosphere 11 00929 g008
Figure 9. Spatial distribution of F4 factor scores (Ba-K-Sr).
Atmosphere 11 00929 g009
Figure 10. Spatial distribution of F5 factor scores (Br-I)—normal values.
Atmosphere 11 00929 g010
Table 1. Descriptive statistics of measurement according to sampling campaign; n = 72.
200220052010
UnitXBCMdMin–MaxXBCMdMin–MaxXBCMdMin–Max
Al%0.400.380.083–1.80.370.360.15–2.60.240.240.11–0.68
Asmg/kg0.860.800.12–8.00.690.680.18–4.30.510.480.23–1.9
Bamg/kg525414–260525318–190505014–360
Brmg/kg2.42.20.061–7.71.91.90.90–7.04.74.42.0–16
Cdmg/kg0.180.160.016–3.00.270.290.015–3.00.220.220.068–2.2
Cemg/kg5.65.50.83–434.34.51.5–172.52.60.66–21
Comg/kg1.21.10.24–141.21.10.42–5.30.770.830.27–2.9
Crmg/kg7.87.92.3–1207.06.82.1–826.76.52.5–35
Csmg/kg0.400.380.097–1.70.340.320.13–2.30.200.200.093–0.90
Euµg/kg11011027–48071666.3–48071798.9–260
Fe%0.250.240.042–1.70.230.220.10–0.810.180.190.089–0.54
Hfmg/kg0.290.260.050–3.80.220.210.076–1.10.170.170.085–0.70
Img/kg1.21.20.36–2.81.61.70.64–3.71.61.60.51–2.9
K%0.830.840.29–1.80.750.750.47–1.40.660.660.36–1.0
Lamg/kg2.52.30.50–222.42.30.97–9.11.31.40.62–9.0
Namg/kg440440120–8700360360140–190019019089–1000
Nimg/kg2.62.50.089–246.15.81.8–434.04.31.0–55
Pbmg/kg5.86.01.5–377.47.60.10–474.54.61.9–22
Rbmg/kg11115.0–479.49.84.0–296.66.62.2–21
Sbmg/kg0.190.200.040–1.40.150.150.044–0.920.090.090.044–0.22
Scmg/kg0.850.740.12–6.80.720.670.30–4.60.460.440.16–1.9
Smmg/kg0.440.450.072–3.40.370.350.14–2.00.270.270.11–1.5
Srmg/kg313212–140323413–140343412–120
Taµg/kg919313–790787731–330384018–170
Tbµg/kg60629.4–560555315–250343612–190
Thmg/kg0.680.680.12–7.60.590.580.26–3.30.360.360.17–2.1
Timg/kg18016012–140023022086–120016015033–470
Umg/kg0.220.210.033–1.50.210.210.080–1.10.110.110.058–0.61
Vmg/kg7.46.91.8–436.56.42.5–323.93.81.5–14
Znmg/kg403914–200383616–91292929
Zrmg/kg17162.1–14013120.38–696.15.61.5–25
n—number of samples; XBC—mean (Box-Cox transformed values used); Md—median; Min—minimum; Max—maximum.
Table 2. Statistical tests of differences and enrichment ratios according to sampling campaign (2002/2005/2010). Box-Cox transformed values were used for the analysis (n = 72).
XBCXBCXBCt-test t-test t-test F-test ERER
Unit2002200520102002/2005 2002/2010 2005/2010 2002/2005/2010 2005/20022010/2002
Al%0.400.370.24−0.09NS4.59*5.23*15.0*0.920.61
Asmg/kg0.860.690.512.19*5.25*2.98*13.3*0.790.59
Bamg/kg525250−0.01NS0.43NS0.47NS0.1NS1.000.96
Brmg/kg2.41.94.71.96NS−8.68*−13.06*75.7*0.771.96
Cdmg/kg0.180.270.22−1.33NS−1.34NS0.39NS1.2NS1.511.20
Cemg/kg5.64.32.52.05*7.12*5.66*30.0*0.770.44
Comg/kg1.21.20.77−0.43NS3.93*5.04*12.9*1.040.67
Crmg/kg7.87.06.70.77NS1.39NS0.59NS1.0NS0.900.86
Csmg/kg0.400.340.200.94NS6.52*5.79*25.8*0.850.50
Euµg/kg11071713.85*5.46*0.66NS13.4*0.620.62
Fe%0.250.230.180.18NS2.70*3.06*5.1*0.940.74
Hfmg/kg0.290.220.172.10*4.27*2.46*9.8*0.750.60
Img/kg1.21.61.6−4.55*−4.36*0.71NS14.2*1.331.35
K%0.830.750.661.30NS4.16*4.47*11.4*0.900.79
Lamg/kg2.52.41.30.29NS5.65*6.21*23.4*0.950.53
Namg/kg4403601901.35NS7.56*6.98*36.0*0.830.43
Nimg/kg2.66.14.0−6.85*−3.92*3.15*24.8*2.341.54
Pbmg/kg5.87.44.5−0.76NS2.53*2.71*4.3*1.260.77
Rbmg/kg119.46.63.21*7.86*4.99*33.3*0.820.58
Sbmg/kg0.190.150.091.87NS7.57*6.41*31.5*0.800.48
Scmg/kg0.850.720.460.64NS5.31*5.38*18.5*0.850.54
Smmg/kg0.440.370.271.17NS3.78*2.99*8.3*0.840.62
Srmg/kg313234−0.40NS−0.55NS−0.20NS0.2NS1.051.10
Taµg/kg9178381.02NS8.19*8.78*46.3*0.860.42
Tbµg/kg6055340.51NS4.46*4.56*13.6*0.920.57
Thmg/kg0.680.590.360.79NS5.56*5.52*20.6*0.880.52
Timg/kg180230160−2.59*0.91NS4.52*7.7*1.280.93
Umg/kg0.220.210.110.25NS5.87*6.59*25.6*0.930.50
Vmg/kg7.46.53.90.71NS6.59*6.37*27.1*0.880.53
Znmg/kg4038290.84NS4.64*4.26*13.4*0.940.72
Zrmg/kg17136.12.65*8.38*5.37*32.7*0.780.37
XBC—mean (Box-Cox transformed values); ER—enrichment ratio; NS—nonsignificant; *—significant.
Table 3. Matrix of dominant rotated factor loadings normal values (n = 216, 27 selected elements).
F1F2F3F4F5Comm
Al0.900.080.190.140.1791.0
As0.780.320.21−0.010.0776.7
Co0.730.200.560.150.0491.1
Cs0.870.180.140.14−0.0183.5
Fe0.840.150.360.200.1993.2
Hf0.900.040.130.240.1590.1
Na0.800.110.110.33−0.1880.3
Rb0.690.18−0.160.40−0.1371.3
Sc0.900.110.290.120.0693.1
Ta0.940.100.070.16−0.0392.1
Th0.910.120.090.240.0892.0
Ti0.720.000.270.210.2770.6
U0.890.150.110.270.0490.5
V0.870.190.230.030.0785.5
Zr0.890.060.030.17−0.0682.6
RE*0.900.080.170.240.1691.7
Cd−0.080.820.130.120.1173.2
Pb0.220.830.02−0.060.1877.8
Sb0.590.640.19−0.10−0.1182.9
Zn0.330.730.330.12−0.2081.3
Cr0.530.220.690.050.1281.8
Ni0.180.250.860.050.2187.9
Ba0.43−0.00−0.030.750.2681.9
K0.200.110.010.68−0.3967.0
Sr0.31−0.020.220.700.2469.2
Br−0.040.030.050.080.8166.8
I0.240.110.19−0.000.7263.1
Prp.Totl47.310.48.68.57.081.8
Expl.Var12.782.812.332.291.88
EigenVal15.342.500.981.341.92
F1–F5—factor loadings; Com—communality in %; Prp.Totl—principal total variance in %; Expl.Var—explained variance; EigenVal—eigenvalues; Dominant values are bolded; RE*—an average of standardized values of analyzed rare-earth elements: Ce, Eu, La, Sm, and Tb.