Article

Dissolved and Suspended Forms of Metals and Metalloids in Snow Cover of Megacity: Partitioning and Deposition Rates in Western Moscow

Faculty of Geography, Lomonosov Moscow State University, 119991 Moscow, Russia
*
Author to whom correspondence should be addressed.
Atmosphere 2020, 11(9), 907; https://doi.org/10.3390/atmos11090907
Submission received: 12 July 2020 / Revised: 22 August 2020 / Accepted: 24 August 2020 / Published: 26 August 2020
(This article belongs to the Special Issue Interaction of Air Pollution with Snow and Seasonality Effects)

Abstract

:
Concentrations and ratio of dissolved and suspended forms of metals and metalloids (MMs) in snow cover and their deposition rates from the atmosphere in the western part of Moscow were studied. Forms of MMs were separated using a filter with pore diameter of 0.45 μm; their concentrations were measured by ICP-MS and ICP-AES methods. Anthropogenic impact in Moscow caused a significant increase in dust load (2–7 times), concentration of solid particles in snow cover (2–5 times), and mineralization of snow meltwater (5–18 times) compared to the background level. Urban snow contains Sn, Ti, Bi, Al, W, Fe, Pb, V, Cr, Rb, Mo, Mn, As, Co, Cu, Ba, Sb, Mg mainly in suspended form, and Ca and Na in dissolved form. The role of suspended MMs in the city significantly increases compared to the background region due to high dust load, usage of de-icing salts, and the change of acidic background conditions to alkaline ones. Anthropogenic emissions are the main sources of suspended Ca, W, Co, V, Sr, Ti, Mg, Na, Mo, Zn, Fe, Sb, and Cu in the snow cover of traffic zone. These elements’ concentrations in roadside snow cover exceed the background values more than 25 times. The highest concentrations and deposition rates of MMs in the snow of Moscow are localized near the large and medium roads.

Graphical Abstract

1. Introduction

Urban air pollution with particulate matter is a recognized environmental problem, especially relevant for megacities. Contaminated air is responsible for about 80% of premature deaths; it causes ischaemic heart disease, stroke, chronic obstructive pulmonary disease, and lung cancer [1], and increases the risk of adenocarcinomas [2]. Increased concentrations of particulate matter with high proportions of metals and metalloids (MMs) affect the external respiratory function of citizens, especially of asthma patients [3].
Due to its long occurrence and ability to accumulate pollutants over the entire cold period of the year, snow cover is a natural, informative, and convenient component indicating air pollution with particulate matter and MMs in northern cities [4,5,6,7]. Snow pollution with MMs correlates well with the overall Air Quality Index (AQI) and the level of atmospheric pollution with PM10 and PM2.5 [8]. In comparison to rains, snow more effectively absorbs pollutants and washes them out of the atmosphere due to the higher surface area and porosity of snowflakes compared to raindrops [9]. The intensity of snow cover pollution is determined from the mass of MMs entering soils and surface waters during snow melting. MMs in liquid (dissolved or soluble) form could be included into the biogeochemical cycle, while solid (suspended or insoluble) forms of MMs accumulate in surface horizons of urban soils and road dust [10,11,12]. The ratio of these forms of MMs and its variations are also frequently used informative indicators of different types of pollution sources [13,14,15,16]. In recent studies on snow cover pollution, special attention has been paid to the chemical composition of accumulated particulate matter and the determination of its mass [4,17,18,19,20,21,22].
Major sources of pollutants in the snow cover of cities are emissions of vehicles, industries and the fuel and energy complex, as well as de-icing salts (DISs). High level of snow cover pollution along roads is caused by reduced efficiency of automobile engines when air temperatures are below zero [23,24]. The most often used chemical DISs are chlorides and carbonates of Na, Ca, Mg, and K, as well as organic compounds, glycols and other alcohols, etc. [25,26]. However, the most commonly applied NaCl causes salinization and solonetzicity of soils, suppresses urban vegetation, and increases salinity of water bodies [27,28,29,30,31]. During snow melting, chloride meltwater increases the mobility of many metals contained in soil particles and their environmental hazard, probably due to the formation of MMs chlorides [32,33,34].
Moscow is the largest megacity in Europe, with more than 12.6 million citizens, and more than 17 million people inhabiting the agglomeration. As in many other large cities the main source of anthropogenic impact on the environment is motor transport, generating about 93% of the total emissions to the atmosphere. Heat and power stations and the oil refinery are responsible for the majority of stationary source emissions [35]. In spite of active deindustrialization since the 1990s, industrial zones still occupy about 17% of the city area, thus reducing the connectivity of road network and leading to excessive motor traffic and higher release of pollutants [36,37].
The studies of snow cover pollution in certain administrative okrugs and districts of Moscow and the Moscow Oblast are quite numerous [29,30,38,39,40,41,42,43,44,45,46,47,48,49,50]. However, most of the studies did not consider the ratio of MMs forms (i.e., MMs partitioning) and its change under anthropogenic impact; nor did they include comprehensive assessment of snow cover pollution with MMs near roads of different types. It is therefore necessary to collect and constantly update data about geochemical pressure on urban landscapes, especially in the traffic zone.
The western part of Moscow is considered to be less polluted with industrial emissions due to predominant westerlies and the concentration of large industrial zones in the eastern and southeastern sectors of the city, where they produce about 2/3 of the total industrial emissions [36]. Therefore, the Western Administrative Okrug (WAО), with a population of 1.4 million and with about 2800 cars per 1 km2, was chosen to assess the vehicles’ impact on MMs accumulation in snow [35]. Our main objective is to assess anthropogenically-induced changes in the chemical composition of snow cover in the traffic zone of the WAO. The aims of this study were the following: (1) identification of changes in macro-component composition and physical-chemical properties of the snow meltwater in the WAO relative to the background territory; (2) determination of snow cover contamination by dissolved and suspended forms of MMs near roads and at car parking lots in the yards of residential buildings; (3) analysis of the ratio of MMs forms in the snow cover of the traffic zone; (4) assessment of the atmospheric deposition rates of pollutants along the roads and potential anthropogenic load on the urban landscapes of WAO during snow melting.

2. Materials and Methods

2.1. Study Area and Snow Sampling

Southerly and westerly winds prevail in Moscow during the year, resulting in the regional transfer of pollutants in the north and east directions; the repeatability of easterly winds is also high [51]. Moreover, Moscow is a “heat island”, created by burning the great amount of fuel from the end of September to the second half of April [52]. The resulting upward air currents in the city center promote the inflow of relatively clean air from suburban territories to the city. This contributes to self-purification of the atmospheric air and, consequently, diminishes snow cover pollution [53].
Large highways and interchanges (Moscow Ring Road–MRR, Rublevskoye and Mozhaiskoye highways, Kutuzovskiy and Michurinskiy avenues, etc.) are the main sources of anthropogenic impact in WAO. There are also six industrial zones within its territory: Fili (Figure 1, letter (A)), Western Port (B), Berezhkovskaya Embankment (C), Kuntsevo (D), Severnoye Ochakovo (E), and Yuzhnoye Ochakovo (F), which include heat and power stations No. 25 (Severnoye Ochakovo industrial zone) and No. 12 (Berezhkovskaya Embankment industrial zone), metal-fabricating enterprises, electrical equipment production, enterprises of rubber, chemical, light and food industries (Figure 1).
Geochemical survey of snow cover was carried out in mid-March 2018 in maximum snow cover thickness. Due to frequent thawing weather in winter of 2017–2018, permanent snow cover was formed only at the end of the first decade of January 2018. The thickness of snow cover in WAO differed only slightly from the long-term mean values (35–45 cm) [51,54] and averaged 42–50 cm near roads, increasing to 55–65 cm (averaged 61 cm) within the background areas. It is known that MMs concentrations in the surface layer of snow cover are usually lower than in the underlying layers [12]. To avoid underestimation of snow cover pollution, snow samples were taken along the full depth of undisturbed snow cover. In total, 26 mixed samples were taken within the territory of WAO (Figure 1), each consisting of 10–15 individual samples taken at a distance of 3–5 m by plastic pipe with the cross-section area of 20 cm2 (one plastic pipe corresponded to one snow core, i.e., snow column) along the following roads: the MRR (3 sites), highways with four lanes in one direction (4 sites), large roads with three lanes in one direction (4 sites), medium roads with two lanes in one direction (5 sites), and small roads with one lane in one direction (5 sites). The yards of residential buildings with car parking lots (four sites) and the Meteorological Observatory of the Lomonosov Moscow State University (MO MSU) were also sampled. The background area was chosen to be sufficiently distant from the city to avoid its polluting influence. Thus, three sampling sites were selected more than 120 km west of Moscow in the Mozhaisk and Volokolamsk districts of the Moscow Oblast.

2.2. Laboratory Analysis and Data Processing

Snow cover samples were melted in the laboratory at 20–22 °C. The main physicochemical characteristics of meltwater were determined at the Ecological and Geochemical Center of the Lomonosov Moscow State University, Faculty of Geography. The pH of the resulting solution was measured using the potentiometric method with the рН Meter “SevenCompact S220” (Mettler Toledo, Greifensee, Switzerland; accuracy: ±0.002). Filtration through membrane filters with pore diameter of 0.45 μm (EMD Millipore, Burlington, MA, USA) was applied to isolate filtrate with dissolved (or soluble) forms of MMs and particles on the filter with suspended (or insoluble) forms. Filters with pore diameter of 0.45 μm are widely used to separate the dissolved and suspended forms of MMs when studying the composition of snow cover, rainfall runoff, or river waters [8,16,55,56].
The anionic composition of filtrate (SO42−, Cl, NO3) was determined using the “Stayer” liquid ion chromatograph (Akvilon, Moscow, Russia); and the cationic composition (Cа2+, Mg2+, K+, Na+) using the atomic absorption spectrometer with flame atomization ”novAA-400“ (Analytik-Jena AG, Jena, Germany). The detection limits for cations and anions were calculated at 95% confidence level for three parallel measurements of the sample and blank measurements. For SO42− and Na+, they are 0.04 mg/L, for Cа2+ and K+ − 0.03 mg/L, for Cl, NO3, and Mg2+ − 0.02 mg/L. The concentration of HCO3 ions was calculated as the difference between the sums of cations and anions equivalents. In aerosol chemistry, the ammonium plays a significant role in chemical processes, including the formation of secondary ammonium sulfate and ammonium nitrate fine inorganic aerosols [57]. However, previous studies on the chemical composition of snow in Moscow showed that the ammonium in urban snow is about 5%-eq. from the amount of cations [58]. That is, the ammonium does not play a significant role in the balance of cations in Moscow snow meltwater. Therefore, the concentrations of ammonium in snow cover of WAO were not measured.
The content of solid particles in snow meltwater (X, mg/L) was estimated (Equation (1)) based on the mass of suspension on the filter m (mg), weighed on an analytical balance “Discovery DV114C” (Ohaus, Greifensee, Switzerland; repeatability: 0.1 mg):
X = m/V,
where V is the amount of meltwater (L).
Concentrations of dissolved and suspended forms of Al, As, Ba, Bi, Ca, Cd, Co, Cr, Cu, Fe, K, Mg, Mn, Mo, Na, Ni, Pb, Rb, Sb, Sn, Sr, Ti, V, W, and Zn were measured at the laboratory of the N.M. Fedorovsky All-Russian Research Institute of Mineral Raw Materials (VIMS) by ICP-MS and ICP-AES methods using the “iCAP Qc” mass spectrometer (Thermo Fisher Scientific, Waltham, MA, USA) and the “Optima-4300DV” atomic emission spectrometer (Perkin Elmer, Waltham, MA, USA) according to the certified methods [59,60]. The VIMS laboratory is accredited to the Analytics international accreditation system (AAS.A.00255) and the national accreditation system (RA.RU.21ΓΠ11); it meets the requirements of the International Standards ISO Guide 34:2009, ISO/IEC 17025:2017, and ISO/IEC 17043:2010. The VIMS laboratory is also accredited to certificate measurement techniques and provide metrological examination in Russian Federation (accreditation certificate No. 01.00115-2013). The analysis was conducted using replicates, method blanks, field blanks, and standard reference materials in order to maintain the standard quality. For dissolved MMs, the detection limit (DL),which is defined as three times the standard deviation of replicate blank measurements, were as (μg/L): Na, 18; Mg, 100; Al, 0.57; K, 100; Ca, 19; Ti 0.55; V, 0.4; Cr, 1.0; Mn, 0.33; Fe, 0.53; Co, 0.034; Ni, 3.4; Cu, 0.32; Zn, 0.23; As, 0.10; Rb, 0.005; Sr, 0.02; Mo, 0.05; Cd, 0.004; Sn, 0.01; Sb, 0.007; Ba, 0.01; W, 0.03; Pb, 0.05; Bi, 0.002. For suspended MMs the DL were as (μg/L): Na, 16; Mg, 2.2; Al, 22; K, 9.1; Ca, 25; Ti, 1.6; V, 0.12; Cr, 0.38; Mn, 0.18; Fe, 8.6; Co, 0.01; Ni, 0.29; Cu, 0.52; Zn, 1.0; As, 0.02; Rb, 0.01; Sr, 0.12; Mo, 0.009; Cd, 0.001; Sn, 0.08; Sb, 0.005; Ba, 0.31; W, 0.05; Pb, 0.6; Bi, 0.003.
Snow cover contamination with dissolved and suspended forms of MMs was evaluated (Equation (2)) using the contamination factor (CF):
CF = Curb/Cb
where Curb and Cb are MMs concentrations in snow cover in the city and in the background area, respectively (μg/L).
The mass of each MMs coming to the Earth’s surface from the atmosphere (μg/m2 per day), that is, the deposition rates of suspended and dissolved MMs were calculated (Equations (3) and (4)):
Durb = Curb · P/t
Db = Cb · P/t
where Durb and Db are deposition rates in the city and in the background area, respectively (μg/m2 per day); P is the water supply in snow cover (L/m2); t is the number of days of snow cover occurrence (61–63 days depending on the date of snow sampling).
Water supply in snow cover was calculated according to Equation (5) below:
P = V/(a · t · S)
where a is the number of plastic pipes with snow (i.e., snow columns or snow cores) collected at the site; S is the area of the plastic pipe cross-section, m2.
The dust deposition rate was estimated as (Equation (6)):
Pn = m/(a · t · S).
The intensity of anthropogenic pressure was determined (Equation (7)) as the excess of an element deposition rate on the studied urban area over its deposition rate on the background area:
DF = Durb/Db.
Comprehensive assessment of snow cover pollution with dissolved and suspended MMs was obtained by calculating the total contamination factor of snow (TCF, Equation (8)) and the total excess of MMs deposition rates in the city above the background (TDF, Equation (9)):
TCF = ∑CF − (n − 1),
TDF = ∑DF − (n − 1),
where n is the number of chemical elements with CF or DF > 1; when calculating TCF and TDF, only CF and DF > 1 are summed [61,62]. The environmental hazard of MMs snow pollution was determined in line with the TCF gradations adopted in Russia: <32—low, non-dangerous, 32–64—medium, moderately dangerous, 64–128—high, dangerous, 128–256—very high, very dangerous, >256—maximum, extremely dangerous [61,62].
The spatial distribution patterns of the TCF and TDF totals were evaluated in the ArcGIS software package (Esri, Redlands, CA, USA). Cluster analysis to separate stable paragenetic associations of MMs was performed by the Complete Linkage method in the STATISTICA 8 software (Statsoft/Dell, Tulsa, OK, USA) with a measure of similarity d = 1–Person r and amalgamation rule Complete Linkage. The significance of Pearson correlation coefficients r and Spearman correlation coefficients rs was checked against the t-criterion at p < 0.05.

3. Results and Discussion

3.1. Physicochemical Properties and Macrocomposition of Snow Meltwater

Background snow waters in the western part of Moscow are slightly acidic (pH 5.6), with low mineralization (6.4 mg/L); the ionic composition of water is calcium bicarbonate (Table 1). The obtained data correlates with the findings of physicochemical properties of snow in Moscow suburbs [40,58,63]. The concentration of solid particles in snow water in background conditions is low (about 9 mg/L), while the intensity of daily dust load (9 mg/m2 per day) corresponds to the average level for background non-urbanized areas in the East European Plain (about 10 mg/m2 per day) [61].
pH value is an integral indicator of acidifying and alkalizing compounds’ ratio and reflects the influence of these compounds on the carbonatic equilibrium. According to 2018 data, the pH value of contaminated snow meltwater in WAO ranged from 7.3 to 8.8 with an average of 8.1; that is, the alkalization of snow cover in the city is intensive and exceeds the background by 2.5 pH units. The highest pH values 7.6–8.8 are common for roads; with an average pH of 8.2, the alkalization of meltwater decreases in the following sequence of roads: large (8.6) > highways (8.4) > medium (8.2) > small and the MRR (8.0). The rising pH value of snow meltwater with an increase in traffic intensity was also recorded in Lahti, Finland [55]. The intensity of alkalization in WAO is lower in the yards of residential buildings with car parking lots—the average pH of snow meltwater is 7.4 with slight variations from 7.3 to 7.5. The pH of snow water in the territory of the MO MSU is 7.3, which is close to the mean value for residential zones. In Moscow, like most other cities, there is alkalinization of surface soil horizons [29,30,64,65,66], road dust particles [65,67,68], and bottom sediments of lakes and ponds [69]. Previous studies on Moscow soil water extract and the composition of salts in soils showed a significant increase in the amount of carbonates [29], as opposed to the background sod-podzolic soils that do not contain carbonates at all. This, together with results of research in other cities [70], indicates significant influence of carbonates on the soils’ pH value. The sources of carbonaceous compounds in the urban environments, aside from natural—originated carbonate particles, are dust from construction and demolition activities, as well as road dust particles mainly related to tire wear, motor exhaust, and brake wear [71,72,73]. Thus, rather high pH values of snow meltwater are associated with partial dissolution of incoming urban soils and road dust particles on snow cover surface. It is known that partial dissolution of solid particles of various geneses increase the rainwater pH values [74]. Greater pH values of roadside snow meltwater sampled near large roads confirm the hypothesis of road dust particles being the most important alkalizing agent for the snow of WAO. The pH of road dust water extract for Moscow large roads varies from 6.9 to 8.1 and decreases in the yards [68]. An additional source of alkalizing agents in snow cover is marble chips, which is a commonly used DIS in Moscow [75]. On the contrary, chloride DISs can slightly reduce the pH of precipitation and snow due to the formation of gaseous HCl, ClNO2, and Cl2 as a result of the reaction of NaCl with gaseous HNO3, H2SO4, N2O5, and ClONO2 [76].
The intensive geochemical impact of transport and industrial facilities and the application of DISs led to a significant increase in the concentration of solid particles in snow cover (2–5-fold), the intensity of dust load (2–7-fold), and mineralization (5–18-fold), as well as to the change in the ionic composition of snow meltwater in WAO relative to the background. The mineralization of meltwater next to roads in the western part of Moscow averages 100 mg/L, varying from 18 to 331 mg/L; in the yards of residential buildings, it varies from 18 to 63 mg/L and amounts 32 mg/L in the territory of the MO MSU. In terms of the mineralization of snow meltwater, the roads of WAO form a following series: highways (233 mg/L) > MRR (144) > large (87) > medium (73) > small (58 mg/L). In Moscow, the average annual concentrations of atmospheric PM10 in 2018 totaled 0.7 of the maximum permissible concentrations (that is, about 40 μg/m3); near highways, the concentration of PM10 was 1.4 times higher than inside residential areas [35]. At the same time, PM10 concentrations in the city decreased by an average of 3.7% annually in 2005–2014 [77]. Our data on snow cover pollution show an increase in the content of solid particles by almost four times in snow meltwater near roads compared to the yards of residential buildings with car parking lots, which indicates a significant contribution of particles larger than PM10 to atmospheric deposition, as well as the presence of an additional source of solid particles in snow, e.g., DISs. A sharp increase in the content of particulate matter in snow cover when using DISs was also found in other cities, for example, in Yekaterinburg (Russia); where the content of particulate matter in the snow cover of roads and footpaths is 4–5 times higher than in the snow cover of lawns and car parking lots in the yards [21].
The ionic composition of snow meltwater near the Moscow Ring Road, the highways, and large and medium roads differs slightly. It is almost everywhere of calcium-sodium chloride type, which compares favorably with the results of long-term (1999–2019) studies of acidity and chemical composition of snow and rainfall in Moscow and Moscow Region [58,63,78]. Only at sampling points on the streets of Molodogvardeiskaya (point S16 in Figure 1) and Ryabinovaya (point S08) near the construction sites and industrial zones Severnoye Ochakovo and Yuzhnoye Ochakovo is the water of calcium-sodium bicarbonate-chloride type. Snow meltwater near small roads, at car parking lots in the yards of residential buildings, and on the territory of the MO MSU has the same composition with slightly higher proportion of bicarbonates, nitrates, sulfates, and calcium and lower proportion of chlorides and sodium, probably due to smaller amounts of DISs, which is also confirmed by low mineralization of meltwater on these territories as compared to other roads.
Water supply in the snow cover next to the roads is average 80 L/m2, slightly decreasing in the yards (79 L/m2) and the MO MSU (77 L/m2). Water supplies in the background snow cover are lower and amounts to 67 L/m2 as a result of partial snow blowing by the wind. Snow cover in the city is less susceptible to blowing due to higher density resulting from slightly higher air temperatures (heat island) and, accordingly, more frequent temperature transitions around 0 °C in March (during snow cover sampling period) and the earlier start of snow melting.

3.2. MMs Concentrations in Snow Cover

3.2.1. Dissolved Forms of MMs

Average, minimum, and maximum concentrations of MMs forms in snow cover near roads, in the yards of residential buildings, near the MO MSU, and in the background area are given in Table 2. The value of contamination factor CF (Table 3) shows the excess of MMs forms’ concentrations above the background level and, therefore, the level of snow cover contamination.
The maximum content of dissolved forms of most MMs is observed in roadside snow cover, because of vehicular impact; it gradually decreases in the yards and at the MO MSU down to minimum levels in snow cover of the background territory in the suburbs. The CF factor varies quite a lot along the roads with different traffic intensities in WAO. The snow cover is most heavily contaminated with dissolved Na, the CF of which regularly declines as the road size decreases: from 280 near the highways, 134 near the MRR and 50–70 near large, medium and small roads, and down to 28–31 in the yards of residential buildings and at the MO MSU. The main source of dissolved Na is DISs; thus, dissolved Ca and Sr actively accumulate in snow cover too. Their CFs also decline as the road size decreases: from 14–23 at the MRR and highways to 6–10 on large, medium, and small roads, and down to 3–6 in the yards and at the MO MSU. High values of correlation coefficient r for pairs Na–Cl (0.99), Ca–Cl (0.87), and Sr–Cl (0.94) indicate the entry of these metals with chloride-type DISs, applied frequently in Moscow. This is confirmed by the studies of snow cover composition in the southwestern part of Moscow, where the use of DISs contributed to a sharp increase in Na, Ca, and K concentrations [39].
Motor vehicle emissions could be an additional source of Na. Petrol Euro 3, 4, 5 and diesel Euro 3, 4 vehicles emit up to 1310 μg Na per 1 km [80]. Strontium is probably an impurity in DISs, since this metal is often a part of calcium compounds. Concentrations of dissolved forms of MMs in snow cover depend on the intensity of transport impact; they are also associated with different amounts of DISs applied on different roads. For example, the concentrations of Na in snow of Novi Sad (Serbia), those of Cu, Fe, Zn, and Pb in snow of Beijing (China), and those of Al, Co, Cr, Cu, Mn, and Ni in snow of Lahti (Finland) increase with larger road size, while the concentrations of Zn in Novi Sad and Cl in Beijing decrease [4,12,55].
In the western part of Moscow, several MMs showed local maxima of concentrations in the yards and at the MO MSU, where large areas are occupied by parking lots. Thus, high levels of dissolved K are probably due to the active fuel combustion during car engine idling; this is confirmed by the value of r = 0.57 between the content of dissolved K and NO3. It is known that NO3 is produced by fuel burning, in particular by motor transport [81], amounting up to 2280 μg NO3 per 1 km [80]. Even larger amounts of water-soluble NO3 are released when burning diesel fuel [82]. Therefore, K is used as an indicator of vehicle emissions when studying the composition of aerosols [83,84]. It occurs in unleaded gasoline [85] and comes abundantly with road dust, especially in tunnels, and with direct tailpipe emissions of cars [80,86,87]. Fuel burning also causes the release of V into the environment [88,89], and therefore its concentrations are high in the snow cover near parking lots. In general, MMs emissions over cruise conditions are substantially different from the emissions over a transient cycle or while idling [90].
Besides the above-mentioned Na, Ca, Sr, K, and V due to the transport impact, the snow cover near all types of roads is highly polluted (CF > 3) with dissolved Mo and Mg, with W, Co, and Ba near the MRR, with W, Sn, Bi, Co, Ni, Ba, Sb, Fe, and Ti near highways, with Sb and Co near large roads, with Cd, Mn, and Co near medium roads, and with Sb, Ba, and Ni along small roads. The possible source of these MMs could be non-exhaust vehicle emissions [91,92,93,94], which is supported by the data on the intensive enrichment of Moscow road dust and especially its fractions PM1 and PM1–10 with Sb, W, Sn, Bi, and Cd [67,95,96], and nanoscale particles of road dust enriched with Pb, Cu, Zn, Ni, Cd, Cr, Co, and Sn [97]. Therefore, the highest CF values for many of these MMs, in particular W and Sn, are characteristic of snow cover along the MRR and highways. High levels of dissolved Na, K, Mg, Fe, Al, Zn, Sr, Cu, and other MMs comparable to our data were also found in snow cover near the MRR in 2011 [48].
The most intensive accumulation of dissolved Mo and Sb in the western part of Moscow was observed in snow cover along large roads. Mo and Sb probably come with emissions from heat and power station No. 25 and other thermal power plants in WAO, as indicated by increased r coefficients in pairs Mo–Sb (0.99), Mo–SO42− (0.48), and Sb–SO42− (0.45). During long and severe frosts, fuel oil is used as an additional fuel for power plants along with natural gas, thus contributing to higher SO2 emissions [77] and increasing SO42− concentrations in snow cover. The accumulation of Mo and Sb in snow cover is also characteristic of the eastern part of Moscow, where these elements are actively emitted by heat and power stations, as well as by metalworking, mechanical engineering, and petrochemical enterprises [46].
The MO MSU and the background territory are characterized by higher concentrations of dissolved Zn and Pb compared to snow cover along the roads and in the yards. The increased content of dissolved Zn in snow cover near the MO MSU compared to roadside snow cover was indicated earlier [40]. This is probably due to the regional transfer of pollutants from urbanized areas of the Moscow Oblast and the nearest regions, to the macro-regional transfer from Europe and global migration of pollutants. It is confirmed by the data on the accumulation of metals in the dust component of background snow cover near Zvenigorod in the western part of Moscow Oblast [46], in snow cover of the background regions of the Ryazan Meshchera [98], and the Polar Plateau in Antarctica [99]. High levels of Cd at the urban reference sites not polluted by traffic compared to snow near the roads were detected in Innsbruck, due to the input of metal from non-transport sources [23]. In Moscow, the snow cover composition at the MO MSU showed 2–3 times higher content of Fe, V, Co, and Ba; minor difference in content of Al, Mn, Ni, Cu, As, and Cd; and 2–3 times lower content of Cr, Zn, Sr, and Mo compared to the territory of the Botanical Garden next to the MO MSU [40].
Different rates of CF value increment with increasing anthropogenic impact make it necessary to consider the behavior of all studied pollutants simultaneously and make an integral assessment of contamination. For this purpose, total contamination factor TCF of snow cover with dissolved and suspended MMs was calculated. The spatial distribution of TCF is shown in Figure 2.
The maximum levels of MMs contamination in the dissolved phase of snow causing extremely dangerous environmental situations (TCF > 256) are characteristic of the sections along Kutuzovskiy Avenue, Mozhaiskoye Highway (near the industrial zones Severnoye Ochakovo and Yuzhnoye Ochakovo), Rublevskoye Highway and Minskaya Street, mainly because of the application of DISs. Very high level of snow cover pollution and very dangerous environmental situations is characteristic of the MRR, Aminievskoye Highway, several medium (Molodogvardeiskaya St. near the Kuntsevo industrial zone and Bolshaya Filevskaya St. near the Fili and Western Port industrial zones) and small (Koshtoyantsa St., sampling point S20 in Figure 1) roads. Territories along almost all studied small roads and at the MO MSU have the high level of pollution (with TCF 64–128) and a dangerous environmental situation. The amount of applied DISs is lower in most yards, and the impact of transport decreases as well, but it does not completely disappear because of the presence of car parking lots. The decrease is also due to protective functions of buildings that act as barriers to air pollutant flows from the highways to the yards of residential buildings [100]. Buildings prevent the spread of emissions from vehicles, thus decreasing snow cover pollution to medium level (with TCF 32–64) and a moderately dangerous environmental situation.

3.2.2. Suspended Forms of MMs

The content of suspended forms of all MMs in roadside snow cover is higher than in snow cover of the yards, the MO MSU, and the background territory. Application of DISs on roads and further blowing of their particles by the wind leads to their inclusion into roadside snow. This accounts for the fact that the highest CF values of Ca (385, 64, and 24, respectively) were found in snow cover of the MRR, highways, and large roads, decreasing on medium roads, small roads, in yards, and at the MO MSU (21, 13, 9, and 10, respectively). Suspended forms of all MMs, except K, Mo, and Sb, are accumulated much more intensively than dissolved ones, due to enrichment of the dust component of snow cover with MMs and the high content of solid particles in snow cover. Solid particles’ input to the snow cover is due to precipitation from the atmosphere, DISs application on roads, blowing of road dust and soils particles from snow-free areas, and spraying of mud sediment from the surface of roadways during snow melting. Resuspended road dust is reported to be one of the most important sources of microparticles in the atmosphere; for example, in Bogota, it supplies about 23% of the mass of PM10 particles [101] and in the USA, more than a half of PM10 and about a quarter of PM2.5 particles [102]. In Paris, the contributions of road dust emissions were estimated to be 13% of atmospheric PM10, while the sum of vehicle exhaust and wear accounted for 47% of PM10 [103]. Moreover, for the north cities, the spraying of mud sediment from the surface of roadways is an essential source of suspended particles and MMs in roadside snow cover [21].
On large roads, dissolved Mo and Sb accumulate more intensively compared to its suspended forms, which is probably due to the increased pH of snow meltwater (an average of 8.6 on large roads, 8.0–8.4 on other roads). These elements are typical anionogenic elements and migrate well in alkaline conditions, so the higher pH values could contribute to the acceleration of their dissolution [104]. A positive correlation of dissolved Mo content with pH values of river water and snow was also found in the basins of rivers flowing into the Gulf of Bothnia [105].
Smaller roads have lower traffic intensity, resulting in a decrease of accumulation of suspended MMs forms. Ca, W, Co, Ti, Mg, Sr, Na, Mo, Al, Fe, Zn, Sb, Mn, As, Ba, Cu, Cr, Ni, Rb, Sn, and K are accumulated intensively (CF > 50) in snow cover near the MRR. The CF decreases sharply for all MMs along the highways, reaching 64 for Ca, 27–47 for W, Co, Ti, Sr, V, Mg, and Na and less than 25 for other MMs. Along large and medium roads, the CF of Ca, W, Cu, Mo, Zn, Sr, Co, Sn, Sb, Mg, V, Ti, As, Na, Cu, and Fe decrease to 10–25, and to 5–17 near small roads. Higher content of solid particles in snow cover at the MO MSU leads to the increase in CF values for Zn, Mo, Cr, Sr, V, Pb, and Ca up to 10–16, as compared with the yards where CF values of these MMs are 5–9. High levels of Zn at the MO MSU are probably due to the influence of transport, since car parking lots are located nearby, where intense accumulation of the metal is typical [106]. Our studies on the chemical composition of dust component in snow cover of the eastern industrial part of Moscow showed that the following MMs are the ones that accumulate most intensively (the CF value is written in subscript): Mo19Sb4.9As4.6W4.3Sn3.6V2.1Fe2.1Cr2.0 [46]. However, foregoing data include areas with low levels of snow cover pollution, namely recreational and agricultural zones; therefore, CF levels for MMs are lower than those obtained for the traffic zone in the western part of the city.
The TCF values of suspended MMs increase considerably and the levels of environmental hazard increase by one gradation at many points, as compared to the total pollution of snow cover with dissolved forms. The highest increase of TCF for suspended forms is at the MRR, where the extremely dangerous environmental situation and the maximum TCF values were found, ranging from 761 in the northern part of the study area (4.5 times higher than the TCF for dissolved MMs forms) to 1296 on the average (6 times higher) and 7580 in the southern part (39 times higher). In other territories, the growth of TCF for suspended forms relative to the dissolved ones is less pronounced, reaching 1.2 to 3 times. The exception is Rublevskoye Highway, where the TCF is almost 6 times lower due to the low dust content in snow cover (12 mg/L compared to 102 mg/L near the MRR). The low dust content in snow cover could be attributed to the large distance of sampling point from the highway itself—there is both an alternate route and a car parking lot on the roadside, which separate the sampling point from the highway.
Extremely high snow cover pollution on the territory near the intersection of the MRR and Leninskiy Avenue, one of the busiest highways in Moscow, is probably the result of very intense MMs inflow with vehicle emissions (enormous numbers of cars and traffic congestions), as well as the blowing of contaminated road dust microparticles. An extremely dangerous situation (TCF > 256) also occurs on Kutuzovskiy Avenue, Mozhaiskoye and Aminievskoye highways, and a number of large (Minskaya and Mosfilmovskaya streets) and medium (Molodogvardeiskaya and Bolshaya Filevskaya streets—sites S16 and S12 in Figure 1, respectively) roads. In the yards of residential buildings, snow cover pollution with suspended forms of MMs as compared to dissolved ones increases to the high level (TCF 64–128), and to very high level (TCF 128–256), and very dangerous environmental situation for small and some medium roads.
Thus, snow cover pollution on the roadside territories in the western part of Moscow is mainly due to particulate matter. It is enriched with Ca, W, Co, V, Sr, Ti, Mg, Na, Mo, Zn, Fe, Sb, and Cu. The MMs content in suspension along the roads is on average 25 times or more above the background. Na, Sr, Ca, K, Mo, Sb, and W are the main dissolved pollutants; their content in the snow of certain areas of the WAO is six or more times above the background level. The spatial pattern of the total contamination factor TCF is characterized by the formation of common centers of abnormally high values for both dissolved and suspended MMs forms on the MRR, Kutuzovskiy Avenue, Rublevskoye, Mozhaiskoye, and Aminievskoye highways and some other streets. The anomalies appear due to the application of DISs, vehicle emissions, as well as the impact of enterprises in the adjacent industrial zones, such as Severnoye Ochakovo, Yuzhnoye Ochakovo, Kuntsevo, Fili, and Western Port.

3.3. Partitioning of MMs

Studying the ratio of MMs forms is important for predicting the pollutants’ behavior during and after snowmelt, since the dissolved phase has a higher migratory ability. Therefore, the risk of contamination greatly depends on the MMs’ ability to transform from a non-dissolved phase to a dissolved one. To define the predominant phase of elements in snow, the share of their dissolved phase, or solubility (Kz, %) was calculated: Kz = 100% · Cdis/(Cdis + Csus), where Cdis is the concentration of dissolved phase of MMs, μg/L; Csus is the concentration of suspended phase, μg/L.
Most MMs in snow cover of the background territory prevail in dissolved form: the proportion of dissolved forms of Ca, Zn, Na, Cd, Ni, As, Cu, and Sr is more than 85%; 60–70% for Sb, Co, Mg, Mn, and Ba, and 52–56% for Rb and Mo (Figure 3). These MMs are most likely washed out from the atmosphere and could enter the snow cover during in-cloud processes, i.e., elements’ sorption on snowflakes inside the cloud [107]. Another source is washing out from the atmosphere with an ultrafine (<0.45 μm) fraction of aerosols, which passes through filters in the process of snow meltwater filtration in the laboratory. The predominance of dissolved forms of MMs could also be attributed to a slightly acidic reaction (pH 5.6) of snow meltwater in background areas, as the cationogenic Ca, Zn, Na, Cd, Ni, Cu, Sr, Co, Mg, and Ba could be easily transferred from insoluble to soluble form in acidic waters [104,108,109].
Other MMs are found predominately in suspended forms, which accounts for 80–90% of Sn and Bi, 60–80% of Ti, Al, Fe, and W, and 50–60% of Pb, V, Cr, and K. An increase in the proportion of suspended forms of MMs is related to the washout of the solid aerosol particles in the atmospheric surface layer by below-cloud scavenging processes [107]. In the background area, most of these MMs enter the atmosphere with relatively large soil particles blown from snow-free surfaces, thus contributing to higher proportion of suspended MMs forms. Thin snow cover, strong wind, and the absence of woody vegetation could significantly increase the soil particles supply to the roadside snow. Regional transport of contaminated atmospheric aerosol particles of different sizes also contributes to the higher proportion of suspended MMs forms. For example, in Northern China, Al and Fe in precipitation are mainly associated with large particles and Pb with thin ones, while K, V, and Cr have a bimodal distribution with peak concentrations within particle size intervals of 0.43–0.65 and 4.7–5.8 μm [110].
In urban areas, mass deposition of solid particles from the atmosphere and the application of DISs on roads with their subsequent blowing out and re-depositing on the surface of roadside snow cover significantly increase the role of suspended MMs forms. This is most pronounced in snow cover along roads (Figure 3), where the proportion of suspended forms is above 90% for Sn, Ti, Bi, Al, W, and Fe, 80–90% for Pb, V, and Cr, 50–80% for Rb, Mo, Mn, As, Co, Cu, Ba, Sb, Mg, and Zn. The dissolved phase prevails for K, Ni, Cd, and Sr (it accounts for 50–65%), as well as for Ca (87%) and Na (97%).
The effect of dust deposition on the increasing proportion of suspended forms of MMs is confirmed by the high significant negative coefficients of rank correlation rs between the dust load and the proportion of dissolved forms for almost all MMs: rs are less than −0.67 for all MMs, except K (−0.57), Sb (−0.56), Ni (−0.41), and insignificant for Mo, W, and Na. Insignificant correlation between Mo and W solubility and dust load is due to numerous points with concentrations below the detection limit, for these elements. Weak Na solubility correlation with amount of dust particles is due to Na input mainly with DISs and their subsequent rapid dissolution, providing for just little effect on the dust load. High positive rs between the concentrations of Cl in meltwater and the proportion of suspended forms of all MMs (rs = 0.49–0.75), except Sr (0.44), Ca (0.40), K, Ni, Mo, W (0.15–0.34), and Na (−0.28) indicate the presence of MMs as slightly soluble impurities in chloride DISs. High proportion of suspended MMs in snow cover of the WAO could be also explained by the change of subacidic conditions in background snow meltwater (pH 5.6) to neutral, weak alkaline, and even alkaline in the city (pH 7.5–8.6). Under such alkaline conditions, the cationogens Bi, Fe, Pb, Rb, Mn, Co, Cu, Ba, Mg, and Zn are poorly dissolved from the suspended particles. This is confirmed by the negative significant rs between the pH value of meltwater and the proportion of dissolved forms of Cu, Cd, Ba, Bi, Fe, Sn, Al, and W.
A comparative analysis of the chemical composition of atmospheric dust, snowmelt-runoff, and rainfall-runoff in Beijing showed the leading role of dust in the formation of precipitation composition. Its presence in the snow cover results in the predominance of suspended forms of pollutants [12]. High proportions of many MMs in the suspension along with the dissolved forms of Na, K, Ca, Sr, and Sb were also identified in snow cover on the windward slope of the Salt Lake Valley (central Wasatch Mountains), Utah, USA [111]. The predominance of suspended forms of most MMs seems to be typical of urban areas, as supported by the data on Cr, Pb, Cu, Ni, Al, and Fe in snow in Östersund [15] and on Pb, Cu, Zn, and Cd in snow in Luleå and Umeå, Sweden [16].
Concentrations of Al, Fe, Mn, and V in snow cover of the traffic zone increase with increasing particle size reaching the maximum in particles >1000 μm, while the concentrations of Zn and Pb are the highest in particles < 100 μm [21]. This trend is observed even in small cities with no industrial enterprises, where the increasing contributions of 0.45–1.2 μm, 1.2–8 μm, and >8 μm fractions to the total concentrations of these MMs in snow cause lower proportion of dissolved forms of Al, Si, Mn, Fe, and Zn compared to the background territories, as shown by the Valday case study [112]. A summary of the results of studies on the chemical composition and the ratio of pollutants in water runoff from roads at 294 monitoring points on six continents showed that Pb and Cr predominate in road runoff in suspended form, while Zn, Cu, Ni, and Cd in dissolved form [14]. At the same time, the proportion of suspended forms of MMs in snow meltwater is usually greater than in rainwater [113].
The MRR stands out among all types of roads of the WAO in terms of the ratio of MMs forms in snow cover—the highest proportion of suspended forms of all MMs was recorded next to this highway. Mass input of dust particles leads to the dominance of suspended form for most MMs in snow cover (more than 85%); only Cd and Sr account for 72–77%. Ca and Na entering snow cover with easily soluble DISs prevail in dissolved forms (61% and 86%, respectively). Medium roads, similar to the MRR, are characterized by a significant proportion (>80%) of suspended forms for Sn, Ti, Bi, Al, W, Fe, Pb, V, Cr, and Mo and relatively low ones for Zn and Cd (43% and 31%, respectively). A high proportion of dissolved Zn reaching 70% is typical of traffic area runoff [14], and of dissolved Cd and Zn for snowmelt water, in which the solubility of these metals could reach 100% and 81%, respectively [15]. The ratio of MMs forms on large, small roads, and highways is scarcely different from the average level for all WAO roads.
Anthropogenic load in the yards and at the MO MSU is less pronounced compared to roads; it is evident from the content of solid particles in snow meltwater (15 and 17 mg/L compared to 48 mg/L on the roads). Therefore, the contribution of suspended MMs to the total content of elements in snow cover decreases. The MO MSU is located between two small roads—Academician Khokhlov Street and Michurinskiy Alley, used for the passage and parking of vehicles of the MSU employees. Thus, the ratio of suspended and dissolved MMs forms is close to that in the yards. At the same time, the share of dissolved Cd, K, Zn, Mg, Ba, Cu, and Rb increases by 10% and more in snow cover at the MO MSU and in the yards of residential buildings compared with roads. The source of these MMs could be fine particles (less than 0.45 μm) emitted during the heating of car engines at car parking lots in the yards and near the MO MSU.
This is confirmed by laboratory studies on the influence of air temperatures and the operation modes of car engines on snow pollution with particulate matter and MMs. The studies have shown that motor vehicles emissions enrich snow with particles of 50–400 nm, which are high in MMs content [19]. Therefore, when a solid phase is separated from meltwater using filters with 0.45 μm pore diameter, a large number of fine MMs-contaminated particles enters the dissolved phase. Nanoparticles account for 71% of the total number of particles with 3 nm to 10 μm diameter in snow of Montreal, and up to 19% of particles are less than 100 nm [114]. Particle number density of ultrafine particles (0.01–0.1 μm in diameter) in snow is dozens and hundreds of times larger than that of 0.1–0.2 μm and 0.2–0.5 μm particles. However, a significant proportion of Al, Cr, Mn, Co, Ni, Cu, As, Cd, and Pb is in suspended form, that is, it is associated with particles larger than 0.2 μm, although the ultrafine fraction also plays an important role in the formation of total MMs content in snow [22].
Study of the composition of atmospheric particles in Hong Kong revealed that the proportion of water-soluble MMs in PM2.5 fraction is 10–25% higher than in the PM10 fraction. Moreover, Ca, Mg, Cd, Zn, V, Cu, Mn, and Ni prevail in dissolved form in PM2.5 fraction, compared to just Ca, Mg, Cd, and Zn in PM10 [84]. Residential buildings often form enclosed spaces, or “well traps,” in which the migration of particles in the atmosphere diminishes sharply and soil pollution with MMs in the yards increases [100] due to deposition of fine particles, thus contributing to a higher proportion of dissolved forms of MMs in snow cover. Probably for the same reason, the proportion of dissolved forms of most MMs (except Ni, K, and Mg) in snow cover of the yards is higher than at the MO MSU. The traffic intensity at car parking lots is low—even near stores, the vehicles’ turnover usually does not exceed 50 units per day per 1 parking place [115]; nevertheless, the runoff from these areas is usually highly enriched with many MMs as compared to highways with light traffic intensity [14].
Thus, Sn, Ti, Bi, Al, W, Fe, Pb, V, Cr, Rb, Mo, Mn, As, Co, Cu, Ba, Sb, and Mg dominate in suspended form in snow cover in the western part of Moscow. Ca and Na prevail in the dissolved form, and the contribution of suspended and dissolved forms of Zn, K, Ni, Cd, and Sr to their total content ranges from 40 to 60%, that is, they lack a clearly pronounced predominant form of occurrence.

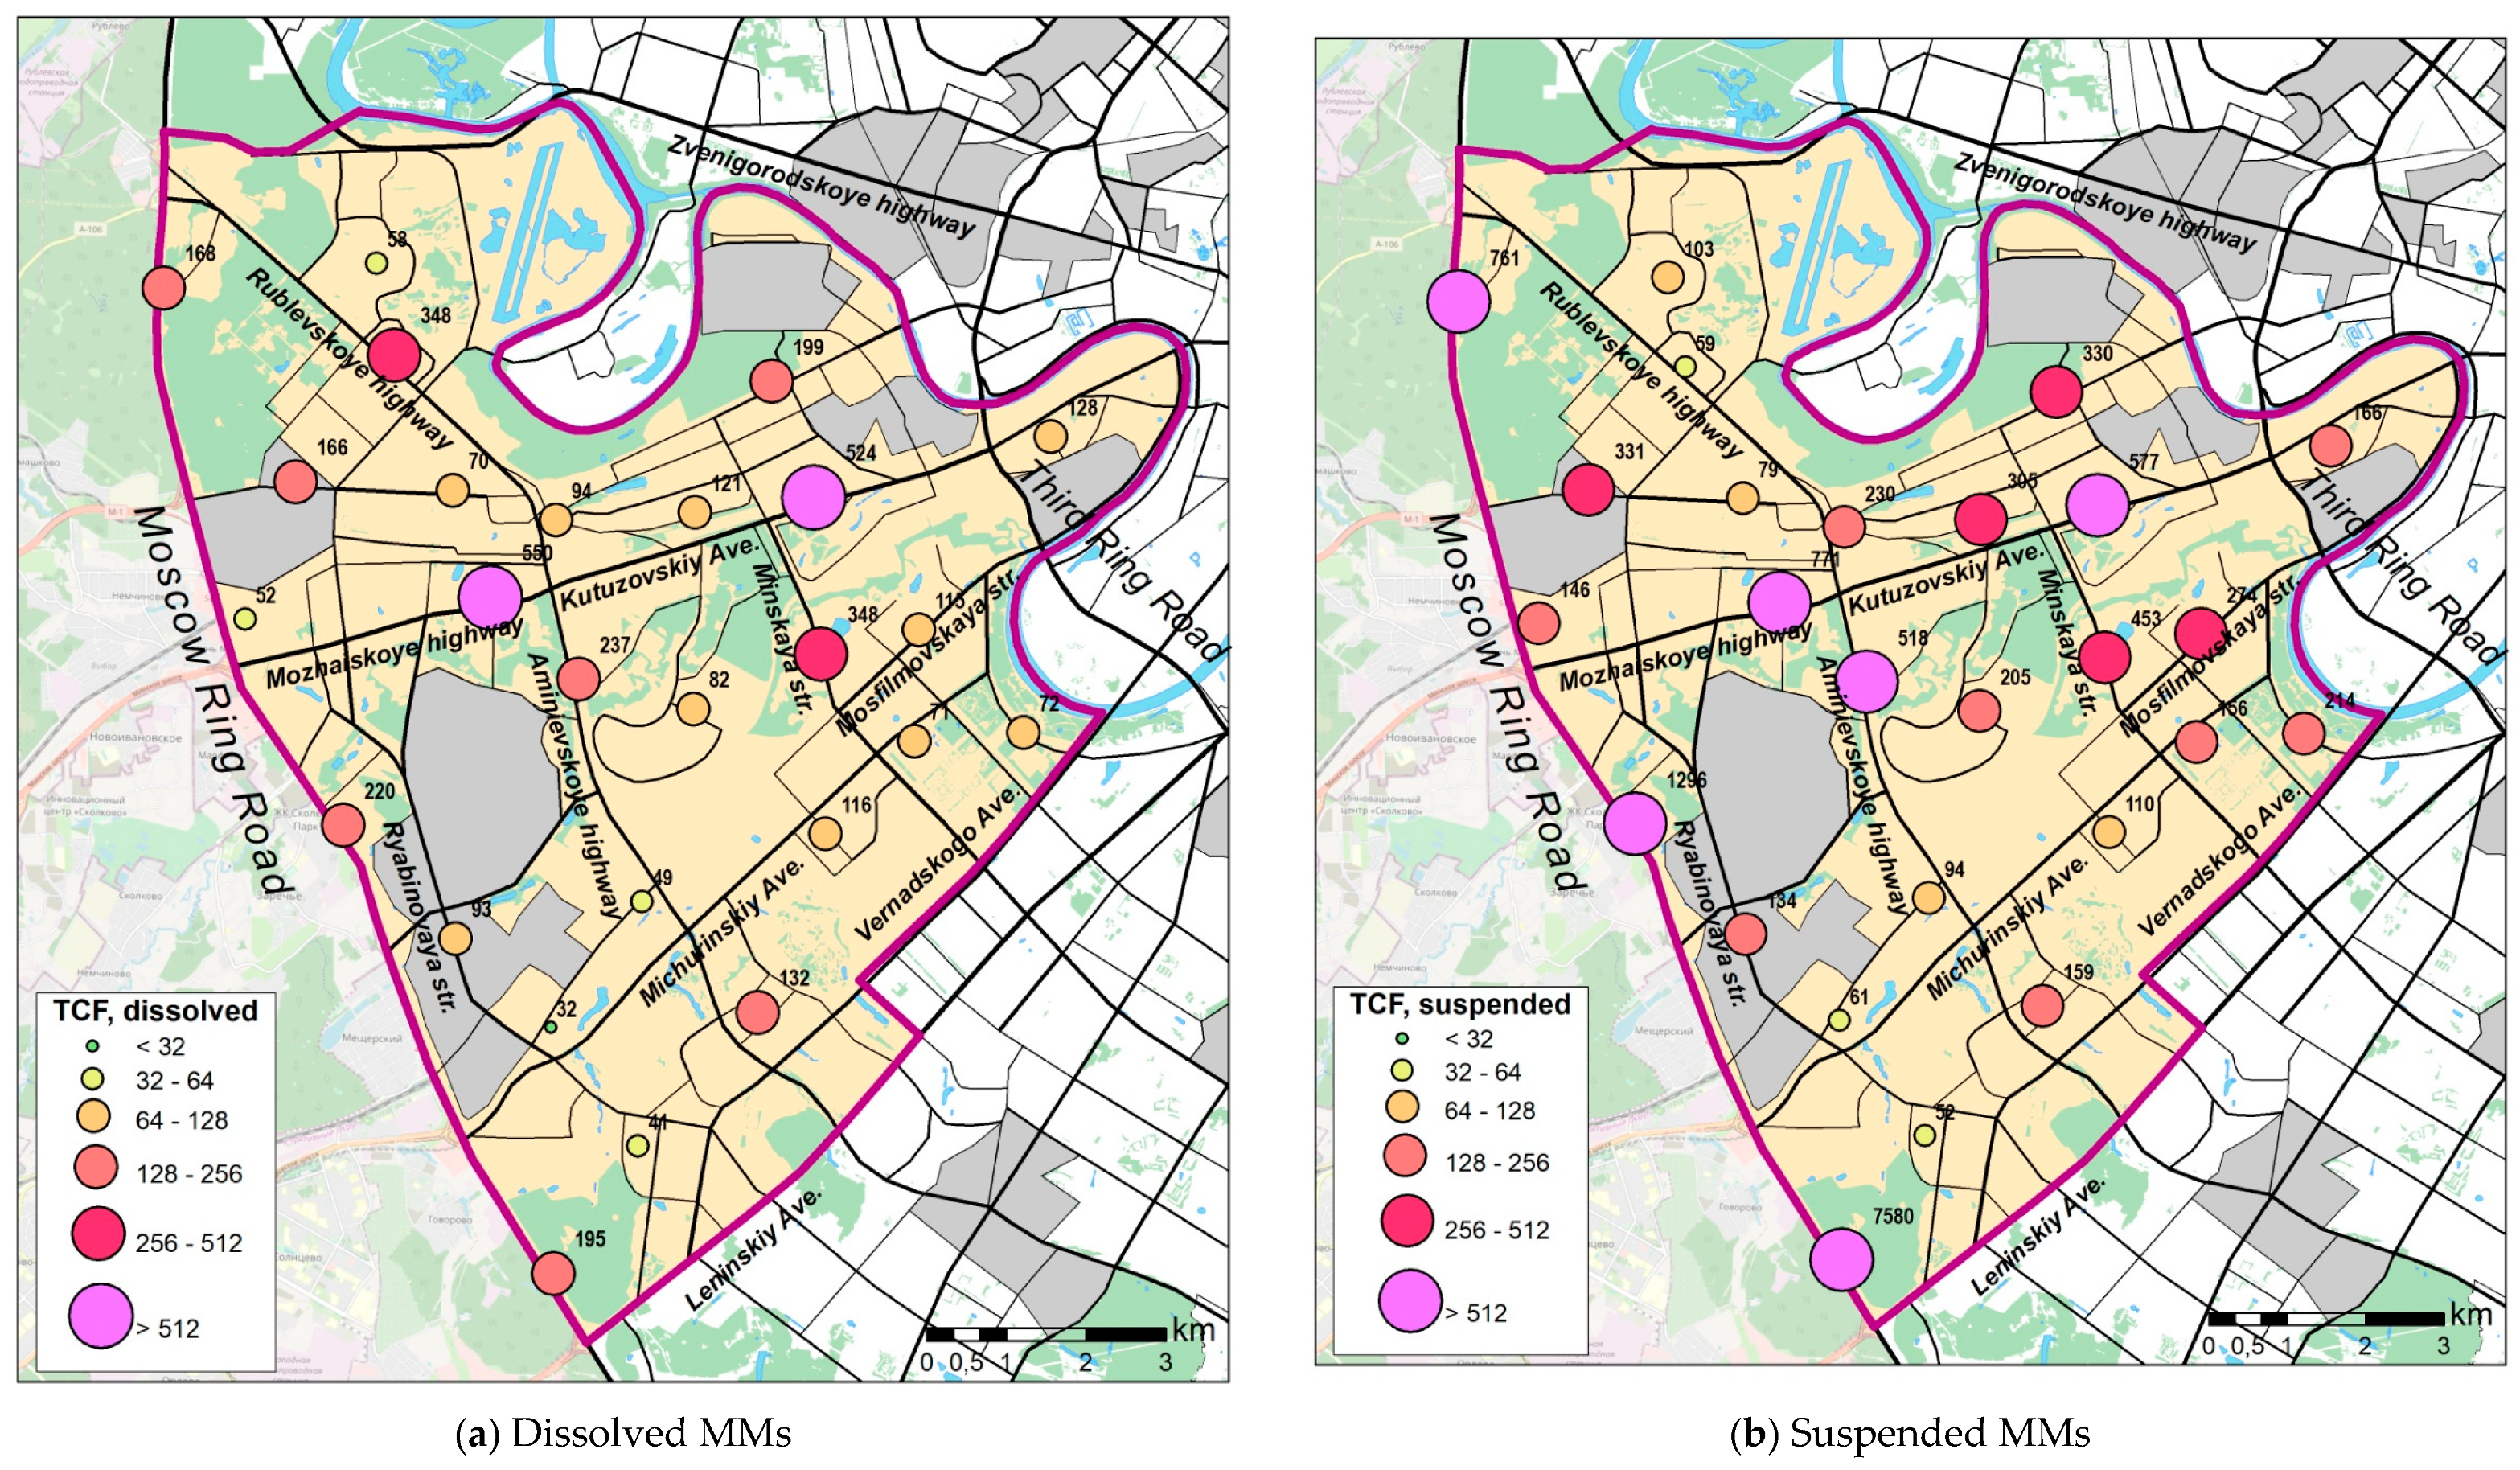
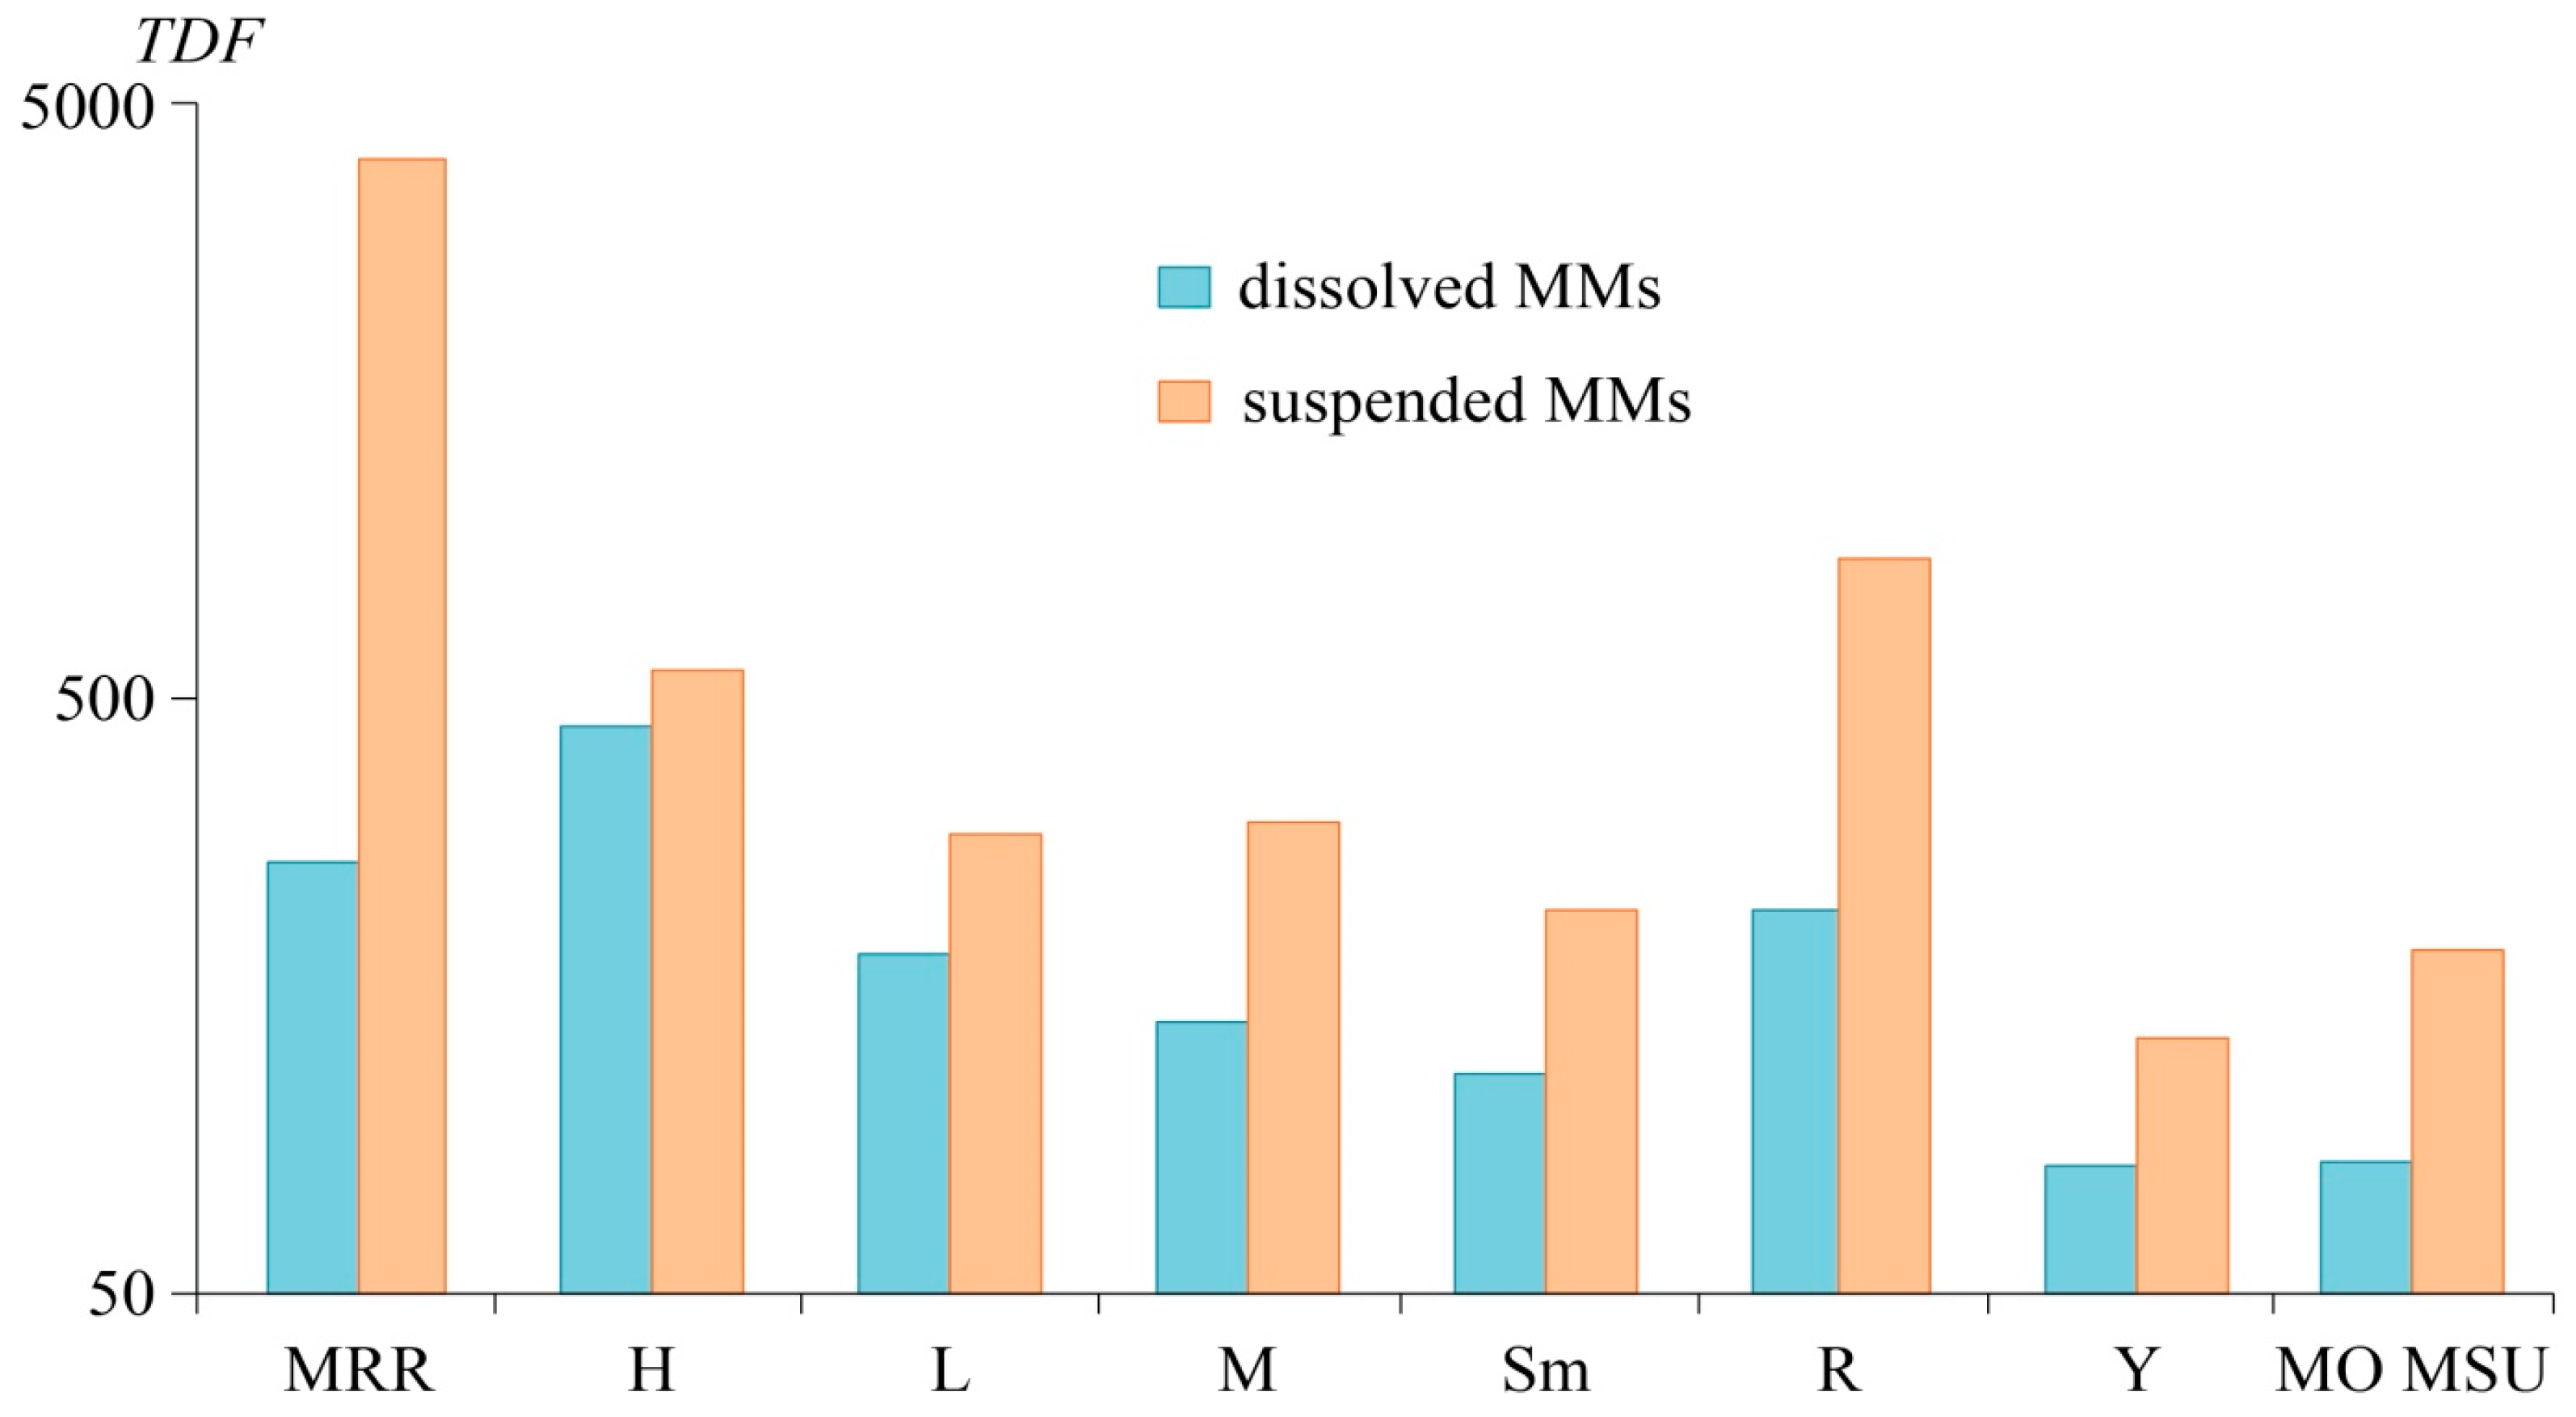
3.4. Deposition Rates of Dissolved and Suspended MMs

To assess geochemical impact on the components of urban landscapes during the snow occurrence period, it is necessary to determine the accumulated supplies of MMs released during snow melting. The content of particulate matter and MMs in snow meltwater of urban areas is greater than in rainfall-runoff, indicating the crucial role of snow melting for the formation of chemical composition of river runoff [12,15]. Snow-covered areas near different types of roads, in the yards, and in the background territory are quite different, because the city territory is severely fragmented by the road network and buildings. Therefore, the correct comparison of the supplies of pollutants in snow cover of different territories is only possible using specific parameters (per unit area). Normalizing of supplies by the number of days of snow occurrence shows the accumulation of pollutants per unit area and per time unit, i.e., the daily intensity of deposition (flux) of pollutants from the atmosphere. Since the concentrations of dissolved and suspended forms of MMs are expressed in μg/L, data on water content in snow cover in L/m2 are used to estimate the intensity of pollutants deposition.
The mean, minimum, and maximum values of the dissolved and suspended forms of MMs deposition from the atmosphere near the roads, in the yards of WAO, at the MO MSU, and in the background area are given in Table 4.
High levels of daily deposition in dissolved form are typical for major elements in precipitation, namely Na, Ca, K, and Mg; elements of the upper continental crust, i.e., Al and Fe, as well as Ti, are added to them if we consider the deposition in suspended form. Deposition of dissolved Na, Ca, Sr, Mo, K, W, Sb, V (DF > 5) and suspended Ca, W, Co, V, Ti, Sr, Mg, Na, Mo, Zn, Fe, Sb, Al, Cu, As, Sn, Ba (DF > 25) in roadside snow cover showed the largest excess above the background values. The list of priority pollutants is shorter at car parking lots in the yards of residential buildings of the Moscow WAO and the MO MSU. In the yards compared to the background areas, the highest excess of deposition rates are found for dissolved Na, K, and Sr (DF > 5) and suspended Ca, Sn, and Mo (DF > 10), while dissolved Na, K, Sr, and V and suspended Zn, Mo, Cr, Sr, V, Pb, Cu, Ca, As, Sn, and Sb are characterized by the highest excess of deposition rates at the MO MSU, compared to the background areas. Thus, the snow cover composition and MMs deposition intensity for the MO MSU territory showed intermediate values between yards and roads. This is mainly due to the amount and composition of deposited dust within MO MSU, since the distribution pattern of the dissolved forms is practically similar to the yards.
The total excess of MMs deposition rates over the background level is represented by the integral TDF index. For the dissolved MMs phase, the TDF value depends on the size of the road: it is maximum for the highways (446), on the MRR it is 264; it decreases to 186 on large roads, to 143 on medium roads and to 116 on small ones (Figure 4).
High TDF values are marked for Kutuzovskiy Avenue and Mozhaiskoye highway—648 and 529, respectively (Figure 5). Increased values of the integral index (TDF > 250) were also calculated for the MRR, Rublevskoye, and Aminievskoye highways and Minskaya Street (a large road). TDF values are approximately the same in the yards and at the MO MSU (82 and 83, respectively). In addition, the changes in TDF values are determined by the accumulation of Na: the share of this metal to TDF is 67–68% for the MRR and the highways, decreasing to 59% for medium roads due to the less intensive use of DISs, to 51% for small roads, 45% in the yards, and 38% at the MO MSU. However, the contribution of Na is only 38% for large roads, because of the intensive input of dissolved forms of Mo and Sb (DF 40 and 19, respectively). A significant contribution of Ca, Sr, and K is common to all types of roads.
The maximum value of the integral TDF index for suspended phase, reaching 4039, is found for the MRR, due to intense deposition of a wide range of MM, among which (DF > 100, and written in subscript) are Ca491W328Co281Ti261V261Sr255Mg246Na243Mo173Al161Fe153Zn147Sb140Mn113 Ba109As105. Similar to suspended MMs, TDF values for dissolved MMs decrease with diminishing road size: it is 553 for the highways, 294 and 308 for large and medium roads, respectively, 220 for small ones and 135 for the yards (Figure 4). The highest TDF values at all points studied on the MRR and the increased values (TDF > 500) on Kutuzovskiy Avenue, Mozhaiskoye and Aminievskoye highways, and Minskaya Street (Figure 5) evidence that the anomalies of dissolved and suspended MMs depositions generally coincide. Lower TDF values of suspended MMs on Rublevskoye highway could be caused by the low content of solid particles in meltwater (12 mg/L compared to 78–102 mg/L in snow cover next to the MRR, 170 mg/L along Kutuzovskiy Avenue and 95 mg/L along Mozhaiskoye highway).
The TDF value for suspended MMs within the MO MSU area lies between values for small roads and yards and equals to 189. There is no particular element leading in its contribution to TDF in suspended phase compared with dissolved one: the input of Zn averages 10%, those of Ca, V, Cr, Cu, As, Sr, Mo, Sn, Sb, and Pb—6–8%, and 5% or less of other MMs. On the roads, the contribution of Ca is 7–13%, W—7–10%, Mo and Cu—below 9%, Co and V—below 8%, Sn and Ti—below 7%, Sb, Zn, Sr, Mg, and Na—below 6%, and the rest MMs—5% or less. In the yards, the contribution of Ca is 9%, Mo, Sn, Sb, W, V, Zn, As, Ti, and Sr—6–8%, and the rest MMs—5% or less.
The average TDF value for suspended forms is 864; the elements form the following series in terms of DF values: Ca100W71Co56V54Ti52Sr52Mg49Na48Mo43Zn36Fe34Sb33Al32Cu30As26Sn25Ba25Mn23Rb19 Cr17K17Ni16Cd11Bi10Pb7. This pattern of deposition differs from what we received earlier for the roads of the Eastern Administrative Okrug of Moscow, where the TDF value for suspended MMs was 609 with the following excesses of deposition over the background: Mo380W45Sb31As27Sn18Fe15Sr14V13Co11 Cr11Mn10Ni9Ti8Zn8Cu7Bi6Ag6Cd5Be4Pb3 [46]. However, the calculation of TDF in the Eastern Okrug did not consider major elements that play an important role in snow cover pollution, such as Ca, Mg, Na, K, and Al, as well as Ba and Rb. If these elements are ignored, the TDF for the Western Okrug will be 574, which is very close to its value in the eastern industrial part of Moscow.

3.5. Indication of Sources (Cluster Analysis)

Sources of dissolved and suspended MMs in the snow cover of the western part of Moscow were identified by cluster analysis (Figure 6). Seven MMs associations were distinguished for dissolved forms, i.e., Cl–Na–Sr–Ca (r = 0.86–0.99), Mg–HCO3 (r = 0.50), Mo–Sb–SO42− (r = 0.45–0.99), K–NO3 (r = 0.57), Mn–Cd–Cu–Co–Rb (r = 0.50–0.95), Ti–Fe–Pb–Al–Sn–Bi–W (r = 0.78–0.97), Cr–Ba–Ni (r = 0.82–0.87); no associations for V and Zn were found. It is well known that coarse particles in the snow are carried over shorter distances compared to fine particles (< 0.45 μm), so their composition is more uniform and depends mainly on the adjacent sources. Therefore, fewer associations of suspended forms of MMs are formed compared to dissolved ones (4 vs 7), but they contain greater number of MMs, i.e., Ni–Al–Mg–Ti–Ca–Sr–Mn–Co–W–K–Rb–Ba–Ni–Fe–V (r = 0.94–0.99), Cr–Zn (r = 0.97), Mo–Sb–Cd–As (r = 0.91–0.97), Sn–Bi (r = 0.91); no associations for Cu and Pb were identified.
DISs are a most important source of MMs in the snow cover of WAO, which is clearly manifested in the associations of dissolved Cl–Na–Sr–Ca and Mg–HCO3, since Na, Ca, and Mg chlorides, as well as Ca and Mg carbonates are mainly used as DISs in Moscow [75]. Their consumption for single road treatment is 80–200 g/m2 [116]. Moscow community services apply liquid DISs at temperatures higher than −16 °C; at lower temperatures, combined ones are applied, which include marble chips (up to 50–60%), and crystals of calcium chloride and formic acid salts. The solubility of marble is low, but it increases with diminishing size of its chips in the presence of dissolved calcium chloride and pavement particles [70]. Only combined DISs are approved for application in the yards, grounds surrounding residential buildings, sidewalks, and pedestrian streets of Moscow. DISs and the construction dust of carbonate composition could also be a source of Sr, since this metal is often contained in Ca and Mg carbonates [117].
Large amounts of MMs accumulate in snow cover as a result of soil and road dust particles transfer. They are resuspended from the road surface during long snowless periods and from the snow-free areas [4], as well as when cars spray particles of contaminated material accumulated on the road surface and consisting of snow, DISs, dirt from the car wheels, and a large mass of soil particles [21]. Input of a large group of MMs as a result of blowing and splashing mud material from the surface of roads is indicated by the formation of associations of suspended Ni–Al–Mg–Ti–Ca–Sr–Mn–Co–W–K–Rb–Ba–Ni–Fe–V and dissolved Ti–Fe–Pb–Al–Sn–Bi–W. Thus, Al, Ti, Fe, Mn, Rb, and K come predominantly with soil particles upon blowing [118,119,120]; Na, Ca, Mg, and Sr—with construction dust and large DISs particles; W, Sn, Bi, Co, Ni, Ba, Pb, and Ti—with various size fractions of road dust [67,95,119,121,122,123,124,125].
The input of elements into snow cover from roadside areas is difficult to separate from their entry with car emissions, since both road dust and roadside soils are partly polluted with MMs by vehicles emissions. Therefore, wear of brake pads and other metal parts of vehicles leads to the formation of associations of dissolved Cr–Ba–Ni and suspended Cr–Zn, and probably dissolved Mo–Sb–SO42– together with suspended Sn–Bi and Mo–Sb–Cd–As in roadside snow. The assumption is supported by the results of studies in which Ba, Zn, Sb, Sn, Mo, Bi, Cr, and Ni were proved to be indicator elements for such effects of motor vehicles [91,93,118,120,126,127,128,129,130]. Ba and Sb sulphates used as a friction modifier in the production of brake linings [131], as well as antimony sulfide (III)–Sb2S3, which is a component of brake lubricant [92] could be sources of sulfate ion in snow cover.
Abrasion of tires and the roadway surface causes the formation of the association of dissolved Mn–Cd–Cu–Co–Rb in roadside snow cover of the Moscow WAO. These MMs are often used as indicators of this type of transport impact [89,93,118,126,127]. In addition, Zn, Cr, Mo, and Sb are indicators of tire abrasion [122,127], while Cu, Cd, and Mn indicate brake pads and linings wearing [89,119,121,122,126]. However, the consideration of brake pads abrasion and tire wear as separate factors is rather questionable because they form a wide range of MMs associations. Therefore, the abrasion of brake pads and tires is sometimes classified as a single “vehicle abrasion” factor [118].
Vehicle exhausts contribute to the formation of dissolved K–NO3 association in roadside snow cover. Most commonly, the input of K is attributed to the combustion of organic residues, biomass, or coal [132,133,134]. However, there are no significant sources of biomass combustion within the WAO territory, and power plants burn mainly natural gas in winter, so the input of K and NO3 from vehicles seems more likely. Moreover, significant correlations of NO3 with dissolved Cu (r = 0.62) and Rb (r = 0.42), and of dissolved K with dissolved forms of Rb (r = 0.75), Cu (r = 0.64), Sr (r = 0.52), Co (r = 0.52), W (r = 0.47), Cl (r = 0.41), and Na (r = 0.39) are typical of snow cover in WAO. This may indicate additional input of K and NO3 with DISs (in the form of KCl, or as impurities to the DISs of chloride composition), as well as when blowing and splashing road dust and soil particles, sometimes with admixed potassium and nitrogen fertilizers.
The anthropogenic impact of industrial enterprises in the western part of Moscow is less intense than that of vehicles, but this source could contribute to the formation of dissolved Mo–Sb–SO42− association in snow cover. Despite the fact that Moscow thermal power plants burn mainly natural gas during the heating season, fuel oil is also used there during severe and prolonged frosts as an additional fuel. This contributes to higher SO2 emissions into the atmospheric air [77] and, probably, increases SO42− concentrations in snow cover.
Both the dissolved forms of V and Zn, and suspended forms of Cu and Pb could come in different amounts from all the above-discussed sources. Thus, no close associations with other MMs were found for these elements.

4. Conclusions

The undertaken studies proved the significant impact of motor transport, industrial facilities, and DISs on urban snow cover pollution. The obtained data made it possible to define in detail the snow cover pollution pattern of snow over in the western part of Moscow, which could be used to predict the after-snowmelt fate of MMs in other urban environments.
In the western part of Moscow, anthropogenic impact caused a significant increase of dust load (2–7 times), concentration of solid particles in snow cover (2–5 times), mineralization of snow meltwater (5–18 times), and the change of its ionic composition from calcium bicarbonate to calcium-sodium chloride (as compared with background snow cover).
Suspended forms of Ca, W, Co, V, Sr, Ti, Mg, Na, Mo, Zn, Fe, Sb, and Cu are primary pollutants in the traffic zone of the western part of Moscow; their concentrations in roadside snow cover are more than 25 times in excess over the background. Na, Sr, Ca, K, Mo, Sb, and W dominate among the dissolved forms, with six and more times excess over the background. The location of the anomalies of dissolved and suspended MMs concentrations matches those of the deposition of mentioned MMs forms in snow cover within the WAO. These anomalies are localized near the MRR and many large and medium roads. Na is the most important pollutant; its contribution to total deposition of pollutants increases with growing amount of DISs application—from 38–45% at the MO MSU and in the yards to 51–68% on the roads.
In WAO, the following anthropogenic sources supply different groups of chemical elements that form specific paragenetic associations of MMs in snow cover: DISs (dissolved Cl–Na–Sr–Ca and Mg–HCO3); resuspension of road dust and blowing of soil particles (suspended Ni–Al–Mg–Ti–Ca–Sr–Mn–Co–W–K–Rb–Ba–Ni–Fe–V and dissolved Ti–Fe–Pb–Al–Sn–Bi–W); wear of metal parts of the cars (suspended Cr–Zn, Mo–Sb–Cd–As and dissolved Cr–Ba–Ni, Mo–Sb–SO42−); abrasion of tires and roadway surfaces (dissolved Mn–Cd–Cu–Co–Rb); vehicle exhausts (dissolved K–NO3); and emissions of heat power plants (dissolved Mo–Sb–SO42−).

Author Contributions

All authors provided conceptualization and participated in writing the original draft and editing, D.V. performed statistical analysis of the geochemical data, D.V. and J.V. worked on the visualization, D.V. and N.K. (Natalia Kosheleva) collected the field data, N.K. (Natalia Kosheleva) and N.K. (Nikolay Kasimov) were responsible for funding acquisition, supervision, and project administration. All authors have read and agreed to the published version of the manuscript.

Funding

Research on snow cover pollution with MMs was financially supported by the Russian Geographical Society and Russian Foundation for Basic Research (contract number 03/2019/RGS-RFBR, project number 17–05–41024 RGS_a). Investigation of MMs partitioning in snow cover was financially supported by the Russian Science Foundation (grant number 19–77–30004).

Acknowledgments

The authors express their gratitude to Mikhail Uzor, Dmitry Cherkasov, and Galina Shinkareva for assistance with the fieldwork; to Lilia Bezberdaya, Tatiana Dubrovskaya, Ksenia Nabelkina, and Alexander Ryzhov for help with laboratory measurements; and to Lyubov’ Dobrydneva and Elena Terskaya for the analysis of ionic composition of snow.

Conflicts of Interest

The authors declare no conflict of interest.

References

  1. World Health Organization. Burden of Disease from Ambient Air Pollution for 2012—Summary of Results; WHO: Geneva, Switzerland, 2014; 3p. [Google Scholar]
  2. Raaschou-Nielsen, O.; Andersen, Z.J.; Beelen, R.; Samoli, E.; Stafoggia, M.; Weinmayr, G.; Hoffmann, B.; Fischer, P.; Nieuwenhuijsen, M.J.; Brunekreef, B.; et al. Air pollution and lung cancer incidence in 17 European cohorts: Prospective analyses from the European Study of Cohorts for Air Pollution Effects (ESCAPE). Lancet Oncol. 2013, 14, 813–822. [Google Scholar] [CrossRef]
  3. Veremchuk, L.V.; Tsarouhas, K.; Vitkina, T.I.; Mineeva, E.E.; Gvozdenko, T.A.; Antonyuk, M.V.; Rakitskii, V.N.; Sidletskaya, K.A.; Tsatsakis, A.M.; Golokhvast, K.S. Impact evaluation of environmental factors on respiratory function of asthma patients living in urban territory. Environ. Pollut. 2018, 235, 489–496. [Google Scholar] [CrossRef] [PubMed]
  4. Vasić, M.V.; Mihailović, A.; Kozmidis-Luburić, U.; Nemes, T.; Ninkov, J.; Zeremski-Škorić, T.; Antić, B. Metal contamination of short-term snow cover near urban crossroads: Correlation analysis of metal content and fine particles distribution. Chemosphere 2012, 86, 585–592. [Google Scholar] [CrossRef]
  5. Yanchenko, N.I.; Sukhodolov, A.P.; Slutskii, S.L. Improving the monitoring of the snow cover for emission components from primary aluminum production. Metallurgist 2015, 59, 187–192. [Google Scholar] [CrossRef]
  6. Moghadas, S.; Paus, K.H.; Muthanna, T.M.; Herrmann, I.; Marsalek, J.; Viklander, M. Accumulation of traffic-related trace metals in urban winter-long roadside snowbanks. Water Air Soil Pollut. 2015, 226, 404. [Google Scholar] [CrossRef]
  7. Talovskaya, A.V.; Yazikov, E.G.; Filimonenko, E.A.; Lata, J.-C.; Kim, J.; Shakhova, T.S. Characterization of solid airborne particles deposited in snow in the vicinity of urban fossil fuel thermal power plant (Western Siberia). Environ. Technol. 2018, 39, 2288–2303. [Google Scholar] [CrossRef]
  8. Gao, Y.; Yang, C.; Ma, J.; Yin, M. Characteristics of the trace elements and arsenic, iodine and bromine species in snow in east-central China. Atmos. Environ. 2018, 174, 43–53. [Google Scholar] [CrossRef]
  9. Franz, T.P.; Eisenreich, S.J. Snow scavenging of polychlorinated biphenyls and polycyclic aromatic hydrocarbons in Minnesota. Environ. Sci. Technol. 1998, 32, 1771–1778. [Google Scholar] [CrossRef]
  10. Sillanpää, N.; Koivusalo, H. Catchment-scale evaluation of pollution potential of urban snow at two residential catchments in southern Finland. Water Sci. Technol. 2013, 68, 2164–2170. [Google Scholar] [CrossRef]
  11. Gustaytis, M.A.; Myagkaya, I.N.; Chumbaev, A.S. Hg in snow cover and snowmelt waters in high-sulfide tailing regions (Ursk tailing dump site, Kemerovo region, Russia). Chemosphere 2018, 202, 446–459. [Google Scholar] [CrossRef] [PubMed]
  12. Chen, L.; Zhi, X.; Shen, Z.; Dai, Y.; Aini, G. Comparison between snowmelt-runoff and rainfall-runoff nonpoint source pollution in a typical urban catchment in Beijing, China. Environ. Sci. Pollut. Res. 2018, 25, 2377–2388. [Google Scholar] [CrossRef] [PubMed]
  13. Telloli, C. Metal concentrations in snow samples in an urban area in the Po Valley. Int. J. Geosci. 2014, 5, 1116–1136. [Google Scholar] [CrossRef] [Green Version]
  14. Huber, M.; Welker, A.; Helmreich, B. Critical review of heavy metal pollution of traffic area runoff: Occurrence, influencing factors, and partitioning. Sci. Total Environ. 2016, 541, 895–919. [Google Scholar] [CrossRef] [PubMed]
  15. Galfi, H.; Österlund, H.; Marsalek, J.; Viklander, M. Mineral and anthropogenic indicator inorganics in urban stormwater and snowmelt runoff: Sources and mobility patterns. Water Air Soil Pollut. 2017, 228, 263. [Google Scholar] [CrossRef]
  16. Vijayan, A.; Österlund, H.; Marsalek, J.; Viklander, M. Laboratory melting of late-winter urban snow samples: The magnitude and dynamics of releases of heavy metals and PAHs. Water Air Soil Pollut. 2019, 230, 182. [Google Scholar] [CrossRef] [Green Version]
  17. Zhao, X.; Guo, X.; Mao, Y.; Yan, H.; Li, M.; Zhao, L. Chemical and mineral characteristics of melted snow-water in the Jilin Province, North-East China. J. Civ. Environ. Eng. 2016, 6, 1000248. [Google Scholar] [CrossRef]
  18. Golokhvast, K.S.; Manakov, Y.A.; Bykov, A.A.; Chayka, V.V.; Nikiforov, P.A.; Rogulin, R.S.; Romanova, T.Y.; Karabtsov, A.A.; Semenikhin, V.A. Some characteristics of dust particles in atmosphere of Kemerovo city according to pollution data of snow cover. IOP Conf. Ser. Earth Environ. Sci. 2017, 87, 042005. [Google Scholar] [CrossRef]
  19. Nazarenko, Y.; Fournier, S.; Kurien, U.; Rangel-Alvarado, R.B.; Nepotchatykh, O.; Seers, P.; Ariya, P.A. Role of snow in the fate of gaseous and particulate exhaust pollutants from gasoline-powered vehicles. Environ. Pollut. 2017, 223, 665–675. [Google Scholar] [CrossRef]
  20. Talovskaya, A.V.; Yazikov, E.G.; Osipova, N.A.; Lyapina, E.E.; Litay, V.V.; Metreveli, G.; Kim, J. Mercury pollution In snow cover around thermal power plants in cities (Omsk, Kemerovo, Tomsk Regions, Russia). Geogr. Environ. Sustain. 2019, 12, 132–147. [Google Scholar] [CrossRef] [Green Version]
  21. Seleznev, A.; Yarmoshenko, I.; Malinovsky, G.; Ilgasheva, E.; Baglaeva, E.; Ryanskaya, A.; Kiseleva, D.; Gulyaeva, T. Snow-dirt sludge as an indicator of environmental and sedimentation processes in the urban environment. Sci. Rep. 2019, 9, 17241. [Google Scholar] [CrossRef] [Green Version]
  22. Rangel-Alvarado, R.B.; Willis, C.E.; Kirk, J.L.; St Louis, V.L.; Amyot, M.; Bélanger, D.; Ariya, P.A. Athabasca oil sands region snow contains efficient micron and nano-sized ice nucleating particles. Environ. Pollut. 2019, 252, 289–295. [Google Scholar] [CrossRef] [PubMed]
  23. Engelhard, C.; De Toffol, S.; Lek, I.; Rauch, W.; Dallinger, R. Environmental impacts of urban snow management—The alpine case study of Innsbruck. Sci. Total Environ. 2007, 382, 286–294. [Google Scholar] [CrossRef] [PubMed]
  24. Ahmed, T.M.; Bergvall, C.; Westerholm, R. Emissions of particulate associated oxygenated and native polycyclic aromatic hydrocarbons from vehicles powered by ethanol/gasoline fuel blends. Fuel 2018, 214, 381–385. [Google Scholar] [CrossRef]
  25. Charola, A.E.; Rousset, B.; Bläuer, C. Deicing salts: An overview. In Proceedings of the SWBSS 2017; Laue, S., Ed.; Verlag der Fachhochschule: Potsdam, Germany, 2017; pp. 16–23. [Google Scholar]
  26. Ke, G.; Zhang, J.; Tian, B. Evaluation and selection of de-icing salt based on multi-factor. Materials 2019, 12, 912. [Google Scholar] [CrossRef] [Green Version]
  27. Novotny, E.V.; Murphy, D.; Stefan, H.G. Increase of urban lake salinity by road deicing salt. Sci. Total Environ. 2008, 406, 131–144. [Google Scholar] [CrossRef]
  28. Snieškienė, V.; Baležentienė, L.; Stankevičienė, A. Urban salt contamination impact on tree health and the prevalence of fungi agent in cities of the central Lithuania. Urban For. Urban Green. 2016, 19, 13–19. [Google Scholar] [CrossRef]
  29. Nikiforova, E.M.; Kasimov, N.S.; Kosheleva, N.E. Long-term dynamics of the anthropogenic salinization of soils in Moscow (by the example of the Eastern district). Eurasian Soil Sci. 2014, 47, 203–215. [Google Scholar] [CrossRef]
  30. Nikiforova, E.M.; Kasimov, N.S.; Kosheleva, N.E. Long-term dynamics of anthropogenic solonetzicity in soils of the Eastern okrug of Moscow under the impact of deicing salts. Eurasian Soil Sci. 2017, 50, 84–94. [Google Scholar] [CrossRef]
  31. Ordóñez-Barona, C.; Sabetski, V.; Millward, A.A.; Steenberg, J. De-icing salt contamination reduces urban tree performance in structural soil cells. Environ. Pollut. 2018, 234, 562–571. [Google Scholar] [CrossRef]
  32. Nelson, S.S.; Yonge, D.R.; Barber, M.E. Effects of road salts on heavy metal mobility in two Eastern Washington soils. J. Environ. Eng. 2009, 135, 505–510. [Google Scholar] [CrossRef]
  33. Acosta, J.A.; Jansen, B.; Kalbitz, K.; Faz, A.; Martínez-Martínez, S. Salinity increases mobility of heavy metals in soils. Chemosphere 2011, 85, 1318–1324. [Google Scholar] [CrossRef] [PubMed]
  34. Li, F.; Zhang, Y.; Fan, Z.; Oh, K. Accumulation of de-icing salts and its short-term effect on metal mobility in urban roadside soils. Bull. Environ. Contam. Toxicol. 2015, 94, 525–531. [Google Scholar] [CrossRef] [PubMed]
  35. Kul’bachevskii, A.O. Report on the State of the Environment in Moscow in 2018; Department of Nature Management and Environmental Protection of Moscow Government: Moscow, Russia, 2019; 247p.
  36. Bityukova, V.R.; Saulskaya, T.D. Changes of the anthropogenic impact of Moscow industrial zones during the recent decades. Vestn. Mosk. Unviersiteta Seriya Geogr. 2017, 3, 24–33. [Google Scholar]
  37. Elansky, N.F.; Shilkin, A.V.; Ponomarev, N.A.; Semutnikova, E.G.; Zakharova, P.V. Weekly patterns and weekend effects of air pollution in the Moscow megacity. Atmos. Environ. 2020, 224, 117303. [Google Scholar] [CrossRef]
  38. Vinokurov, S.F.; Tarasova, N.P.; Trunova, A.N.; Sychkova, V.A. A comprehensive analysis of the content of heavy rare-earth elements and platinum in snow samples to assess the ecological hazard of air pollution in urban areas. Dokl. Earth Sci. 2017, 475, 771–774. [Google Scholar] [CrossRef]
  39. Dryabzhinskiy, O.; Zubkova, V.; Lebedeva, M. The chemical composition of snow as a component of the environment in the South-Western administrative district of Moscow. In Proceedings of the 25th International Scientific Conference on Economic and Social Development—XVII International Social Congress (ISC-2017), Moscow, Russia, 30–31 October 2017; pp. 58–68. [Google Scholar]
  40. Bogatyrev, L.G.; Zhilin, N.I.; Samsonova, V.P.; Yakushev, N.L.; Kirillova, N.P.; Benediktova, A.I.; Zemskov, P.I.; Karpuhin, M.M.; Ladonin, D.V.; Vartanov, A.N.; et al. Long-term monitoring of snow cover within natural and urbanized landscapes of the Moscow region. Vestn. Mosk. Unviersiteta Seriya Geogr. 2018, 2, 85–96. [Google Scholar]
  41. Voronina, L.P.; Morachevskaya, E.V.; Akishina, M.M.; Kozlova, O.N. Evaluation of environmental health of the Kolomenskoye Park under anthropogenic pressure from Moscow City. J. Soils Sediments 2019, 19, 3226–3234. [Google Scholar] [CrossRef]
  42. Khaustov, A.; Redina, M. Polycyclic aromatic hydrocarbons in the snow cover of Moscow (case study of the RUDN University campus). Polycycl. Aromat. Compd. 2019, 1–12. [Google Scholar] [CrossRef]
  43. Sokolov, L.S.; Astrakhan, E.D. Contamination of Moscow area by metals. Priroda 1993, 7, 68–73. [Google Scholar]
  44. Kasimov, N.S.; Perel’man, A.I.; Evseev, A.V.; Golubeva, N.I.; Nikiforova, E.M.; Lazukova, G.G. Ecogeochemistry of Urban Landscapes; Kasimov, N.S., Ed.; Moscow University Publishing House: Moscow, Russia, 1995; 336p. [Google Scholar]
  45. Klimenko, I.A.; Poliakov, V.A.; Sokolovskiĭ, L.G.; Aksenova, O.I.; Skvortsova, O.I.; Okhrimenko, S.E. The sanitary status of natural waters on the territory of Moscow (according to the results of the examination of chemical and radionuclide composition). Gig. Sanit. 2003, 5, 7–11. [Google Scholar]
  46. Kasimov, N.S.; Kosheleva, N.E.; Vlasov, D.V.; Terskaya, E.V. Geochemistry of snow cover within the Eastern district of Moscow. Vestn. Mosk. Unviersiteta Seriya Geogr. 2012, 4, 14–24. [Google Scholar]
  47. Galitskaya, I.V.; Rumyantseva, N.A. Snow-cover contamination in urban territories (Lefortovo district, Moscow). Ann. Glaciol. 2012, 53, 23–26. [Google Scholar] [CrossRef] [Green Version]
  48. Lebedev, A.T.; Polyakova, O.V.; Mazur, D.M.; Bol’shov, M.A.; Seregina, I.F. Estimation of contamination of atmosphere of Moscow in winter. J. Anal. Chem. 2012, 67, 1039–1049. [Google Scholar] [CrossRef]
  49. Ermakov, A.A.; Karpova, E.A.; Malysheva, A.G.; Mikhaylova, R.I.; Ryzhova, I.N. Monitoring of the chemical composition of snow cover pollution in the Moscow region. Gig. Sanit. 2014, 5, 88–94. [Google Scholar]
  50. Ermakov, A.A.; Karpova, E.A.; Malysheva, A.G.; Mikhaylova, R.I.; Ryzhova, I.N. Monitoring of the content of heavy metals and elements in the snow cover in agricultural soils at the territory of the Moscow region. Gig. Sanit. 2015, 94, 31–36. [Google Scholar]
  51. Bobrovskiy, Y.V.; Boguslavskiy, M.V.; Bykov, V.N.; Vedenin, V.A.; Gadenin, M.M.; Glushkova, V.G.; Gorinov, M.M. Great Atlas of Moscow; Shmidt, S.O., Ed.; Feoriya: Moscow, Russia, 2013; ISBN 978-5-91796-032-6. [Google Scholar]
  52. Yushkov, V.P.; Kurbatova, M.M.; Varentsov, M.I.; Lezina, E.A.; Kurbatov, G.A.; Miller, E.A.; Repina, I.A.; Artamonov, A.Y.; Kallistratova, M.A. Modeling an urban heat island during extreme frost in Moscow in January 2017. Izv. Atmos. Ocean. Phys. 2019, 55, 389–406. [Google Scholar] [CrossRef]
  53. Lokoshchenko, M.A. Urban heat island and urban dry island in Moscow and their centennial changes. J. Appl. Meteorol. Climatol. 2017, 56, 2729–2745. [Google Scholar] [CrossRef]
  54. Lokoshchenko, M.A. Snow cover and its modern changes in Moscow. Meteorol. Gidrol. 2005, 6, 71–82. [Google Scholar]
  55. Kuoppamäki, K.; Setälä, H.; Rantalainen, A.-L.; Kotze, D.J. Urban snow indicates pollution originating from road traffic. Environ. Pollut. 2014, 195, 56–63. [Google Scholar] [CrossRef]
  56. Yuan, D.; Liu, Y.; Guo, X.; Liu, J. Characteristic contaminants in snowpack and snowmelt surface runoff from different functional areas in Beijing, China. Environ. Sci. Pollut. Res. 2018, 25, 36256–36266. [Google Scholar] [CrossRef]
  57. Cao, Z.; Zhou, X.; Ma, Y.; Wang, L.; Wu, R.; Chen, B.; Wang, W. The concentrations, formations, relationships and modeling of sulfate, nitrate and ammonium (SNA) aerosols over China. Aerosol Air Qual. Res. 2017, 17, 84–97. [Google Scholar] [CrossRef]
  58. Eremina, I.D.; Vasil’chuk, J.Y. Temporal variations in chemical composition of snow cover in Moscow. Geogr. Environ. Sustain. 2019, 12, 148–158. [Google Scholar] [CrossRef] [Green Version]
  59. NSAM № 499 AES/MS. Determination of the Elemental Composition of Rocks, Soils and Bottom Sediments by Atomic Emission and Mass Spectral Methods with Inductively Coupled Plasma; VIMS: Moscow, Russia, 2015. (In Russian) [Google Scholar]
  60. NSAM № 520 AES/MS. Determination of the Elemental Composition of Natural, Drinking, Sewage and Sea Waters by Atomic Emission and Mass Spectral Methods with Inductively Coupled Plasma; VIMS: Moscow, Russia, 2017. (In Russian) [Google Scholar]
  61. Saet, Y.E.; Revich, B.A.; Yanin, E.P.; Smirnova, R.S.; Basharkevich, E.L.; Onischenko, T.L.; Pavlova, L.N.; Trefilova, N.Y.; Achkasov, A.I.; Sarkisyan, S.S. Geochemistry of the Environment; Nedra: Moscow, Russia, 1990; ISBN 5-247-01127-9. [Google Scholar]
  62. Kasimov, N.S.; Kosheleva, N.E.; Nikiforova, E.M.; Vlasov, D.V. Benzo[a]pyrene in urban environments of eastern Moscow: Pollution levels and critical loads. Atmos. Chem. Phys. 2017, 17, 2217–2227. [Google Scholar] [CrossRef] [Green Version]
  63. Eremina, I.D.; Grigoriev, A.V. Acidity and chemical composition of snow cover in the city of Moscow and the Moscow region during 1999–2006. Vestn. Mosk. Unviersiteta Seriya Geogr. 2010, 3, 55–60. [Google Scholar]
  64. Johnson, C.C.; Demetriades, A.; Allen, M.A.; Cave, M.R.; Chenery, S.R.N.; Gowing, C.J.B.; Reeder, S.; Harrison, I. Mapping the Chemical Environment of Urban Areas; Johnson, C.C., Demetriades, A., Locutura, J., Ottesen, R.T., Eds.; John Wiley & Sons, Ltd.: Chichester, UK, 2011; ISBN 978-0-470-67007-1. [Google Scholar]
  65. Prokof’eva, T.V.; Kiryushin, A.V.; Shishkov, V.A.; Ivannikov, F.A. The importance of dust material in urban soil formation: The experience on study of two young Technosols on dust depositions. J. Soils Sediments 2017, 17, 515–524. [Google Scholar] [CrossRef]
  66. Prokof’eva, T.; Shishkov, V.; Kiriushin, A. Calcium carbonate accumulations in Technosols of Moscow city. J. Soils Sediments 2020, 1–10. [Google Scholar] [CrossRef]
  67. Kasimov, N.S.; Vlasov, D.V.; Kosheleva, N.E. Enrichment of road dust particles and adjacent environments with metals and metalloids in eastern Moscow. Urban Clim. 2020, 32, 100638. [Google Scholar] [CrossRef]
  68. Kasimov, N.S.; Kosheleva, N.E.; Vlasov, D.V.; Nabelkina, K.S.; Ryzhov, A.V. Physicochemical properties of road dust in Moscow. Geogr. Environ. Sustain. 2019, 12, 96–113. [Google Scholar] [CrossRef] [Green Version]
  69. Vlasov, D.V.; Shinkareva, G.L.; Kasimov, N.S. Metals and metalloids in bottom sediments of lakes and ponds of the eastern part of Moscow. Vestn. Mosk. Unviersiteta Seriya Geogr. 2019, 4, 43–52. [Google Scholar]
  70. Greinert, A.; Fruzińska, R.; Kostecki, J. Urban soils in Zielona Góra. In Technogenic Soils of Poland; Charzyński, P., Hulisz, P., Bednarek, R., Eds.; Polish Society of Soil Science: Toruń, Poland, 2013; pp. 31–54. [Google Scholar]
  71. Karanasiou, A.; Amato, F.; Moreno, T.; Lumbreras, J.; Borge, R.; Linares, C.; Boldo, E.; Alastuey, A.; Querol, X. Road dust emission sources and assessment of street washing effect. Aerosol Air Qual. Res. 2014, 14, 734–743. [Google Scholar] [CrossRef]
  72. Amato, F.; Alastuey, A.; de la Rosa, J.; Gonzalez Castanedo, Y.; Sánchez de la Campa, A.M.; Pandolfi, M.; Lozano, A.; Contreras González, J.; Querol, X. Trends of road dust emissions contributions on ambient air particulate levels at rural, urban and industrial sites in southern Spain. Atmos. Chem. Phys. 2014, 14, 3533–3544. [Google Scholar] [CrossRef] [Green Version]
  73. Ramírez, O.; Sánchez de la Campa, A.M.; Amato, F.; Moreno, T.; Silva, L.F.; de la Rosa, J.D. Physicochemical characterization and sources of the thoracic fraction of road dust in a Latin American megacity. Sci. Total Environ. 2019, 652, 434–446. [Google Scholar] [CrossRef] [PubMed]
  74. Singh, S.; Elumalai, S.P.; Pal, A.K. Rain pH estimation based on the particulate matter pollutants and wet deposition study. Sci. Total Environ. 2016, 563–564, 293–301. [Google Scholar] [CrossRef]
  75. Kasimov, N.S.; Vlasov, D.V.; Kosheleva, N.E.; Nikiforova, E.M. Geochemistry of Landscapes of Eastern Moscow; APR: Moscow, Russia, 2016; ISBN 978-5-904761-62-2. [Google Scholar]
  76. Eremina, I.D.; Aloyan, A.E.; Arutyunyan, V.O.; Larin, I.K.; Chubarova, N.E.; Yermakov, A.N. Acidity and mineral composition of precipitation in Moscow: Influence of deicing salts. Izv. Atmos. Ocean. Phys. 2015, 51, 624–632. [Google Scholar] [CrossRef]
  77. Elansky, N.F.; Ponomarev, N.A.; Verevkin, Y.M. Air quality and pollutant emissions in the Moscow megacity in 2005–2014. Atmos. Environ. 2018, 175, 54–64. [Google Scholar] [CrossRef]
  78. Eremina, I.D. Chemical composition of atmospheric precipitation in Moscow and the trends of its long-term changes. Vestn. Mosk. Unviersiteta Seriya Geogr. 2019, 3, 3–10. [Google Scholar]
  79. Reimann, C.; Filzmoser, P.; Garrett, R.G.; Dutter, R. Statistical Data Analysis Explained: Applied Environmental Statistics with R; John Wiley & Sons, Ltd.: Chichester, UK, 2008. [Google Scholar]
  80. Alves, C.A.; Barbosa, C.; Rocha, S.; Calvo, A.; Nunes, T.; Cerqueira, M.; Pio, C.; Karanasiou, A.; Querol, X. Elements and polycyclic aromatic hydrocarbons in exhaust particles emitted by light-duty vehicles. Environ. Sci. Pollut. Res. 2015, 22, 11526–11542. [Google Scholar] [CrossRef]
  81. Hung-Lung, C.; Yao-Sheng, H. Particulate matter emissions from on-road vehicles in a freeway tunnel study. Atmos. Environ. 2009, 43, 4014–4022. [Google Scholar] [CrossRef]
  82. Chiang, H.-L.; Lai, Y.-M.; Chang, S.-Y. Pollutant constituents of exhaust emitted from light-duty diesel vehicles. Atmos. Environ. 2012, 47, 399–406. [Google Scholar] [CrossRef]
  83. Almeida, S.; Pio, C.; Freitas, M.; Reis, M.; Trancoso, M. Source apportionment of fine and coarse particulate matter in a sub-urban area at the Western European Coast. Atmos. Environ. 2005, 39, 3127–3138. [Google Scholar] [CrossRef]
  84. Jiang, S.Y.; Kaul, D.S.; Yang, F.; Sun, L.; Ning, Z. Source apportionment and water solubility of metals in size segregated particles in urban environments. Sci. Total Environ. 2015, 533, 347–355. [Google Scholar] [CrossRef] [PubMed]
  85. Spencer, M.T.; Shields, L.G.; Sodeman, D.A.; Toner, S.M.; Prather, K.A. Comparison of oil and fuel particle chemical signatures with particle emissions from heavy and light duty vehicles. Atmos. Environ. 2006, 40, 5224–5235. [Google Scholar] [CrossRef]
  86. Cross, E.S.; Sappok, A.; Fortner, E.C.; Hunter, J.F.; Jayne, J.T.; Brooks, W.A.; Onasch, T.B.; Wong, V.W.; Trimborn, A.; Worsnop, D.R.; et al. Real-time measurements of engine-out trace elements: Application of a novel soot particle aerosol mass spectrometer for emissions characterization. J. Eng. Gas Turbines Power 2012, 134, 072801. [Google Scholar] [CrossRef] [Green Version]
  87. Pio, C.; Mirante, F.; Oliveira, C.; Matos, M.; Caseiro, A.; Oliveira, C.; Querol, X.; Alves, C.; Martins, N.; Cerqueira, M.; et al. Size-segregated chemical composition of aerosol emissions in an urban road tunnel in Portugal. Atmos. Environ. 2013, 71, 15–25. [Google Scholar] [CrossRef]
  88. Al-Momani, I. Trace elements in atmospheric precipitation at Northern Jordan measured by ICP-MS: Acidity and possible sources. Atmos. Environ. 2003, 37, 4507–4515. [Google Scholar] [CrossRef]
  89. Song, F.; Gao, Y. Size distributions of trace elements associated with ambient particular matter in the affinity of a major highway in the New Jersey–New York metropolitan area. Atmos. Environ. 2011, 45, 6714–6723. [Google Scholar] [CrossRef]
  90. Hu, S.; Herner, J.D.; Shafer, M.; Robertson, W.; Schauer, J.J.; Dwyer, H.; Collins, J.; Huai, T.; Ayala, A. Metals emitted from heavy-duty diesel vehicles equipped with advanced PM and NOX emission controls. Atmos. Environ. 2009, 43, 2950–2959. [Google Scholar] [CrossRef]
  91. Pant, P.; Harrison, R.M. Estimation of the contribution of road traffic emissions to particulate matter concentrations from field measurements: A review. Atmos. Environ. 2013, 77, 78–97. [Google Scholar] [CrossRef]
  92. Grigoratos, T.; Martini, G. Brake wear particle emissions: A review. Environ. Sci. Pollut. Res. 2015, 22, 2491–2504. [Google Scholar] [CrossRef] [Green Version]
  93. Penkała, M.; Ogrodnik, P.; Rogula-Kozłowska, W. Particulate matter from the road surface abrasion as a problem of non-exhaust emission control. Environments 2018, 5, 9. [Google Scholar] [CrossRef] [Green Version]
  94. Bencharif-Madani, F.; Ali-Khodja, H.; Kemmouche, A.; Terrouche, A.; Lokorai, K.; Naidja, L.; Bouziane, M. Mass concentrations, seasonal variations, chemical compositions and element sources of PM10 at an urban site in Constantine, northeast Algeria. J. Geochem. Explor. 2019, 206, 106356. [Google Scholar] [CrossRef]
  95. Vlasov, D.V.; Kasimov, N.S.; Kosheleva, N.E. Geochemistry of the road dust in the Eastern district of Moscow. Vestn. Mosk. Unviersiteta Seriya Geogr. 2015, 1, 23–33. [Google Scholar]
  96. Vlasov, D.V. Metals and metalloids in PM10 fraction of the road dust of Eastern Moscow. RUDN J. Ecol. Life Saf. 2017, 25, 529–539. [Google Scholar] [CrossRef] [Green Version]
  97. Ermolin, M.S.; Fedotov, P.S.; Ivaneev, A.I.; Karandashev, V.K.; Fedyunina, N.N.; Burmistrov, A.A. A contribution of nanoscale particles of road-deposited sediments to the pollution of urban runoff by heavy metals. Chemosphere 2018, 210, 65–75. [Google Scholar] [CrossRef] [PubMed]
  98. Krivcov, V.A.; Tobratov, S.A.; Vozorezov, A.V.; Komarov, M.M.; Zheleznova, O.S.; Solov’eva, E.A. The Natural Potential of the Landscapes of the Ryazan Oblast; Ryazan State University Named for S. Yesenin: Ryazan, Russia, 2011. [Google Scholar]
  99. Grotti, M.; Soggia, F.; Ardini, F.; Magi, E. Major and trace element partitioning between dissolved and particulate phases in Antarctic surface snow. J. Environ. Monit. 2011, 13, 2511. [Google Scholar] [CrossRef]
  100. Kosheleva, N.E.; Vlasov, D.V.; Korlyakov, I.D.; Kasimov, N.S. Contamination of urban soils with heavy metals in Moscow as affected by building development. Sci. Total Environ. 2018, 636, 854–863. [Google Scholar] [CrossRef]
  101. Ramírez, O.; Sánchez de la Campa, A.M.; Amato, F.; Catacolí, R.A.; Rojas, N.Y.; de la Rosa, J. Chemical composition and source apportionment of PM10 at an urban background site in a high–altitude Latin American megacity (Bogota, Colombia). Environ. Pollut. 2018, 233, 142–155. [Google Scholar] [CrossRef]
  102. United States Environmental Protection Agency National Emissions Inventory 2017. Available online: https://www.epa.gov/air-emissions-inventories/2017-national-emissions-inventory-nei-data (accessed on 21 March 2020).
  103. Amato, F.; Favez, O.; Pandolfi, M.; Alastuey, A.; Querol, X.; Moukhtar, S.; Bruge, B.; Verlhac, S.; Orza, J.A.G.; Bonnaire, N.; et al. Traffic induced particle resuspension in Paris: Emission factors and source contributions. Atmos. Environ. 2016, 129, 114–124. [Google Scholar] [CrossRef]
  104. Emelyanov, E.M. Physicochemical barriers. In The Barrier Zones in the Ocean; Springer: Berlin/Heidelberg, Germany, 2005; pp. 15–24. ISBN 978-3-540-25391-4. [Google Scholar]
  105. Bauer, S.; Conrad, S.; Ingri, J. Geochemistry of tungsten and molybdenum during freshwater transport and estuarine mixing. Appl. Geochem. 2018, 93, 36–48. [Google Scholar] [CrossRef]
  106. Adamiec, E.; Wieszała, R.; Strzebońska, M.; Jarosz-Krzemińska, E. An attempt to identify traffic related elements in snow. Geol. Geophys. Environ. 2013, 39, 317. [Google Scholar] [CrossRef] [Green Version]
  107. Zhang, L.; Michelangeli, D.V.; Taylor, P.A. Numerical studies of aerosol scavenging by low-level, warm stratiform clouds and precipitation. Atmos. Environ. 2004, 38, 4653–4665. [Google Scholar] [CrossRef]
  108. Di Marco, V.; Tapparo, A.; Badocco, D.; D’Aronco, S.; Pastore, P.; Giorio, C. Metal ion release from fine particulate matter sampled in the Po Valley to an aqueous solution mimicking fog water: Kinetics and solubility. Aerosol Air Qual. Res. 2020, 20, 720–729. [Google Scholar] [CrossRef]
  109. Kasimov, N.S.; Lychagin, M.Y.; Chalov, S.R.; Shinkareva, G.L. Paragenetic associations of chemical elements in landscapes. Vestn. Mosk. Unviersiteta Seriya Geogr. 2019, 6, 20–28. [Google Scholar]
  110. Pan, Y.P.; Wang, Y.S. Atmospheric wet and dry deposition of trace elements at 10 sites in Northern China. Atmos. Chem. Phys. 2015, 15, 951–972. [Google Scholar] [CrossRef] [Green Version]
  111. Carling, G.T.; Fernandez, D.P.; Johnson, W.P. Dust-mediated loading of trace and major elements to Wasatch Mountain snowpack. Sci. Total Environ. 2012, 432, 65–77. [Google Scholar] [CrossRef] [PubMed]
  112. Dinu, M.; Moiseenko, T.; Baranov, D. Snowpack as indicators of atmospheric pollution: The Valday Upland. Atmosphere 2020, 11, 462. [Google Scholar] [CrossRef]
  113. Westerlund, C.; Viklander, M.; Bäckström, M. Seasonal variations in road runoff quality in Luleå, Sweden. Water Sci. Technol. 2003, 48, 93–101. [Google Scholar] [CrossRef]
  114. Rangel-Alvarado, R.B.; Nazarenko, Y.; Ariya, P.A. Snow-borne nanosized particles: Abundance, distribution, composition, and significance in ice nucleation processes. J. Geophys. Res. Atmos. 2015, 120, 11760–11774. [Google Scholar] [CrossRef] [Green Version]
  115. Göbel, P.; Dierkes, C.; Coldewey, W.G. Storm water runoff concentration matrix for urban areas. J. Contam. Hydrol. 2007, 91, 26–42. [Google Scholar] [CrossRef]
  116. Sister, V.; Koretsky, V. Engineering-Environmental Protection of Water System of the Northern Megapolis in Winter Period; Center MSUIE: Moscow, Russia, 2004. [Google Scholar]
  117. Borsato, A.; Johnston, V.E.; Frisia, S.; Miorandi, R.; Corradini, F. Temperature and altitudinal influence on karst dripwater chemistry: Implications for regional-scale palaeoclimate reconstructions from speleothems. Geochim. Cosmochim. Acta 2016, 177, 275–297. [Google Scholar] [CrossRef]
  118. Fabretti, J.-F.; Sauret, N.; Gal, J.-F.; Maria, P.-C.; Schärer, U. Elemental characterization and source identification of PM2.5 using Positive Matrix Factorization: The Malraux road tunnel, Nice, France. Atmos. Res. 2009, 94, 320–329. [Google Scholar] [CrossRef]
  119. Lawrence, S.; Sokhi, R.; Ravindra, K. Quantification of vehicle fleet PM10 particulate matter emission factors from exhaust and non-exhaust sources using tunnel measurement techniques. Environ. Pollut. 2016, 210, 419–428. [Google Scholar] [CrossRef] [PubMed]
  120. Morera-Gómez, Y.; Alonso-Hernández, C.M.; Santamaría, J.M.; Elustondo, D.; Lasheras, E.; Widory, D. Levels, spatial distribution, risk assessment, and sources of environmental contamination vectored by road dust in Cienfuegos (Cuba) revealed by chemical and C and N stable isotope compositions. Environ. Sci. Pollut. Res. 2020, 27, 2184–2196. [Google Scholar] [CrossRef] [PubMed]
  121. Tanner, P.A.; Ma, H.-L.; Yu, P.K.N. Fingerprinting metals in urban street dust of Beijing, Shanghai, and Hong Kong. Environ. Sci. Technol. 2008, 42, 7111–7117. [Google Scholar] [CrossRef]
  122. Apeagyei, E.; Bank, M.S.; Spengler, J.D. Distribution of heavy metals in road dust along an urban-rural gradient in Massachusetts. Atmos. Environ. 2011, 45, 2310–2323. [Google Scholar] [CrossRef]
  123. Adamiec, E.; Jarosz-Krzemińska, E.; Wieszała, R. Heavy metals from non-exhaust vehicle emissions in urban and motorway road dusts. Environ. Monit. Assess. 2016, 188, 369. [Google Scholar] [CrossRef] [Green Version]
  124. Kasimov, N.S.; Bezberdaya, L.A.; Vlasov, D.V.; Lychagin, M.Y. Metals, metalloids, and benzo[a]pyrene in PM10 particles of soils and road dust of Alushta city. Eurasian Soil Sci. 2019, 52, 1608–1621. [Google Scholar] [CrossRef]
  125. Konstantinova, E.; Minkina, T.; Konstantinov, A.; Sushkova, S.; Antonenko, E.; Kurasova, A.; Loiko, S. Pollution status and human health risk assessment of potentially toxic elements and polycyclic aromatic hydrocarbons in urban street dust of Tyumen city, Russia. Environ. Geochem. Health 2020, 1–24. [Google Scholar] [CrossRef]
  126. Wahlin, P.; Berkowicz, R.; Palmgren, F. Characterisation of traffic-generated particulate matter in Copenhagen. Atmos. Environ. 2006, 40, 2151–2159. [Google Scholar] [CrossRef]
  127. Thorpe, A.; Harrison, R.M. Sources and properties of non-exhaust particulate matter from road traffic: A review. Sci. Total Environ. 2008, 400, 270–282. [Google Scholar] [CrossRef]
  128. Amato, F.; Pandolfi, M.; Moreno, T.; Furger, M.; Pey, J.; Alastuey, A.; Bukowiecki, N.; Prevot, A.S.H.; Baltensperger, U.; Querol, X. Sources and variability of inhalable road dust particles in three European cities. Atmos. Environ. 2011, 45, 6777–6787. [Google Scholar] [CrossRef]
  129. Hulskotte, J.H.J.; Roskam, G.D.; Denier van der Gon, H.A.C. Elemental composition of current automotive braking materials and derived air emission factors. Atmos. Environ. 2014, 99, 436–445. [Google Scholar] [CrossRef]
  130. Goddard, S.L.; Williams, K.R.; Robins, C.; Brown, R.J.C. Determination of antimony and barium in UK air quality samples as indicators of non-exhaust traffic emissions. Environ. Monit. Assess. 2019, 191, 641. [Google Scholar] [CrossRef] [PubMed]
  131. Sanders, P.G.; Xu, N.; Dalka, T.M.; Maricq, M.M. Airborne brake wear debris: Size distributions, composition, and a comparison of dynamometer and vehicle tests. Environ. Sci. Technol. 2003, 37, 4060–4069. [Google Scholar] [CrossRef]
  132. Reid, J.S.; Koppmann, R.; Eck, T.F.; Eleuterio, D.P. A review of biomass burning emissions part II: Intensive physical properties of biomass burning particles. Atmos. Chem. Phys. 2005, 5, 799–825. [Google Scholar] [CrossRef] [Green Version]
  133. Grivas, G.; Cheristanidis, S.; Chaloulakou, A.; Koutrakis, P.; Mihalopoulos, N. Elemental composition and source apportionment of fine and coarse particles at traffic and urban background locations in Athens, Greece. Aerosol Air Qual. Res. 2018, 18, 1642–1659. [Google Scholar] [CrossRef] [Green Version]
  134. Achad, M.; Caumo, S.; de Castro Vasconcellos, P.; Bajano, H.; Gómez, D.; Smichowski, P. Chemical markers of biomass burning: Determination of levoglucosan, and potassium in size-classified atmospheric aerosols collected in Buenos Aires, Argentina by different analytical techniques. Microchem. J. 2018, 139, 181–187. [Google Scholar] [CrossRef]
Figure 1. Snow cover sampling sites in the western part of Moscow (March 2018). Industrial zones: A–Fili, B–Western Port, C–Berezhkovskaya Embankment, D–Kuntsevo, E–Severnoye Ochakovo, F–Yuzhnoye Ochakovo.
Atmosphere 11 00907 g001
Figure 2. Distribution of TCF values for dissolved and suspended MMs in the western part of Moscow.
Atmosphere 11 00907 g002
Figure 3. Proportions of dissolved and suspended MMs forms in snow cover along different types of roads, at car parking lots in the yards of residential buildings and at the MO MSU in the western part of Moscow, and in the background area.
Atmosphere 11 00907 g003
Figure 4. Total excess of daily deposition of dissolved and suspended forms of MMs over the background level for different territories: H—highways, L—large roads, M—medium roads, Sm—small roads, R—all roads of the Moscow WAO, Y—car parking lots in the yards of residential buildings.
Atmosphere 11 00907 g004
Figure 5. Distribution of integral TDF index values for dissolved and suspended MMs forms in the western part of Moscow.
Atmosphere 11 00907 g005
Figure 6. Dendrograms of dissolved and suspended MMs in snow cover of the western part of Moscow. Results of cluster analysis (amalgamation rule: Complete Linkage, distance measure: d = 1–Pearson r).
Atmosphere 11 00907 g006
Table 1. Physicochemical properties, snow cover thickness, and ion content in snow meltwater in the western part of Moscow and the background territory.
ParameterRoads *R
(n = 21)
Y
(n = 4)
MO MSU
(n = 1)
B
(n = 3)
MRR
(n = 3)
H
(n = 4)
L
(n = 4)
M
(n = 5)
Sm
(n = 5)
рН8.08.48.68.28.08.27.57.35.6
Mineralization, mg/L14423387735811335326.4
Solid particles, mg/L93832831244815179.0
Dust load, mg/m2 per day1331023541306220219.0
Snow cover thickness, cm504246454245454561
Water supply, L/m2917383807780797767
Na+, μeq/L112623575055944369512622368
K+, μeq/L925149111416281
Mg2+, μeq/L1720381212199194
Ca2+, μeq/L1039145970749839477322617869
Cl, μeq/L1400335360771943412292782407
NO3, μeq/L222829252626242924
SO42, μeq/L9210479638283705915
HCO3, μeq/L67837455030531042014113438
* Roads: H—highways, L—large, M—medium, Sm—small; R—average for roads; Y—yards with parking lots; B—background; n—number of mixed samples.
Table 2. Concentrations of dissolved and suspended forms of MMs in snow cover near roads, at car parking lots in the yards of residential buildings, at the MO MSU and in the background area in March 2018, μg/L.
MMsDissolved FormsSuspended Forms
Roads (n = 21)Yards (n = 4)MO
MSU (n = 1)
Background (n = 3)Roads (n = 21)Yards (n = 4)MO
MSU (n = 1)
Background (n = 3)
MeanMin.Max.MeanMin.Max.MeanMeanMin.Max.MeanMin.Max.MeanMin.Max.MeanMeanMin.Max.
Na2187028308590060221960156205430193170210932691090710354172109241738
Mg23310084010710012023050 *50 *50 *11101021261014583228148282239
Al7531227653911153584769421635148798526299822638165103270
K5311001210617260950111050 *50 *50 *8361068660157852421646136108
Ca154982820461604535280058003570138712301690401025144960462227778478503081
Ti2.00.3 *130.850.551.11.01.11.01.2345303900482976458.31.918
V0.920.2 *2.90.760.2 *1.71.10.2 *0.2 *0.2 *121.11352.11.42.72.80.270.160.45
Cr0.660.5 *3.90.5 *0.5 *0.5 *0.5 *0.5 *0.5 *0.5 *110.441401.10.591.68.80.710.531.0
Mn113.884123.2343.94.53.26.2555.56038.44.5148.13.01.25.8
Fe932544068379346494356384845239098680383103667813994218
Co0.280.121.00.180.10.30.110.0710.0540.0911.60.13190.190.110.310.220.0370.020.058
Ni4.61.7 *281.7 *1.7 *1.7 *3.61.7 *1.7 *1.7 *6.10.51761.10.671.41.70.450.30.67
Cu5.22.5134.12.84.94.92.82.53.1172.11213.82.54.76.10.650.580.7
Zn168.72918122324221531333.93116.93.79.2181.10.631.7
As0.05 *0.05 *0.05 *0.05 *0.05 *0.05 *0.05 *0.05 *0.05 *0.05 *0.270.0132.60.0770.0140.110.120.0130.010.016
Rb0.430.220.880.350.250.520.340.190.170.233.10.42320.560.330.810.600.20.120.38
Sr144.9407.25.2117.01.21.01.3171.61912.71.84.14.40.410.230.74
Mo0.260.025 *3.40.0710.025 *0.160.025 *0.025 *0.025 *0.025 *0.710.0837.00.170.10.210.250.020.0150.025
Cd0.0680.0190.610.0640.0280.120.0610.0330.0170.0470.0530.0080.420.0180.0090.0250.0250.0060.001 *0.012
Sn0.0150.005 *0.210.0120.005 *0.0330.005 *0.005 *0.005 *0.005 *1.30.359.60.590.380.750.560.0630.04 *0.098
Sb0.380.14.00.120.0950.160.120.0680.0630.0740.790.118.00.210.160.250.260.0290.0220.044
Ba9.24.2316.74.18.67.72.72.13.3344.93417.55.89.99.31.70.953.2
W0.110.02 *0.880.02 *0.02 *0.02 *0.02 *0.02 *0.02 *0.02 *2.60.25280.330.190.470.270.0450.025 *0.068
Pb0.350.131.80.280.180.440.540.700.500.835.00.46381.81.52.08.60.840.671.0
Bi0.0030.001 *0.0290.0020.001 *0.0060.001 *0.001 *0.001 *0.001 *0.0940.0230.660.0350.0310.0360.0470.0110.0070.02
Notes. * Concentrations below detection limits were assigned a value equal to a half of it [79]. MMs are listed in the order of increasing numbers in Mendeleev’s Periodic Table.
Table 3. Accumulation of dissolved and suspended MMs forms in snow cover of WAO.
Object (Number of Mixed Samples)Values of Contamination Factor CFTCF
>5025–5010–255–103–5
MRR (n = 3)DSNa134Ca15Sr14W7K7Co5Mo4Mg4Ba4V3194
SPCa385W258Co219Ti203Mg199Sr198Na194
Mo141Al128Fe122Zn120Sb113Mn88As86
Ba85Cu78Cr78Ni66Rb66Sn63K60
Cd31Bi25Pb193212
Highways (n = 4)DSNa280Sr23Ca21K20W19Sn11Bi8Co6Mo6Mg5Ni5V5Ba4Sb3Fe3Ti3414
SPCa64W47Co31Ti31Sr29
V29Mg28Na27
Zn24Mo22Fe20Sn17Al17Sb16
Cu15Ba14As13Mn13Rb11K10
Cd7Bi6Ni6Cr6Pb4481
Large roads (n = 4)DSNa60Mo36Sb17K11Ca10Sr9Mg9V4Co3156
SPCa24W21Cu17Mo16Zn14Sr13Co12
Sn12Sb11Mg11V11Ti10As10Na10
Fe9Ba8Al7Rb6Mn6
Bi6Cd5K5Ni5Pb5
Cr4235
Medium roads (n = 5)DSNa71Sr9Ca7K7Cd6Mn5Co5V4Mg3Mo3116
SP Cu22Ca21W19Mo18Sn14Sb13V13
Sr13Zn12Ti11Mg11Co11As11Na10Fe10
Ba8Al7Rb6K6Mn6Bi5Cd4Ni4Cr4Pb4240
Small roads (n = 5)DSNa52K9Sr7Ca6V6Mo5Sb4Ba4Ni4Mg398
SPMo17V15Ca13Sn12W12
Cu12Sb11As10Zn10Fe10
Sr9Co9Ti8Mg7Na6
Ba6Al5Mn5Bi5
Cd4Ni4Rb4K4Pb3Cr3179
Average for roads (n = 21)DSNa113Sr12Ca11K11Mo10Sb6W6Mg5V5Co4Sn3Ba3187
SPCa80W57Co44V44Sr42Ti41Mg40Na39
Mo36Zn30Fe28Sb27Cu25
As22Sn21Ba20Mn19
Al25Rb15Cr15K14Ni14
Cd9Bi8Pb6695
Yards with car parking lots (n = 4)DSNa31K12Sr6V4Ca366
SPSn9Ca9Mo8V8Sb7W7Sr6
Zn6As6Ti6Cu6Co5Mg5Fe5
Ba4Na4Al3Cd3Bi3103
MO MSU (n = 1)DSNa28K22V6Sr6Mg571
SPZn16Mo13Cr12
Sr11V10Pb10Ca10
Cu9As9Sn9Sb9W6
Co6Ba5Ti5Mg5Fe5Na5
Cd4Bi4Al4Ni4156
Notes. The CF value of each element is written in the subscript. DS—dissolved (blue background), SP—suspended (orange background) forms.
Table 4. Mean, minimum, and maximum daily deposition rates of dissolved and suspended forms of MMs near roads, at car parking lots in the yards of residential buildings, near the MO MSU, and in the background area in March 2018, μg/m2 per day.
MMsDissolved FormsSuspended Forms
Roads (n = 21)Yards (n = 4)MO
MSU (n = 1)
Background (n = 3)Roads (n = 21)Yards (n = 4)MO
MSU (n = 1)
Background (n = 3)
MeanMin.Max.MeanMin.Max.MeanMeanMin.Max.MeanMin.Max.MeanMin.Max.MeanMeanMin.Max.
Na27511348998917769521601979166662111542751189951332113460233134251635
Mg29910793213711015228254456914151151540018891310181292135
Al9541247854815066615565538238359597683330111578317099244
K66512215887833531288136354456910601221057720494328201623597
Ca1999734766160358513086786543831475119117055104309549106032501054587513874
Ti2.40.31141.10.751.51.31.20.91.64404247646332103558.41.816
V1.20.213.70.930.272.21.40.220.180.27151.21652.61.53.43.40.280.160.41
Cr0.840.524.90.630.550.680.610.540.450.69130.481711.40.652.2110.760.480.99
Mn144.3110163.5464.85.13.18.5716.7737115.019103.01.15.3
Fe11634479894112657524265489849247751884422140583314491197
Co0.360.141.40.240.130.410.130.0740.0670.0822.10.16230.250.120.420.270.0370.0270.053
Ni5.61.9362.21.92.44.41.91.62.47.70.56931.40.741.82.10.470.350.64
Cu6.63.0175.23.66.663.12.53.9212.31484.92.86.07.50.70.620.79
Zn21133724153129251543424.33809.04.012221.20.611.6
As0.0640.0520.0840.0640.0550.0680.0610.0540.0450.0690.350.0163.20.10.0150.140.140.0130.0110.015
Rb0.550.231.20.450.320.70.420.210.160.253.90.46390.730.371.10.740.210.110.34
Sr186.09539.35.7168.71.30.991.8222.02333.42.05.65.50.420.270.67
Mo0.320.034.00.0910.0280.20.0310.0270.0230.0340.90.098.50.210.110.270.310.0210.0190.023
Cd0.0870.0250.80.0820.0350.160.0750.0360.0160.0490.0670.0090.520.0240.010.0350.0310.0060.0010.011
Sn0.0170.0050.230.0160.0060.0450.0060.0050.0050.0071.70.38120.750.420.950.690.0660.0390.089
Sb0.470.124.80.160.10.220.150.0740.060.11.00.129.80.270.170.340.320.030.0210.04
Ba125.2398.45.6129.53.02.04.6435.44179.66.413111.70.922.9
W0.140.0210.960.0250.0220.0270.0250.0220.0180.0273.30.3340.420.210.640.330.0460.0340.061
Pb0.440.151.90.360.230.60.660.760.481.16.30.5462.31.72.7110.910.651.1
Bi0.0030.0010.0320.0030.00130.0070.00120.00110.00090.00140.120.0250.810.0440.040.0480.0580.0120.0070.02

