Article

Seasonal Variability of Lightning Activity in Yakutia in 2009–2019

Yuri Georgievich Shafer Institute of Cosmophysical Research and Aeronomy of the Siberian Branch of the Russian Academy of Sciences, 677027 Yakutsk, Russia
*
Author to whom correspondence should be addressed.
Atmosphere 2020, 11(9), 918; https://doi.org/10.3390/atmos11090918
Submission received: 13 July 2020 / Revised: 22 August 2020 / Accepted: 25 August 2020 / Published: 28 August 2020

Abstract

:
The instrumental continuous monitoring of lightning activity in Yakutia has been carried by the lightning direction finder since the 2000s. Devices for detection of sferic (very low frequency radio pulses emitted by lightning discharges) in Yakutia were supplemented in 2009 with relatively short-range (effective detection radius up to 480 km) single-point Stormtracker and LD-250 direction finders from Boltek Corporation (Welland, ON, Canada). The Stormtracker gives a slightly overestimated ratio of CG strokes due to the amplitude threshold of a single-point direction finder, but the device has not changed over the years, which allows for the consideration of the annual dynamics of parameters. In 2009, a sensor in Yakutsk was included in the World Wide Lightning Location Network (WWLLN). The seasonal and diurnal variations of the total lightning stroke number in the central part and the entire area of Yakutia were obtained (up to 1200 km in radius and limited by latitude–longitude boundaries of 105–150° E, 55–75° N). The longest thunderstorm seasons are often observed in the southern part of Yakutia. There was a slight increase in the duration of the thunderstorm season until 2015 in the central part of Yakutia. The interannual variations in the total number of lightning strokes showed periodic fluctuations (with a period of about three years) over the whole area of Yakutia. The periods of high lightning activity shifted within a season from year to year, as revealed by the monthly stroke number variation. Thus, the maximum lightning rate occurred at the beginning of summer, in the middle or at the beginning of August, and had a period of about three years. Every summer, there were 2–3 periods of high lightning activity, resulting from the moving average with a two-week window (according to the longest duration of cyclones). If the periods of high lightning activity shifted toward the beginning of summer, a decrease in the number of days between seasonal peaks was observed. If the maximum shifted to the beginning of August, the number of days between peaks increased. The ratio of cloud-to-ground (CG) lightning strokes and the ratio of negative CG strokes was slightly decreasing by 2015 in the central part of Yakutia.

1. Introduction

The northeastern parts of Asia, including Yakutia, are low-population regions and are sparsely covered by instrumental observation of lightning activity. The first experimental data in Yakutia were obtained by Fillipov et al. in the 1970s by means of a lightning electromagnetic pulse (sferic) counter in a very low frequency (VLF) range [1,2]. The obtained average parameters of thunderstorms and their summer frequency were in accordance with meteorological visual observations. Based on the method of sferic detection, Mullayarov and Kozlov developed a lightning direction finder and started long-term digital recording in 1999 [3,4,5]. They found the average seasonal variation of sferic numbers and areas with high lightning density in Yakutia within a radius of 1200 km around Yakutsk City. The resulting spatial distribution of sferic density agreed with the data of the optical transient detector loaded on the MicroLab-1 satellite in 1995–2000 [6]. The forest department developed the Russian network “Verya-MR,” which covers the south and southwest of Yakutia [7], an area that often suffers forest fires. However, the north and northeast of Yakutia are not covered by the network. Two large areas of high lightning density in the western and southern parts of Yakutia have been found. The resulting mean daily variation was in agreement with the standard form, with a peak around 17 LT and a morning minimum. The total sferic number was found to have a positive trend until 2003 [5].
Lightning ignition in the northern regions is a common cause of wildfires [8]. Lightning strokes caused 55% of wildfires in North America over five years [9]. The Ministry of the Russian Federation for Civil Defence, Emergencies, and Elimination of Consequences of Natural Disasters published that lightning strokes caused 93% of wildfires in Yakutia [10], mainly because of the sparse population density in the Republic of Sakha (Yakutia). The hotspots number associated with summer wildfires increased in 2009–2015 according to satellite observations [11]. Therefore, the relationship between lightning activity and forest fire activity may be investigated by the results of ground-based instrumental observation in the regions distant from the populated localities and meteorological stations.
The lightning discharge number may be an indicator of high convective activity, severe storms accompanied by hail, and climate change [12,13,14,15] in the northern regions where expensive equipment or satellite data still cannot be used. Long-term climatology of lightning activity as an indicator of severe storms or hailstorms may have a practical application as recommendations for agriculture in the sparsely populated regions of Yakutia.
The sferic detection equipment was expanded in 2009 with relatively short-range Stormtracker and LD-250 sensors produced by the Boltek Corporation (Welland, ON, Canada). In the center of Yakutsk, we installed a sensor that was included in the Worldwide Lightning Location Network (WWLLN) in 2009. The network locates lightning strokes more accurately (up to tens of kilometers) than a lightning direction finder [16,17]. However, due to the methods used to sense a signal at a long distance, the network processing does not separate signals by type of lightning stroke, and it has a relatively low detection efficiency in comparison with single-point lightning detectors or networks with smaller distances between sensors. The detection efficiency of the network is increasing as the lightning peak current increases [16,17]. To estimate the cloud-to-ground (CG) and intracloud (IC) strokes number, Stormtracker data was used.

2. Instrumentation

The VLF sferics were detected by three different lightning location systems set near to Yakutsk. Lightning discharge can have several components, the most powerful is the return stroke, a main stage of discharge. The lightning flash may consist of several return strokes separated by ~40–60 ms mean time interval [18,19,20]. The first return stroke is associated with the greatest peak current in flash in ~40% of events. It can be followed by the subsequent strokes with peak currents of smaller magnitude in about half of all flashes [20,21,22]. The average number of components in a flash is ~2 strokes. In this study, we analyze the number of sferics associated with return strokes not combined in flashes.

2.1. Lightning Direction Finder

The lightning direction finder constructed in Yu.G. Shafer Institute of Cosmophysical Research and Aeronomy of the Siberian Branch of the Russian Academy of Sciences (ShICRA SB RAS) had been operating permanently, resulting in digital data from 1999 to 2016 [5]. There were discontinuous observations in 1993–1999 [23], but the data of that period were not considered in this study. It includes an antenna system, preamplifier (the coefficient is 40 for the range of ~1–100 kHz), an analog-to-digit converter (ADC, frequency 400 kHz, 16 channels, 14 bit), and a laptop. The lightning locating system has three antennas to measure the vertical electric (E) and two horizontal magnetic (H) components of the sferic’s electromagnetic field. The three-meter electric antenna is mounted on a seven-meter metal pole on the insulator. Two shielded frames in the shape of a square have 20 rounds (the effective area of the frame is 360 m2) and are placed on the same pole. To eliminate the influence of local interference, the antenna system with preliminary amplifiers is located 400 m from the registration point. Recording to the digital array began after exceeding the amplitude threshold. The recording duration was chosen to be at least three sferic durations (~1 ms). The time interval between samples of recordings (8 μs) was less than a quarter of the first half-period of the sferic. The time interval was set according to the sampling rate of 250 kHz of the previous ADC used till 2006. The four channels of ADC were used to record the E-component, the H-component of the north–south direction, the E-component again, and the H-component of the east–west direction. Thus, the E-component was recorded with a rate two times greater than that of the H-components. The software has not been modified since 2000, despite the fact that the speed of computer functioning had grown abruptly over the past two decades.
The direction of a lightning stroke is determined by the ratio of the root-mean square values of the sferic signal detected by two orthogonal magnetic antennas oriented in the north–south and east–west directions. To eliminate error produced by the noise component of the field in the measured values, the background level is subtracted from the sferic’s quadratic values. The uncertainty of the direction determination is eliminated by comparing the signs of cross-correlation of the E- and H-components of a sferic. The distance to a lightning stroke is defined as the geometric mean values of the root-mean square value of the E- and H-components of the sferic and the number of positive and negative half-periods of the sferic E-component exceeding the level of 10% of the maximum sferic magnitude. The effective radius of detection was about 1200 km. The waveform of a lightning stroke pulse radiated closer than about 200 km was cut by the amplitude threshold of the amplifier unit. Thus, the pulses in the range up to 200 km around the sensor site were not located, and only the pulse number was determined. The range determination was calibrated by a system consisting of two lightning sensors (in the localities of Yakutsk and Olekminsk) with a distance between the positions of 540 km. The measured error in determining the coordinates of a lightning stroke in the range of 250–1200 km was 15% of the distance to the stroke [24].
The autocorrelation coefficient of signals detected by the E-antenna, with a shift of 8 μs, was calculated. The threshold value corresponding to one third of the sferics with the lowest frequency was found. The sferics with an autocorrelation coefficient exceeding this threshold (i.e., with lower frequency) are considered as radiated by lightning cloud-to-ground discharge. Positive CG strokes differ from negative CG strokes by the sign of the first half-period of the signal of the sferics E-component.
The sensor was installed in an area with a low level of technical noise and was powered by a battery that was recharged every week. There were two seasonal modes—winter and summer—to detect distant and local thunderstorms. The amplitude threshold of the seasonal mode was switched manually in the beginning of the warm and cold season every year. The sferic parameters were analyzed and stored in binary files automatically to prevent storage overload. However, we undertook an analysis of annual variation only for the interval of 2009 to 2016, when we installed additional short-range detectors and a sensor included in the worldwide network. The data in other years of detection were considered the patterns of seasonal variation. The days with outages in 2010 exceeded 10% of the summer season and occurred in the middle of the season when the thunderstorm rate is often high (Table 1). Therefore, we excluded the data from 2010 from the current analysis. Due to the irregular timing for switching the seasonal mode, the season was limited to 11 June to 31 August.

2.2. Stormtracker Detector

The relatively short-range detector “Stormtracker” consists of crossed ferrite coils and a cable as an electrical whip antenna and a board integrated into a personal computer. It was installed in the center of Yakutsk in 2009. The device was not modified; however, the software was updated in 2012. It measures lightning stroke pulse parameters automatically, including the time of pulse arrival, distance and azimuth estimation, the signal amplitude and wavelength of relative units, type, and the polarity of the signal source (lightning discharge). The Stormtracker gives a slightly overestimated ratio of CG strokes caused by the technology of a single-point direction finder, but the device has not changed over the years, which allows for consideration of the annual dynamics of the parameters. The effective detection radius is up to 480 km (300 miles). Due to the low threshold, the magnitude of signals of a probable technical noise source may sometimes prevail over the magnitude of lightning stroke pulses for a distance closer than 60 km and hence could be mistaken as sferics by the sensor. The data were selected for the distance interval of 60–480 km from the Yakutsk site. The average storm location accuracy should be ~5 km (up to 25 km) with one-degree azimuthal resolution for a well calibrated system according to the information declared by the software producer [25]. The Boltek Corporation also produced the “LD-250” lightning detector, which can be combined into a network. The “LD-250” and Stormtracker are similar in terms of software and the construction of the sensors. The lightning localization by a single sensor was experimentally validated by the detection of subsequent strokes using a system of two lightning detectors—“LD-250” [26]. The derived relative accuracy of determination of the distance to a lightning stroke was ~12% (6–18%) for a range of 50–450 km. The longitude and latitude of the point of lightning stroke termination was determined under the assumption of the Earth as a sphere.
The data of Stormtracker were used to study seasonal variations and lightning type ratios in the central part of Yakutia, where the ShICRA’s lightning direction finder was not able to locate lightning strokes because of the amplitude limits of ADC.

2.3. World Wide Lightning Location Network

The sensor of the World Wide Lightning Location Network (WWLLN, Seattle, WA, USA) that was installed in Yakutsk in 2009 was constructed as a whip antenna of 6 m height, connected to a VLF-range amplifier and sound card in a computer. The time is synchronized by GPS pulses per minute (Resolution T GPS Timing Receiver, Trimble, Sunnyvale, CA, USA). The network includes more than 80 sensors all over the world [27]. Very low frequency lightning stroke pulses are detected by at least five sensors from a distance of more than 6000 km, synchronized by the time of group arrival [16,17]. As is the case for any network with far-distanced sensors, the WWLLN detects lightning strokes better if it is powerful; thus, it should have a high lightning current. It detects both CG strokes and intracloud IC strokes. Due to the VLF range and better detection of powerful signals that are often generated by CG strokes, the system detects a smaller number of intracloud strokes [28]. A thunderstorm typically produces IC lightning strokes more than two times more frequently than CG strokes [29,30,31]. Therefore, the WWLLN detects about an equal number of both types of strokes. The number of sensors around the world has increased since 2009. The detection efficiency of the network was estimated by the comparison with satellite data for tropical regions (in 2013, 2017) [32,33] and the data of local commercial networks (in 2010) [34]; it was found that detection efficiency increased from ~10–15% for any stroke and about 30% for strokes with peak currents above 40 kA to over 60–80% of all strokes with peak currents greater than 50 kA [35]. However, the detection efficiency varies spatially on a global scale. Given the changing number of sensors, the density maps were corrected by the model of relative detection efficiency [36]. The lightning density was multiplied on relative detection efficiency maps interpolated to a 0.25-degree grid every hour, and then were summarized daily. Correction of relative detection efficiency maps is used for the estimation of the annual and monthly lightning density. It is not used to estimate the lightning stroke number in the area with a radius of 480 km around Yakutsk in central Yakutia. The differences between positions of lightning stroke defined by the satellite-based optical sensor and the WWLLN was distributed around 5–10 km in 2013 [32].
In comparison with a single-point system, the WWLLN usually detects smaller number of lightning strokes (the average number of detected subsequent strokes was 1.5 [33], and the average number was 2.4 as reported by the National Lightning Detection Network, USA, with a 40% stroke detection efficiency in 2003 [19]) because of the requirement to detect a signal at several distant sensors. The power of stroke pulse should be larger to be detected by at least five distant sensors. This leads to the amplitude threshold being lower in a single-point system in comparison with the network. Also, Stormtracker software provides the determination of lightning type. One can note that the number of IC strokes (with weaker currents and larger rates compared to CG strokes) detected by the Stormtraker or the lightning direction finder should be larger than the number of IC strokes detected by the WWLLN because of the lower amplitude threshold. The single-point systems have an upper limit of bandwidth of about 100 kHz, and WWLLN has limit of about 24 kHz. The data of the WWLLN were used to study lightning spatial distribution, patterns of annual and seasonal variations of the number of lightning strokes with high peak current mainly.
The days with lightning activity defined by the Stormtracker and WWLLN were compared to the meteorological visual observation in 2011 over the area of a 480 km radius around Yakutsk. There were 32 meteorological stations within the considered area. The designation of the days of the beginning and ending of the lightning activity season agreed with Stormtracker and WWLLN data to within one day. During a season, there were days with lightning activity and no marks at meteorological stations due to the location of weak lightning activity at the edge of area of consideration not covered by visual observation. Only the nighttime storm detected over the central area on 28 June was not identified by meteorological stations. It agreed with the daily cloud spatial distribution obtained by the MODIS instrument on satellites Terra/Aqua [37]. The lightning rate according to the raw WWLLN data within one degree was 21–22 stroke per/hour at 22:00–23:00 local time, between time of surface weather reading at meteorological stations.

3. Results

3.1. The Yakutia Region

3.1.1. Mean Lightning Density

Mean lightning density was significantly dependent on the latitude and elevation in the Yakutia region. Mean lightning density decreases with increasing latitude; this is common for northern areas because of the mean air temperature decrease. Highlands and mountain ranges have an influence on storm paths and convection conditions. The Yakutia territory is elevated up to 3 km above sea level. The height distribution has an exponential decline with increasing altitude and a local maximum of 300 m, and the second local maximum in the distribution is in the interval of 600–900 m, based on the interpolated relief data [38]. Altitudes of 100–500 m are found over 48% of the land area (area of more than 0 m above sea level), and the height of about 11% of the total area is more than 1000 m (Figure 1). One can find an example of the clear impact of orography on lightning activity around the Verkhoyansk, Cherskiy, and Momskiy Ranges in the central and northeastern parts of Yakutia (Figure 1). The lightning density was about four times higher on the western and southern hillsides of the Verkhoyansk Range along the Lena and Aldan Rivers, than the lightning density at the foot of the mountains. The lightning density on the eastern slope sharply decreases by ~10 times in comparison with the maximum at a wide range of heights of around 300 m and 700–1000 m.
The wide scatter of height values for the maximum mean lightning density along the Verkhoyansk Range does not depend on latitude. It is probably due to the location of slopes relative to each other. A high lightning density was found on the western and southwestern hillsides of the Cherskiy Range. Note that the lightning density near the Momskiy Range was greater on its eastern side. The region of Southern Yakutia that is covered by the Aldan plateau (at a height of ~500–2300 m) is associated with peak lightning activity over Yakutia. This region borders the northern side of the Stanovoy Range, which contributes to high values of lightning density. To the south of the area of consideration, there is a vast region (40–55° N, 110–140° E) associated with highest values of lightning density in North Asia (40–80° N, 60–180° E).

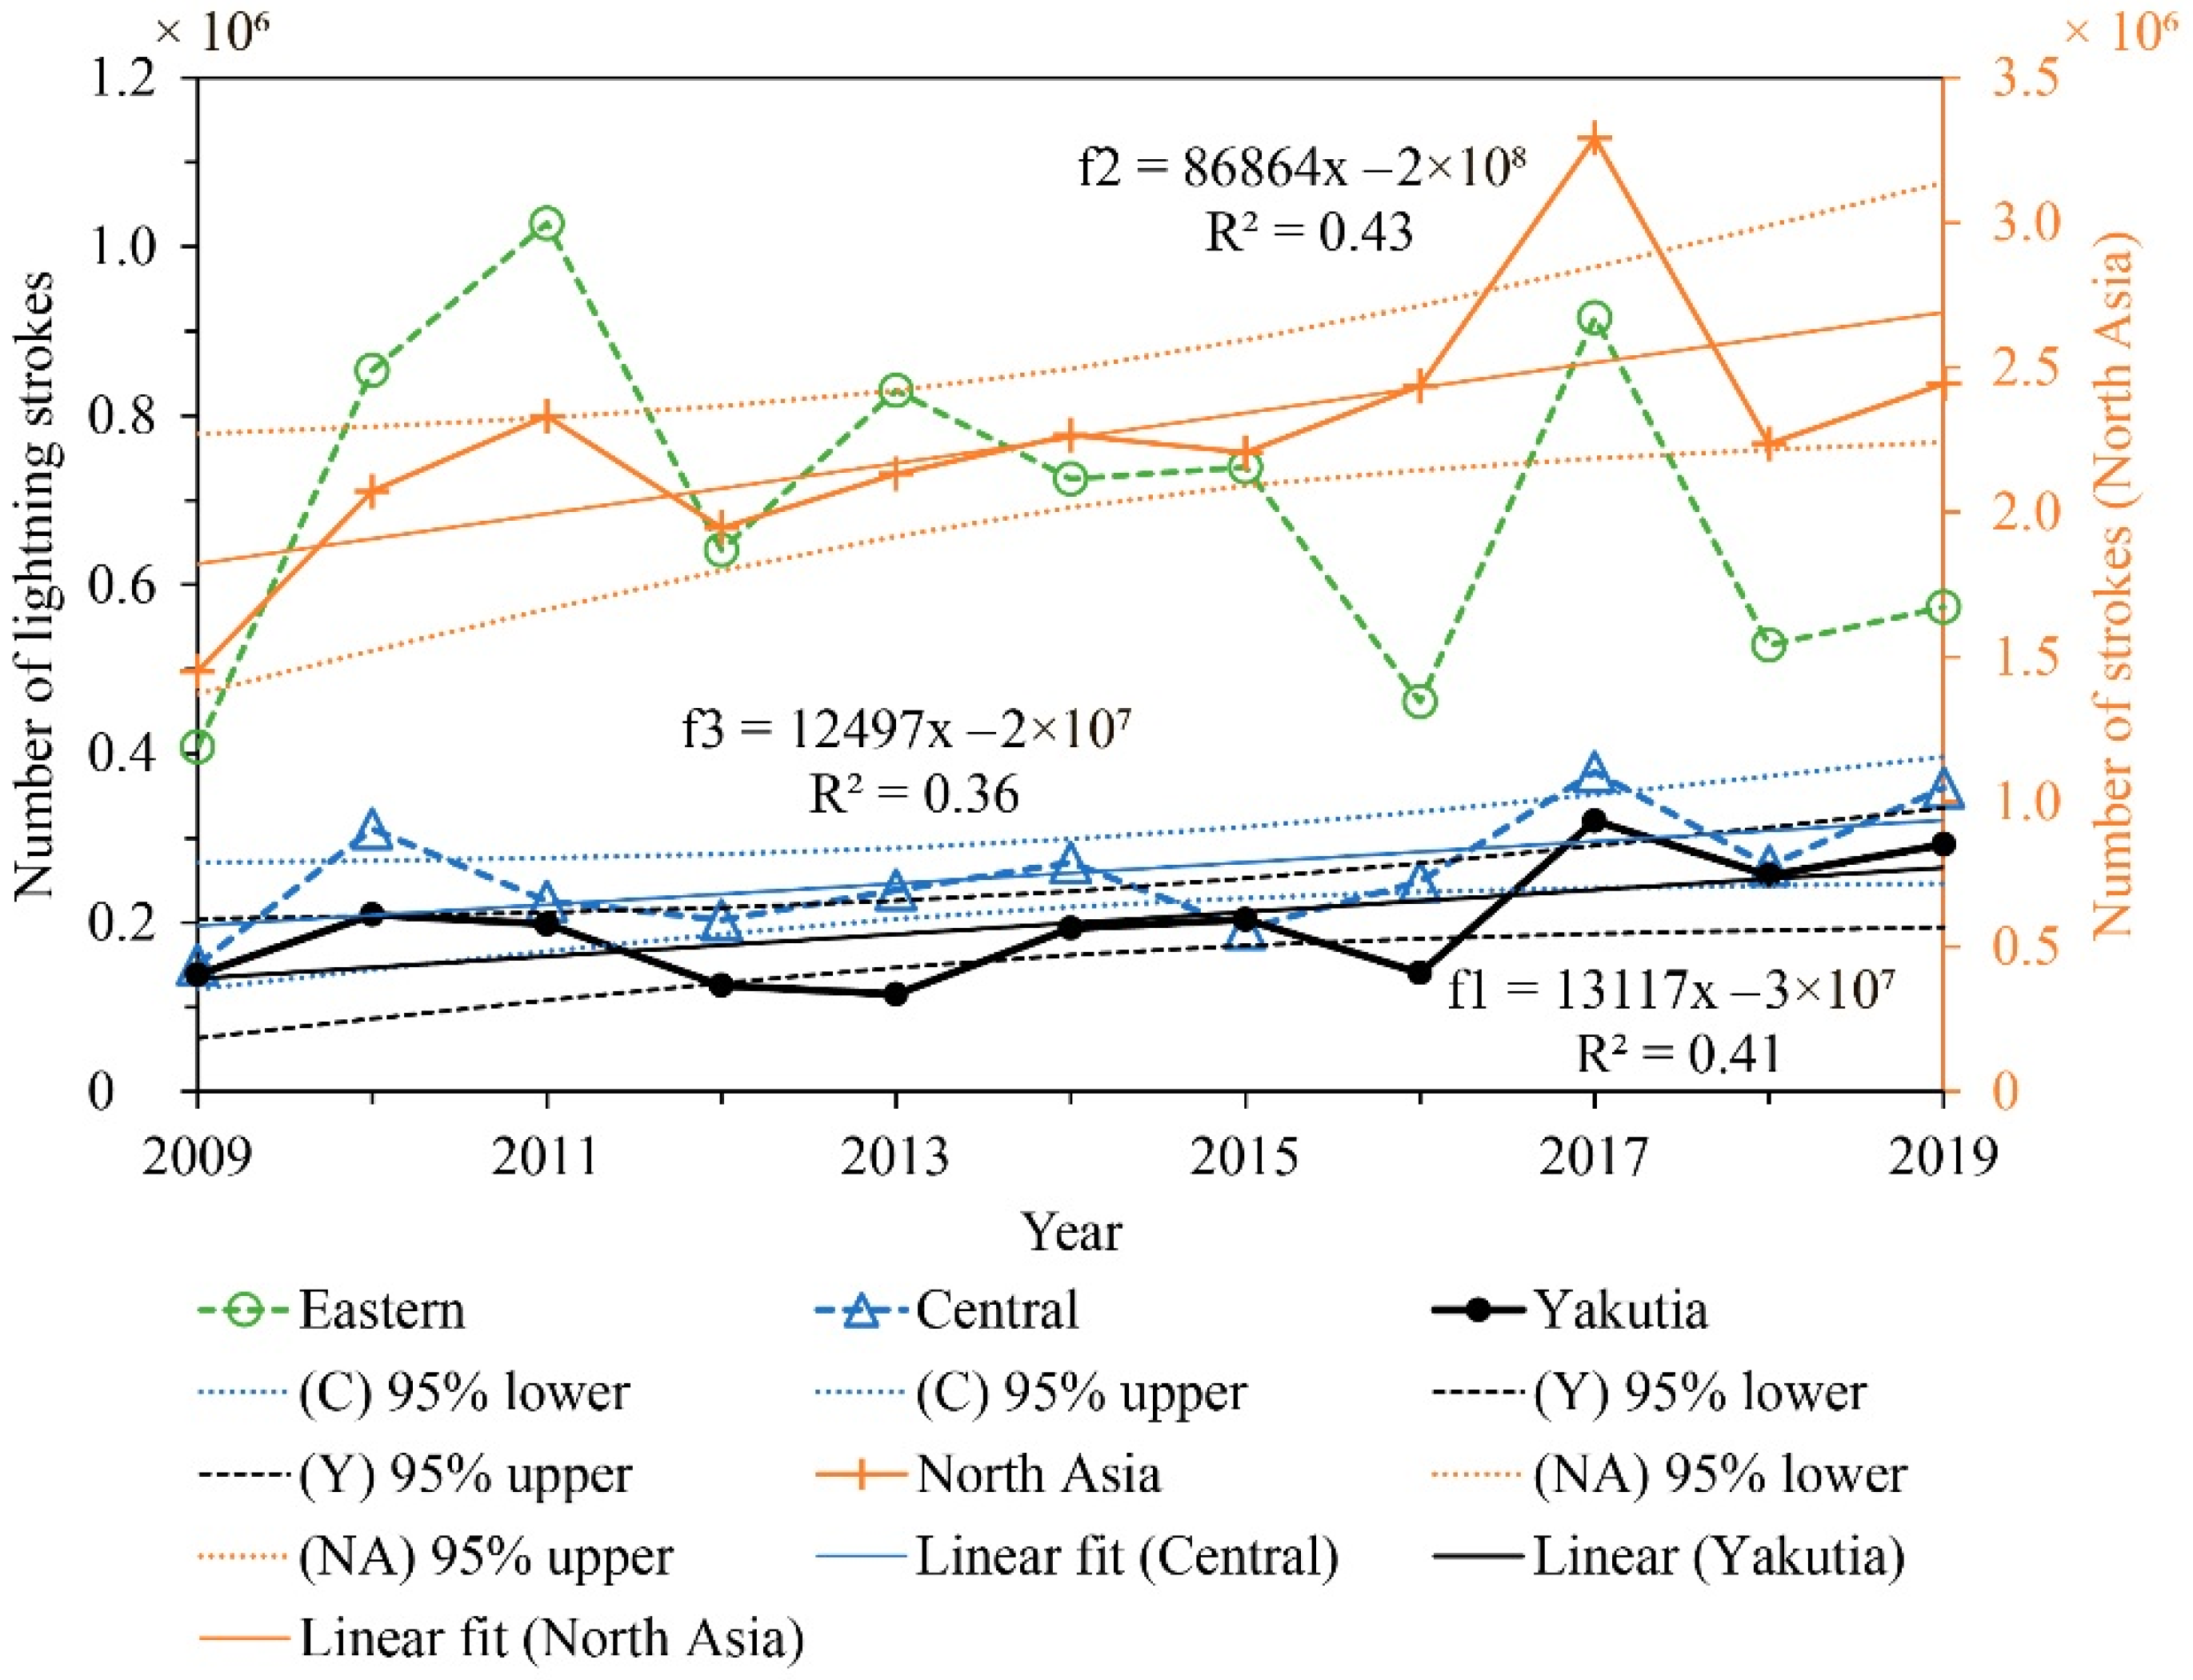
3.1.2. Annual Variation of Total Lightning Stroke Number

The total number of lightning strokes in the summer (11 June–31 August) in 2009–2019 showed a positive trend in the last four years of observation (Figure 2), and earlier in 1999–2004 (according to the data of ShICRA’s direction finder [5]). The greatest lightning stroke numbers (about 3.2 × 10⁵ strokes according to the WWLLN data corrected by the network’s relative detection efficiency) over the whole Yakutia region were in the summers of 2017 and 2019. The variation obtained by WWLLN was appropriate to the results of sferic detection by the lightning direction finder in 2009–2016, except for in 2010, when the lightning detection finder did not work throughout most of the summer.
The lightning number variation in Yakutia relates to the variation in the central part of North Asia (45–60 N, 90–110 E) with a correlation coefficient of 0.8 (linear regression coefficient was 0.78 with the 95% confidence interval of (0.33, 1.23) with a t-distribution, F1, 9 = 15.28, p = 0.0035), and to the total number in the whole area of North Asia with the coefficient of 0.7 (regression coefficient was 0.109 with the 95% confidence interval of (0.026, 0.192), F1, 9 = 8.83, p = 0.015). The positive trends in the variations had similar slopes in 2009–2019 (Figure 3). The slope for Yakutia was 1.31 × 10⁴ stroke/year (1180, 2.5 × 10⁴—95% confidence interval, F1, 9 = 6.18, p = 0.035), and for central region, it was 1.25 × 10⁴ stroke/year (−174, 2.5 × 10⁴—95% confidence interval, F1, 9 = 4.98, p = 0.053). However, the annual increments were not equal over 2–3 years (the correlation coefficient was 0.64 for annual increments in the central part and in Yakutia).
The variation of the lightning stroke number in the eastern region (40–55° N, 110–140° E), where the weather state is associated with summer monsoon activity, showed a slightly negative linear trend (Figure 3, the green line). However, the annual increment variations in the eastern region and Yakutia correlated with a coefficient of 0.78 (the regression coefficient was 0.2 with the 95% confidence interval of (0.07, 0.33), F1, 8 = 12.34, p = 0.008). It was greater than correlation coefficient between the annual increments of the total lightning number in the central region of North Asia and in Yakutia −0.64 (the regression coefficient was 0.541 with the 95% confidence interval of (0.008, 1.073), F1, 8 = 5.49, p = 0.047). There was a non-significant relationship between the annual variation in Yakutia and the variation in the western region of North Asia (47–62° N, 60–90° E)—the correlation coefficient of the annual increment in the total lightning number was −0.06 (F1, 8 = 0.03, p = 0.87). One feature of the sharply continental climate of Yakutia in the summer season is the meridional outlets of southern cyclones from Transbaikalia, which occur during the disturbance of the zonal circulation [39]. In the rear of the southern outlet, there is an invasion of Arctic air resulting in a cold snap [39]. The impact of these atmospheric processes can probably be represented in the correlation of annual variations of the total lightning number in the central region and Yakutia, but to support this suggestion, long-term observation (and the extension of population size) is needed.

3.1.3. Seasonal Variations

Every summer from 2009–2019, there was a high mean lightning density (about 10 times greater than in the surrounding areas) in southern Yakutia, and the lightning rate was often greater in the valley between the rivers Lena and Vilyuy in southwestern Yakutia. However, the annual lightning stroke number in the southwest varied widely from year to year. The thunderstorm season usually starts at the end of April or beginning of May, and the last thunderstorm often occurs in late September in the southern part of Yakutia, based on WWLLN data. Thunderstorms occurred rarely in the middle of April, as in 2012 and 2017. The last day with lightning activity may occur within the first half of October, as in 2011 and 2017. The longest seasons were in 2011 and 2017 for the entire area of observation.
The seasonal lightning variations in other regions in North Asia do not show the same peaks and patterns each year as the lightning activity in Yakutia. The correlation coefficient was up to 0.6 some years, and cross-correlation showed a better coefficient within 2–3 days. The seasonal variations detected by the ShICRA lightning direction finder in 1999–2016 had 1–3 peaks or short periods of a high lightning rate in summer. The periods were often within two intervals in 1999–2007: around the 19–25 June and 29–31 July, or as late as the 1 August, though the second interval might move to ~10 July. In the case of the second period occurring near to the beginning of July, the first period moved closer to the end of June (25 June). In some years, all three periods occurred within these three intervals.
In some years, the date of summer mode detection was late in June or early in August. However, the variation of the monthly number ratio to the total summer lightning strokes number (and further, the relative lightning number) can be studied. The monthly relative lightning number (Figure 4a) was quite similar in terms of indicating the most productive lightning strokes month to the analogue parameter for coordinates of Yakutia based only on the WWLLN data in 2009–2015 (Figure 4b). The difference in 2016 was a result of high lightning activity in July (especially on 18–21 July) in the region of 51–54° N, 125–135° E (not Yakutia) covered by the effective radius of the ShICRA’s detector. The largest ratio was in July 2016 in comparison with ratios in June and August according to the WWLLN data for the area limited to a radius of 1200 km around Yakutsk.
Thus, one may estimate the monthly total lightning number variation in the entire area of Yakutia in 1999–2008. In July, the lightning rate prevailed in 1999–2007, as was revealed in previous studies [3,4,5]. The lightning seasonal variation was estimated by the negative quadratic function with a maximum in the middle of the summer [3,4,5]. Since 2008, the seasonal maximum has shown some oscillation behavior, moving from the midsummer to the end of summer and to its beginning (Figure 4a). This kind of oscillation in Yakutia continued throughout 2009–2019, based on the data of the WWLLN (Figure 4b). The quasi-period of the oscillation was about four years in 2009–2019.

3.2. Central Yakutia

3.2.1. Lightning Activity Seasons’ Beginning and Ending

The Stormtracker observations resulted in a summer total lightning stroke number on average about 1.5 times that of the WWLLN observation. It was caused by a different approach to determine the lightning location and was explained in Section 2.3. The Stormtracker data was used in that section. Since the Stormtracker sensor has a broadband receiver that detects pulses of a small magnitude, the data could be false due to long propagation of VLF-wave or industrial interference; we assumed that 10 strokes per hour within 1 degree indicated that there was some lightning activity that day in the area within a 480-km radius around Yakutsk. The threshold was set empirically according to the previous studies in Yakutia defined that the number of lightning strokes in July varied from 10 strokes to 3500 strokes per hour [23], and the average spatial extension of a single-cell storm producing lightning was 20–30 km and for multi-cell storm was 100–150 km using cluster analysis [40]. The first day of non-isolated thunderstorm (observed by three or more meteorological stations within two days) in Central Yakutia often occurs in late May. The day of the beginning of lightning activity season was in the last third of May (the average date was 21 May) and moved earlier in 2015 and 2019 (Figure 5). The day of the first thunderstorm was sometimes in April, as observed both instrumentally and by surface weather reading. However, the thunderstorm was isolated (and was marked by less than three meteorological stations), of short duration (<1 h), resulted in small numbers of lightning strokes, and was not considered in this paper.
The day of the season’s ending was postponed from the end of August to the middle of September in 2014–2019. The variation in the date of the lightning activity season’s ending may be fit by the quadratic function with a negative first coefficient for 2009–2019 as p1 × x2 + p2 × x + p3, where the coefficients (with 95% confidence interval) are p1 =−0.54 (−0.96, −0.13), p2 = 9.38 (4.3, 14.47), and p3 = 4.004 × 10⁴ (4.002 × 10⁴, 4.005 × 10⁴), and x is an order of year (2009 was taken as a first year). The polynomial fit (the determination coefficient was 0.84) considered the shift of season’s beginning to the late September since 2013 to be significant. The line trend of type as p1 × x + p2, where p1 = 2.84 (1.27, 4.4, is 95% confidence bounds), p2 = 40,052 (40,041, 40,063), and x is an order of year, which agreed with variation with determination coefficient of 0.65 and F1,9 = 16.76, p = 0.027. The significance of the shift was also confirmed by the linear trend, but it was delayed to the season of 2015 and did not agree with the process of observed saturation in 2014–2019 (Figure 5).

3.2.2. Seasonal Variation in Central Yakutia

The variation of the lightning number in central Yakutia always had two to three periods of local maxima in summer (Figure 6a). The first period was on 10 June, and the second peak was often in July, or sometimes in early August. Severe storms were quite rare in late August but were observed every year in 2017–2019. The most lightning-productive storms were often caused by cyclones moving mostly from the southwest, as noted in the 2019 season by the positive values of zonal and meridional wind components during most of the periods with lightning activity (Figure 6). In the rear of southwestern cyclones, there is often an invasion of Arctic air [39]. This causes periods of significantly reduced lightning activity before or after the peaks in lightning number seasonal variation in central Yakutia. In the season of 2019, it was associated with northeastern wind—negative values of zonal and meridional wind components at 850 hPa (Figure 6a). The difference between the relative level of the peaks representing sferic numbers detected by WWLLN and Stormtracker is explained by the daily ratio of the number of lightning strokes with high currents, detected mostly by the WWLLN, to the number of lightning strokes with fewer currents, which were better detected by Stormtracker (Section 2.3).
The seasonal maximum appeared from the middle of June one year and to late July the other year and spread widely within a season. To define lightning activity’s summer maximum, the monthly lightning stroke numbers were presented by its ratio to the total summer lightning number (Figure 7). The 11-year variation showed that seasonal maximum displacement to the middle of the summer was more common (occurring in five of the measured years).
Although the seasonal maximum varied from the summer ending to its beginning quite randomly, the quasi period was around 2–4 years. The seasonal maximum was displaced every year except the summers of 2012–2013, when the lightning activity was 2–3 times greater in June than in other months as it was for the whole of the Yakutia region. The lightning number was significantly greater in August in 2011 and 2018 than in other years. In 2018, it was caused by the position of thunderstorms with the highest lightning rate in the south of Yakutia in June, and some of it was in the west of Yakutia in July, not in the central part. That resulted in differences between observations central Yakutia and the rest of the region. In June of 2017, severe storms were often out of the effective area of Stormtracker (to the southwest, west, and northwest), which resulted in the difference of monthly ratios between central Yakutia and the whole region.

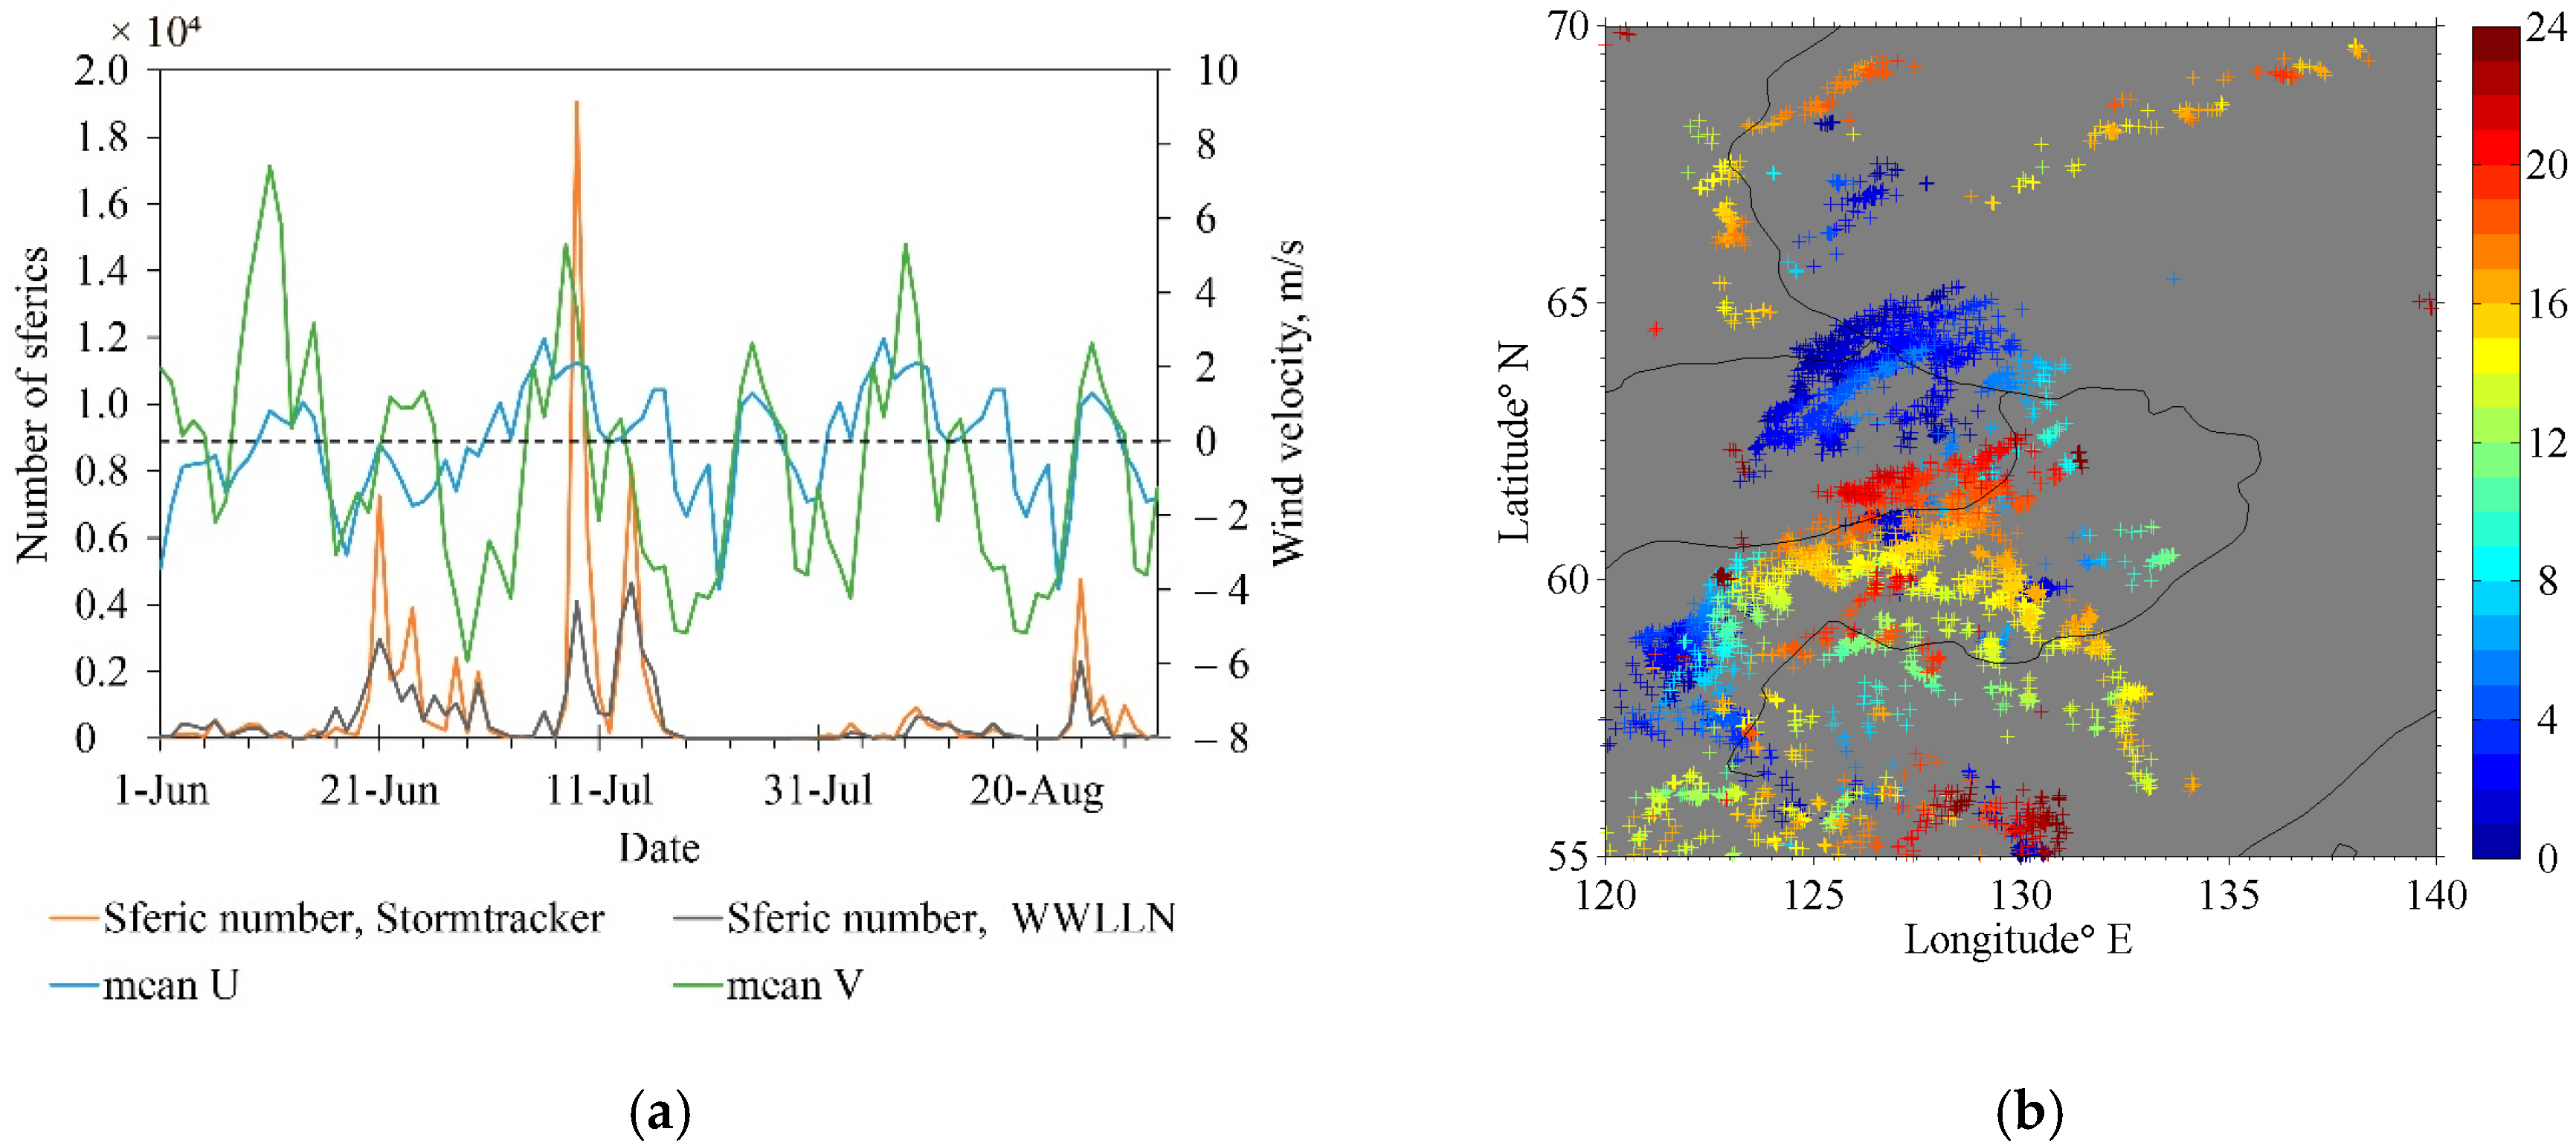
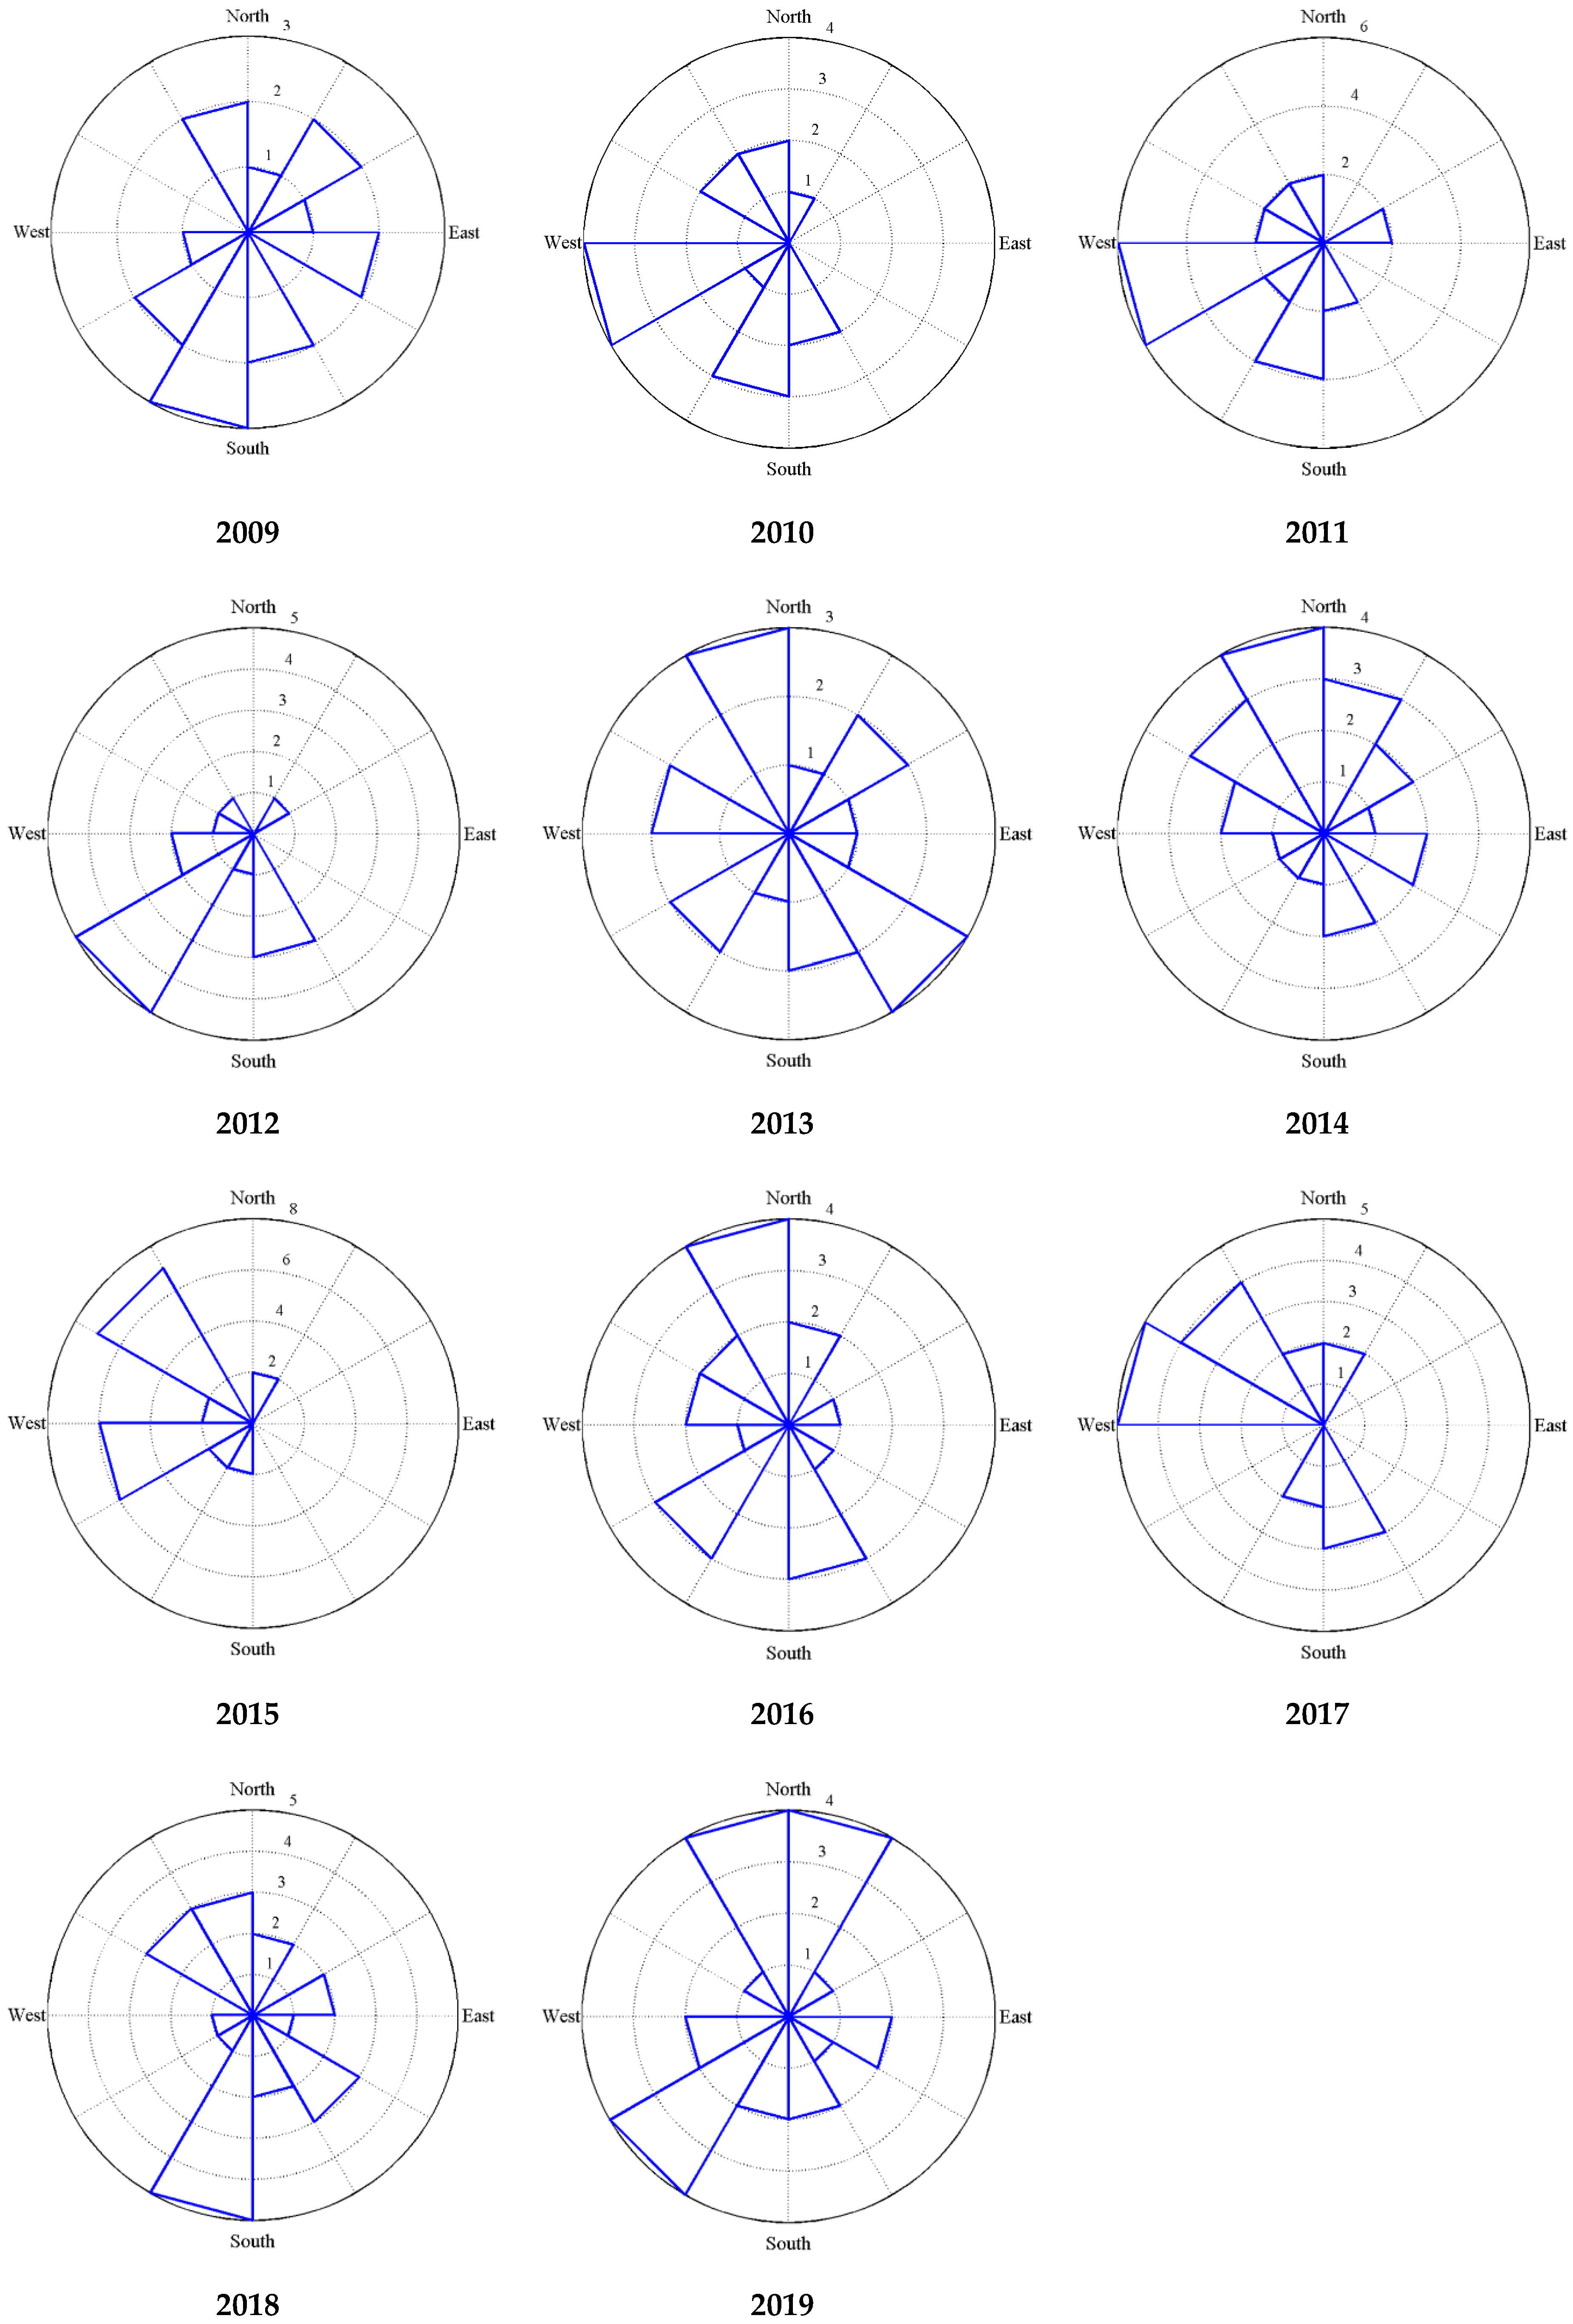
3.2.3. Preliminary Comparison with Average Wind Direction

According to meteorological observations, thunderstorms in Yakutia occur mainly at the weather front (67%) [39]. We analyzed the wind direction associated with lightning seasonal variation peaks of daily resolution. The local peaks were selected by a threshold of 50 strokes per hour that was defined in a previous study [23]. It found that the lightning rate in 78% of storms events in Yakutia was about 60 stroke/hour in the early stage of the thunderstorm, around 100 stroke/hour at the mature stage, and about 40 stroke/hour in the last stage. The average daily values of zonal and meridional components at the geopotential height of 850 hPa pressure level over the area of 55–70° N 120–140° E were obtained by the data of the ERA-Interim Reanalysis of the European Centre for Medium-Range Weather Forecasts, with a 2.5-degree spatial resolution. The wind components were averaged over the area, and the speed and meteorological direction were derived from the averaged components. The total histogram for 11 years of observation gives the general direction and speed of the wind patterns common in central Yakutia (Figure 8a). The wind speed on the days of lightning peaks had a slightly greater skew (0.72) toward 2–3 m/s than the common values of speed (0.58), which were around 2 m/s. The general direction of wind was from southwest and northwest (Figure 8b) because the Verkhoyansk Range is on the east and northeast to the area of consideration (Figure 1). The derived general directions confirmed the frequent direction of cyclones’ paths in the 1970s [39] and showed that lightning activity in the central part of Yakutia associated with the wind from the northwest had the same total frequency as the southwestern wind. In an earlier study [39], the frequency of southwestern direction was 1.3 higher than the frequency of the northwestern direction.
The prevailing wind direction changed every summer (Figure 9). The southwestern direction prevailed in 2009–2012; however, the wind direction in 2011 did not differ much from other years and was associated with the largest lightning numbers in 2009–2012. The northwestern and southeastern directions prevailed in 2013, 2014, and 2016. It is probable that a north direction of the wind could reduce lightning activity. In 2017, there was a large increase in the total lightning number that was perhaps associated with the frequent western direction, though a southwestern direction was not frequent. The average wind in the summer of 2019 had frequent northern components, along with a southwestern component, and lightning activity was high. The day of the maximum lightning number in 2019 was associated with the southwestern direction (Figure 6a).

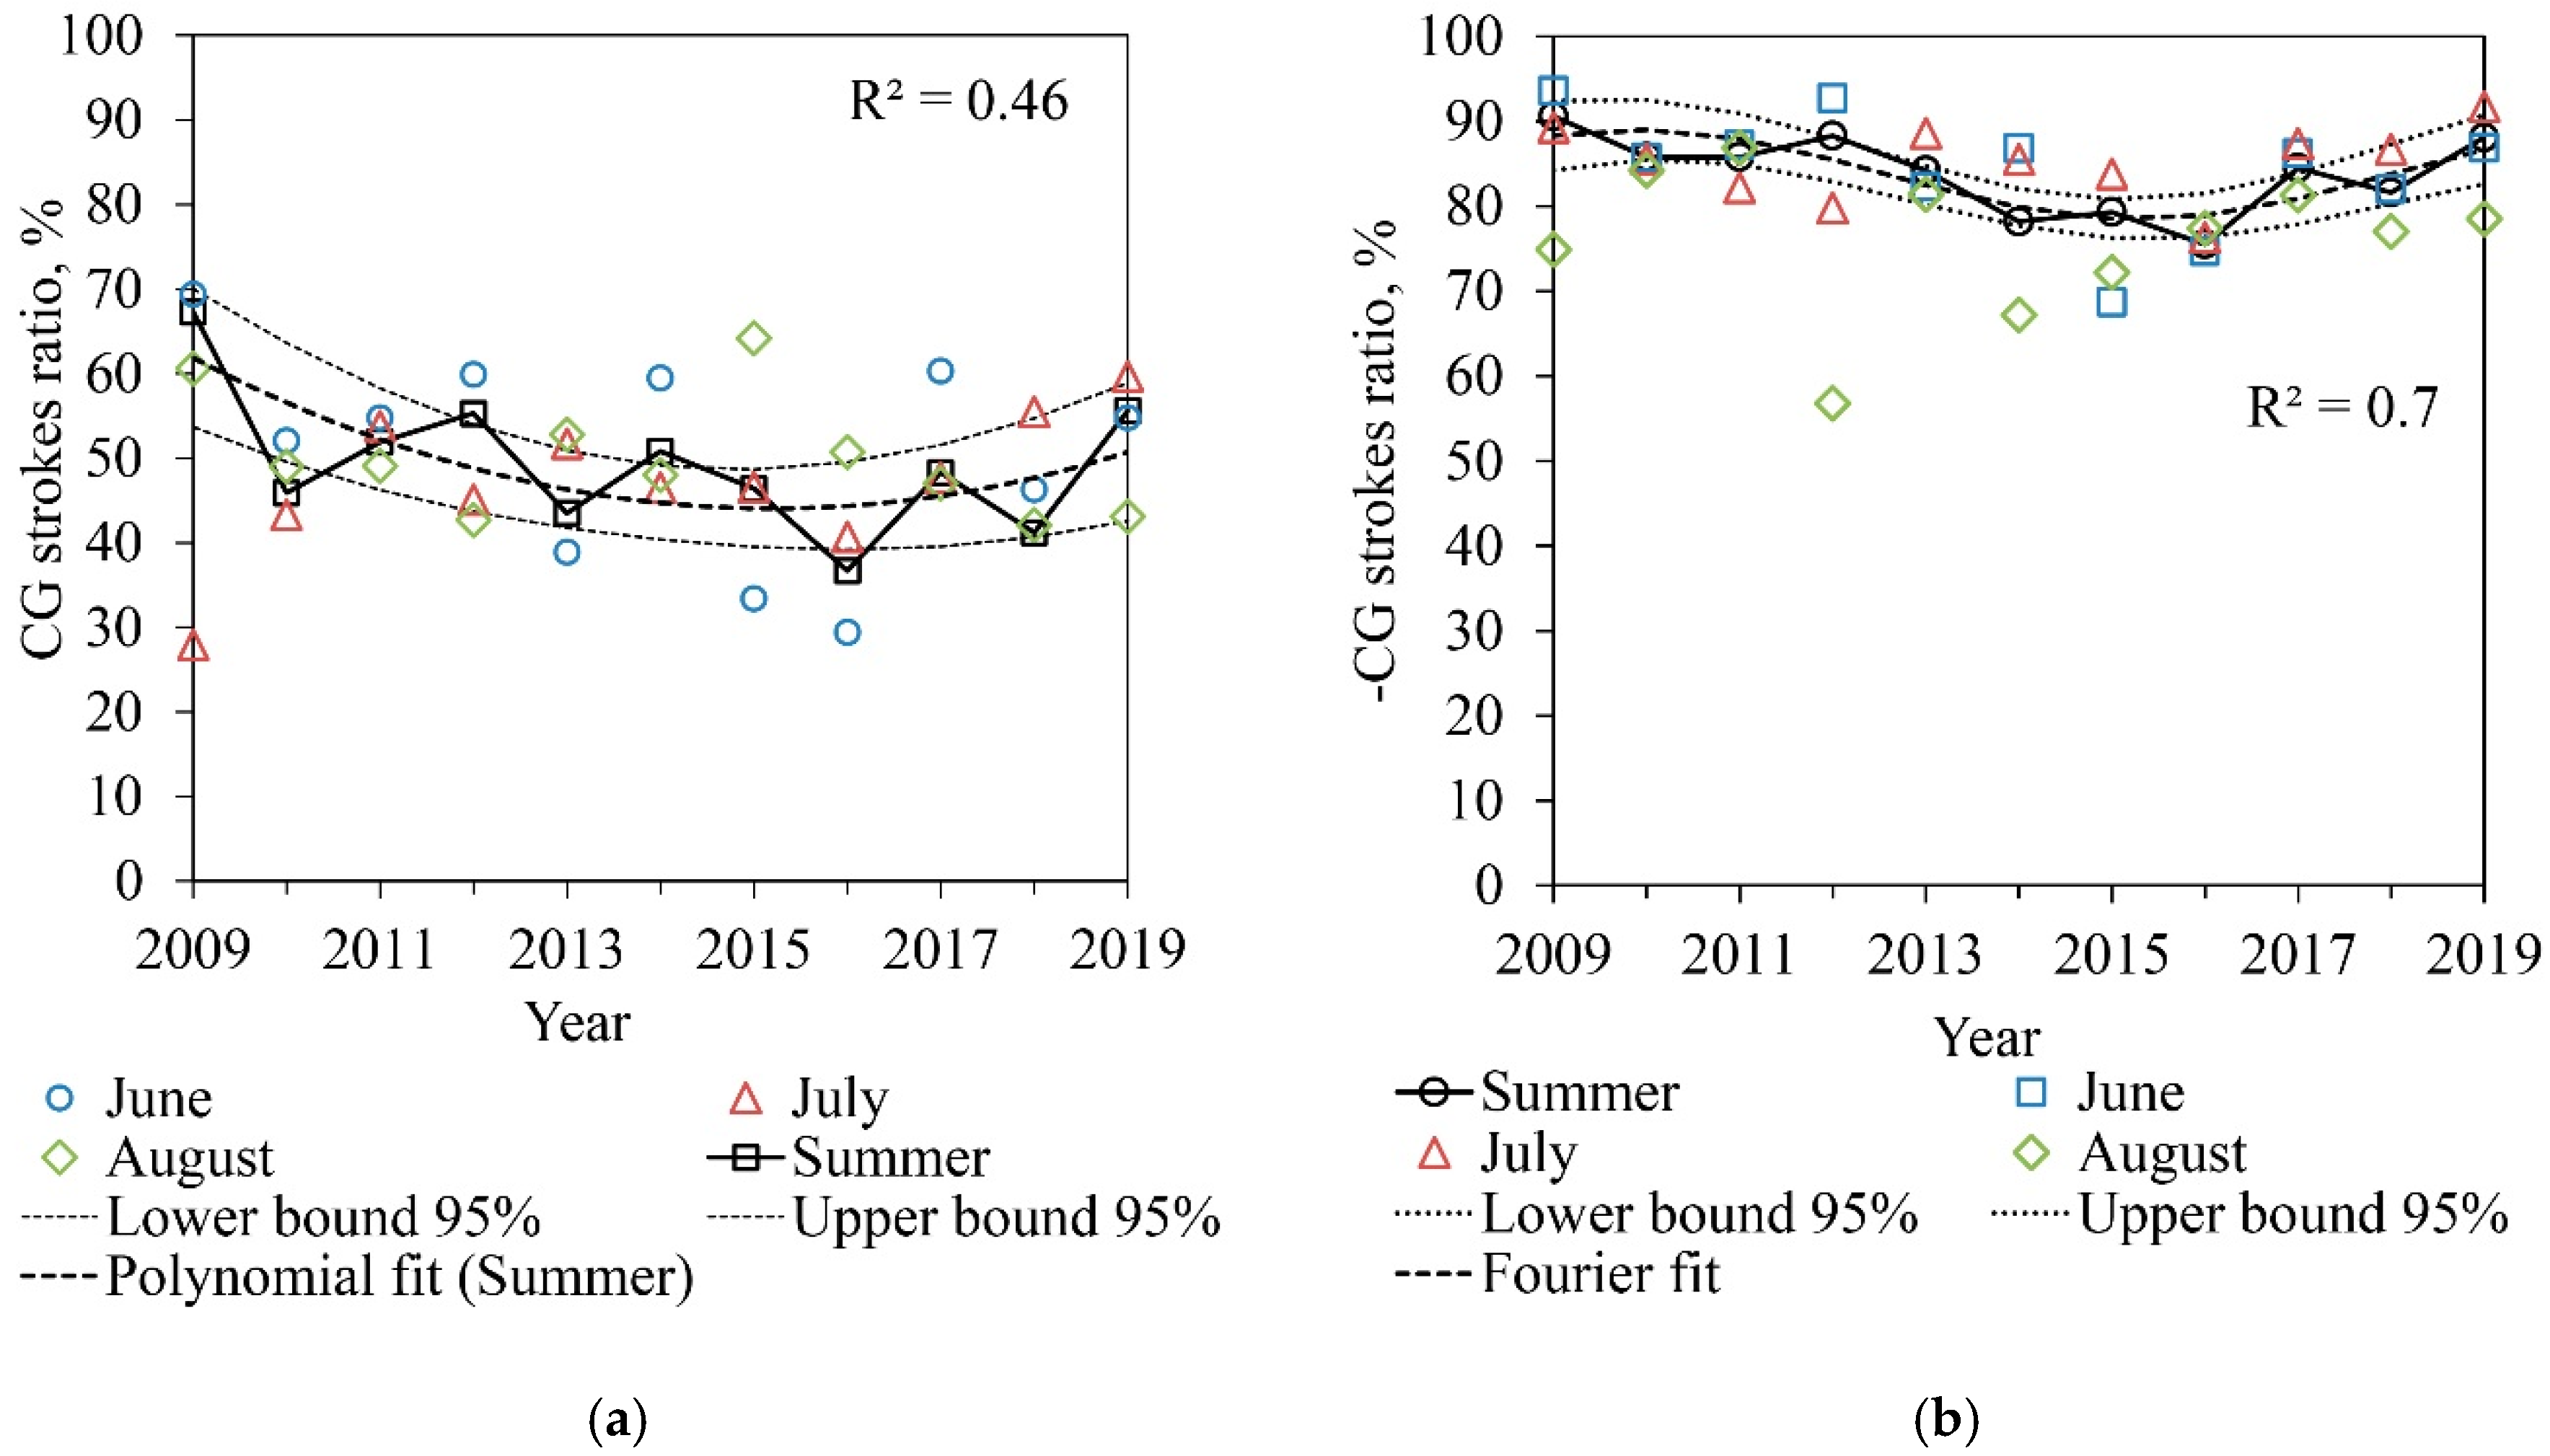
3.2.4. Ratio of Number of Common Lightning Types to the Total Lightning Number

The rates of two general types of lightning discharge were estimated. The ratio of the cloud-to-ground stroke monthly number to the annual number of lightning of any type varied around 40–60% (Figure 10a). In 2009–2019, it can be fit by a quadratic function with the determination coefficient being 0.46: p1 × x2 – p2 × x + p3, where x is an order of the year (the first year in order is 2009), p1 = 0.46 (with 95% confidence limits: −0.07, 0.99), p2 = −6.66 (−13.24, −0.08), p3 = 68.06 (50.88, 85.23). The polynomial fit indicated the significant decrease of ~10% in 2015–2016. The CG stroke daily rate varied around 50–60% of the daily lightning number and had an asymmetric distribution toward smaller rates. The negative CG stroke monthly rate also showed a decrease of ~15% in 2015–2016, indicated by polynomial or Fourier fit (Figure 10b). Fitting by a quadratic function corresponded to the variation with the determination coefficient of 0.58, the function coefficients are p1 = 0.32 (with 95% confidence limits: 0.06, 0.59), p2 = −4.47 (−7.76, −1.18), p3 = 95.72 (87.14, 104.3). The Fourier fit of a0 + a1 × cos(x × w) + b1 × sin(x × w) where a0 = 83.73 (with 95% confidence limits: 81.05, 86.42), a1 = 2.39 (−5.91, 10.69), b1 = 4.7 (−0.29, 9.69), and w = 0.58 (0.34, 0.82), gave better correspondence: R2 = 0.7. However, the oscillation period derived as t = 2 π/w is 10.83 (7.66, 18.49), which is the number of years of observation. Therefore, the extension of observation duration is required to determine if the variations of CG and negative CG ratios are oscillatory processes. The daily ratio of negative CG strokes had a standard asymmetric distribution, with a peak around 80–90%. The peak of distribution decreased to an interval of 60–80% in 2015–2016.

4. Discussion

The lightning density average in 2009–2019 was strongly related to the local orography. Almost half of the Yakutia area is elevated 100–500 m above sea level, and hence, this height interval was associated with a peak of lightning density distribution. However, the highest lightning density was associated with the mountains (700–1000 m) in the south and east of Yakutia. One may note the high lightning density at the beginning of the Lena River and at the narrow area of the lowland between the Vilyuy River and Lena River. This lightning density was probably associated with the path of the southern outlets there. Studies with different methods (elevation, elevation difference, and slope as parameters) found a large dispersion of lightning densities related to orographical factors caused by the various relative positions of the mountains, highlands, and rivers [41,42,43,44,45]. This problem should be studied further in future research.
Although the general change in the positive trend does not go beyond the interannual variability, one can note some trend toward an increase in the number of lightning in Yakutia over 11 years. Lightning activity in most of the Yakutia area showed similar annual variations throughout 2009–2019. The increment of the summer lightning number in 2013–2014 in central Yakutia (Stormtracker, Figure 2) differed from the increment of the total number in the whole area of Yakutia, as detected by the WWLLN. However, the same increment change in 2013–2014, and no positive major trend, were observed in the region to the south of Yakutia (40–55° N, 110–140° E), according to the data of the WWLLN. The same increase in the total lightning stroke number in 2013 was detected also by the ShICRA sensor in Yakutia (Figure 2), and by the WWLLN in the region to the southwest of Yakutia (Figure 3). The high lightning rates in the southern and southwestern parts of Yakutia dominated the annual variation in the total lightning number in the whole area. Generally, lightning activity in Yakutia was a good indicator of lightning activity in the entire region of North Asia (60–180° E, 40–80° N) in 2009–2019 (Figure 3). The positive trend in the lightning number in North Asia, contrary to the lack of a trend in the eastern region (Figure 3), was defined by the increasing lightning number in a second region with high lightning density (60–90° E, 47–62° N) in western Siberia [46]. The local atmospheric air mass is most likely under the influence of air transfer from the southern region, and the air mass transport from the west or southwest also contributes to the lightning activity’s positive trend. The influence of lightning activity in the southern regions of Yakutia was revealed on a large time scale (long-term fluctuations). However, further investigation of individual storm paths and development is required.
The annual variation in 1999–2009 could not be accurately estimated because the threshold of the summer mode was not regular. However, the lightning stroke number variation might be estimated within seasons using the data of the ShICRA lightning direction finder due to uniform detection levels in summer. The seasonal variation in the lightning stroke number in Yakutia showed a pattern with several intervals of a high lightning rate. Severe or frequent storms were often in the middle of the summer, in July, until 2007. However, the period of storms resulting in a large daily lightning stroke number moved to June or August in 2008–2019. A long-term observation of lightning activity in Yakutia is needed to define the whole oscillation pattern.
The lightning number variation in central Yakutia reflected the total variation in the whole area of Yakutia, though the thunderstorm season in the central area had a different duration to the lightning activity over the area of 56–74 N, 105–160 E. The thunderstorm season begins earlier in the southern part of Yakutia, probably under the influence of cyclones moving from the eastern region of North Asia. Thunderstorms may penetrate to the central area or develop there while the temperature is increasing, usually in May. In central Yakutia, the duration of the thunderstorm season showed a positive trend (R2 = 0.46) in 2009–2019, with extended lightning activity seasons in 2015 and 2019. The lightning activity season in the central area showed variations in terms of the most active month: the seasonal maximum in the monthly lightning number moved from the middle of the summer toward its end and beginning every 2–4 years. Since there was a period of a permanent maximum in July in 1999–2007, the changes in the period of 2009–2019 may have been driven by atmospheric circulation changes over the Yakutia region.
A third (34.6%) of all selected lightning local peaks were associated with the eastern wind component (daily mean U < 0), and almost a half (48%) of local peaks were associated with the northern wind component (daily mean V < 0). The greatest daily lightning numbers, which greatly contributed to the annual total lightning number, were more often associated with the wind from the west and southwest in 2009–2019. The large lightning number peaks were not often on days with a northwestern mean wind or eastern mean wind. The defined wind direction associated with the largest lightning local peaks confirmed the usual cyclones tracks [39,47]. The lightning density on the land strongly relates to the convection available potential energy (CAPE) multiplying on the precipitation [48,49,50], and the other important weather parameter is the vertical wind shear [51,52,53]. The southwestern direction of the wind, moving warm moist air from the south, might cause better conditions for CAPE enhancement in Central Yakutia, leading to a greater potential for severe weather. The north direction might move cold dry air that collapses with warm air in the central Yakutia, followed by resultant weather changes.
The ratio of the CG lightning stroke number was probably higher than the natural value [29,30] due to the electrical field sensor operating principle: it detects vertical CG lightning discharge better than IC strokes. However, due to the constant functioning of the annual variation, the CG stroke ratio can be defined. There was a slight decrease in the ratio of the CG lightning number and negative CG lightning number in the summer of 2015; hence, the positive CG lightning number slightly increased in 2015. Due to the mechanism being different to that of negative strokes, the positive CG lightning discharge often generates larger and longer currents [54,55]. Thus, the likelihood of technical damage or forest fires caused by positive CG strokes is higher.

5. Conclusions

The study presents the results of instrumental observation of lightning activity in the Yakutia region for the period of 2009–2019. The average lightning density in Yakutia tends to decrease with increasing latitude and has a remarkable dependence on orography. The lightning density in the south and southwestern regions reached five times greater values than in the central and northern parts of Yakutia. The highest lightning density occurs along the southern and eastern side of the Verkhoyansk, Cherskiy and Momskiy Ranges. The lightning density on the eastern slope of the Verkhoyansk Range sharply decreases by ~10 times in comparison with the maximum at wide range of heights (around 300 m and 700–1000 m).
The annual total lightning number in Yakutia showed a slight positive trend in 2009–2019 with a maximum in 2017 (about 3.2 × 10⁵ strokes according to the WWLLN data corrected by the network’s relative detection efficiency). The variation related to lightning activity changes in the whole of North Asia and its central area at 90–110° N, 45–50° N with a coefficient of ~0.8. The southern outlets’ influence on thunderstorms in most of the Yakutia area was confirmed by previous studies [39,56]. However, the daily average wind direction showed three probable paths from where severe storms condition may occur: the southwest, the northwest, and the west.
The daily negative CG stroke ratio of the total CG stroke number had an ordinary distribution around 80–90% on average. The ratios of the annual CG stroke and negative CG stroke number decreased by about ~15% in 2015.
The thunderstorm season duration showed a positive trend up to 2015 in central Yakutia, and the thunderstorm season duration in the entire area of 56–74° N, 105–160° E varied widely in 2009–2019. The seasonal variation in the lightning activity in Yakutia and in its central area showed similar patterns, with several (1–3) periods of high lightning activity. The invasion of Arctic air in the rear of southwestern cyclones [39] caused periods of significantly reduced lightning activity after the peaks in lightning number seasonal variation. The lightning seasonal maximum was often in July in 1999–2007, and the maximum shifted widely in 2008–2019. Since 2007, it has been changing position throughout the summer non-linearly. The change in lightning season pattern over the last decade implies the need for long-term observation of lightning activity at northern latitudes.

Author Contributions

Conceptualization, V.K. and L.T.; methodology, V.K. and L.T.; software, L.T.; validation, V.K.; formal analysis, L.T.; investigation, L.T.; resources, V.K.; writing—original draft preparation, L.T. and V.K.; data curation, L.T.; writing—review and editing, V.K.; visualization, L.T.; supervision, V.K.; project administration, V.K.; funding acquisition, V.K. All authors have read and agreed to the published version of the manuscript.

Funding

The equipment maintenance was funded by the budget theme II.16.2.1. (State registration number No. AAAA-A17-117021450059-3).

Acknowledgments

The authors are grateful to the World Wide Lightning Location Network and R.H. Holzworth. The authors also thank Viktor A. Mullayarov for his contribution and guidance at the beginning of the instrumental observations in Yakutia.

Conflicts of Interest

The authors declare no conflict of interest.

References

  1. Filippov, A.K. Thunderstorms of Eastern Siberia; Hydrometeoizdat: Leningrad, Russia, 1974; p. 75. [Google Scholar]
  2. Filippov, A.K.; Khutyoryanskaya, D.F. Statistical characteristics of thunderstorms in Yakutia. Rep. Inst. Geogr. Sib. Far East 1971, 31, 39–47. [Google Scholar]
  3. Kozlov, V.I.; Mullayarov, V.A. Instrumental observations of thunderstorm activity in Yakutia in 1993–1994. Russ. Meteorol. Hydrol. 1996, 2, 105–109. [Google Scholar]
  4. Kozlov, V.I.; Mullayarov, V.A.; Laptev, A.D.; Valkov, S.P.; Gromov, B.N. Detecting thunderstorm activity in Yakutiya by means of one-site thunderstorm direction-range finder. Izv. Atmos. Ocean. Phys. 1996, 32, 199–204. [Google Scholar]
  5. Kozlov, V.I.; Mullayarov, V.A. Lightning Activity in Yakutia; YaSC SB RAS: Yakutsk, Russia, 2004; p. 103. [Google Scholar]
  6. Cecil, D.J.; Buechler, D.E.; Blakeslee, R.J. Gridded lightning climatology from TRMM-LIS and OTD: Dataset description. Atmos. Res. 2014, 135, 404–414. [Google Scholar] [CrossRef] [Green Version]
  7. Moskovenko, V.M.; Znamenschikov, B.P.; Zolotarev, S.V. Application of the Vereya-MR lightning direction finding system in the interests of the Russian power industry. New Russ. Electr. Power Ind. 2012, 2, 15–23. [Google Scholar]
  8. McGee, T.; McFarlane, B.; Tymstra, C. Wildfire: A Canadian perspective. In Wildfire Hazards, Risks and Disasters; Shroder, J.F., Paton, D., Eds.; Elsevier: Amsterdam, The Netherlands, 2015; pp. 35–58. [Google Scholar] [CrossRef]
  9. Veraverbeke, S.; Rogers, B.; Goulden, M.; Jandt, R.R.; Miller, C.E.; Wiggins, E.B.; Randerson, J.T. Lightning as a major driver of recent large fire years in North American boreal forests. Nat. Clim. Chang. 2017, 7, 529–534. [Google Scholar] [CrossRef]
  10. The Ministry of the Russian Federation for Civil Defence, Emergencies and Elimination of Consequences of Natural Disasters. Available online: https://14.mchs.gov.ru/deyatelnost/poleznaya-informaciya/dopolnitelnye-stranicy/konstruktor-blokov/pravaya-kolonka/intervyu/1749024 (accessed on 30 July 2020).
  11. Tomshin, O.A.; Solovyev, V.S. Detection of burnt areas in Yakutia on long-term NOAA satellites data (1985–2015). In Proceedings of the 24th International Symposium on Atmospheric and Ocean Optics: Atmospheric Physics, Tomsk, Russia, 2–5 July 2018; Matvienko, G.G., Romanovskii, O.A., Eds.; SPIE: Bellingham, WA, USA, 2018; Volume 10833. [Google Scholar] [CrossRef]
  12. Reeve, N.; Toumi, R. Lightning activity as an indicator of climate change. Q. J. R. Meteorol. Soc. 1999, 125, 893–903. [Google Scholar] [CrossRef]
  13. Yijun, Z.; Ming, M.; Weitao, L.U.; Shanchang, T.A.O. Review on climate characteristics of lightning activity. J. Meteorol. Res. 2010, 24, 137–149. [Google Scholar]
  14. Avila, E.E.; Bürgesser, R.E.; Castellano, N.E.; Collier, A.B.; Compagnucci, R.H.; Hughes, A.R. Correlations between deep convection and lightning activity on a global scale. J. Atmos. Sol. Terr. Phys. 2010, 72, 1114–1121. [Google Scholar] [CrossRef]
  15. Teufel, B.; Sushama, L. Abrupt changes across the Arctic permafrost region endanger northern development. Nat. Clim. Chang. 2019, 9, 858–862. [Google Scholar] [CrossRef]
  16. Dowden, R.L.; Brundell, J.B.; Rodger, C.J. VLF lightning location by time of group arrival (TOGA) at multiple sites. J. Atmos. Sol. Terr. Phys. 2002, 64, 817–830. [Google Scholar] [CrossRef]
  17. Hutchins, M.L.; Holzworth, R.H.; Rodger, C.J.; Brundell, J.B. Far-field power of lightning strokes as measured by the World Wide Lightning Location Network. J. Atmos. Ocean. Technol. 2012, 29, 1102–1110. [Google Scholar] [CrossRef]
  18. Saba, M.M.F.; Ballarotti, M.; Pinto, O., Jr. Negative cloud-to-ground lightning properties from high-speed video observations. J. Geophys. Res. Atmos. 2006, 111, D03101. [Google Scholar] [CrossRef] [Green Version]
  19. Rakov, V.A.; Huffines, G.R. Return stroke multiplicity of negative cloudtoground lightning flashes. J. Appl. Meteorol. 2003, 42, 1455–1462. [Google Scholar] [CrossRef]
  20. Tarabukina, L.D.; Kozlov, V.I. Parameters of radio pulses of cloud-to-ground multiple-stroke lightning discharges in Northeast Asia. Izv. Atmos. Ocean. Phys. 2016, 52, 271–276. [Google Scholar] [CrossRef]
  21. Nag, A.; Rakov, V.; Schulz, W.; Saba, M.M.F.; Thottappillil, R.; Biagi, C.J.; Filho, A.O.; Kafri, A.; Theethayi, N.; Götschl, T. First versus subsequent return-stroke current and field peaks in negative cloud-to-ground lightning discharges. J. Geophys. Res. Atmos. 2008, 113, D19112. [Google Scholar] [CrossRef] [Green Version]
  22. Li, Q.; Li, K.; Chen, X. Research on lightning electromagnetic fields associated with first and subsequent return strokes based on Laplace wavelet. J. Atmos. Sol. Terr. Phys. 2013, 93, 1–10. [Google Scholar] [CrossRef]
  23. Kozlov, V.I.; Mullayarov, V.A.; Vasiliev, A.E. Characteristics of thunderstorm cores in Yakutia in 1993–2001 from instrumental observations. Russ. Meteorol. Hydrol. 2003, 2, 39–45. [Google Scholar]
  24. Kozlov, V.I.; Mullayarov, V.A.; Karimov, R.R. Tool measurements of thunderstorms in Yakutia in 2003–2006. Radiophys. Quantum Electron. 2008, 51, 745–749. [Google Scholar] [CrossRef]
  25. Astrogenic Systems. Available online: https://www.astrogenic.com/nexstorm_lite.html (accessed on 8 August 2020).
  26. Kozlov, V.I.; Markova, A.; Shabaganova, S.N. Errors of methods of one and two points locating the lightning discharge system. Nauka Obraz. 2010, 1, 7–12. [Google Scholar]
  27. World Wide Lightning Location Network. Available online: wwlln.net (accessed on 8 August 2020).
  28. Rodger, C.J.; Werner, S.; Brundell, J.B.; Lay, E.H.; Thomson, N.R.; Holzworth, R.H.; Dowden, R.L. Detection efficiency of the VLF World-Wide Lightning Location Network (WWLLN): Initial case study. Ann. Geophys. 2006, 24, 3197–3214. [Google Scholar] [CrossRef] [Green Version]
  29. De Souza, P.; Pinto, O., Jr.; Pinto, I.; Ferreira, N.; Dos Santos, A.F. The intracloud/cloud-to-ground lightning ratio in Southeastern Brazil. Atmos. Res. 2009, 91, 491–499. [Google Scholar] [CrossRef]
  30. Soriano, L.R.; de Pablo, F. Total flash density and the intracloud/cloud-to-ground lightning ratio over the Iberian Peninsula. J. Geophys. Res. Atmos. 2007, 112, D13114. [Google Scholar] [CrossRef]
  31. Adzhiev, A.H.; Kuliev, D.D. Characteristics of Storm Activity and Parameters of Lightning Discharges in the South of the European Part of Russia. Izv. Atmos. Ocean. Phys. 2018, 54, 372–379. [Google Scholar] [CrossRef]
  32. Rudlosky, S.D.; Shea, D.T. Evaluating WWLLN performance relative to TRMM/LIS. Geophys. Res. Lett. 2013, 40, 2344–2348. [Google Scholar] [CrossRef]
  33. Bürgesser, R.E. Assessment of the World Wide Lightning Location Network (WWLLN) detection efficiency by comparison to the Lightning Imaging Sensor (LIS). Q. J. R. Meteorol. Soc. 2017, 143, 2809–2817. [Google Scholar] [CrossRef]
  34. Abarca, S.F.; Corbosiero, K.L.; Galarneau, T.J. An evaluation of the Worldwide Lightning Location Network (WWLLN) using the National Lightning Detection Network (NLDN) as ground truth. J. Geophys. Res. Atmos. 2010, 115, D18206. [Google Scholar] [CrossRef]
  35. Holzworth, R.H.; McCarthy, M.P.; Brundell, J.B.; Jacobson, A.R.; Rodger, C.J. Global Distribution of Superbolts. J. Geophys. Res. Atmos. 2019, 124, 9996–10005. [Google Scholar] [CrossRef] [Green Version]
  36. Hutchins, M.L.; Holzworth, R.H.; Brundell, J.B.; Rodger, C.J. Relative detection efficiency of the World Wide Lightning Location Network. Radio Sci. 2012, 47, 1–9. [Google Scholar] [CrossRef]
  37. EOSDIS Worldview. Available online: https://worldview.earthdata.nasa.gov (accessed on 8 August 2020).
  38. Amante, C.; Eakins, B.W. ETOPO1 1 Arc-Minute Global Relief Model: Procedures, Data Sources and Analysis. NOAA Technical Memorandum NESDIS NGDC-24; National Geophysical Data Center, NOAA: Boulder, CO, USA, 2009. [Google Scholar] [CrossRef]
  39. Schwer, C.A.; Izyumenko, S.A. The Climate of Yakutsk; Hydrometeoizdat: Leningrad, Russia, 1982; 246p. [Google Scholar]
  40. Kozlov, V.I.; Mullayarov, V.A.; Shabaganova, S.N. Characteristics of thunderstorm cores from observations in Yakutia. Russ. Phys. J. 2013, 56, 398–404. [Google Scholar] [CrossRef]
  41. Bourscheidt, V.; Junior, O.P.; Naccarato, K.P.; Pinto, I.R.C.A. The influence of topography on the cloud-to-ground lightning density in South Brazil. Atmos. Res. 2009, 91, 508–513. [Google Scholar] [CrossRef]
  42. Kilinc, M.; Beringer, J. The Spatial and Temporal Distribution of Lightning Strikes and Their Relationship with Vegetation Type, Elevation, and Fire Scars in the Northern Territory. J. Clim. 2007, 20, 1161–1173. [Google Scholar] [CrossRef] [Green Version]
  43. Kotroni, V.; Lagouvardos, K. Lightning occurrence in relation with elevation, terrain slope, and vegetation cover in the Mediterranean. J. Geophys. Res. Atmos. 2008, 113, D21118. [Google Scholar] [CrossRef]
  44. Tarabukina, L.D.; Kozlov, V.I.; Karimov, R.R.; Mullayarov, V.A. Spatial pattern of lightning strikes in North Asia. Russ. Meteorol. Hydrol. 2017, 42, 88–94. [Google Scholar] [CrossRef]
  45. Oulkar, S.; Siingh, D.; Saha, U.; Kamra, A.K. Distribution of lightning in relation to topography and vegetation cover over the dry and moist regions in the Himalayas. J. Earth Syst. Sci. 2019, 128, 180. [Google Scholar] [CrossRef] [Green Version]
  46. Tarabukina, L.D.; Kozlov, V.I. Spatial and temporal distribution of lightning strokes over north Asia and its comparison with solar activity variations in 2009–2016. Sol. Terr. Phys. 2017, 3, 65–69. [Google Scholar] [CrossRef] [Green Version]
  47. Latysheva, I.V.; Loshenko, K.A.; Shahaeva, E.V.; Smetanin, G.S. The circulation characteristics of anomalous weather phenomena on the territory of Russia in the summer of 2013. The Bulletin of Irkutsk State University. Ser. Earth Sci. 2013, 6, 125–137. [Google Scholar]
  48. Romps, D.M.; Seeley, J.T.; Vollaro, D.; Molinari, J. Projected increase in lightning strikes in the United States due to global warming. Science 2014, 346, 851–854. [Google Scholar] [CrossRef]
  49. Dewan, A.; Ongee, E.T.; Rafiuddin, M.; Rahman, M.M.; Mahmood, R. Lightning activity associated with precipitation and CAPE over Bangladesh. Int. J. Clim. 2018, 38, 1649–1660. [Google Scholar] [CrossRef]
  50. Pineda, N.; Rigo, T.; Bech, J.; Soler, X. Lightning and precipitation relationship in summer thunderstorms: Case studies in the North Western Mediterranean region. Atmos. Res. 2007, 85, 159–170. [Google Scholar] [CrossRef]
  51. Ray, P.S.; MacGorman, D.R.; Rust, W.D.; Taylor, W.L.; Rasmussen, L.W. Lightning location relative to storm structure in a supercell storm and a multicell storm. J. Geophys. Res. Atmos. 1987, 92, 5713–5724. [Google Scholar] [CrossRef]
  52. Mecikalski, R.M.; Carey, L.D. Lightning characteristics relative to radar, altitude and temperature for a multicell, MCS and supercell over northern Alabama. Atmos. Res. 2017, 191, 128–140. [Google Scholar] [CrossRef] [Green Version]
  53. Kaltenboeck, R.; Steinheimer, M. Radar-based severe storm climatology for Austrian complex orography related to vertical wind shear and atmospheric instability. Atmos. Res. 2015, 158, 216–230. [Google Scholar] [CrossRef]
  54. Nag, A.; Rakov, V. Positive lightning: An overview, new observations, and inferences. J. Geophys. Res. Atmos. 2012, 117, D08109. [Google Scholar] [CrossRef]
  55. Nag, A.; Rakov, V.; Cummins, K.L. Positive Lightning Peak Currents Reported by the U.S. National Lightning Detection Network. IEEE Trans. Electromagn. Compat. 2013, 56, 404–412. [Google Scholar] [CrossRef]
  56. Tarabukina, L.; Kozlov, V.; Innokentiev, D. Assessment of Lightning Parameters during Thunderstorm Development in Yakutia. In Proceedings of the 2019 Russian Open Conference on Radio Wave Propagation (RWP), Kazan, Russia, 1–6 July 2019; IEEE: Piscataway, NJ, USA, 2019; pp. 564–567. [Google Scholar]
Figure 1. (a) Average lightning density spatial distribution in the summers of 2009–2019 according to World Wide Lightning Location Network (WWLLN) data (black dashed line marks an effective detection area of lightning direction finder; black dash-dotted line marks effective detection area of Stormtracker). (b) The terrain elevation model [38]; the white circle indicates the location of Yakutsk.
Atmosphere 11 00918 g001
Figure 2. The sferics number detected by the lightning direction finder, WWLLN (data corrected by the system’s relative detection efficiency), and Stormtracker in June–August of 2009–2019.
Atmosphere 11 00918 g002
Figure 3. Lightning stroke number and linear fit (f1, f2, f3 functions) for the variations, obtained by the data of WWLLN, in the regions of North Asia (40–80° N, 60–180° E)—the eastern region (40–55° N, 110–140° E), the central region (45–60° N, 90–110° E), and Yakutia (56–74° N, 105–160° E).
Atmosphere 11 00918 g003
Figure 4. Relative monthly number by the data of (a) lightning direction finder (1200 km around Yakutsk), (b) WWLLN (56–74° N, 105–160° E).
Atmosphere 11 00918 g004
Figure 5. The dates of the seasons’ beginning and ending.
Atmosphere 11 00918 g005
Figure 6. (a) The seasonal variation in sferic number within a 480 km radius from Yakutsk with the corresponding average daily values of zonal (U) and meridional (V) components of the wind at 850 hPa and (b) the hourly spatial distribution of lightning strokes according to WWLLN on 9 July 2019; the color marks the local time.
Atmosphere 11 00918 g006
Figure 7. The ratio of the monthly lightning stroke number to the summer total lightning stroke number in Central Yakutia according to the Stormtracker data.
Atmosphere 11 00918 g007
Figure 8. (a) The wind speed for all summer days and the velocity associated with days of lightning number local peaks and (b) the frequency of the wind direction for every summer day (blue line) and of the wind direction associated with days of lightning number local peaks at 850 hPa (red line), summarized for 2009–2019.
Atmosphere 11 00918 g008
Figure 9. The histograms of daily average direction of the wind at a pressure level of 850 hPa associated with the days of peak lightning activity. The radius represents the number of days.
Atmosphere 11 00918 g009
Figure 10. The ratio of monthly and total number of cloud-to-ground lightning strokes to the number of lightning strokes of any type (a) and the annual ratio of monthly and total number of the negative cloud-to-ground lightning strokes to the number of cloud-to-ground strokes (b).
Atmosphere 11 00918 g010
Table 1. Lightning direction finder outages in the summer mode.
YearNumber of Days without RecordingsOutages, %Dates with Maximum Outages Duration
200977.64–10 June
20101415.215–28 July
201166.521–26 July
201222.227–28 July
201377.615–21 August
201477.67–13 August
201500
201600
The data from the lightning direction finder were used to study the annual variation of sferic number radiated by the lightning strokes that occurred within a radius of 1200 km around Yakutsk City in 2009–2016 and to analyze the seasonal variation patterns of 1999–2016.

