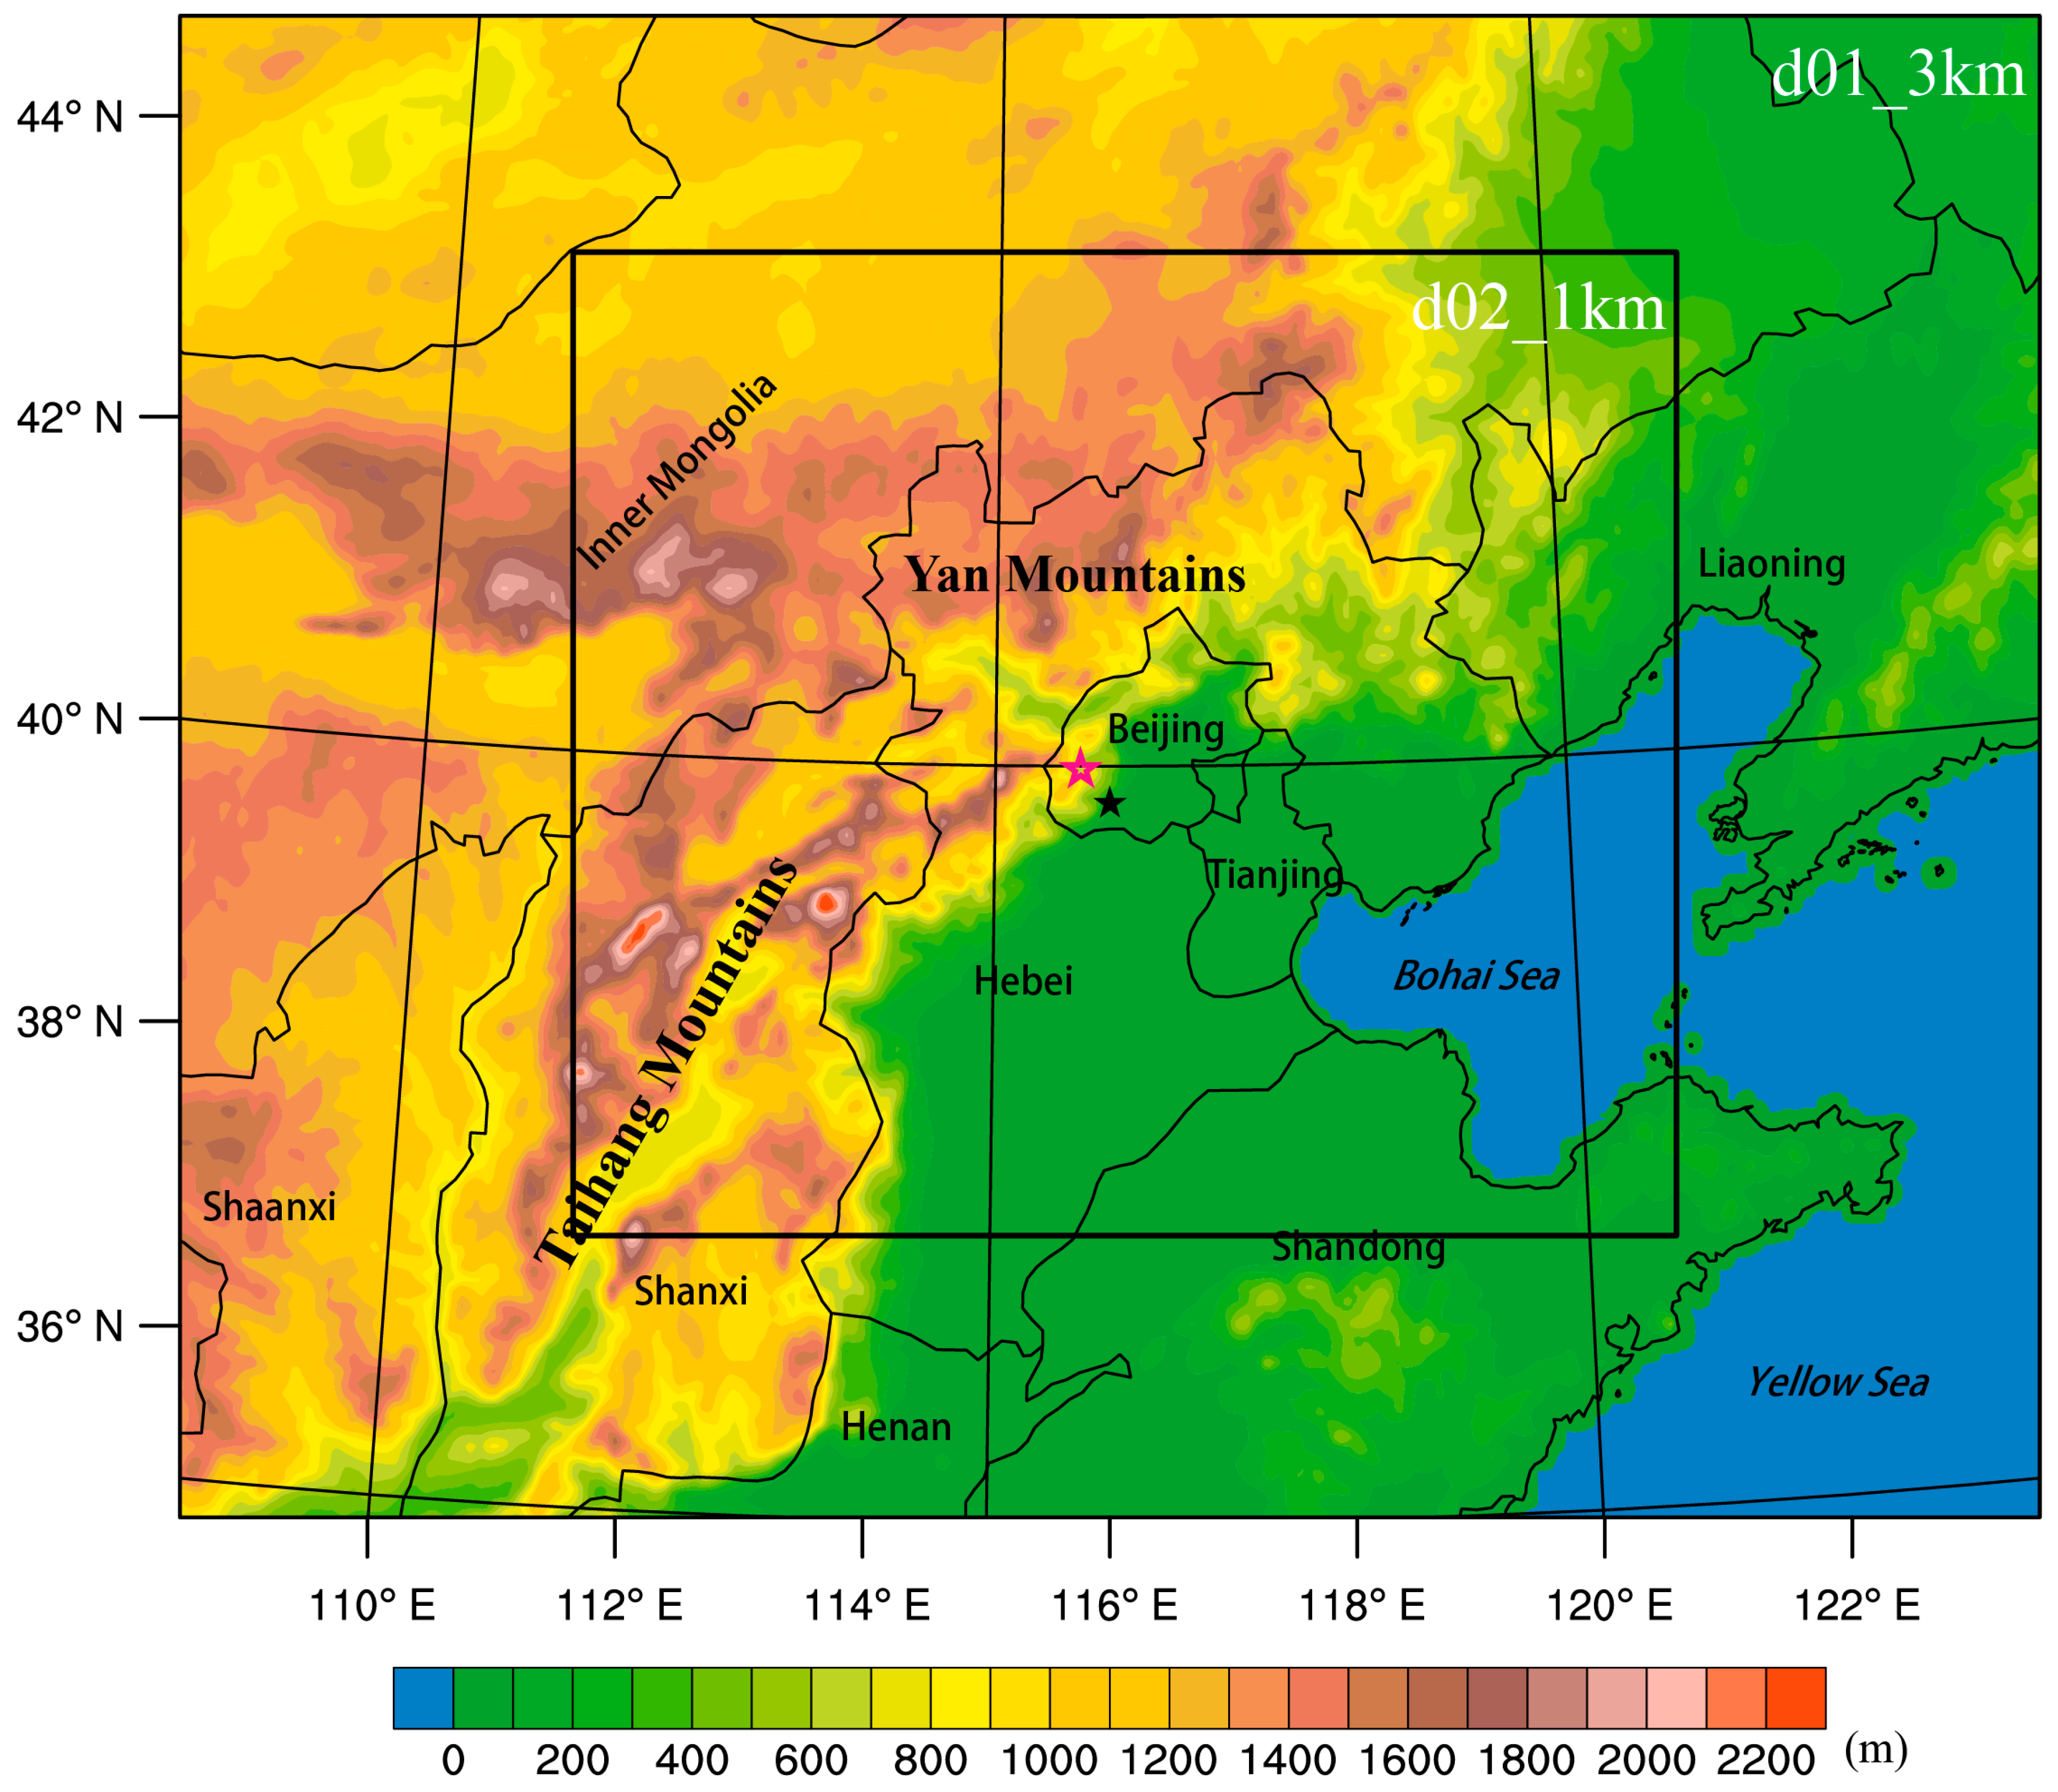
Figure 1.
Topography (shaded) diagram in the simulation domains (d01, d02). The Taihang Mountains and Yan Mountains (bold font) and some provinces of China (regular font) over the domains are labeled. Mentougou District and Fangshan District of Beijing are marked separately by magenta and black pentagrams denoting its downtown area.
Figure 2.
(a1–c1) Observed equivalent temperature (shaded, units: K), geopotential height (contours, units: 10 gpm), and wind field (vector arrows, units: m s−1) at 700 hPa. (a2–c2) Observed water vapor flux divergence (shaded, units: g (s·cm−2·hPa−1)−1), water vapor flux (dotted, units: g s−1 hPa−1 cm−1), and wind field (vector arrows, units: m s−1) at 850 hPa. The positive (negative) value of water vapor flux divergence means the divergence (convergence) of water vapor. The results are valid at 0000 UTC (a1,a2), 0600 UTC (b1,b2), and 1200 UTC (c1,c2) 21 July 2012. The location of Beijing is marked with the black pentagram. The black dotted box denotes the area of domain 2.
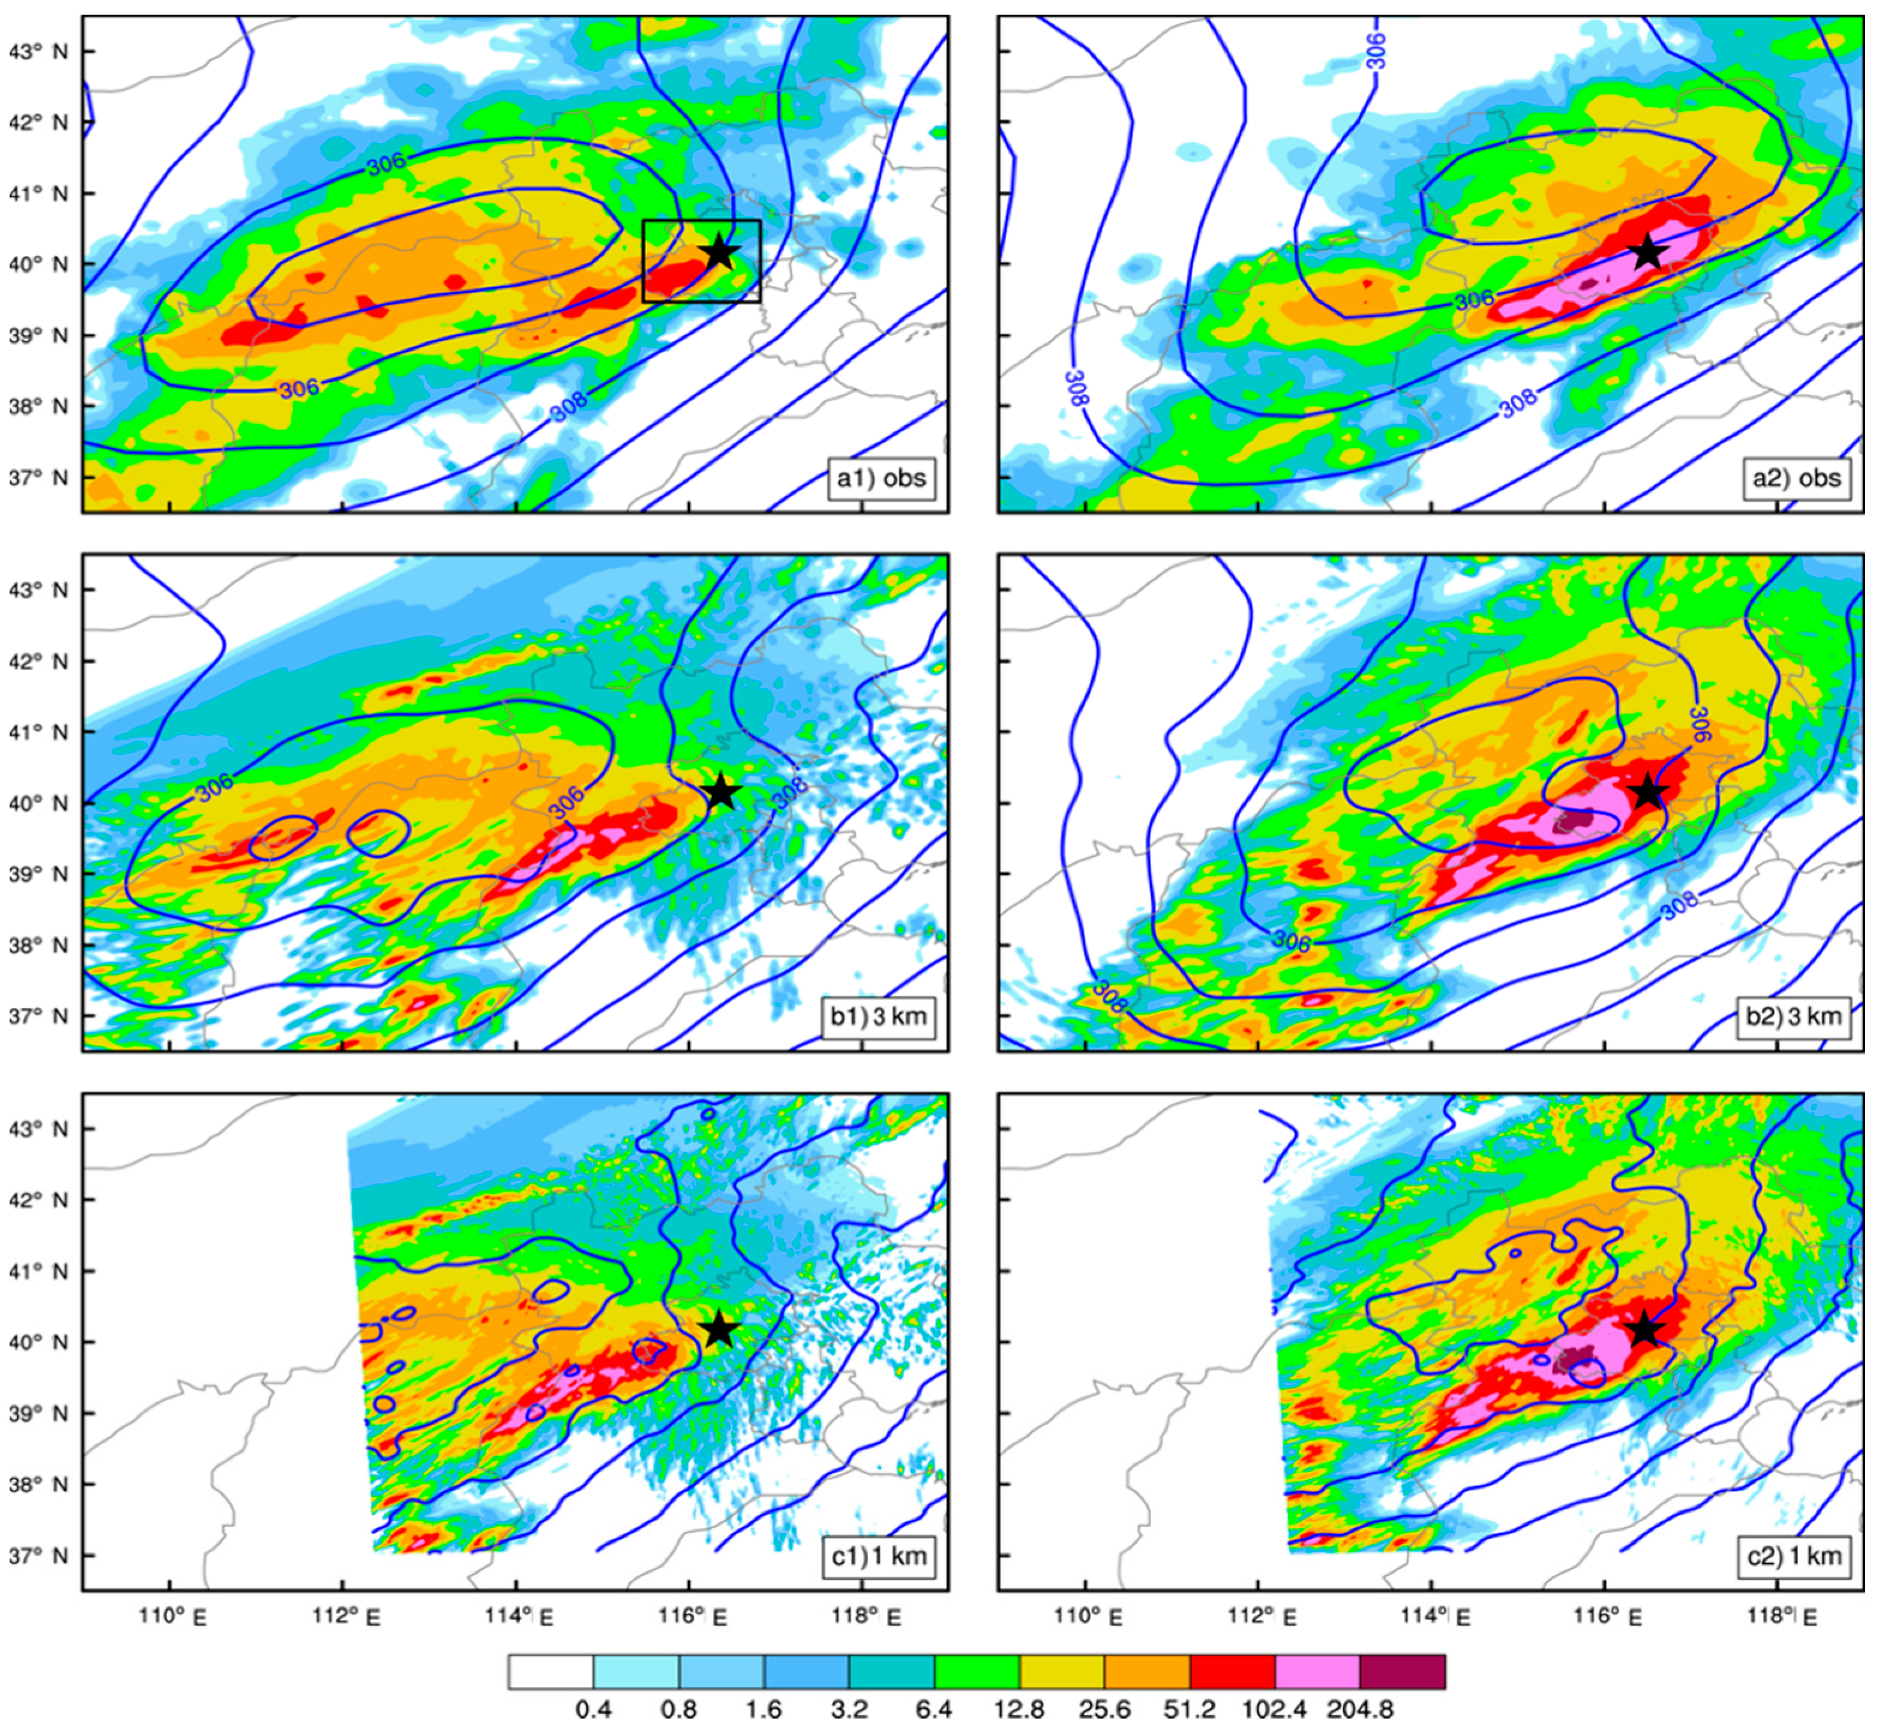
Figure 3.
The observed (a1,a2) and 3-km simulated (b1,b2) and 1-km simulated (c1,c2) 6-h cumulative precipitation (shaded, units: mm) and the geopotential height (blue contours, units: 10 gpm) at 700 hPa during the period 0000–0600 UTC (a1–c1) and 0600–1200 UTC (a2–c2) 21 July 2012. The black star denotes the location of Beijing.
Figure 4.
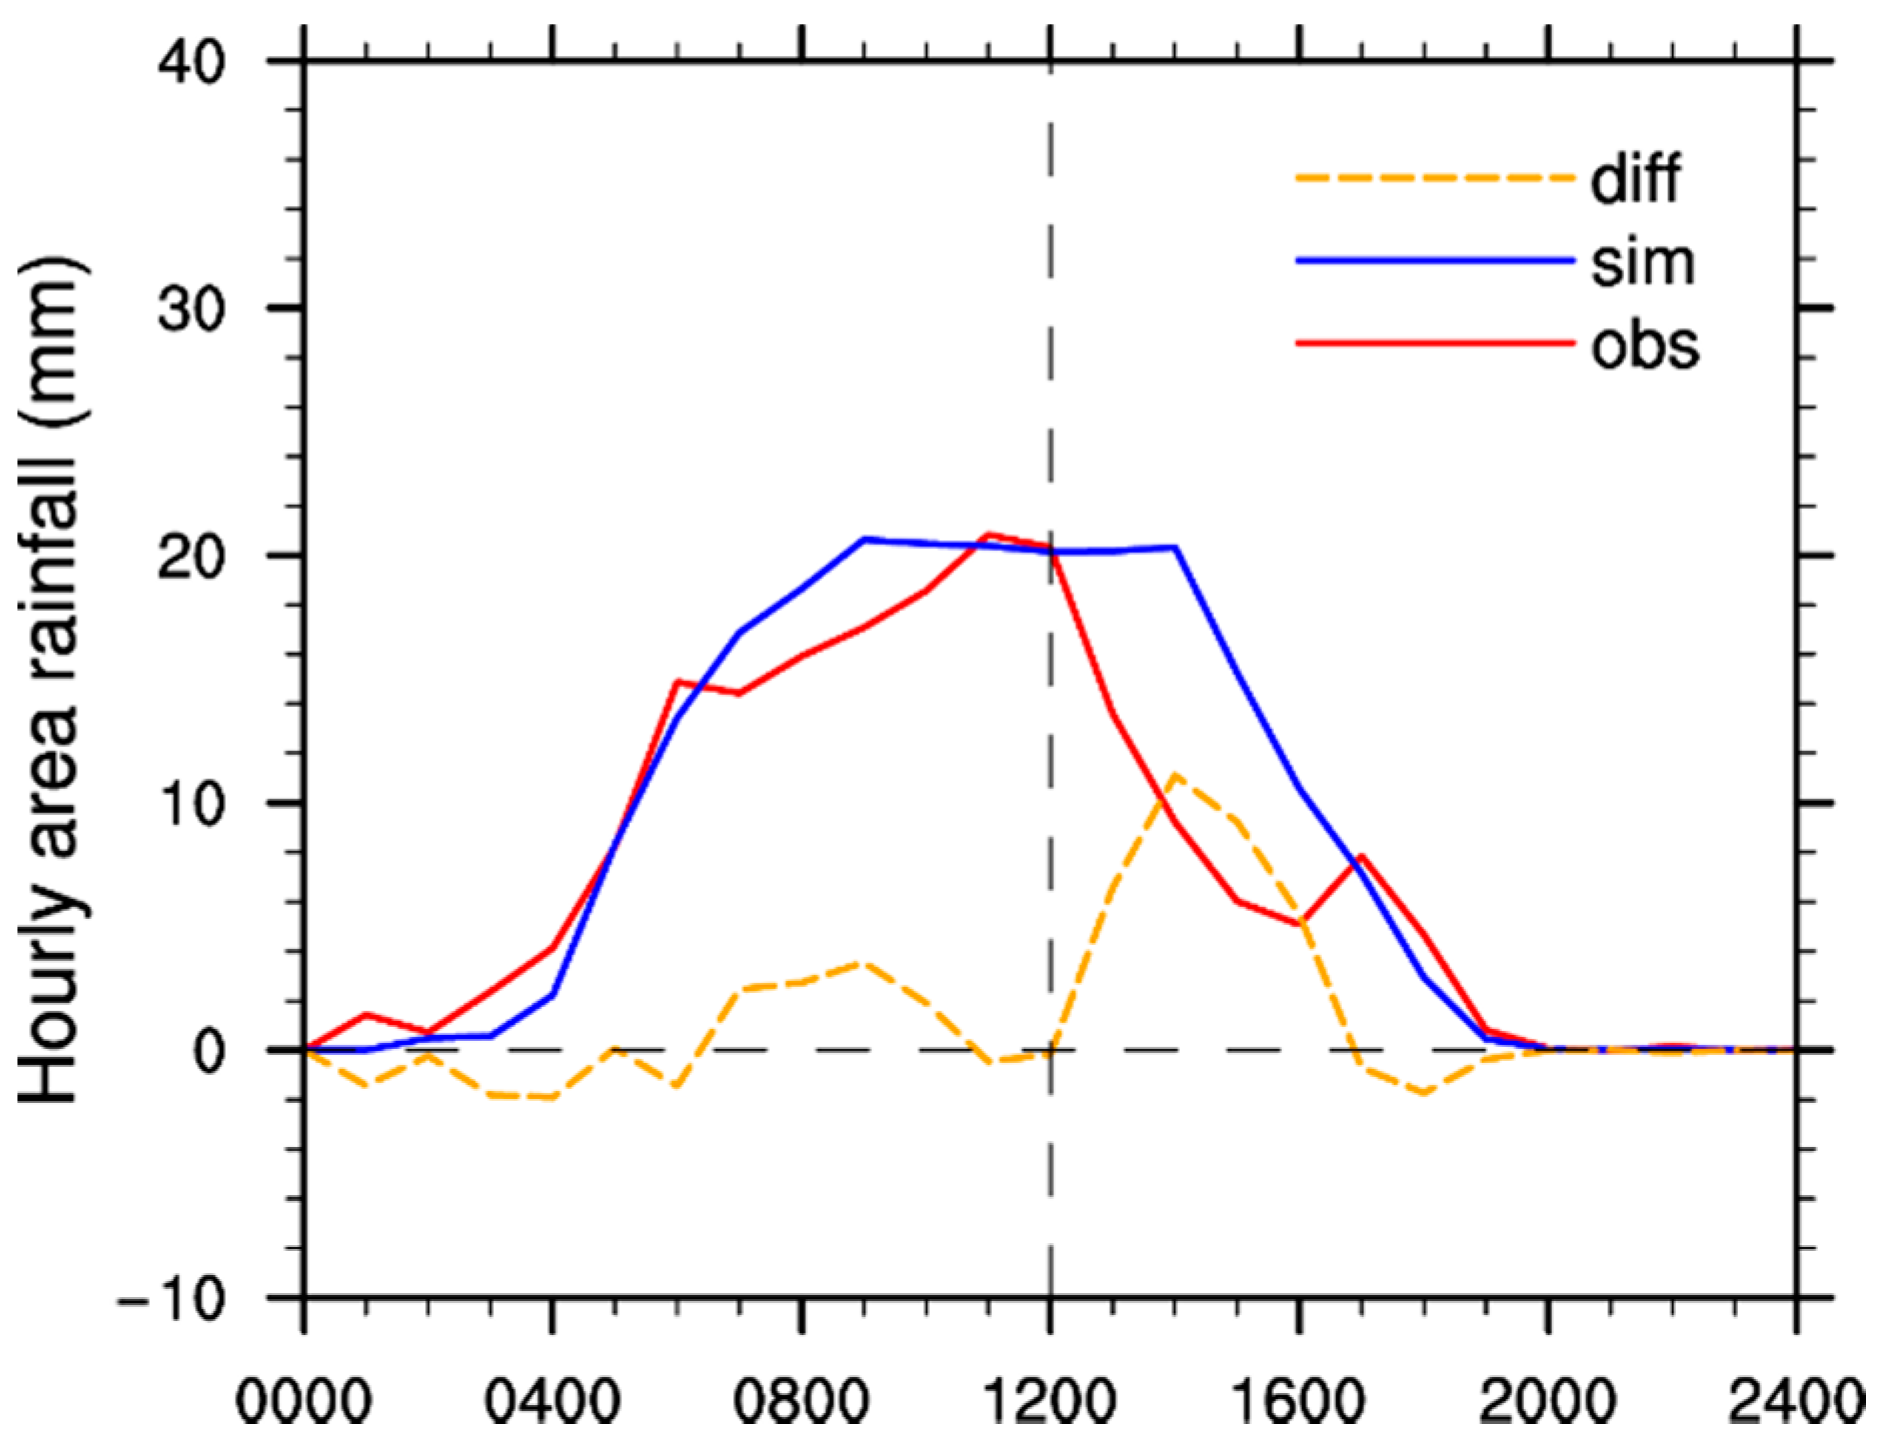
Time series of the observed (
red line) and simulated (
blue line) mean hourly rainfall amount. Yellow line represents the difference between simulation and observation. Regional averaging is performed over the black box in
Figure 3a1.
Figure 4.
Time series of the observed (
red line) and simulated (
blue line) mean hourly rainfall amount. Yellow line represents the difference between simulation and observation. Regional averaging is performed over the black box in
Figure 3a1.
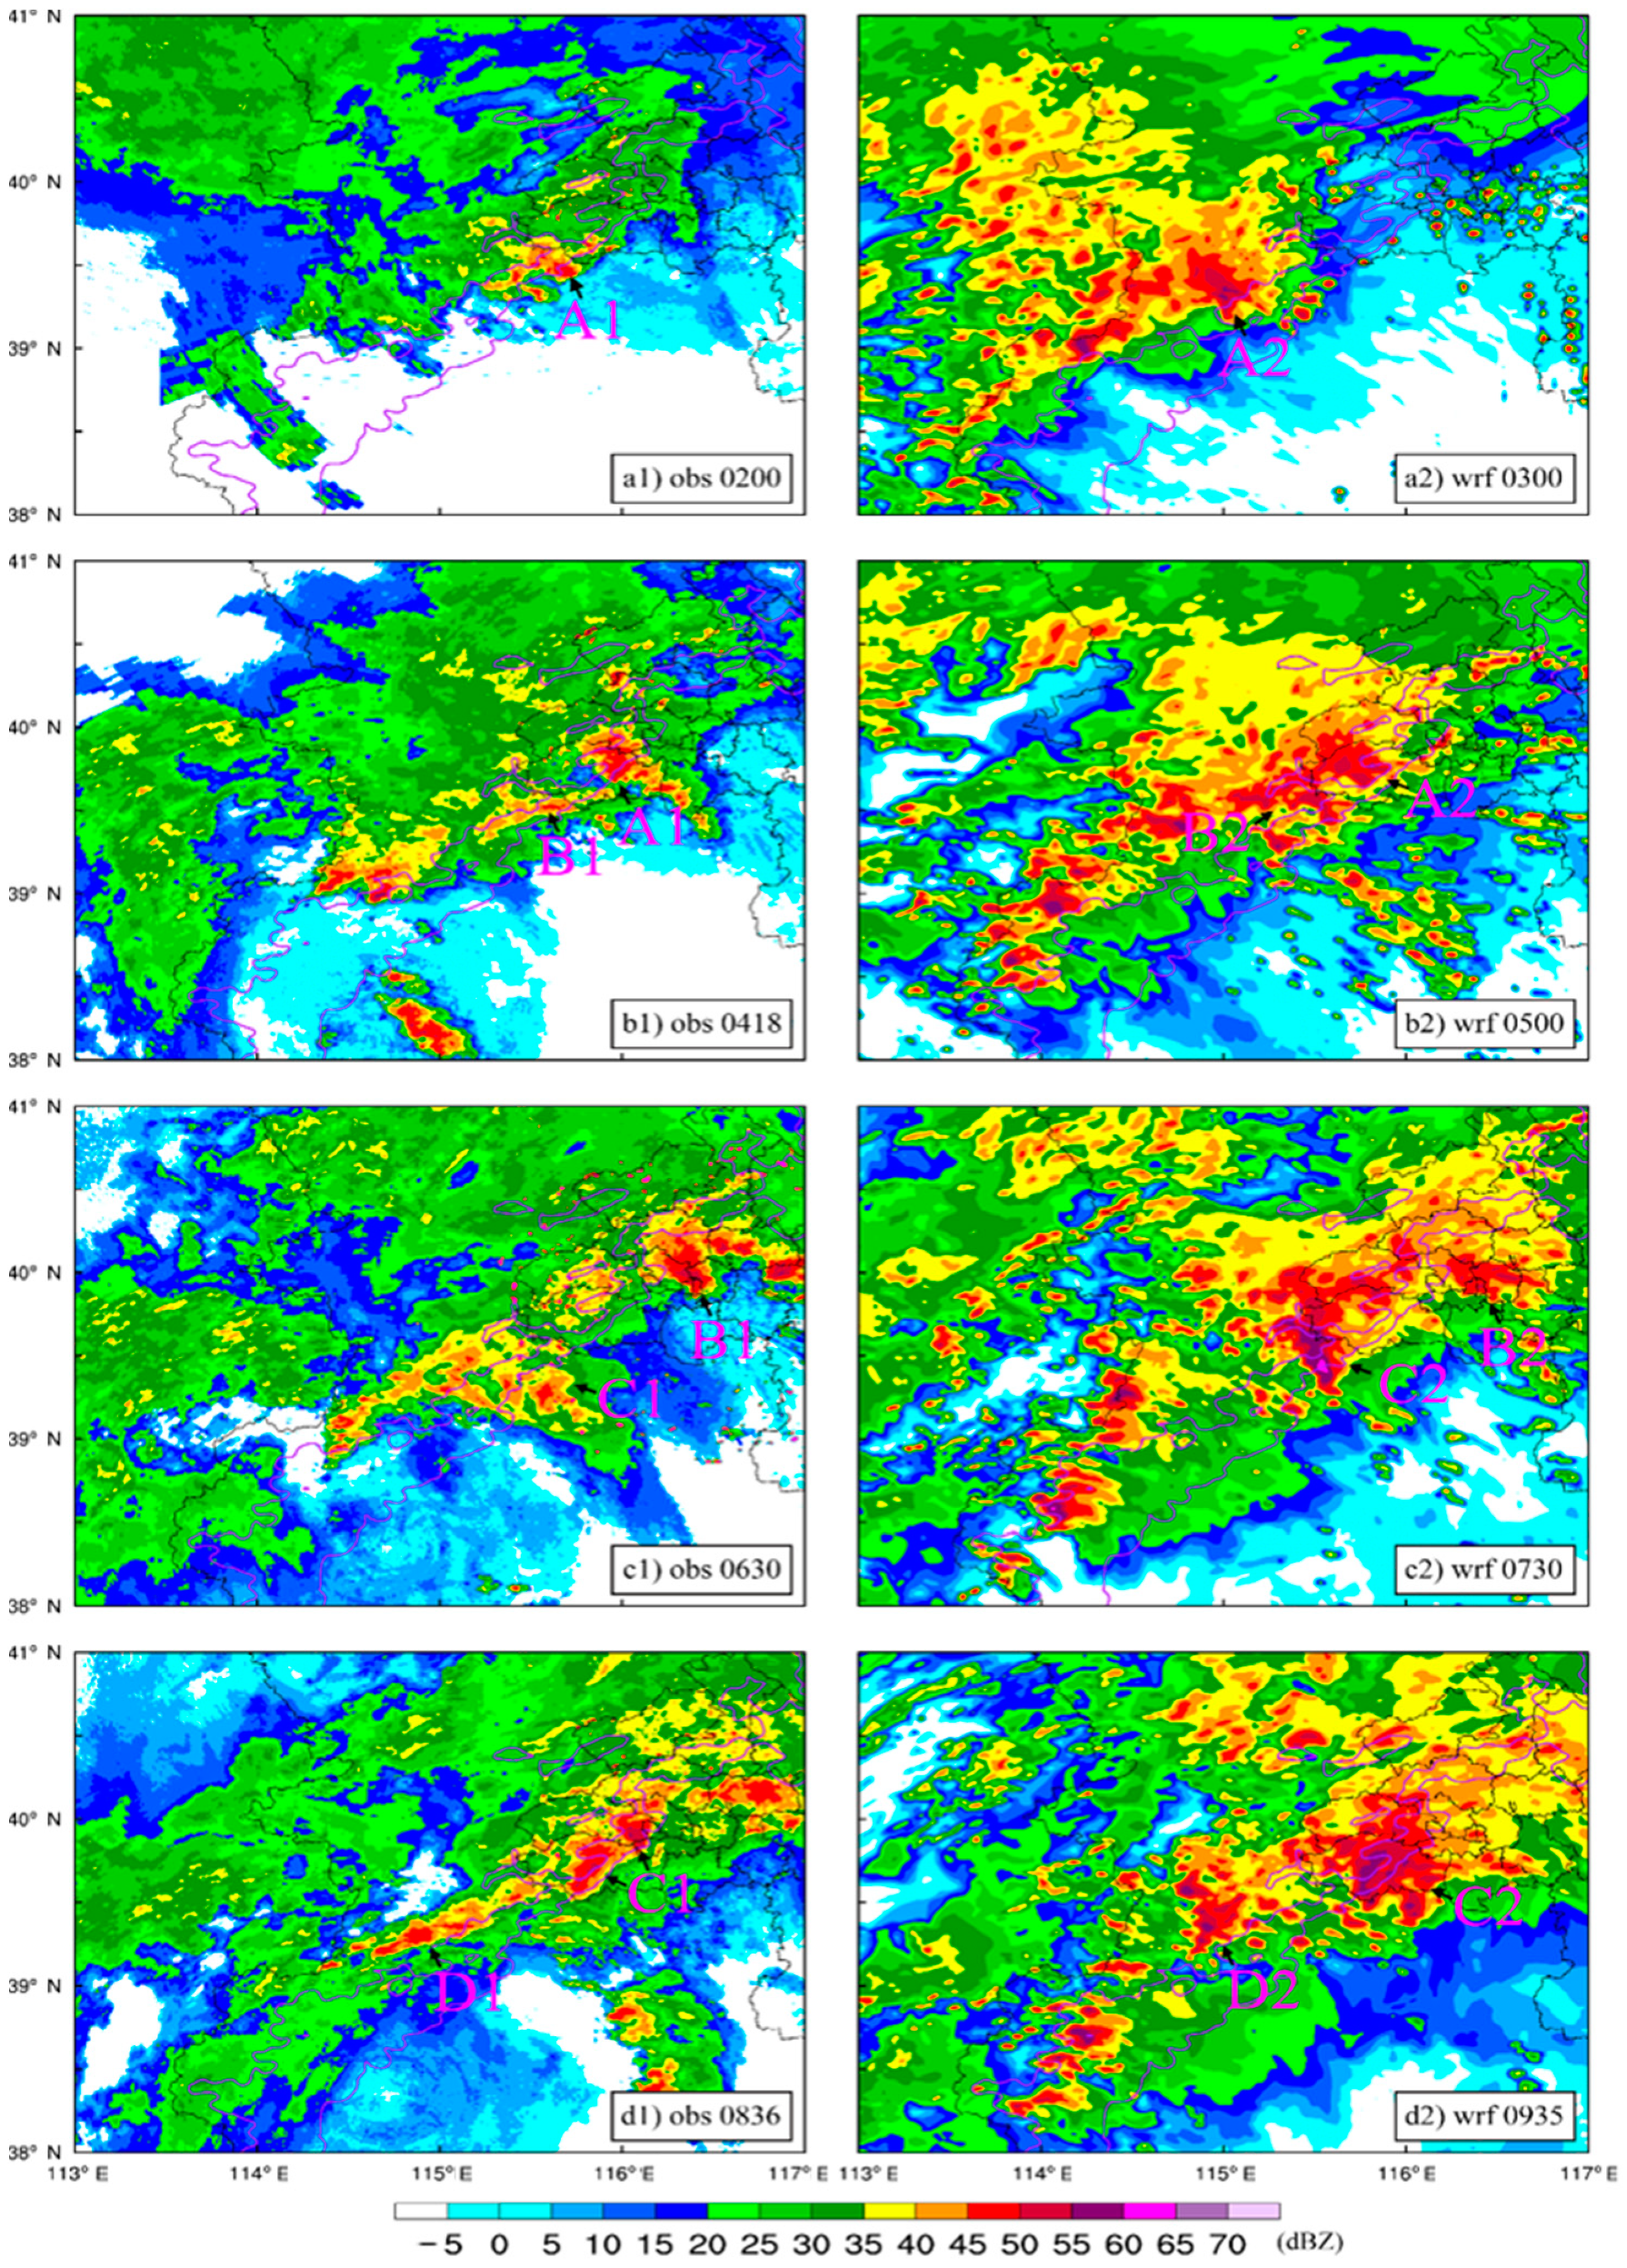
Figure 5.
(a1–d1) Observed composite radar reflectivity (shaded, units: dBZ) at 0200, 0418, 0630, and 0836 UTC 21 July 2012, respectively. The black contours are terrain height (units: m). (a2–d2) As in (a1–d1) but for the simulated results, which are valid at 0300, 0500, 0730, and 0935 UTC 21 July 2012. The labels “A1/A2”, “B1/B2”, “C1/C2”, and “D1/D2” denote the four main mesoscale convective systems (MCSs) (A, B, C, and D), respectively.
Figure 6.
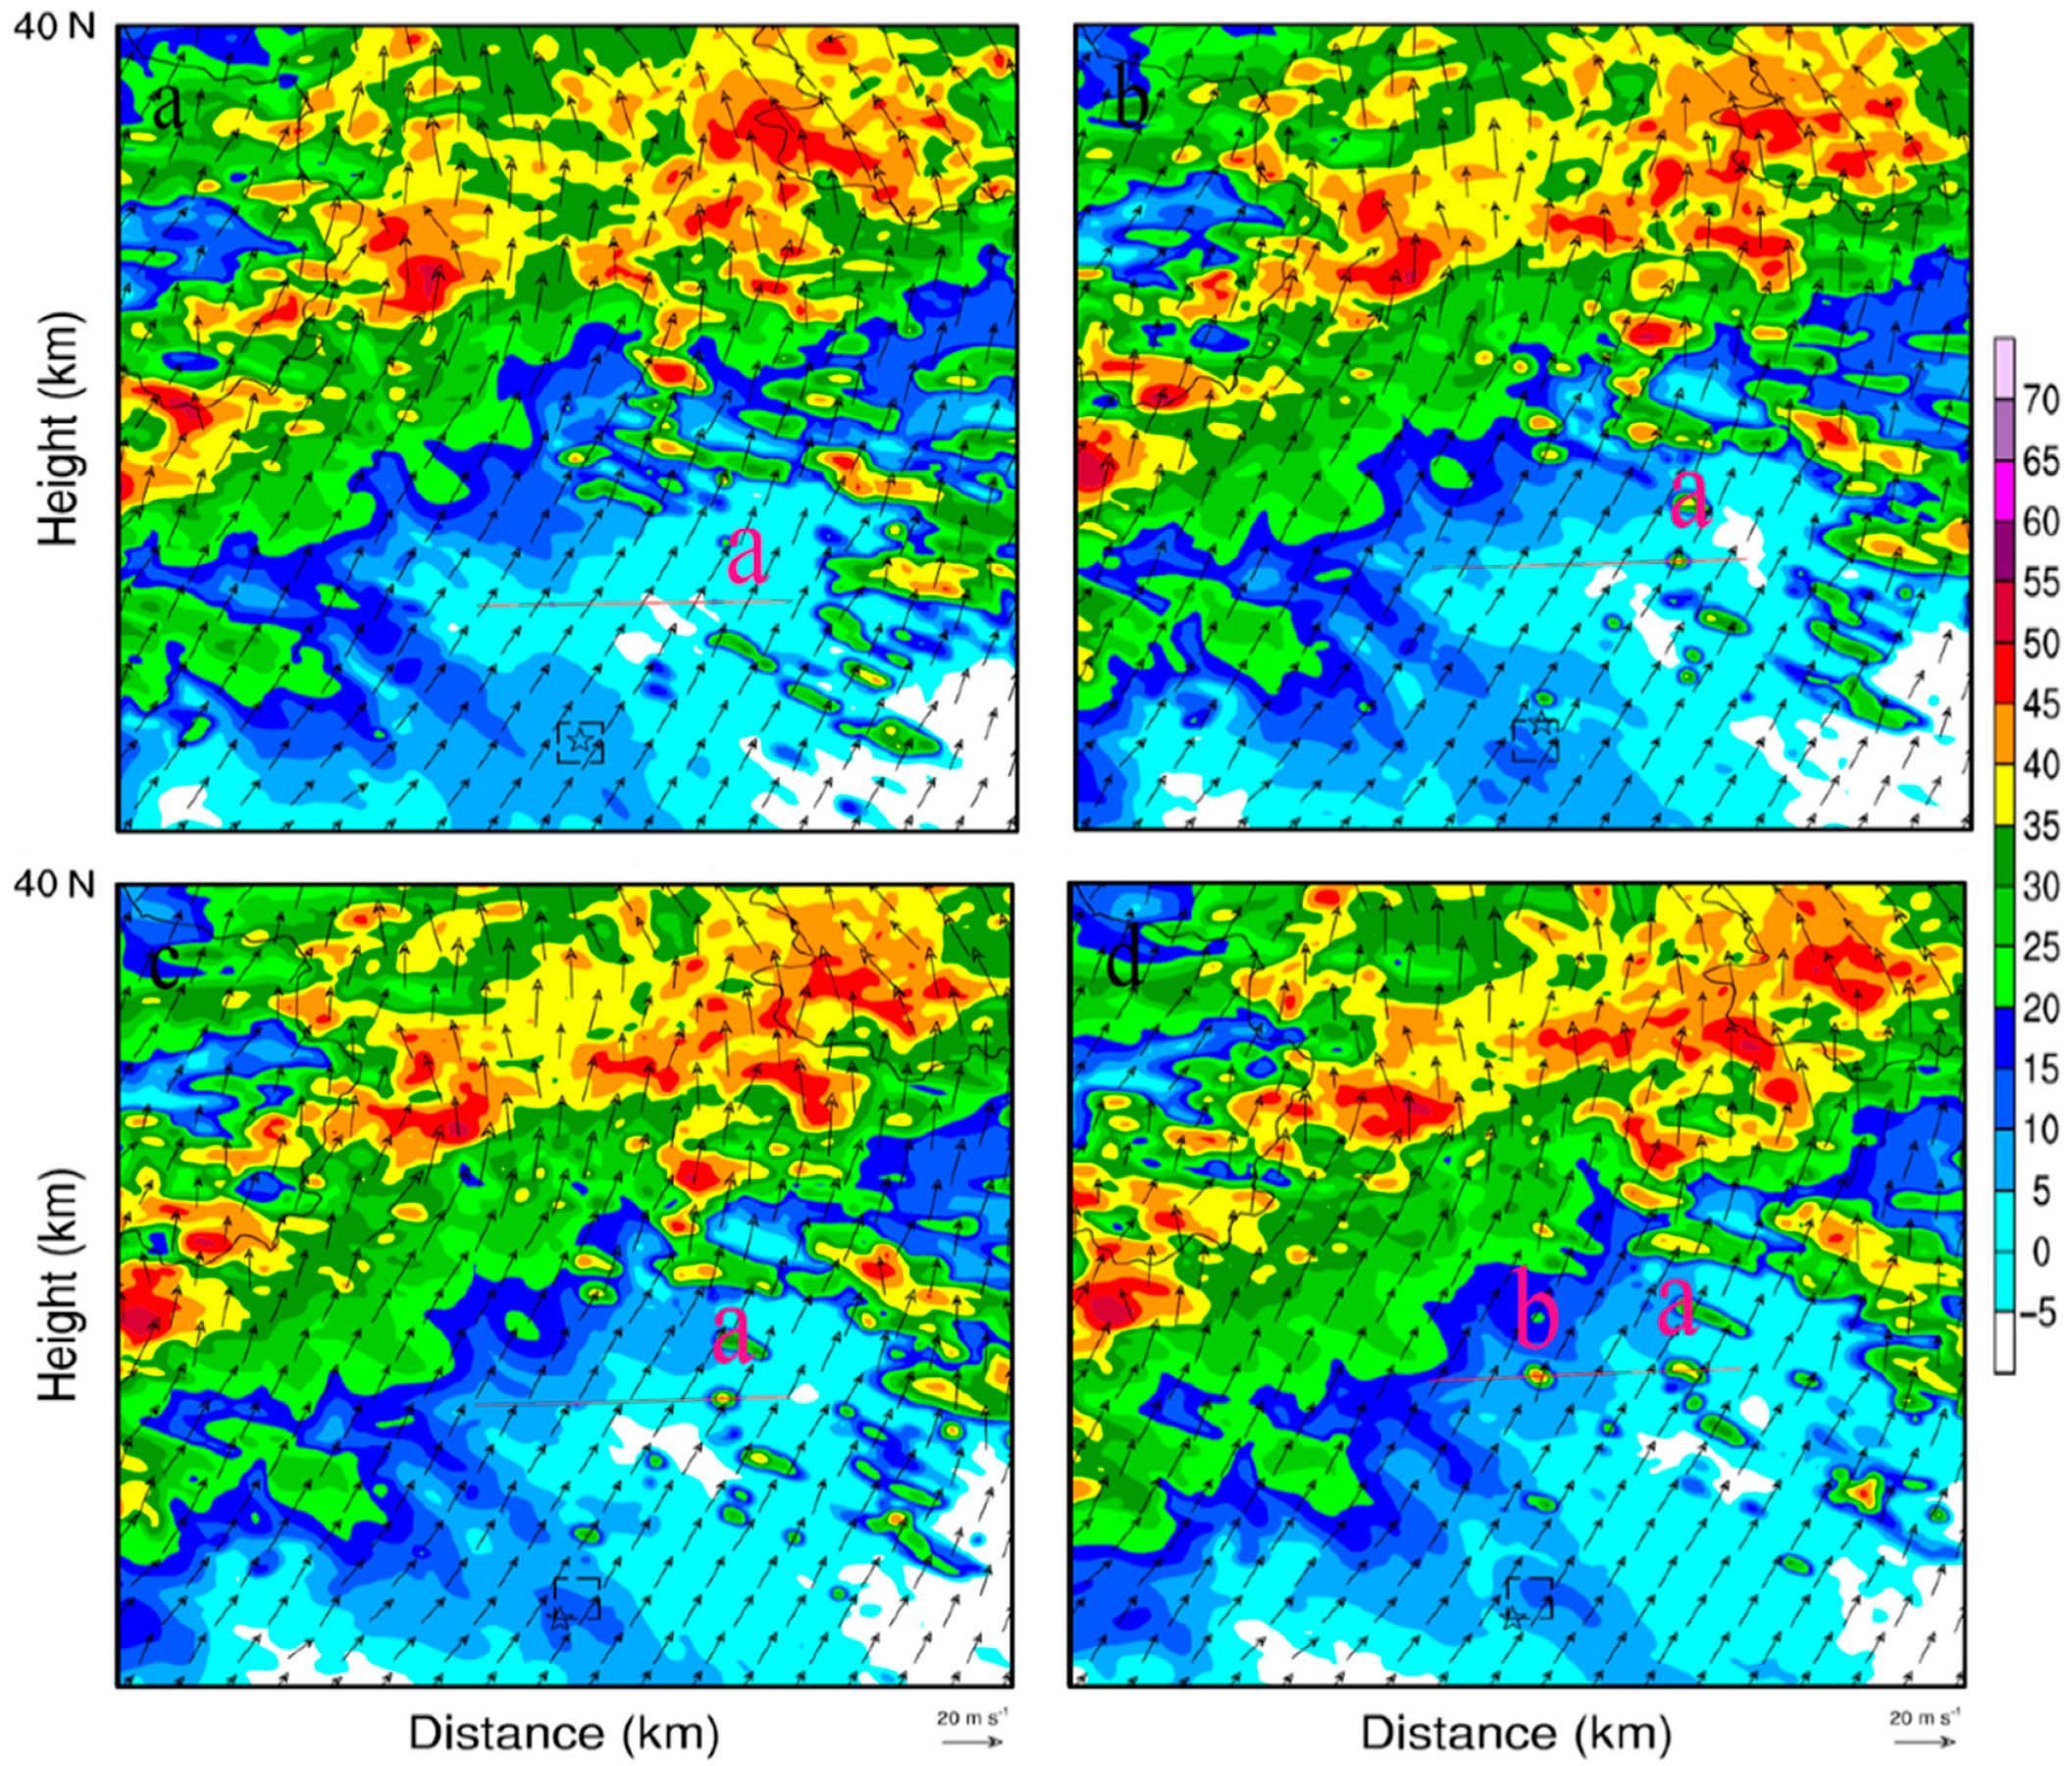
(a–d) Simulated composite radar reflectivity (shaded, unit: dBZ) and the wind field (vector arrows, units: m s−1) at 700 hPa at 0438, 0450, 0456, and 0505 UTC 21 July 2012, respectively. The letters, “a” and “b” denote convective cells over the plains.
Figure 6.
(a–d) Simulated composite radar reflectivity (shaded, unit: dBZ) and the wind field (vector arrows, units: m s−1) at 700 hPa at 0438, 0450, 0456, and 0505 UTC 21 July 2012, respectively. The letters, “a” and “b” denote convective cells over the plains.
Figure 7.
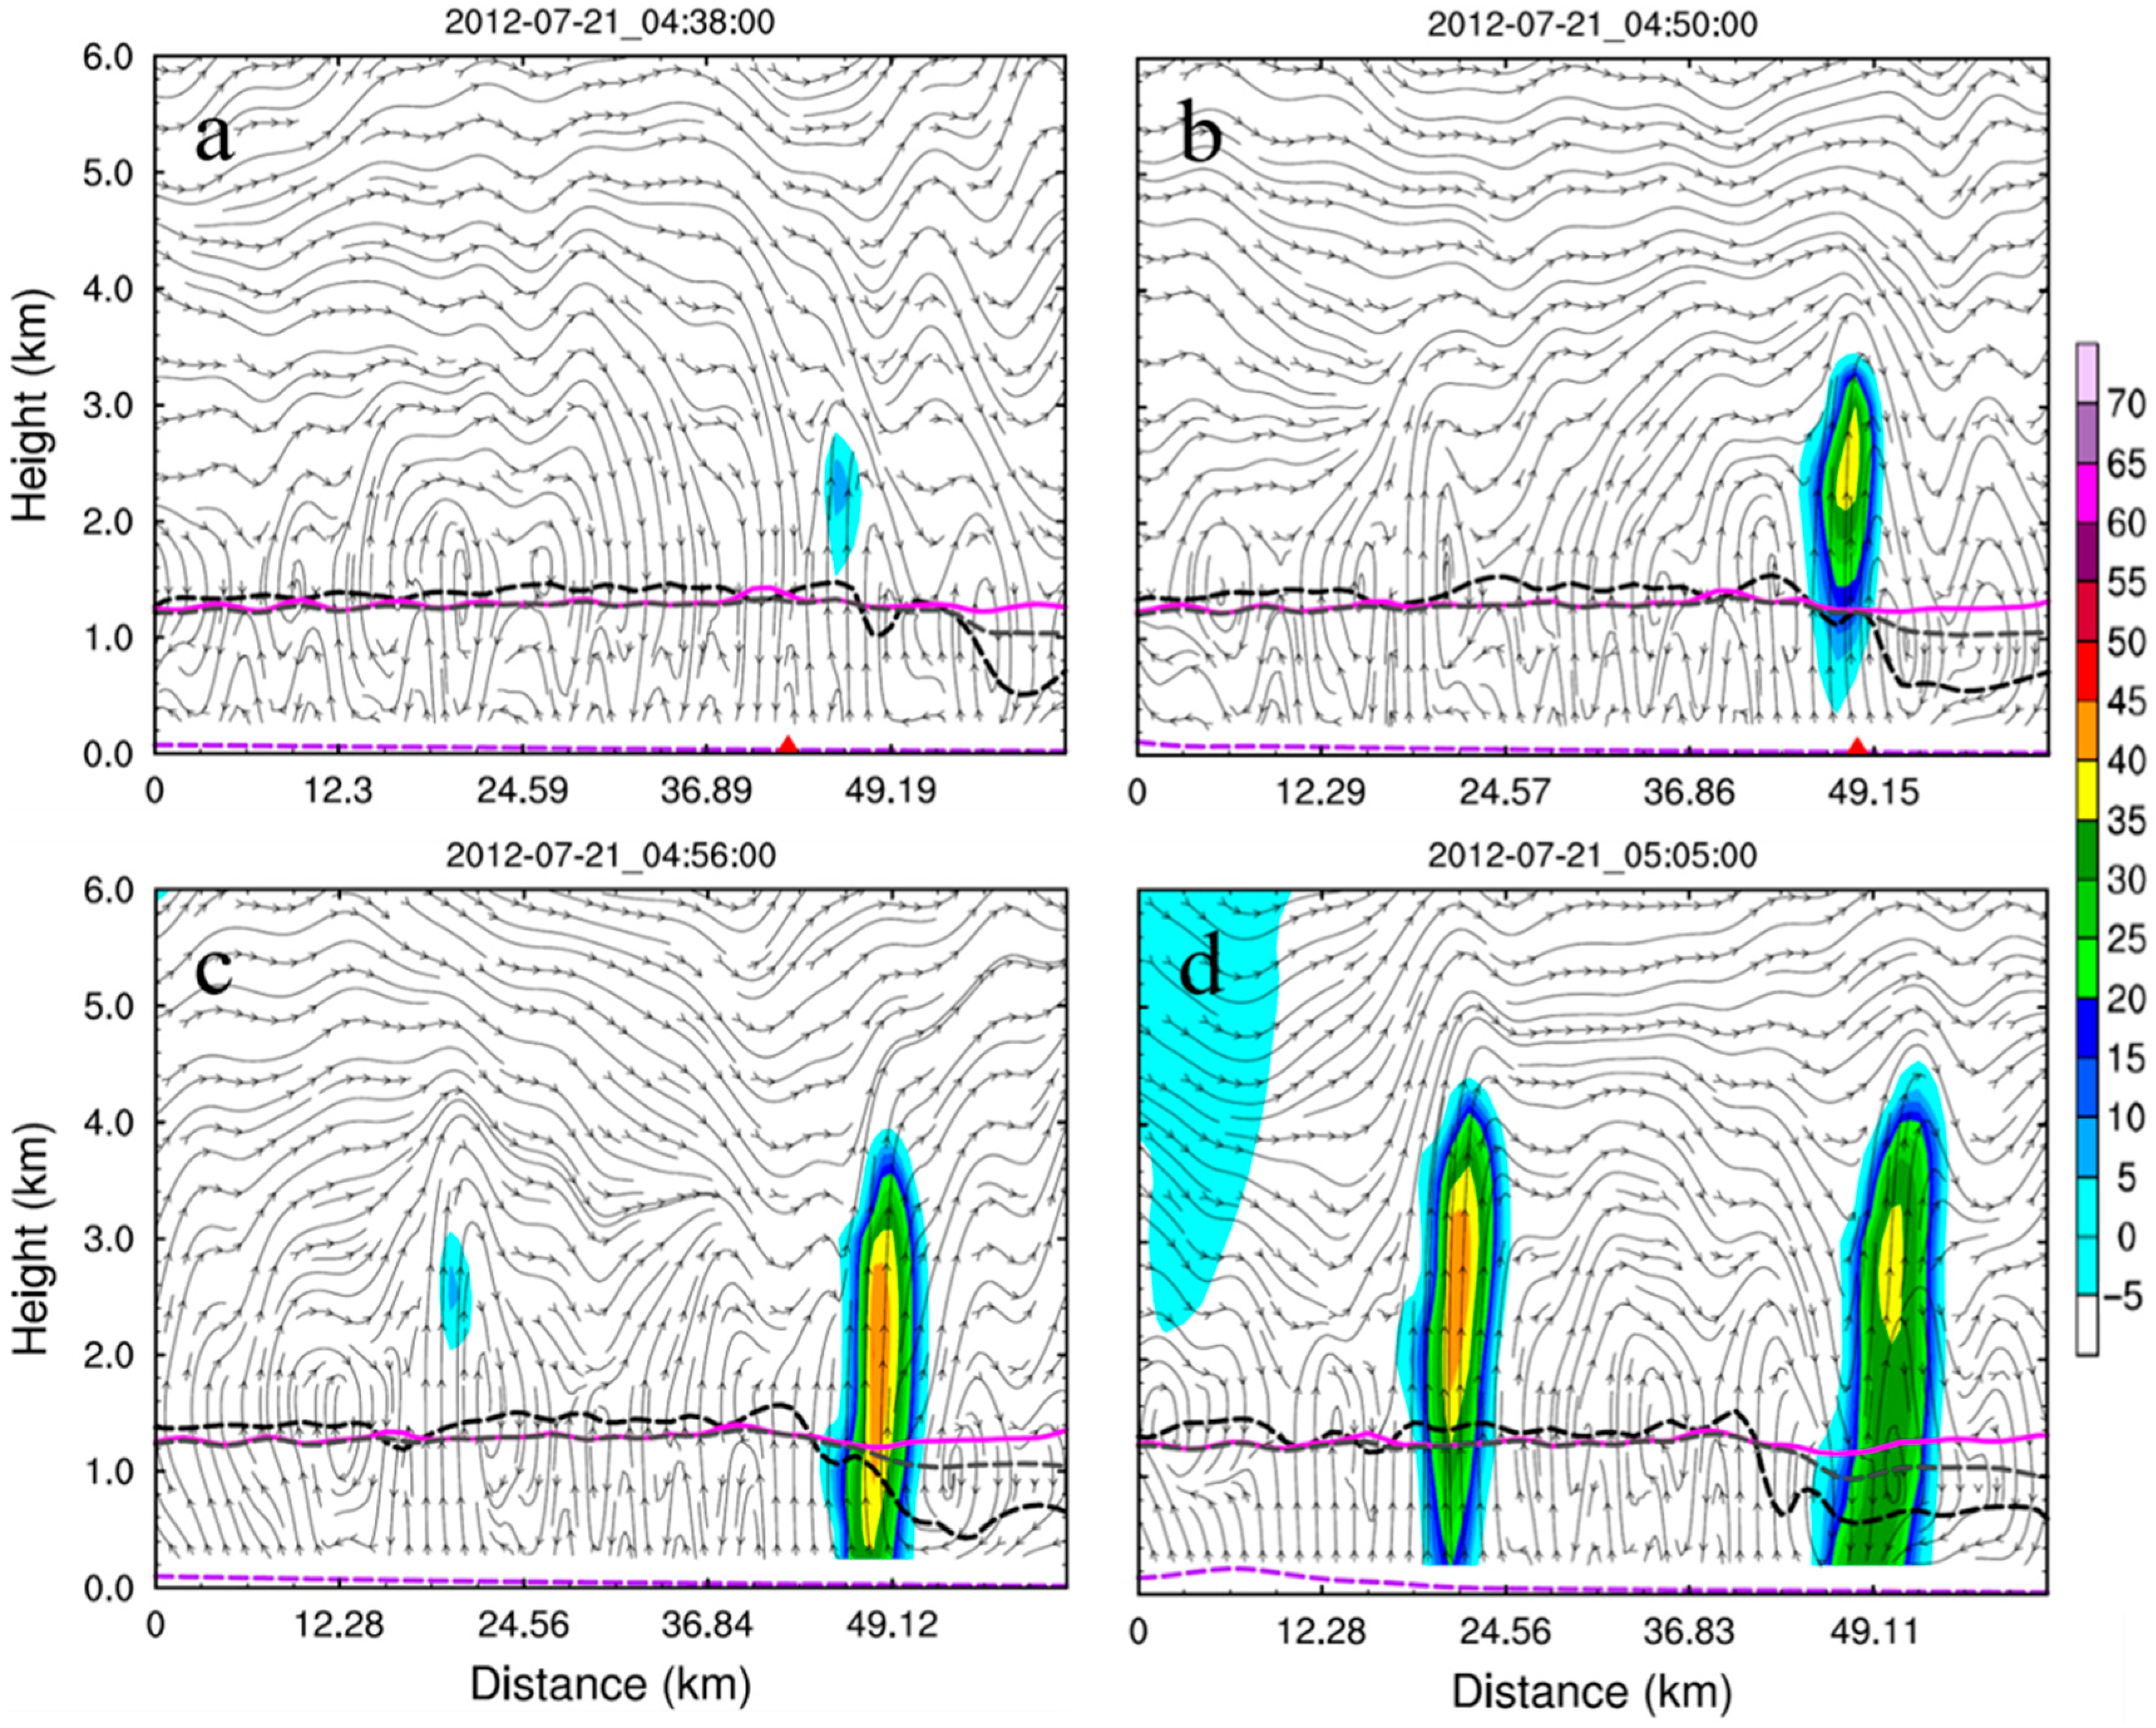
(
a–
d) Vertical cross sections of the simulated composite radar reflectivity (shaded, units: dBZ), the wind field (streamlines, units: m s
−1), the lifting condensation level (LCL) (gray dotted line), the planetary boundary layer height (PBLH) (black dotted line), and the level of free convection (LFC) (magenta solid line) at 0438, 0450, 0456, and 0505 UTC 21 July 2012, respectively. The locations of cross sections were denoted by the magenta lines given in
Figure 6.
Figure 8.
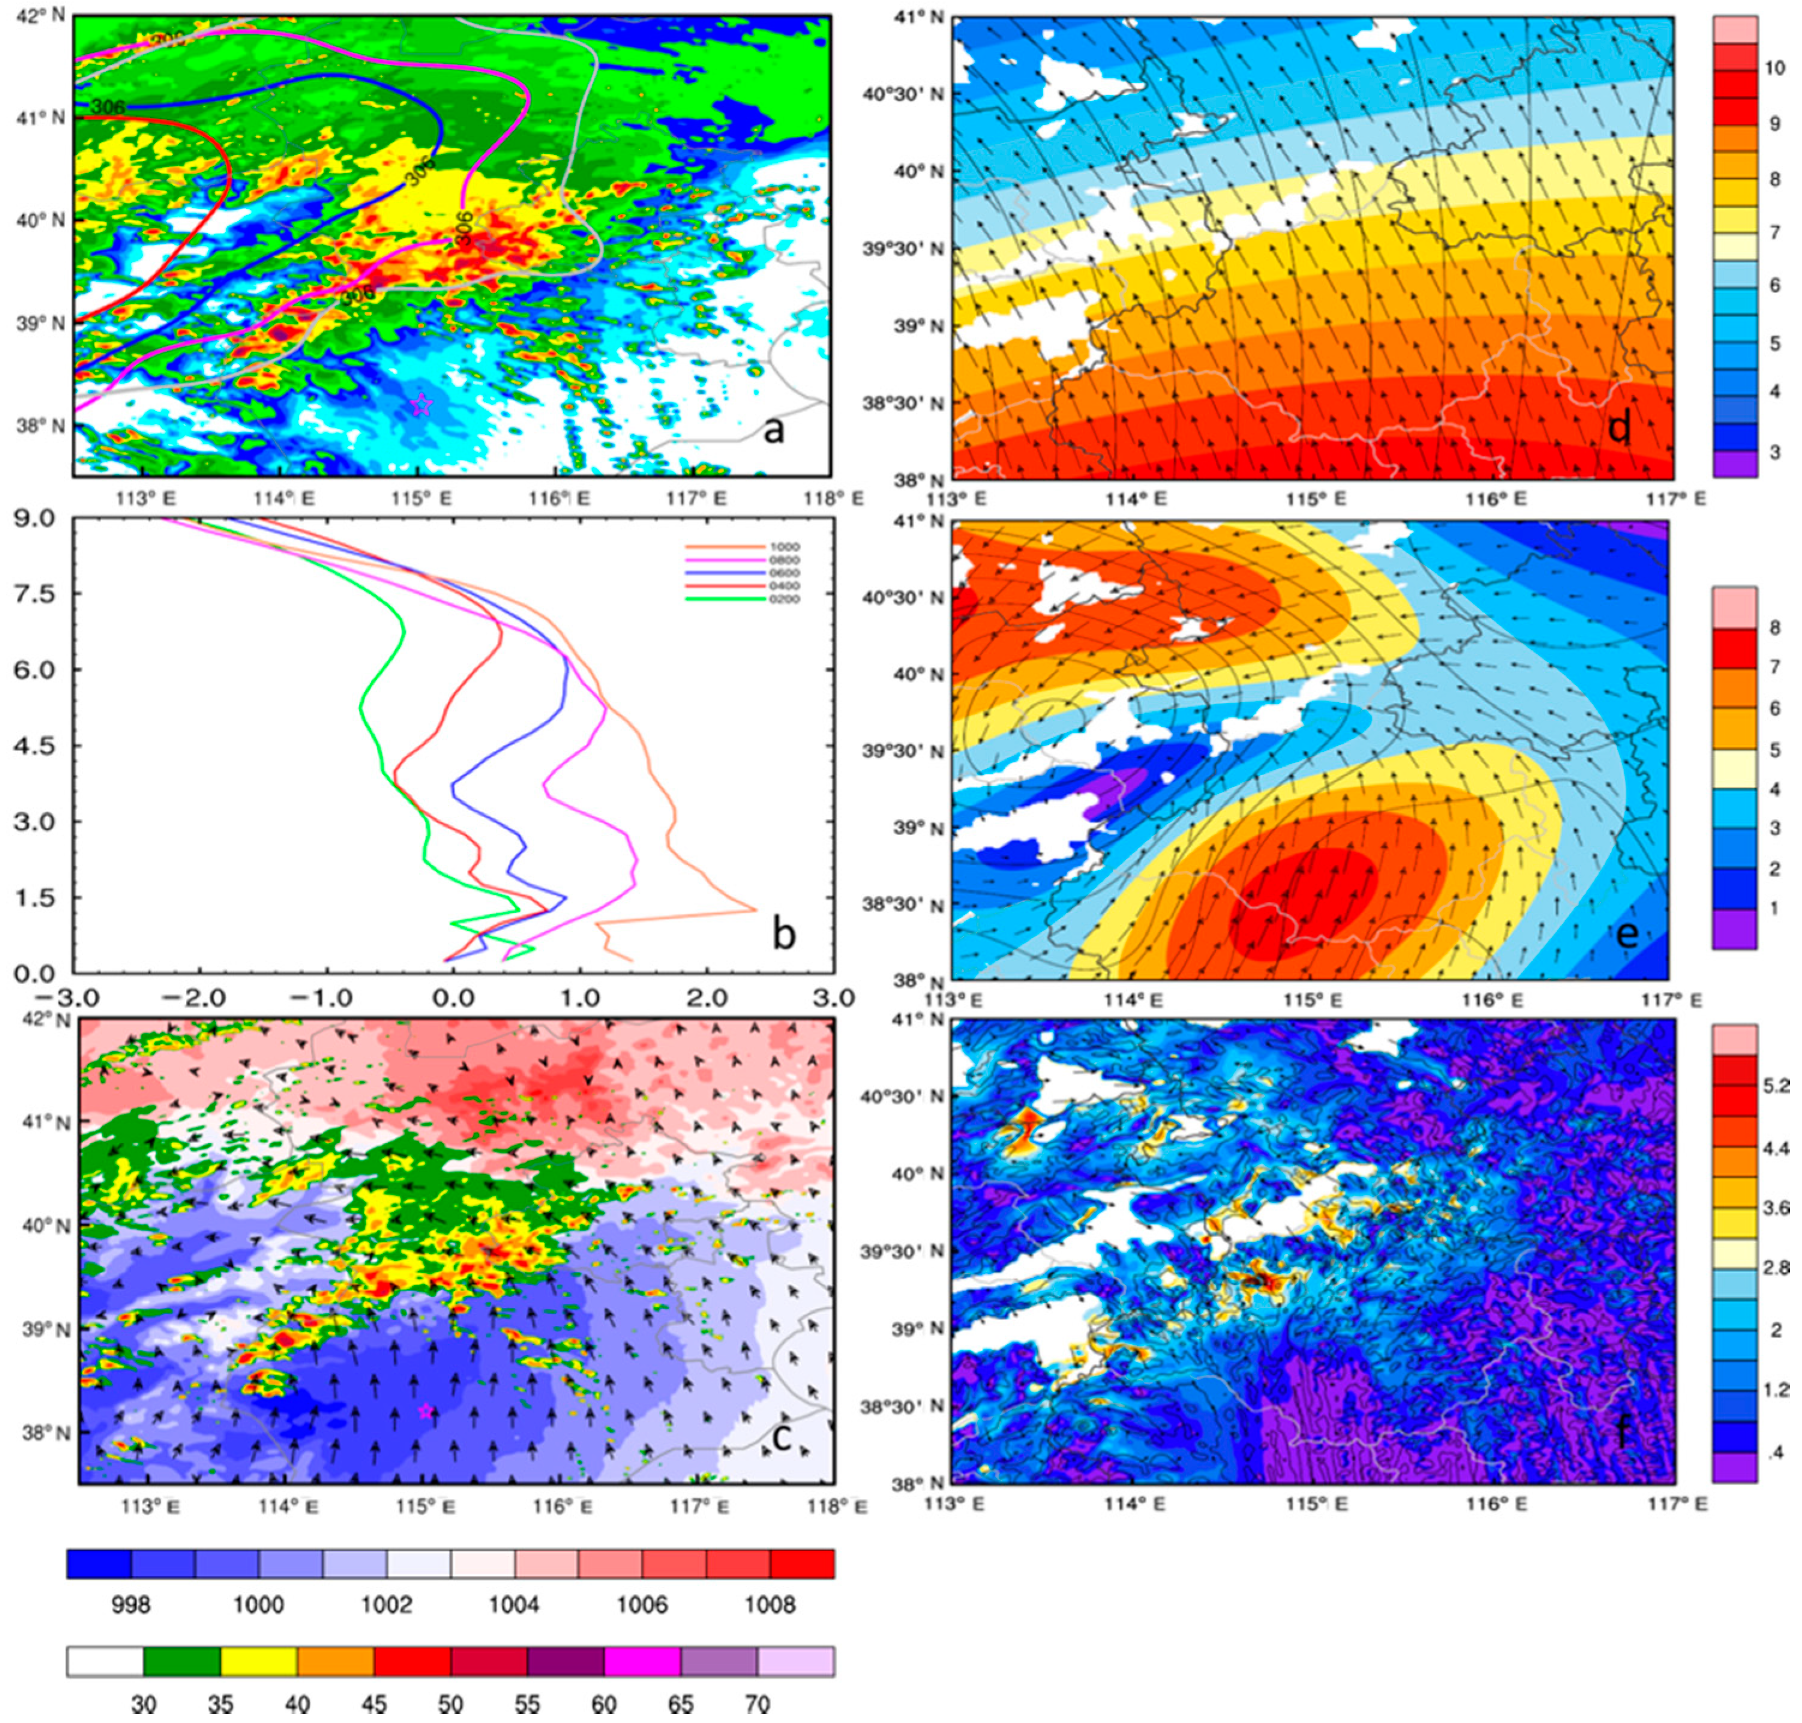
(a) Simulated composite radar reflectivity (shaded, units: dBZ) at the initiation time of MCS-C. The red, blue, and magenta lines represent the 306 (units:10 gpm) feature line of Hetao vortex at 700 hPa at 0400, 0600, and 0800 UTC, respectively. (b) Area-averaged vertical profile of the 306 feature lines (units: 10 gpm) of Hetao vortex. (c) Simulated composite radar reflectivity (shaded, units: ≥35 dBZ), the sea level pressure (red and blue shading, units: Pa), and the 10-m wind field (arrows) at the initiation time of MCS-C. The initiation location of the first convective cell over the plains is marked with the magenta pentagram. (d–f) The large-scale, meso-scale, and small-scale component of wind field at the initiation time MCS-C, which were extracted by Barens’ (1973) low-pass, band-pass, and high-pass filtering methods, respectively. All of them include the wind speed field (shaded, units: m s−1), the vorticity field (contours, units: s−1), and the wind field (vector arrows, units: m s−1).
![Atmosphere 11 00946 g008 Atmosphere 11 00946 g008]()
Figure 9.
(a) Spatial distribution of vertical velocity (shading, units: m s−1) at the height of 1 km at 0430 UTC. (b) Cross sections of the vertical velocity (shading, units: m s−1), the wind field (streamlines), the LCL (gray dotted line), the PBLH (black dotted line), and the LFC (magenta solid line) along the black line in (a). (c) Time series of the sea level pressure at locations denoted by the stars in (a). The NCI, PCI, and MCI represent no convective initiation, plain convective initiation, and mountain convective initiation, respectively. (d) Time–distance plot of vertical velocity (shading, units: m s−1) at the height of 1 km during the period from 0400 to 0500 UTC.
Figure 10.
(a–c) Vertical cross sections of the simulated divergence field (shaded, units: 10−5 s−1), the vorticity field (contoured, units: 10−5 s−1), the wind field (vectors, units: m s−1), the LCL (gray dotted line), the PBLH (black dotted line), and the LFC (red solid line) during the evolution of convective cell ‘a’ over the plains, valid at 0430, 0438, and 0450 UTC 21 July 2012, respectively. (d–f) As in (a–c) but for convective cell ‘b’, valid at 0430, 0438, and 0450 UTC 21 July 2012, respectively.
Figure 11.
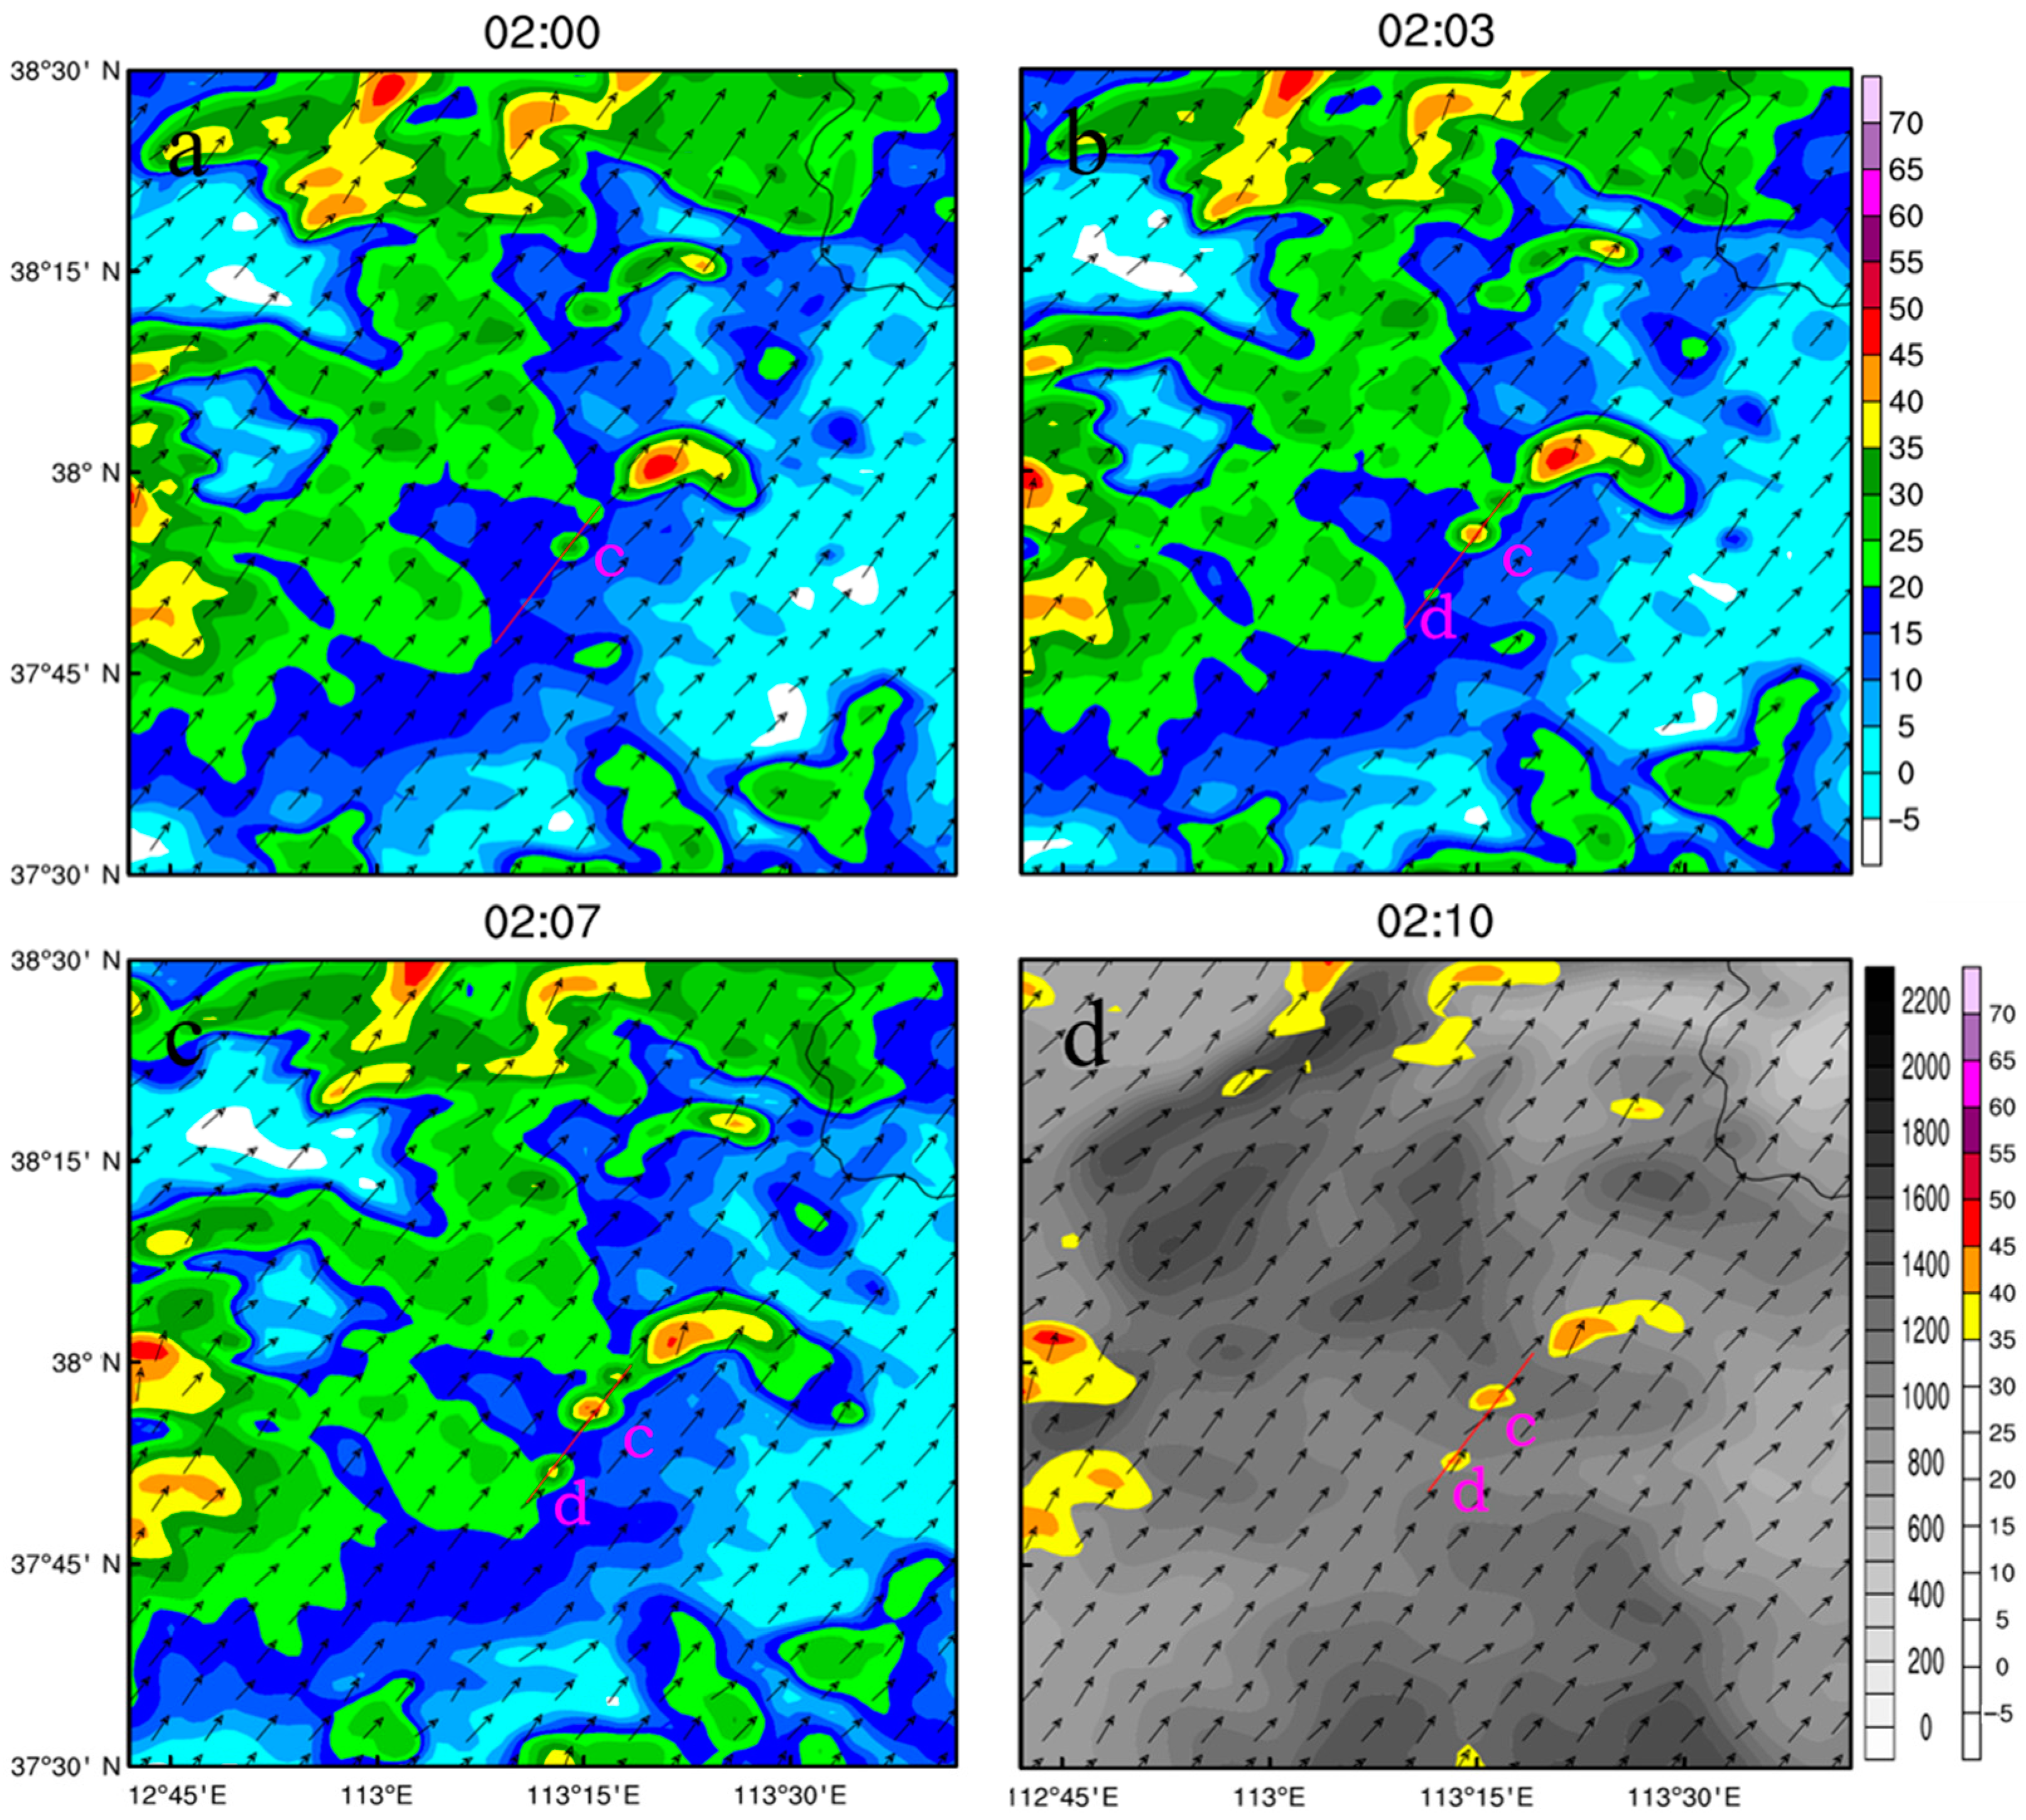
(a–c) Simulated composite radar reflectivity (shaded, units: dBZ) and the wind field (vector arrows, units: m s−1) at 700 hPa at 0200, 0203, and 0207 UTC 21 July 2012, respectively. The letters “c” and “d” denote convective cells over the mountains. (d) As in (a–c) but the composite radar reflectivity (color shaded, units: ≥35 dBZ) and the topographic height (gray shaded, units: m).
Figure 12.
(
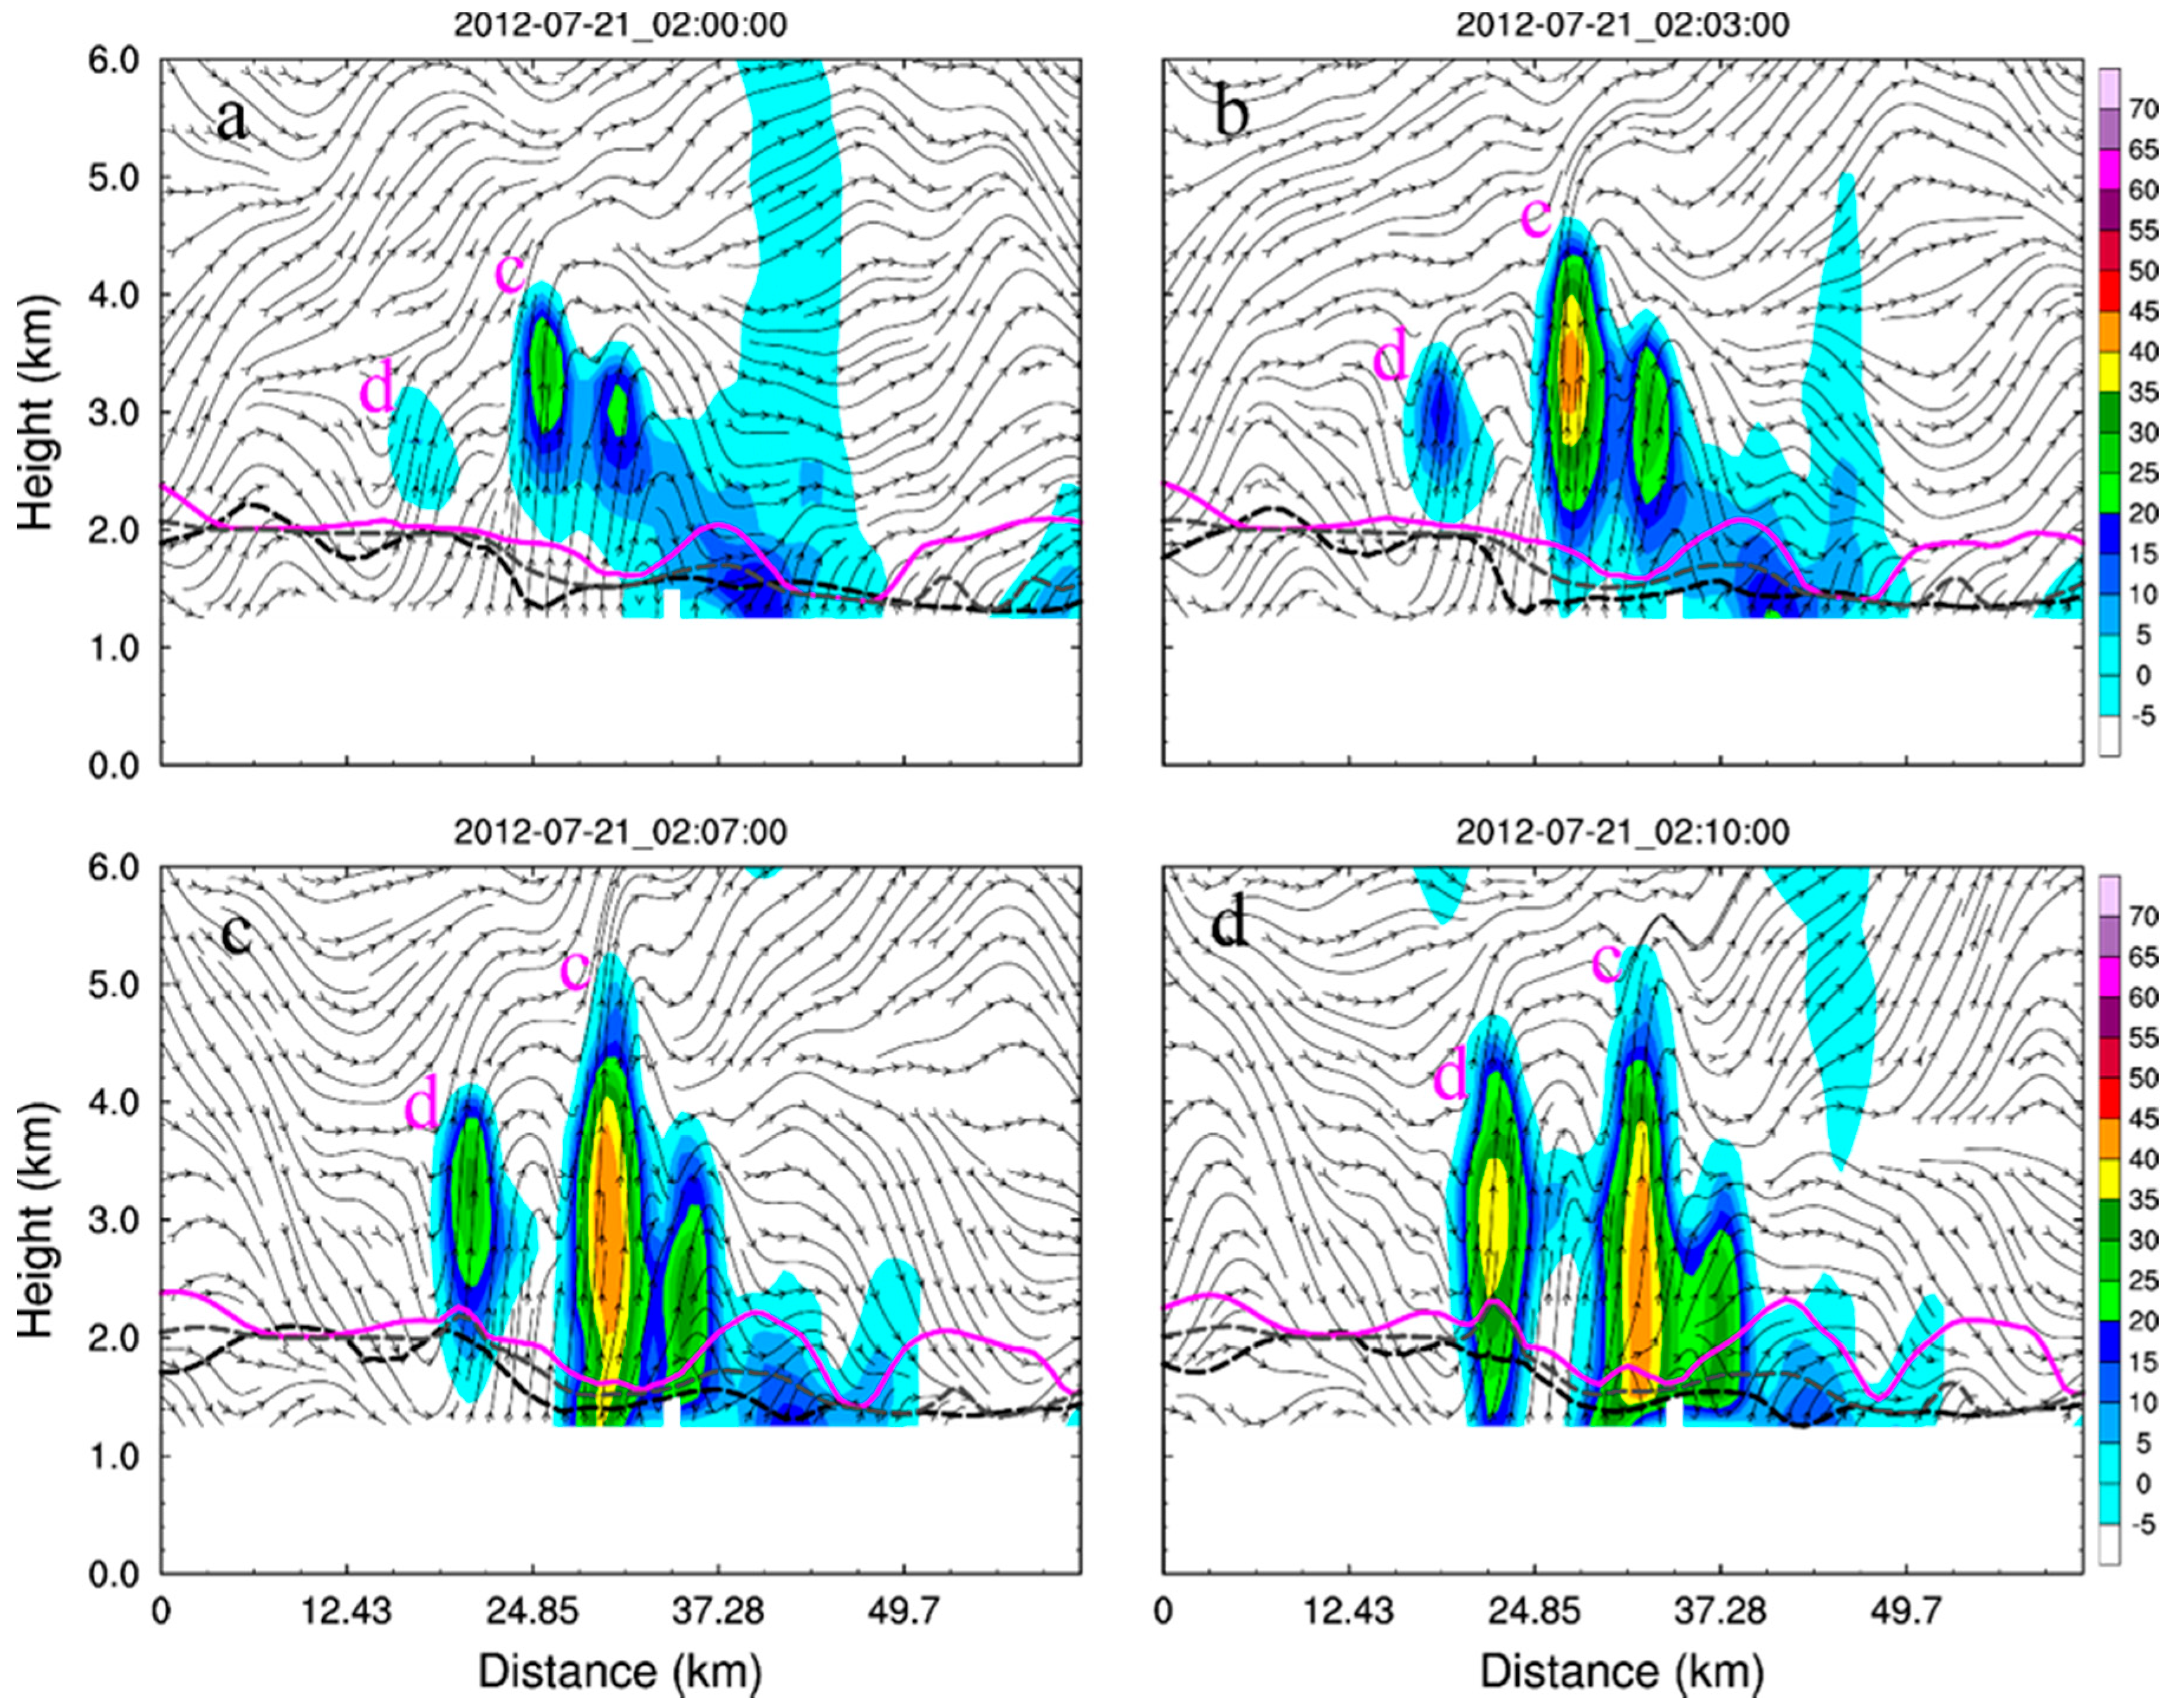
a–
d) Vertical cross sections of the simulated composite radar reflectivity (shaded, units: dBZ), the wind field (streamlines, units: m s
−1), the LCL (gray dotted line), the PBLH (black dotted line), and the LFC (magenta solid line) along the red lines given in
Figure 10, valid at 0200, 0203, 0207, and 0210 UTC 21 July 2012, respectively. The letters “c” and “d” denote convective cells over the mountains.
Figure 13.
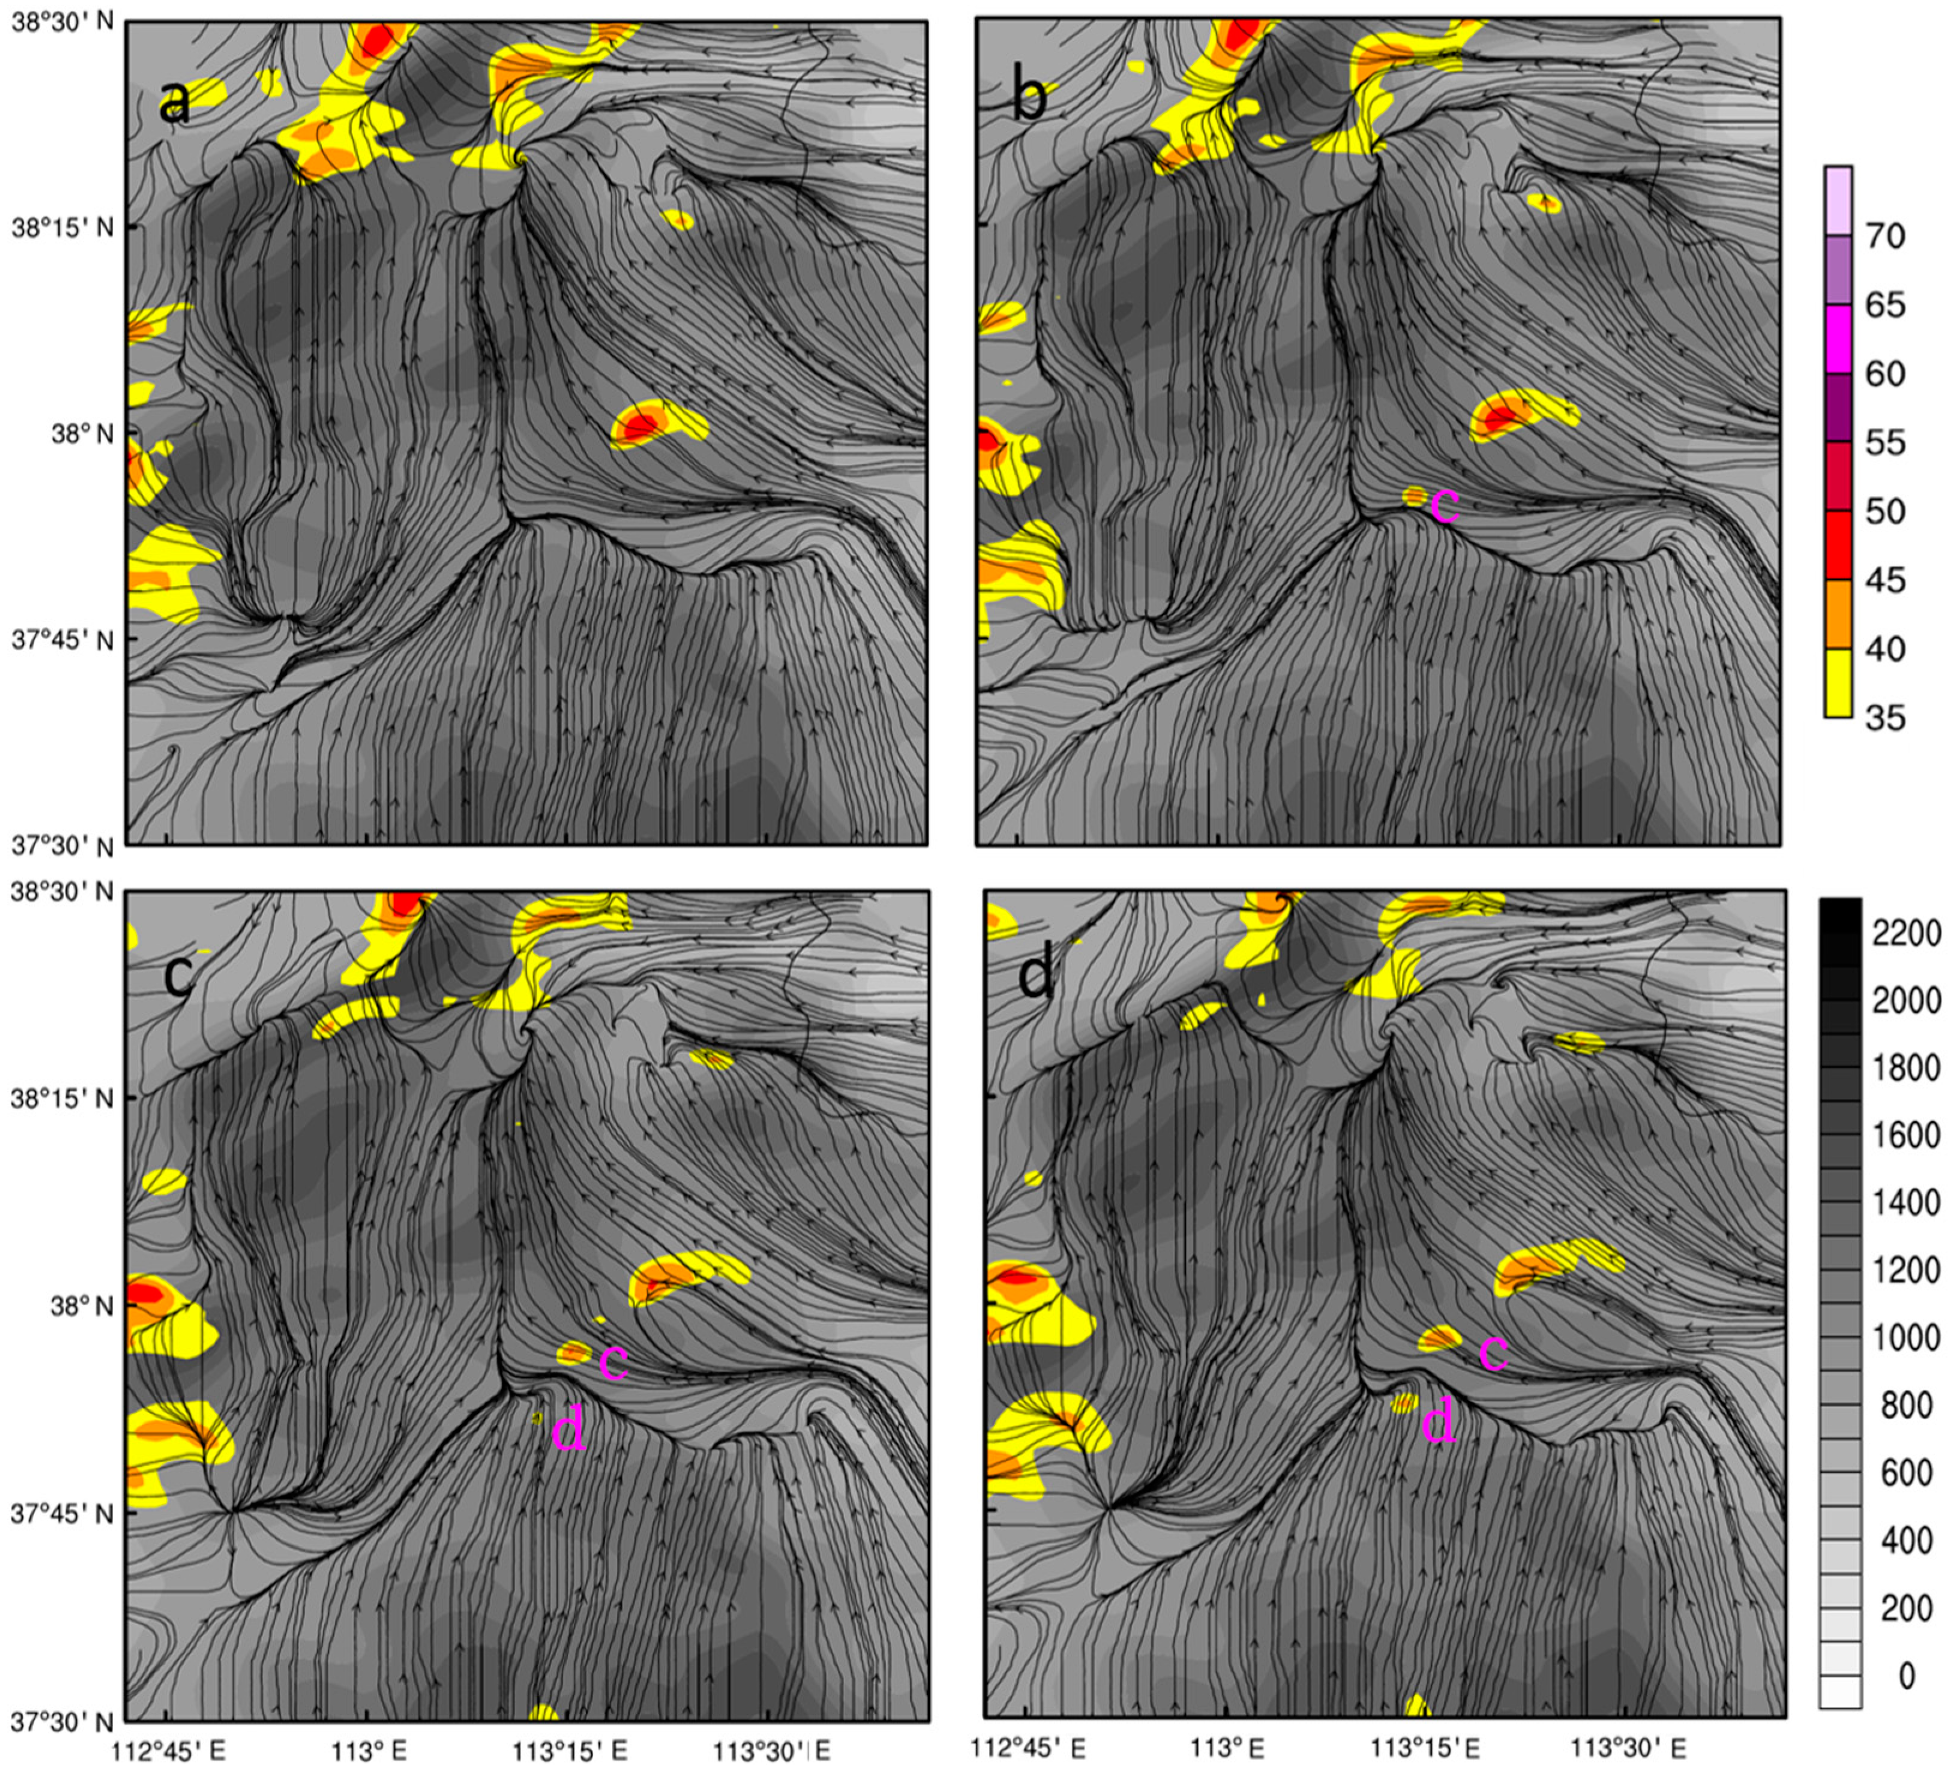
(a–d) Simulated composite radar reflectivity (color shaded, units: ≥35 dBZ), the topographic height (gray shaded, units: m), and the 10-m wind field (streamlines) during the evolution of convective cells ‘c’ and ‘d’ over the mountains at 0200, 0203, 0207, and 0210 UTC, respectively.
Figure 13.
(a–d) Simulated composite radar reflectivity (color shaded, units: ≥35 dBZ), the topographic height (gray shaded, units: m), and the 10-m wind field (streamlines) during the evolution of convective cells ‘c’ and ‘d’ over the mountains at 0200, 0203, 0207, and 0210 UTC, respectively.
Figure 14.
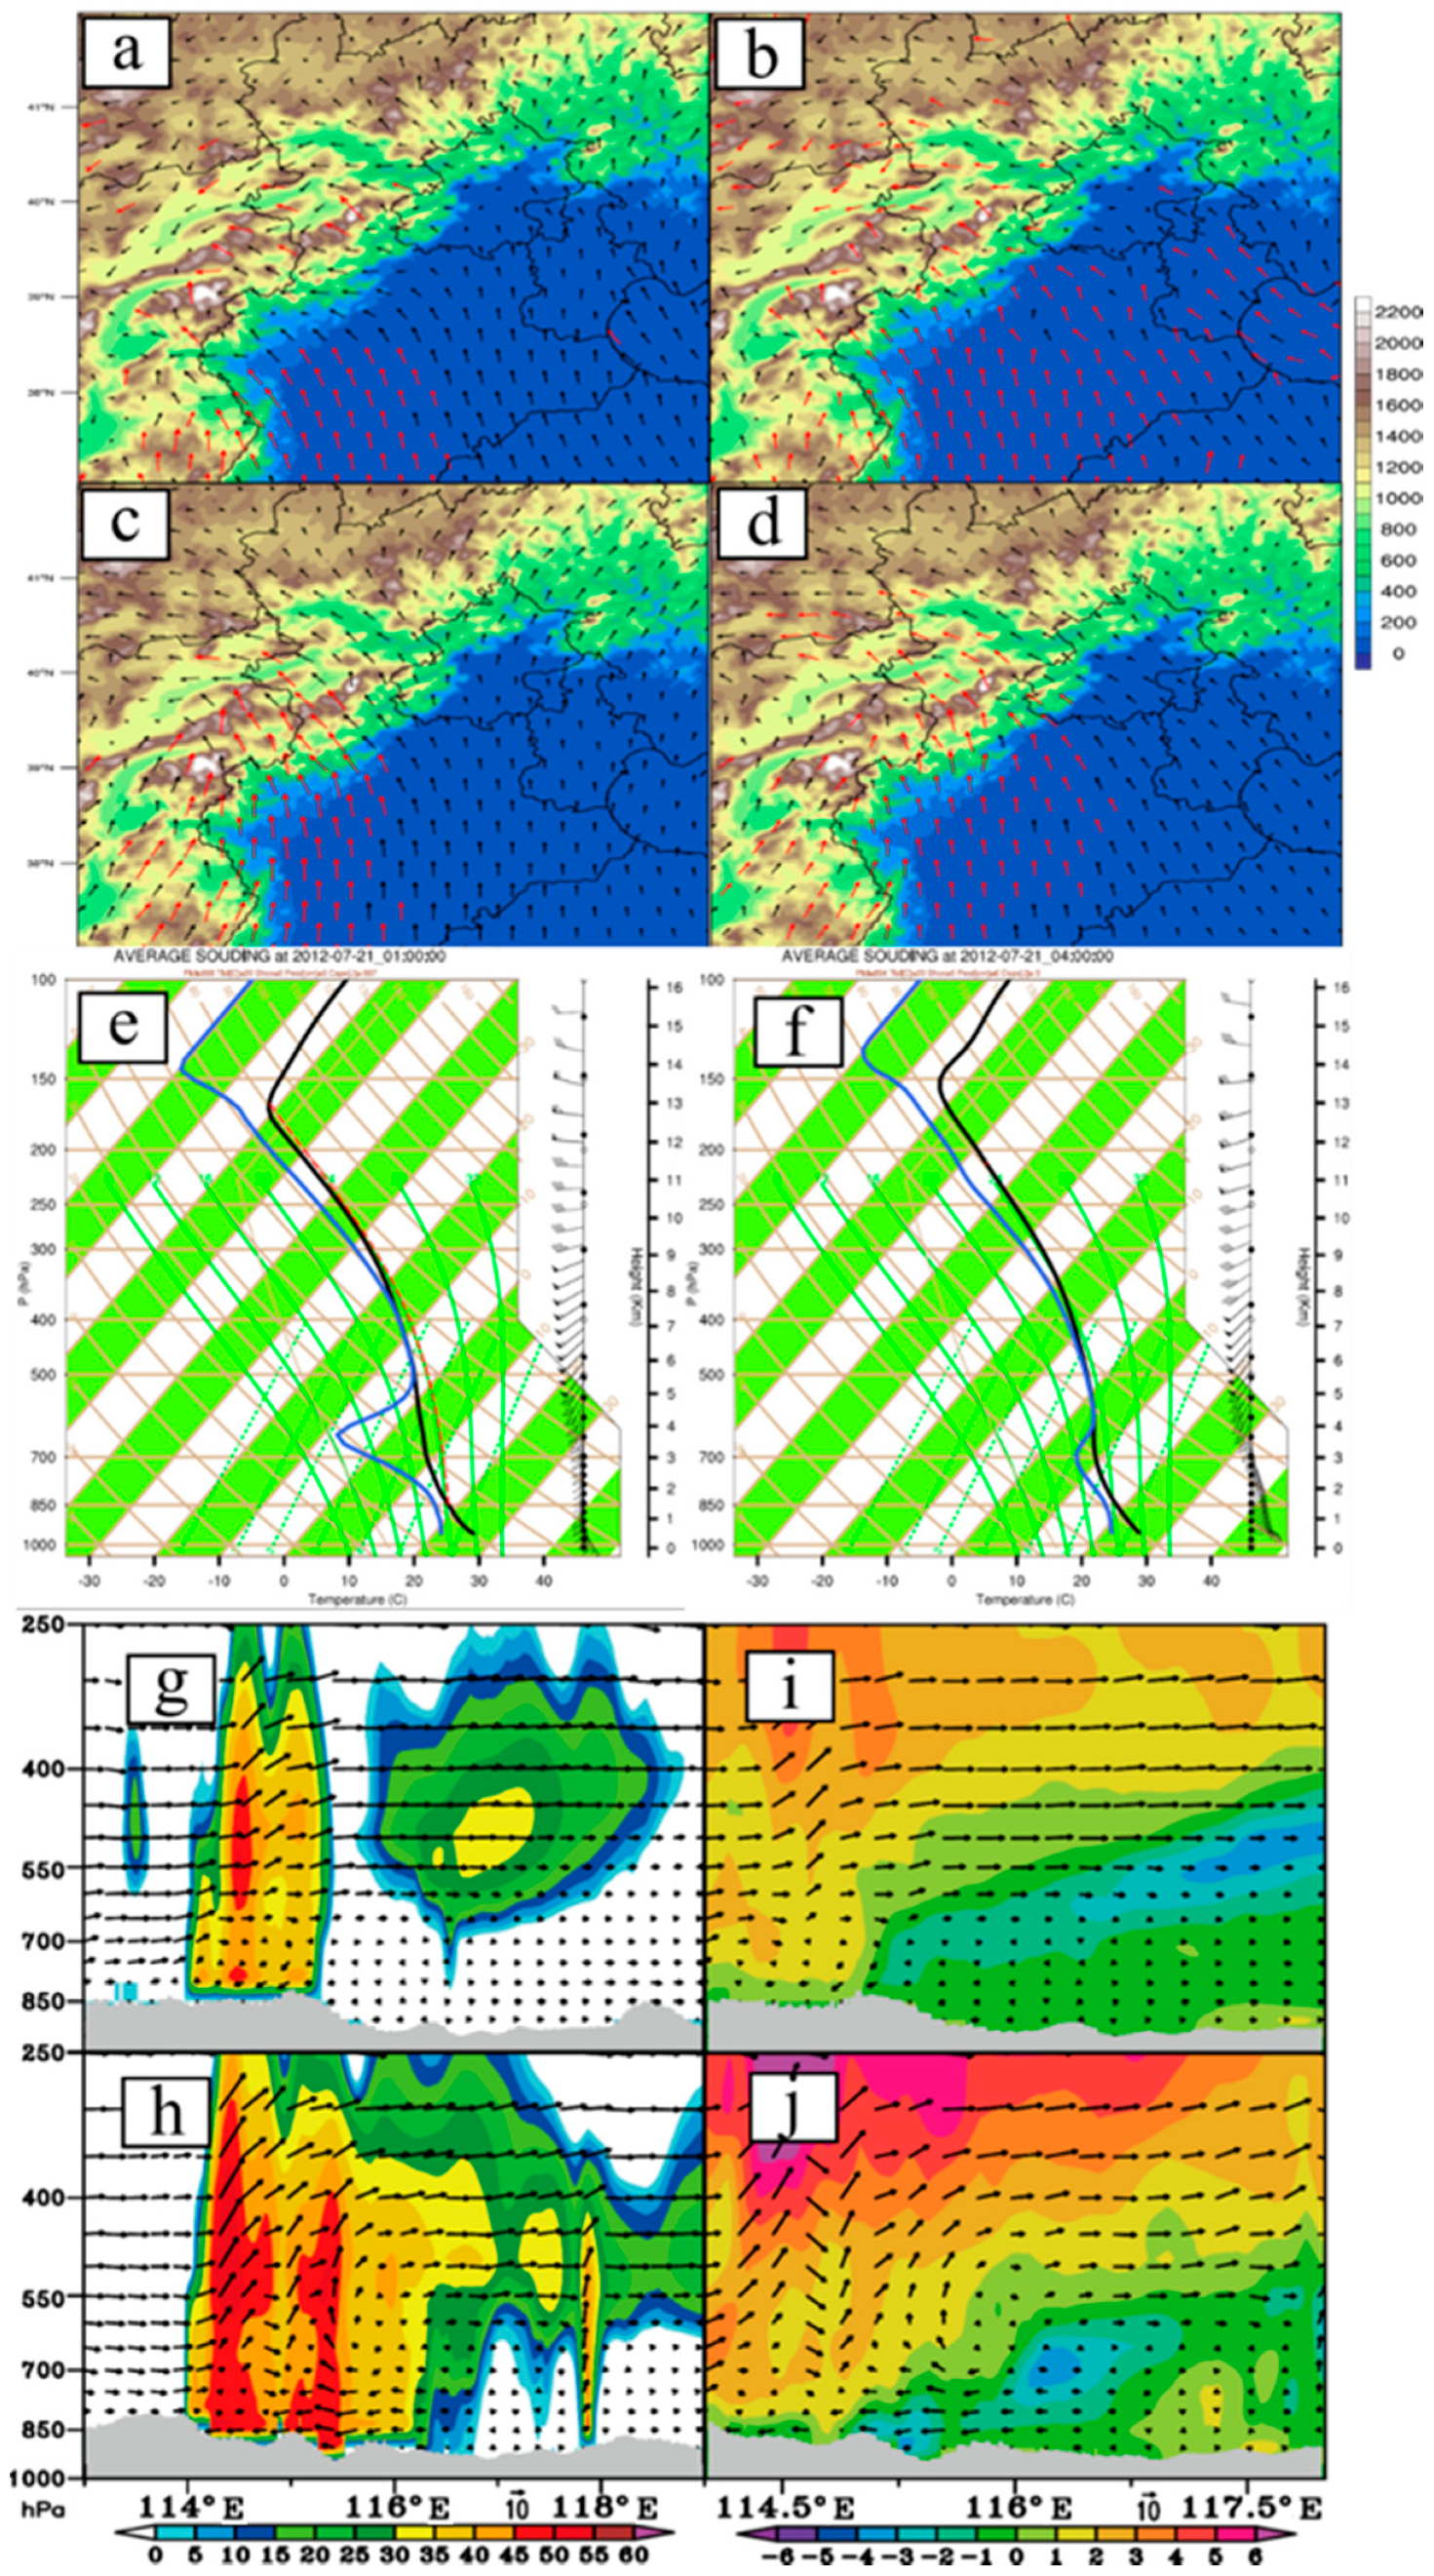
(
a,
b) Simulated 10 m horizontal wind (arrow), with red arrows wind speed > 5 m s
−1. (
c,
d) Simulated horizontal wind at 850 hPa (arrow), with red arrows wind speed > 12 m s
−1. The shading area is terrain height. (
a,
c) is at 0200 UTC, (
b,
d) is at 0400 UTC. (
e,
f) Skew-T plots of soundings averaged over the black box in
Figure 3a1 at 0100 and 0400 UTC, respectively. Simulated vertical cross sections of (
g,
h) radar reflectivity (dBZ, shaded), wind field (vectors), and (
i,
j) potential temperature perturbation (°C, shaded) at (
g,
i) 0800 and (
h,
j) 0830 UTC, respectively. The gray-shading at the bottom denotes the topography profile.
Figure 15.
Three-dimensional diagram of flow field (streamlines) and radar echo reflectivity (shaded) at the initiation time of the convective cells over the mountains.
Figure 15.
Three-dimensional diagram of flow field (streamlines) and radar echo reflectivity (shaded) at the initiation time of the convective cells over the mountains.
Figure 16.
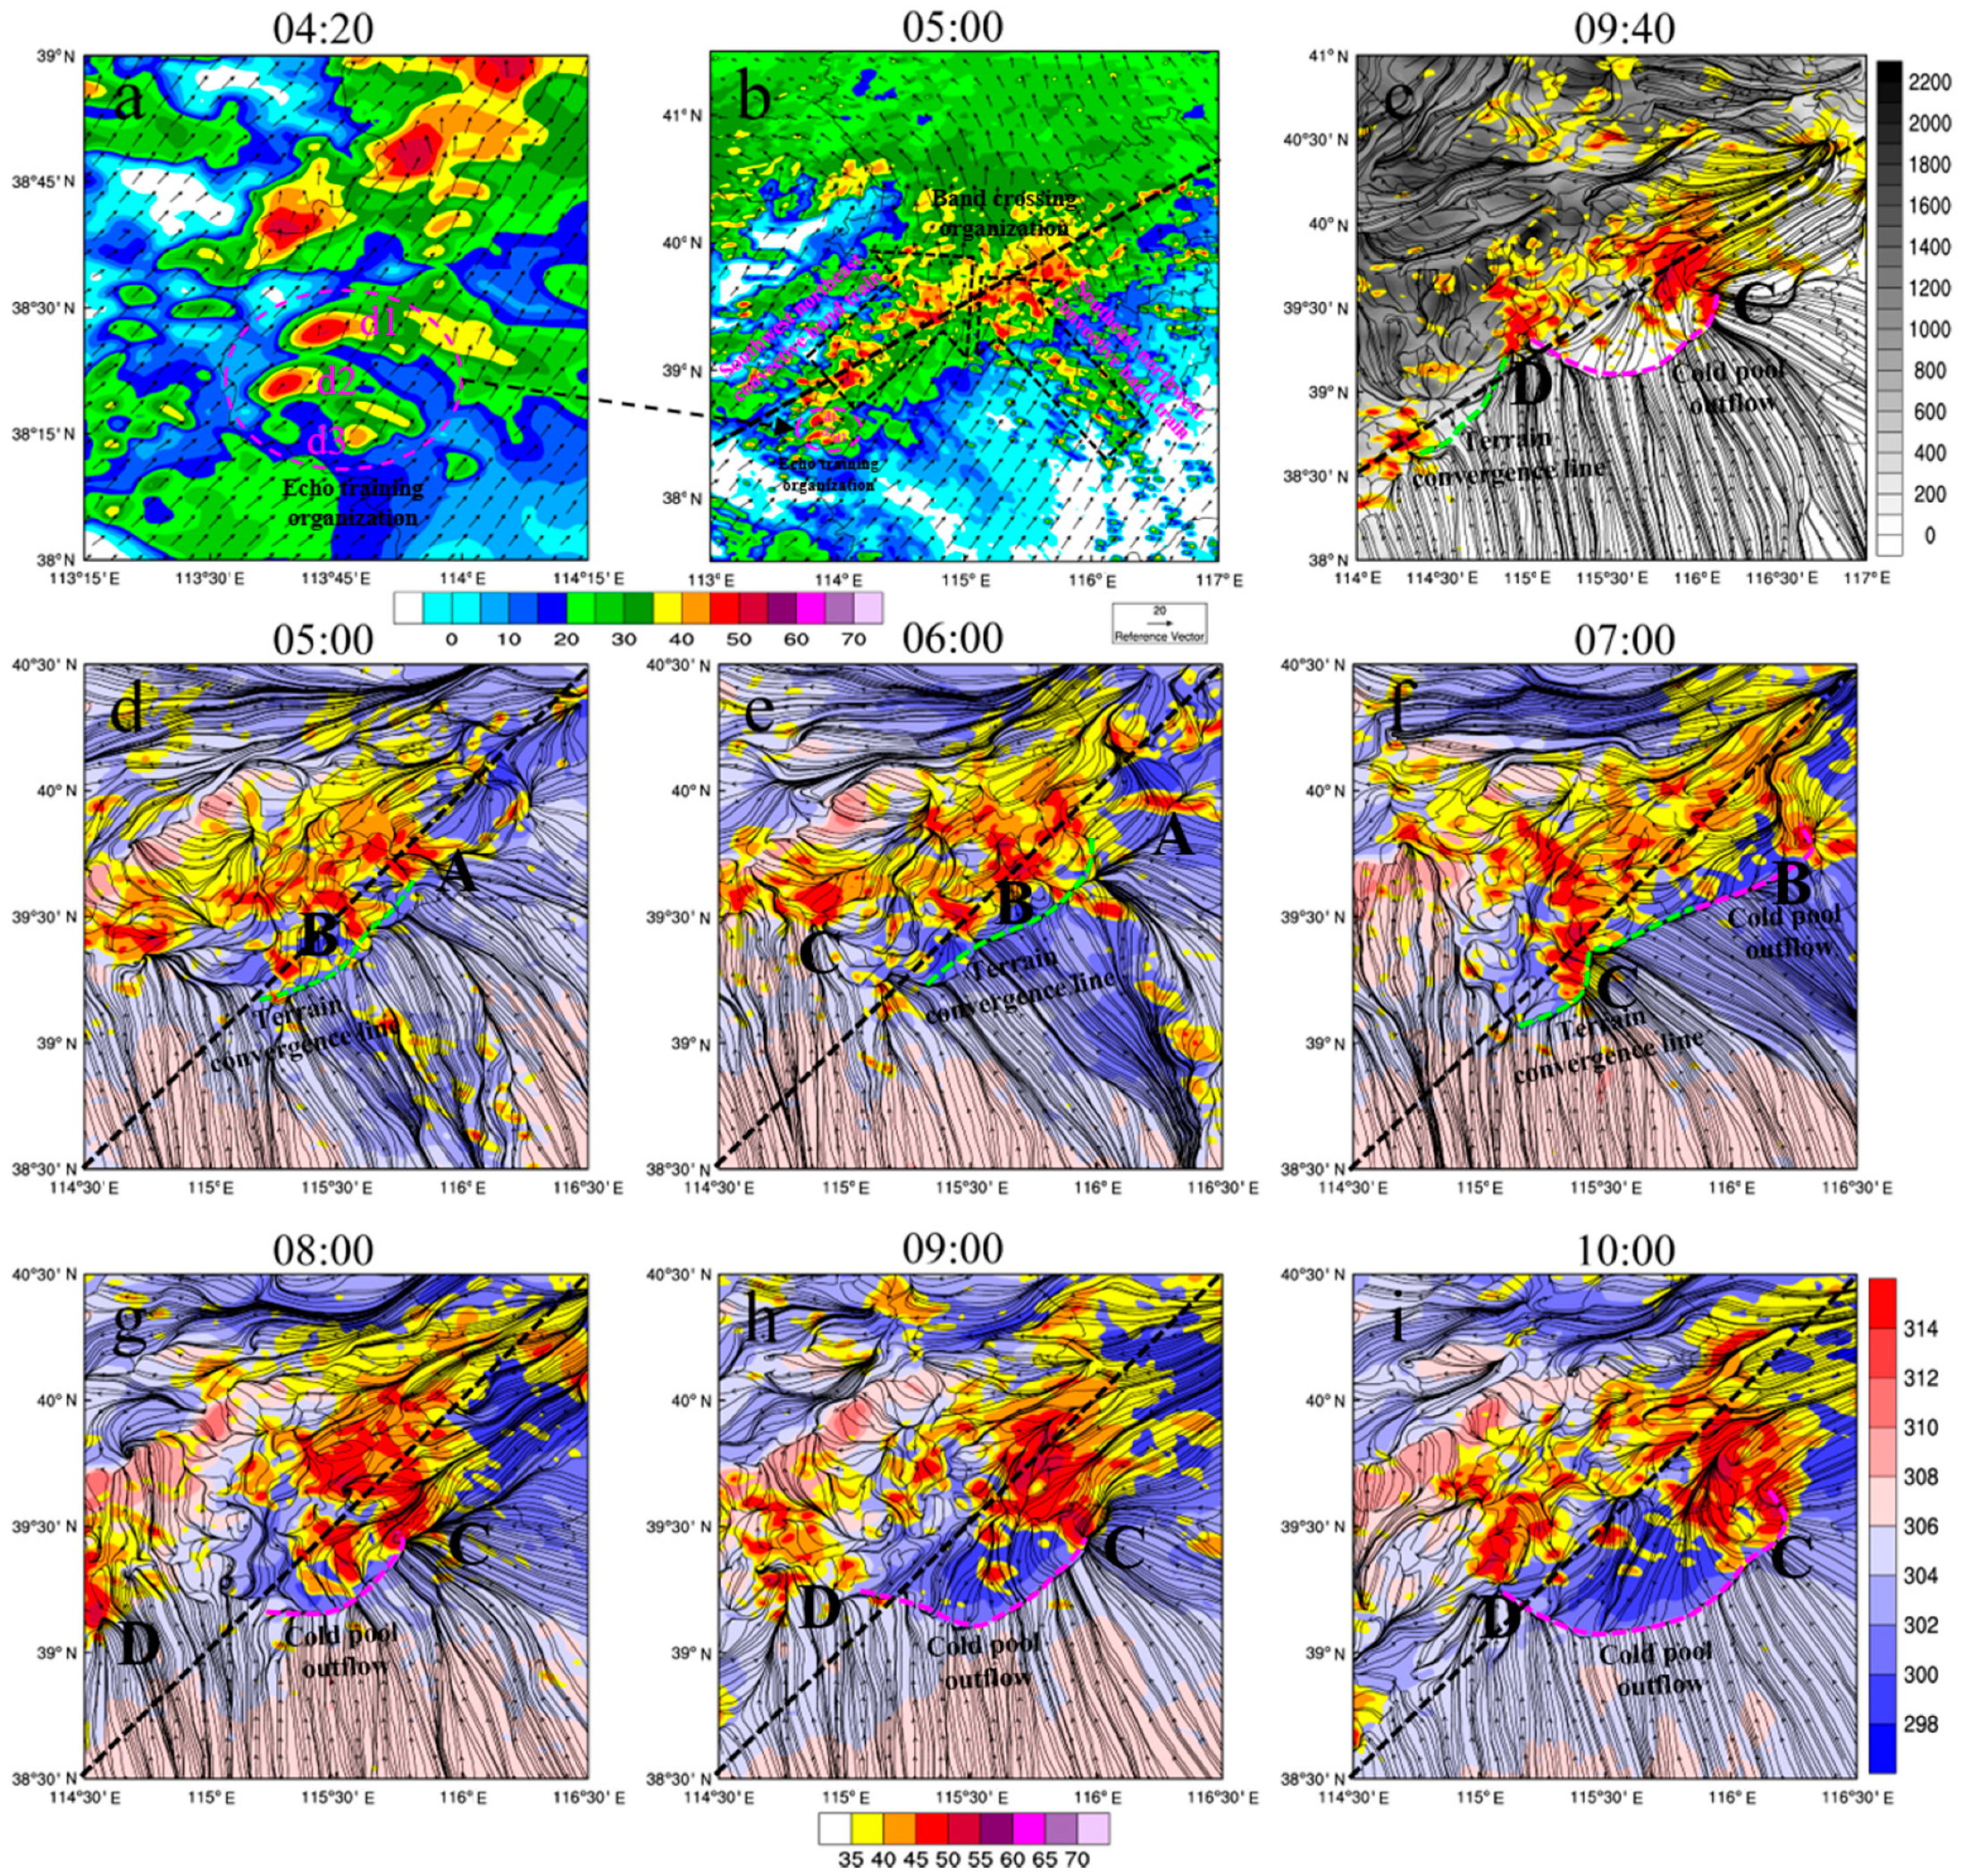
(a,b) Simulated composite radar reflectivity (shaded, units: dBZ) and the wind field (vector arrows, units: m s−1) at 700 hPa at 0420 and 0500 UTC 21 July 2012, respectively. The magenta dotted ellipse in (a) denotes the echo-scale organization, and the two hollow arrows in (b) the band-scale organization. (d–i) Simulated composite radar reflectivity (shaded, units: ≥35 dBZ), the 2-m potential temperature (red and blue shaded, units: K) and the 2-m wind field (streamlines) at 0500, 0600, 0700, 0800, 0900, and 1000 UTC, respectively. The letters “A”, “B”, “C”, and “D” represent MCS-A, -B, -C, and -D, respectively. (c) As in (d–i) but for the topographic height (gray shaded, units: m). The green dotted lines denote the terrain convergence line. The magenta dotted line represents the outflow boundary of the surface cold pool. The black dotted lines roughly divide mountains and plains.
Figure 17.
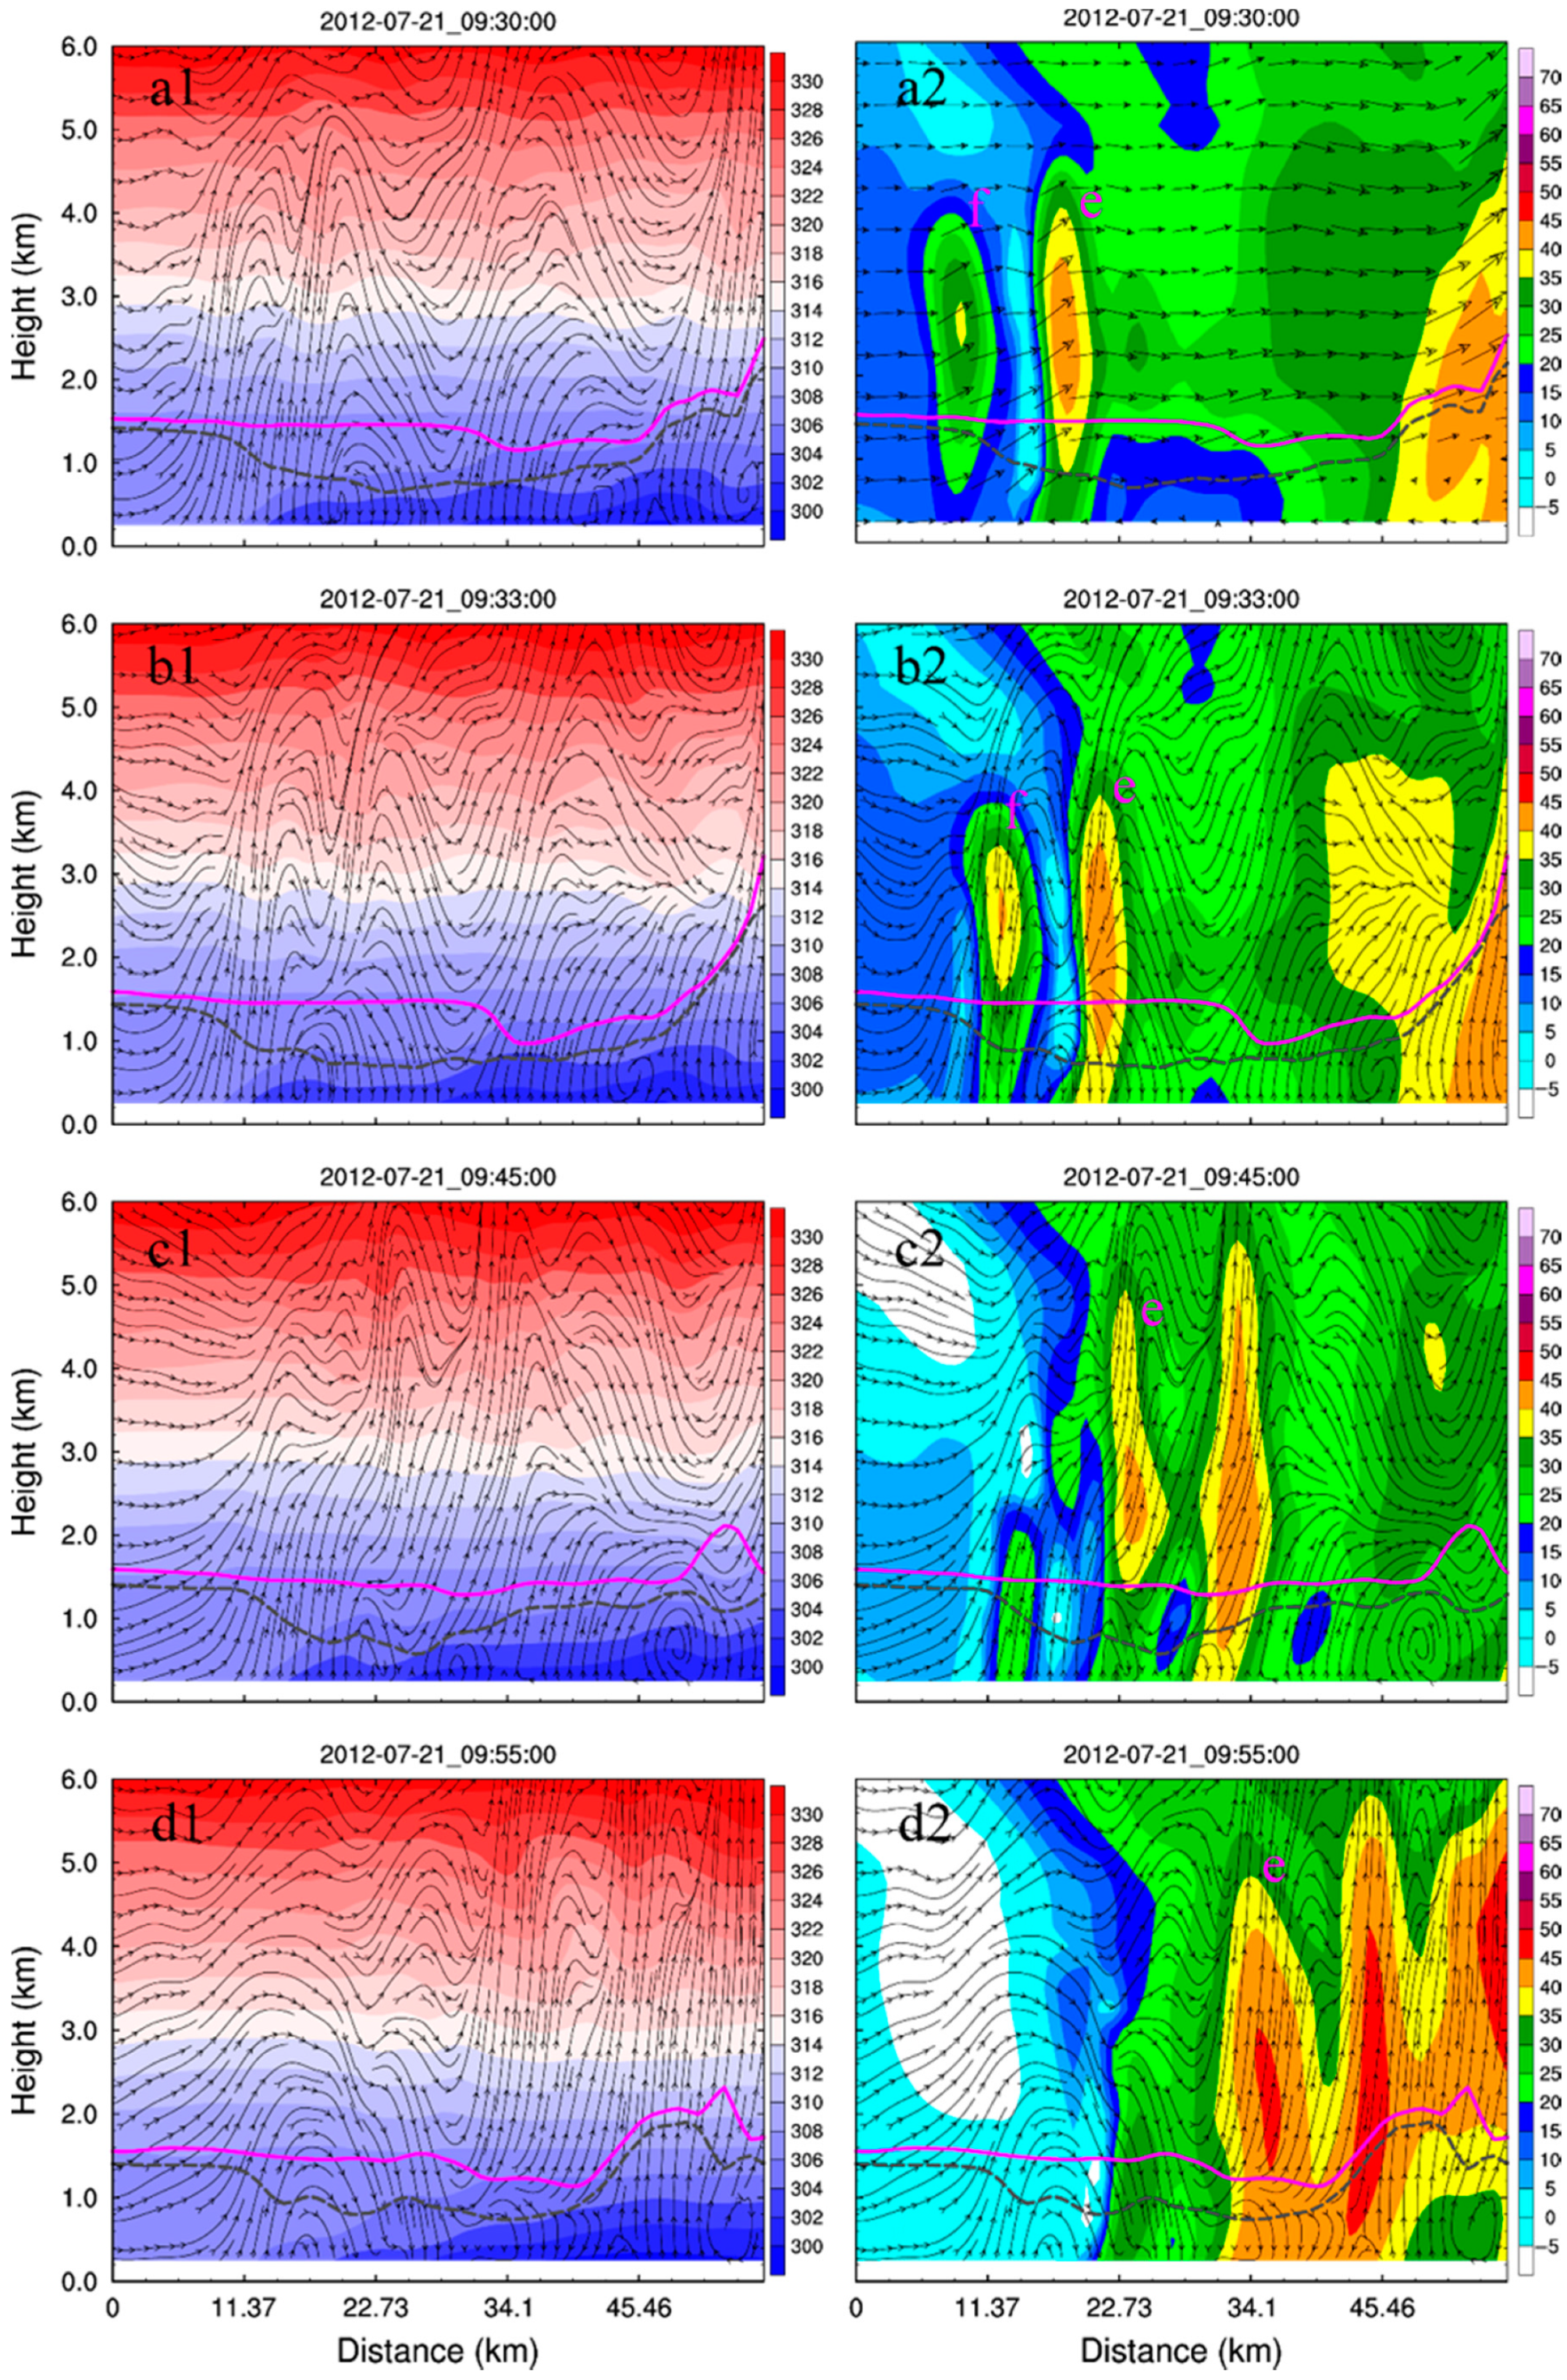
(a1–d1) Vertical cross sections of the simulated equivalent potential temperature (shaded, units: K), the wind field (streamlines, units: m s−1), the LCL (gray dotted line), the PBLH (black dotted line), and the LFC (magenta solid line) during the evolution of convective cells ‘e’ and ‘f’, valid at 0930, 0933, 0945, and 0955 UTC 21 July 2012, respectively. (a2–d2) As in (a1–d1) but for composite radar reflectivity (shaded, units: dBZ).
Figure 18.
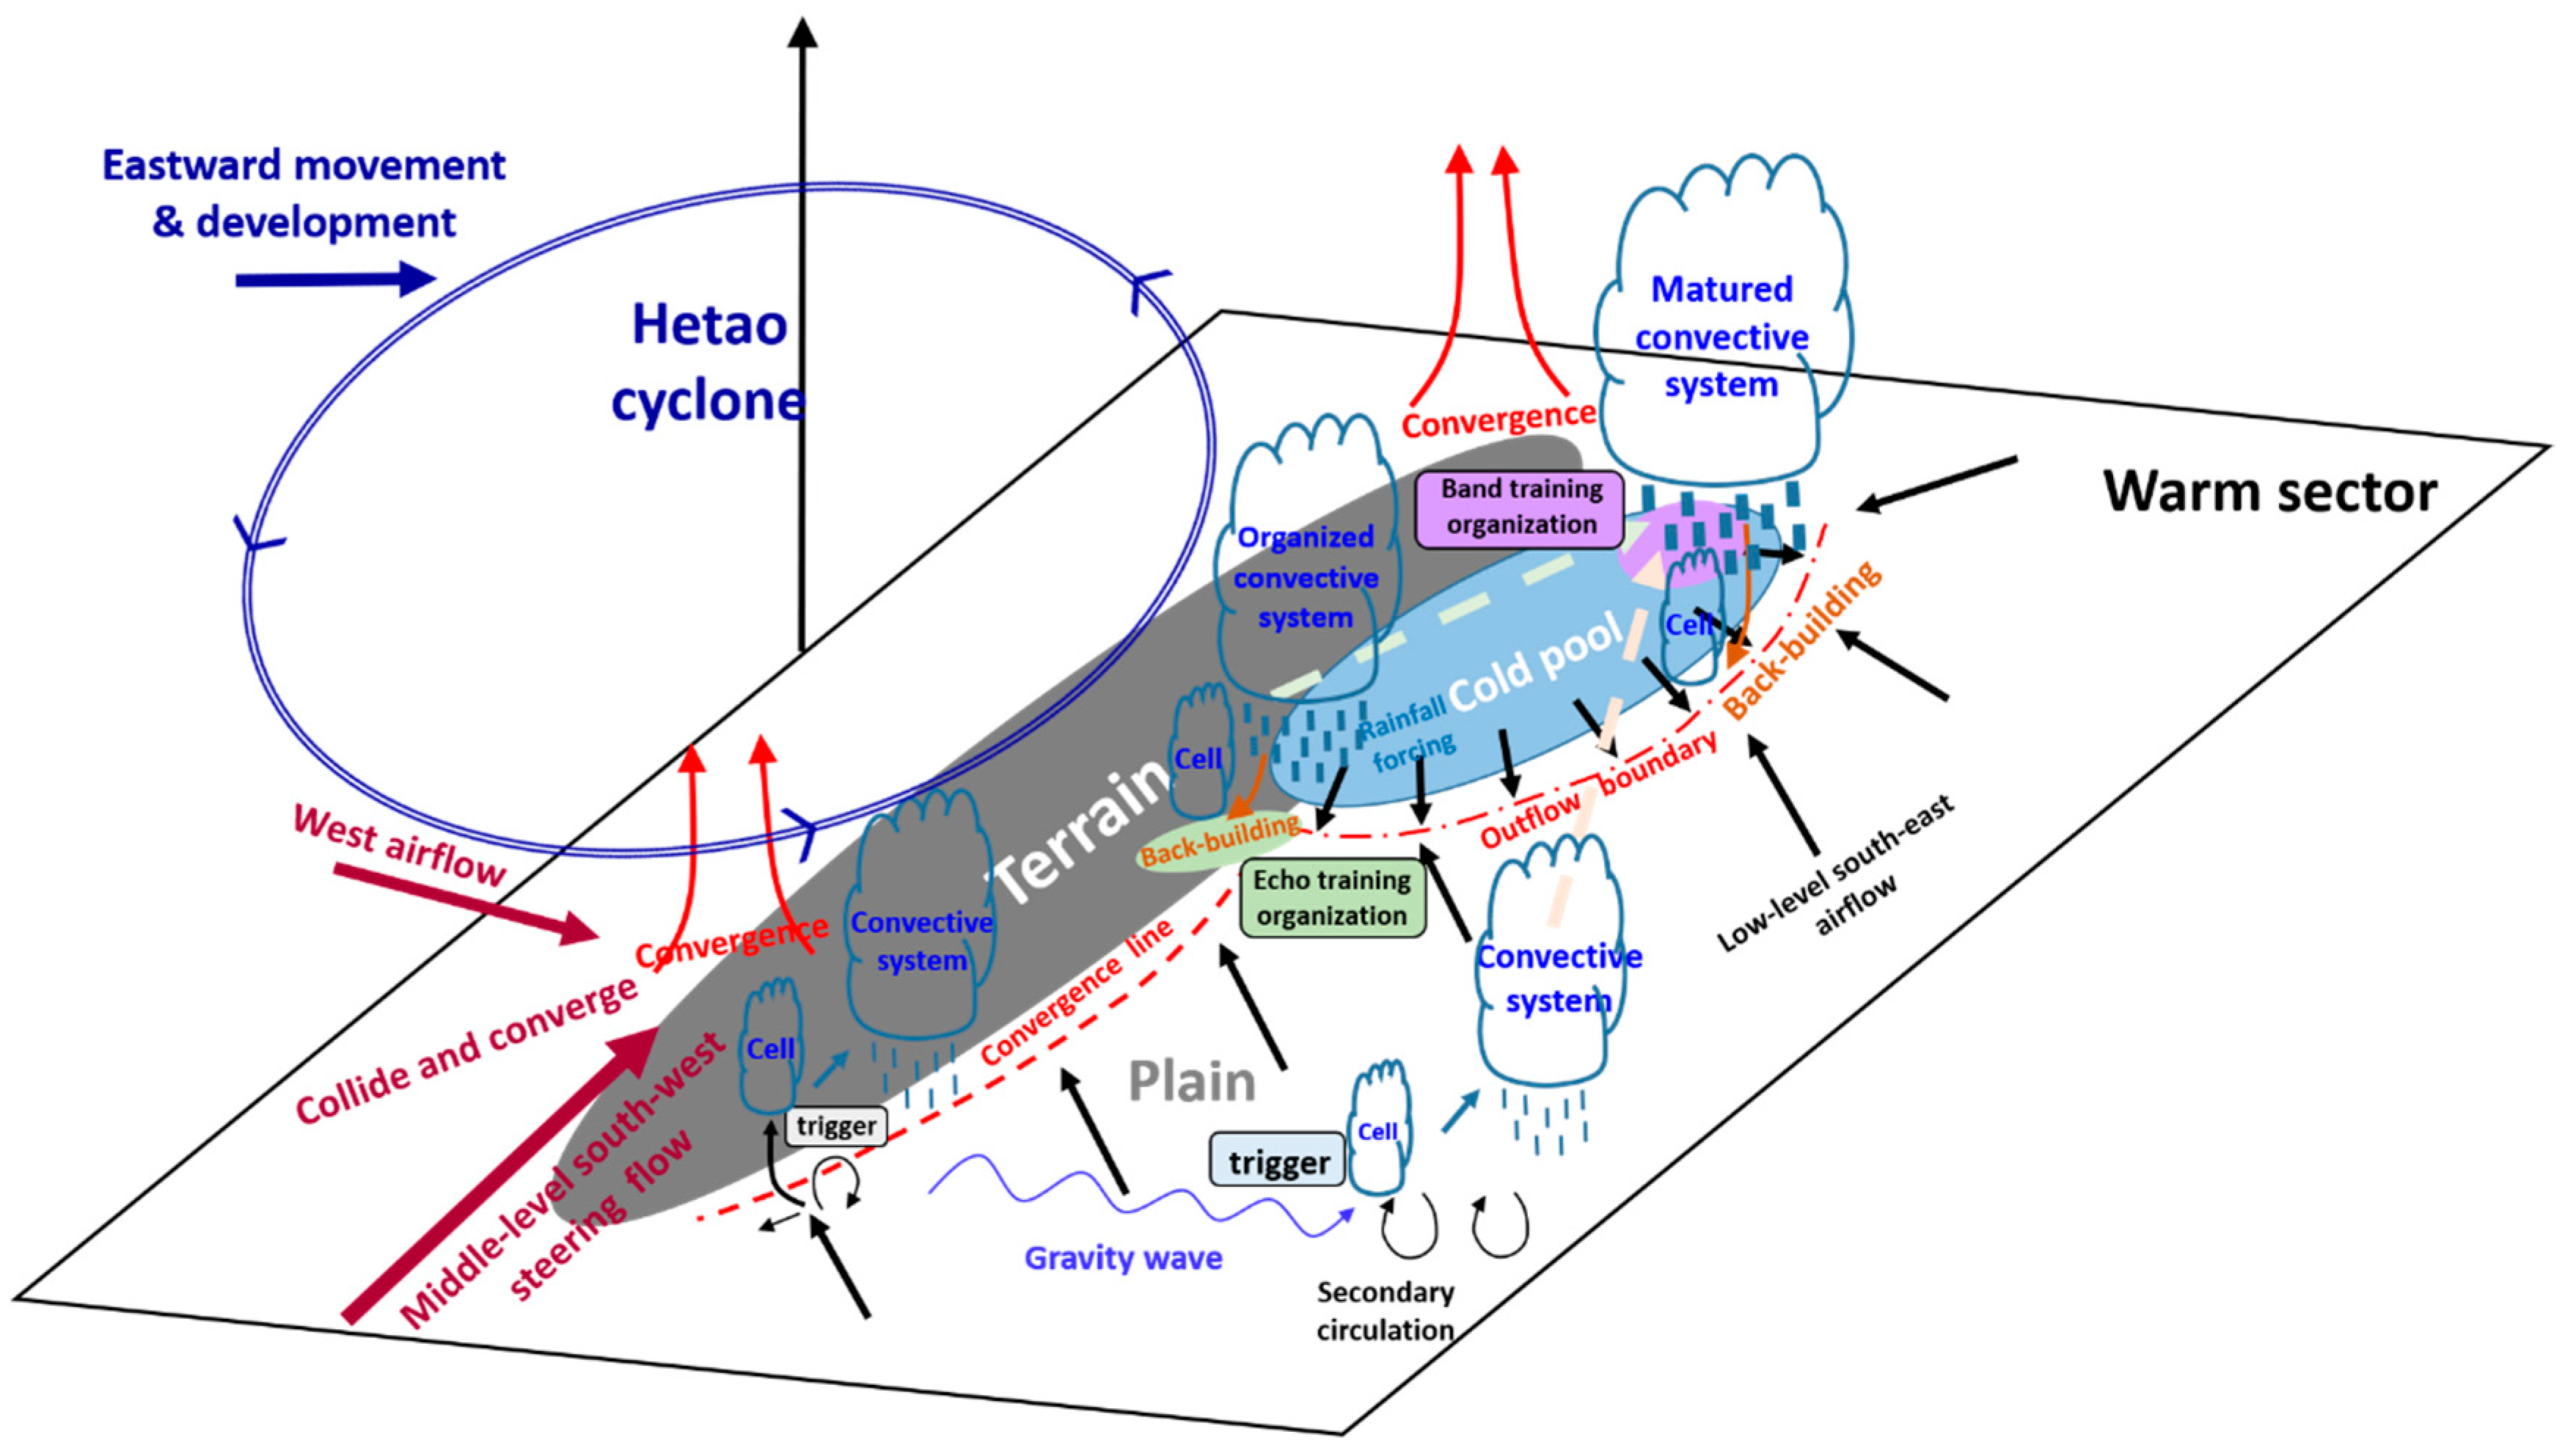
Conceptual model of the probable initiation and organization mechanisms of the mesoscale convective systems in this warm-sector torrential rain event over Beijing.
Figure 18.
Conceptual model of the probable initiation and organization mechanisms of the mesoscale convective systems in this warm-sector torrential rain event over Beijing.
Table 1.
Statistical results of the observed and simulated hourly rainfall amount.
Table 1.
Statistical results of the observed and simulated hourly rainfall amount.
| | WSP | CFP | ALL |
|---|
| CORR | 0.985 | 0.885 | 0.925 |
| RMSE | 1.777 | 4.686 | 3.614 |
