Article

Climatology of the Boundary Layer Height and of the Wind Field over Greece

by
Nikolaos A. Bakas
1,*,
Angeliki Fotiadi
2 and
Sophia Kariofillidi
1,†
1
Laboratory of Meteorology and Climatology, Department of Physics, University of Ioannina, 45110 Ioannina, Greece
2
Department of Environmental Engineering, University of Patras, 30100 Agrinio, Greece
*
Author to whom correspondence should be addressed.
Current address: Department of Physics, National and Kapodistrian University of Athens, 15784 Athens, Greece.
Atmosphere 2020, 11(9), 910; https://doi.org/10.3390/atmos11090910
Submission received: 17 July 2020 / Revised: 21 August 2020 / Accepted: 21 August 2020 / Published: 27 August 2020
(This article belongs to the Section Climatology)

Abstract

:
In this study, a climatology of two key boundary layer features, the Planetary Boundary Layer Height (PBLH) and the wind field over Greece is derived. The climatology is based on daily soundings collected in Athens, Thessaloniki and Heraklion and spanning a 32-year period. The PBLH is estimated using a method based on the gradient of potential temperature and a method based on the bulk Richardson number. The wind field is analyzed by calculating the wind shear and the turning angle of the wind vector between the surface and the top of the boundary layer. The PBLH of the daytime boundary layer over Athens and Thessaloniki is found to exhibit seasonal variability with summer maxima and winter minima and has annual median values in the range of 1.4–1.7 km estimated using the gradient method. The PBLH over Heraklion is found to exhibit weak seasonal variability with a lower median value of 1.2 km. The nighttime boundary layer over all three sites is found to be much shallower with PBLH values in the range of 150–200 m with no seasonal variations. In addition, the bulk Richardson number method is found to systematically underestimate the PBLH compared to the gradient method. The wind field in the daytime boundary layer at all three sites is found to have small shear of the order of 1 ms 1 and wind turning angles that are lower than 15 degrees, while in the nocturnal boundary layer it has larger shear of the order of 5–10 ms 1 with turning angles lower than 20 degrees. In addition, for both the daytime and the nighttime boundary layer there is no general preference for veering or backing.

1. Introduction

The Planetary Boundary layer (PBL) is the lowest layer of the atmosphere where the Earth’s surface interacts with the free troposphere through energy, momentum, moisture, and chemical compounds exchanges. The key role of the PBL in many aspects of weather, climate and air quality has long been recognized since it is involved in many processes such as convection, turbulent mixing, low-level cloud and fog formation, pollutants dispersion and the surface energy budget. Thus, the realistic parametrization of PBL characteristics and their temporal evolution is critical to weather forecast and to climate and air pollution models.
The PBL structure is determined by the complex interactions between the surface forcing, the local circulation and the synoptic flow and therefore exhibits variability in a large range of spatial and temporal scales [1,2]. To characterize the complex PBL structure, two key features have been widely used: the Planetary Boundary Layer Height (PBLH) and the mean wind field as described by the wind shear and the turning of the wind vector. The PBLH determines the vertical extent of turbulent mixing and convective transport within the boundary layer and has been used as a key parameter in weather, climate and air quality models [3,4,5]. The horizontal wind field and its change with height determines the dispersion of pollutants within the boundary layer, has a substantial impact on the development of cyclones [6] and its knowledge is also required in applications such as the wind turbine industry [7].
The PBLH is mainly influenced by the intensity of the turbulence in the boundary layer while it is also influenced by the terrain complexity, the local flow and the synoptic conditions [1]. During daytime, convectively driven turbulence leads to a deep boundary layer with typical values for the PBLH of the order of a couple of kilometers over land and lower values observed in marine boundary layers [2]. After sunset, the confinement of turbulence near the surface results in a shallow PBL of the order of a few hundred meters [8]. The wind field structure is similarly influenced by static stability as well as the surface terrain and the baroclinicity of the thermal wind. Surface and eddy friction change the direction of the wind with height, with stable conditions [9] and warm advection [10] leading to larger wind turning angles. Typical values for the angle between the surface wind and the wind at the top of the boundary layer reach 45 ° under stable conditions in the midlatitudes over land [11], while much lower values of up to 10 ° occur in marine boundary layers due to the absence of surface roughness [12]. During daytime, as convective turbulence mixes the air masses, much smaller values of wind turning angles of the order of 10 ° are reported over land as well [2]. Wind speed has received much less attention with a large spread of reported values and without any clear correlation to the turning of the wind vector [12].
Measurements of the horizontal wind field are readily available from radiosondes as well as from products using remote sensing techniques. The PBLH however, is not an observed quantity. Its estimation is based on the heights within the boundary layer in which turbulence prevails and requires measurements of the turbulent fluxes that are only provided near the surface. Consequently, there are many indirect methods that have been proposed to estimate the PBLH from vertical profiles of atmospheric variables such as temperature, humidity, wind and aerosol concentrations. The most commonly used measurements are again radiosonde soundings [4,13] and remote sensing techniques using LiDAR [14,15,16], sodar [17,18] and ceilometer [19,20] measurements. The radiosonde measurements have the advantage of a long-term time series as they are relatively cheap to operate, but their global spatial coverage is limited, and they are routinely released only four times per day, therefore providing a very rough picture of the PBL’s diurnal variability. On the other hand, remote sensing techniques provide continuous in time measurements and a better vertical resolution, but they are too expensive to continuously operate and data is limited to short-duration campaigns.
The goal of this study is to derive a long-term climatology for the PBLH and the wind field in the boundary layer over Greece. We will therefore use sounding measurements that cover a long time period. Similar climatologies for the PBLH have been derived for continents such as Europe and the US [21], for marine and continental sites over the globe [22] and for specific countries such as China [23] and Germany [24]. However, for the area of Greece there is only one study for the city of Thessaloniki that is based on two years of data [25]. In this study, we expand the climatology over a period of 32 years and over two additional sites in Greece. In addition, climatologies of the wind field have recently been reported on a global scale [26] but this study focuses on the region of Greece.
This paper is organized as follows. In Section 2 we present the data set and the methods used to estimate the PBLH and the wind field over Greece. In Section 3 and Section 4 we present the climatologies of the PBLH and the wind field respectively and compare the obtained climatology to results of previous studies in Section 5. Finally, we end with our conclusions in Section 6.

2. Data and Methodology

2.1. Data

We used measurements of potential temperature, wind speed and wind direction from soundings released by the Hellenic National Meteorological Service (HNMS) over three sites in Greece: Athens (37.98° N,23.73° E), Thessaloniki (40.64° N,22.94° E) and Heraklion (35.34° N,25.14° E) that are shown in Figure 1.
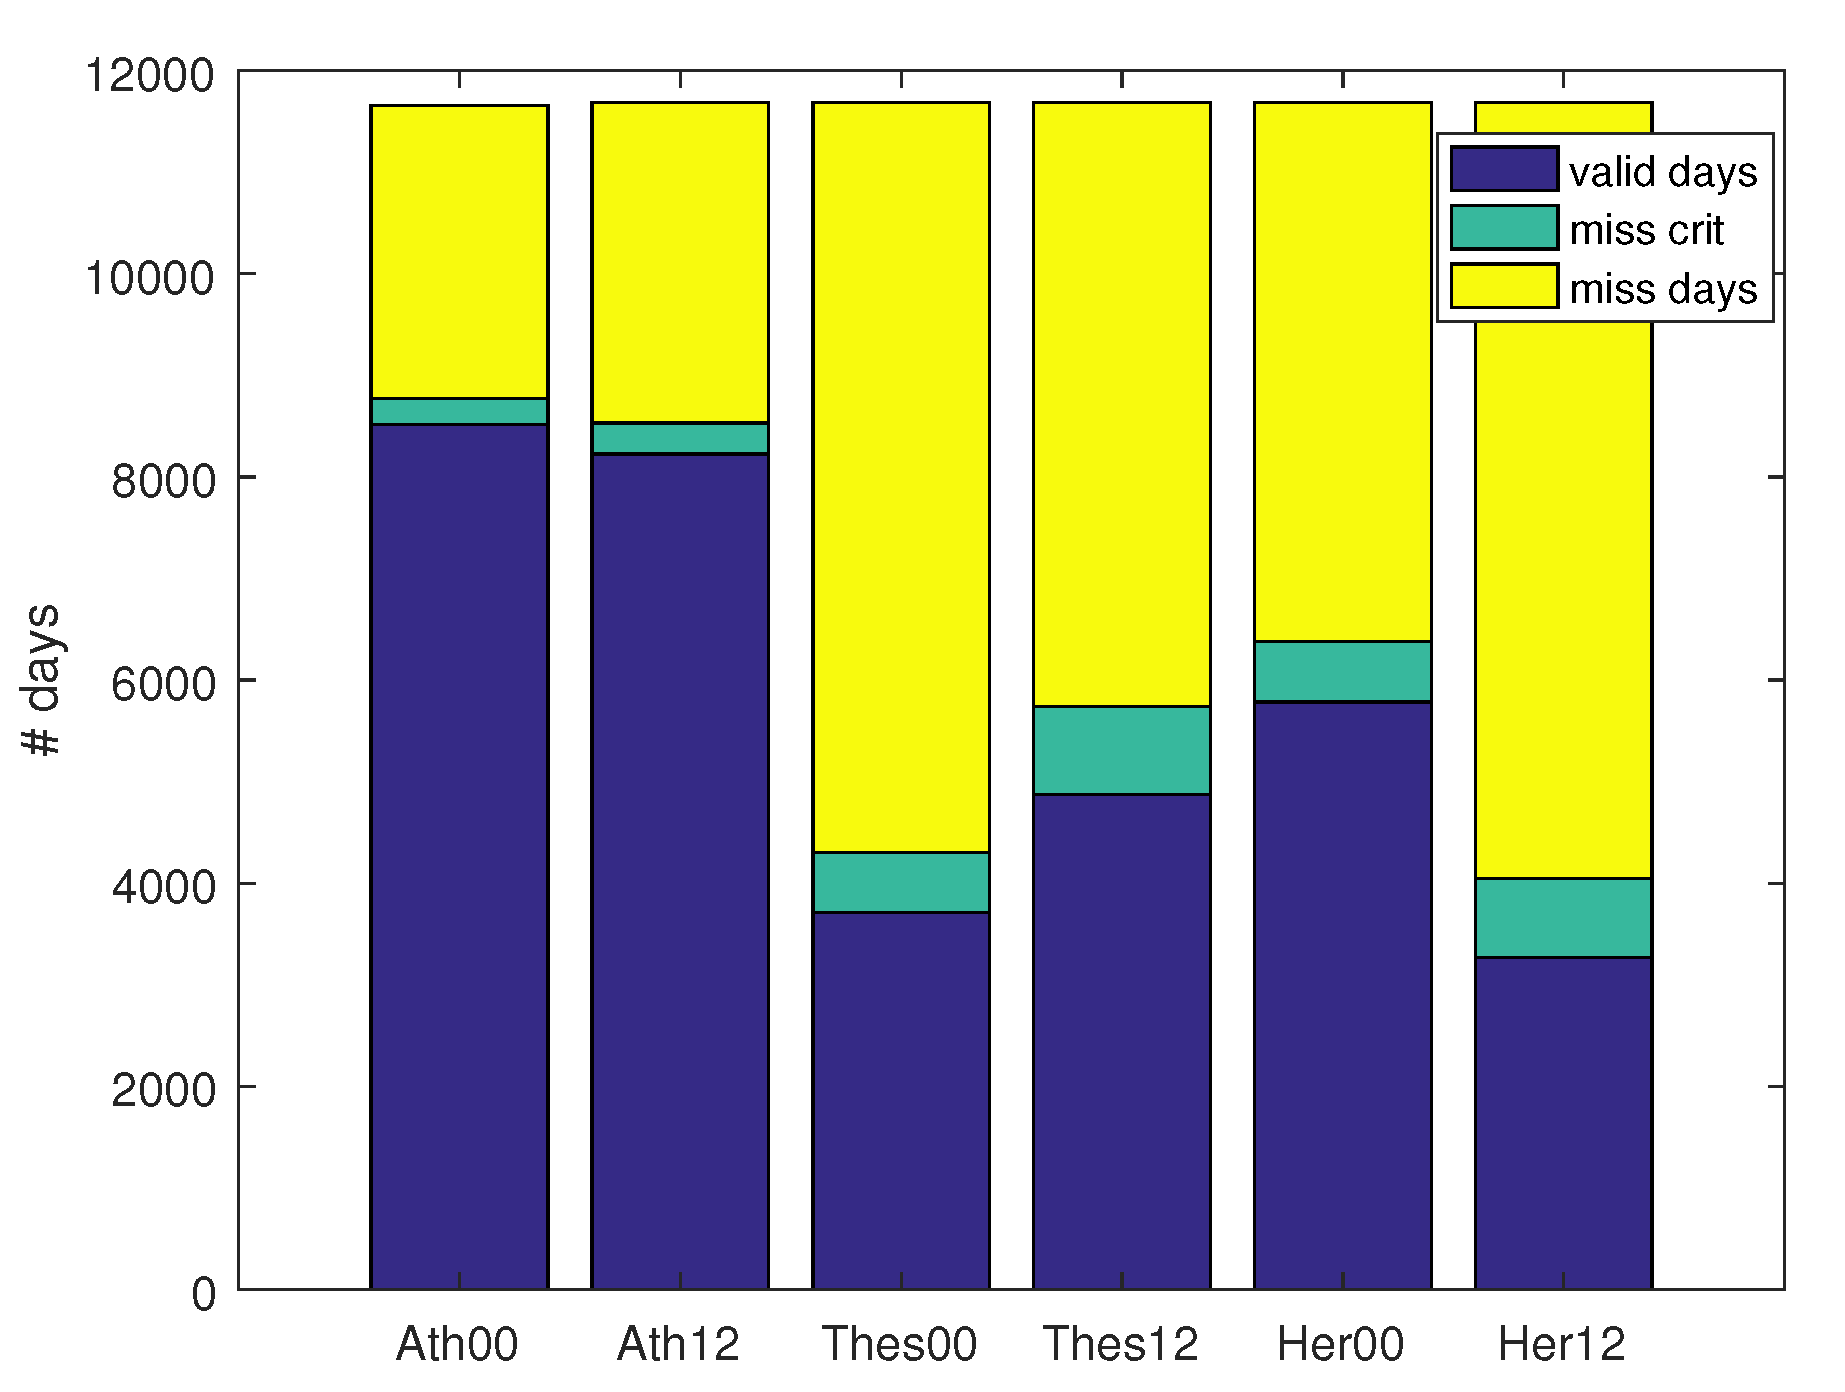
The data were retrieved from the Wyoming database (http://weather.uwyo.edu/upperair/sounding.html) and cover a 32-year period (1985–2016). We used both the 1200UTC and the 0000UTC soundings for all three sites as representative of the daytime and the nighttime boundary layer. Figure 2 shows the available number of days as well as the number of missing days due to the lack of soundings for all three sites. There is a large number of missing days ranging from about 3000 days for the Athens soundings (26% of total days) and reaching to about 8000 days (68% of total days) for the 0000UTC soundings in Thessaloniki and the 1200UTC soundings in Heraklion. The monthly distribution of the missing days (not shown) is rather uniform, with relative differences between the maximum and the minimum sample size over a month of the order of 10% for the four soundings with the largest sample size. The differences in the 0000UTC soundings over Thessaloniki and Heraklion that have the smallest sample size are of the order of 25%. However, there is an adequate number of days (more than 3000 the least) for all three sites to obtain an accurate climatology for the boundary layer characteristics and the differences in the monthly sample sizes are considered small enough so that the seasonal variations discussed are considered statistically significant.

2.2. Methods Used to Determine the PBLH and Wind Turning

The boundary layer exhibits a strong diurnal cycle with differing characteristics during the day and during the night. Therefore, the methods for the determination of the PBLH typically depend on the two types of the boundary layer: the daytime Convective Boundary Layer (CBL) and the nocturnal Stable Boundary Layer (SBL).
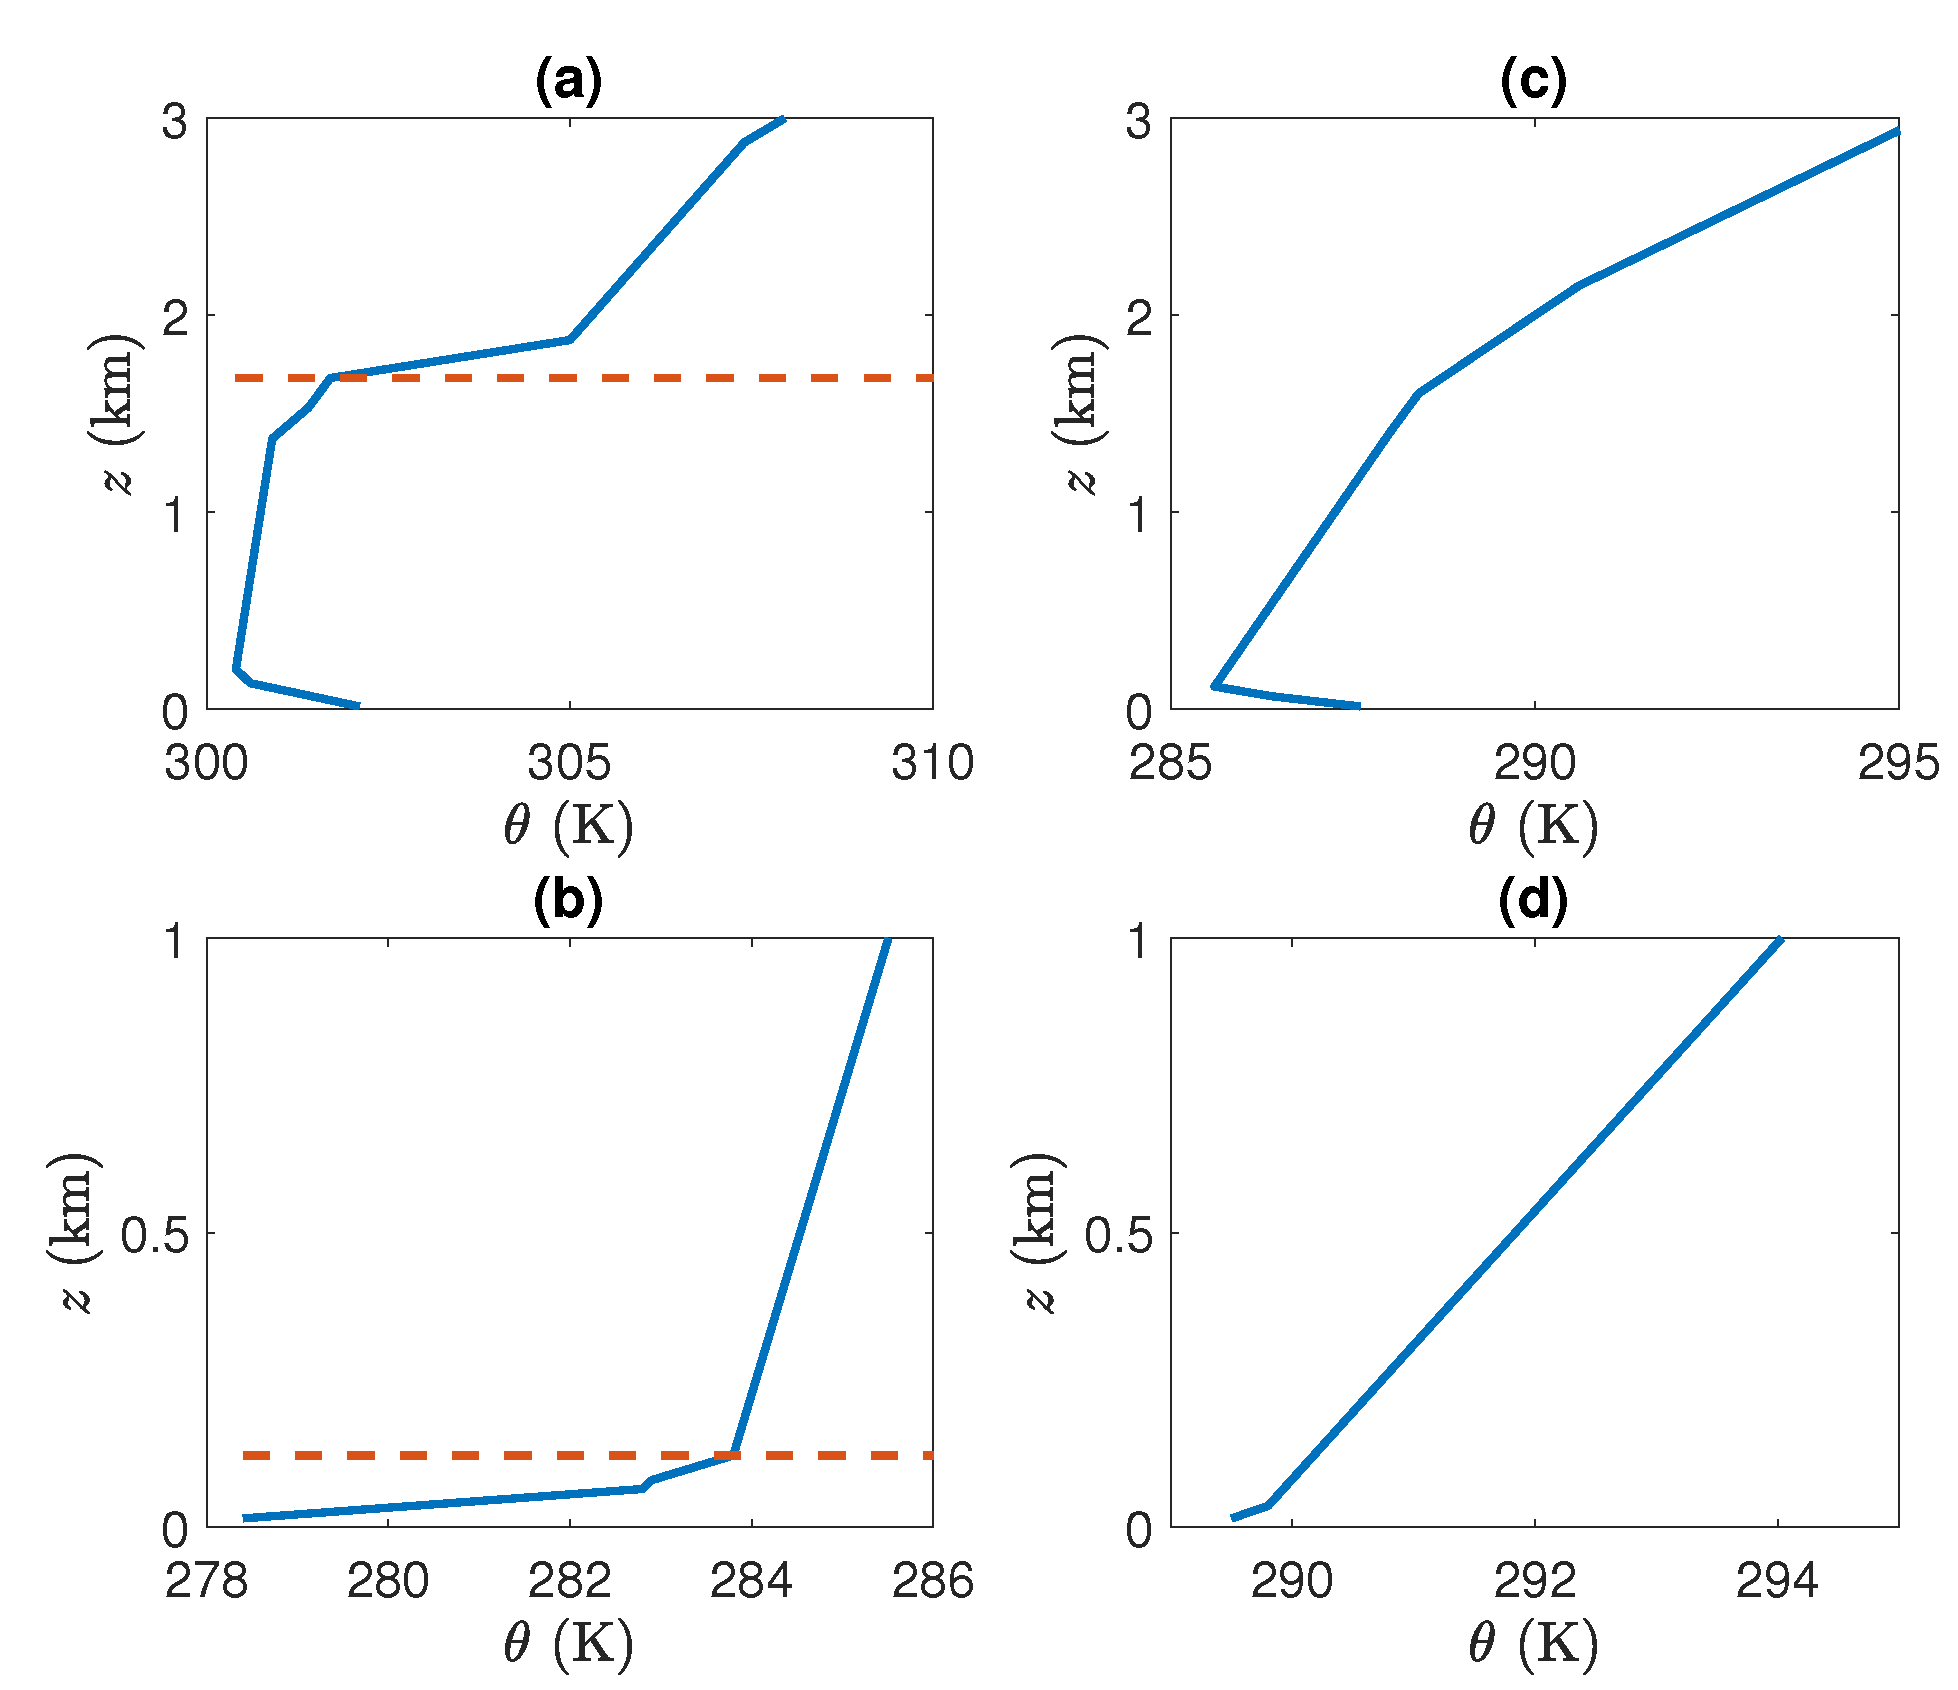
According to Stull [1], the well-mixed CBL sets usually during the day and under clear sky conditions when severe turbulence produced by the active convective thermals mixes and homogenizes potential temperature, water vapor and momentum. The uniform vertical distributions of these dynamic variables extend until the stable inversion layer (entrainment zone) that forms a transition zone to the free troposphere as shown in Figure 3a illustrating the vertical profile of potential temperature for a typical CBL over Athens. Within the inversion layer, the atmospheric variables exhibit sharp gradients and the turbulence intensity declines and seizes towards its top [27]. As a result, there are several methods proposed to identify the PBLH with the height of the inversion layer. Holtzworth [28] assumed that the PBLH is the height at which an air parcel starting from the ground representing a thermal would terminate its upward motion. Holtzworth [28] therefore calculated the PBLH as the height over which the surface potential temperature matches the potential temperature aloft. However, this method along with its several variations [29,30] sensitively depends on the value of the surface temperature which exhibits large variability. An alternative approach, a version of which will be followed in this work as well, takes advantage of the large gradients of potential temperature and specific humidity within the transition layer and identify the CBL height as the height of maximum (or minimum) gradient of potential temperature (or specific humidity) [2,13]. In the case of cloudy or rainy conditions, convection is also strongly influenced by other forcing mechanisms such as ground thermal inertia, cold air advection, and cloud top radiative cooling. In this case, the CBL grows more slowly compared to the clear sky conditions. Especially in overcast conditions, the buoyancy is nearly neutral above the surface layer leading to the development of a Neutral Boundary Layer (NBL) [31]. Since the intensity of turbulence persists throughout the depth of the NBL, the PBLH can be identified by the height of the capping inversion in this case as well.
After sunset, the rapid surface cooling creates a stably stratified layer, which separates the lower part of the boundary layer that is termed as Stable Boundary Layer (SBL) from the rest that is termed as the residual layer. This is shown in Figure 3b illustrating the vertical profile of potential temperature for a typical SBL over Athens. In the SBL, turbulence is suppressed, it exhibits intermittency and exists only near the surface [8]. Typically, the SBL is accompanied by a surface-based temperature inversion in which the weak near-surface turbulence ceases [22]. However, the residual layer that is oftentimes neutrally stratified can extend to the ground, therefore resembling the daytime NBL. In addition, a few hundred meters off the ground, a low-level jet can occur. This nocturnal jet has a strong wind shear with the maximum speed being significantly supergeostrophic and can generate turbulence due to shear instability [32]. The intermittency of turbulence and its weak intensity as well as the influence of other factors such as inertial oscillations and gravity waves makes the determination of PBLH much harder [4]. There are two main classes of methods that depend on the wind and the temperature profiles, respectively. The wind profile-based methods assume that turbulence is produced by shear instability of the nocturnal jet and the PBLH is identified as the level of maximum wind [22,33]. However, a low-level jet is not always present and might not be of sufficient strength for shear instability to commence and produce turbulence. The temperature profile methods assume that turbulence occurs only within the surface layer and the PBLH is identified by the top of the surface inversion layer [34,35]. This assumption was supported by the results of Garrett [36] and Smeldman [37] who found a good correlation between the top of the surface inversion layer and the inhibition of surface turbulence and will be followed in this work as well.
A method that has been applied to all types of boundary layers is the bulk Richardson number method proposed by Vogelezang and Holtslag [38]. This method attempts to identify the turbulent regions by applying Miles’ sufficient instability criterion which states that instability arises only when the gradient Richardson number (Ri) is below 1/4 [39]. Due to the limited vertical resolution of the soundings, calculation of the gradient Ri is inaccurate and therefore the condition is applied in terms of the bulk Richardson number
R i b = ( g / θ s ) ( θ z θ s ) ( z z s ) ( u z u s ) 2 + ( v z v s ) 2 ,
where the subscript z denotes the value of a function at height z and the subscript s denotes the value of the function at the first level to avoid noisy observations at the surface. The PBLH is identified as the first height over which R i b passes the critical value of 1/4. This method has been widely used to deduce PBLH from soundings, reanalysis data as well as numerical models due to the fact that it can be applied to both the CBL and the SBL as well as the NBL states of the boundary layer [21,40]. However, there are questions regarding its applicability. The first is that Miles criterion is sufficient, not necessary. Therefore, regions in which the Richardson number is below 1/4 are not necessarily unstable. The second is that the use of the bulk Richardson number instead of the gradient Richardson number does not guarantee that the sufficient condition still holds. For example, there can be cases in which the stratification is concentrated in narrow regions within the shear layer. In these cases, the gradient Richardson number may be locally smaller than 1/4 even though the bulk Richardson number is larger than this critical value and a well recorded instability (termed as Holmboe) can result despite the large overall stratification [41]. Although these arguments question the validity of the method, we also consider it in this work to compare our results to previous studies using this method.
To calculate the PBLH, we follow Liu and Liang [22] and first categorize the boundary layer as CBL, SBL or NBL based on the potential temperature gradient near the surface. We consider the gradient at the first reported level ( ( d θ / d z ) s ) to remove surface noise and categorize the boundary layer according to
d θ d z s < δ s ,   then CBL > δ s ,   then SBL else ,   NBL ,
where δ s = 1 / 150 K m 1 . In the cases of both CBL and NBL based on the discussion above, we relate the PBLH to the height of the strong capping inversion. Specifically, we identify the PBLH as the height over which the potential temperature gradient first exceeds the threshold δ θ c u = 6 K km 1 . In the case of an SBL, we identify the PBLH by the extent of the surface-based inversion. We thus calculate the first height over which the potential temperature gradient is less than the threshold δ θ c s = 4 K km 1 . The values of δ s , δ θ c u and δ θ c s were chosen based on visual identification of many days of data for all three sites. However, we checked that the results presented do not sensitively depend on the exact values chosen. As discussed above, we also calculated the PBLH using the method based on the bulk Richardson number for comparison purposes.
Since these methods depend on the vertical spacing of the sounding measurements, there is an intrinsic error due to the finite spacing. The altitude resolution varies between the different soundings. The mean value for the vertical resolution is 270 m with little differences in the average resolution among the three sites (less than 5%). We estimate the error as ( z i + 1 z i 1 ) / 4 , where i + 1 and i 1 are the levels above and below the value for the PBLH. We report the median values for the PBLH with an error that is the mean value over the error measurements for each sounding used.
The two methods are most effective when a clear CBL is capped with a well-defined inversion layer. Non-convective atmospheric conditions (e.g., cloudy and rainy cases) or multiple layers in the troposphere with strong gradients could lead to an ambiguous height determination. For instance, in the case illustrated in Figure 3c, potential temperature increases monotonically within the troposphere resulting in an erroneous estimation of height. Similarly, when the SBL does not have a well-developed surface inversion or a clear jet aloft, the surface stable layer gradually merges into the residual layer resulting in a non-typical profile for potential temperature such as the one shown in Figure 3d and thus in a wrong height value. To avoid such incorrect estimates for the PBLH, only values below 4 km were retained for the CBL and NBL types and heights lower than 1.5 km were retained for the SBL. The coarse vertical resolution of atmospheric profile data can also prevent the accurate estimate of the boundary layer height. Thus, only days with at least three data levels within the boundary layer were kept. The number of days excluded by these criteria are shown in Figure 2 and range from around 300 (2.5% of total days) for Athens, to around 600 (5% of total days) for Thessaloniki and Heraklion.
Regarding the climatology of the wind field, we report the angle of wind turning as well as the wind shear. The angle of wind turning was calculated as the change in wind direction between the wind vector at the first reported level u s and the wind vector at the top of the boundary layer u t . The angle is positive when the wind turns clockwise (veering) with height and negative when the wind turns anti-clockwise (backing) and the angle is restricted to be between −180 and 180 deg. This turning angle represents the total change in wind direction, i.e., it includes both the frictional effects within the boundary layer and the changes due to the baroclinicity of the thermal wind since it is very difficult to separate these two contributions based on the sounding data alone. The wind shear was calculated as ( | u t | | u s | ) / z t , where z t is the value of the PBLH. For both the turning angle and the wind shear, the top of the boundary layer is calculated using the gradient method described above.

3. Climatology of the Boundary Layer Height

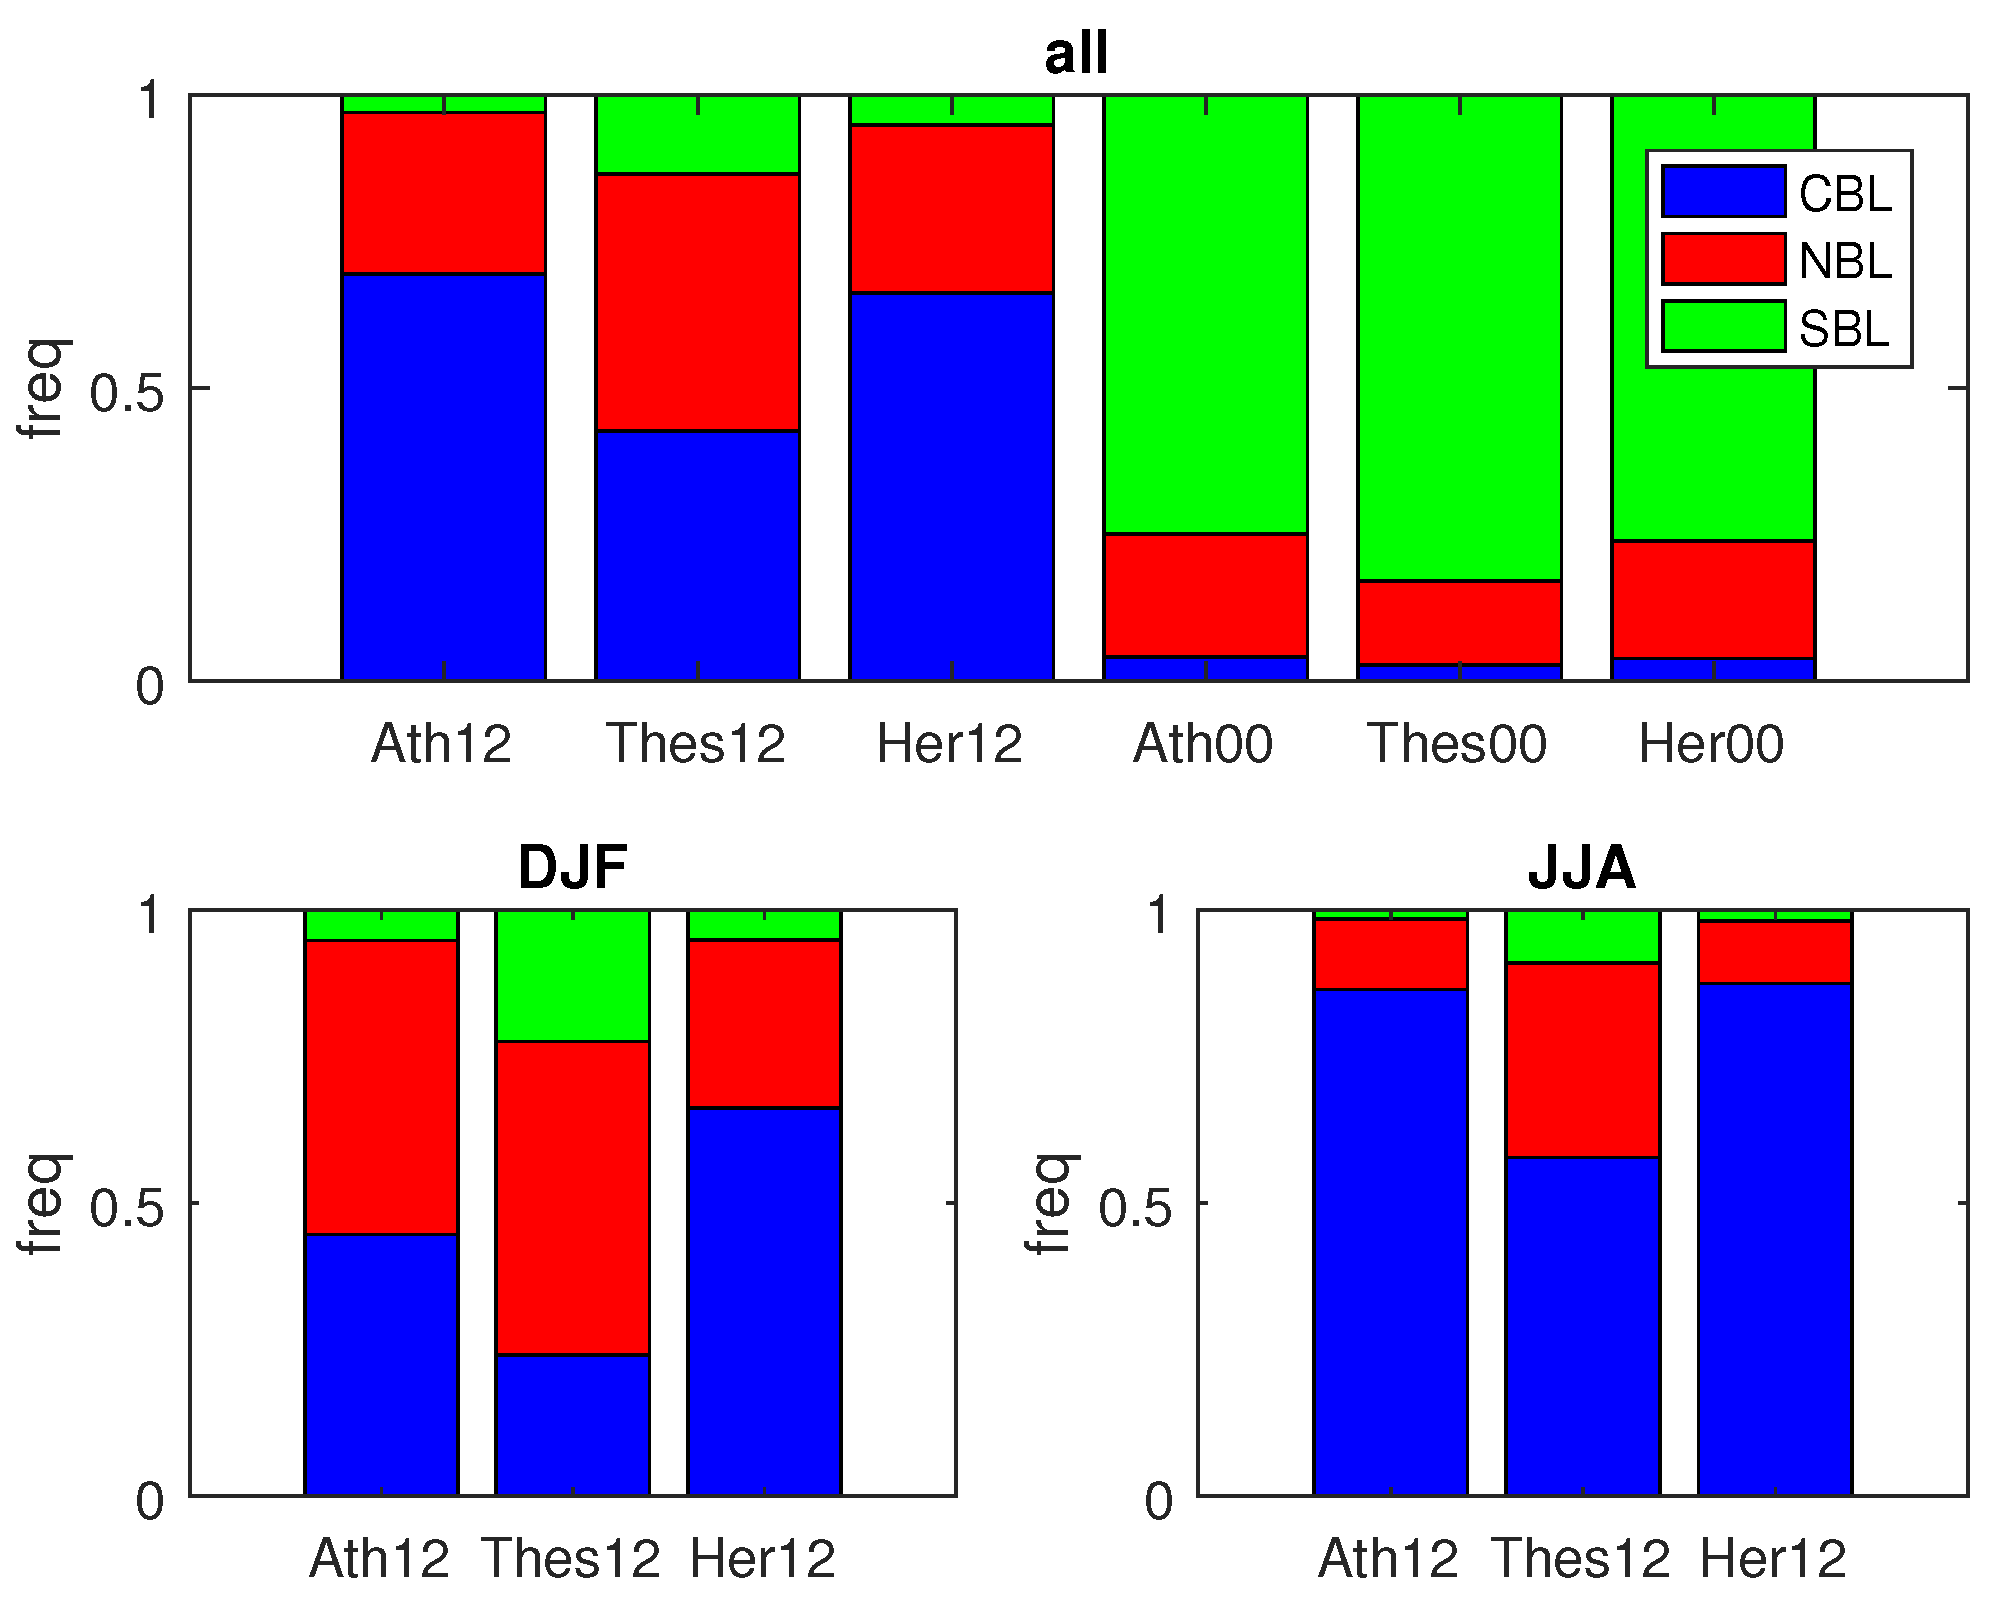
The frequency of the three types of boundary layers is shown in Figure 4. We observe that the daytime boundary layer is as expected convective in most cases (about 70%) for Athens and Heraklion and the rest are NBL with a weak temperature gradient near the surface. Thessaloniki has an almost equal frequency for the occurrence of CBL and NBL. For the daytime boundary layer there is also a pronounced seasonal dependence for the frequency of occurrence of the three types and this is shown in the lower panels of Figure 4. During the summer, the CBL occurs more often reaching an 85% frequency in Athens and Heraklion and a 60% frequency in Thessaloniki, while in the winter NBL’s are equally probable reaching a frequency of 50% in both Athens and Thessaloniki and a slightly smaller frequency in Heraklion. During the night, the boundary layer is mostly stable in all three sites with a small number of days (around 20%) with an NBL structure and there is little seasonal variability for the occurrence frequency of the three types (not shown).
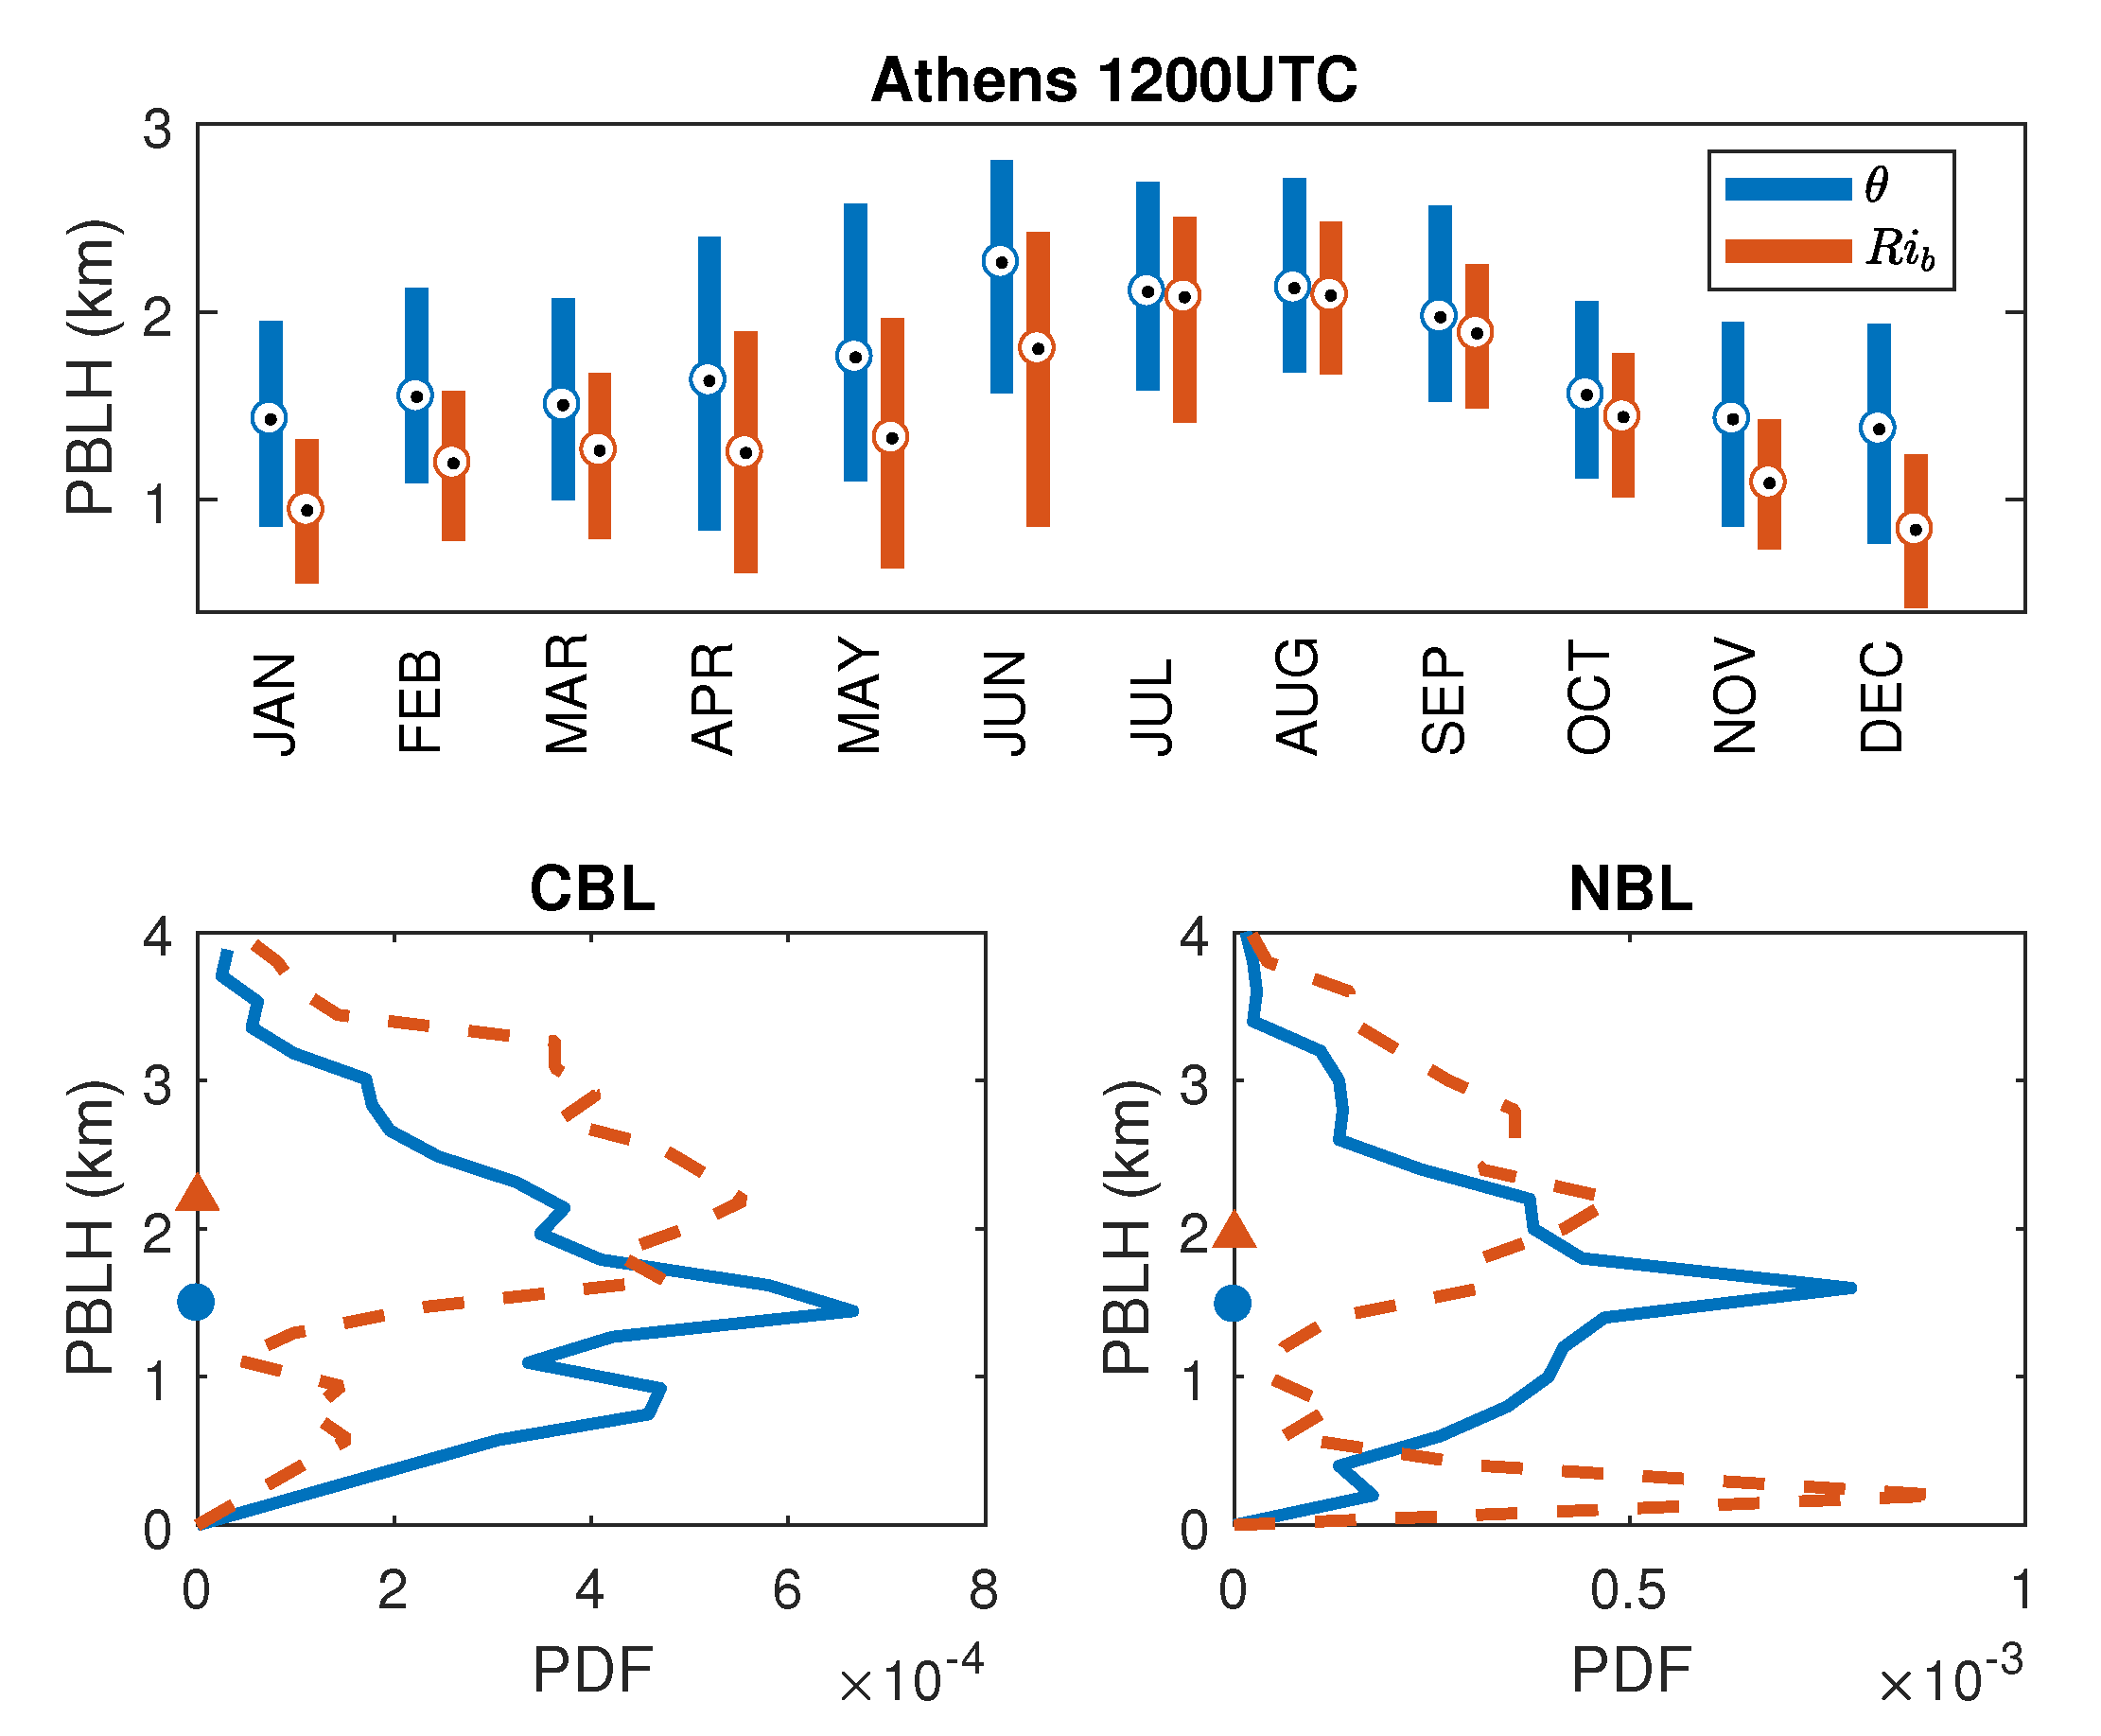
The intra-annual variability of PBLH estimated from the 1200UTC soundings over Athens using the gradient and the bulk Richardson number methods is shown in the upper panel of Figure 5. We observe that the PBLH exhibits a seasonal variation with maximum median values of 2.2 km during the warm period (JJA) and minimum values of 1.4 km during the winter (DJF), as estimated using the gradient method. This is because during the summer, the intense surface heating and the clear sky conditions due to the prevailing anticyclonic circulation over the Mediterranean, result in strong convective turbulence that produces significant deepening of the boundary layer. The two different methods produce a similar seasonal variation but the PBLH estimated using the bulk Richardson number method is systematically lower than the PBLH estimated using the gradient method with the median PBLH values over all seasons being 1.37 km and 1.7 km respectively (cf. Table 1). The Probability Density Functions (PDFs) for the PBLH during the winter (DJF) and the summer (JJA) months are shown in the lower panels of Figure 5 for the two dominant types of boundary layers (the CBL and the NBL). For the CBL there is a rather large peak at 1.5 km during winter, while during the summer the peak widens and shifts toward 2 km heights. For the NBL, there is a similar peak centered around 1.5 km in DJF while in JJA the PBLH exhibits a bimodal distribution with a narrow peak at low values (0.3 km) and a wider peak at high values (1.5 km).
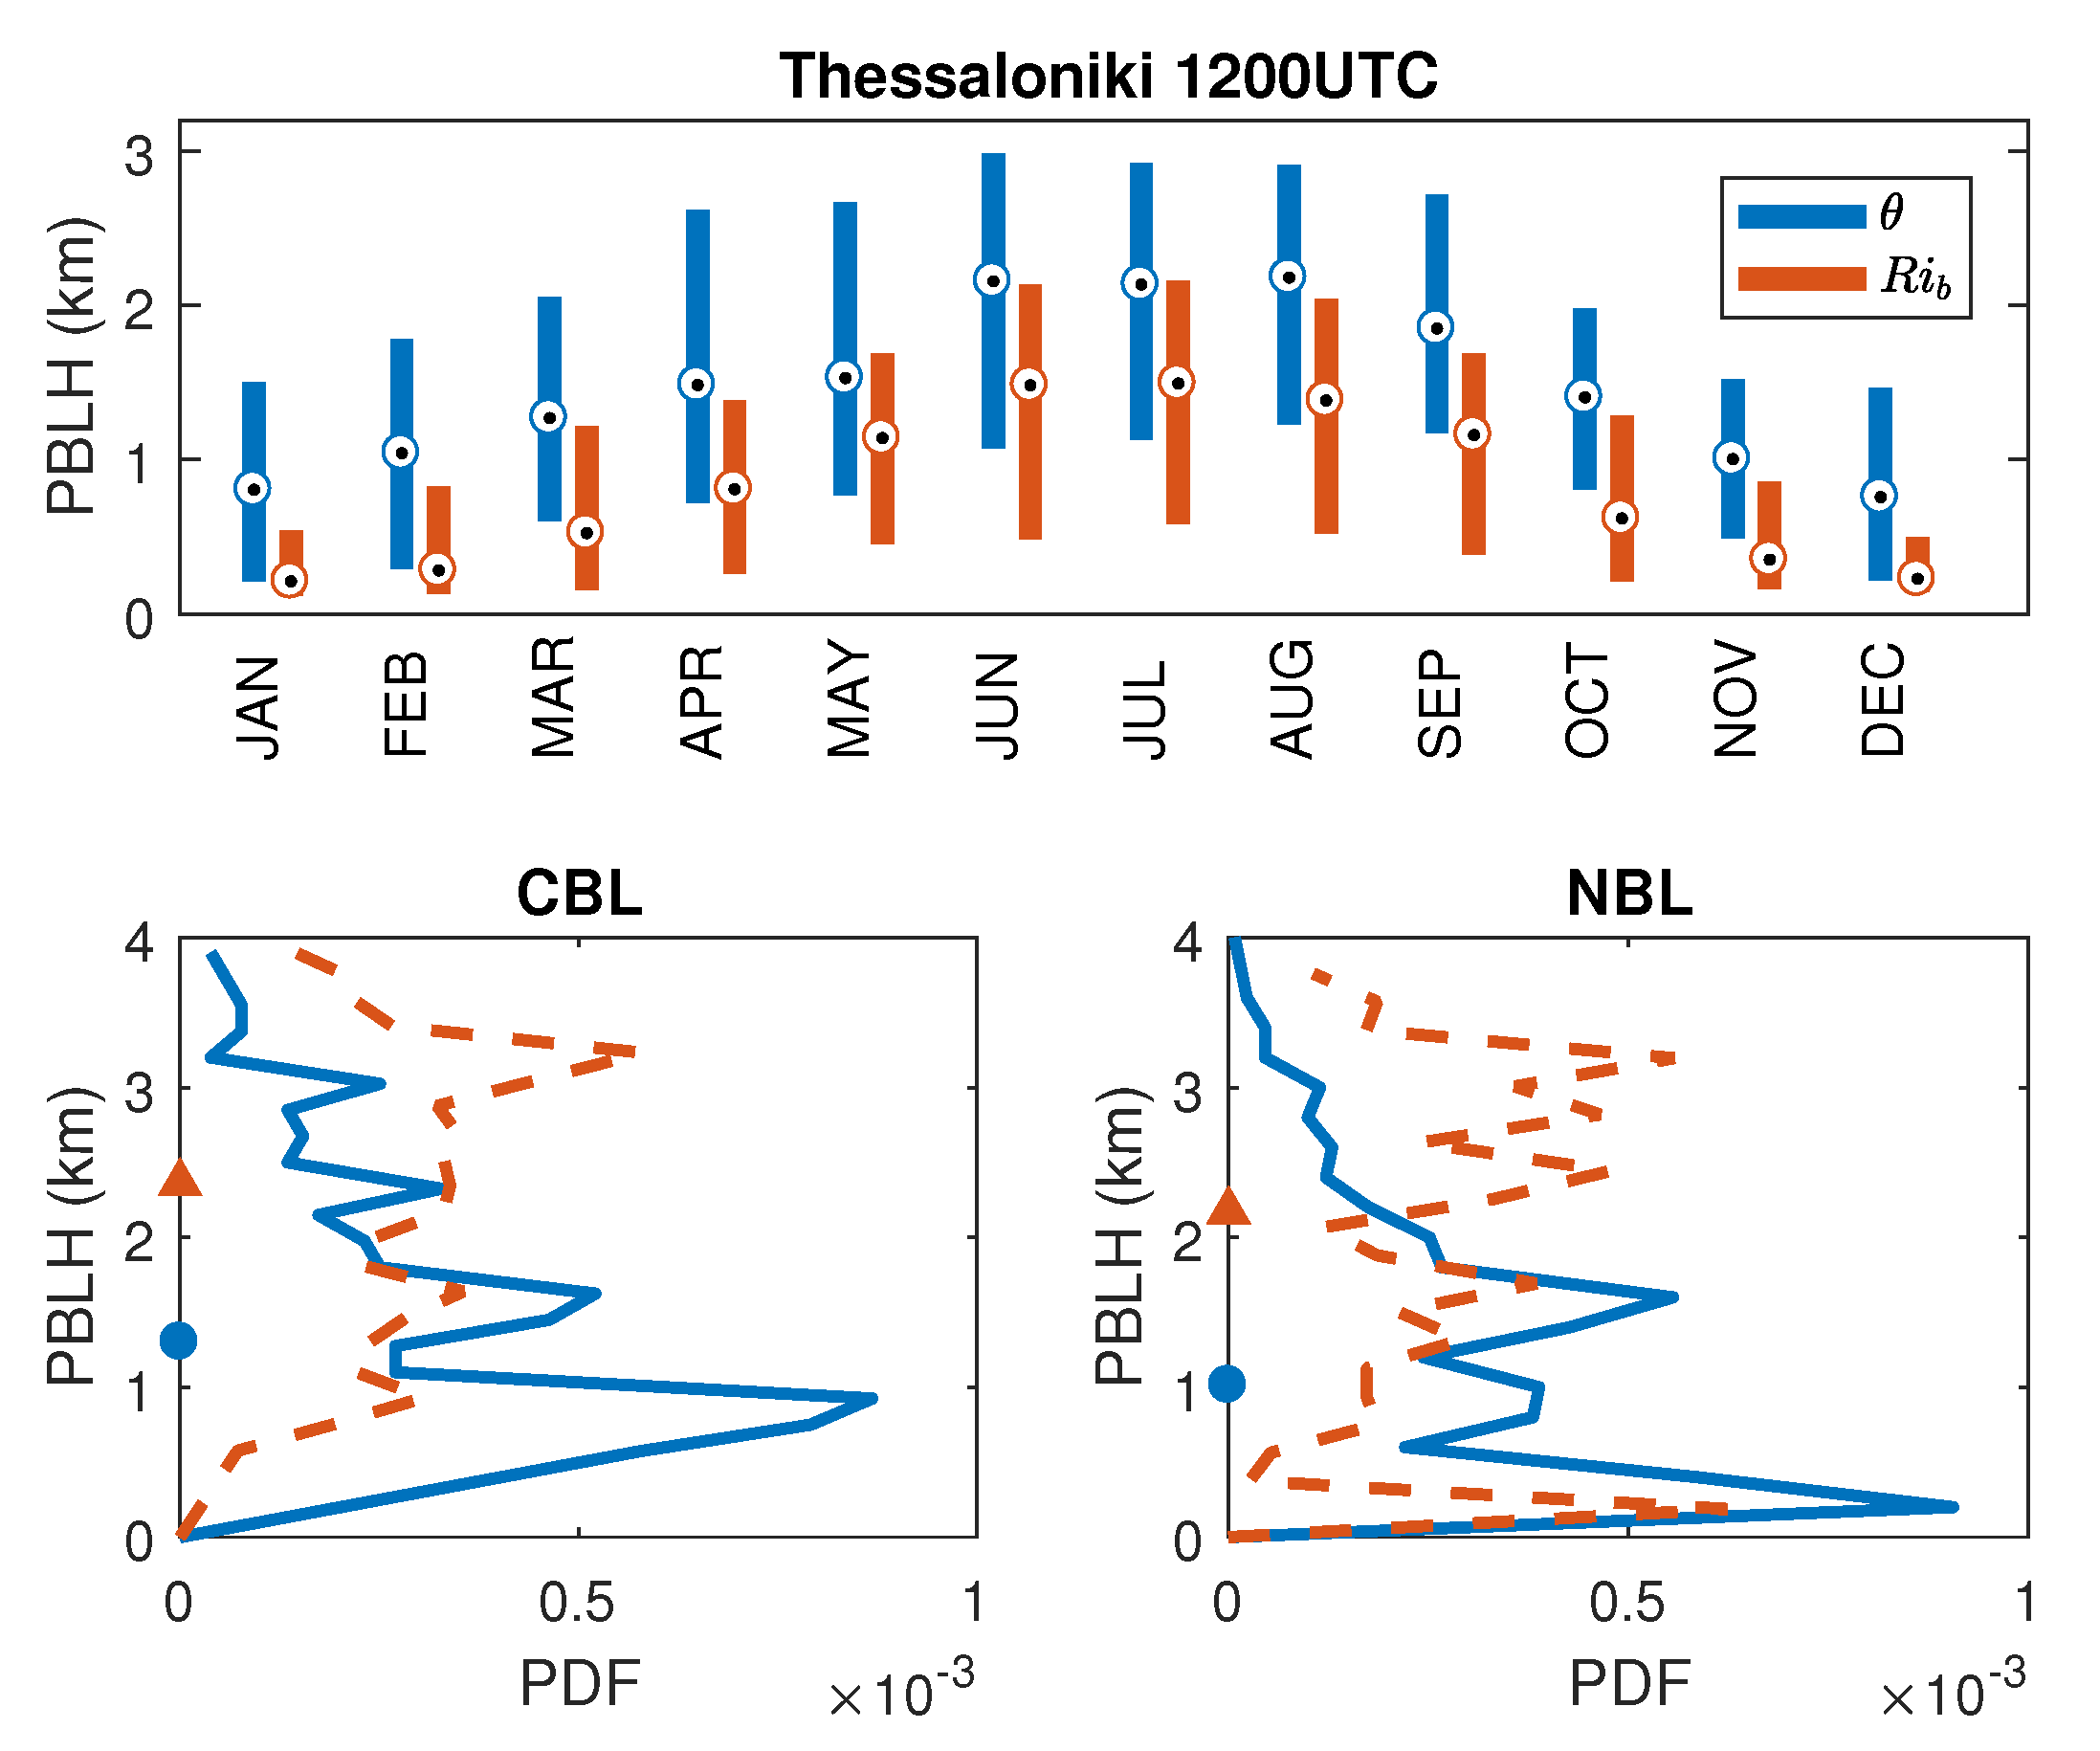
A similar seasonal variation for the PBLH is also observed for Thessaloniki as shown in the upper panel of Figure 6, with a maximum median value of 2.2 km during the summer and a minimum median value of 0.8 km during the winter, as estimated using the gradient method. The lower panels of Figure 6 illustrate the PDFs for both dominant types of boundary layers during the winter and during the summer. During the winter there are sharp peaks at 1 km and at 0.3 km for the CBL and NBL types respectively, while during the summer there are almost uniform distributions with values in the range 1.5–3 km. Finally, we note that similar to the Athens soundings, the bulk Richardson number method systematically estimates lower values for the PBLH compared to the gradient method, with the median PBLH values over all seasons being 0.67 km and 1.4 km as estimated from the two methods respectively (cf. Table 1).
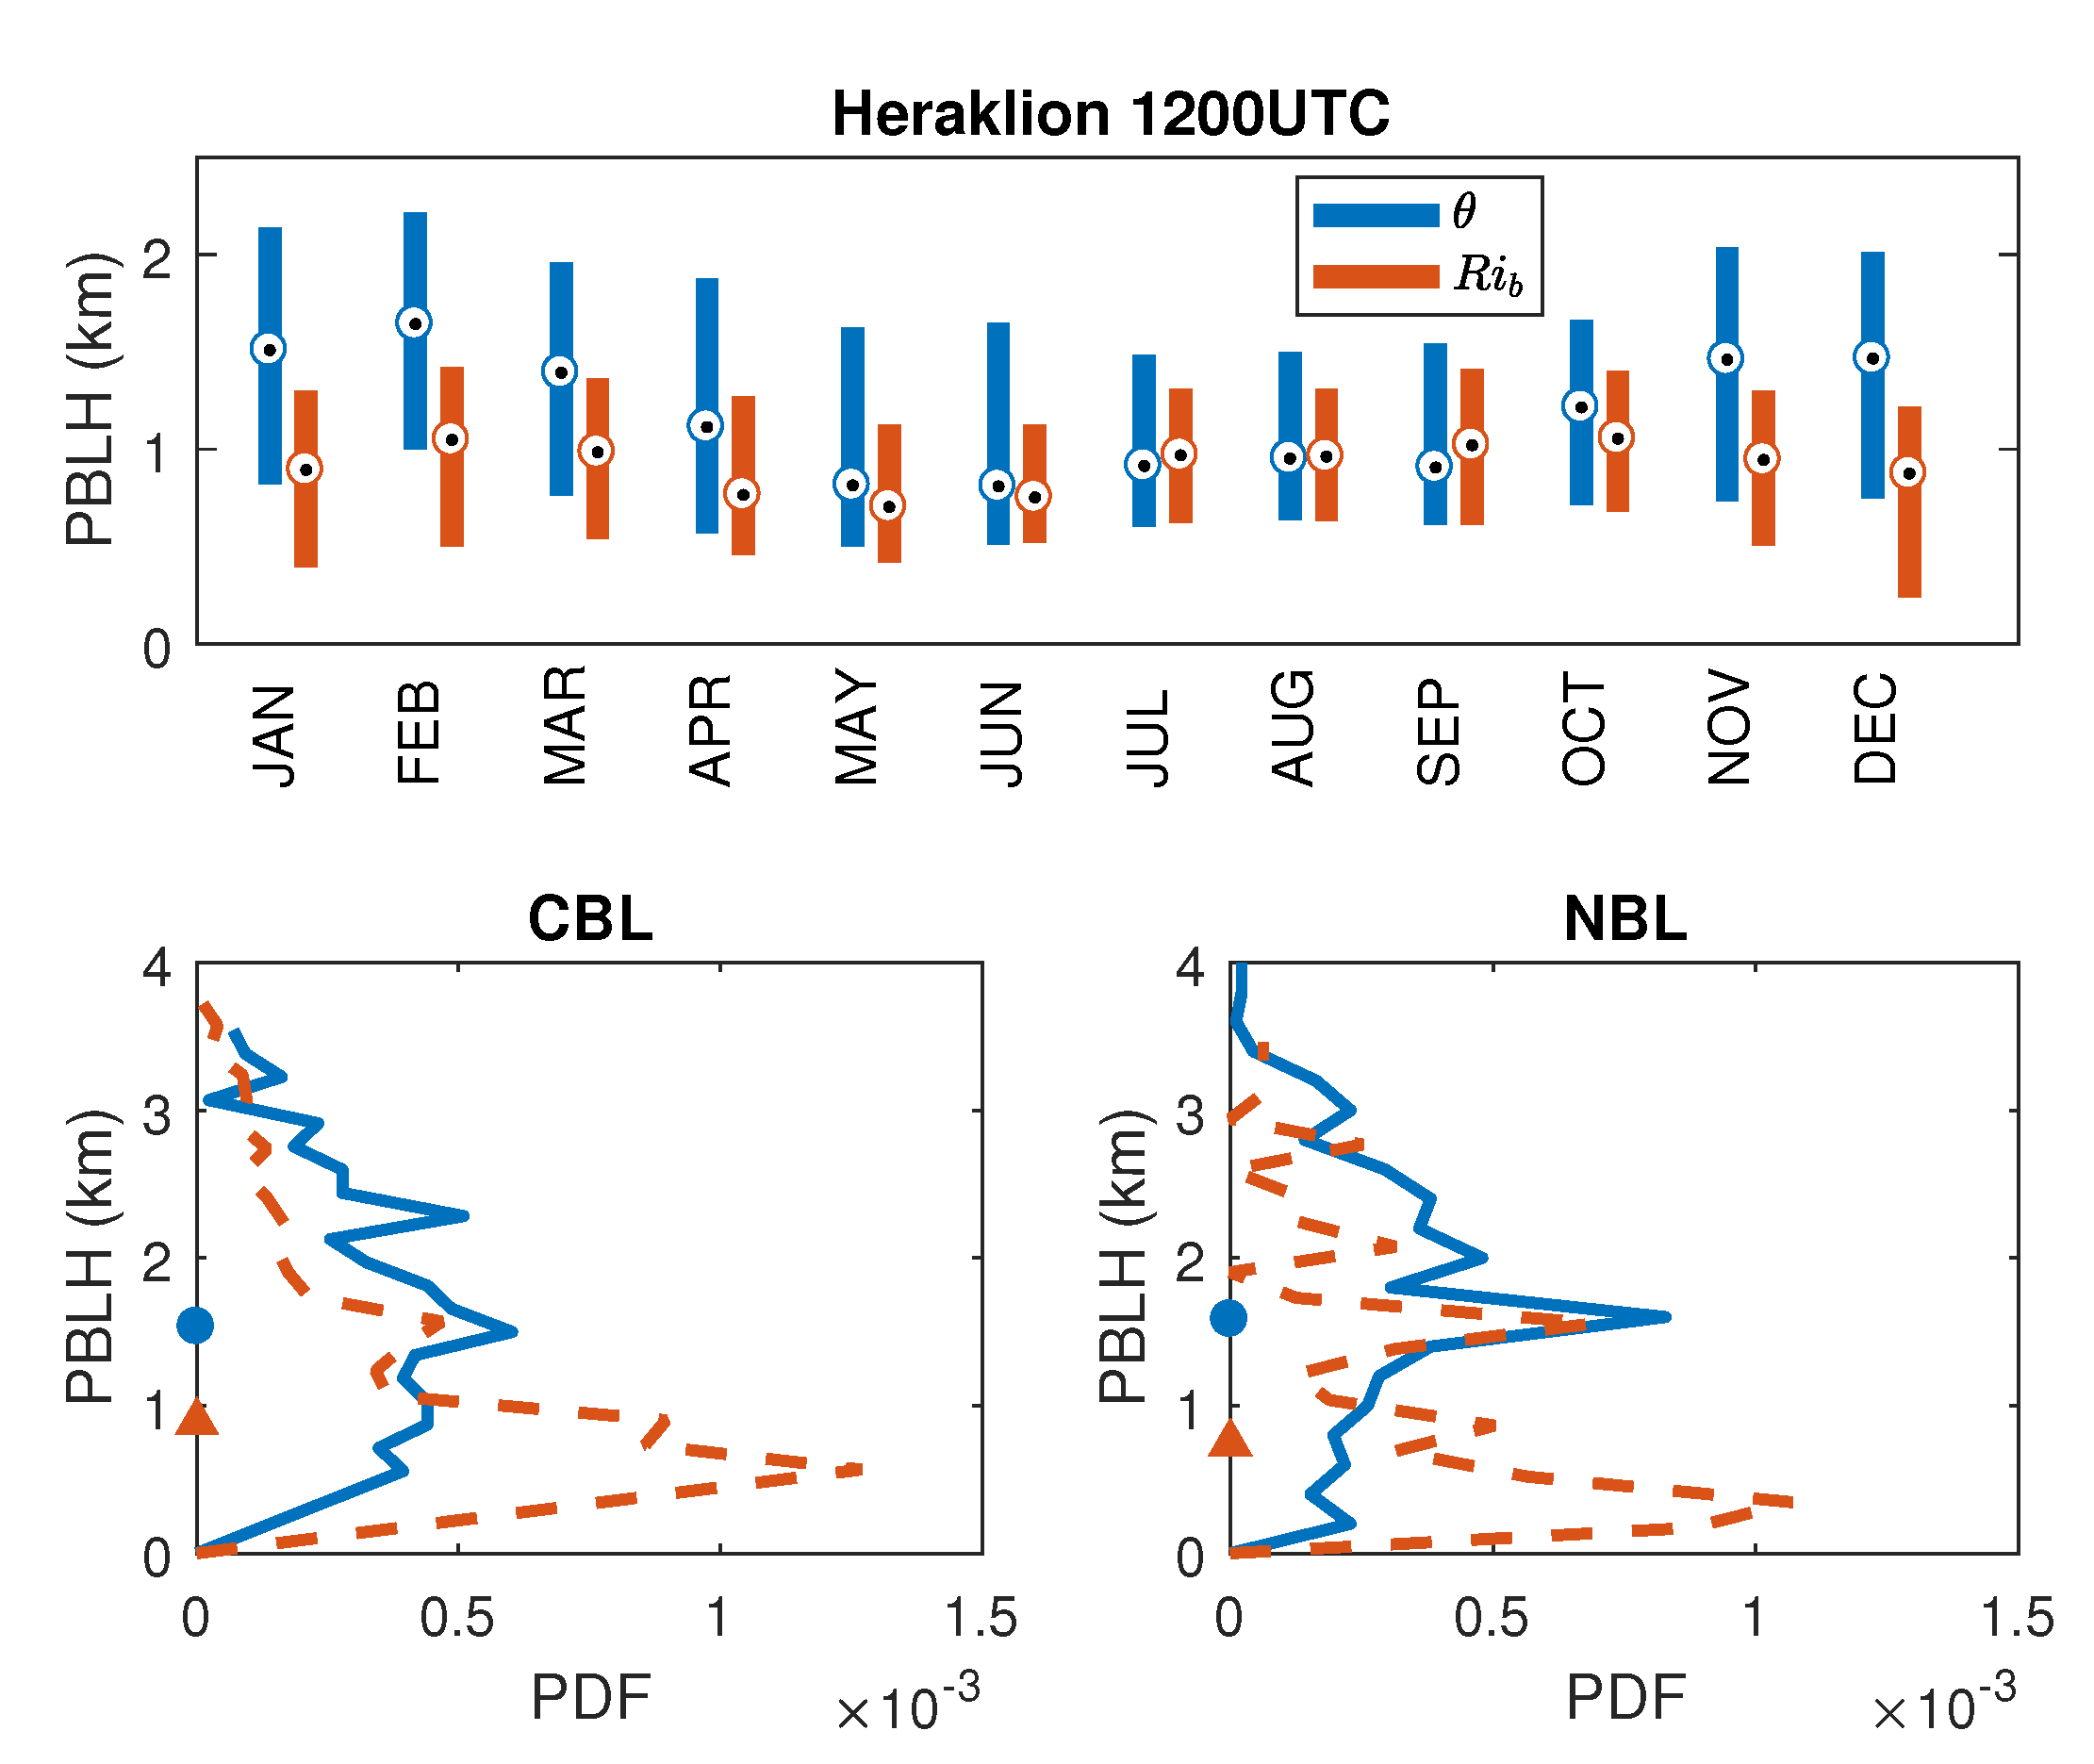
The intra-annual variability of PBLH for Heraklion is shown in Figure 7 along with the corresponding wintertime and summertime PDFs. Estimation of the PBLH using the bulk Richardson number method reveals no significant seasonal variability, while the gradient method reveals a seasonal variation of much lower amplitude compared to Athens and Thessaloniki with a winter maximum median value of 1.5 km and a summer minimum median value of 0.9 km. In addition, the annual median values which are 0.9 km and 1.2 km estimated using the bulk Richardson number and the gradient methods respectively are lower than the corresponding values for Athens and Thessaloniki. The absence of seasonal variability and the lower PBLH values imply that the boundary layer above Heraklion which is situated on the coast of the island of Crete may be influenced by the surrounding marine environment. Some seasonal differences are only revealed in the PDFs shown in the lower panels of Figure 7. During the summer there are more prominent peaks at low values for the PBLH in contrast to the more uniform-like distributions during winter which give an almost equal probability for the PBLH to be between approximately 0.5 km and 2.5 km.
The PDFs for the nocturnal PBLH estimated from the 0000UTC soundings for Athens and Thessaloniki are shown in Figure 8, while the distributions for Heraklion are similar to the distributions for Athens and are not shown. The left panels show the PDFs for the PBLH estimated using the two methods. For both methods, the PDFs are concentrated at low values below 300 m. The distributions for the PBLH estimated using the bulk Richardson number method have sharper peaks and at lower heights for all three sites yielding the median values of 60 m, 50 m and 90 m for Athens, Thessaloniki and Heraklion, respectively. This should be contrasted to the distributions obtained using the gradient method which have wider peaks and at higher values yielding the median values of 160 m, 200 m and 190 m for Athens, Thessaloniki and Heraklion, respectively. The right panels of Figure 8 show the PDFs for the PBLH estimated using the gradient method for the two dominant types of nocturnal boundary layers (the SBL and the NBL). For the SBL occurring in 80% of the days, there is a very sharp peak of the distribution at values around 160 m for all three sites, while for the NBL occurring in 20% of the days, there is a more uniform-like distribution with an equal probability for the PBLH to be between 0.2 km and 1.5 km except for Thessaloniki having a sharp peak at 150 m.
To summarize, the daytime boundary layer is mostly convective with strong negative gradients in potential temperature except for Thessaloniki where the surface gradients are weaker. The nocturnal boundary layer is characterized by a surface inversion in all three sites with very weak seasonal variability. In contrast, the PBLH during daytime for both Athens and Thessaloniki exhibits a seasonal variation with summer maxima and winter minima due to the stronger heat fluxes in the summer producing more vivid turbulence that deepens the boundary layer. This is also evident in the probability distributions over the two seasons that exhibit shifts in their maxima towards larger values in the summer. In Heraklion there is very weak seasonal variability with lower median values for the PBLH. The PBLH values estimated using the gradient method are in the range of 1.2–1.7 km for the daytime boundary layer and in the range of 150–200 m for the nighttime boundary layer. The bulk Richardson number method systematically yields lower values ranging from 300 m lower for Athens and Heraklion to 700 m lower for Thessaloniki during the day and lower by 50 m to 90 m for the nighttime boundary layer over all three sites.

4. Climatology of the Wind in the Planetary Boundary Layer

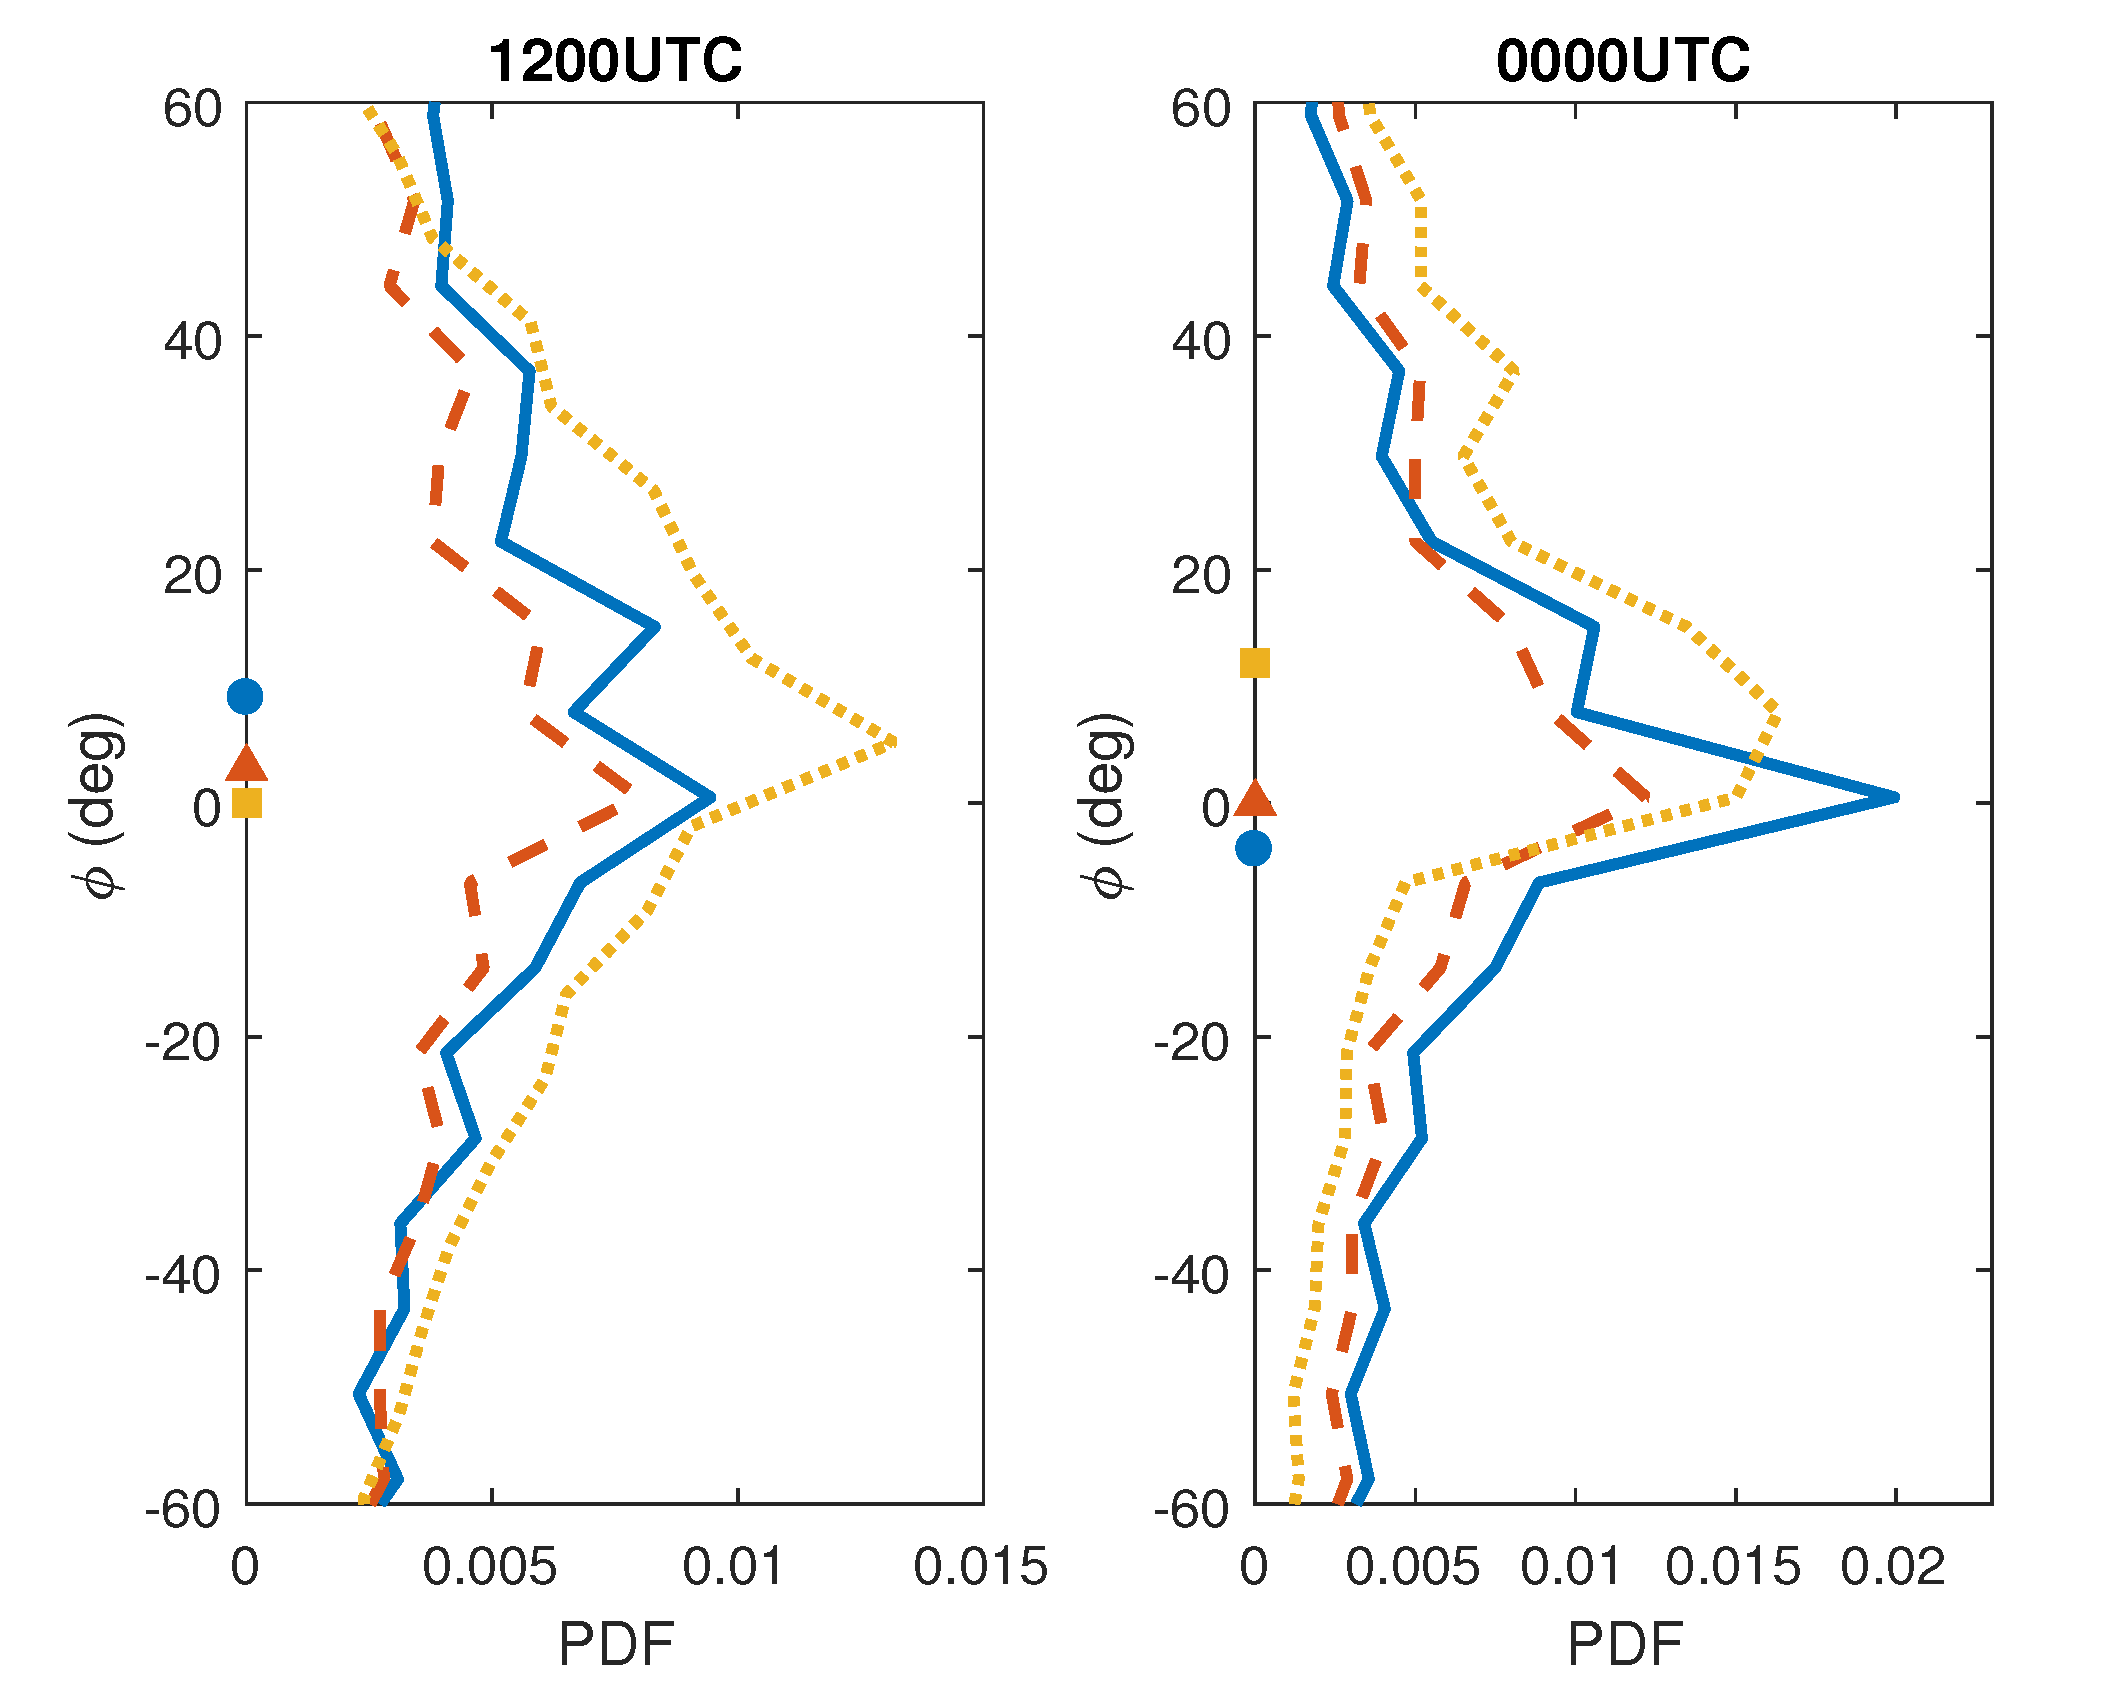
The PDFs for the angle of wind turning obtained from the 1200UTC soundings is shown in the left panel of Figure 9. The distributions are similar for the two dominant types of daytime boundary layers (CBL and NBL) and there is no significant seasonal variation except for Athens in which there is a slight summer shift of the distribution towards larger positive values (not shown). The peak for all three sites is at angles close to zero degrees with somewhat uniform distributions for Athens and Thessaloniki extending roughly between −15 and 15 degrees and a sharper peak for Heraklion. The distribution for Athens is slightly asymmetric with positive values (wind veering) being more probable yielding a median value for the turning angle of ten degrees, whereas the distributions for Thessaloniki and Heraklion are almost symmetric yielding median values of three and zero degrees, respectively. Therefore, the wind is equally probable to turn clockwise and anti-clockwise.
Similar PDFs are obtained from the 0000UTC soundings as shown in the right panel of Figure 9, with angles close to zero being the most probable. The distributions for Athens and Thessaloniki are symmetric with respect to zero angle yielding median values of −4 and zero degrees respectively, while for Heraklion there is a slight shift towards positive values (wind veering) yielding a median value of 12 degrees.
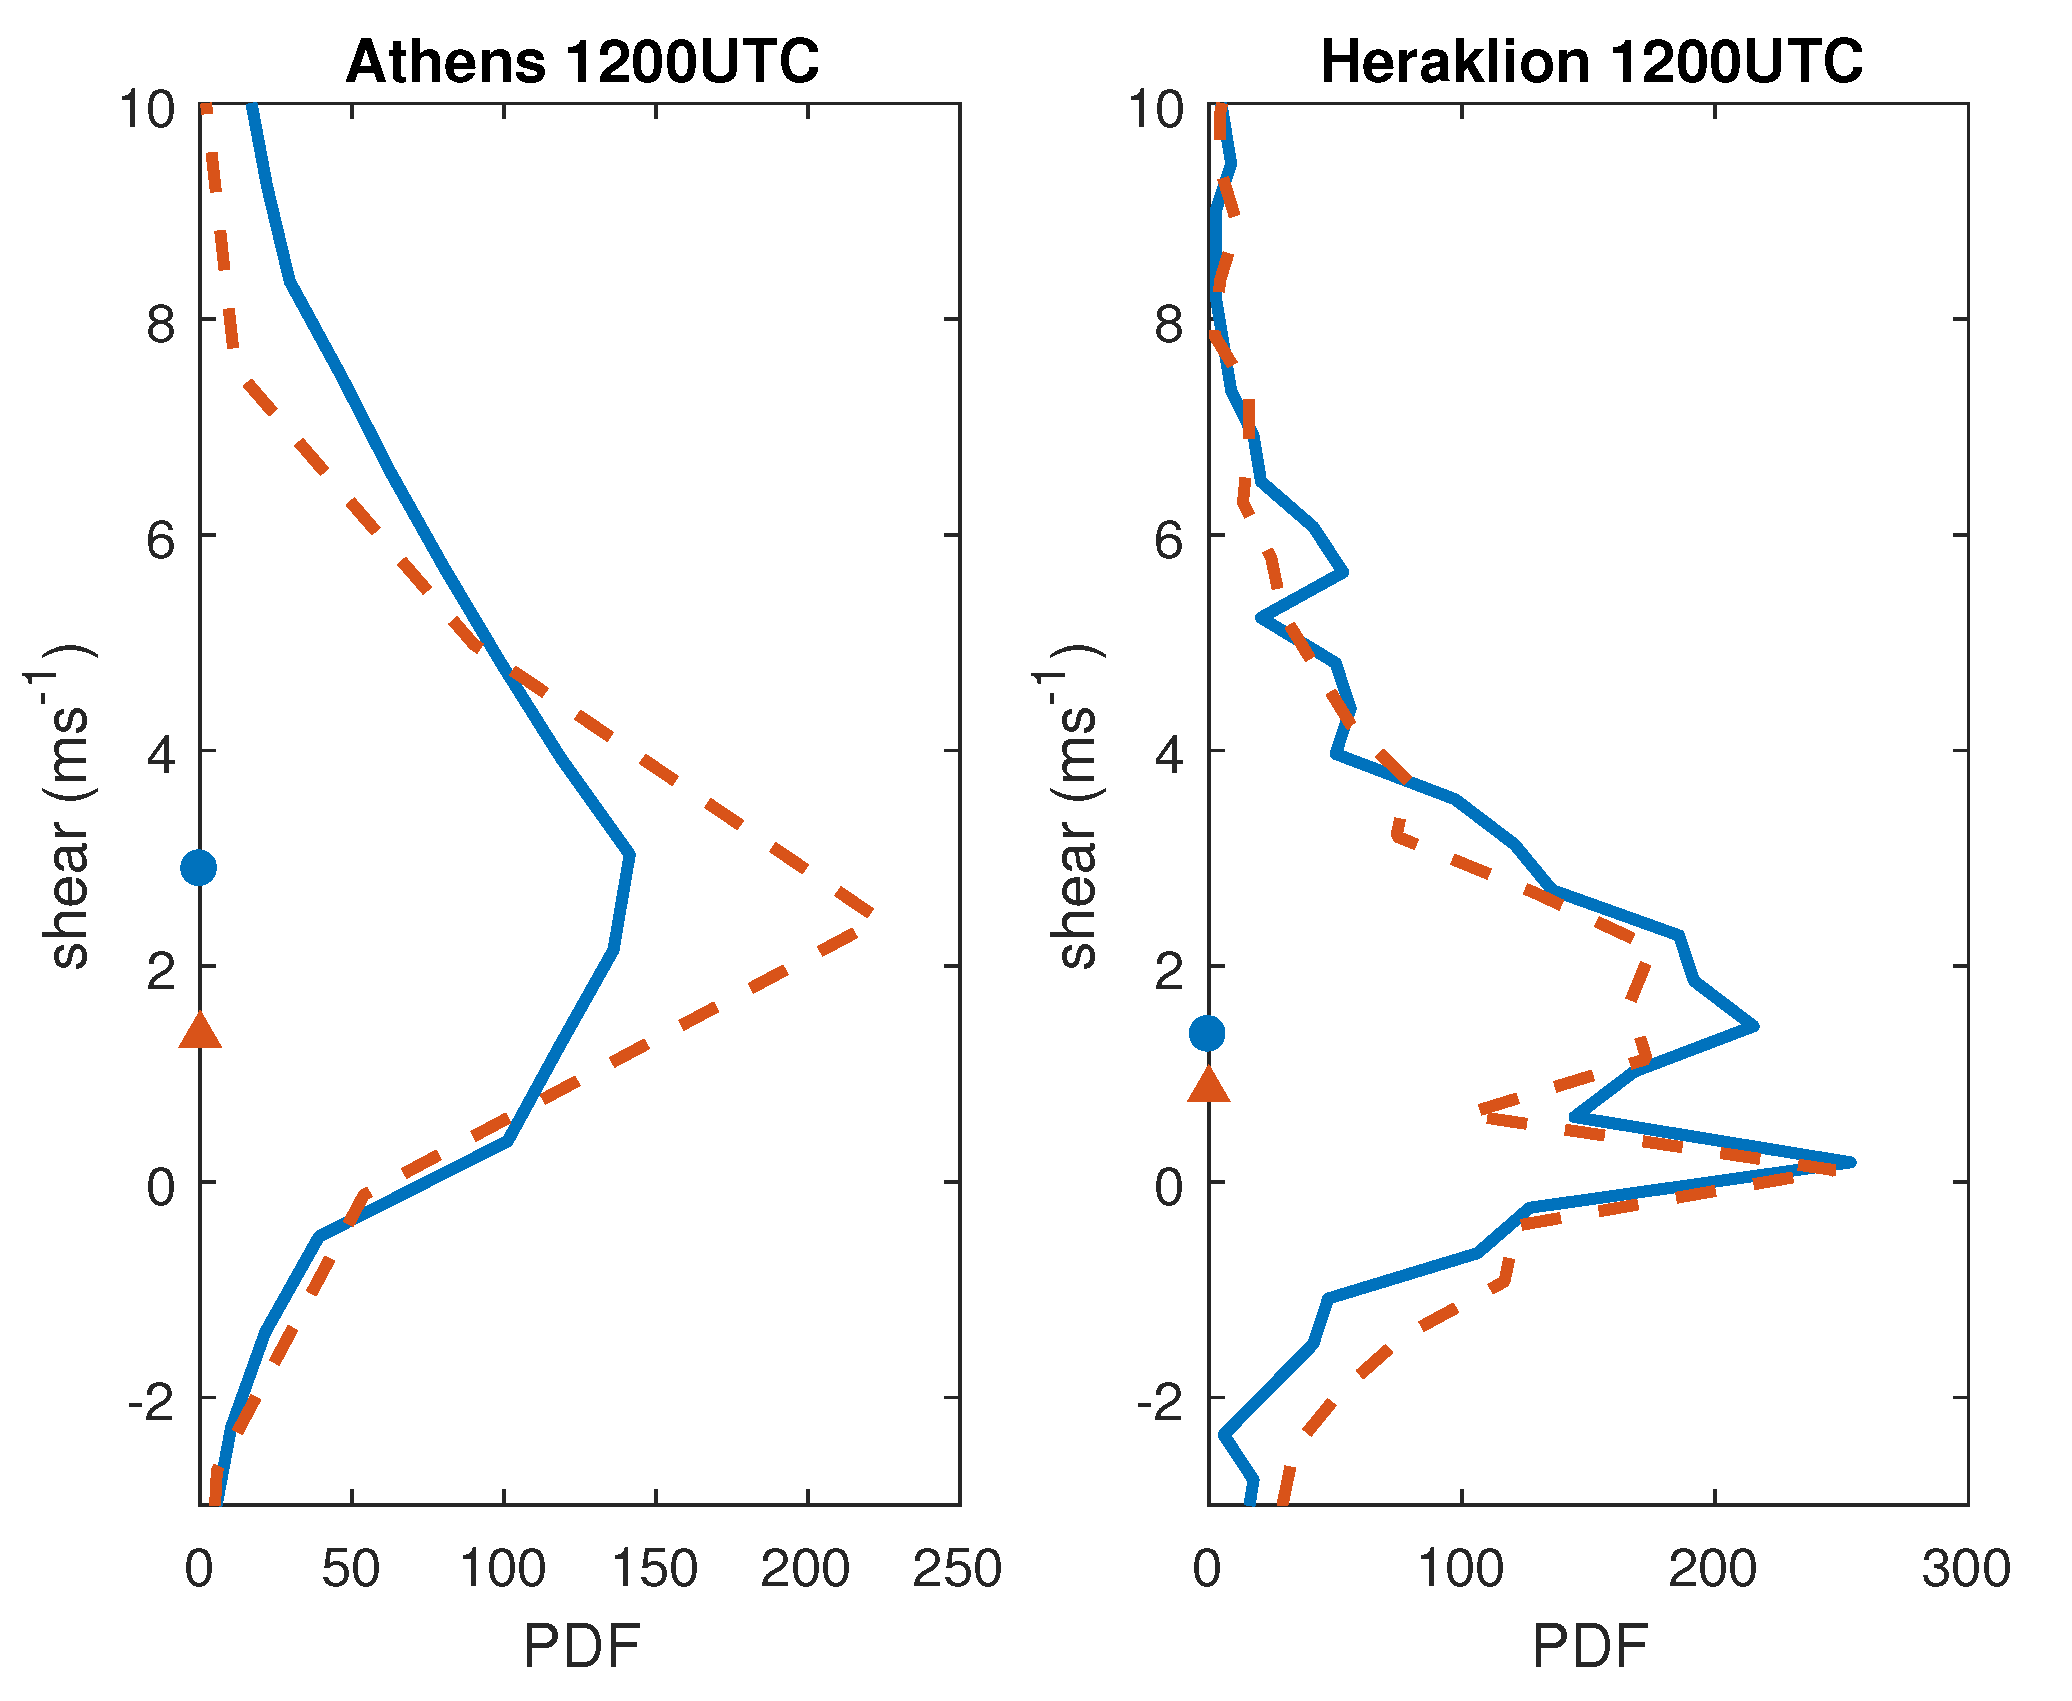
The PDFs for the wind shear obtained from the 1200UTC soundings over Athens and Heraklion are shown in Figure 10 for the summer (JJA) and the winter (DJF) months. The distribution for Thessaloniki is similar to the distribution for Athens and is not shown. We observe positive values for the shear (wind speed aloft larger than the wind speed at the surface) of the order of a few ms 1 for all three sites and the distributions are similar for the two dominant types of daytime boundary layers (CBL and NBL). During the summer, the PDFs have a sharper peak at low values for both Athens and Thessaloniki yielding the smaller median values of 1.4 and 0.6 ms 1 for the summer compared to 2.9 and 2.2 ms 1 for the winter months, respectively. This is probably due to the fact that convectively produced turbulence which is more vivid during the summer homogenizes momentum more effectively yielding a nearly uniform distribution of the wind. In Heraklion there is no seasonal variability and the wind shear has a median value of 1.1 ms 1 .
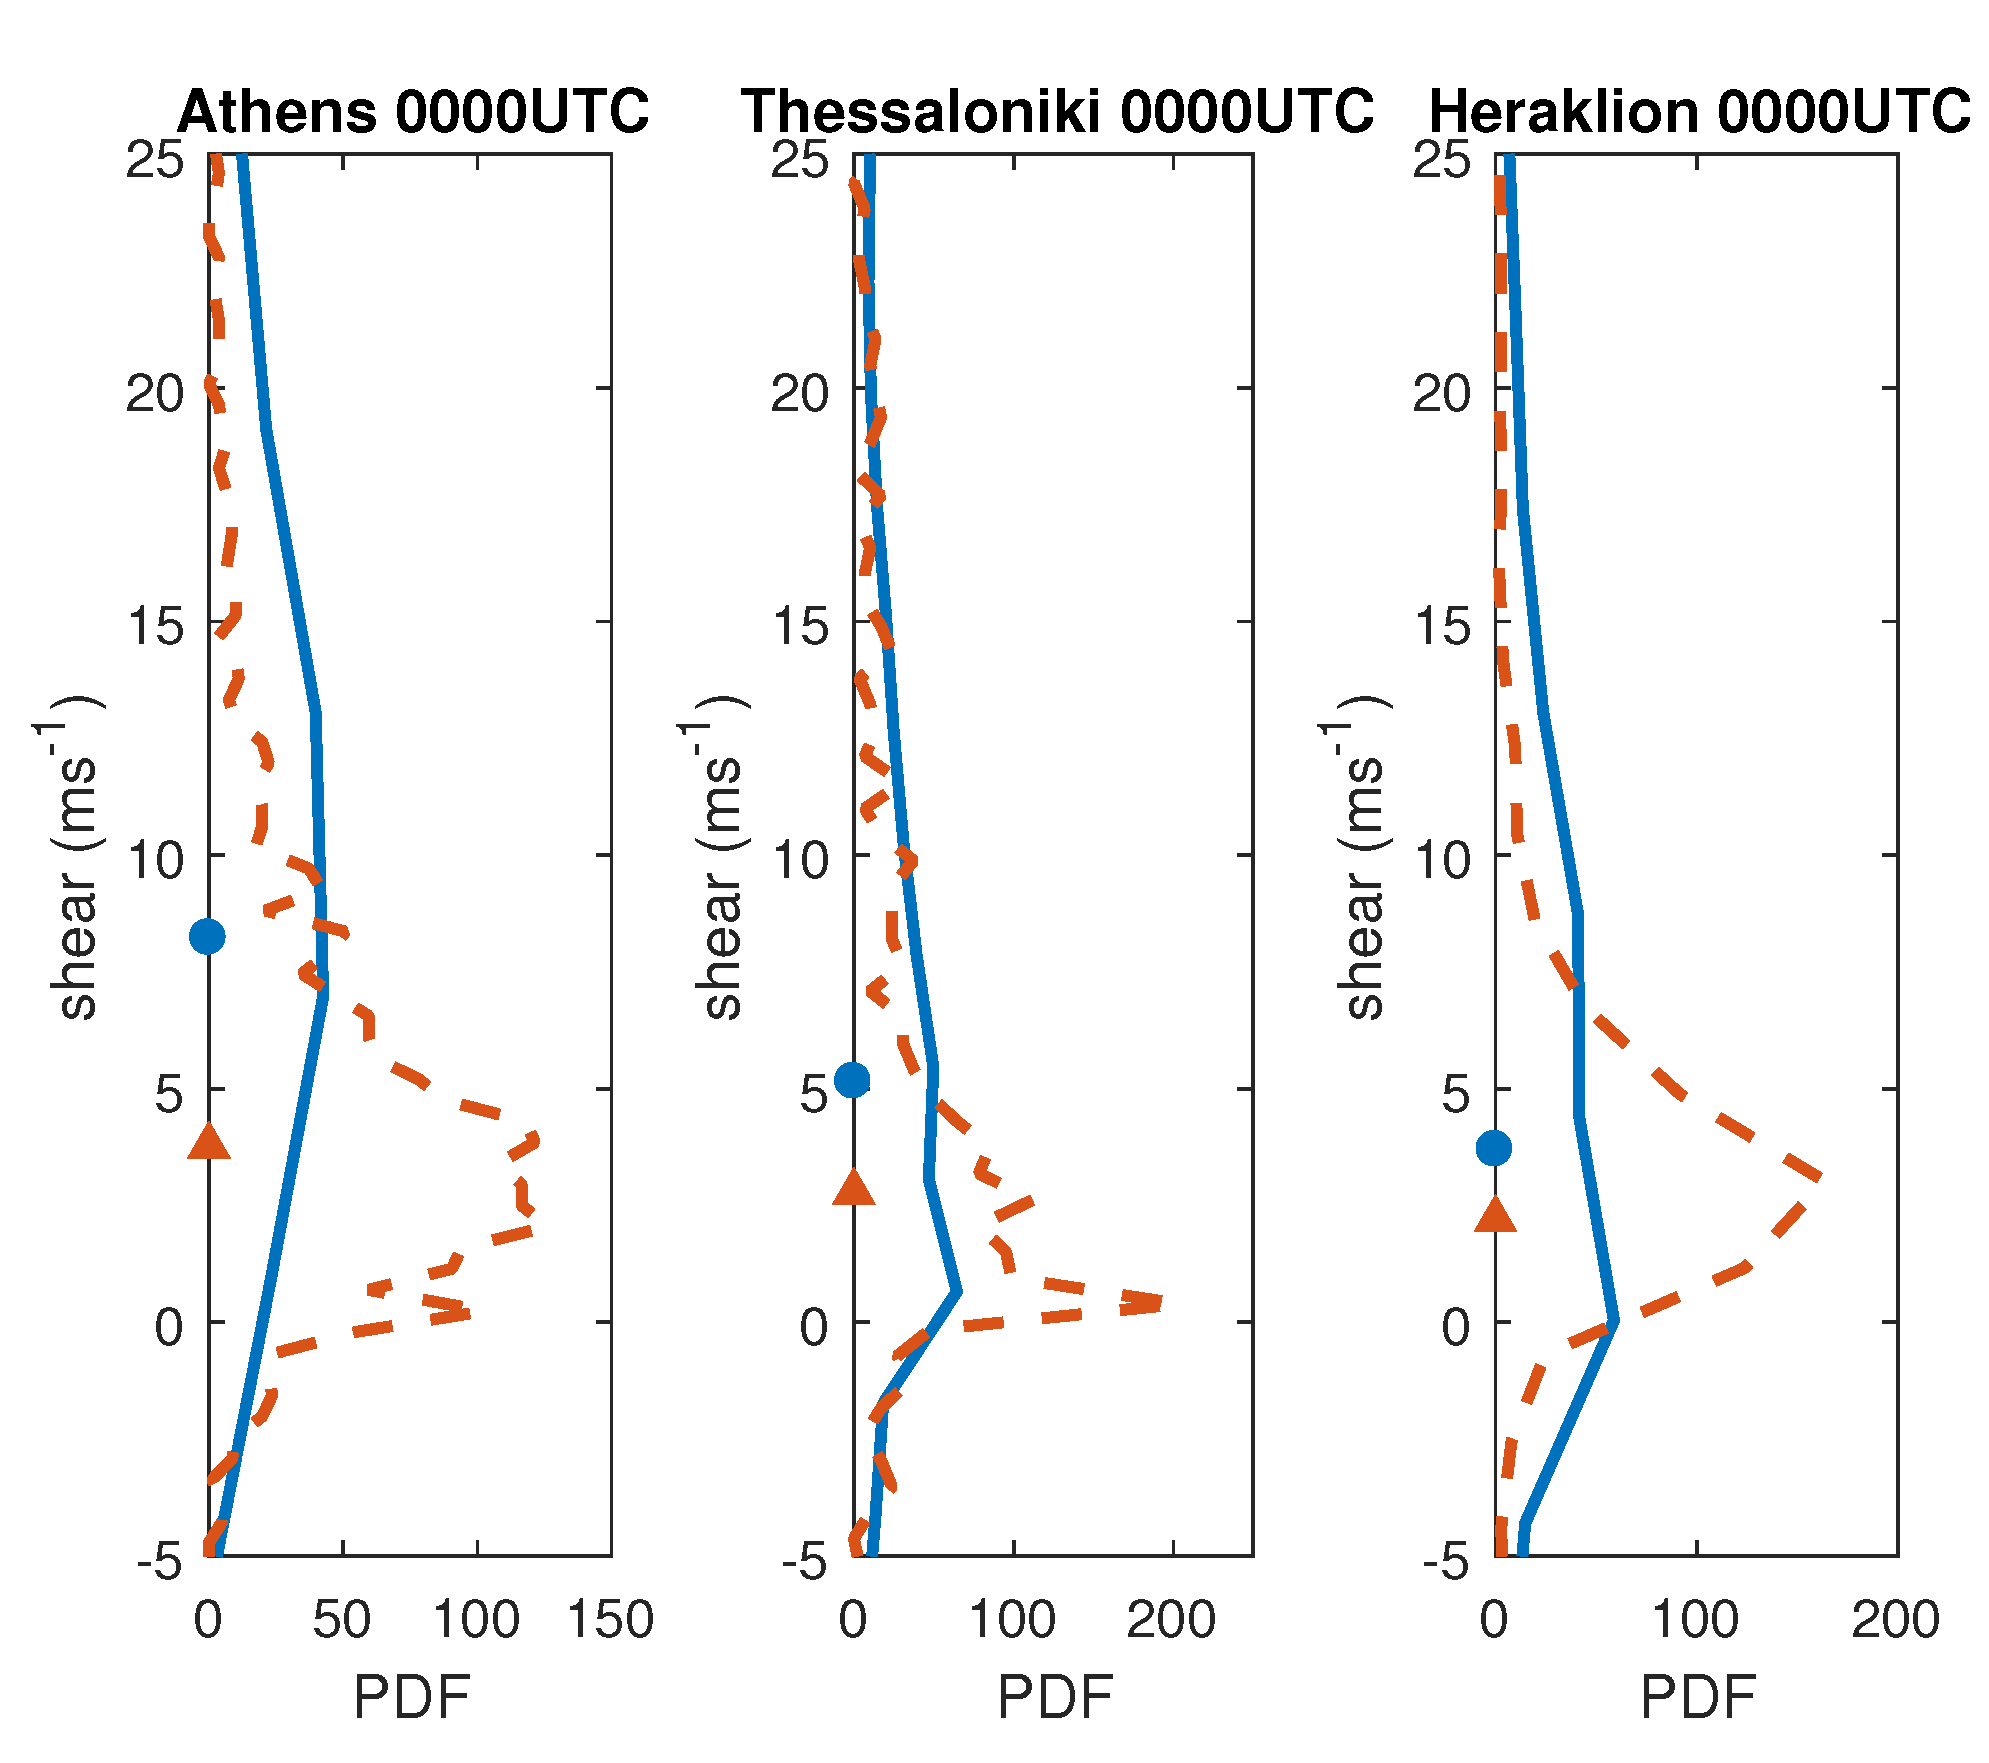
The PDFs of the wind shear for the nocturnal boundary layer over all three sites is shown in Figure 11. There is no significant seasonal variability as is observed for the daytime boundary layer (not shown in the figure) but there are significant differences between the dominant SBL type and the NBL type which occurs in about 20% of the days. While the PDFs for the NBL type peak at low shear values as in the daytime boundary layer, the PDF for the stable boundary layer is much wider and peaks towards larger values of the wind shear for all three sites. As a result, the median values for the SBL are 8.2, 5.1 and 3.7 ms 1 for Athens, Thessaloniki and Heraklion respectively compared to 3.8, 2.8 and 2.2 ms 1 for the NBL type.
To summarize, the wind in the daytime boundary layer is characterized by rather small shear values of the order of 1 ms 1 and a rather homogeneous distribution of small wind turning angles lower than 15 degrees with no general preference for veering or backing. These characteristics are indicative of a well-mixed boundary layer with homogeneous wind distributions and small turning angles. The wind in the nocturnal boundary layer has larger shear of the order of 5–10 ms 1 and a slight tendency towards wind veering for at least one site. A seasonal variation is evident in the daytime wind shear for Athens and Thessaloniki, with summer minima and winter maxima, an observation that is consistent with the homogenizing action of convectively driven turbulence. The wind over Heraklion as well as the nighttime wind field over all three sites does not exhibit significant seasonal variability.

5. Comparison to Results from Previous Studies

We now compare our findings to results from previous studies estimating the PBLH and the wind field over Europe and Greece using various methodologies and observational data. Seidel et al. [21] conducted a climatological analysis on soundings, reanalysis and climate models data using the bulk Richardson method and found that daytime values of PBL height over Europe exhibit a similar seasonal variability as reported here with winter minima of 0.5 km and summer maxima of 1.2 km. In addition they calculated a nocturnal boundary layer height in the range 0.1–0.3 km, which is comparable to our calculations. Regarding the two methods used in this study and their systematic differences, Engeln [40] reported similar findings when analyzing the PBLH using reanalysis data and comparing the bulk Richardson number method and a relative humidity gradient-based method.
For the estimation of the PBLH over Greece, there has been several studies using sodar, and ceilometer measurements over short time periods or LiDAR and radiosonde measurements over longer time periods for Athens and Thessaloniki. Sodar estimates of the PBLH over Athens from various campaigns lasting for a few days, range from 1–1.5 km for the daytime boundary layer and 0.2–0.5 km for the nocturnal boundary layer [18,20,42]. Alexiou et al. [43] estimated the PBLH over Athens based on LiDAR measurements. They found a similar seasonal variation for the daytime PBLH ranging from 1 km during the winter to 2 km during the summer and a median value of 1.6 km. For the nocturnal PBLH they reported a median value of 0.9 km with no significant seasonal variation. Helmis et al. [20] launched a campaign lasting for a week and estimated the PBLH over Athens using a ceilometer. They found that the PBLH reaches values of 1.7–2 km during the day and is much shallower at 300 m during the night. For the boundary layer over Thessaloniki, Georgoulias et al. [25] calculated a two-year climatology of the PBLH based on sounding data and using the bulk Richardson number method. For the daytime boundary layer, they found a rather homogeneous distribution of PBLH values in the range up to 2 km. In addition, Santacesaria et al. [15] estimated the PBLH over Thessaloniki using LiDAR measurements in a campaign that lasted four days and found daytime values in approximately the same range. The results of these studies are summarized in Table 2.
To summarize, the main results in this work regarding the seasonal variability of the daytime PBLH and the absence of seasonal variability for the nocturnal boundary layer, as well as the range of estimates and the median of the values for the three sites are in general agreement to the findings in the literature for the PBLH over Europe and Greece.
Regarding the wind field within the boundary layer, observational studies that are based on campaigns limited to a few days report a large range of values for the wind turning angle with small values up to 10–15 degrees for convective conditions [2] and larger values reaching up to 35 degrees for stable boundary layers [45]. Lindvall and Svensson [26] derived a forty-year global climatology for the wind turning angle using the IGRA sounding data set. They found a strong dependence of turning angle with latitude, so for the range of latitudes of the three sites in our study they found a slight veering of the wind with a median value for the global average of the wind turning angle of 15 degrees with little seasonal variation. For the wind shear, observational campaigns limited to a small number of days have found that the shear depends mainly on the stability in the boundary layer. Convective boundary layers produce generally small shear values of the order 1 ms 1 , while shear in the stable boundary layer can reach values as high as 30 ms 1 in the presence of a Low-Level Jet [9,46]. Houchi et al. [44] compared a 10-year climatology of the wind field obtained from high resolution radiosonde measurements mostly located in the United States (SPARC database) and the output of the ECMWF model. For the wind shear near the surface, they found a distribution of values ranging from 3 ms 1 (the 25th percentile) to 10 ms 1 (the 75th percentile) with a median value of 6 ms 1 . Therefore, our wind field climatology is in general agreement with the previously reported results in the literature regarding both the range of values for the wind turning angle and the wind shear as well as the dependence of these two parameters on the season and on the stability in the boundary layer.

6. Conclusions

In this work, a climatological analysis of the Planetary Boundary Layer Height (PBLH) and of the boundary layer wind field over Greece was carried out. The climatology is based on measurements from radiosonde soundings released at three sites (Athens, Thessaloniki and Heraklion) at 1200 and 0000UTC over a 32-year period (1985–2016). The PBLH was derived by first categorizing the boundary layer in three types based on the gradient of potential temperature near the surface: the Convective Boundary Layer (CBL), the Neutral Boundary Layer (NBL) and the Stable Boundary Layer (SBL). For the CBL and the NBL, the PBLH is identified as the height of the capping inversion by finding the height where the gradient of potential temperature aloft surpasses a specified threshold. For the SBL, the PBLH is identified as the height of the surface inversion by finding the height where the potential temperature falls below a specified threshold. It was also estimated for all boundary layer types using the bulk Richardson number method.
The daytime boundary layer was found to be mostly convective (CBL) except for Thessaloniki where an NBL is equally probable, while the nocturnal boundary layer is more frequently characterized by a surface inversion in all three sites. While the PBLH during nighttime has no seasonal variability, the PBLH during daytime for both Athens and Thessaloniki was found to exhibit a seasonal variation with summer maxima and winter minima due to the stronger summer convection deepening the boundary layer. In contrast, the seasonal variability of the PBLH in Heraklion was found to be very weak. The PBLH values estimated using the gradient method are in the range of 1.2–1.7 km for the daytime boundary layer and in the range of 150–200 m for the nighttime boundary layer, while the bulk Richardson number method systematically yields lower values ranging from 300 m to 700 m for the daytime boundary layer and 50 m to 90 m for the nighttime boundary layer. These values are in general agreement with previously obtained heights for the area of Greece using remote sensing techniques and for other sites of continental southern Europe using radiosonde measurements.
The wind field in the daytime boundary layer at all three sites was found to have small shear of the order of 1 ms 1 and small wind turning angles that are lower than 15 degrees with equal probability for veering and backing. In addition, there is seasonal variation in the daytime wind shear for Athens and Thessaloniki with summer minima and winter maxima. The wind field in the nocturnal boundary layer was found to exhibit no seasonal variability and has larger shear of the order of 5–10 ms 1 , small wind turning angles that are lower than 15 degrees and a slight tendency towards wind veering for Heraklion.
Based on these findings, the boundary layer over Athens and Thessaloniki presents characteristics of a convective, well-mixed layer with seasonal variability as the vivid summer convection deepens the boundary layer and mixes efficiently momentum leading to small wind shears and wind turning angles during the warm period. In contrast, the boundary layer over Heraklion exhibits little seasonal variability and slight wind veering at night under the stable conditions of the nocturnal layer. While the fact that Heraklion is situated on the island of Crete surrounded by the Aegean Sea might be able to explain such differences in the PBL characteristics, an elaborate future study addressing the influence of the geomorphological characteristics of the three sites as well as the influence of local or larger scale circulations and of other meteorological factors on the PBL characteristics and their differences is needed and will be pursued in the future.

Author Contributions

Conceptualization, N.A.B. and A.F.; methodology, N.A.B. and A.F.; software, S.K.; formal analysis, N.A.B. and S.K.; resources, A.F.; writing—original draft preparation, N.A.B.; visualization, N.A.B.; funding acquisition, A.F. All authors have read and agreed to the published version of the manuscript.

Funding

This research received no external funding.

Conflicts of Interest

The authors declare no conflict of interest.

Abbreviations

The following abbreviations are used in this manuscript:
CBLConvective Boundary Layer
DJFDecember January February
ECMWFEuropean Center for Medium-Range Weather Forecasts
HNMSHellenic National Meteorological Service
IGRAIntegrated Global Radiosonde Archive
JJAJune July August
NBLNeutral Boundary Layer
PBLPlanetary Boundary Layer
PBLHPlanetary Boundary Layer Height
PDFProbability Density Function
SBLStable Boundary Layer
SPARCStratosphere-Troposphere Processes And their Role in Climate

References

  1. Stull, R.B. An Introduction to Boundary Layer Meteorology; Kluwer Acad.: Dordrecht, The Netherlands, 1988; p. 666. [Google Scholar]
  2. Garratt, J.R. The Atmospheric Boundary Layer; Cambridge University Press: Cambridge, UK, 1992; p. 335. [Google Scholar]
  3. Arakawa, A.; Schubert, W.H. Interaction of a cumulus cloud ensemble with the large scale envirnoment, part I. J. Atmos. Sci. 1974, 31, 674–701. [Google Scholar] [CrossRef] [Green Version]
  4. Seibert, P.; Beyrich, F.; Gryning, S.E.; Joffre, S.; Rasmussen, A.; Tercier, P. Review and intercomparison of operational methods for the determination of the mixing height. Atmos. Environ. 2000, 34, 1001–1027. [Google Scholar] [CrossRef]
  5. Medeiros, B.A.; Hall, A.; Stevens, B. What controls the mean depth of the PBL? J. Clim. 2005, 18, 3157–3172. [Google Scholar] [CrossRef] [Green Version]
  6. Beare, R.J. Boundary-layer mechanisms in extratropical cyclones. Q. J. R. Meteorol. Soc. 2007, 133, 503–515. [Google Scholar] [CrossRef]
  7. Peña, A.; Gryning, S.E.; Hasager, C.B. Measurements and modelling of the wind speed profile in the marine atmospheric boundary layer. Bound. Layer Meteorol. 2009, 129, 479–495. [Google Scholar] [CrossRef]
  8. Mahrt, L.; Sun, J.; Blumen, W.; Delany, T.; Oncley, S. Nocturnal boundary-layer regimes. Bound. Layer Meteorol. 1998, 88, 255–278. [Google Scholar] [CrossRef]
  9. Peña, A.; Floors, R.; Gryning, S.E. The Høvsøre TallWind-profile experiment: A description of wind profile observations in the atmospheric boundary layer. Bound. Layer Meteorol. 2014, 150, 69–89. [Google Scholar] [CrossRef]
  10. Floors, R.; Peña, A.; Gryning, S.E. The effect of baroclinicity on the wind in the planetary boundary layer. Q. J. R. Meteor. Soc. 2015, 141, 619–630. [Google Scholar] [CrossRef]
  11. Hess, G.D.; Garratt, J.R. Evaluating models of the neutral barotropic planetary layer using integral measures. Part I: Overview. Bound. Layer Meteorol. 2002, 104, 333–358. [Google Scholar] [CrossRef]
  12. Gray, W.M. A Diagnostic Study of the Planetary Boundary Layer over the Oceans; Technical Report, Paper 179; Department of Atmospheric Science, Colorado State University: Fort Collins, CO, USA, 1972. [Google Scholar]
  13. Seidel, D.J.; Ao, C.O.; Li, K. Estimating climatological planetary boundary layer heights from radiosonde observations: Comparison of methods and uncertainty analysis. J. Geophys. Res. 2010, 115, D16113. [Google Scholar] [CrossRef] [Green Version]
  14. Melfi, S.H.; Spinhirne, J.D.; Chou, S.H. Lidar observations of vertically organized convection in the planetary boundary layer over the ocean. J. Appl. Meteorol. Climatol. 1985, 24, 806–821. [Google Scholar] [CrossRef]
  15. Santacesaria, V.; Marenco, F.; Balis, D.; Papayannis, A.; Zerefos, C. Lidar observations of the planetary boundary layer above the city of Thessaloniki, Greece. Meteorol. Atmos. Phys. 1998, 21, 585–596. [Google Scholar]
  16. Hennemuth, B.; Lammert, A. Determination of the boundary layer height from radiosonde and lidar backscatter. Bound. Layer Meteorol. 2006, 120, 181–200. [Google Scholar] [CrossRef]
  17. Beyrich, F. Mixing height estimation from sodar data—A critical discussion. Atmos. Environ. 1997, 31, 3941–3953. [Google Scholar] [CrossRef]
  18. Asimakopoulos, D.N.; Helmis, C.G.; Michopoulos, J. Evaluation of SODAR methods for the determination of the atmospheric boundary layer mixing height. Meteorol. Atmos. Phys. 2004, 85, 85–92. [Google Scholar] [CrossRef]
  19. Eresmaa, N.A.; Karpinnen, A.; Joffre, S.M.; Rasanen, J.; Talvitie, H. Mixing height determination by ceilometers. Atmos. Chem. Phys. 2006, 6, 1485–1493. [Google Scholar] [CrossRef] [Green Version]
  20. Helmis, C.G.; Sgouros, G.; Tombrou, M.; Schäfer, K.; Münkel, C.; Bossioli, E.; Dandou, A. A comparative study and evaluation of mixing-height estimation based on sodar-RASS, ceilometer data and numerical model simulations. Bound. Layer Meteorol. 2012, 145, 507–526. [Google Scholar] [CrossRef]
  21. Seidel, D.J.; Ao, C.O.; Li, K. Climatology of the planetary boundary layer over the continental United States and Europe. J. Geophys. Res. 2012, 117, D17106. [Google Scholar] [CrossRef]
  22. Liu, S.; Liang, X.Z. Observed diurnal cycle climatology of planetary boundary layer height. J. Clim. 2010, 23, 5790–5809. [Google Scholar] [CrossRef]
  23. Guo, J.; Miao, Y.; Zhang, Y.; Liu, H.; Li, Z.; Zhang, W.; He, J.; Lou, M.; Yan, Y.; Bian, L.; et al. The climatology of planetary boundary layer height in China derived from radiosonde and reanalysis data. Atmos. Chem. Phys. 2016, 16, 13309–13319. [Google Scholar] [CrossRef] [Green Version]
  24. Beyrich, F.; Leps, J.P. An operational mixing height data set from routine radiosoundings at Lindenberg: Methodology. Meteorol. Z. 2012, 21, 337–348. [Google Scholar] [CrossRef] [Green Version]
  25. Georgoulias, A.K.; Papanastasiou, D.K.; Melas, D.; Amiridis, V.; Alexandri, G. Statistical analysis of boundary layer heights in a suburban environment. Meteorol. Atmos. Phys. 2009, 104, 103–111. [Google Scholar] [CrossRef]
  26. Lindvall, J.; Svensson, G. Wind turning in the atmospheric boundary layer over land. Q. J. R. Meteorol. Soc. 2019, 145, 3074–3088. [Google Scholar] [CrossRef]
  27. Gryning, S.E.; Batchvarova, E. Parametrization of the depth of the entrainment zone above the daytime mixed layer. Q. J. R. Meteorol. Soc. 1994, 120, 47–58. [Google Scholar] [CrossRef]
  28. Holtzworth, G.C. Estimates of mean maximum mixing depths in the contiguous United States. Mon. Weather Rev. 1964, 92, 235–242. [Google Scholar] [CrossRef] [Green Version]
  29. Miller, M.E. Evaluation and model impacts of alternative boundary layer height formulation. Mon. Weather Rev. 1967, 95, 35–44. [Google Scholar] [CrossRef]
  30. Garrett, A.J. Comparison of observed mixed layer depth to model estimates using observed temperature and winds, and MOS forecasts. J. Appl. Meteorol. 1981, 20, 1277–1283. [Google Scholar] [CrossRef]
  31. Cohen, A.E.; Cavallo, S.M.; Coniglio, M.C.; Brooks, H.E. A Review of Planetary Boundary Layer Parameterization Schemes and Their Sensitivity in Simulating Southeastern U.S. Cold Season Severe Weather Environments. Weather Forecast. 2015, 30, 591–612. [Google Scholar] [CrossRef]
  32. Newsom, R.K.; Banta, R.M. Shear-Flow Instability in the Stable Nocturnal Boundary Layer as Observed by Doppler Lidar during CASES-99. J. Atmos. Sci. 2003, 60, 16–33. [Google Scholar] [CrossRef]
  33. Mahrt, L.; Heald, R.C.; Lenschow, D.H.; Stankov, B.B.; Troen, I. An observational study of the structure of the nocturnal boundary layer. Bound. Layer Meteorol. 1979, 17, 247–264. [Google Scholar] [CrossRef]
  34. Yu, T.W. Determining the height of the nocturnal boundary layer. J. Appl. Meteorol. 1978, 17, 28–33. [Google Scholar] [CrossRef] [Green Version]
  35. Bradley, R.S.; Keimig, F.T.; Diaz, H.F. Recent changes in the North American Arctic boundary layer in winter. J. Geophys. Res. 1993, 98, 8851–8858. [Google Scholar] [CrossRef]
  36. Garrett, J.R. Observations in the nocturnal boundary layer. Bound. Layer Meteorol. 1982, 22, 21–48. [Google Scholar] [CrossRef]
  37. Smeldman, A.S. Some turbulence characteristics in stable atmospheric boundary layer flow. J. Atmos. Sci. 1991, 48, 856–868. [Google Scholar] [CrossRef] [Green Version]
  38. Vogelezang, D.H.P.; Holtslag, A.A.M. Evaluation and model impacts of alternative boundary layer height formulation. Bound. Layer Meteorol. 1996, 81, 245–269. [Google Scholar] [CrossRef]
  39. Miles, J.W. On the stability of heterogenic shear flows. J. Fluid Mech. 1961, 10, 496–508. [Google Scholar] [CrossRef] [Green Version]
  40. Von Engeln, A.; Teixeira, J. A planetary boundary layer height climatology derived from ECMWF reanalysis data. J. Clim. 2013, 26, 6575–6590. [Google Scholar] [CrossRef]
  41. Holmboe, J. On the behavior of symmetric waves in stratified shear layer. Geofysiske 1962, 24, 67–113. [Google Scholar]
  42. Tombrou, M.; Dandou, A.; Helmis, C.; Akylas, E.; Angelopoulos, G.; Flocas, H.; Assimakopoulos, V.; Soulakellis, N. Model evaluation of the atmospheric boundary layer and mixed-layer evolution. Bound. Layer Meteorol. 2007, 124, 61–79. [Google Scholar] [CrossRef]
  43. Alexiou, D.; Kokkalis, P.; Papayannis, A.; Rocadenbosch, F.; Argyrouli, A.; Tsaknakis, G.; Tzanis, C.G. Planetary boundary layer variability over Athens, Greece, based on the synergy of Raman lidar and radiosonde data: Application of the Kalman filter and other techniques. EPJ Web Conf. 2018, 176, 06007. [Google Scholar] [CrossRef]
  44. Houchi, K.; Stoffelen, A.; Marseille, G.J.; de Kloe, J. Comparison of wind and wind shear climatologies derived from high-resolution radiosondes and the ECMWF model. J. Geophys. Res. 2010, 115, D22123. [Google Scholar] [CrossRef] [Green Version]
  45. Van Ulden, A.P.; Holtslag, A.A.M. Estimation of atmospheric boundary layer parameters for diffusion applications. J. Appl. Meteorol. Climatol. 1985, 24, 1196–1207. [Google Scholar] [CrossRef] [Green Version]
  46. Mizuma, M.; Iwamoto, S. Wind structure of the boundary layer over the Tropical Ocean. J. Meteorol. Soc. Jpn. 1982, 60, 1273–1282. [Google Scholar] [CrossRef] [Green Version]
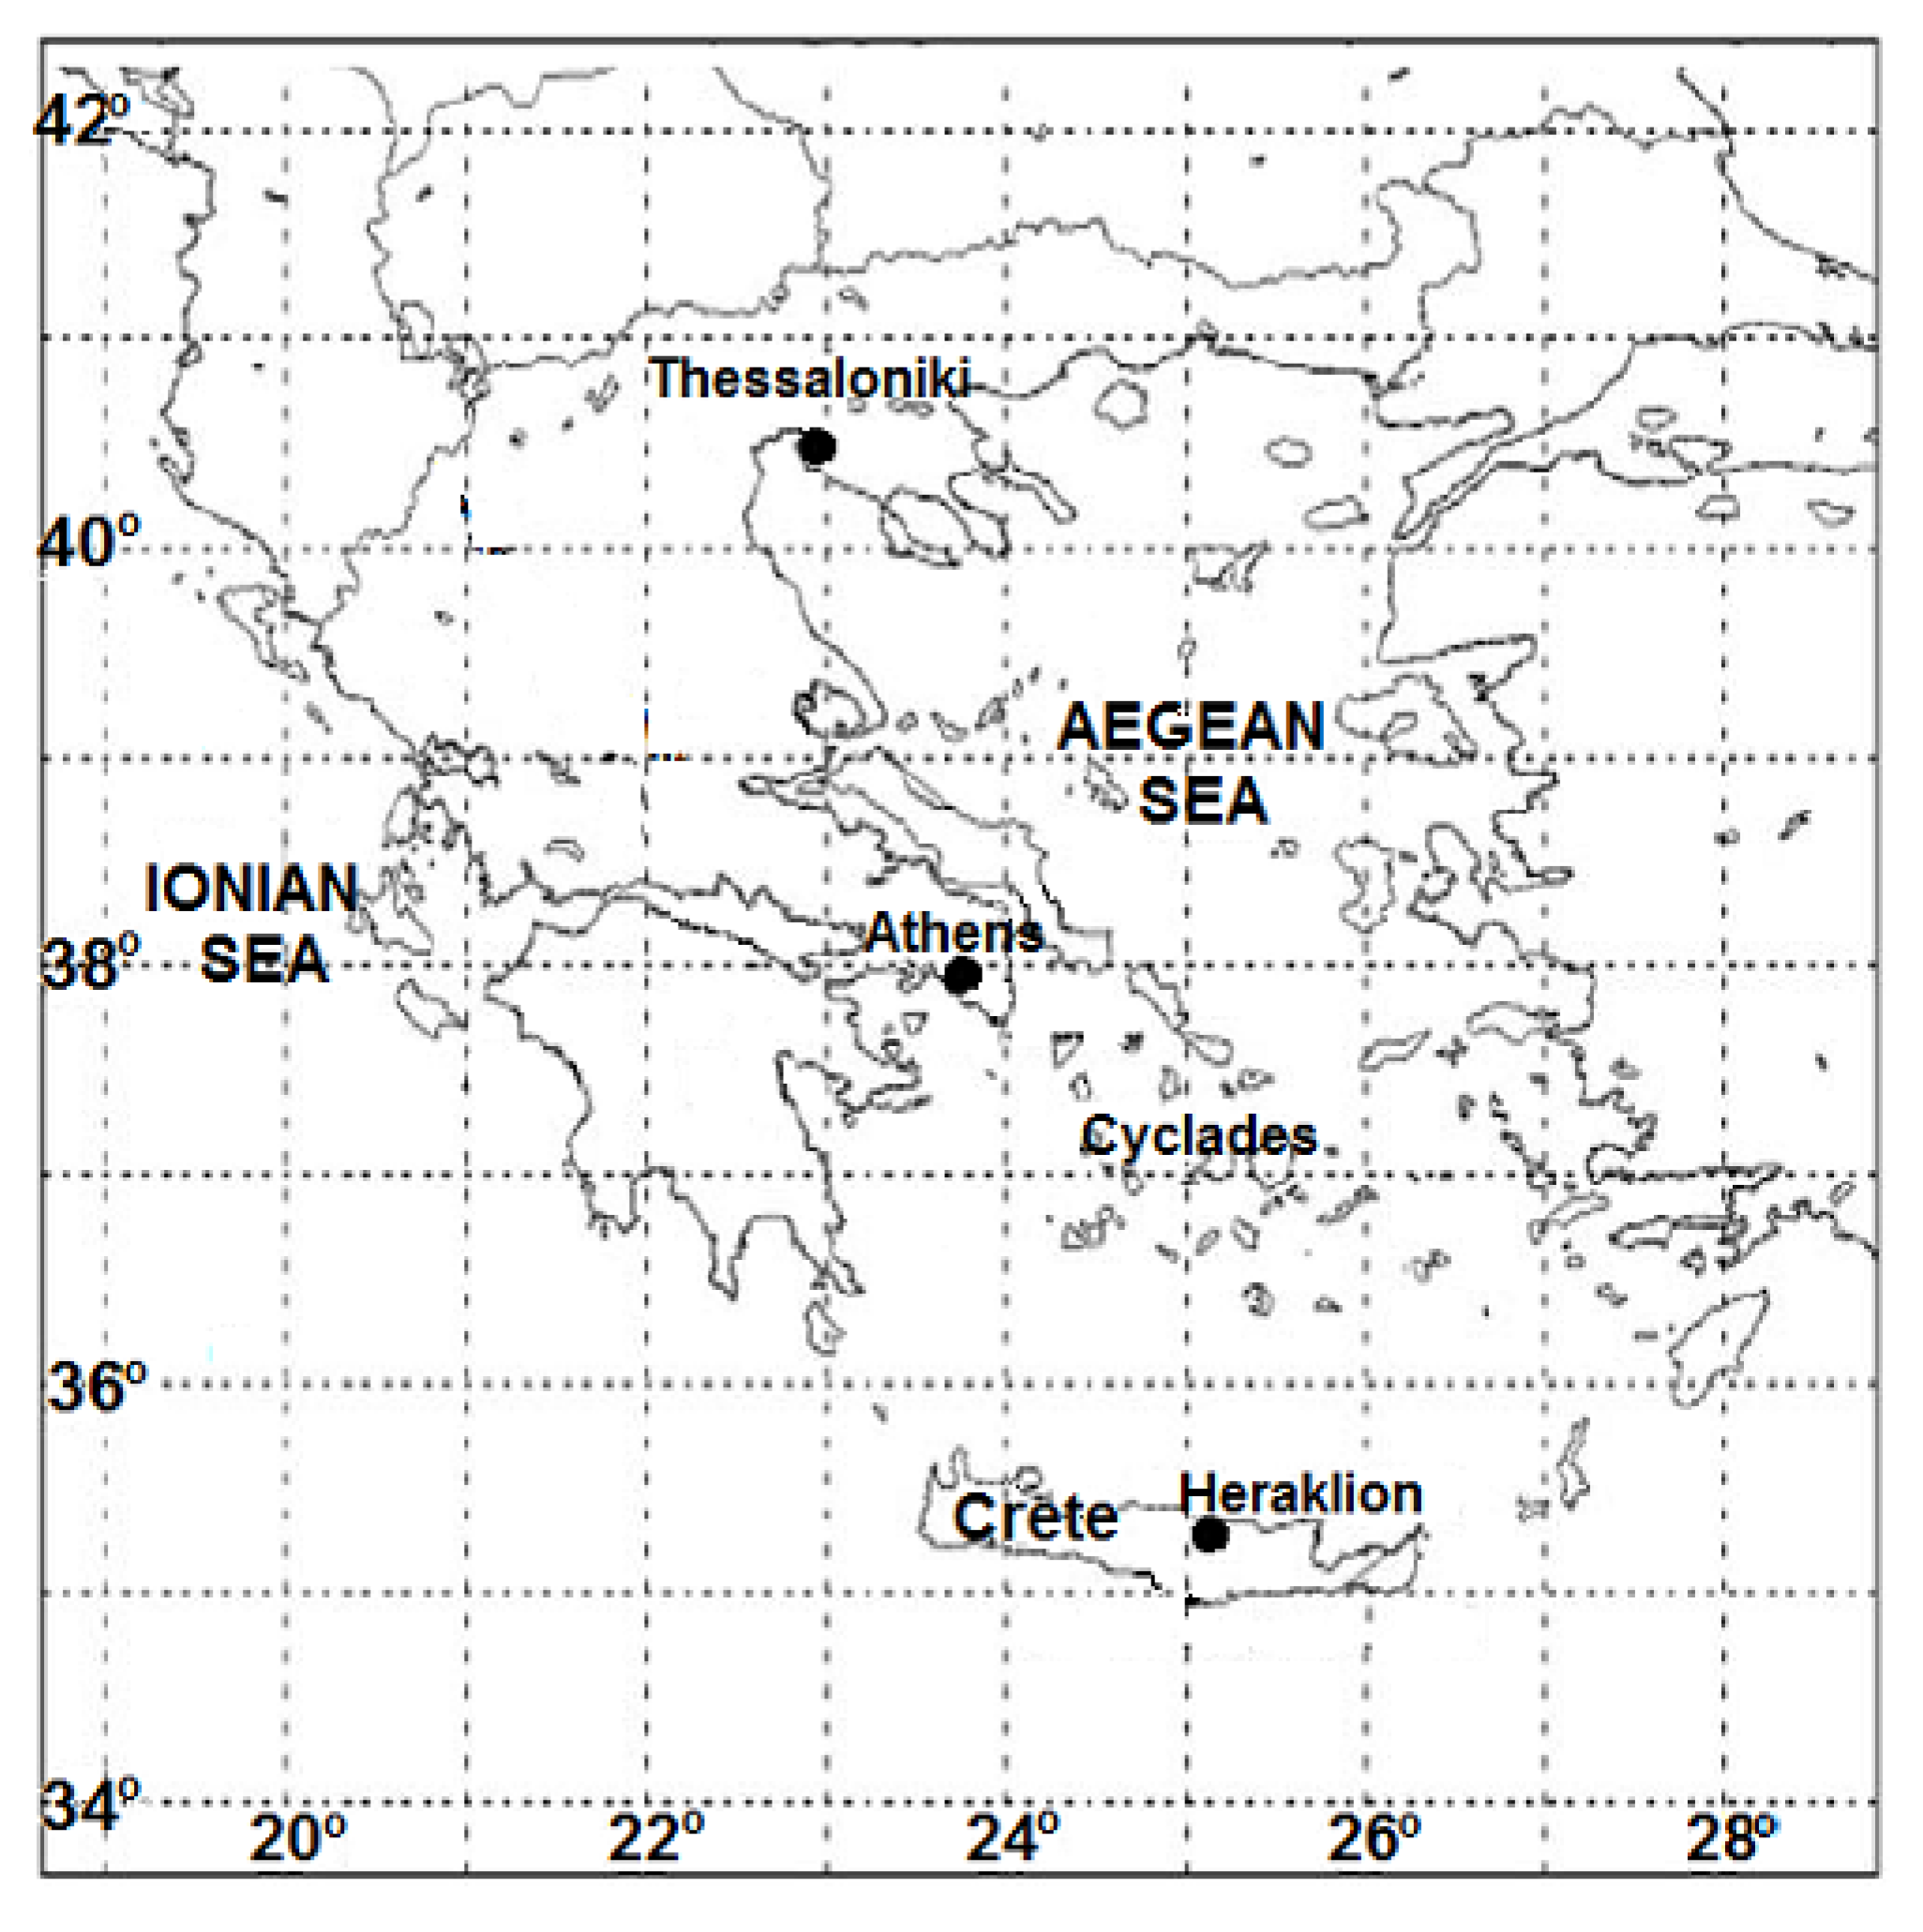
Figure 1. The map of Greece showing the three sites that are the focus of this study: Athens, Thessaloniki and Heraklion.
Atmosphere 11 00910 g001
Figure 2. Available data for all sites and times of observations. Shown are the number of available days, the number of missing days and the number of excluded days due to the quality criteria described in Section 2.2.
Atmosphere 11 00910 g002
Figure 3. Potential temperature as a function of height for the (a) 1200UTC sounding on 12/7/1985, (b) 0000UTC sounding on 5/1/1985, (c) 1200UTC sounding on 20/1/1985 and (d) 0000UTC sounding on 9/1/1985 over Athens. The estimated PBLH using the gradient method is also indicated by the dashed line in (a,b).
Atmosphere 11 00910 g003
Figure 4. Upper panel: Frequency of the three types of boundary layers for all seasons. Lower panels: Frequency of the three types of daytime boundary layers for the winter months (lower left) and the summer months (lower right).
Atmosphere 11 00910 g004
Figure 5. Upper panel: Distribution of the PBLH for each month of the year. The PBLH is estimated using the gradient (denoted as θ in the insert) and the bulk Richardson number (denoted as R i b in the insert) methods for the 1200UTC soundings over Athens. The box plot shows the 25th and 75th percentile values and the open circle shows the median. Lower panels: Probability Density Function (PDF) of the PBLH for the CBL (lower left panel) and NBL (lower right panel) types estimated using the gradient method. Shown are the PDFs for DJF (solid line) and for JJA (dashed line). Also shown are the corresponding median values of the distributions for DJF (circles) and JJA (triangles).
Atmosphere 11 00910 g005
Figure 6. The same as in Figure 5 but for the 1200UTC soundings over Thessaloniki.
Atmosphere 11 00910 g006
Figure 7. The same as in Figure 5 but for the 1200UTC soundings over Heraklion.
Atmosphere 11 00910 g007
Figure 8. Left panels: Probability Density Function (PDF) of the PBLH estimated from the 0000UTC soundings using the gradient (solid lines) and the bulk Richardson number (dashed lines) methods as well as the corresponding median values of the distributions for the gradient (circles) and the bulk Richardson number (triangles) methods. Right panels: PDF of the PBLH estimated from the 0000UTC soundings using the gradient method for the SBL (solid lines) and the NBL (dashed lines) types as well as the corresponding median values of the distributions for the SBL (circles) and the NBL (triangles) types.
Atmosphere 11 00910 g008
Figure 9. Probability Density Function (PDF) of the wind turning angle estimated from the 1200UTC soundings (left panel) and the 0000UTC soundings (right panel) with the PBLH estimated using the gradient method. Shown are the PDFs for Athens (solid line), Thessaloniki (dashed line) and Heraklion (dotted line) along with the corresponding median of the distributions for Athens (circles), Thessaloniki (triangles) and Heraklion (squares).
Atmosphere 11 00910 g009
Figure 10. Probability Density Function (PDF) of the wind shear during winter (solid lines) and during summer (dashed lines) estimated from the 1200UTC soundings over Athens (left panel) and Heraklion (right panel) with the PBLH estimated using the gradient method. The median values for the corresponding distributions for the winter (circles) and summer (triangles) months are also shown.
Atmosphere 11 00910 g010
Figure 11. Probability Density Function (PDF) of the wind shear for the SBL (solid lines) and the NBL (dashed lines) types estimated from the 0000UTC soundings over Athens (left panel), Thessaloniki (middle panel) and Heraklion (right panel) with the PBLH estimated using the gradient method. The median values for the corresponding distributions for the SBL (circles) and NBL (triangles) types are also shown.
Atmosphere 11 00910 g011
Table 1. Median values for the PBLH (in m) over all three sites estimated using the gradient and the bulk Richardson number methods. The error is the mean error due to the finite vertical spacing of the soundings as described in Section 2.2.
SoundingGradient Method Ri b Method
Athens 1200UTC 1700 ± 100 1370 ± 150
Athens 0000UTC 160 ± 90 60 ± 30
Thessaloniki 1200UTC 1400 ± 100 670 ± 130
Thessaloniki 0000UTC 200 ± 80 50 ± 30
Heraklion 1200UTC 1200 ± 100 900 ± 130
Heraklion 0000UTC 190 ± 70 90 ± 30
Table 2. Summary of the results of previous relevant studies regarding the PBLH, the wind turning angle and the wind shear. The median values are either the values reported or inferred from Figures and the data in the studies.
StudyRegionDurationInstr./MethodPBLH 1200UTCPBLH 0000UTC
Seidel et al. [21]Europe24 yearssound./ R i b 1 km0.1 km
Asimakopoulos et al. [18]Athens24 days (April)sodar1.4 km0.2 km
Tombrou et al. [42]Athens2 days (September)sodar1.3 km0.3 km
Helmis et al. [20]Athens7 days (September)ceilometer1.8 km0.3 km
Alexiou et al. [43]Athens5 yearsLiDAR 1.6 ± 0.3 km 0.89 ± 0.13 km
Georgoulias et al. [25]Thessaloniki2 yearssound./ R i b 1 km0.2 km
Santacesaria et al. [15]Thessaloniki2 days (April)LiDAR2 km
StudyRegionDurationInstr./MethodAngleShear
Lindvall & Svensson [26]global40 yearssound./ R i b 15 deg
Houchi et al. [44]US10 yearssound. 6 ms 1