Article

Spatio-Temporal Variations of Atmospheric NH3 over East Asia by Comparison of Chemical Transport Model Results, Satellite Retrievals and Surface Observations

1
Research Institute for Applied Mechanics (RIAM), Kyushu University, Fukuoka 816-8580, Japan
2
State Key Laboratory of Atmospheric Boundary Layer Physics and Atmospheric Chemistry (LAPC), Institute of Atmospheric Physics (IAP), Chinese Academy of Sciences (CAS), Beijing 100029, China
3
Graduate School of Environmental Studies, Nagoya University, Chikusa, Nagoya 464-8601, Japan
4
Environmental Science Research Laboratory, Central Research Institute of Electric Power Industry (CRIEPI), Chiba 270-1194, Japan
*
Author to whom correspondence should be addressed.
Atmosphere 2020, 11(9), 900; https://doi.org/10.3390/atmos11090900
Submission received: 20 July 2020 / Revised: 17 August 2020 / Accepted: 21 August 2020 / Published: 25 August 2020
(This article belongs to the Special Issue Regional Air Quality Modeling)

Abstract

:
Atmospheric ammonia (NH3) plays an important role in the formation of secondary inorganic aerosols, the neutralization of acid rain, and the deposition to ecosystems, but has not been well understood yet, especially over East Asia. Based on the GEOS-Chem model results, the IASI satellite retrievals, the in-site surface observations of a nationwide filter pack (FP) network over Japan and the long-term high resolution online NH3 measurements at Fukuoka of western Japan, the spatio-temporal distributions of atmospheric NH3 over East Asia was analyzed comprehensively. A significant seasonal variation with a summer peak was found in all datasets. Comparison between the satellite retrievals and model simulations indicated that the IASI NH3 vertical column density (VCD) showed good consistency with GEOS-Chem results over North and central China, but had large differences over South China due to the effect of clouds. Over the Japan area, GEOS-Chem simulated NH3 concentrations successfully reproduced the spatio-temporal variations compared with in-situ observations, while IASI NH3 VCD retrievals were below or near the detection limit and difficult to obtain a reasonable correlation for with model results. The comprehensive analysis indicated that there were still some differences among different datasets, and more in-situ observations, improved satellite retrievals, and high-resolution model simulations with more accurate emissions are necessary for better understanding the atmospheric NH3 over East Asia.

Graphical Abstract

1. Introduction

Atmospheric ammonia (NH3) is a highly reactive gas and plays an important role in atmospheric chemical processes by reacting rapidly with sulfuric acid (H2SO4) and nitric acid (HNO3) formed from sulfur dioxide (SO2) and nitrogen oxides (NOx) and producing ammonium (NH4+), which is the most important ambient cation [1]. As a result of these reactions, the formed secondary inorganic aerosols (SIAs, e.g., (NH4)2SO4 and NH4NO3) significantly contribute to high levels of atmospheric fine particles or PM2.5, especially over China, where there are large amounts of anthropogenic emissions for NH3, SO2, and NOx. The modelling study indicated the control of 20% NH3 emission can affect 5–11% of PM2.5 formation in North China [2]. The high concentration of SIAs in China had a wide effect over East Asia through long-range transport [3,4,5]. Due to rapid decrease of SO2 emission in China in recent years, the formation of (NH4)2SO4 decreased subsequently over East Asia, which created free NH3 that reacts with HNO3 to form NH4NO3, and therefore, the nitrate aerosol significantly increased in the downwind area over East Asia [6]. Since the NH3 could significantly affect the HNO3, it subsequently could affect the heterogenous reactions between HNO3 and dust as well as sea salt to form Ca(NO3)2 and NaNO3 [7,8]. To quantitively understand these component shifts in SIAs, the level of NH3 is critically important.
Because atmospheric NH3 is the most important soluble alkaline gas and can react rapidly with acid gases, it also has an important influence on the acidity of precipitation [9]. Observation analysis based on the Acid Deposition Monitoring Network in East Asia (EANET) data revealed that NH3 has a great neutralization capability toward acid rain, even in the regions with low concentrations, such as Japan [10]. Through wet and dry deposition processes, NH3 and its derivatives can be deposited in ecosystems, increasing eutrophication and reducing biodiversity [11]. Recent multi-model studies indicated that the deposition of total ammonia was about 2–6 kg n ha−1 yr−1 over marginal seas of East Asia, and could reach as high as 20 kg n ha−1 yr−1 over North and central China [12,13].
Despite the importance of NH3 in the environment, the atmospheric processes controlling NH3 levels and its related budgets are still poorly understood [1]. One important reason is that the measurement of NH3 is challenging due to the following: (i) strong temporal and spatial variability of ambient levels, (ii) rapid conversion of NH3 between phases (gas/particulate/liquid), and (iii) its tendency to adhere to the surfaces of measurement instruments [14]. Differing with other air pollutants (e.g., SO2 and NOx), there are currently very few monitoring stations that provide daily or hourly resolved NH3 measurements, with most long-term monitoring of NH3 conducted using a passive sampler or dedicated denuder at a time resolution of several weeks.
Over the last few years, satellite instruments capable of detecting NH3 vertical column density (VCD) have been used to study the emission, distribution, and transport of NH3 at global and regional scales [15,16,17]. Via comparison of satellite retrievals and simulations using a global atmospheric chemistry transport model, it was indicated that NH3 emissions could have been significantly underestimated in the Northern Hemisphere [15]. Also, based on five-year satellite retrievals, the seasonality and interannual variability were examined separately for the Northern and Southern Hemispheres [16]. Via comparison between satellite retrievals and LOTOS-EUROS model results over Europe and Western Russia, large discrepancies were found over several industrial areas in Eastern Europe and Russia [17]. Since the satellite retrievals may suffer large relative errors, especially in areas with low VCD, detailed evaluations are necessary, especially over East Asia where the studies are limited.
In addition to the measurement of NH3, chemical transport models (CTMs) are useful tools for studying the sources and sinks of NH3, and the processes controlling its levels in the atmosphere. However, model results may have a large bias due to uncertainties of emissions and atmospheric processes, i.e., gas–aerosol partitioning of NH3 and NH4+. Based on the recent results from the Model Inter-Comparison Study for Asia III (MICS-Asia III), all models failed to reproduce the observed monthly variations in surface NH3 concentrations in the North China Plain region, and most models mismatched the observed peak in July and showed negative correlation coefficients with the observations [18]. Since the MICS-Asia III study only evaluated the simulations of surface NH3 concentrations over North China, more evaluations over other areas of East Asia and comparisons with satellite NH3 retrievals are necessary.
In this study, we analyzed the horizontal distribution and seasonal variation of atmospheric NH3 over East Asia based on the satellite retrievals, the model results, the nationwide filter pack (FP) observation network over Japan, and the hourly NH3 measurements in Fukuoka of western Japan. The similarities and differences of different datasets were also analyzed comprehensively.

2. Observations

2.1. In-Situ High-Resolution Online Measurement

Concentrations of gaseous NH3 were continuously measured using a semi-continuous microflow analytical system (MF-NH3A; Kimoto Electric Co. Ltd., Osaka, Japan) [19] at the 6th floor of a building in Chikushi Campus of Kyushu University (CC-KU). The open triangle in Figure 1b shows the location of CC-KU site. According to the NH3 emission of the EAGrid inventory [20] shown in Figure 1b, the high NH3 emission (mainly originating from local agriculture and poultry farming) area located 5–10 km south of the observation site may influence the NH3 measurement in CC-KU. Atmospheric NHx (= gaseous NH3 + aerosol NH4+) was dissolved in ultrapure water using a continuous air-water droplet sampler and quantified from the fluorescence signal (excitation, 360 nm; emission, 420 nm) of the o-phtalaldehyde-sulfite-NH3 reaction product [21]. The concentrations of NHx and NH4+ in liquid samples were measured simultaneously by application with and without a phosphoric acid denuder at the inlet and the NH3 concentration was calculated as the difference between the measured NHx and NH4+ concentrations. Atmospheric NH3 was measured hourly between July 31, 2014 and October 19, 2015. The details of the observation system and basic data analysis have been reported previously [22].

2.2. Japan Environmental Laboratories Association (JELA) Observation Network

We also used the NH3 observations (from 2010 to 2014) from the Japan Environmental Laboratories Association (JELA), which were acquired at 33 sites in Japan [23]. Table 1 shows the site used for the comparison of the NH3 time series later. The locations of Fukuoka (S27) and Dazaifu (S26) sites were shown as open and closed circles in Figure 1b. (A figure later will show the locations of all the sites with observation during the study period).
The JELA dataset provided monthly averaged atmospheric NH3 concentrations measured using the Filter Pack (FP) method (hereafter denoted as FP data) [24]. The FP method used a passive sampler, which was manufactured by Ogawa Shokai Co. Ltd. and had been widely used for NH3 sampling [25]. Captured NH3 on the sampling filter was extracted into pure water (5 mL), and the amount was detected using the Flow Injection Analysis method. We used the JELA NH3 concentration to compare with other datasets and excluded the sites where there was a strong local influence from agriculture and livestock farming.

2.3. Satellite Retrieval

The improved Infrared Atmospheric Sounding Interferometer (IASI) NH3 dataset was used in this study. IASI is a passive remote-sensing instrument, operating in nadir mode that measures the infrared radiation emitted by the Earth’s surface and atmosphere. The algorithm used to retrieve NH3 columns from the radiance spectra is described in detail and compared to previous algorithms in the literature [16]. The NH3 VCDs were retrieved based on the hyperspectral range index (HRI, a dimensionless spectral index from IASI Level 1C radiance), thermal contrast (TC, the temperature difference between the earth’s surface and the atmosphere at 1.5 km from the IASI Level 2 information), and look-up tables (LUTs, built from forward radiative transfer model simulations). The relative errors were provided by the IASI NH3 product and estimated by considering the uncertainties of HRI and TC, with large errors related to low values of HRI (indicating low values of the NH3 column) and/or TC [16].
The IASI instrument is onboard the polar sun-synchronous MetOp platform, which crosses the equator at a mean local solar time of 9:30 a.m. and p.m. It therefore allows global retrievals of NH3 twice a day. In this study, we only considered the measurements from the morning overpass because they are generally more sensitive to NH3 and have smaller relative errors due to the higher TC at this time of day [16]. The availability of measurements was mainly controlled by the cloud cover, with only observations with cloud cover lower than 25% being processed. It has to be shown that given the strong dependence on TC, the spring–summer months are better suited to accurately measure NH3 from IASI (error below 50%) [17]. As an example of the detection limit (defined as 2σ on the HRI) for an individual observation, an NH3-retrieved column was considered detectable when the VCD exceeded 9.68 × 10¹⁵ molecules cm−2 (surface concentration exceeded 1.74 μg m−3) at a TC of 20 K, while the VCD should be larger than 1.69 × 10¹⁶ molecules cm−2 (3.05 μg m−3) at 10 K [17].
The IASI NH3 retrieval dataset used in this study was produced at the Université Libre de Bruxelles (ULB), Belgium (http://www.pole-ether.fr/etherTypo/index.php?id=1700&L=1) [16,17]. And the dataset included: (1) the ammonia total column along the satellite swath path (data only for conditions with cloud cover < 25%), (2) the error on the ammonia total column, (3) the cloud cover on ground pixels, (4) the vertical profile used in the retrieval procedure, and (5) the viewing angle of the satellite. NH3 VCDs were then re-gridded to the GEOS-Chem Asian grid system with 0.5° × 0.667° resolution.

3. Numerical Model and Emission Inventory

In this study, the three-dimensional (3-D) Goddard Earth Observing System - Chemistry (GEOS-Chem) CTM (version 09-02) [26,27] was run with the full NOx-Ox-VOC-HOx-CO chemistry option to simulate the emissions, chemical reactions, and transport of tracer gases (e.g., NH3, SO2, NO, NO2, CO, and VOCs) and aerosols (e.g., black carbon (BC), organic carbon (OC), mineral dust, sea salt, and secondary inorganic aerosols). To simulate the distribution of atmospheric NH3, the physical processes of advection, diffusion, dry deposition, and wet deposition were considered [26,27]. The partitioning of NH3 and NH4+ was calculated by the aerosol thermodynamical equilibrium module of ISORROPIA II [28]. The GEOS-Chem model used the assimilated meteorological fields from the GEOS of the NASA Global Modeling and Assimilation Office (GMAO). The model had a horizontal resolution of 2° × 2.5° for global runs, and 0.5° × 0.667° for Asian one-way nesting runs (11° S−55° N, 70−150° E), with both having 47 vertical levels from the surface to 0.01 hPa. The lowest model layer thickness was approximately 130 m.
We used anthropogenic emissions data from the Emission Database for Global Atmospheric Research (EDGAR) [29] for the global domain and the Regional Emission Inventory in Asia (REAS) (version 2.1) [30] for the Asian domain. REAS NH3 emissions were modified to include seasonal variations in China and Japan based on References [20,31], respectively, and the changes in winter emission amounts as recommended by the literature [32]. This modified NH3 emission inventory, including seasonal variation, is simply referred to as REAS in this manuscript. The horizontal distribution of NH3 emission from REAS over East Asia was shown in Figure 1a, and high NH3 emissions (>15 Gg grid−1 year−1) could be found over North and central China. The model simulation covered the period from the beginning of December 2013 to October 2015. Other basic numerical settings were as reported previously [33,34].

4. Results and Discussion

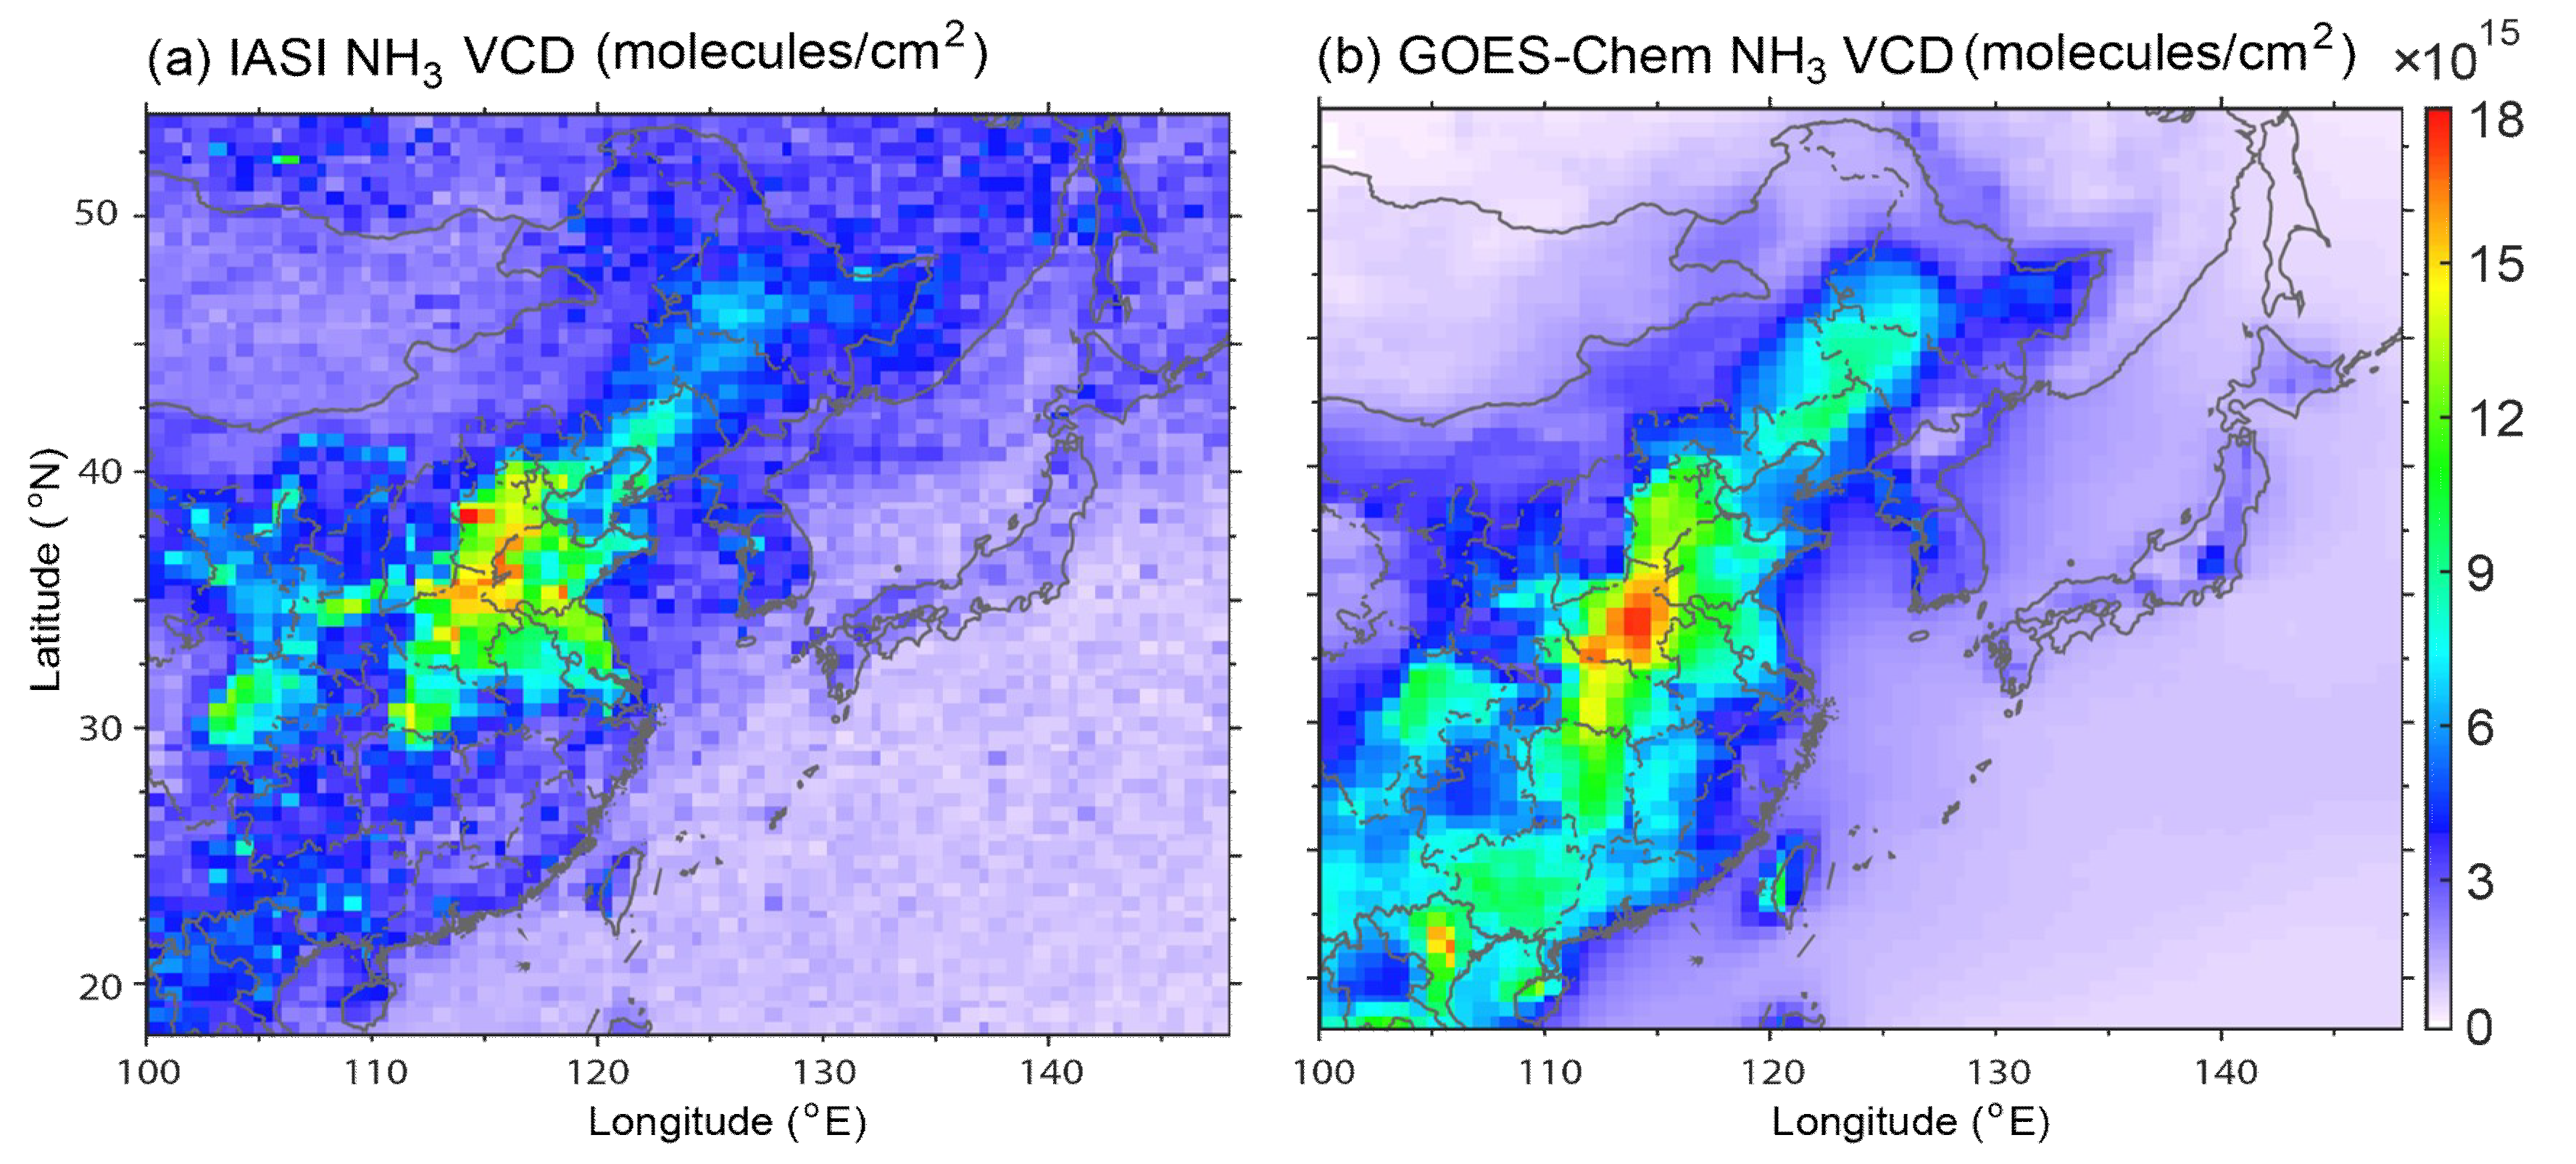
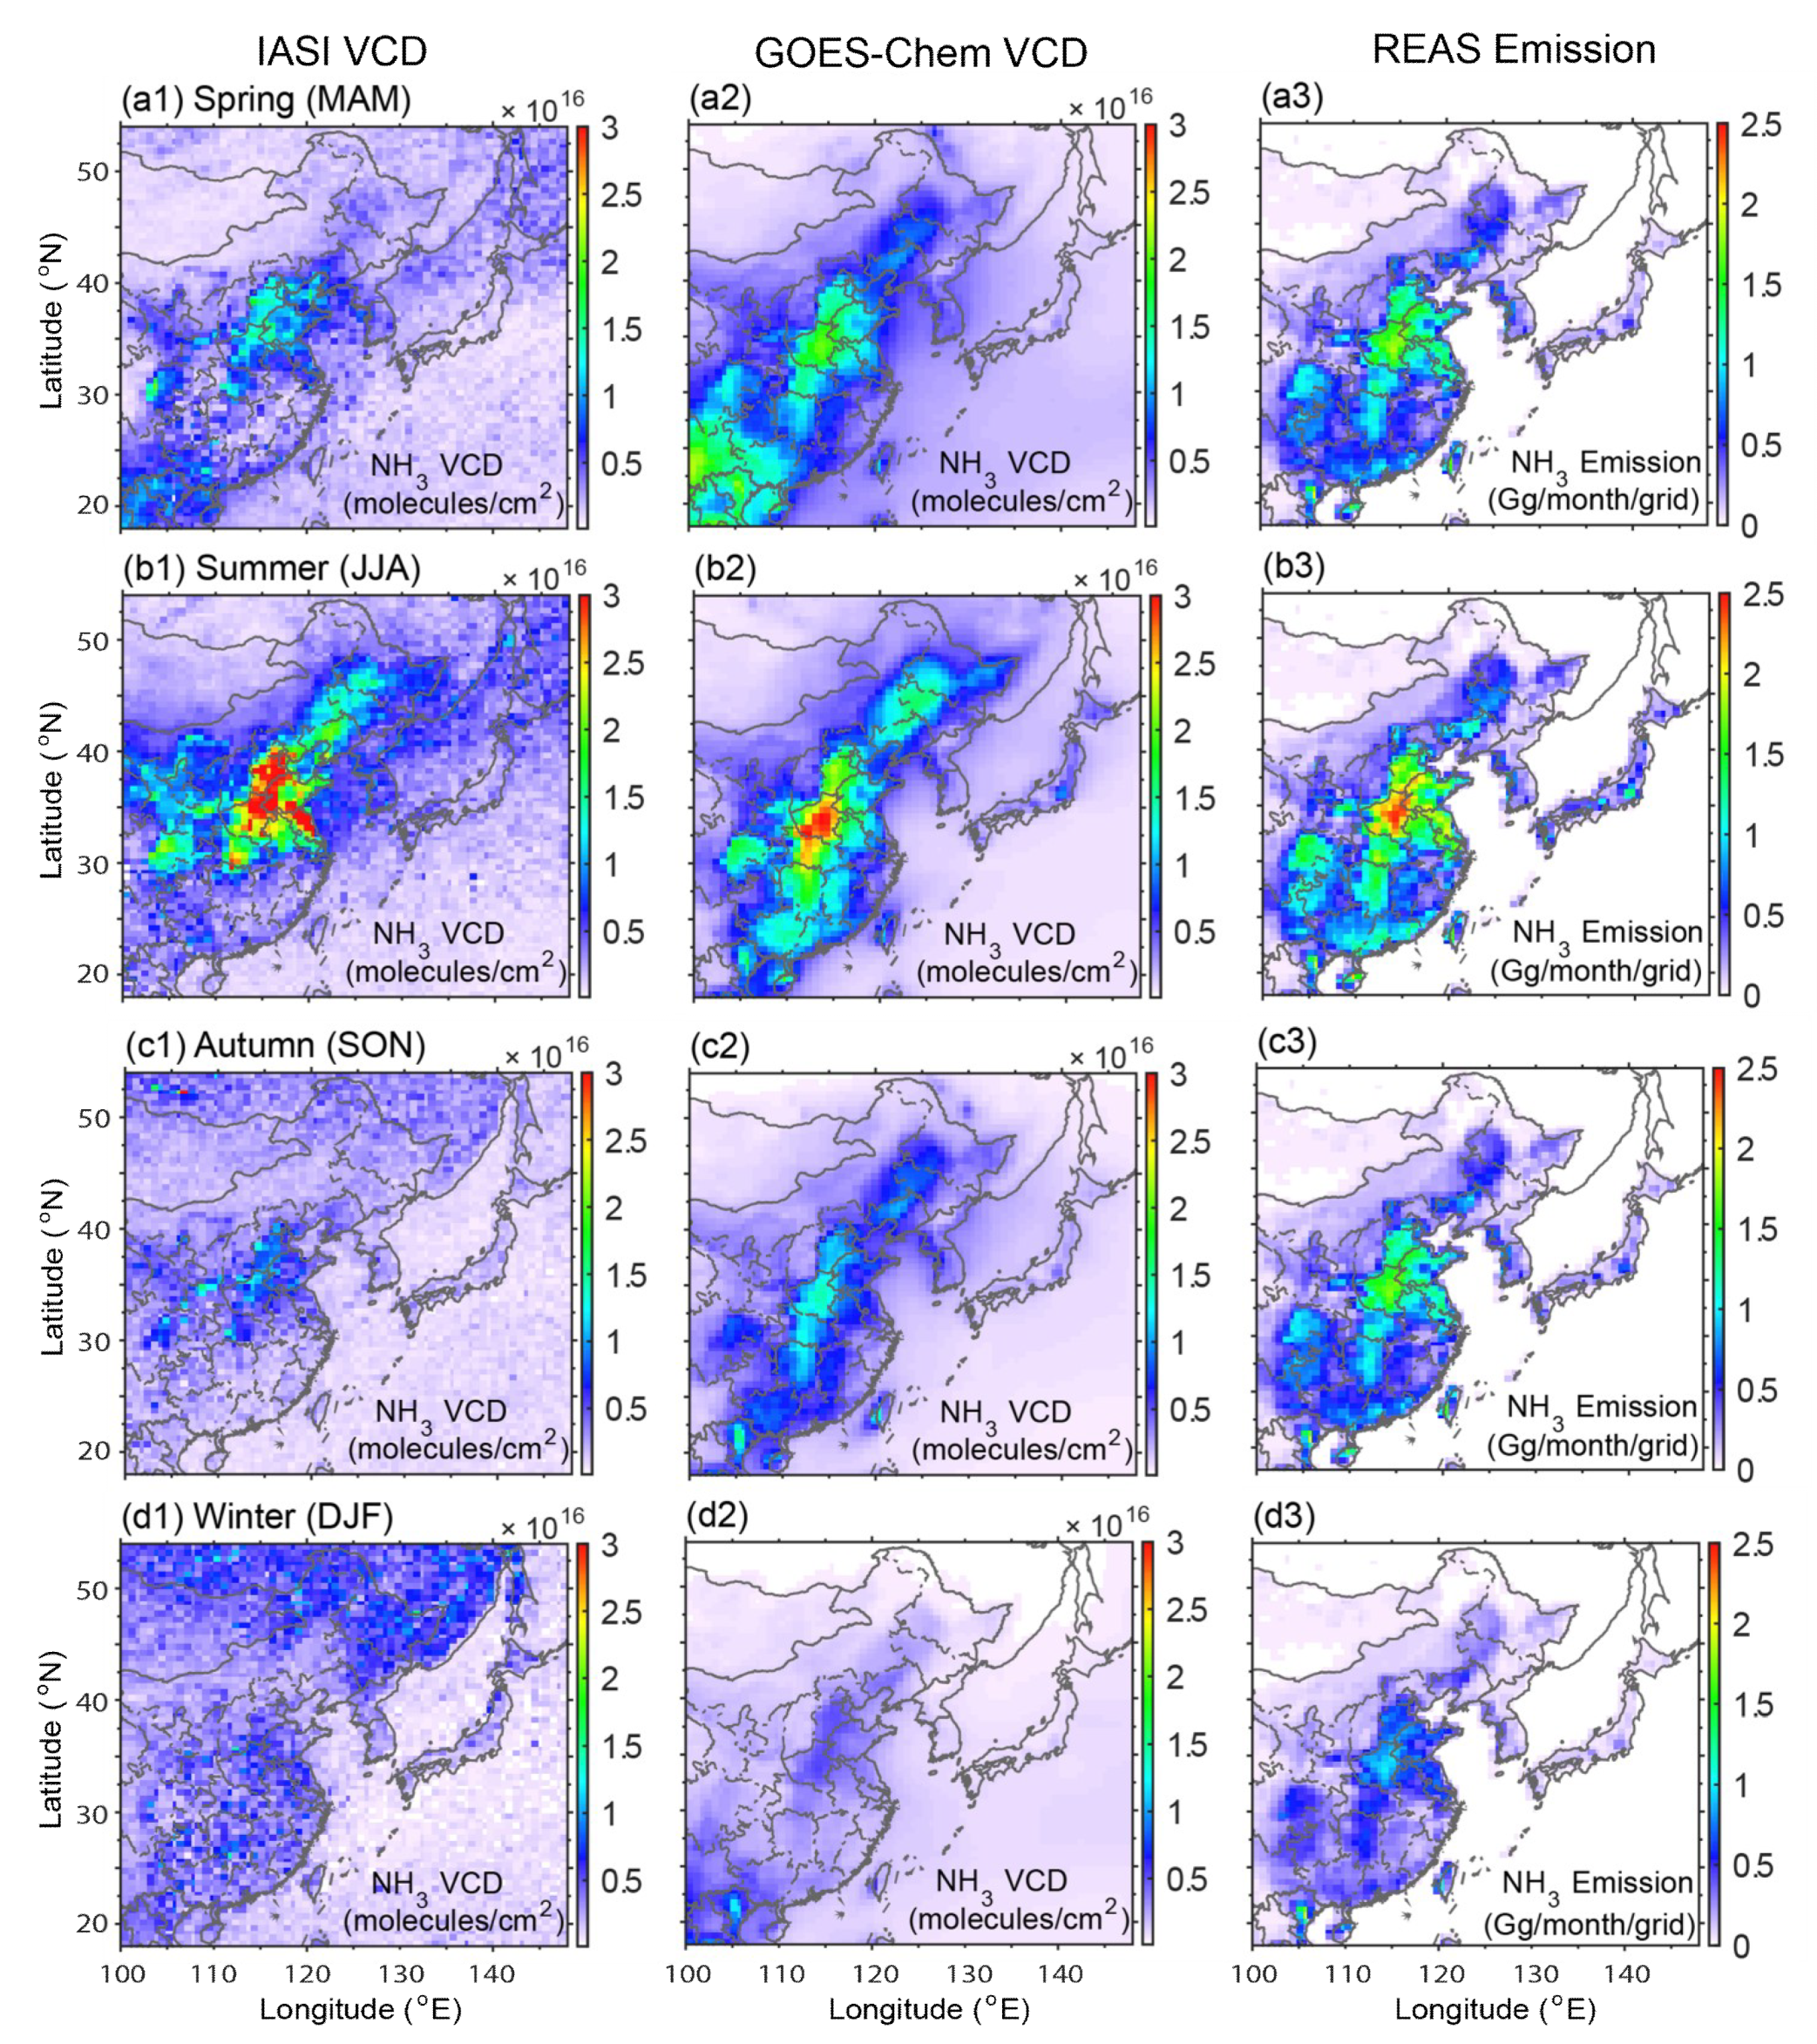
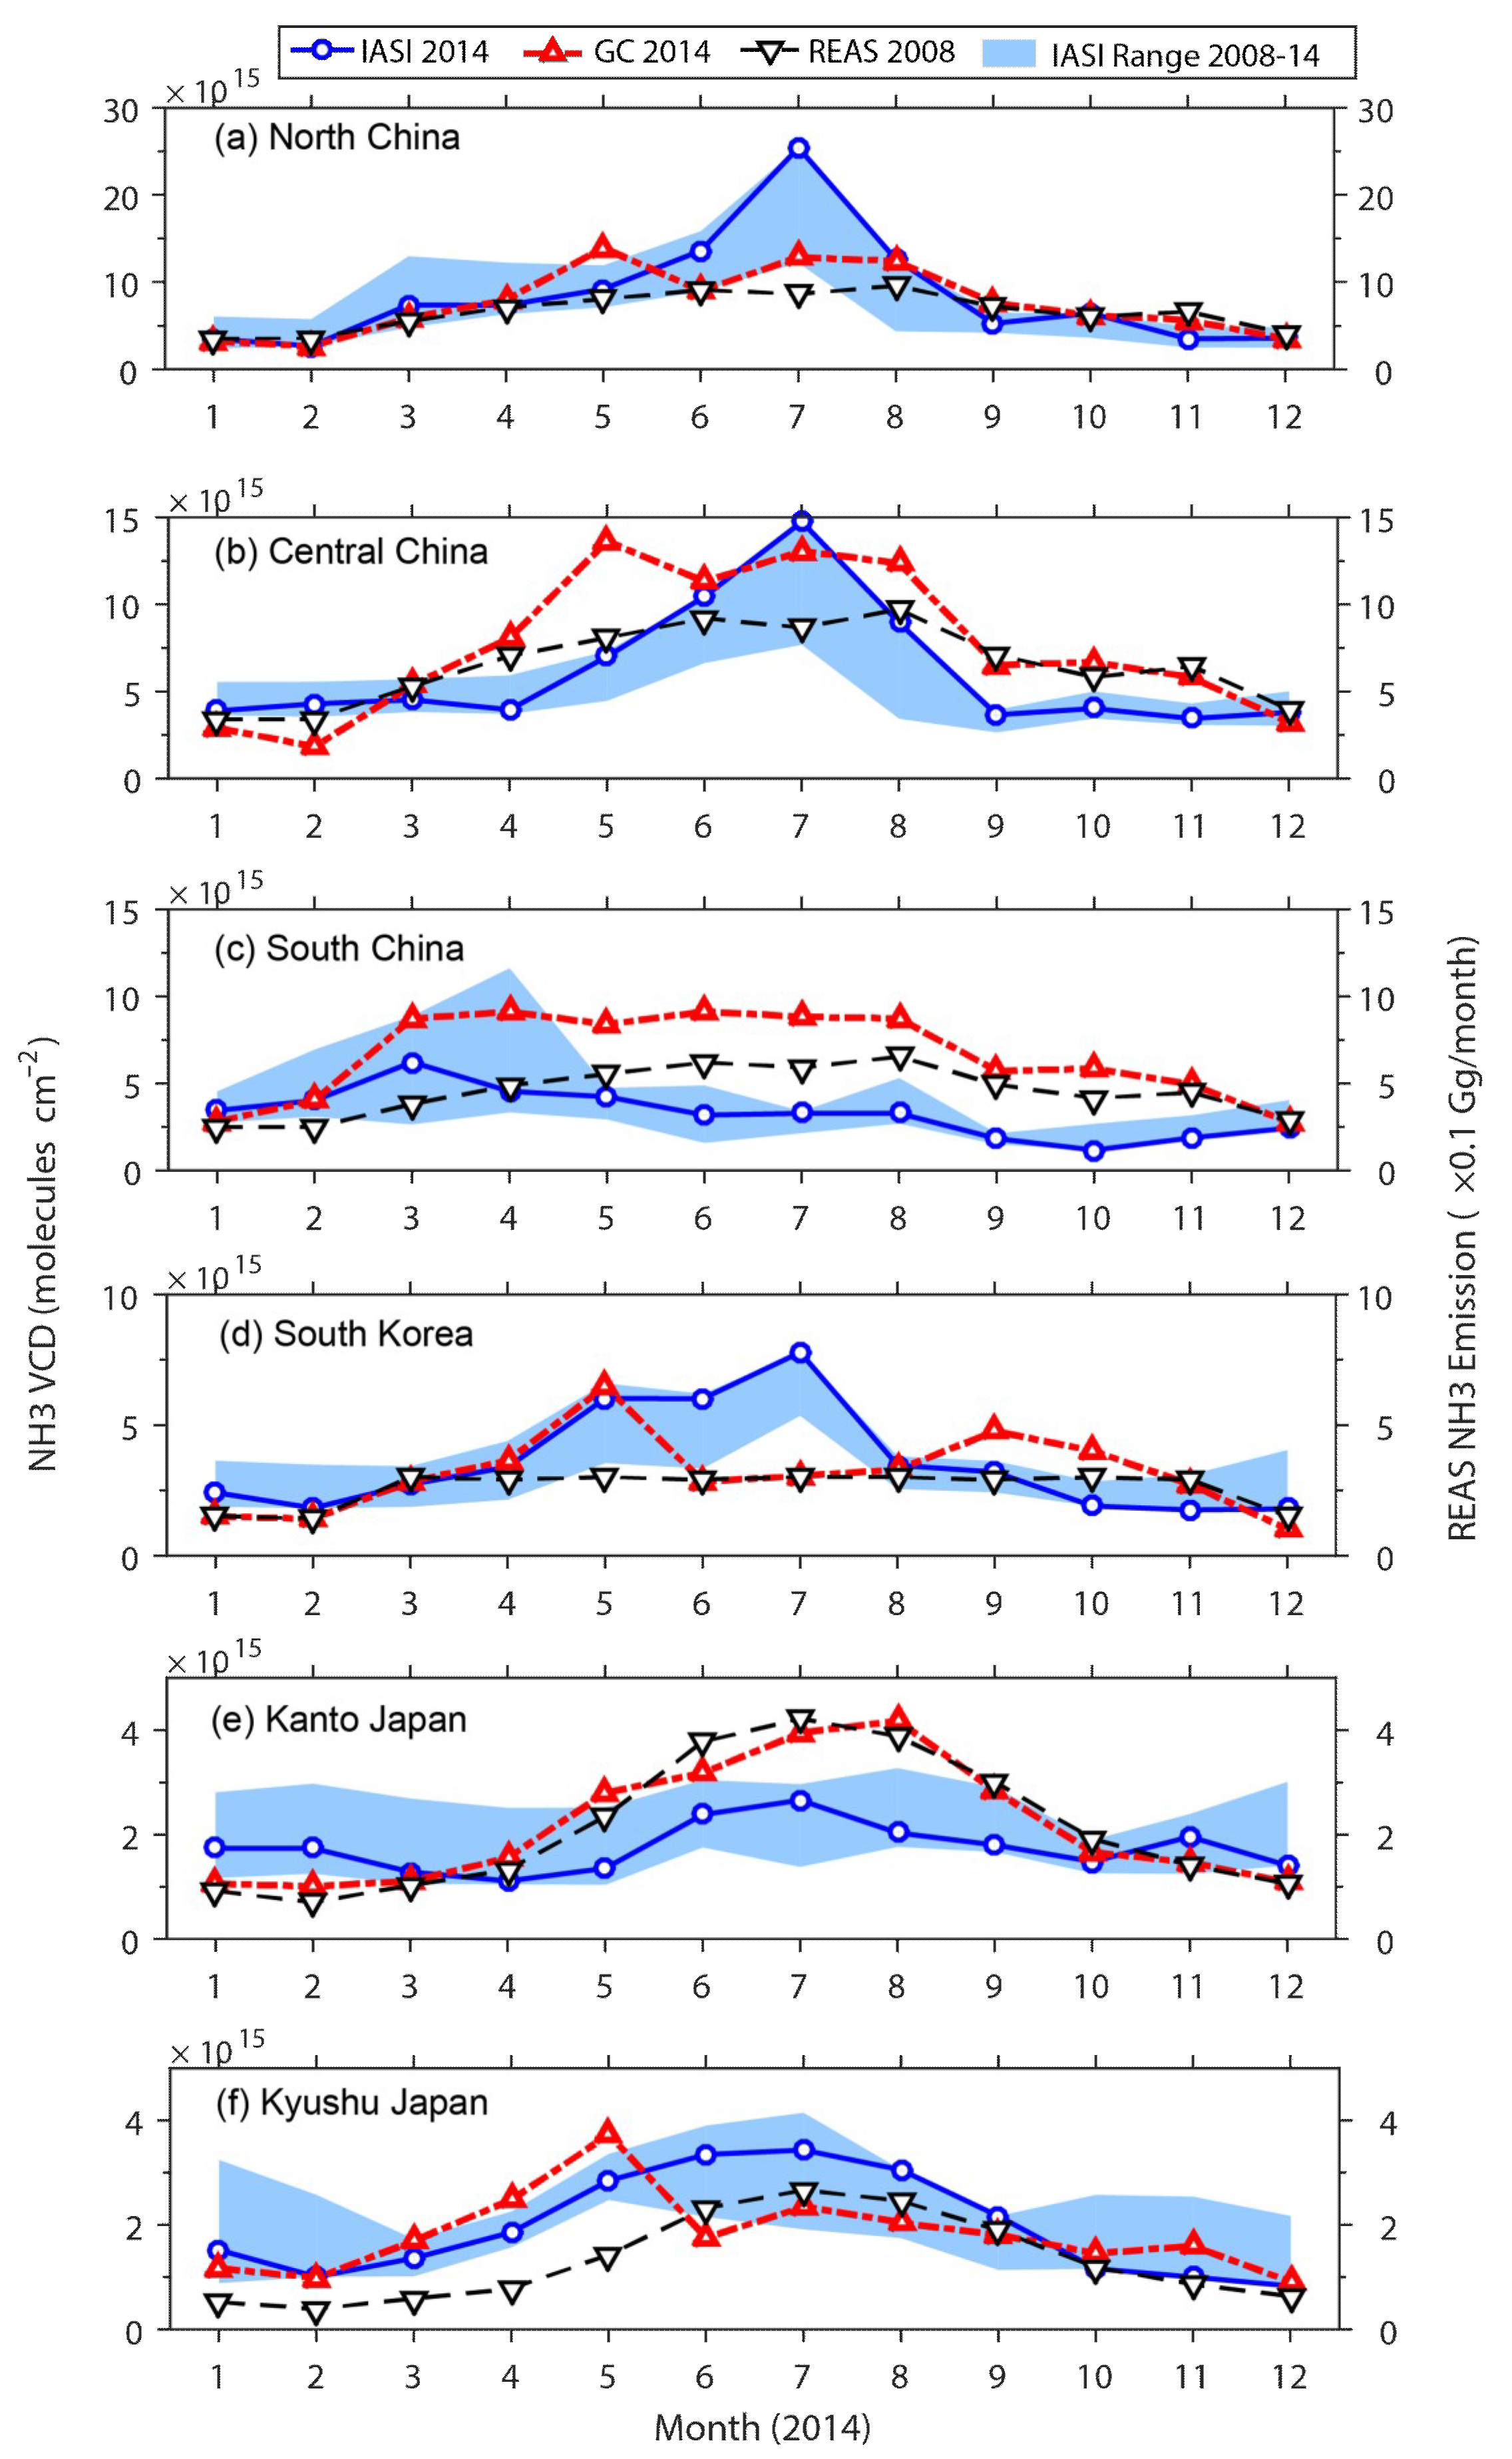
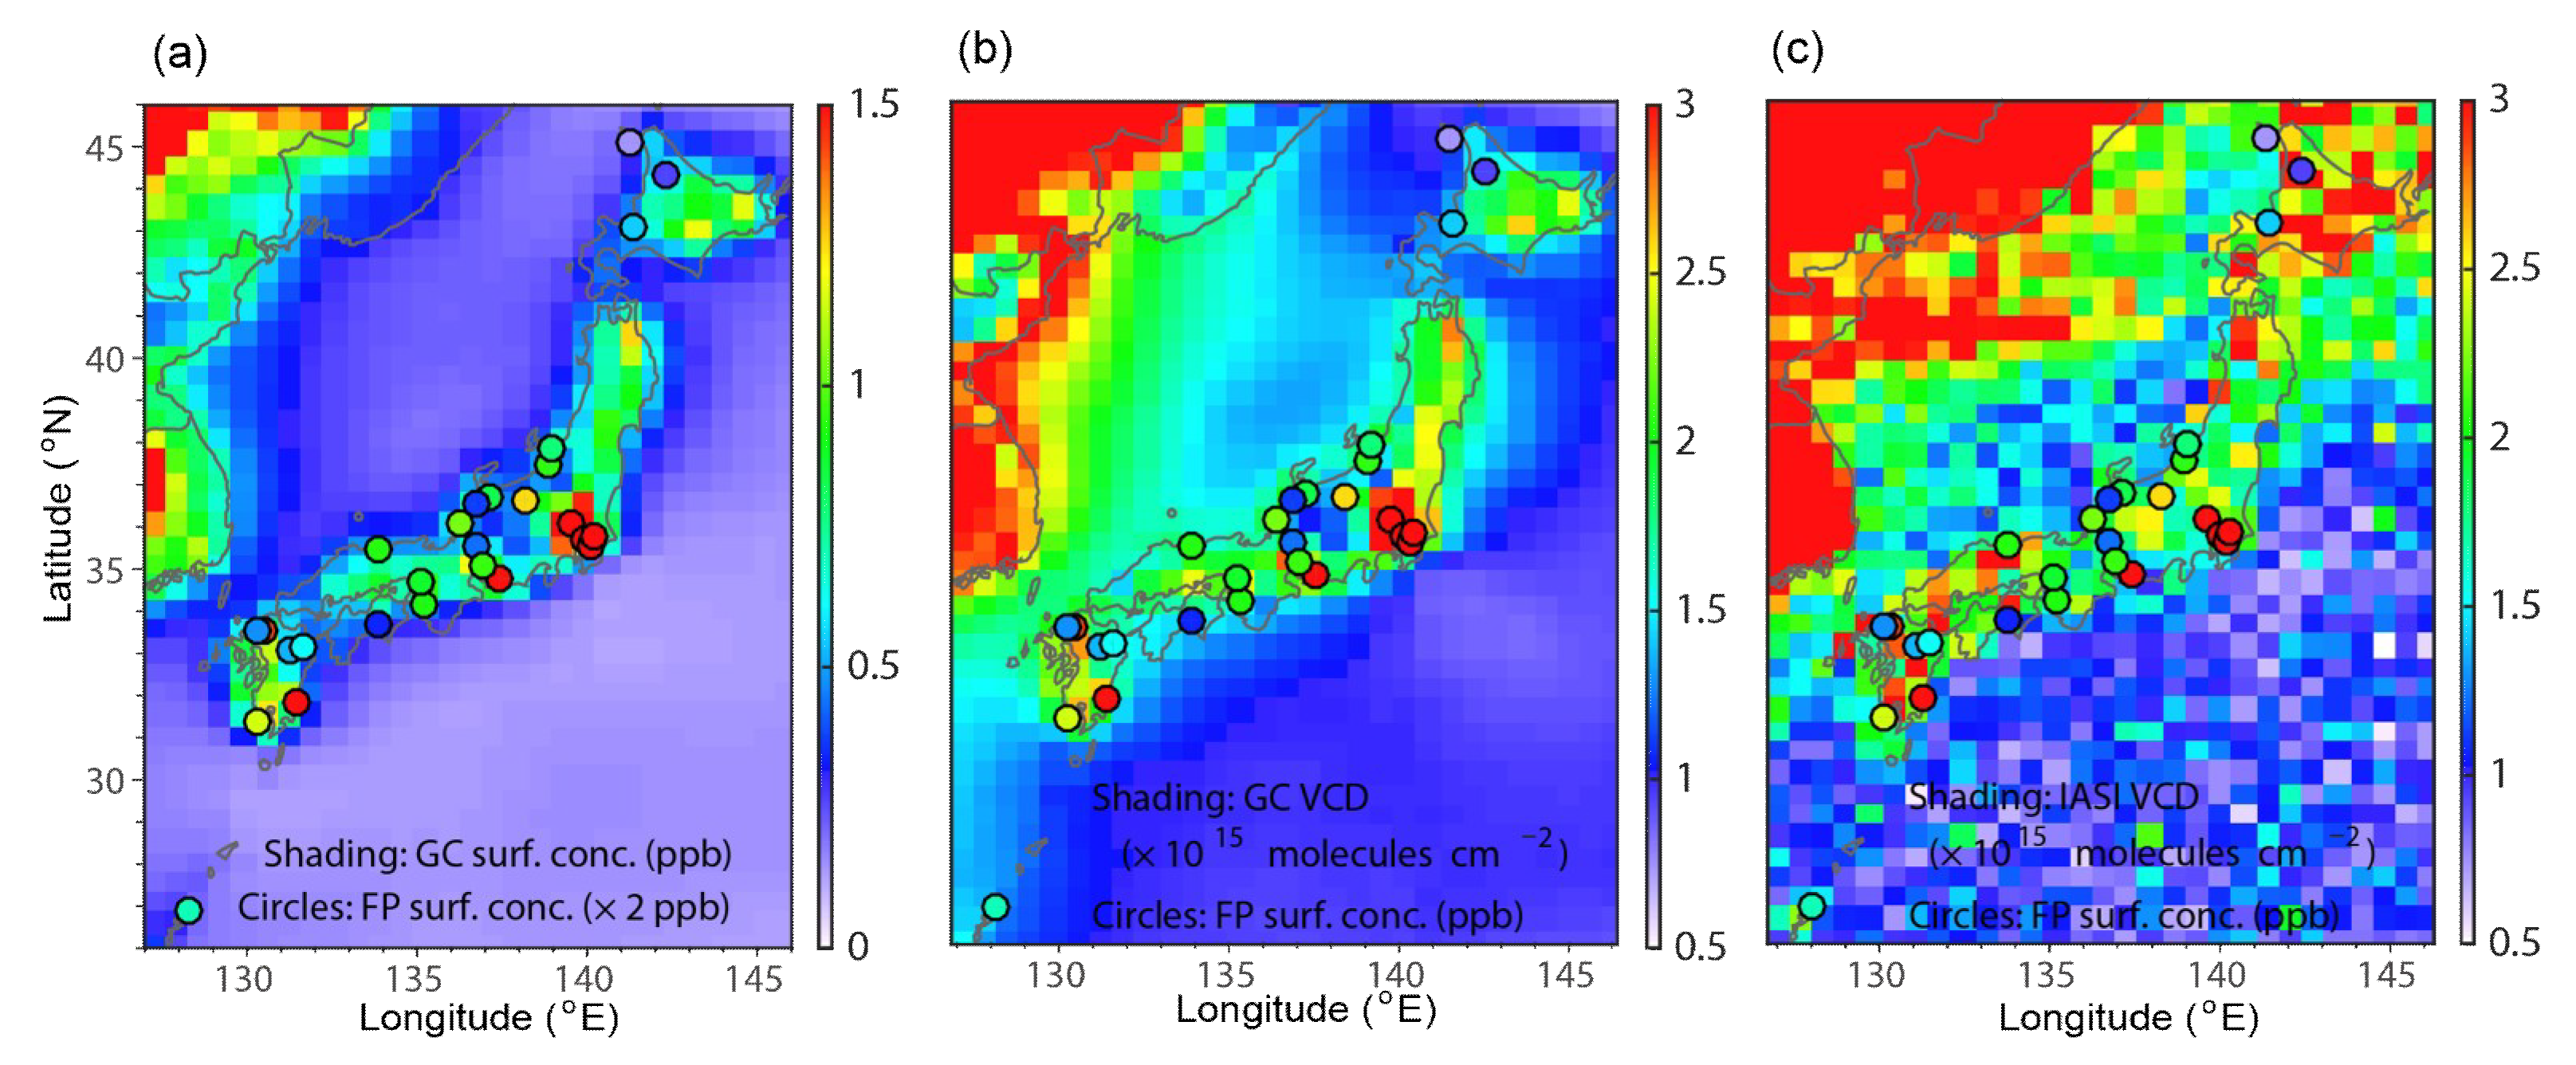
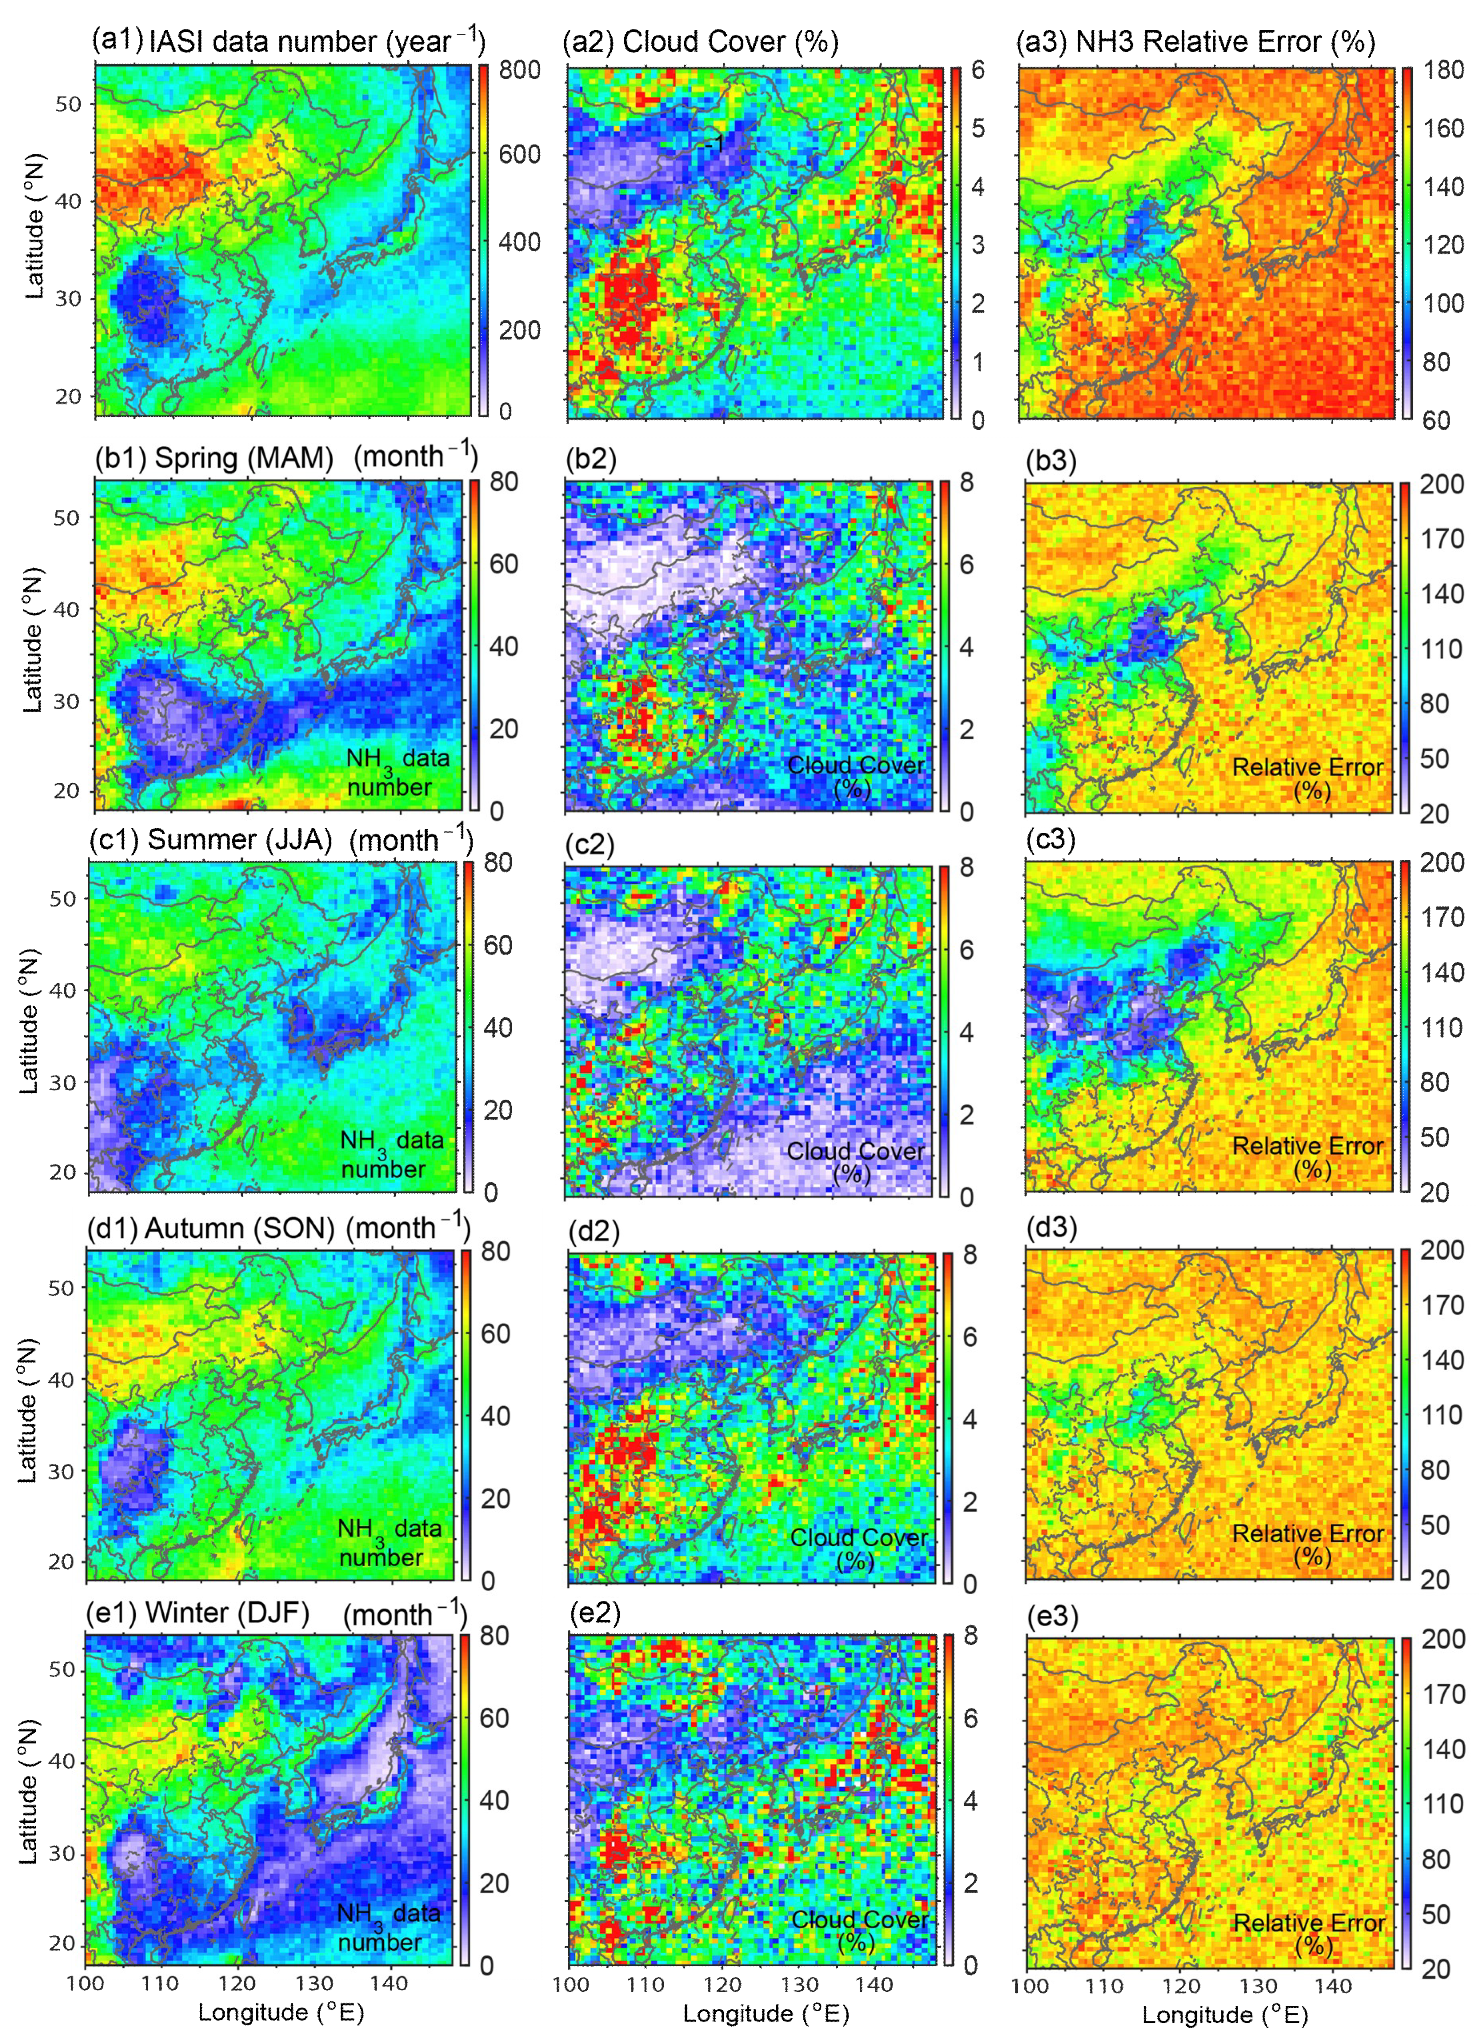
4.1. Seasonal/Horizontal Distribution of NH3 Column Density

Figure 2 shows a comparison of the annual average VCDs from IASI retrievals and GEOS-Chem model results. Figure A1 shows the number of satellite data pixels, averaged cloud cover, and relative error. Both IASI and GEOS-Chem data showed a high NH3 VCD over north (Beijing, Tianjin, and the south of Hebei province) and central (Henan and Hubei provinces) China, where the annual mean NH3 VCD could reach 1.5 × 10¹⁶ molecules cm−2. The relative errors over these regions were relatively small (<150%) due to the high NH3 value compared to other areas. Over South China, the IASI NH3 VCD was significantly lower than the GEOS-Chem value due to the small number of measurements and large relative errors resulting from high levels of cloud cover (Figure A1). The NH3 VCD was less than 6 × 10¹⁵ molecules cm−2 over all of Japan. The relative error over Japan was higher than that over central China due to the lower NH3 VCD. The IASI NH3 VCD was below or near the detection limit (as discussed in Section 2.3), except over North and central China. The horizontal distribution of GEOS-Chem NH3 VCD was consistent with REAS NH3 emissions as shown in Figure 1a, which was because NH3 is a primary gaseous tracer with a short life; therefore, the horizontal distribution of NH3 VCD was quite relevant to its sources.
Figure 3 showed the averaged IASI retrieved and GEOS-Chem simulated NH3 VCDs as well as REAS NH3 emission over East Asia in the spring (March–April–May, i.e., MAM), summer (June–July–August, i.e., JJA), autumn (September–October–November, i.e., SON), and winter (December–January–February, i.e., DJF). The horizontal distributions of the IASI and GEOS-Chem NH3 VCDs were generally similar in the different seasons, with high values over North and central China. However, the GEOS-Chem results revealed that the areas downwind of China (e.g., the East China Sea and Japan sea areas) had a higher NH3 VCD in spring than in summer, even though the NH3 VCD over China was significantly higher in summer than in spring. This indicated the importance of long-range transport of NH3 over East Asia in the cold season when northwest winds were dominant.
The seasonal variations were significant and consistent in the IASI and GEOS-Chem results, with higher peak values of about 3 × 10¹⁶ molecules cm−2 (central China) in summer and lower peak values of about 5 × 10¹⁵ molecules cm−2 in winter. The major factors affecting the seasonal variation of NH3 VCD included the seasonal variation of NH3 emissions and gas-aerosol partitioning of NH3 and NH4+. A clear summer peak for NH3 emissions can be found in Figure 3, which resulted from the high NH3 volatilization rate from the soil and livestock due to high temperatures in summer [31]. High temperatures will lead to more gaseous NH3 during the gas-aerosol partitioning process [22]. Due to the low NH3 VCD, IASI retrievals had larger relative errors (>150%) in winter over the East Asia area (Figure A1). Over the Japan area, IASI retrievals did not show a clear seasonal variation due to the large relative errors (Figure A1), while GEOS-Chem produced a higher NH3 VCD in summer than in winter.
Figure 4 shows the region-averaged monthly ISAI NH3 VCD, GEOS-Chem NH3 VCD, and REAS NH3 emission for the six regions shown by black boxes in Figure 1. North China had a clear summer peak of NH3 VCD in IASI retrievals and GEOS-Chem results, but the GEOS-Chem peak in July (1.2 × 10¹⁶ molecules cm−2) was lower than the IASI peak (2.6 × 10¹⁶ molecules cm−2), which may be due to the underestimation of NH3 emissions.
The pattern of IASI NH3 seasonal variation over central China was similar to that over North China, and the GEOS-Chem results also indicated a similar seasonal variation. However, the IASI NH3 level over North China (maximum: 2.6 × 10¹⁶ molecules cm−2) was significantly higher than that over central China (maximum: 1.5 × 10¹⁶ molecules cm−2), while the GEOS-Chem results indicated a similar NH3 level (maximum: 1.4 × 10¹⁶ molecules cm−2). GEOS-Chem NH3 levels in July were consistent with those of IASI retrievals, but were higher than IASI levels in May. GEOS-Chem NH3 results over South China were higher than IASI retrievals in spring and summer; however, the IASI data did not reveal clear seasonal variation due to the small number of measurements and large relative errors resulting from high levels of cloud cover.
The GEOS-Chem NH3 VCD over South Korea was significantly lower than the IASI levels in June and July due to no monthly variation in REAS NH3 emissions. The GEOS-Chem NH3 VCD over the Kanto region indicated a more significant seasonal variation than that revealed by IASI retrievals, and was consistent with REAS emissions, indicating the importance of Japanese domestic emissions. Over the Kyushu region, the GEOS-Chem NH3 VCD peaked in May, while REAS emissions did not, which may indicate the effect of the long-range transport of NH3 from outside Japan. Based on a sensitivity simulation by GEOS-Chem, we found that only 35% of the NH3 (in May) in the Kyushu region originated from domestic emissions.

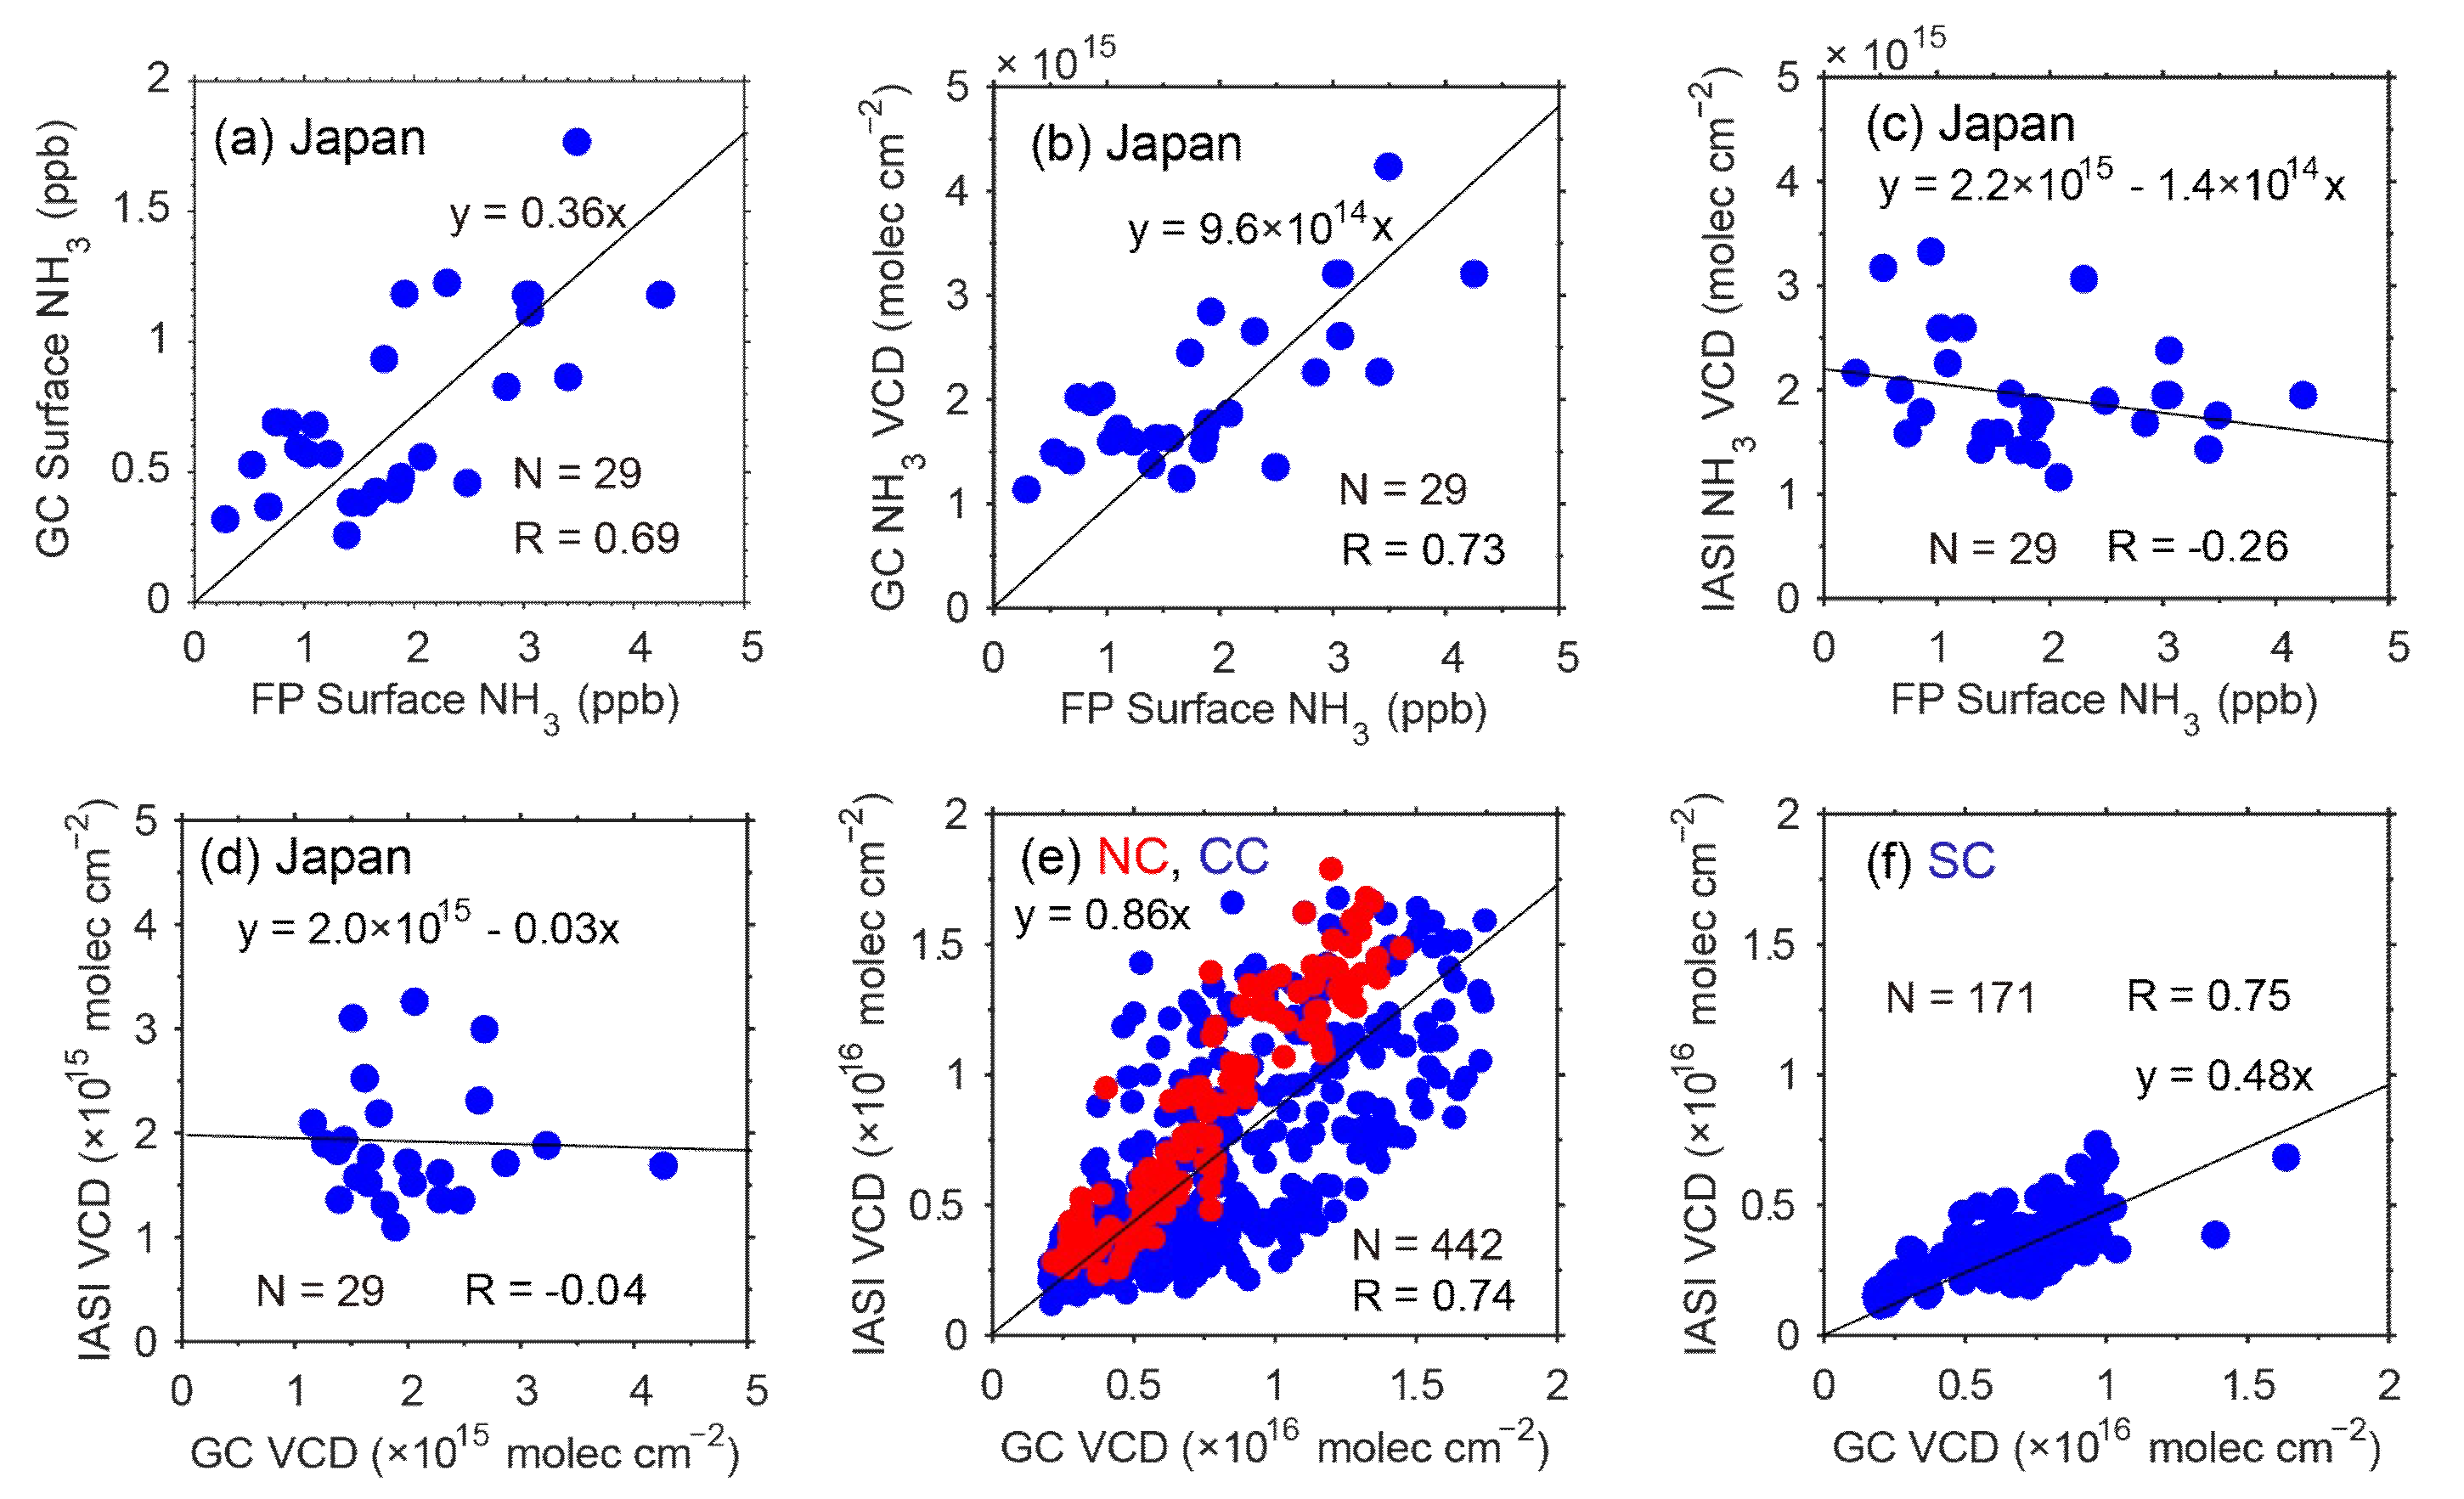
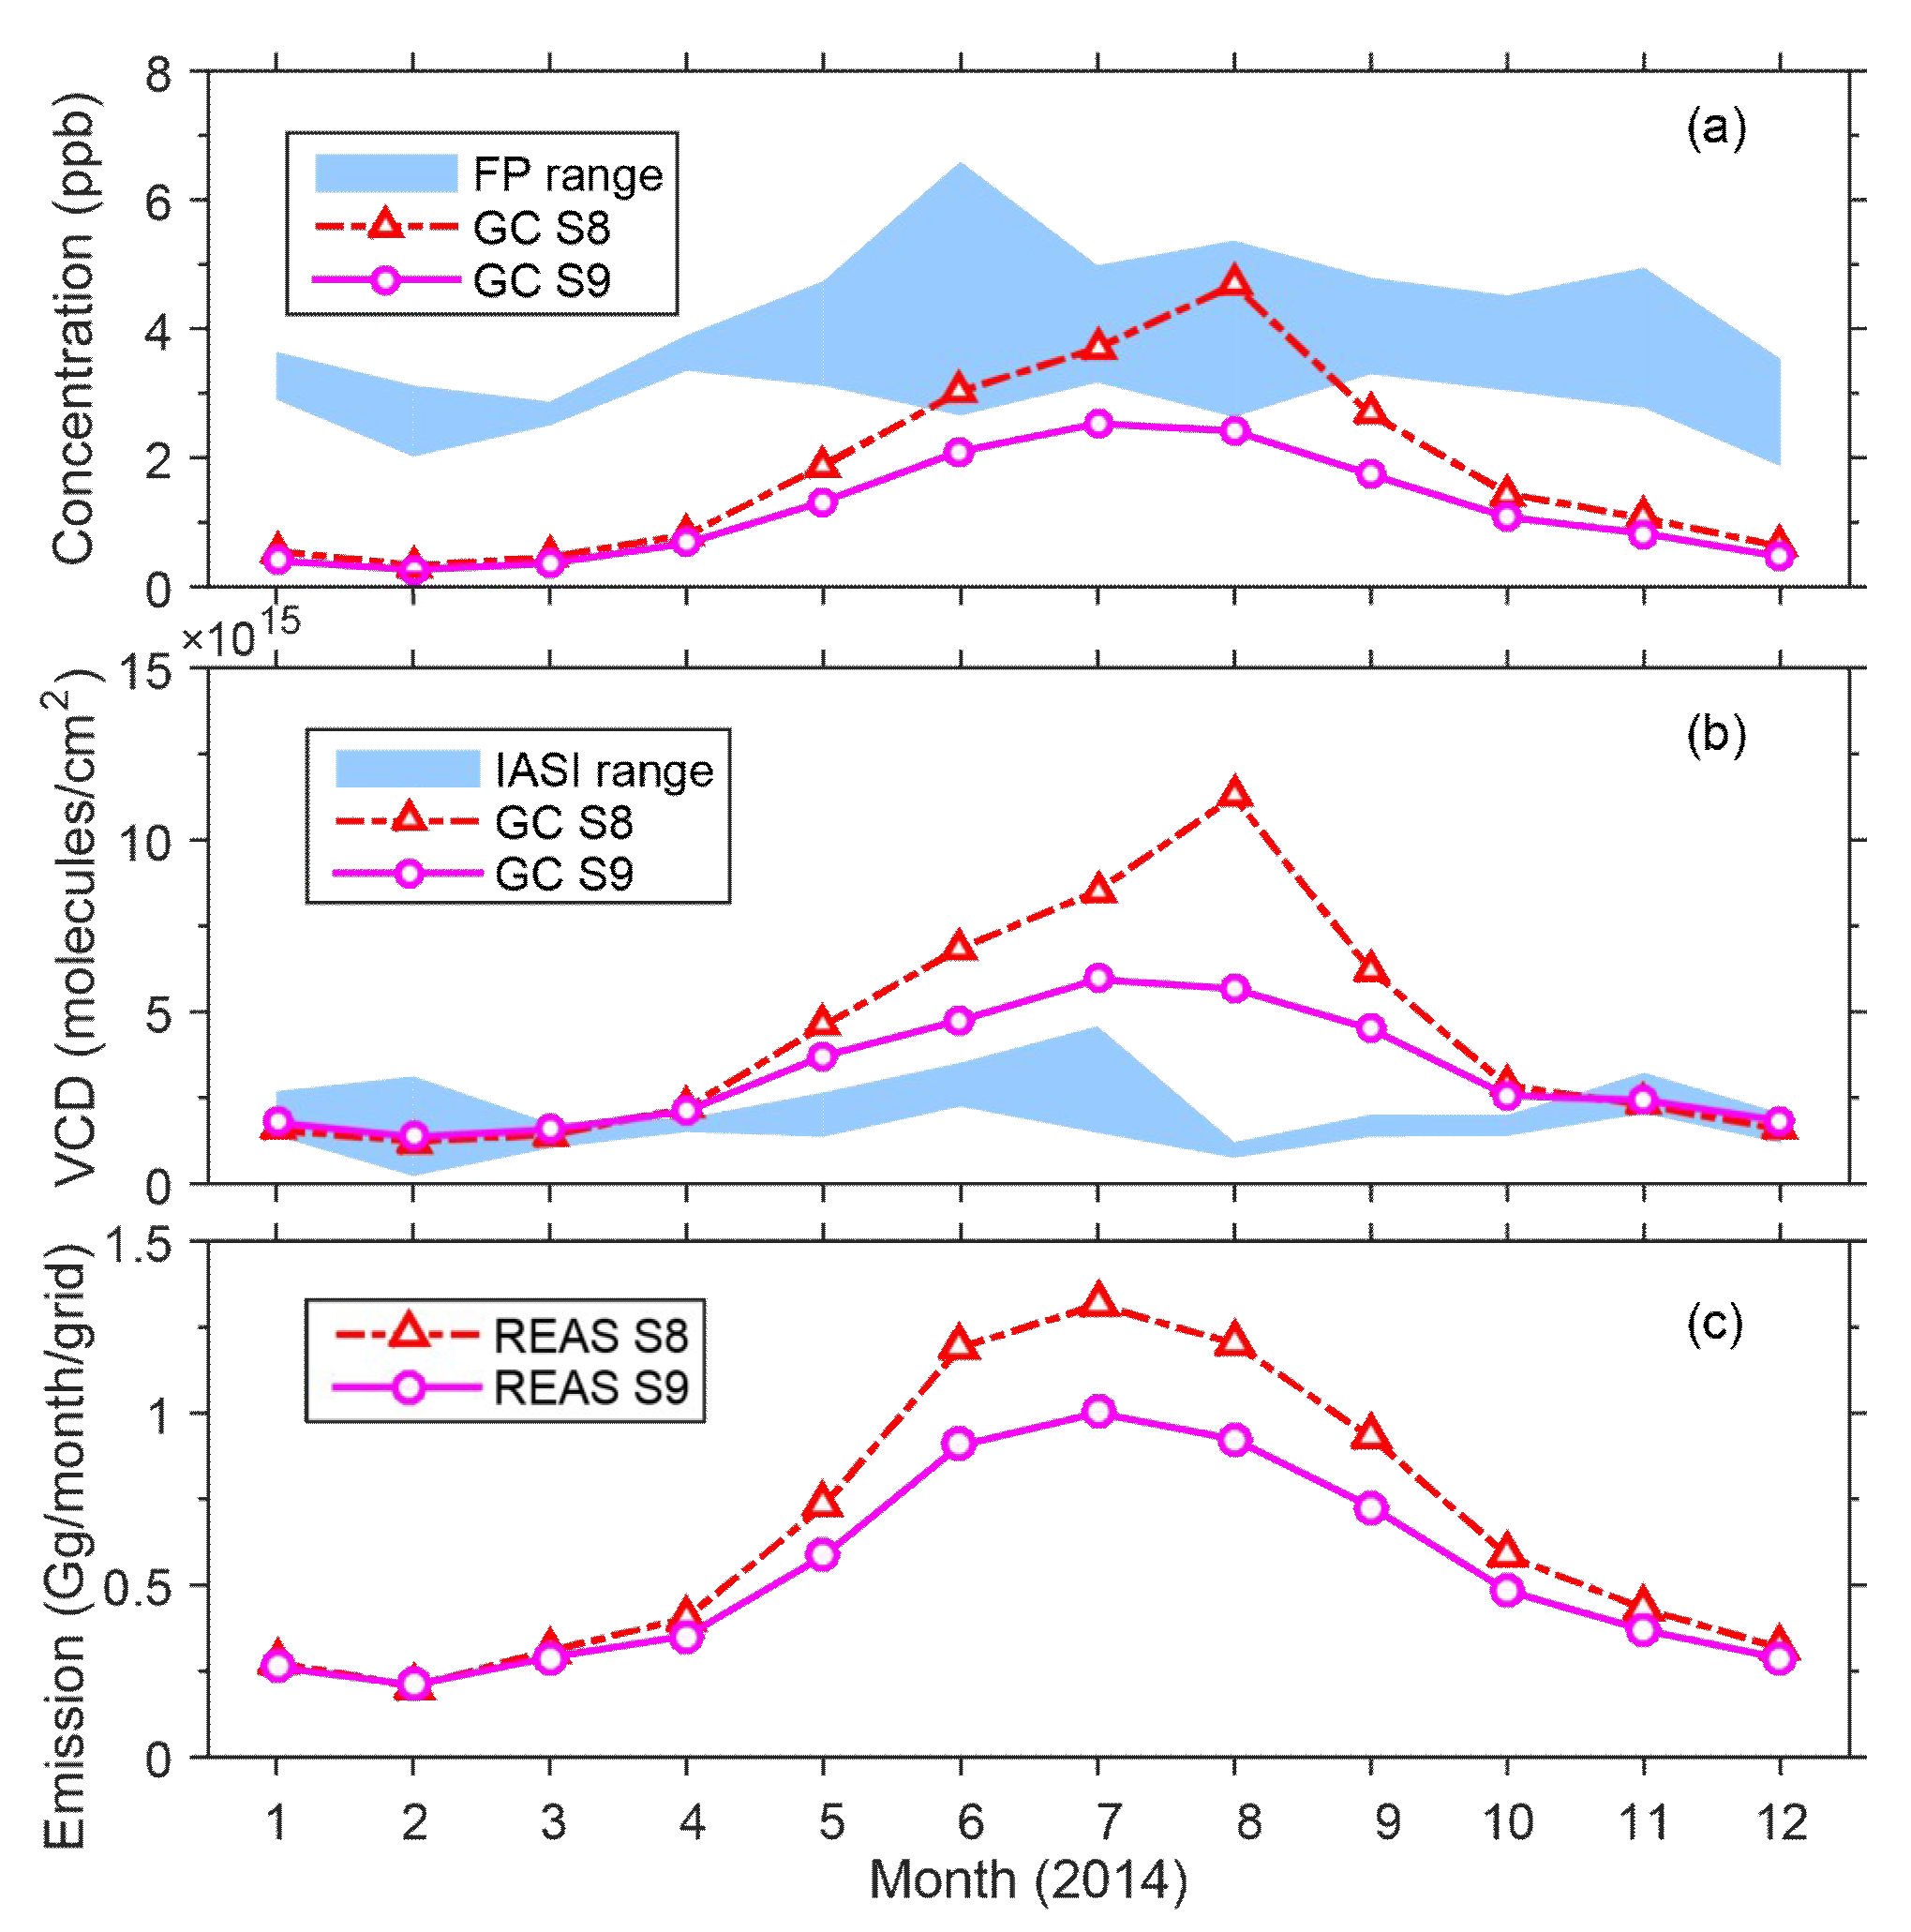
4.2. Comparisons between JELA-FP Observations, IASI Retrievals and GEOS-Chem Results

Figure 5 shows the annual averaged FP NH3 data over Japan and a comparison with IASI NH3 and GEOS-Chem NH3 VCDs. Figure 6 shows a scatter plot of (a) FP and GEOS-Chem surface NH3, (b) FP surface NH3 and GEOS-Chem NH3 VCD, (c) FP surface NH3 and IASI NH3 VCD and (d) IASI and GEOS-Chem NH3 VCDs over Japan in 2014. Figure 6 also shows a comparison of IASI and GEOS-Chem NH3 VCDs over (e) North and central China, and (f) South China.
The highest level of NH3 concentration (>3 ppb) in Japan was mainly over the Kanto region due to high anthropogenic emissions (Figure 1a). High values of FP NH3 concentration (>3 ppb) were also shown in southern Kyushu, which were due to the large numbers of livestock and high levels of fertilizer use in local agriculture. FP and GEOS-Chem results showed relatively high correlation (R = 0.69) as in Figure 6a which indicated that GEOS-Chem captured the gradient of the horizontal distribution of NH3 over Japan (e.g., high NH3 concentration over Kanto region); however, GEOS-Chem NH3 was significantly underestimated in the observations, which might be because the overall amount of NH3 emission in Japan was underestimated. A most important reason for the difference between FP and GEOS-Chem NH3 concentrations was that the GEOS-Chem concentrations represented the mean NH3 concentrations over a grid (0.5° × 0.667°, about 2500 km2), while the FP observations usually represented the NH3 concentrations over a much smaller area due to the short lifetime of NH3.
IASI data did not indicate high values over the Kanto region, but showed higher values over Hokkaido, which was a different pattern to that indicated by the FP and GEOS-Chem results in winter. Scatter plots of the IASI NH3 did not show a positive relationship with FP NH3 (the slope was negative, R = −0.26) and GEOS-Chem NH3 VCD (the slope was −0.03, R = −0.04), due to high relative errors over Japan. Scatter plots for North and central China indicated a relatively strong correlation (R = 0.74) due to there being sufficient IASI observations over these regions. There was a similar correlation (R = 0.75) over South China, although IASI retrieval was only 48% of the CTM value.
For a detailed comparison of NH3 time series, we used two sites (S1 and S2) over the northern Hokkaido Region (Figure 7) and four sites (S8–10, S13) over the Kanto Region (Figure 8). The FP data variation range of S1 and S2 for the period of 2010 to 2014 is shown in the shaded area (Figure 7a). The range of the IASI NH3 VCD variation at S1 and S2 in 2014 is indicated in Figure 7b by the shaded area.
Besides the two factors affecting NH3 VCD, as we discussed in Section 4.1, there was one more factor that could affect the seasonal variation of surface NH3 concentrations, which was the planetary boundary layer height (PBLH). The PBLH in summer was higher than in winter, which may have a dilution effect on surface NH3 concentrations. However, both the FP and GEOS-Chem NH3 concentrations showed similar seasonal variation which peaked in the summer, and the GEOS-Chem NH3 range had a reasonable agreement with FP data. This indicated that the impact of PBLH on the seasonal variation of surface NH3 concentration was much smaller compared to the impacts of emissions and gas-aerosol partitioning.
The winter peak in IASI data (January to March) was unexpected and might be due to the large relative error and limited observation data as a result of relatively large cloud cover (Figure A1). The GEOS-Chem results still showed a summer peak which was constant with the seasonal variation of surface NH3 concentrations.
Figure 8 shows similar information for the Kanto area. FP data for various sites (S8, S9, S10, and S13 for 2014) are shown in the shaded area, and these 4 sites are located in 2 grids in GEOS-Chem; therefore, only GC S8 and GC S9 are shown in Figure 8. The FP average was higher than the GEOS-Chem average (i.e., GEOS-Chem was underestimated), but both displayed a clear summer peak (seasonal cycle). Both FP and GEOS-Chem data showed a peak in August, but IASI data did not show a peak at the same time, and the peak of REAS emission was July. The IASI results in August indicated very low levels and did not show a significant summer maximum, which may also be due to a large relative error.

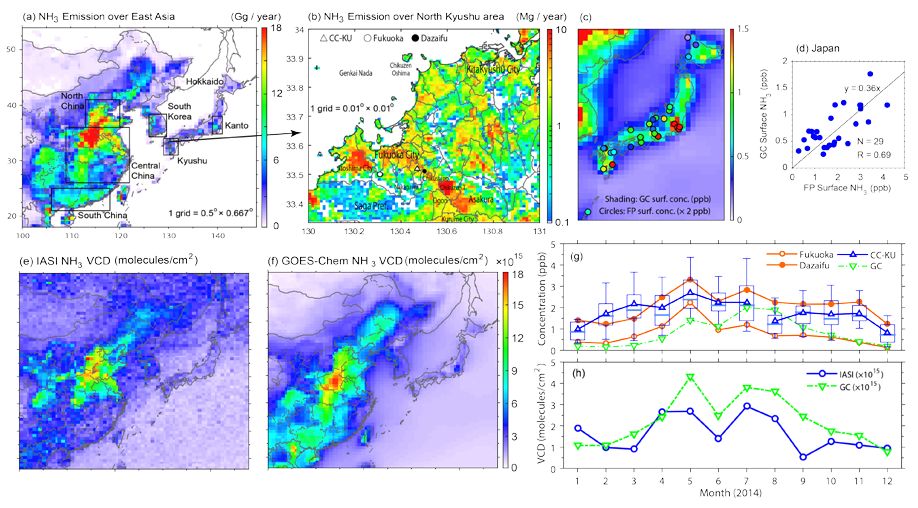
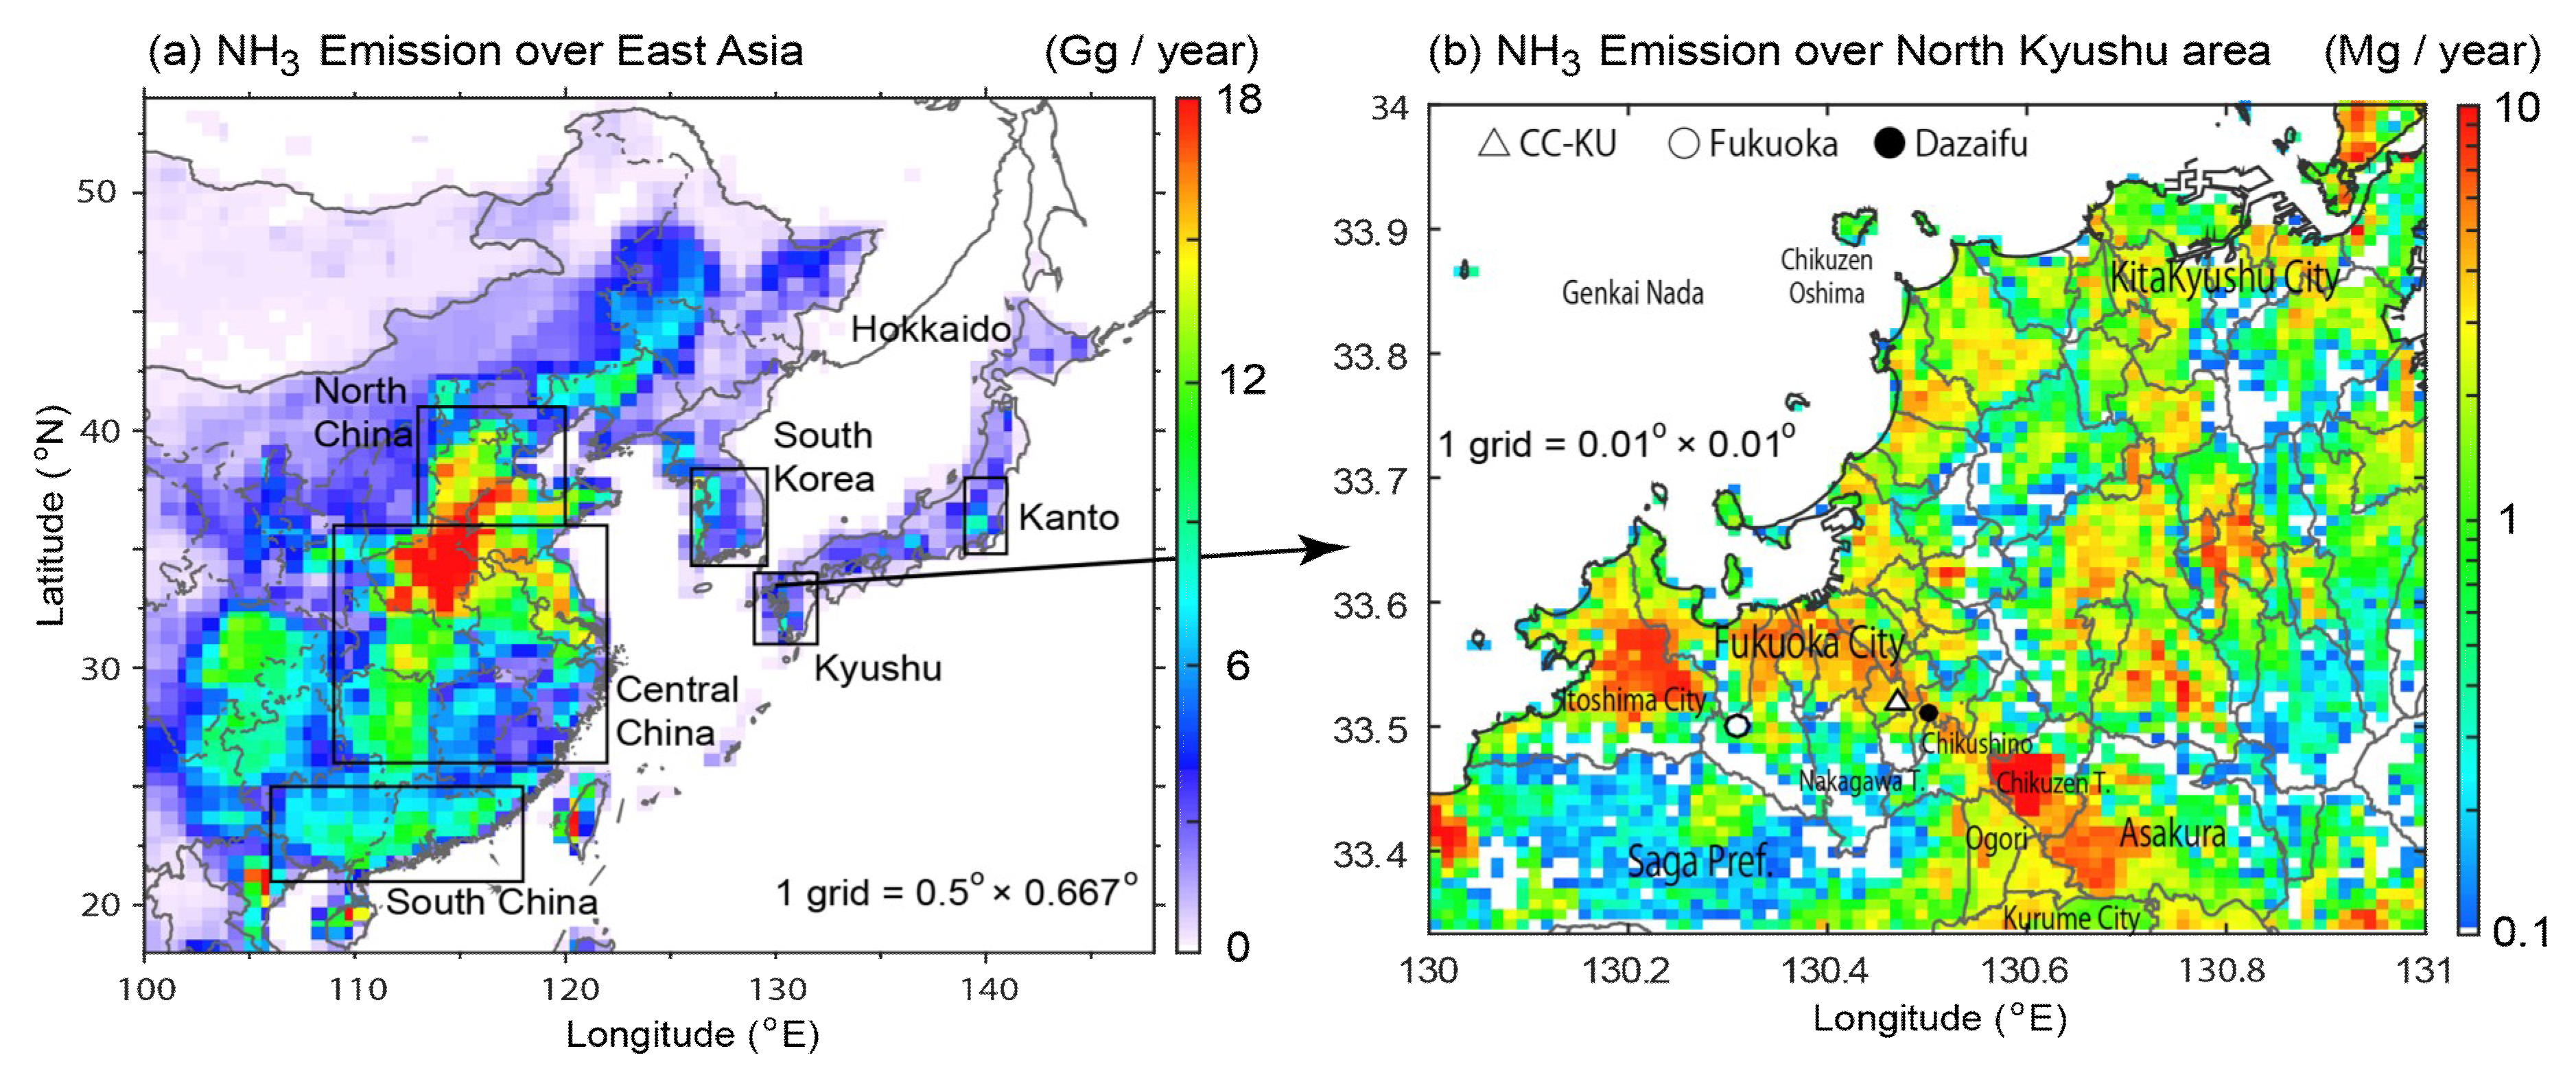
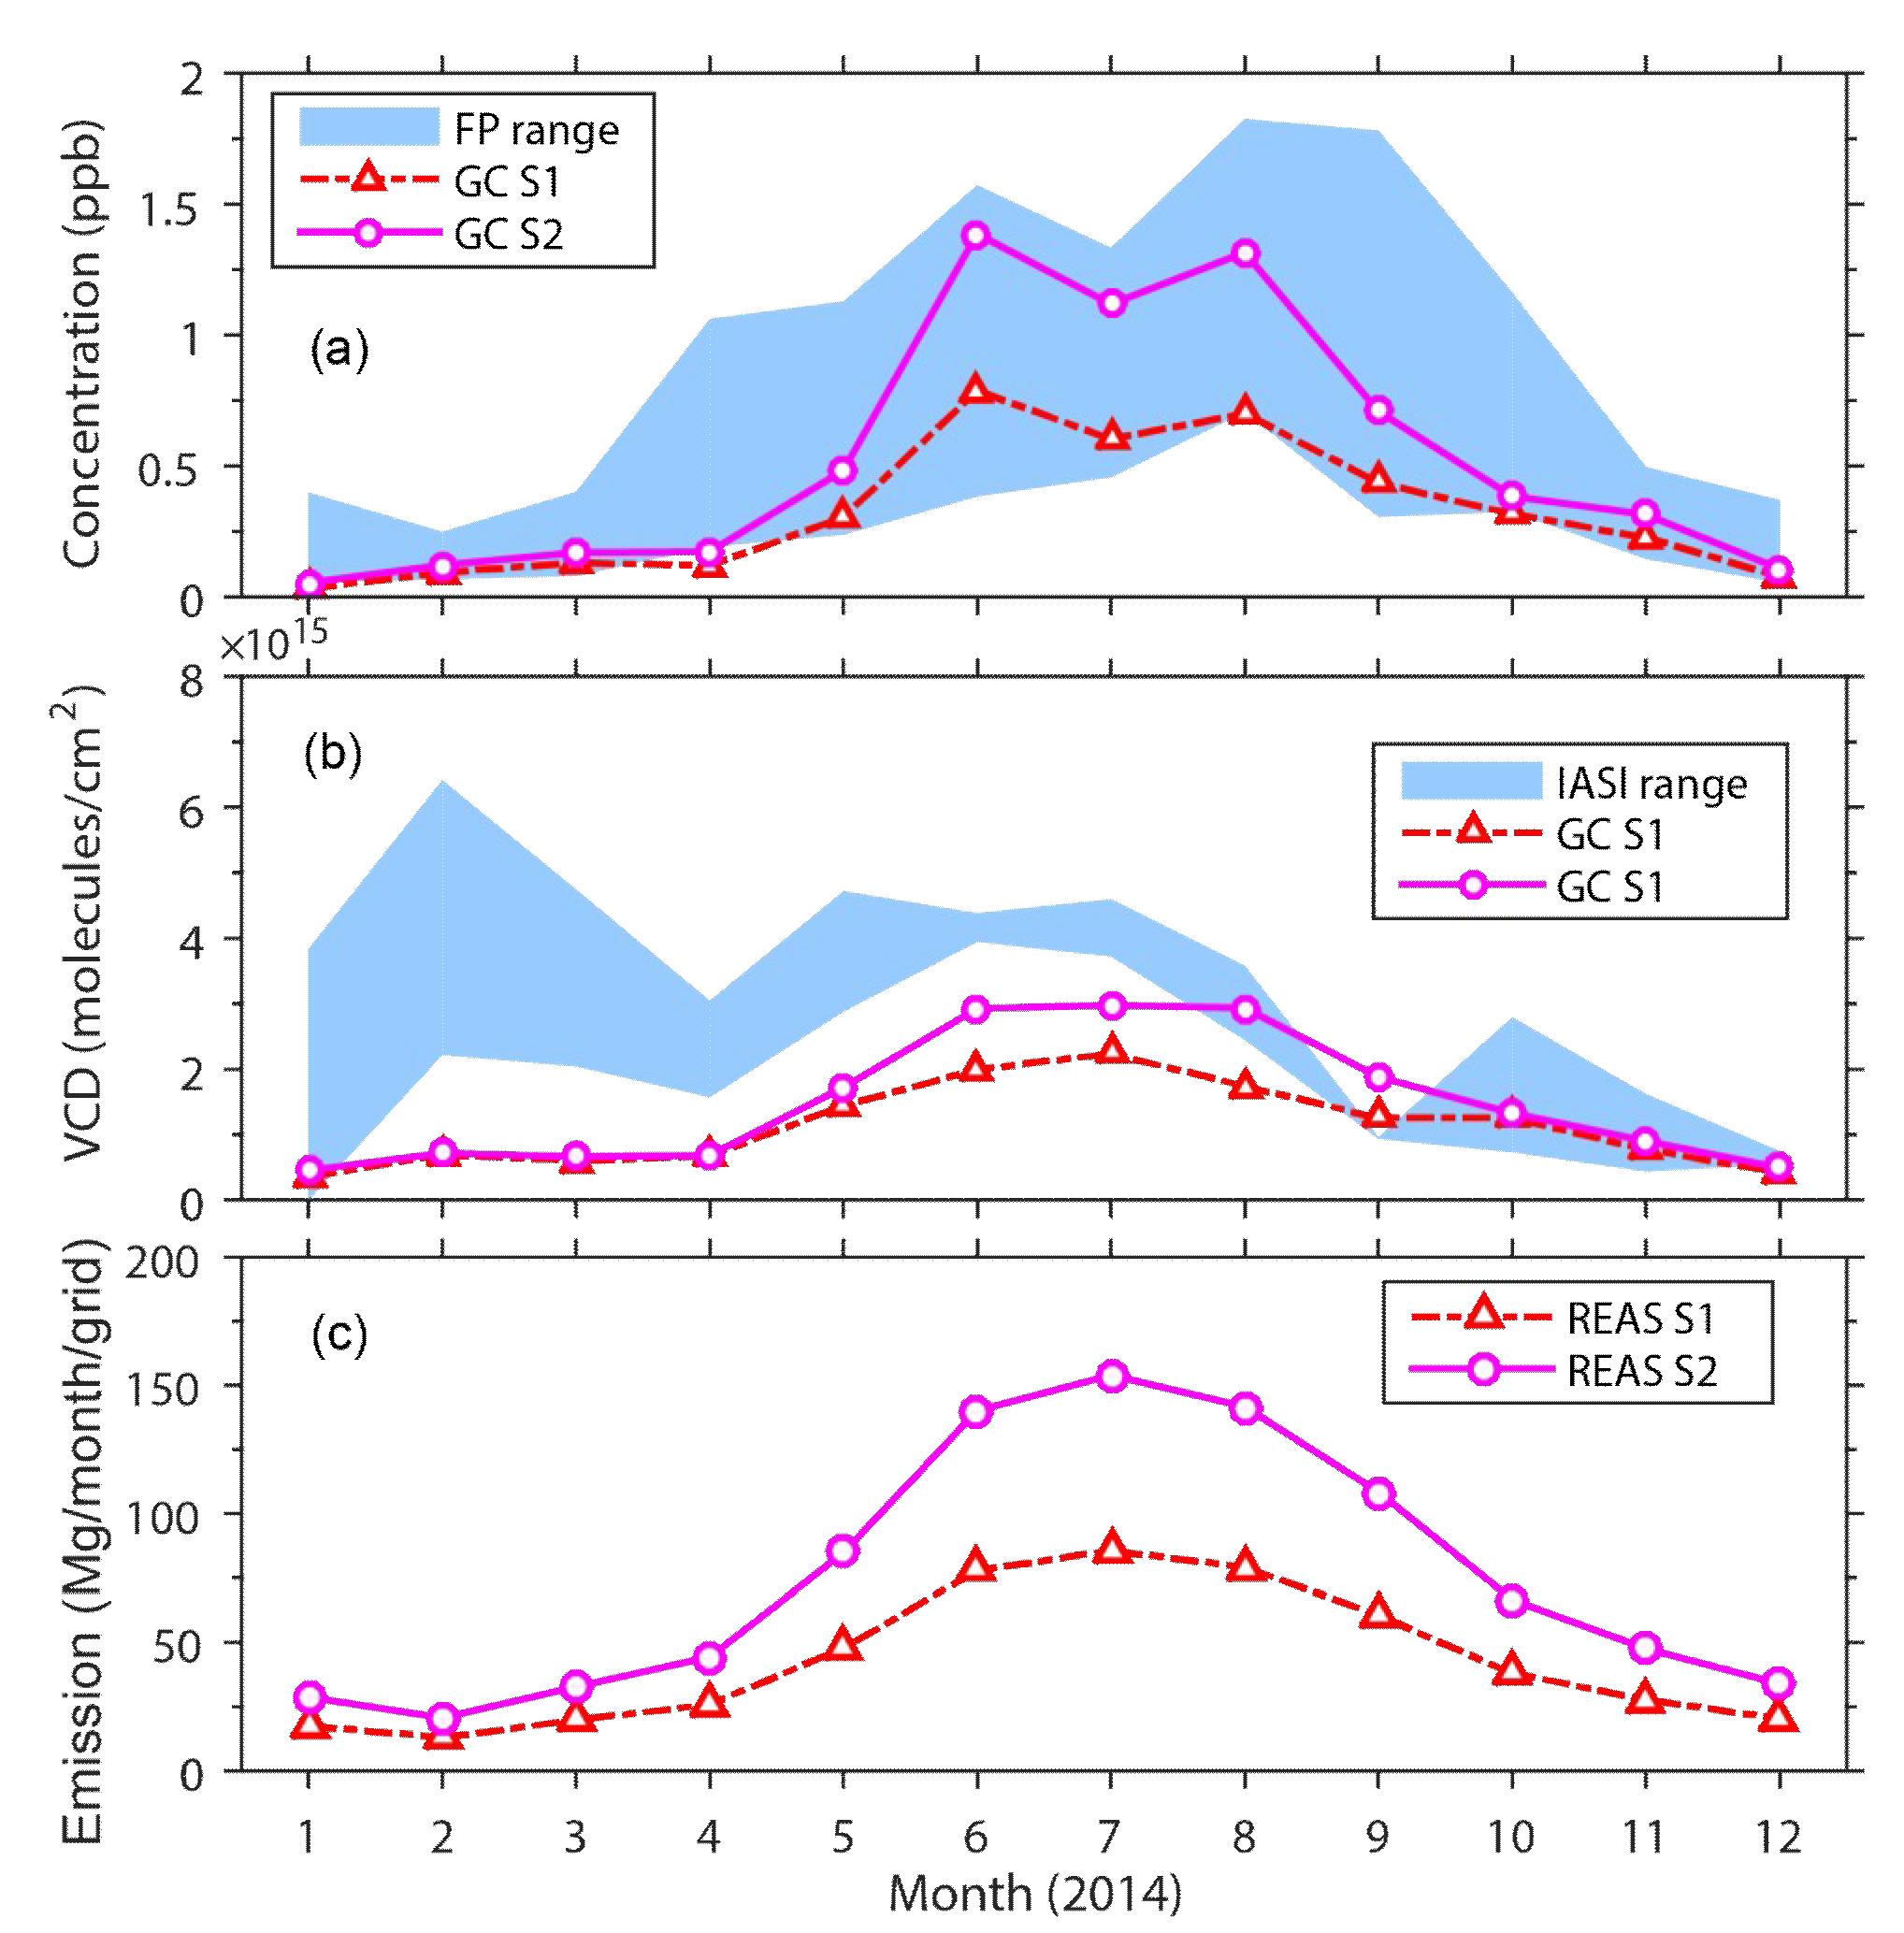
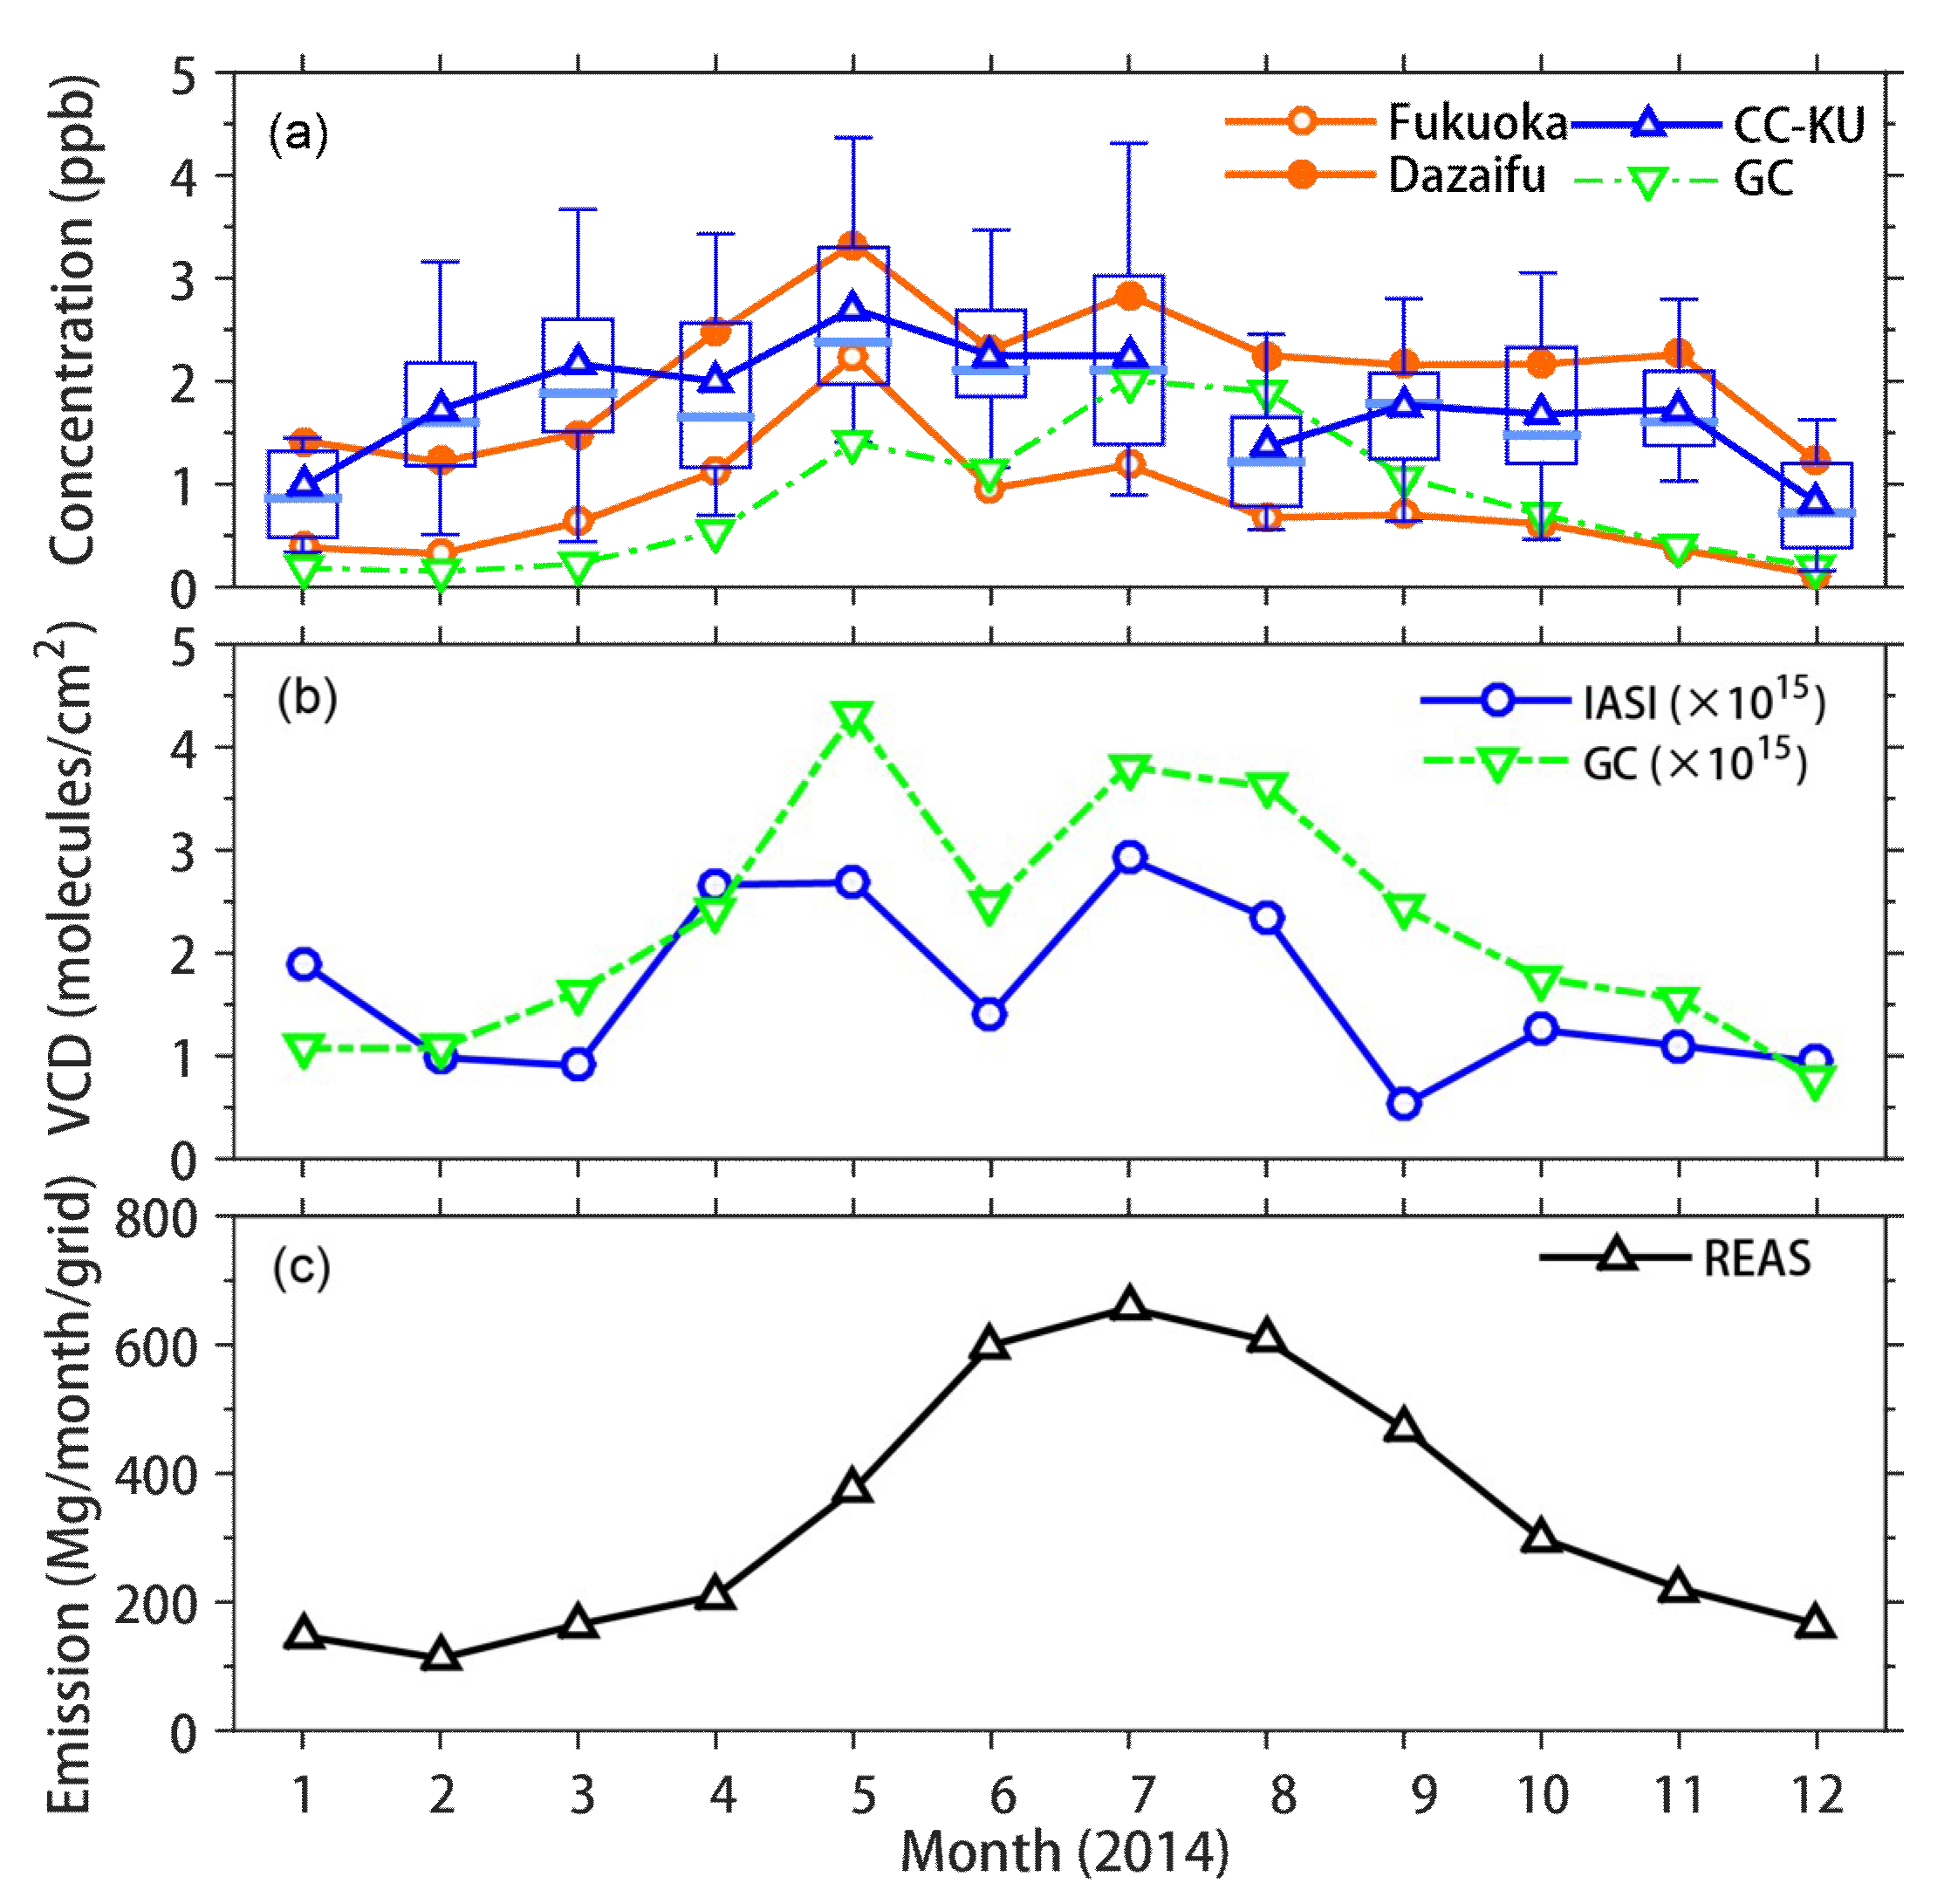
4.3. Impact of Local NH3 Emissions at the Dazaifu and Fukuoka Sites

FP observations in Fukuoka Prefecture were conducted at two sites. S26 (Dazaifu) was located near the CC-KU site, while S27 (Fukuoka) was located in a rural area of Fukuoka city (about 13 km southwest of the Fukuoka City downtown area and surrounded by small forest), and therefore was not significantly influenced by human activities. The locations of these three sites are shown in Figure 1b. Figure 1b also indicated that the NH3 emissions were quite different in these three sites. The emission rates at the Dazaifu, CC-KU, and Fukuoka sites were 3.68, 2.22, and 0.26 Mg km−2 year−1, respectively.
Figure 9a shows FP data for Fukuoka and Dazaifu for 2014 and a box-whisker plot of NH3 measurements at CC-KU (monthly data for January–July 2015, and August–December 2014 was used to show the seasonal cycle). Figure 9b,c show a comparison of IASI and GEOS-Chem NH3 VCDs over Fukuoka and REAS NH3 emissions used for GEOS-Chem simulations, respectively (the horizontal resolution of the REAS emission inventory was approximately 50 km; therefore, the three sites could not be distinguished). The FP NH3 levels were highest at Dazaifu (S27), which was slightly higher than CC-KU and was 2–3 times higher than Fukuoka (S26). This indicated that differences in local NH3 emissions surrounding the observation site can significantly affect the observed NH3 concentrations, although the three measurement sites were located in the same GEOS-Chem grid. Therefore, higher resolution simulations were necessary to reproduce the horizontal distributions of NH3 in urban areas.
Both the NH3 surface concentration and VCD produced by GEOS-Chem displayed peaks in May and July. The peaks in GEOS-Chem NH3 surface concentration and VCD occurred in different months. The GEOS-Chem surface concentration peaked in summer, while the GEOS-Chem VCD peaked in May. This may be because the long-range transport of NH3 occurs in elevated layers in spring. The variation of IASI NH3 VCD in Fukuoka was different from that in Kyushu, as shown in Figure 4. The Kyushu NH3 VCD had a peak in summer, but there was no peak in May.
Based on the comprehensive analysis and comparison in this study, it can be indicated that although different datasets showed reasonable agreements, there were still some differences among different datasets. As revealed by the observations of 3 sites in Fukuoka, large differences (a factor of 2–3) existed; therefore, more in-situ observations are necessary. Besides in-situ observations, improved satellite retrievals and high-resolution model simulations with more accurate emissions are necessary for a better understanding of the atmospheric NH3 over East Asia.

5. Conclusions

Atmospheric ammonia plays an important role in the formation of secondary inorganic aerosols, the neutralization of acid rain, and the deposition to ecosystems, but has not been well understood yet, especially over East Asia. In this study, we analyzed the spatio-temporal variation in atmospheric NH3 using long-term hourly NH3 measurements made at CC-KU in Fukuoka, the nationwide FP network observation in Japan, GEOS-Chem CTM results, and IASI satellite retrievals over East Asia.
IASI NH3 data provided useful information for East Asia. IASI retrievals over central and North China were similar to the CTM results. However, over South China, there were fewer IASI observations due to high levels of cloud cover, and the retrieval results were underestimated compared with CTM results (IASI NH3 was 48% of CTM NH3). Over Japan, the nationwide FP NH3 data from JELA and CTM results were strongly correlated (R = 0.65) even when CTM results were underestimated (about half of the FP measurements). It was found that the IASI observations over Japan were below or near the detection limit, and it was difficult to obtain a reasonable correlation between surface measurements and CTM results.
Data from two FP NH3 measurement sites within Fukuoka Prefecture were examined carefully. Dazaifu FP NH3 measurements displayed a clear seasonal cycle (spring-summer high and winter low), and were 2–3 times higher than that of the Fukuoka rural site (located 13 km southwest of the Fukuoka downtown area). NH3 emissions with 1-km resolution identified a 10-fold difference in levels between the Dazaifu and Fukuoka sites (Dazaifu was higher). This indicates that differences in local NH3 emissions surrounding an observation site play an important role in determining the observed NH3 concentrations. The CTM underestimation (by about 50%) of the NH3 might be due to the underestimation of the NH3 emission inventory at a coarse resolution (50 km) used in the model simulation.
The comprehensive analysis indicated that there were still some differences among different datasets. More in-situ observations, improved satellite retrievals, and high-resolution model simulations with more accurate emissions are necessary for better understanding the atmospheric NH3 over East Asia.

Author Contributions

Conceptualization, Z.W. (Zhe Wang) and I.U.; methodology, S.I., X.C., W.Y. and Z.W. (Zifa Wang); data curation, K.O. and K.Y.; writing—original draft preparation, Z.W. (Zhe Wang); writing—review and editing, I.U. All authors have read and agreed to the published version of the manuscript.

Funding

This study was supported by JSPS KAKENHI Grant Number JP18H03359 and the National Natural Science Foundation of China (NNSF, 41505115).

Acknowledgments

This study was supported by JSPS KAKENHI Grant Number JP18H03359 and the National Natural Science Foundation of China (NNSF, 41505115). The authors are grateful to the Japan Environmental Laboratories Association (JELA) for the measurement datasets. The authors thank Martin Van Damme (Université Libre de Bruxelles (ULB), Belgium) for help with IASI data. EAGrid NH3 digital data was provided with the kind help of T. Ohara of NIES and T. Fukui of Institute of Behavioral Sciences (IBS) of Japan.

Conflicts of Interest

The authors declare no conflict of interest.

Appendix A

Figure A1. Horizontal distributions of NH3 data number per grid (a1, b1, c1, d1, e1), averaged cloud cover (%, a2, b2, c2, d2, e2), and (c) relative error (%, a3, b3, c3, d3, e3) over East Asia for the whole year (a1a3) and each season (b1e3) of 2014.
Atmosphere 11 00900 g0a1

References

  1. Fowler, D.; Coyle, M.; Skiba, U.; Sutton, M.A.; Cape, J.N.; Reis, S.; Sheppard, L.J.; Jenkins, A.; Grizzetti, B.; Galloway, J.N.; et al. The global nitrogen cycle in the twenty-first century. Philos. Trans. R. Soc. B Biol. Sci. 2013, 368, 20130164. [Google Scholar] [CrossRef] [PubMed]
  2. Ge, B.; Xu, X.; Ma, Z.; Pan, X.; Wang, Z.; Lin, W.; Ouyang, B.; Xu, D.; Lee, J.; Zheng, M.; et al. Role of Ammonia on the Feedback Between AWC and Inorganic Aerosol Formation During Heavy Pollution in the North China Plain. Earth Space Sci. 2019, 6, 1675–1693. [Google Scholar] [CrossRef] [Green Version]
  3. Wang, Z.; Itahashi, S.; Uno, I.; Pan, X.; Osada, K.; Yamamoto, S.; Nishizawa, T.; Tamura, K.; Wang, Z. Modeling the Long-Range Transport of Particulate Matters for January in East Asia using NAQPMS and CMAQ. Aerosol Air Qual. Res. 2017, 17, 3065–3078. [Google Scholar] [CrossRef]
  4. Itahashi, S.; Uno, I.; Osada, K.; Kamiguchi, Y.; Yamamoto, S.; Tamura, K.; Wang, Z.; Kurosaki, Y.; Kanaya, Y. Nitrate transboundary heavy pollution over East Asia in winter. Atmos. Chem. Phys. 2017, 17, 3823–3843. [Google Scholar] [CrossRef] [Green Version]
  5. Wang, Z.; Pan, X.; Uno, I.; Chen, X.; Yamamoto, S.; Zheng, H.; Li, J.; Wang, Z. Importance of mineral dust and anthropogenic pollutants mixing during a long-lasting high PM event over East Asia. Environ. Pollut. 2018, 234, 368–378. [Google Scholar] [CrossRef]
  6. Uno, I.; Wang, Z.; Itahashi, S.; Yumimoto, K.; Yamamura, Y.; Yoshino, A.; Takami, A.; Hayasaki, M.; Kim, B.-G. Paradigm shift in aerosol chemical composition over regions downwind of China. Sci. Rep. 2020, 10, 6450. [Google Scholar] [CrossRef] [Green Version]
  7. Wang, Z.; Pan, X.; Uno, I.; Li, J.; Wang, Z.; Chen, X.; Fu, P.; Yang, T.; Kobayashi, H.; Shimizu, A.; et al. Significant impacts of heterogeneous reactions on the chemical composition and mixing state of dust particles: A case study during dust events over northern China. Atmos. Environ. 2017, 159, 83–91. [Google Scholar] [CrossRef]
  8. Wang, Z.; Uno, I.; Yumimoto, K.; Pan, X.; Chen, X.; Li, J.; Wang, Z.; Shimizu, A.; Sugimoto, N. Dust Heterogeneous Reactions during Long-Range Transport of a Severe Dust Storm in May 2017 over East Asia. Atmosphere 2019, 10, 680. [Google Scholar] [CrossRef] [Green Version]
  9. Behera, S.N.; Sharma, M.; Aneja, V.P.; Balasubramanian, R. Ammonia in the atmosphere: A review on emission sources, atmospheric chemistry and deposition on terrestrial bodies. Environ. Sci. Pollut. Res. 2013, 20, 8092–8131. [Google Scholar] [CrossRef]
  10. Gao, C.; Wang, Z.-F.; Enagnon, A.G. Ammonium Variational Trends and the Ammonia Neutralization Effect on Acid Rain over East Asia. Atmos. Ocean. Sci. Lett. 2010, 3, 120–126. [Google Scholar] [CrossRef] [Green Version]
  11. Erisman, J.W.; Bleeker, A.; Galloway, J.; Sutton, M.S. Reduced nitrogen in ecology and the environment. Environ. Pollut. 2007, 150, 140–149. [Google Scholar] [CrossRef] [PubMed] [Green Version]
  12. Itahashi, S.; Ge, B.; Sato, K.; Fu, J.S.; Wang, X.; Yamaji, K.; Nagashima, T.; Li, J.; Kajino, M.; Liao, H.; et al. MICS-Asia III: Overview of model intercomparison and evaluation of acid deposition over Asia. Atmos. Chem. Phys. 2020, 20, 2667–2693. [Google Scholar] [CrossRef] [Green Version]
  13. Ge, B.; Itahashi, S.; Sato, K.; Xu, D.; Wang, J.; Fan, F.; Tan, Q.; Fu, J.S.; Wang, X.; Yamaji, K.; et al. MICS-Asia III: Multi-model comparison of reactive Nitrogen deposition over China. Atmos. Chem. Phys. Discuss. 2020, 2020, 1–43. [Google Scholar] [CrossRef]
  14. Sutton, M.A.; Erisman, J.W.; Dentener, F.; Moeller, D. Ammonia in the environment: From ancient times to the present. Environ. Pollut. 2008, 156, 583–604. [Google Scholar] [CrossRef] [PubMed]
  15. Clarisse, L.; Clerbaux, C.; Dentener, F.; Hurtmans, D.; Coheur, P.-F. Global ammonia distribution derived from infrared satellite observations. Nat. Geosci. 2009, 2, 479–483. [Google Scholar] [CrossRef]
  16. Van Damme, M.; Clarisse, L.; Heald, C.L.; Hurtmans, D.; Ngadi, Y.; Clerbaux, C.; Dolman, A.J.; Erisman, J.W.; Coheur, P.F. Global distributions, time series and error characterization of atmospheric ammonia (NH3) from IASI satellite observations. Atmos. Chem. Phys. 2014, 14, 2905–2922. [Google Scholar] [CrossRef] [Green Version]
  17. Van Damme, M.; Wichink Kruit, R.J.; Schaap, M.; Clarisse, L.; Clerbaux, C.; Coheur, P.-F.; Dammers, E.; Dolman, A.J.; Erisman, J.W. Evaluating 4 years of atmospheric ammonia (NH3) over Europe using IASI satellite observations and LOTOS-EUROS model results. J. Geophys. Res. Atmos. 2014, 119, 9549–9566. [Google Scholar] [CrossRef] [Green Version]
  18. Kong, L.; Tang, X.; Zhu, J.; Wang, Z.; Fu, J.S.; Wang, X.; Itahashi, S.; Yamaji, K.; Nagashima, T.; Lee, H.-J.; et al. Evaluation and uncertainty investigation of the NO2, CO and NH3 modeling over China under the framework of MICS-Asia III. Atmos. Chem. Phys. 2020, 20, 181–202. [Google Scholar] [CrossRef] [Green Version]
  19. Osada, K.; Ueda, S.; Egashira, T.; Takami, A.; Kaneyasu, N. Measurements of Gaseous NH3 and Particulate NH4+ in the Atmosphere by Fluorescent Detection after Continuous Air–water Droplet Sampling. Aerosol Air Qual. Res. 2011, 11, 170–178. [Google Scholar] [CrossRef] [Green Version]
  20. Kannari, A.; Tonooka, Y.; Baba, T.; Murano, K. Development of multiple-species 1 km × 1 km resolution hourly basis emissions inventory for Japan. Atmos. Environ. 2007, 41, 3428–3439. [Google Scholar] [CrossRef]
  21. Genfa, Z.; Dasgupta, P.K. Fluorometric measurement of aqueous ammonium ion in a flow injection system. Anal. Chem. 1989, 61, 408–412. [Google Scholar] [CrossRef]
  22. Uno, I.; Osada, K.; Yumimoto, K.; Wang, Z.; Itahashi, S.; Pan, X.; Hara, Y.; Kanaya, Y.; Yamamoto, S.; Fairlie, T.D. Seasonal variation of fine- and coarse-mode nitrates and related aerosols over East Asia: Synergetic observations and chemical transport model analysis. Atmos. Chem. Phys. 2017, 17, 14181–14197. [Google Scholar] [CrossRef] [Green Version]
  23. Environmental Laboratories Association. Acid Deposition Survey in Japan, Phase 5. J. Environ. Lab. Assoc. 2016, 41, 2–37. [Google Scholar]
  24. Sakurai, T.; Suzuki, T.; Yoshioka, M. Model Evaluation based on a Relationship Analysis between the Emission and Concentration of Atmospheric Ammonia in the Kanto Region of Japan. Asian J. Atmos. Environ. 2018, 12, 59–66. [Google Scholar] [CrossRef]
  25. Roadman, M.J.; Scudlark, J.R.; Meisinger, J.J.; Ullman, W.J. Validation of Ogawa passive samplers for the determination of gaseous ammonia concentrations in agricultural settings. Atmos. Environ. 2003, 37, 2317–2325. [Google Scholar] [CrossRef]
  26. Bey, I.; Jacob, D.J.; Yantosca, R.M.; Logan, J.A.; Field, B.D.; Fiore, A.M.; Li, Q.; Liu, H.Y.; Mickley, L.J.; Schultz, M.G. Global modeling of tropospheric chemistry with assimilated meteorology: Model description and evaluation. J. Geophys. Res. Atmos. 2001, 106, 23073–23095. [Google Scholar] [CrossRef]
  27. Park, R.J.; Jacob, D.J.; Field, B.D.; Yantosca, R.M.; Chin, M. Natural and transboundary pollution influences on sulfate-nitrate-ammonium aerosols in the United States: Implications for policy. J. Geophys. Res. Atmos. 2004, 109, 1–17. [Google Scholar] [CrossRef]
  28. Fountoukis, C.; Nenes, A. ISORROPIA II: A computationally efficient thermodynamic equilibrium model for K+–Ca2+–Mg2+–NH4+–Na+–SO42−–NO3–Cl–H2O aerosols. Atmos. Chem. Phys. 2007, 7, 4639–4659. [Google Scholar] [CrossRef] [Green Version]
  29. Olivier, J.G.J.; Bouwman, A.F.; Van der Maas, C.W.M.; Berdowski, J.J.M. Emission database for global atmospheric research (EDGAR): Version 2.0. In Studies in Environmental Science; Zwerver, S., van Rompaey, R.S.A.R., Kok, M.T.J., Berk, M.M., Eds.; Elsevier: Amsterdam, The Netherlands, 1995; Volume 65, pp. 651–659. ISBN 0166-1116. [Google Scholar]
  30. Kurokawa, J.; Ohara, T.; Morikawa, T.; Hanayama, S.; Janssens-Maenhout, G.; Fukui, T.; Kawashima, K.; Akimoto, H. Emissions of air pollutants and greenhouse gases over Asian regions during 2000-2008: Regional Emission inventory in ASia (REAS) version 2. Atmos. Chem. Phys. 2013, 13, 11019–11058. [Google Scholar] [CrossRef] [Green Version]
  31. Huang, X.; Song, Y.; Li, M.; Li, J.; Huo, Q.; Cai, X.; Zhu, T.; Hu, M.; Zhang, H. A high-resolution ammonia emission inventory in China. Glob. Biogeochem. Cycles 2012, 26, 1030. [Google Scholar] [CrossRef]
  32. Xu, P.; Zhang, Y.; Gong, W.; Hou, X.; Kroeze, C.; Gao, W.; Luan, S. An inventory of the emission of ammonia from agricultural fertilizer application in China for 2010 and its high-resolution spatial distribution. Atmos. Environ. 2015, 115, 141–148. [Google Scholar] [CrossRef]
  33. Uno, I.; Yumimoto, K.; Pan, X.; Wang, Z.; Osada, K.; Itahashi, S.; Yamamoto, S. Simultaneous Dust and Pollutant Transport over East Asia: The Tripartite Environment Ministers Meeting March 2014 Case Study. SOLA 2017, 13, 47–52. [Google Scholar] [CrossRef] [Green Version]
  34. Uno, I.; Osada, K.; Yumimoto, K.; Wang, Z.; Itahashi, S.; Pan, X.; Hara, Y.; Yamamoto, S.; Nishizawa, T. Importance of Long-Range Nitrate Transport Based on Long-Term Observation and Modeling of Dust and Pollutants over East Asia. Aerosol Air Qual. Res. 2017, 17, 3052–3064. [Google Scholar] [CrossRef]
Figure 1. Horizontal distribution of NH3 emission by (a) REAS over East Asia used for GEOS-Chem simulation (Grid = 0.5° × 0.667°) and (b) EAGrid over the North Kyushu area (Grid = 0.01° × 0.01°).
Atmosphere 11 00900 g001
Figure 2. Horizontal distribution of annual averaged (a) IASI retrieved and (b) GEOS-Chem simulated NH3 vertical column densities (VCDs) over East Asia for the year of 2014.
Atmosphere 11 00900 g002
Figure 3. Horizontal distribution of seasonal averaged IASI retrieved (a1d1) and GEOS-Chem simulated (a2d2) NH3 VCDs as well as REAS NH3 emission (a3d3) over East Asia.
Atmosphere 11 00900 g003
Figure 4. Regional averaged monthly IASI NH3 VCD (the blue dashed line with open circle and shade), GEOS-Chem NH3 VCD (the red dashed line with the open triangle), and REAS NH3 emissions (the black dashed line with the open triangle). (a): North China, (b): Central China, (c) South China, (d) South Korea, (e) Kanto Japan, (f) Kyushu Japan.
Atmosphere 11 00900 g004
Figure 5. Horizontal distribution of the annual averaged FP surface NH3 concentrations over Japan (colored circles) and comparison with (a) GEOS-Chem surface concentration, (b) GEOS-Chem NH3 VCD, and (c) IASI NH3 VCD shown as shadings.
Atmosphere 11 00900 g005
Figure 6. Scatter plot of (a) FP and GEOS-Chem surface NH3, (b) FP surface NH3 and GEOS-Chem NH3 VCD, (c) FP surface NH3 and IASI NH3 VCD, and (d) IASI and GEOS-Chem NH3 VCD on grids with FP observations, (e) IASI and GEOS-Chem NH3 VCD for the North China (NC) and central China (CC), and (f) IASI and GEOS-Chem NH3 VCD for the South China (SC). N is the number of data and R is the correlation coefficient.
Atmosphere 11 00900 g006
Figure 7. Time series of NH3 in the Hokkaido region (a) FP and GEOS-Chem concentrations, (b) IASI NH3 VCD and GEOS-Chem NH3 VCDs, (c) REAS NH3 emissions for S1 and S2 sites.
Atmosphere 11 00900 g007
Figure 8. Time series of NH3 in the Kanto region (a) FP and GEOS-Chem concentrations, (b) IASI NH3 VCD and GEOS-Chem NH3 VCDs, (c) REAS NH3 emissions for S8 and S9 sites.
Atmosphere 11 00900 g008
Figure 9. Time series of NH3 in the Kyushu area (a) FP and GEOS-chem concentrations in Fukuoka, Dazaifu and CC-KU (box-whisker), (b) IASI and GEOS-Chem VCDs, and (c) REAS NH3 emissions.
Atmosphere 11 00900 g009
Table 1. Japan Environmental Laboratories Association (JELA) filter pack (FP) NH3 sites.
RegionSite NameSite No.Lat. (°N)Lon. (°E)
HokkaidoRishiriS145.12141.21
HokkaidoMoshiriS244.36142.27
KantoKazoS836.09139.56
KantoIchikawaS935.72139.93
KantoIchiharaS1035.53140.07
KantoSakuraS1335.73140.21
KyushuDazaifuS2633.51130.50
KyushuFukuokaS2733.50130.31

