Abstract
This study examined the impact of foreign SO2 emission changes on the aerosol direct radiative effects (ADRE) in South Korea. Simulations that applied basic emissions (BASE) and simulations that applied reduced SO2 emissions from foreign sources (R_FSO2) were performed, respectively, using the Weather Research and Forecasting (WRF)-Community Multiscale Air Quality (CMAQ) two-way coupled model. In addition, the difference between the two experimental results was calculated (i.e., R_FSO2 minus BASE) to quantitatively identify the impact of foreign SO2 emission reduction. The reduction in foreign SO2 emissions caused a decrease in the concentration of SO2 flowing in from overseas to South Korea. As a result, a clear decrease in SO42− concentration was shown mainly in the southwest coast of South Korea. The difference in PM2.5 concentration in South Korea according to the foreign SO2 emission reduction did not correspond to the difference in SO42− concentration; it was determined in a complex way by the changes in SO42− concentration caused by SO2 concentration changes, and the subsequent series of changes in NO3− and NH4+ concentrations. The differences in SO42− and PM2.5 concentrations caused by the foreign SO2 reduction also affected the ADRE changes in South Korea. The distribution of ADRE difference between the two experiments was not consistent with the distribution of PM2.5 concentration difference, but it was very similar to the distribution of SO42− concentration difference. These results imply that the ADRE of South Korea is not simply proportional to PM2.5 concentration and may be determined by concentration changes of SO42−.
1. Introduction
Sulfate (SO42−) is a major component of PM2.5, and the generation of high-concentration SO42− is closely related to SO2 emissions [1]. China is one of the world’s largest countries emitting SO2 [2], and the SO42− concentration of South Korea located in the downwind region of China is greatly affected by SO2 transported from China [3,4,5,6]. According to Lee et al. [3], 8–12% of SO2 in Seoul of South Korea originated from China, and Choi et al. [7] reported that the rapid increase in SO42− concentration during high-concentration PM2.5 episodes in South Korea was due to the transport of foreign SO2 emissions. Because SO2 emitted from China produces PM2.5 components such as SO42− and ammonium sulfate ((NH4)2SO4) through chemical reactions in the process of being transported across the Yellow Sea to South Korea [6], it affects the PM2.5 concentration changes in South Korea.
PM2.5 concentration change in the atmosphere may cause changes in the meteorological factors such as solar radiation and temperature, and these changes affect the planetary boundary layer (PBL) height, photolysis rates, and the like, which again cause changes in PM2.5 concentration [8,9]. The scattering and/or reflection of solar radiation by aerosols in the atmosphere, affecting the meteorology and air pollutants’ concentration [10,11,12,13], is called Aerosol Direct Radiative Effects (ADRE). Studies of ADRE have been carried out in a variety of ways, mainly using a two-way coupled model (e.g., Weather Research and Forecasting (WRF)-Community Multiscale Air Quality (CMAQ), and WRF-Chem) that can take into account the effects of aerosols. For example, Hong et al. (2017) [14] reported an improved accuracy of O3 and PM2.5 simulation results by considering ADRE, and Nguyen et al. (2019) [15] analyzed that the increase in PM2.5 concentration attributes to a decrease in meteorological factors due to ADRE, and Jung et al. (2019) [16] confirmed that ADRE increases the concentration of PM2.5 constituents such as SO42− and NO3−. Many other studies have also reported that ADRE affects surface PM2.5 concentration, long-range transport, and even human health [17,18,19]
The ADRE may be large when the concentration of aerosol in the atmosphere is high (i.e., when the concentration of PM2.5 is high) [15] but it does not simply increase in proportion to PM2.5 concentration. According to Yoo et al. [13], South Korea’s ADRE varies depending on the concentration of each component rather than the total concentration of PM2.5. Particularly, SO42− concentration is reported to play an important role. Therefore, the concentration of SO2, which is a major precursor of SO42−, affects the ADRE, and consequently, SO2 transported from China can affect the ADRE distribution in South Korea. However, because the previous study only estimated the conclusion qualitatively and did not provide quantitative evidence, additional investigation and analysis are called for more generalization.
This study thus aimed to quantitatively analyze the impact of foreign SO2 emissions on the PM2.5 (especially SO42−) concentration and the ADRE distribution in South Korea. To examine the changes in SO42− concentration over South Korea based on the foreign SO2 emission changes, we applied the brute force method (BFM) to this study. BFM is a method of quantitatively analyzing the differences in modeling results due to emission reduction, which is used in various studies related to contribution analysis [20,21,22,23]. The WRF–CMAQ two-way coupled model [24], which facilitates the quantitative calculation of the ADRE, was used to analyze the characteristics of changes in the ADRE distribution according to SO42− concentration changes. This is intended to conduct a quantitative analysis that was not performed in previous studies, but very important to better understand the effects of ADRE on PM2.5 concentration.
2. Method
2.1. Modeling System
In this study, we used the WRF–CMAQ two-way coupled model, which is a combination of the weather model, Weather Research and Forecasting (WRF, ver. 3.8), and the air quality model, Community Multiscale Air Quality (CMAQ, ver. 5.2) for numerical simulation. This model can quantitatively analyze the differences in PM2.5 concentration and the Aerosol Direct Radiative Effects (ADRE) results according to the emission difference because the direct feedback effect of aerosol can be selectively applied when the numerical simulation is performed. For the modeling domain, Northeast Asia including South Korea was selected. The horizontal resolution was configured to be 12 km (280 × 230) and the total number of vertical layers was 30 (Figure 1). The final operational global analysis data (FNL) of National Centers for Environmental Prediction (NCEP) with the horizontal resolution of 1.0° × 1.0° was used as the initial and boundary data of the WRF model, and the Model Inter-Comparison Study for Asia (MICS-Asia) [2] with the horizontal resolution of 0.25° × 0.25° was used as the anthropogenic emission data. The numerical simulation period was one month in February 2015, and the detailed settings for the modeling were applied in the same way as in Yoo et al. [13].
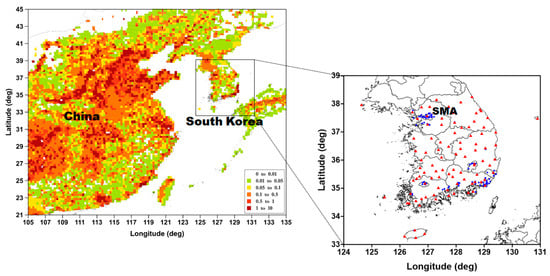
Figure 1.
The modeling domain and SO2 emissions (moles/s) distribution (left), and the location map of South Korea (right). The right panel shows the locations of meteorological (red triangles) and air quality (blue circles) observation sites. “SMA” denotes Seoul Metropolitan Area.
2.2. Emission Reduction Method
In this study, the impact of foreign SO2 emissions on PM2.5 and the ADRE in South Korea was analyzed using the BFM. BFM is a method of calculating the estimated contribution from the difference of simulated concentrations after changing the emissions of air pollutants to be analyzed; it is mainly used in research to quantitatively analyze the impact of emissions [25]. Simulations that applied basic emissions (BASE) experiments using basic emission data and the R_FSO2 (i.e., reduced foreign SO2 emissions) experiment using a 50% reduction in the foreign SO2 emissions were performed, respectively, to analyze the impact of foreign SO2 emissions on South Korea, and the numerical simulation results were compared.
2.3. Analysis Method of Aerosol Direct Radiative Effects
The WRF–CMAQ two-way coupled model (WRF–CMAQ, hereafter) used in this study was developed to simulate the effects of aerosol for the rapid and accurate radiative transfer model for general circulation models’ (RRTMG) short-wave radiation scheme. First, the results of simulation in the CMAQ model were used to calculate the values such as the aerosol’s optical characteristics, scattering, and absorption rate, and these values were fed back to the WRF model to calculate the short-wave radiation. The short-wave radiation values thus calculated affect other meteorological factors (e.g., temperature, PBL height), which again cause the changes in aerosol concentration in the atmosphere. In the WRF–CMAQ model, the ADRE values are calculated through the repetition of this feedback process. In this study, the aerosol feedback effects were applied (and not applied) to the BASE and R_FSO2 experiments, respectively, to calculate the ADRE value for each experiment. Then, we focused the analysis on the difference of results between the two experiments.
2.4. Statistical Analysis
Statistical parameters such as the mean bias (MB), the root mean square error (RMSE), correlation coefficient (R), and the index of agreement (IOA) were used to evaluate the meteorological and air quality simulation results. Each parameter is defined as follows:
where is the number of data pairs, and and are the th WRF and CMAQ simulated and observed values, respectively. and denote the mean WRF and CMAQ simulated and observed values, respectively.
3. Results
3.1. Model Performance
The meteorological and air quality simulation results were evaluated, respectively, to analyze the accuracy of WRF–CMAQ numerical simulation results. First, the hourly observation values and the model values (BASE simulation) were compared for 94 meteorological observation sites in South Korea (Figure 1) during the analysis period to evaluate the numerical simulation accuracy of WRF, a meteorological model (Figure 2). In the case of 2 m temperature (T2), the model value was overestimated by 0.18 °C compared to the observation value, and the R and IOA were 0.89 and 0.91, respectively, satisfying the baseline (Bias ≤ ±0.5 K; IOA ≥ 0.7) provided by Emery et al. [26]. In the case of 10 m wind speed (WS10), the RMSE was 2.17 m s−1, which was slightly overestimated compared to the baseline (≤2.0 m s−1), but the IOA was 0.75, which satisfied the baseline (≥0.6). The hourly PM2.5 observation values and model values (BASE experiment) of 90 observation sites (Figure 1) in South Korea during the analysis period were compared to evaluate the simulation results of CMAQ, an air quality model. The CMAQ simulation results were overestimated compared to the observation values, but the IOA value was 0.77, which was high, indicating that the temporal variation of observation values was well simulated overall.
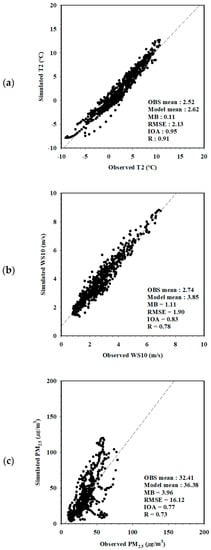
Figure 2.
The comparison of hourly observation and model values for (a) 2 m temperature (T2), (b) 10 m wind speed (WS10), and (c) PM2.5 concentration. “OBS” is observation, “MB” is mean bias, “RMSE” is root mean squared error, “IOA” is index of agreement, and “R” is correlation coefficient.
3.2. SO42− and PM2.5 Concentration Changes in South Korea due to Reduction of Foreign SO2 Emissions
In this study, we examined the impact of foreign SO2 emissions on the SO42− and PM2.5 concentration changes in South Korea. Since air pollutants are mainly distributed below the PBL height, the mean values within the PBL height were used when calculating the difference of results between the experiments (R_FSO2–BASE). As illustrated in Figure 3a, the SO42− concentration difference between the two experiments showed a negative value in the whole domain and a decrease of 2.66 μg m−3 on average. This is the result of the decrease in SO2 (main precursor of SO42−) transport from upwind regions (e.g., China) to South Korea due to the reduced foreign SO2 emissions. SO2 oxidation reactions (R1 to R3) decrease due to the decline of SO2 concentration in the atmosphere. As a result, the production of H2SO4, a direct precursor of SO42− slowed down, which in turn led to the decrease in SO42− concentration. The distribution of SO42− concentration difference was mainly on the southwest coast and the east coast of South Korea. According to the analysis, this was because SO2 transported from overseas during the case period (February 2015) was mainly on the southwest coast (SO2 transported from eastern China by southwestern wind) and the east coast (SO2 transported from Liaodong and North Korea by northwestern wind):
SO2 + OH → HOSO2
HOSO2 + O2 → HO2 + SO3
SO3 + H2O → H2SO4
2NH3 + H2SO4 → (NH4)2SO4
NH3 + HNO3 → NH4NO3
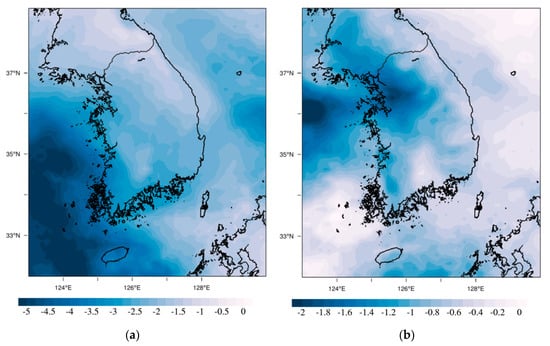
Figure 3.
Changes of SO42− and PM2.5 concentrations (μg m−3) in South Korea due to the reduction of overseas SO2 emissions ((R_FSO2)–simulations that applied basic emissions (BASE)). (a) SO42−, (b) PM2.5.
The PM2.5 concentration difference between the two experiments was clear around the Seoul Metropolitan Area (SMA) and its west coast, unlike the result of SO42−, and showed a concentration decrease of 0.97 μg m−3 on average. Interestingly, despite the concentration of SO42−, a component of PM2.5, decreased by an average of 2.56 μg m−3, the decrease in the concentration of PM2.5 was only 0.70 μg m−3. This means that the concentration of PM2.5 components other than SO42− may increase despite the reduced SO2 emissions.
The results of NO3− and NH4+ were analyzed additionally for a clearer interpretation of the difference between the SO42− and PM2.5 results examined above. As shown in Figure 4a, the NO3− concentration difference between the two experiments showed a positive value overall, and the distribution pattern was similar to the result of SO42−. This result means that the decrease in SO42− concentration led to the production of NO3−. H2SO4, which is produced by SO2 oxidation reactions (R1 to R3), reacts with NH3 in the atmosphere and produces (NH4)2SO4 (R4). Here, if the H2SO4 concentration decreases, the surplus NH3 concentration increases, which in turn can promote NO3− production by reaction with HNO3 (R5). Through this mechanism, the increase in NO3− concentration was clearly visible in the southwestern region of the domain where the decrease in SO42− concentration was most prominent.
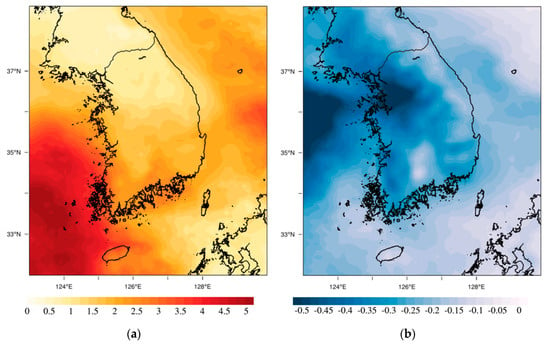
Figure 4.
Changes of NO3− and NH4+ concentrations (μgm−3) in South Korea due to the reduction of overseas SO2 emissions (R_FSO2–BASE). (a) NO3−, (b) NH4+.
On the other hand, NH4+ concentration is mainly determined by R4 and R5, and as explained above, if SO2 decreases, R4 decreases, and conversely, R5 increases. Therefore, the difference of NH4+ concentration (R_FSO2–BASE) shown in Figure 4b was negative overall, which was determined by the net effect of R4 decrease and R5 increase. These results suggest that the impact of the reduced foreign SO2 emissions is not limited to the decrease in SO42− concentration; it also affects concentration changes of NO3− and NH4+ through a series of chemical reactions. When the sum of differences in the SO42−, NO3−, and NH4+ results between the two experiments was calculated (Figure 5), it was very similar to the difference of PM2.5 results shown in Figure 3b. This means that the PM2.5 concentration changes in South Korea due to the reduction of foreign SO2 emissions are well explained by the concentration changes of SO42−, NO3−, and NH4+, which are major inorganic PM2.5 species.
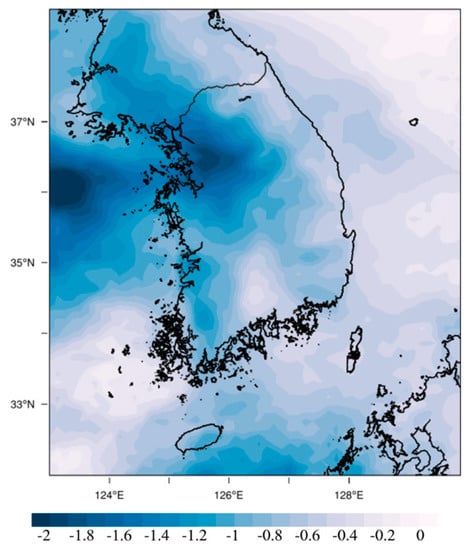
Figure 5.
Changes of the sum of SO42−, NO3−, and NH4+ concentrations (SO42− + NO3− + NH4+, μg m−3) in South Korea due to the reduction of SO2 emissions from foreign sources (R_FSO2–BASE).
3.3. The Difference in Aerosol Direct Radiative Effect in South Korea Due to the Reduced Foreign SO2 Emissions
The ADRE difference between the two experiments was calculated by the same method as in the previous studies [12,13] to examine the impact of SO42− and PM2.5 concentration differences by the foreign SO2 reduction on the ADRE distribution changes in South Korea. To consider only the pure aerosol feedback effects, rainy and cloudy days were excluded and the ADRE difference between the two experiments was analyzed for clear-sky days only.
As shown in Figure 6, the ADRE difference between the two experiments (R_FSO2–BASE) showed negative values in the entire domain and a decrease of 0.31 Wm−2 on average. Particularly, the ADRE difference was large in the southwest coast of South Korea and smaller in inland regions where the domestic emissions were concentrated. Interestingly, the distribution of the ADRE difference was not consistent with the distribution of the PM2.5 difference (Figure 3b); it was very similar to the distribution of SO42− concentration difference (Figure 3a). This supports the research results of Yoo et al., [13], which concluded that the feedback effects of aerosol were not simply proportional to the PM2.5 concentration but were affected by the concentration and distribution of its components, particularly SO42−. The reason why the influence of SO42− on the changes of the ADRE is relatively large compared to other substances is estimated to be related to the altitude where SO42− is distributed in South Korea. The distribution of SO42− concentration in South Korea is greatly affected by foreign sources, and the transport of SO42− occurs mainly below the height of 2–3 km (Figure 7). Therefore, the distribution altitude of SO42− may be relatively higher than that of other PM2.5 components (NO3−, etc.), which is greatly affected by the emissions from domestic sources.
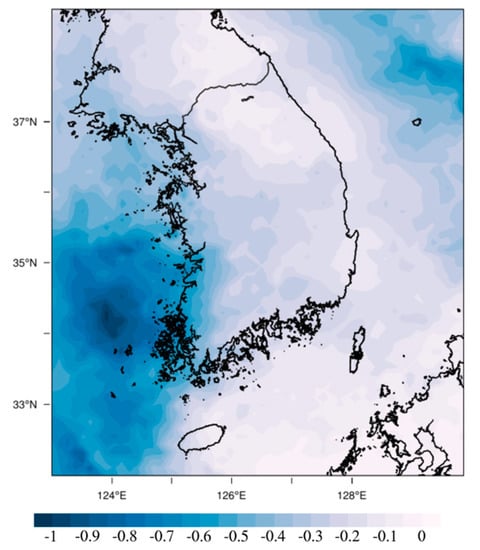
Figure 6.
The changes in aerosol direct radiative effects (ADRE, Wm−2) in South Korea due to the reduction of SO2 emissions from foreign sources (R_FSO2–BASE).
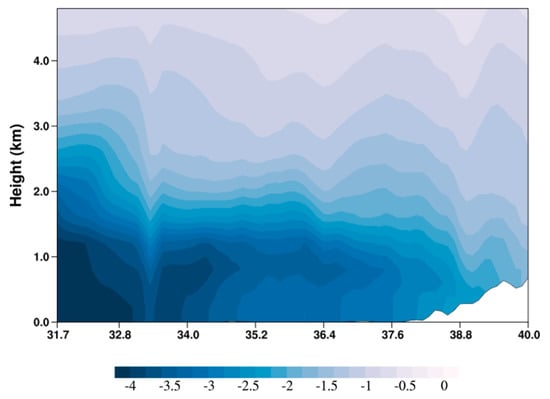
Figure 7.
Vertical cross-section of SO42− concentration difference between BASE and R_FSO2 experiments.
Table 1 shows the concentrations of SO42−, NO3−, and NH4+ by altitude (the mean values of the entire domain), and the concentration of SO42− is maintained high in the upper layer while the concentration of other substances decreases rapidly as the altitude increases. These results mean that compared to other substances, SO42− may have a favorable condition to induce the feedback effects by reacting with short-wave solar radiation. However, it is difficult to sufficiently explain the high correlation of the ADRE and SO42− with only the altitude difference. Therefore, an additional investigation should be conducted to determine other causes through follow-up studies.

Table 1.
The distribution of SO42−, NO3−, and NH4+ concentrations (μg m−3) according to altitude.
When the above results are pieced together, it is clear that the concentration changes of PM2.5 caused by the foreign emission reduction were determined in a complex way by the changes of SO42−, NO3−, and NH4+, but the changes of the ADRE were determined mainly by the changes of SO42−. Nevertheless, because the concentration change of SO42− in South Korea depends on the inflow direction of foreign emissions into South Korea, the ADRE distribution of South Korea is not always consistent but can vary depending on the seasonal difference of long-range transport pattern. However, additional studies on various cases need to be conducted to generalize these results.
4. Conclusions
Using the WRF–CMAQ two-way coupled model, this study analyzed the impact of foreign SO2 emission changes on the ADRE in South Korea. The differences between the BASE experiment using the basic emissions and the R_FSO2 experiment using a 50% reduction of foreign SO2 emissions were analyzed to quantitatively examine the differences of SO42− and PM2.5 concentrations, and the ADRE in South Korea according to the difference in foreign SO2 emissions.
The difference of results between the two experiments (R_FSO2–BASE) was analyzed, and the results confirmed that the inflow of SO2, the main precursor of SO42−, into South Korea decreased due to the reduction in the foreign SO2 emissions. Furthermore, the results showed a clear decrease in SO42− concentration mainly in the southwest coast of South Korea. The impact of foreign SO2 emission reduction was not just limited to the decrease in SO42− concentration; it also affected the concentration changes of NO3− (increase) and NH4+ (decrease) through a series of chemical reactions. The difference in PM2.5 concentration in South Korea due to the reduction of foreign SO2 emissions was different from the difference in SO42− concentration, and this result shows that the change of PM2.5 concentration is not determined simply by the change of SO2 emissions. The changes of PM2.5 concentration was determined in a complex way by the change of SO42− concentration due to the change in SO2 concentration, and the subsequent changes in NO3− and NH4+ concentrations.
The differences in SO42− and PM2.5 concentrations due to the reduction of foreign SO2 emissions affected the ADRE distribution changes in South Korea. The distribution of the ADRE difference between the two experiments was not consistent with the distribution of PM2.5 difference, but it was very similar to the distribution of SO42− concentration difference (i.e., large in the southwest coast and the east coast of South Korea). These results support the results of Yoo et al. [13], which demonstrated that the ADRE is not simply proportional to PM2.5 concentration but is affected by the concentration and distribution of SO42−. The reason why SO42− has a greater impact on the ADRE than other PM2.5 components is that high concentration is relatively maintained in the upper layer. However, follow-up studies should be conducted for further analysis.
The results of this study confirm that the ADRE changes in South Korea may vary by region depending on the changes in foreign emissions. However, additional modeling and analysis of various cases should be conducted for further generalization since the conclusion of this study was derived through the analysis of a specific case (February 2015).
Author Contributions
Conceptualization, J.-W.Y. and W.J.; methodology, J.-W.Y. and S.-Y.P.; formal analysis, J.-W.Y.; resources, J.-W.Y.; visualization, J.-W.Y. and J.M.; writing—original draft preparation, J.-W.Y.; writing—review and editing, W.J. and S.-H.L.; supervision, W.J. and H.W.L. All authors have read and agreed to the published version of the manuscript.
Funding
This study was financially supported by the “2019 Post-Doc. Development Program” of Pusan National University.
Conflicts of Interest
The authors declare no conflict of interest.
References
- Vardoulakis, S.; Kassomenos, P. Sources and factors affecting PM10 levels in two European cities: Implications for local air quality management. Atmos. Environ. 2008, 42, 3949–3963. [Google Scholar] [CrossRef]
- Li, M.; Zhang, Q.; Kurokawa, J.I.; Woo, J.H.; He, K.; Lu, Z.; Ohara, T.; Song, Y.; Streets, D.G.; Carmichael, G.R.; et al. MIX: A mosaic Asian anthropogenic emission inventory under the international collaboration framework of the MICS-Asia and HTAP. Atmos. Chem. Phys. 2017, 17, 935–963. [Google Scholar] [CrossRef]
- Lee, J.Y.; Kim, Y.P.; Kang, C.H. Characteristics of the ambient particulate PAHs at Seoul, a mega city of Northeast Asia in comparison with the characteristics of a background site. Atmos. Res. 2011, 99, 50–56. [Google Scholar] [CrossRef]
- Itahashi, S.; Uno, I.; Kim, S. Source contributions of sulfate aerosol over East Asia estimated by CMAQ-DDM. Environ. Sci. Technol. 2012, 46, 6733–6741. [Google Scholar] [CrossRef] [PubMed]
- Kim, B.U.; Bae, C.; Kim, H.C.; Kim, E.; Kim, S. Spatially and chemically resolved source apportionment analysis: Case study of high particulate matter event. Atmos. Environ. 2017, 162, 55–70. [Google Scholar] [CrossRef]
- Jeon, W.; Choi, Y.; Mun, J.; Lee, S.H.; Choi, H.J.; Yoo, J.W.; Lee, H.J.; Lee, H.W. Behavior of sulfate on the sea surface during its transport from Eastern China to South Korea. Atmos. Environ. 2018, 186, 102–112. [Google Scholar] [CrossRef]
- Choi, J.; Park, R.J.; Lee, H.M.; Lee, S.; Jo, D.S.; Jeong, J.I.; Henze, D.K.; Woo, J.H.; Ban, S.J.; Lee, M.-D.; et al. Impacts of local vs. trans-boundary emissions from different sectors on PM2.5 exposure in South Korea during the KORUS-AQ campaign. Atmos. Environ. 2019, 203, 196–205. [Google Scholar] [CrossRef]
- Wang, J.; Wang, S.; Jiang, J.; Ding, A.; Zheng, M.; Zhao, B.; Wong, D.C.; Zhou, W.; Zheng, G.; Wang, L.; et al. Impact of aerosol-meteorology interactions on fine particle pollution during China’s severe haze episode in January 2013. Environ. Res. Lett. 2014, 9. [Google Scholar] [CrossRef]
- Xing, J.; Wang, J.; Mathur, R.; Wang, S.; Sarwar, G.; Pleim, J.; Hogrefe, C.; Zhang, Y.; Jiang, J.; Wong, D.C.; et al. Impacts of aerosol direct effects on tropospheric ozone through changes in atmospheric dynamics and photolysis rates. Atmos. Chem. Phys. 2017, 17, 9869–9883. [Google Scholar] [CrossRef]
- Zhang, X.; Zhang, Q.; Hong, C.; Zheng, Y.; Geng, G.; Tong, D.; Zhang, Y.; Zhang, X. Enhancement of PM2.5 Concentrations by Aerosol-Meteorology Interactions Over China. J. Geophys. Res. Atmos. 2018, 123, 1179–1194. [Google Scholar] [CrossRef]
- Yu, H.; Kaufman, Y.J.; Chin, M.; Feingold, G.; Remer, L.A.; Anderson, T.L.; Balkanski, Y.; Bellouin, N.; Boucher, O.; Christopher, S.; et al. A review of measurement-based assessments of the aerosol direct radiative effect and forcing. Atmos. Chem. Phys. 2006, 6, 613–666. [Google Scholar] [CrossRef]
- Xing, J.; Mathur, R.; Pleim, J.; Hogrefe, C.; Gan, C.M.; Wong, D.C.; Wei, C. Can a coupled meteorology-chemistry model reproduce the historical trend in aerosol direct radiative effects over the Northern Hemisphere? Atmos. Chem. Phys. 2015, 15, 9997–10018. [Google Scholar] [CrossRef]
- Yoo, J.W.; Jeon, W.; Park, S.Y.; Park, C.; Jung, J.; Lee, S.H.; Lee, H.W. Investigating the regional difference of aerosol feedback effects over South Korea using the WRF-CMAQ two-way coupled modeling system. Atmos. Environ. 2019, 218, 116968. [Google Scholar] [CrossRef]
- Hong, C.; Zhang, Q.; Zhang, Y.; Tang, Y.; Tong, D.; He, K. Multi-year downscaling application of two-way coupled WRF v3.4 and CMAQ v5.0.2 over east Asia for regional climate and air quality modeling: Model evaluation and aerosol direct effects. Geosci. Model Dev. 2017, 10, 2447–2470. [Google Scholar] [CrossRef]
- Nguyen, G.T.H.; Shimadera, H.; Uranishi, K.; Matsuo, T.; Kondo, A.; Thepanondh, S. Numerical assessment of PM2.5 and O3 air quality in continental Southeast Asia: Baseline simulation and aerosol direct effects investigation. Atmos. Environ. 2019, 219, 117054. [Google Scholar] [CrossRef]
- Jung, J.; Souri, A.H.; Wong, D.C.; Lee, S.; Jeon, W.; Kim, J.; Choi, Y. The Impact of the Direct Effect of Aerosols on Meteorology and Air Quality Using Aerosol Optical Depth Assimilation During the KORUS-AQ Campaign. J. Geophys. Res. Atmos. 2019, 124, 8303–8319. [Google Scholar] [CrossRef]
- Xing, J.; Mathur, R.; Pleim, J.; Hogrefe, C.; Gan, C.M.; Wong, D.C.; Wei, C.; Wang, J. Air pollution and climate response to aerosol direct radiative effects: A modeling study of decadal trends across the northern hemisphere. J. Geophys. Res. Atmos. 2015, 120, 12221–12236. [Google Scholar] [CrossRef]
- Sekiguchi, A.; Shimadera, H.; Kondo, A. Impact of aerosol direct effect on wintertime PM2.5 simulated by an online coupled meteorology-air quality model over east asia. Aerosol Air Qual. Res. 2018, 18, 1068–1079. [Google Scholar] [CrossRef]
- Sahu, S.K.; Chen, L.; Liu, S.; Ding, D.; Xing, J. The impact of aerosol direct radiative effects on PM2.5-related health risk in Northern Hemisphere during 2013–2017. Chemosphere 2020, 254, 126832. [Google Scholar] [CrossRef]
- Chen, T.F.; Chang, K.H.; Tsai, C.Y. Modeling direct and indirect effect of long range transport on atmospheric PM2.5 levels. Atmos. Environ. 2014, 89, 1–9. [Google Scholar] [CrossRef]
- Chen, T.F.; Chang, K.H.; Lee, C.H. Simulation and analysis of causes of a haze episode by combining CMAQ-IPR and brute force source sensitivity method. Atmos. Environ. 2019, 218, 117006. [Google Scholar] [CrossRef]
- Bae, M.; Kim, B.U.; Kim, H.C.; Kim, S. A multiscale tiered approach to quantify contributions: A case study of PM2.5 in South Korea during 2010–2017. Atmosphere 2020, 11, 141. [Google Scholar] [CrossRef]
- Pan, Y.; Zhu, Y.; Jang, J.; Wang, S.; Xing, J.; Chiang, P.C.; Zhao, X.; You, Z.; Yuan, Y. Source and sectoral contribution analysis of PM2.5 based on efficient response surface modeling technique over Pearl River Delta Region of China. Sci. Total Environ. 2020, 737, 139655. [Google Scholar] [CrossRef] [PubMed]
- Wong, D.C.; Pleim, J.; Mathur, R.; Binkowski, F.; Otte, T.; Gilliam, R.; Pouliot, G.; Xiu, A.; Young, J.O.; Kang, D. WRF-CMAQ two-way coupled system with aerosol feedback: Software development and preliminary results. Geosci. Model Dev. 2012, 5, 299–312. [Google Scholar] [CrossRef]
- Bartnicki, J. Computing Source-Receptor Matrices with the EMEP Eulerian Acid Deposition Model; Norwegian Meteorological Institute: Oslo, Norway, 1999; p. 37. [Google Scholar]
- Emery, C.; Tai, E.; Yarwood, G. Enhanced Meteorological Modeling and Performance Evaluation for Two Texas Ozone Episodes. Environ. Int. Corp. 2001, 235. [Google Scholar]
© 2020 by the authors. Licensee MDPI, Basel, Switzerland. This article is an open access article distributed under the terms and conditions of the Creative Commons Attribution (CC BY) license (http://creativecommons.org/licenses/by/4.0/).