Abstract
Upper-air observational networks in Southwest Asia (SWA) are geographically sparse and reanalysis datasets (RDs) are a typical alternative. However, RDs can perform with varying degrees of quality and accuracy due to differences in assimilation schemes and input observations, among other factors. Geopotential height (gph), air temperature (tmp) and horizontal wind (U and V) modelled by the Japanese 55-year Reanalysis (JRA-55), the European Centre for Medium-Range Weather Forecasts Reanalysis Interim (ERA-I), the ERA fifth-generation (ERA-5), and the National Aeronautics and Space Administration (NASA) Modern Era Retrospective Analysis for Research and Applications version 2 (MERRA), are compared with radiosonde observations at three standard vertical levels (850, 500 and 300 hPa). Results showed that most RDs represent the general climatology, and ERA-5 tended to show the smallest agreements in most cases. RDs did not show consistent performance across seasons, variables, and pressure levels. RDs tended to conduct reasonable estimates over subregions with less complex topography. RDs showed better resampling performance at the upper and lower ends of sounding data distributions more frequently than around the means for most of the variables. This highlights the high potential usefulness of RDs in studying extremes over the region.
1. Introduction
The climate of Southwest Asia (SWA) is warming, and it is expected that this will lead to hardship [1,2]. There is a growing risk that the area will be inhabitable by the end of this century [1,2]. The ongoing warming in the region is expected to continue, and the extreme temperatures of today will become the norm, and severe conditions are likely to emerge which may not be survivable, particularly during summertime [1]. This is associated with more widespread and stronger South Asian monsoon troughs, which are projected to join with intensifying thermal lows over the Sahara during summertime [2]. However, these projections present possibilities and are nondeterministic, as the outputs of climate models depend mainly on the quality of input data and our understanding of climatic and atmospheric mechanisms. Climate model outputs are examined against historical observations to assess model performance and infer future model validity. The only limitation in this type of evaluation using past climate is the availability of climatological datasets with high reliability, including high quality and accurate representation [3].
Fixed observational networks are one common option to assess the state of the atmosphere at different levels. However, these networks have some disadvantages such as limited spatial coverage and resolution, low availability to researchers, and instrument changes. Climate networks (including surface and upper-air observational networks) in SWA are geographically sparse [4] and mostly located in or near urban settlements. Such networks have low spatial resolution to enable satisfactory understanding and depiction of atmospheric processes, and thus predict future changes at an adequate resolution. Reanalysis data (RD) is an increasingly popular alternative to overcome most of these limitations, particularly for monitoring inaccessible and remote areas such as deserts [5,6,7,8,9]. Using numerical atmospheric model outputs and data assimilation techniques (i.e., a reanalysis system) and observations from multiple data sources (e.g., upper air balloons, satellite data, aircraft observations) for multiple variables (e.g., temperature, humidity, solar radiation, geopotential height, etc.) are combined to represent the state of atmosphere at different temporal and spatial scales. The resulting data set is gridded and referred to as reanalysis (retrospective analysis) data. This has global coverage and an extended homogeneous time series with no temporal and spatial gaps [5,10].
In regions with inadequate in situ spatial coverage, RDs may be biased and their reliability is of great concern [10,11]. Previous studies have reported that RDs are not consistently reliable or equally effective due to differences in assimilation schemes and the observational data used [9,11]. RD efficiency is time [9], region [12] and weather [13] dependent, and small differences between RD and observations may lead to substantially different results [14]. Findings from studies concerning the performance of RD lack broad application due to diverse regional climate conditions [7,8]. In assessing the quality of four reanalyses representing the diurnal cycle over East Asia during summer, [11] showed that reanalyses performed differently at the subregional scale than at a large scale. Differences in local atmospheric processes and topography are among significant factors affecting the efficiency of RD [7,15].
As climate and weather modeling and data simulations methods advance along with new observations, new and improved RDs emerge, and their effectiveness should be assessed [16]. Given the diversity of subregional atmospheric processes [4], topography and scarce soundings across SWA shown in Figure 1 in Section 2, RDs are expected to perform with varying degrees of quality and accuracy. Research on this is lacking for SWA and needs to be established for the region. The availability of such knowledge is crucial not only for atmospheric studies, but also for evaluating the performance of different models and assimilation schemes, as well as the development and planning for future observational networks [8]. In fact, the region has been considered as a good area for evaluating climate models’ effectiveness [4]. The present research, thus, aims to provide a general regional evaluation of four selected reanalysis datasets at annual and seasonal scales, using sounding observations at three atmospheric heights (850, 500 and 300 hPa).
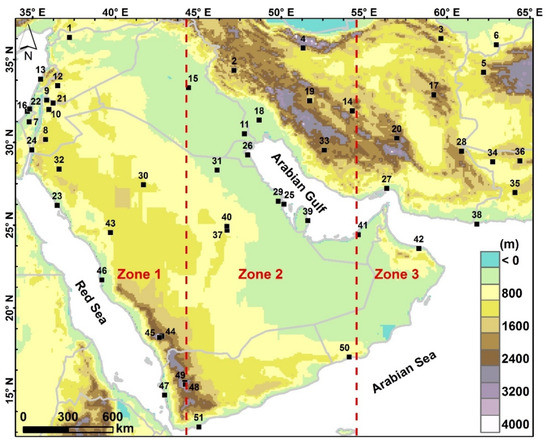
Figure 1.
A map showing the study area along with locations of Integrated Global Radiosonde Archive (IGRA) radiosonde sites used and elevation. Refer to Table S1 for key characteristics.
2. Datasets
2.1. Radiosonde Data
Upper-air observations for this study were obtained from the Integrated Global Radiosonde Archive version 2 (IGRAv2). The IGRA dataset aims to provide reliable data on the vertical structure of the atmosphere. IGRAv2 [17] is the latest version and is an enhanced version of IGRAv1 [18] with more data sources and additional variables. The data is quality controlled, as several quality control procedures are applied before archiving soundings. The data, along with documentation and background information, are available at (https://data.nodc.noaa.gov/cgi-bin/iso?id=gov.noaa.ncdc:C00975). As [19] discussed, IGRA is an acceptable source to assess the reliability of RDs. Reanalysis estimates are derived from observations from multidata sources (e.g., upper-air balloon, remote sensing, aircraft observations); this leads to competition among data sources, and models may disregard ground observations in some cases [19]. Outputs of assimilation systems are the best fits (i.e., estimates) of input observations, and when some of the inputs diverge largely from the fit, they are excluded [15]. Furthermore, RDs increasingly rely on satellite data as a key observations input [9]. Thus, IGRA can be used as a valuable source for evaluation, as in other studies (e.g., [19,20,21]).
IGRAv2 (henceforth abbreviated to IGRA) was obtained at 00 and 12 UTC periods for the selected four variables: geopotential height (gph), air temperature (tmp) and horizontal wind (U and V) at three standard vertical levels (850, 500 and 300 hPa). These levels were selected as they usually represent the lower, mid and upper troposphere layer, in which most of the weather occurs. Data was acquired for the evaluation domain (Southwest Asia) situated at 12°–36° N and 34°–65° E, shown in Figure 1 as defined by [1].
2.2. Reanalysis Data
Four well-known reanalysis datasets were inspected, as shown in Table 1. This work focuses on new reanalyses generations since they tend to have better performances as they are constructed with the state-of-the-art atmospheric models and assimilation approaches (e.g., [8,11]). ERA-Interim (ERA-I) [5] was produced by the European Center for Medium Range Weather Forecasting (ECMWF), and was initiated in 2006 to improve on some important aspects of the ERA-40 dataset. ERA-I was produced using a 4-dimensional variational analysis (4D-Var), using Cycle 31R2 of an integrated forecast system (IFS), with a 12 h analysis window on 60 vertical levels (surface up to 0.1 hPa). The fifth-generation ERA (ERA-5) [6] is the latest ECMWF atmospheric reanalysis and replaces the ERA-I, which stopped on 31 August 2019. ERA-5 provides a much higher native spatial resolution and improved global balance of precipitation and evaporation, among other key differences. This is due to improvements in the data assimilation system, IFS Cycle 41r2. The Japanese 55-year Reanalysis, or JRA-55 [22], is produced by the Japan Meteorological Agency (JMA); it employs the TL319 version of JMA’s assimilation system using recently available and improved observations. It replaces the JRA-25 reanalysis, and lessens two major biases of JRA-25 (a cold bias in the lower stratosphere and a dry bias in the Amazon basin) due to improvements in the original assimilation system. The Modern-Era Retrospective Analysis for Research and Applications version 2 (MERRA-2) [23] replaces the original MERRA reanalysis dataset. MERRA-2 uses the latest version of the Goddard Earth Observing System Data Assimilation System Version 5 (GEOS-5), as it enables assimilation of recently available observations such as modern hyperspectral radiance and microwave observations. MERRA-2 (henceforth abbreviated to MERRA) was produced by NASA’s Global Modeling and Assimilation Office, and covers the period 1980–present. These RDs are known as the third generation and readers are kindly directed to references above for more details concerning each reanalysis dataset.

Table 1.
Key characteristics of evaluated reanalyses in this study.
3. Methodology
3.1. Quality Control
The radiosonde data used was thoroughly checked to reduce uncertainty in evaluating the reliability of RDs. Stations were enrolled in this study if they met the following criteria at each examined pressure level [20,24,25]: (1) a minimum of ten months of observations for a given year; (2) at least four years of climatology data; (3) observations available at both 00 and 12 UTC; (4) at least ten data points available for a given month. Monthly climatology was calculated at station level for qualified stations, using observations at 00 and 12 UTC. Correspondingly, 00 and 12 UTC periods were used to calculate monthly climatology from RDs. RDs have shown better agreement with observational data after 1979 due to the inclusion of satellite observations [26,27]. Thus, the period 1980–2018 was considered for the analysis and to adjust for ERA-I and MERRA-2, as shown in Table 1. When two or more stations were located inside the same grid, station(s) with lower quality or shorter records were omitted; otherwise, their measurements were averaged. Following [14], monthly instead of daily averages were used for comparison to eliminate the high-frequency effects of daily time series.
3.2. Evaluation Procedure
Since both observational data and RDs originally involve some bias, a subsampling technique [24] was used: RDs were first interpolated to sounding stations [8] and then subsampled over the IGRA dataset. This approach accounts for inherent biases and allows direct comparison between reanalyses and in situ datasets (e.g., [24,28,29]). Given the uneven distribution of stations shown in Figure 1, and to capture spatial differences, the study domain was divided into three equally sized longitude zones (e.g., [8,20]), as shown in Figure 1. For each zone, two common statistical measures were used to compare RDs with the radiosonde data: mean bias (reanalysis minus radiosonde) and a weighted version of coefficient of determination (r2). It is well documented that coefficient of determination (r2) is an inadequate measure of model performance, as a weakly performing model could still achieve a high r2 value [30,31]. As showed by [31], this limitation can be overcome by including the slope (b) of the regression line between observations and estimates to weigh r2 and values range from one (optimum) to zero:
Additionally, graphical plots were used for visual performance analysis to compare the statistical distributions using a probability distribution function (PDF). The main advantage of visual analysis is that any remaining or hidden biases in the above statistical evaluations can be detected [32]. A multi-validation approach was used to allow different aspects of RDs performances to be examined [31,32]. Following [33], root-mean-square error statistic was avoided, as it is not purely a function of average error and generally elevates the mean errors. Evaluations were carried out at annual and seasonal levels. Although ERA-I and ERA5 data could be obtained at higher spatial resolutions from the ECMWF data server, native resolutions were kept, as their accuracies would not be improved with downscaling [34].
4. Results and Discussion
4.1. Annual Climatology
First, the observed vertical annual climatology means of gph, tmp and horizontal wind (U and V) are presented and then compared with analyses, as shown in Figure 2. The annual mean observed gphs over the region exhibited eastward decreasing patterns at all heights. Over zone one, the average observed gphs were 1507, 5830 and 9584 m at 850, 500 and 300 hPa, respectively. Over zones two and three, the average observed heights were lower (compared to zone one) by about 4 and 7 m at 850 hPa. As altitude increases, the differences rise to 11 and 48 m (at 500 hPa), then 19 and 80 m (at 300 hPa). Similarly, eastward decreasing patterns were found for tmp at 500 and 300 hPa. Mean observed tmps were −10 (500 hPa) and −35 °C (300 hPa) over zone one with differences of less than 0.5 °C over zone two and about 2 °C over zone three. Near the surface (850 hPa), the average observed tmps were 19, 20 and 16 °C over zones one, two and three, respectively.
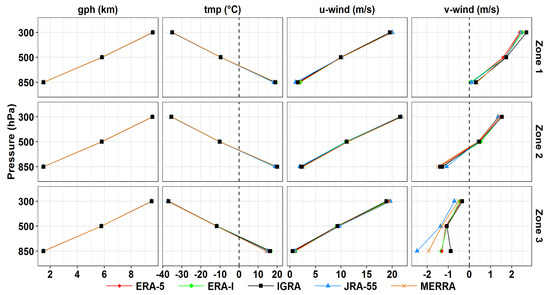
Figure 2.
Annual mean vertical profiles of geopotential height (gph), air temperature (tmp) and horizontal wind averaged over soundings, along with means from the four reanalysis products.
The annual mean-observed u-wind component showed that the winds were mainly westerlies over the region as shown in Figure 2, increasing in magnitude with altitude as the effects of surface diminish. Higher westerly averages were obtained at all heights over zone two (2, 11 and 22 m/s at 850, 500 and 300 hPa, respectively), followed by zones one (1.5, 10 and 20 m/s at 850, 500 and 300 hPa, respectively) and three (0.8, 9 and 19 m/s at 850, 500 and 300 hPa, respectively). Such patterns may reflect the locations of stations, as most of the stations in zone two were in flat, open surfaces, as shown in Figure 1. For meridional wind (V), values were positive over zone one at all heights, ranging from 0.33 to 2.7 m/s, followed by those over zone two at the upper levels, ranging from 0.5 to 1.5 m/s. Negative V values were over zone three at all heights (~−1 m/s at 850 and 500 hPa and −0.3 m/s at 300 hPa) and over zone two at 850 hPa (−1.22 m/s).
The results presented in Figure 2 shows that RDs generally followed the overall patterns of observed climatology, but with differences in magnitudes. Figure 3 shows the overall mean bias for the vertical profiles for the examined variables. All RDs had underestimated gphs over all zones increasing from −4 to −22 m and biases tended to increase with altitudes by most of RDs. Over zone one, RDs exposed similar bias values at 850 hPa (~−10 m), except ERA-I which showed a higher bias of −12.5 m. At 500 and 300 hPa MERRA showed the lowest bias values (~−12 m) followed by ERA-I (−14 m) with stable biases at both levels. Over zones two and three, inverse patterns were found; an RD recorded the lowest bias at 850 hPa and the highest or second highest bias at 300 hPa. However, the deviations among RDs at 850 hPa (500 hPa) were in the order of a few meters over both zones (zone 2); ERA-I thus performed reasonably. In general, these bias values may not be that significant for capturing the general climatological features (not the magnitudes) in gph over the region, as both values and the PDF suggest, as shown in Figure 4 and Figure 5. RDs showed comparable weighted coefficients at each level as displayed in Figure 4, and ERA-5 had the minima in all cases. Correspondingly, acceptable resampling of the general distributions (i.e., PDF) of observed gph was achieved by most of the RDs at the upper levels, compared to at 850 hPa, as shown in Figure 5. In most cases, ERA-5 showed the worst resampling. Both r2 and PDF showed that agreements between estimated and observed gphs were higher at upper levels as the effects of local factors minimized. This suggests more consideration is needed when selecting RDs for gph studies near the surface.
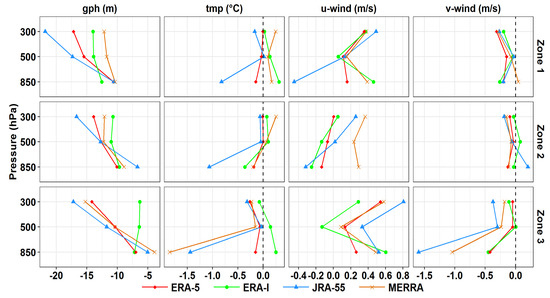
Figure 3.
Vertical profiles of annual mean biases (reanalysis–radiosonde) of gph (m), tmp (°C), and horizontal wind (m/s).
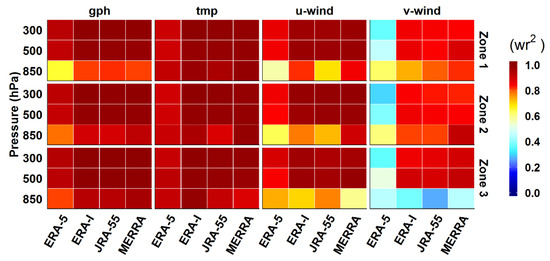
Figure 4.
Weighted coefficients (r2) of the vertical profiles of gph (m), tmp (°C), and horizontal wind (m/s) at annual scale.
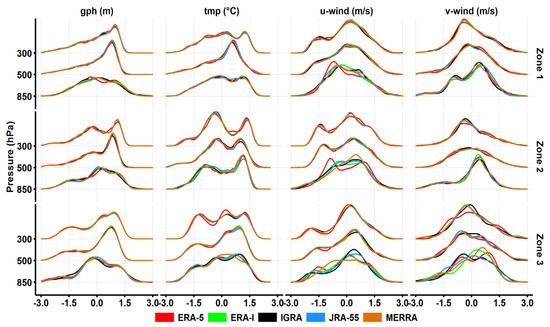
Figure 5.
Probability distribution function (PDF) of the vertical profiles of gph (m), tmp (°C), and horizontal wind (m/s) at annual scale.
The mean biases of temperature for all datasets were small and were mostly within ±0.3 °C, except at lower altitudes for JRA-55 (across zones) and MERRA (over zone three), as shown in Figure 3. The corresponding r2 values showed similar patterns in the lower troposphere and were nearly higher than ~0.9, as shown in Figure 4. ERA-I and MERRA tended to obtain weighted coefficients close to one at all heights over zones one and two and at upper levels over zone three. Both datasets reasonably resembled the distribution of observed tmps across zones one and two, and MERRA (ERA-I) outperformed other RDs at 850 hPa over zone two (three), as shown in Figure 5. For the u-wind component, overestimations were found over zones one and three through the vertical column, except in the upper troposphere (zone three) and lower troposphere (zone one) by ERA-I and JRA-55, respectively, as shown in Figure 3. Excluding JRA-55, bias values ranged from −0.25 to 0.60 m/s. RDs tended to show relatively similar biases at each height in most cases. Both r2 and PDF showed fair agreement between estimated and observed U in the middle and upper troposphere, excluding ERA-5 which exhibited the lowest r2 values, as shown in Figure 4 and Figure 5. At 850 hPa, no RD fully captured the observed zonal wind distribution, as shown by r2 and PDF. Bias values for V-wind were within an extremely low range of ±0.25 m/s at all heights over zones one and two. Over zone three, biases were within a wider range, and ERA-I and ERA-5 exhibited the lowest values (−0.45 to 0.00 m/s). Weighted coefficients for meridional wind tended to be smaller than the other variables; RDs showed comparable values at each height excluding ERA-5, which had the lowest values in all cases, except at 850 hPa over zone three, as shown in Figure 4.
4.2. Seasonal Climatology
Seasonal variations in the climatology of the vertical column of observed gph, tmp, and wind are shown in Figure 6. The 850 hPa altitude is lower during summer (1475 m on average) and higher during autumn (1523 m on average) across all zones. At zone level, 850 hPa is at the lowest altitude over zone two followed by zones three and one, during summer. This pattern is related to the presence of the Indian summer monsoon trough (a thermal trough) accompanied by the Arabian heat low situated over the Empty Quarter desert (zone two). The 500 hPa and 300 hPa altitudes are higher during summer (5882 and 9725 m on average, respectively) and lower during winter (5730 and 9397 m on average, respectively) across all zones. Comparing zones, 300 and 500 hPa are at higher altitudes over zone one, with westward decreasing patterns through the year. However, during summer, 300 hPa is highest over zone two, followed by zones one and three. Temperatures decrease with height and are highest during summer, followed by autumn, spring and winter, throughout the vertical column, as shown in Figure 6. Over zone three, tmp is the lowest at all heights through the year, as most of the stations are located at higher altitudes, as shown in Figure 1. Throughout the year, u-wind is mostly westerly, with lower magnitude during autumn (< 1 m/s) and higher during winter (31–37 m/s) across SWA. The seasonal differences at the 850 hPa level are within 3 m/s and as altitudes increase, the zonal wind increases at a higher (lower) rate during winter (summer), and more frequently over zone 2. There are also higher westerlies at higher altitudes over zone two, except during summer. The meridional wind showed a lower vertical variation rate with altitude, and mostly increased with altitudes. Negative u-wind means were distinguished during summer and autumn over zones three (at all heights) and two at 850 and 500 hPa, and during spring at 850 hPa. The surface horizontal wind was mostly higher during winter; this could be related to winter Shamal (northerly and northwesterly winds).
Figure 6.
Seasonal mean vertical profiles of gph, tmp, and horizontal wind averaged over soundings.
Reanalysis data did not perform equally at the seasonal level. All reanalyses underestimated gph over the entire region, except for ERA-5 during spring at the upper levels, as shown in Figure 7a. During winter, the mean biases of gph ranged from −9 (850 hPa) to −24 m (300 hPa) over zone one; MEERA had the smallest mean bias values at all the pressure levels (−9 to −13 m), followed by ERA-I with roughly 2 m greater differences at the upper levels. However, over zone one, ERA-I outperformed MEERA in representing the gph’s distribution of soundings, as displayed in Figure 7a. Over zones two and three, mean gph biases ranged from −8 to −18 m (zone two) and −3 to −20 m (zone three); ERA-I showed the minimum biases at most heights during winter. During spring, mean gph biases were mostly similar over each zone, −8 to −19 m (zone two), −7 to −18 m (zone three) and −10 to −21 m (zone one), excluding ERA-5 which showed large differences from observations in most cases. During this season, most RDs displayed comparable gph biases at 850 hPa over each zone, and MEERA (ERA-I) showed smaller biases at upper levels over zones one and two (three). Nevertheless, r2 values were lower in the lower troposphere (except over zone three) and higher at the upper levels shown in Figure 7c, with relatively comparable values. In comparing frequency distributions at upper levels, RDs showed relatively similar performances, except for ERA-5, which tended to perform worst in most cases, as displayed in Figure 7b. During summer, most RDs presented similar biases at each pressure level. Over zones two and three during this season, RDs with small mean biases in the lower troposphere tended to record the highest biases in the upper troposphere. Looking at the r2 index, no major differences among RDs at each of the upper levels were found (excluding, JRA-55, which showed the lowest values). However, no RD outperformed the others in representing the distribution of soundings, as shown in Figure 7b. During autumn, all datasets (not including ERA-5) showed relatively similar gph biases at each pressure level over all zones with ~5 m differences at 850 and 500 hPa and within ~10 m differences at 300 hPa. During this season, ERA-5 performed the poorest at the upper levels, as confirmed by r2 values and PDF, as shown in Figure 7b,c.
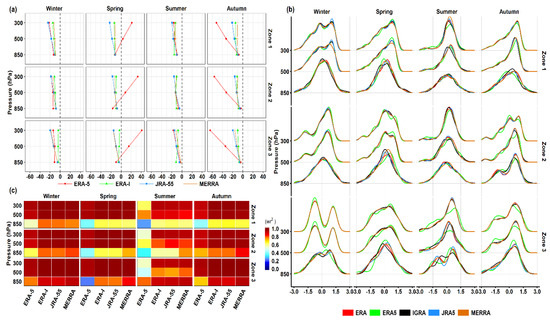
Figure 7.
Seasonal comparison of vertical mean biases (a), PDF (b) and weighed coefficients (c) of geopotential height (m).
The vertical mean biases, r2, and PDF of tmp at subregional and seasonal levels are shown in Figure 8. The mean bias values of ERA-5 were the most abundant (> ±1 °C) across zones during spring (warming biases) and autumn (cold biases). As showing in Figure 8c, the lowest r2 values for tmp were obtained by ERA-5 across seasons and zones more frequently with low PDF performances during transitional seasons, as shown in Figure 8b. For the other RDs during transitional seasons, ERA-I tended to achieve the lowest mean biases at 300 hPa across SWA with no substantial differences at 500 hPa (about ±0.3 °C). At the 850 hPa level, ERA-I and MERRA performed similarly (about ±0.2 °C) over zones one and two throughout seasons and achieved small biases and high weighed coefficients interchangeably. During winter and summer, all RDs showed mean bias values of tmp within ±0.5 °C at 300 and 500 hPa, across all zones. These were higher during summer and over zone three. At both heights, ERA-5 tended to obtain the lowest weighed coefficients shown in Figure 8c, with low PDF performance shown in Figure 8b. Over zone three and at 850 hPa, ERA-I showed the highest weighted coefficient with the smallest tmp bias values (within ±0.25 °C) across seasons, except during spring (0.5 °C).
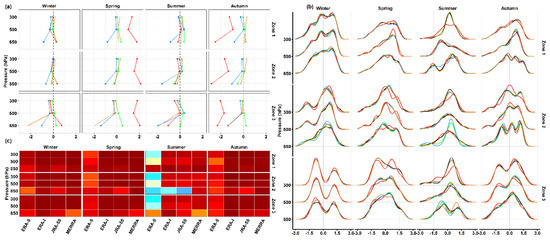
Figure 8.
As in Figure 7, but for temperature (°C).
Over zones one and two, the mean biases of v-wind were small. Excluding ERA-5 during spring and autumn, they were regularly within ±0.5 m/s throughout the vertical column and across seasons, as shown in Figure 9a. Over zone three, biases increase near the surface with mostly negative directions. Generally, the mean bias indicator showed that all RDs tended to obtain similar values in the upper troposphere (excluding ERA-5 in some cases). Weighted coefficients were smaller for the lower troposphere, and ERA-5 had the lowest values across zones and throughout the vertical column, as displayed in Figure 9c. The corresponding PDF showed that RDs performed similarly in the upper troposphere, where ERA-5 showed the smallest agreement in most cases, as shown in Figure 9b. Near the surface, PDF tended to show less agreement, particularly over zone three and RDs achieved interchangeable performance.
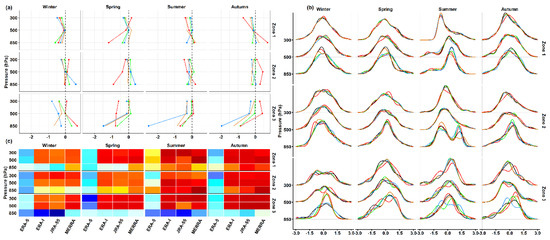
Figure 9.
As in Figure 7, but for v-wind (m/s).
For zonal wind, large mean biases were recorded during spring and autumn by ERA-5, whereas other datasets showed values ranging from −0.5 to 1 m/s during spring (largest over zone three) and within ±0.5 m/s during autumn, as shown in Figure 10a. During both seasons, RDs (excluding ERA-5) showed no fundamental differences at each height, as generally indicated by r2, as shown in Figure 10c. During winter, most RDs (excluding JRA-55) overestimated observed u-wind over zones one (within about 1 m/s) and three (within about 0.5 m/s. Over zone two, JRA-55 showed no biases (less than 0.1 m/s) at 850 and 500 hPa, whereas other RDs exhibited biases within about ±0.5 m/s throughout the vertical column. During summer, biases were within ±1 m/s and RDs (excluding ERA-5) tended to show relatively similar performances at 300 and 500 hPa as suggested by r2. As PDF indicates, ERA-5 showed the highest deviation from observed u-wind distribution across zones during summer, as shown in Figure 10b. Other datasets displayed comparably good performance at upper levels over zones one and two, during summer. Over zone three, JRA-55 showed the best resampling performance at 850 hPa over zone three during summer, as it had the highest r2 values, as shown in Figure 10b,c.
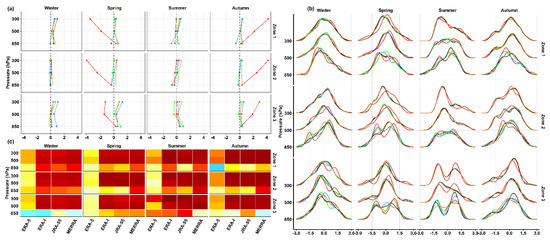
Figure 10.
As in Figure 7, but for u-wind (m/s).
5. Summary and Conclusions
The capability of four reanalyses to capture general climatology features within the troposphere layer in SWA was assessed. It was found that most RDs represent the climatology of the lower, mid and upper troposphere generally, but with differences in magnitudes. In the lower troposphere, RDs overestimated gph with comparable differences (mean biases) from soundings over all zones, with similar weighted coefficients (except for ERA-5). In the midtroposphere, all RDs showed similar gph bias performances over zone two. At upper altitudes, ERA-I showed the lowest biases over zones two and three, and MERRA showed the lowest biases over zone one. Nevertheless, both were comparable over zones two and three. For tmp, all RDs performed equally in terms of mean biases and weighted coefficients at upper altitudes, across zones. However, ERA-5 had a stronger tendency to deviate from the soundings’ distributions. For zonal wind, biases were within lower ranges (−0.25 to 0.4 m/s) over zones one and two (excluding JRA-55); ERA-5 displayed the lowest unity (weighted coefficient) and PDF performance. A relatively similar finding was seen over zone three but with a larger bias range. For v-wind, all RDs showed similar weighted coefficients (excluding ERA-5) and biases over zones one and two. Over zone three, ERA-I and ERA-5 showed the smallest biases and ERA-5 showed the lowest weighted coefficient values.
At seasonal scale, MERRA and ERA-I showed reasonable fits over zones one and two for both gph (except during summer, where no dataset outperformed at all heights) and tmp. Over zone three, ERA-I had a higher tendency to show reasonable performance in estimating gph and tmp. For v-wind, RDs (except for MERRA) behaved similarly across zones and seasons, and ERA-I tended to achieve higher r2 values and PDF performance in most cases. For u-wind, RDs showed similar performance during spring and autumn (excluding ERA-5), but they performed interchangeably during other seasons. At both annual and seasonal scales, mean bias values were higher at the upper levels for most variables. During transition seasons (autumn and spring), ERA-5 tended to experience large biases in all zones (e.g., Figure 7 and Figure 8). This is highly related to the dataset itself rather than to the weather conditions over the region, as the other RDs did not display such an issue. Biases and differences among RDs at different timescales and subregional levels are due to several reasons, including differences in the assimilated input observations, assimilation methods, resolutions (horizontal and vertical) [9,35] and differences in local atmospheric processes and topography [7,15]. Differences in input observations are a key reason [9,36], as different reanalysis systems rely on different subsets of inputs to assimilate the atmospheric state. For example, aircraft temperature observations are assimilated in all of the examined RDs in this work except for JRA-55, which is the only RD that assimilates satellite radiance observations form the Tropical Rainfall Measuring Mission Microwave Imager [36]. Furthermore, different RDs apply different quality control criteria, even for a given input type. For instance, satellite radiance observations assimilated from a given sensor vary among RDs [9]. For example, MERRA and JRA-55 assimilate channels 4–14 from Advanced Microwave Sounding Unit-A, whereas ERA-I assimilates channels 5–14.
It should also be noted that differences in the main biases can partly be attributed to the nature of the mean bias index, as negative and positive errors cancel each other out depending on their frequencies and sizes. Both r2 and PDF tended to agree that most RDs performed reasonably at upper levels. From the climate dynamic perspective, results of r2 and PDF are more rational, as the atmosphere becomes more homogenous further from the surface (i.e., effects of local factors are minimized). RDs thus have a greater ability to produce reasonable estimates. Interestingly, most RDs showed better resampling ability at the upper and lower ends of sounding data distributions more frequently than around the means. This highlights the high potential usefulness of RDs for studying extremes over the region. At subregional levels, RDs tended to produce reasonable estimates over zones one and two; this may be due to the less complex topography of those zones compared to zone three. Wind components seem to be challenging variables for all RDs in this region, particularly near the surfaces as both r2 and PDF suggested. Both observations support the idea that RDs are not only time [9] and region dependent [12], but are also variable dependent, and consequently phenomena dependent. This mainly implies that when an atmospheric phenomenon is studied at a local/subregional scale using RDs, the reliability of RDs should be evaluated at the phenomenon level. In the literature, increasing effort is being made to evaluate RDs at the phenomenon and application levels (e.g., [12,28,35,37]). The results of this work also have important implications for planning future weather and climate monitoring networks and evaluating the effectiveness of models within the region.
This work was a general assessment of a set of variables at the subregional scale, and researchers considering particular phenomena are advised to view this work as a general guideline. Recommending a dataset was not possible, as no dataset outperformed others for all levels, variables, seasons and zones (although ERA-I seems to be a fair candidate). In fact, a specific recommendation was avoided here, as research objectives vary among studies, and, consequently, criteria for dataset selection vary. Additionally, all of the reanalyses (except ERA-I) examined here are operational datasets, so their quality and performance are continually monitored and updated.
Supplementary Materials
The following are available online at https://www.mdpi.com/2073-4433/11/4/402/s1, Table S1: Key characteristics of used IGRA radiosonde sites. Source: IGRA.
Funding
This research was completely funded by the Deanship of Scientific Research at King Saud University through research group program [RG-1441-344].
Acknowledgments
The author extend his appreciation to the Deanship of Scientific Research at King Saud University for funding this work through research group no.RG-1441-344. Author is grateful for free access to the used datasets.
Conflicts of Interest
The author declares no conflict of interest.
References
- Pal, J.S.; Eltahir, E.A. Future temperature in southwest Asia projected to exceed a threshold for human adaptability. Nat. Clim. Chang. 2016, 6, 197. [Google Scholar] [CrossRef]
- Lelieveld, J.; Proestos, Y.; Hadjinicolaou, P.; Tanarhte, M.; Tyrlis, E.; Zittis, G. Strongly increasing heat extremes in the Middle East and North Africa (MENA) in the 21st century. Clim. Chang. 2016, 137, 245–260. [Google Scholar] [CrossRef]
- IPCC. Climate Change 2013: The Physical Science Basis. Contribution of Working Group I to the Fifth Assessment Report of the Intergovernmental Panel on Climate Change; Stocker, T.F., Qin, D., Plattner, G.-K., Tignor, M., Allen, S.K., Boschung, J., Nauels, A., Xia, Y., Bex, V., Midgley, P.M., Eds.; Cambridge University Press: Cambridge, UK; New York, NY, USA, 2013; p. 1535. [Google Scholar]
- Evans, J.P.; Smith, R.B.; Oglesby, R.J. Middle East climate simulation and dominant precipitation processes. Int. J. Climatol. J. R. Meteorol. Soc. 2004, 24, 1671–1694. [Google Scholar] [CrossRef]
- Dee, D.P.; Uppala, S.M.; Simmons, A.J.; Berrisford, P.; Poli, P.; Kobayashi, S.; Andrae, U.; Balmaseda, M.A.; Balsamo, G.; Bauer, D.P.; et al. The ERA-Interim reanalysis: Configuration and performance of the data assimilation system. Q. J. R. Meteorol. Soc. 2011, 137, 553–597. [Google Scholar] [CrossRef]
- Hersbach, H.; Bell, B.; Berrisford, P.; Horányi, A.; Muñoz, J.S.; Nicolas, J.; Radu, R.; Schepers, D.; Simmons, A.; Soci, C.; et al. Global reanalysis: Goodbye ERA-Inteirm, hello ERA5. Ecmwf. Newsl. 2019, 159, 17–24. [Google Scholar]
- Szot, S.; Kosowski, M. A comparison of the radiosonde and NCEP–NCAR Reanalysis data over Central Europe. In Proceedings of the International Scientific Conference Environmental Changes and Adaptation Strategies, Skalica, Slovakia, 9–11 September 2013. [Google Scholar]
- Bao, X.; Zhang, F. Evaluation of NCEP–CFSR, NCEP–NCAR, ERA-Interim, and ERA-40 reanalysis datasets against independent sounding observations over the Tibetan Plateau. J. Clim. 2013, 26, 206–214. [Google Scholar] [CrossRef]
- Bao, X.; Zhang, F. How Accurate Are Modern Atmospheric Reanalyses for the Data-Sparse Tibetan Plateau Region? J. Clim. 2019, 32, 7153–7172. [Google Scholar] [CrossRef]
- Chen, B.; Liu, Z. Global water vapor variability and trend from the latest 36 year (1979 to 2014) data of ECMWF and NCEP reanalyses, radiosonde, GPS, and microwave satellite. J. Geophys. Res. Atmos. 2016, 121, 11–442. [Google Scholar] [CrossRef]
- Chen, G.; Iwasaki, T.; Qin, H.; Sha, W. Evaluation of the warm-season diurnal variability over East Asia in recent reanalyses JRA-55, ERA-Interim, NCEP CFSR, and NASA MERRA. J. Clim. 2014, 27, 5517–5537. [Google Scholar] [CrossRef]
- Chen, S.; Gan, T.Y.; Tan, X.; Shao, D.; Zhu, J. Assessment of CFSR, ERA-Interim, JRA-55, MERRA-2, NCEP-2 reanalysis data for drought analysis over China. Clim. Dyn. 2019, 53, 737–757. [Google Scholar] [CrossRef]
- Dong, Y.; Li, G.; Yuan, M.; Xie, X. Evaluation of five grid datasets against radiosonde data over the eastern and downstream regions of the Tibetan Plateau in summer. Atmosphere 2017, 8, 56. [Google Scholar] [CrossRef]
- Mooney, P.A.; Mulligan, F.J.; Fealy, R. Comparison of ERA-40, ERA-Interim and NCEP/NCAR reanalysis data with observed surface air temperatures over Ireland. Int. J. Climatol. 2011, 31, 545–557. [Google Scholar] [CrossRef]
- Schafer, R.; Avery, S.K.; Gage, K.S. A comparison of VHF wind profiler observations and the NCEP–NCAR reanalysis over the tropical Pacific. J. Appl. Meteorol. 2003, 42, 873–889. [Google Scholar] [CrossRef]
- Hodges, K.I.; Lee, R.W.; Bengtsson, L. A comparison of extratropical cyclones in recent reanalyses ERA-Interim, NASA MERRA, NCEP CFSR, and JRA-25. J. Clim. 2011, 24, 4888–4906. [Google Scholar] [CrossRef]
- Durre, I.; Vose, R.S.; Yin, X.; Applequist, S.; Arnfield, J. Integrated Global Radiosonde Archive (IGRA) Version 2; NOAA National Centers for Environmental Information: Asheville, NC, USA, 2016; Volume 10, p. V5X63X0Q. [Google Scholar]
- Durre, I.; Vose, R.S.; Wuertz, D.B. Overview of the integrated global radiosonde archive. J. Clim. 2006, 19, 53–68. [Google Scholar] [CrossRef]
- Dufour, A.; Zolina, O.; Gulev, S.K. Atmospheric moisture transport to the Arctic: Assessment of reanalyses and analysis of transport components. J. Clim. 2016, 29, 5061–5081. [Google Scholar] [CrossRef]
- Wang, J.S.; Seidel, D.J.; Free, M. How well do we know recent climate trends at the tropical tropopause? J. Geophys. Res. Atmos. 2012, 117. [Google Scholar] [CrossRef]
- Xian, T.; Homeyer, C.R. Global tropopause altitudes in radiosondes and reanalyses. Atmos. Chem. Phys. 2019, 19, 5661–5678. [Google Scholar] [CrossRef]
- Kobayashi, S.; Ota, Y.; Harada, Y.; Ebita, A.; Moriya, M.; Onoda, H.; Onogi, K.; Kamahori, H.; Kobayashi, C.; Endo, H.; et al. The JRA-55 reanalysis: General specifications and basic characteristics. J. Meteorol. Soc. Jpn. Ser. Ii 2015, 93, 5–48. [Google Scholar] [CrossRef]
- Gelaro, R.; McCarty, W.; Suárez, M.J.; Todling, R.; Molod, A.; Takacs, L.; Randles, C.A.; Darmenov, A.; Bosilovich, M.G.; Reichle, R.; et al. The modern-era retrospective analysis for research and applications, version 2 (MERRA-2). J. Clim. 2017, 30, 5419–5454. [Google Scholar] [CrossRef]
- Waliser, D.E.; Shi, Z.; Lanzante, J.R.; Oort, A.H. The Hadley circulation: Assessing NCEP/NCAR reanalysis and sparse in-situ estimates. Clim. Dyn. 1999, 15, 719–735. [Google Scholar] [CrossRef]
- Bauer, M.; Del Genio, A.D.; Lanzante, J.R. Observed and simulated temperature–humidity relationships: Sensitivity to sampling and analysis. J. Clim. 2002, 15, 203–215. [Google Scholar] [CrossRef][Green Version]
- Randel, W.J.; Wu, F.; Gaffen, D.J. Interannual variability of the tropical tropopause derived from radiosonde data and NCEP reanalyses. J. Geophys. Res. Atmos. 2000, 105, 15509–15523. [Google Scholar] [CrossRef]
- Bengtsson, L.; Hagemann, S.; Hodges, K.I. Can climate trends be calculated from reanalysis data? J. Geophys. Res. Atmos. 2004, 109. [Google Scholar] [CrossRef]
- Mathew, S.S.; Kumar, K.K.; Subrahmanyam, K.V. Hadley cell dynamics in Japanese Reanalysis-55 dataset: Evaluation using other reanalysis datasets and global radiosonde network observations. Clim. Dyn. 2016, 47, 3917–3930. [Google Scholar] [CrossRef]
- You, Q.; Fraedrich, K.; Ren, G.; Pepin, N.; Kang, S. Variability of temperature in the Tibetan Plateau based on homogenized surface stations and reanalysis data. Int. J. Climatol. 2013, 33, 1337–1347. [Google Scholar] [CrossRef]
- Legates, D.R.; McCabe, G.J., Jr. Evaluating the use of “goodness-of-fit” measures in hydrologic and hydroclimatic model validation. Water Resour. Res. 1999, 35, 233–241. [Google Scholar] [CrossRef]
- Krause, P.; Boyle, D.P.; Bäse, F. Comparison of different efficiency criteria for hydrological model assessment. Available online: https://www.adv-geosci.net/5/89/2005/ (accessed on 10 April 2020).
- Bennett, N.D.; Croke, B.F.; Guariso, G.; Guillaume, J.H.; Hamilton, S.H.; Jakeman, A.J.; Marsili-Libelli, S.; Newham, L.T.; Norton, J.P.; Perrin, C.; et al. Characterising performance of environmental models. Environ. Model. Softw. 2013, 40, 1–20. [Google Scholar] [CrossRef]
- Willmott, C.J.; Matsuura, K. Advantages of the mean absolute error (MAE) over the root mean square error (RMSE) in assessing average model performance. Clim. Res. 2005, 30, 79–82. [Google Scholar] [CrossRef]
- ECMWF. Does Downloading Data at Higher Resolution Improve the Output? Available online: https://confluence.ecmwf.int//display/CKB/Does+downloading+data+at+higher+resolution+improve+the+output (accessed on 12 February 2020).
- Jones, P.; Harpham, C.; Troccoli, A.; Gschwind, B.; Ranchin, T.; Wald, L.; Goodess, C.; Dorling, S. Using ERA-Interim reanalysis for creating datasets of energy-relevant climate variables. Earth Syst. Sci. Data Discuss. 2017. [Google Scholar] [CrossRef]
- Fujiwara, M.; Wright, J.S.; Manney, G.L.; Gray, L.J.; Anstey, J.; Birner, T.; Davis, S.; Gerber, E.P.; Harvey, V.L.; Hegglin, M.I.; et al. Introduction to the SPARC Reanalysis Intercomparison Project (S-RIP) and overview of the reanalysis systems. Atmos. Chem. Phys. 2017, 17, 1417–1452. [Google Scholar] [CrossRef]
- Tarek, M.; Brissette, F.P.; Arsenault, R. Evaluation of the ERA5 reanalysis as a potential reference dataset for hydrological modeling over North-America. Hydrol. Earth Syst. Sci. Discuss. 2019, 1–35. [Google Scholar] [CrossRef]
© 2020 by the author. Licensee MDPI, Basel, Switzerland. This article is an open access article distributed under the terms and conditions of the Creative Commons Attribution (CC BY) license (http://creativecommons.org/licenses/by/4.0/).