Changes of Extreme Temperature and Its Influencing Factors in Shiyang River Basin, Northwest China

 ,
, 
Abstract
1. Introduction
2. Data and Methods
2.1. Study Area
2.2. Materials and Methods
2.2.1. Data Sources and Quality Controls
Meteorological Data
Amospheric Circulation Indices
2.2.2. Extreme Temperatures Indices
2.2.3. Method
Climate Tendency Rate
Weighted Average Method
Other Methods
3. Results
3.1. Temporal Variation Characteristics of Extreme Temperatures Indices
3.1.1. Variation Characteristics of Interannual and Interdecadal Warm Indices
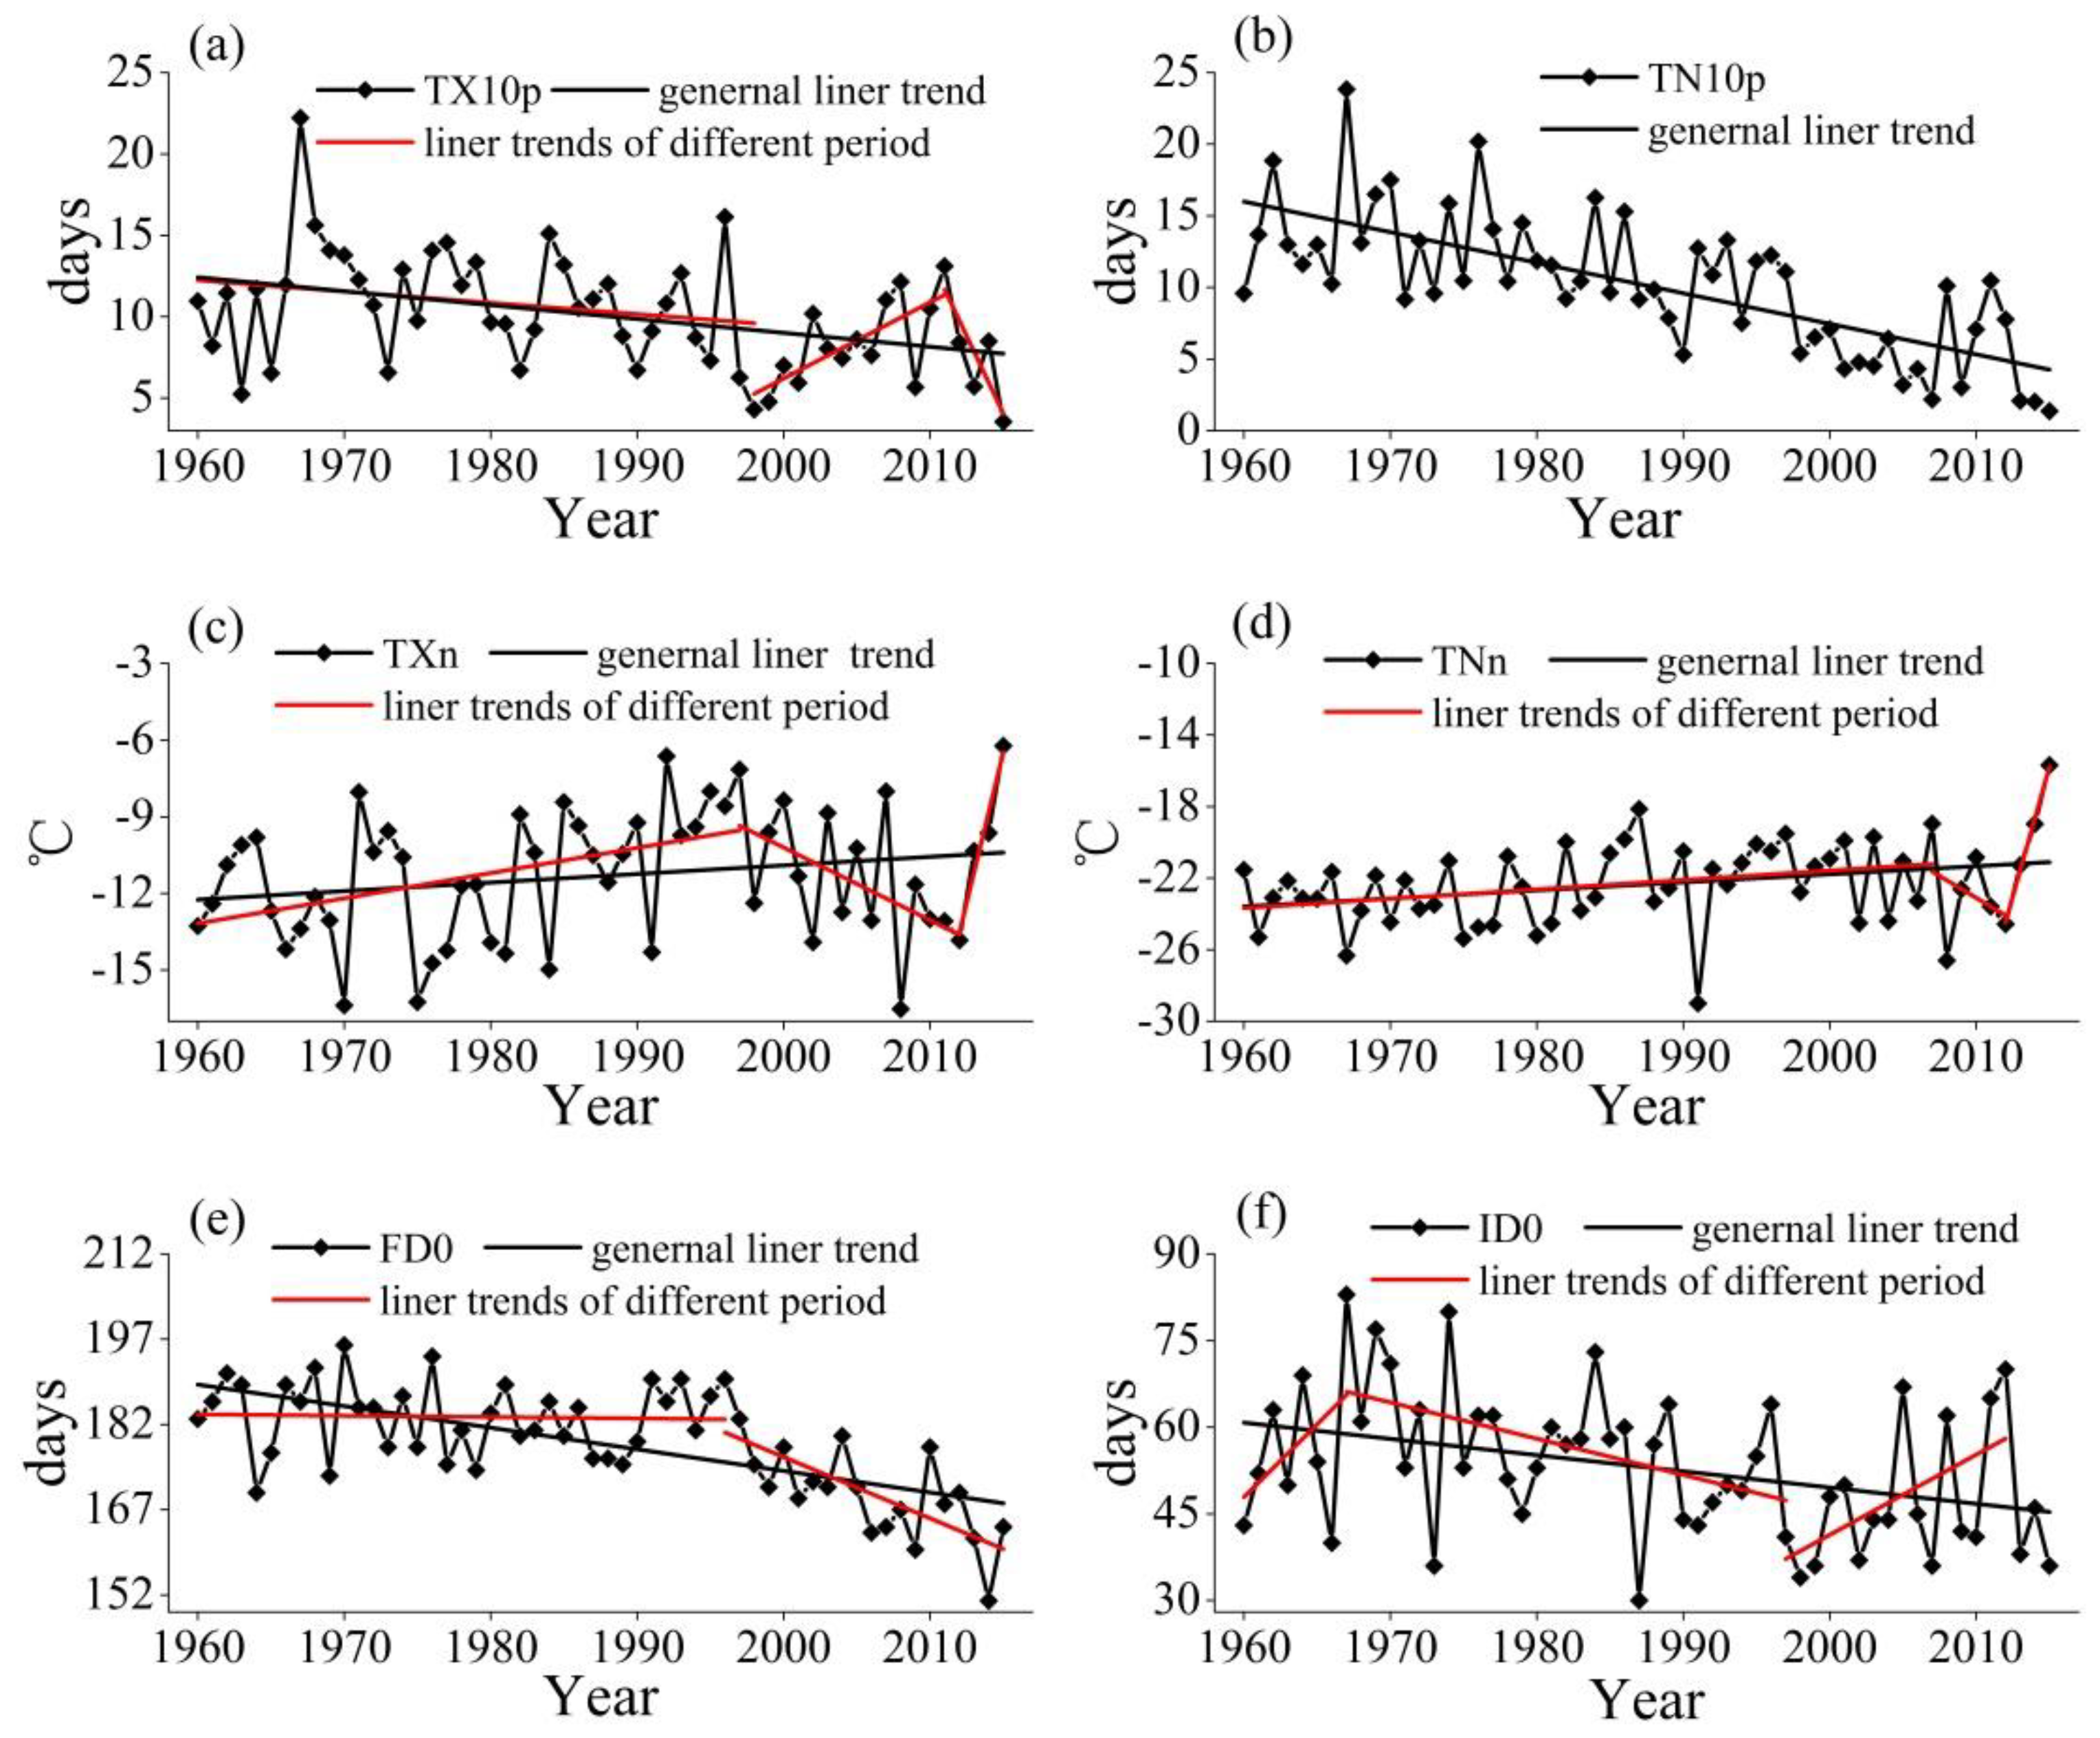
3.1.2. Variation Characteristics of Interannual and Interdecadal Cold Indices
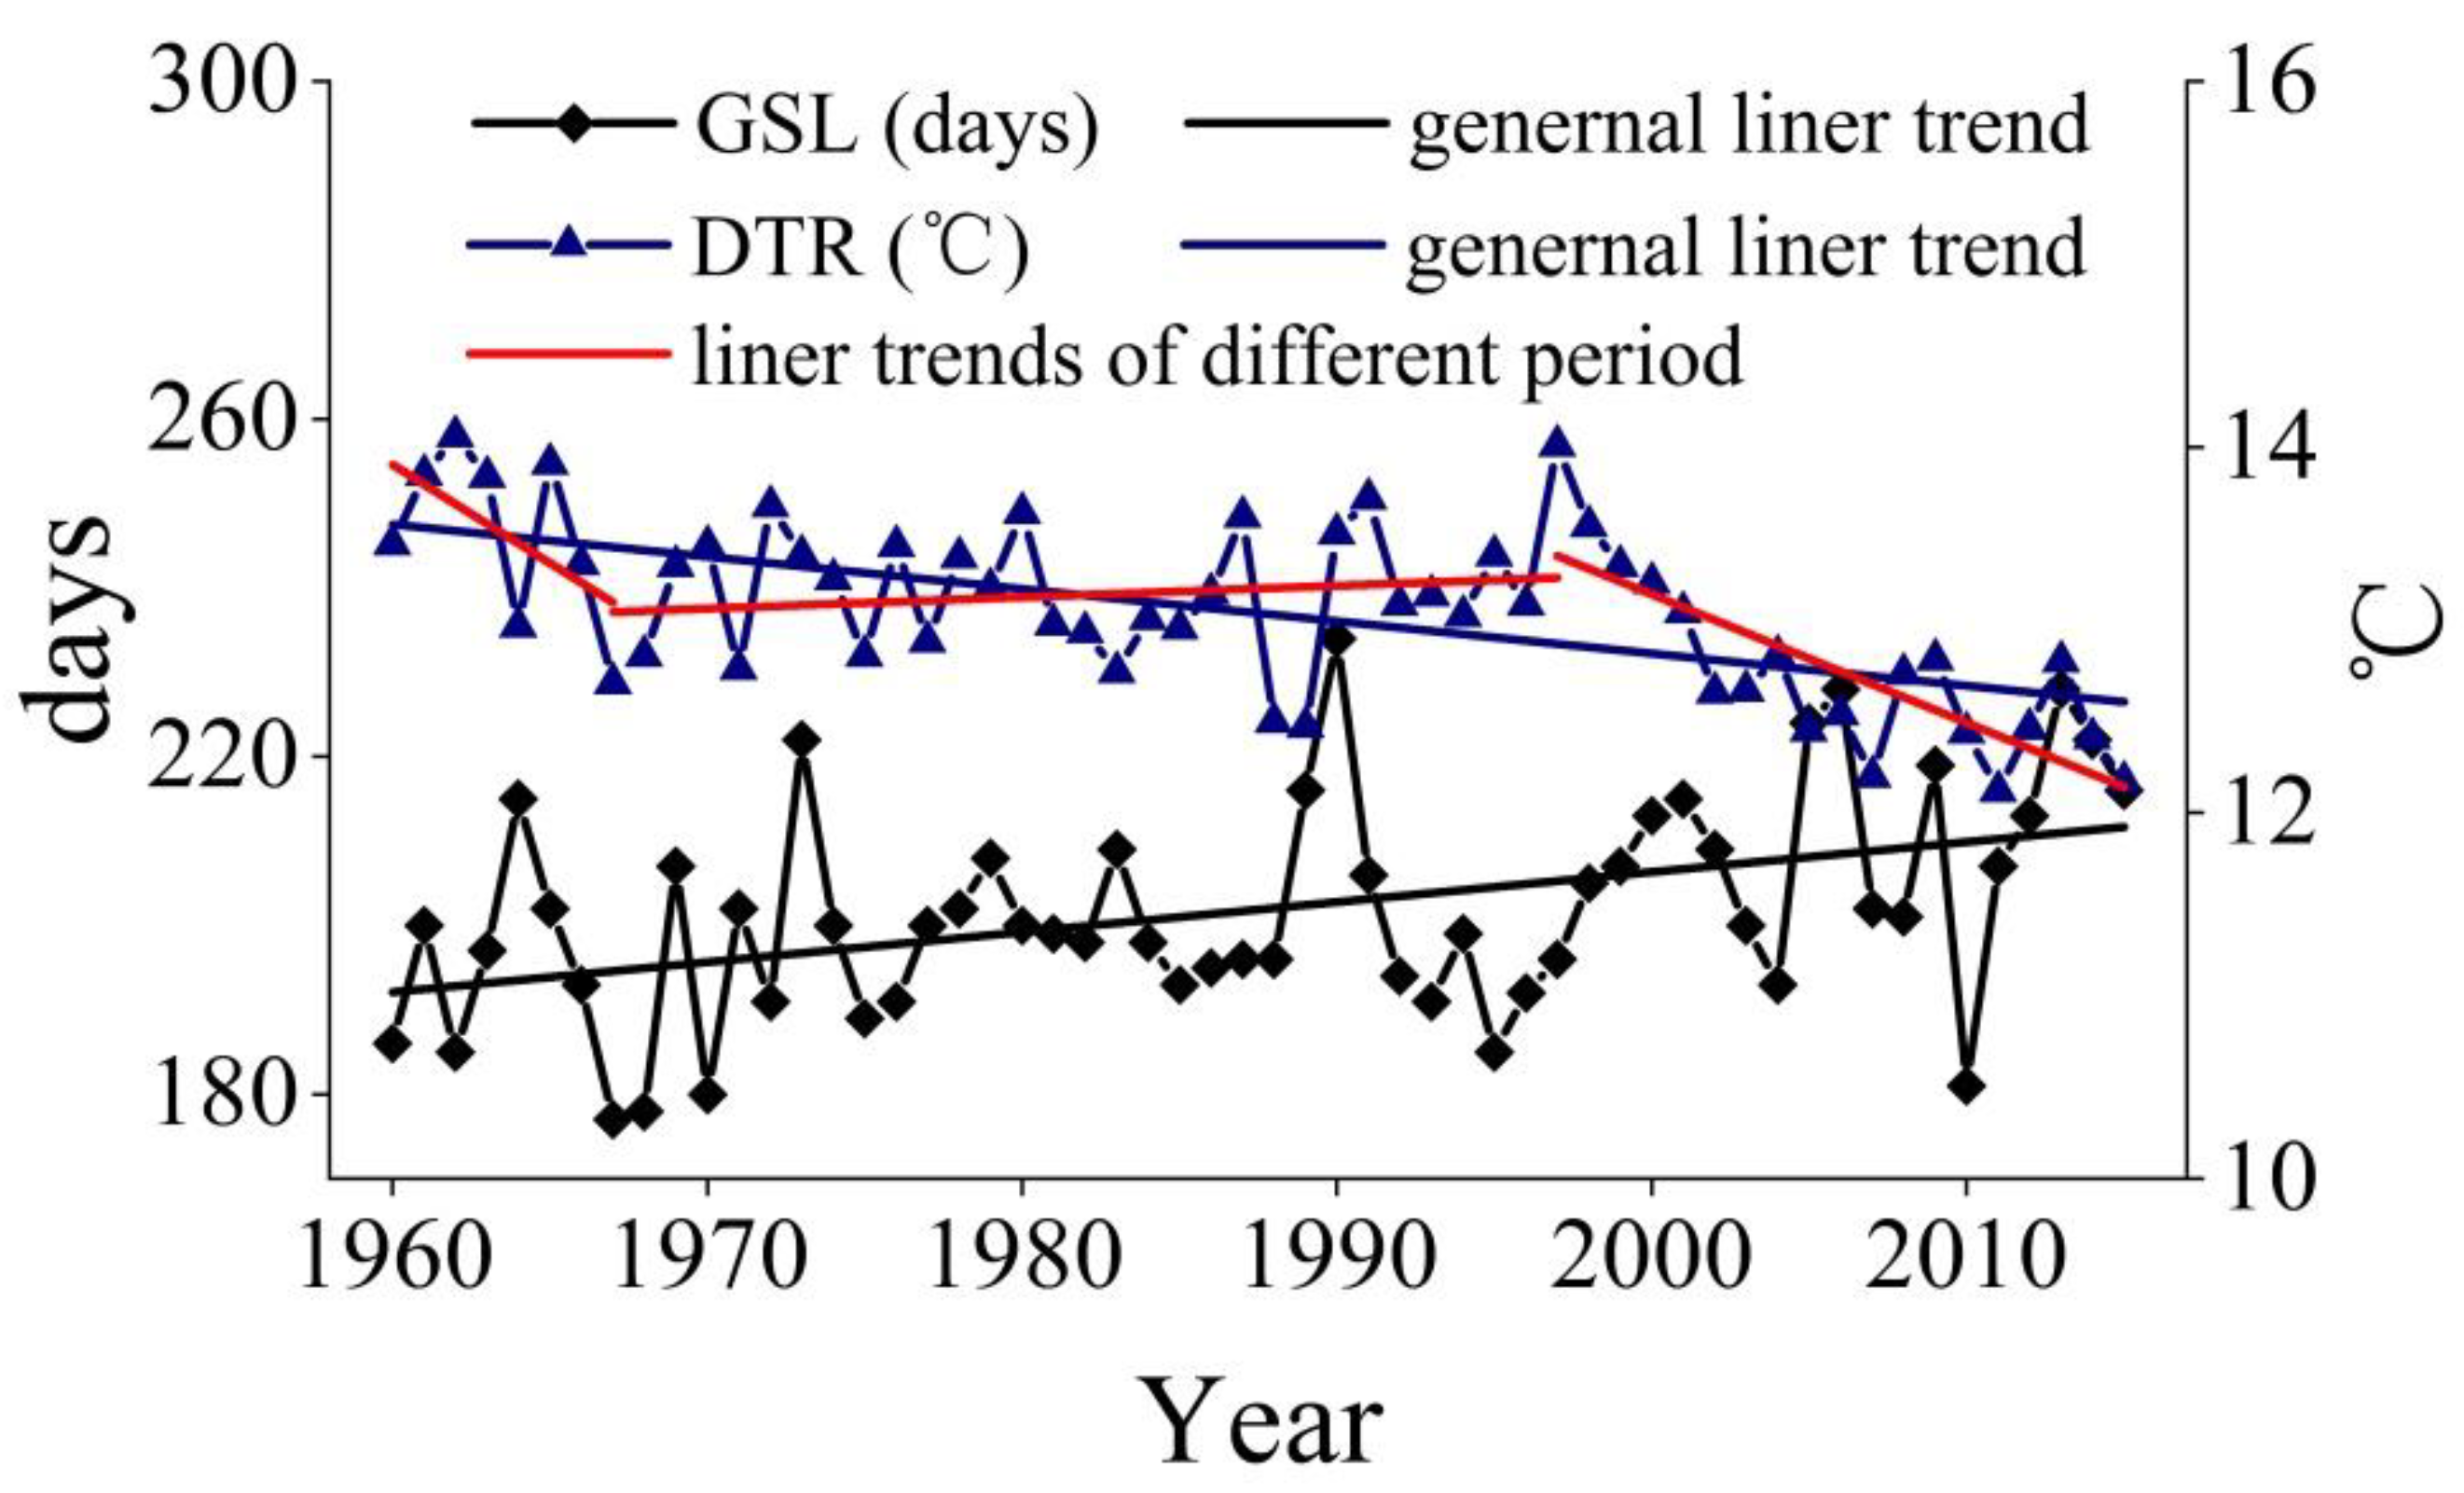
3.1.3. Variation Characteristics of Interannual and Interdecadal Other Indices
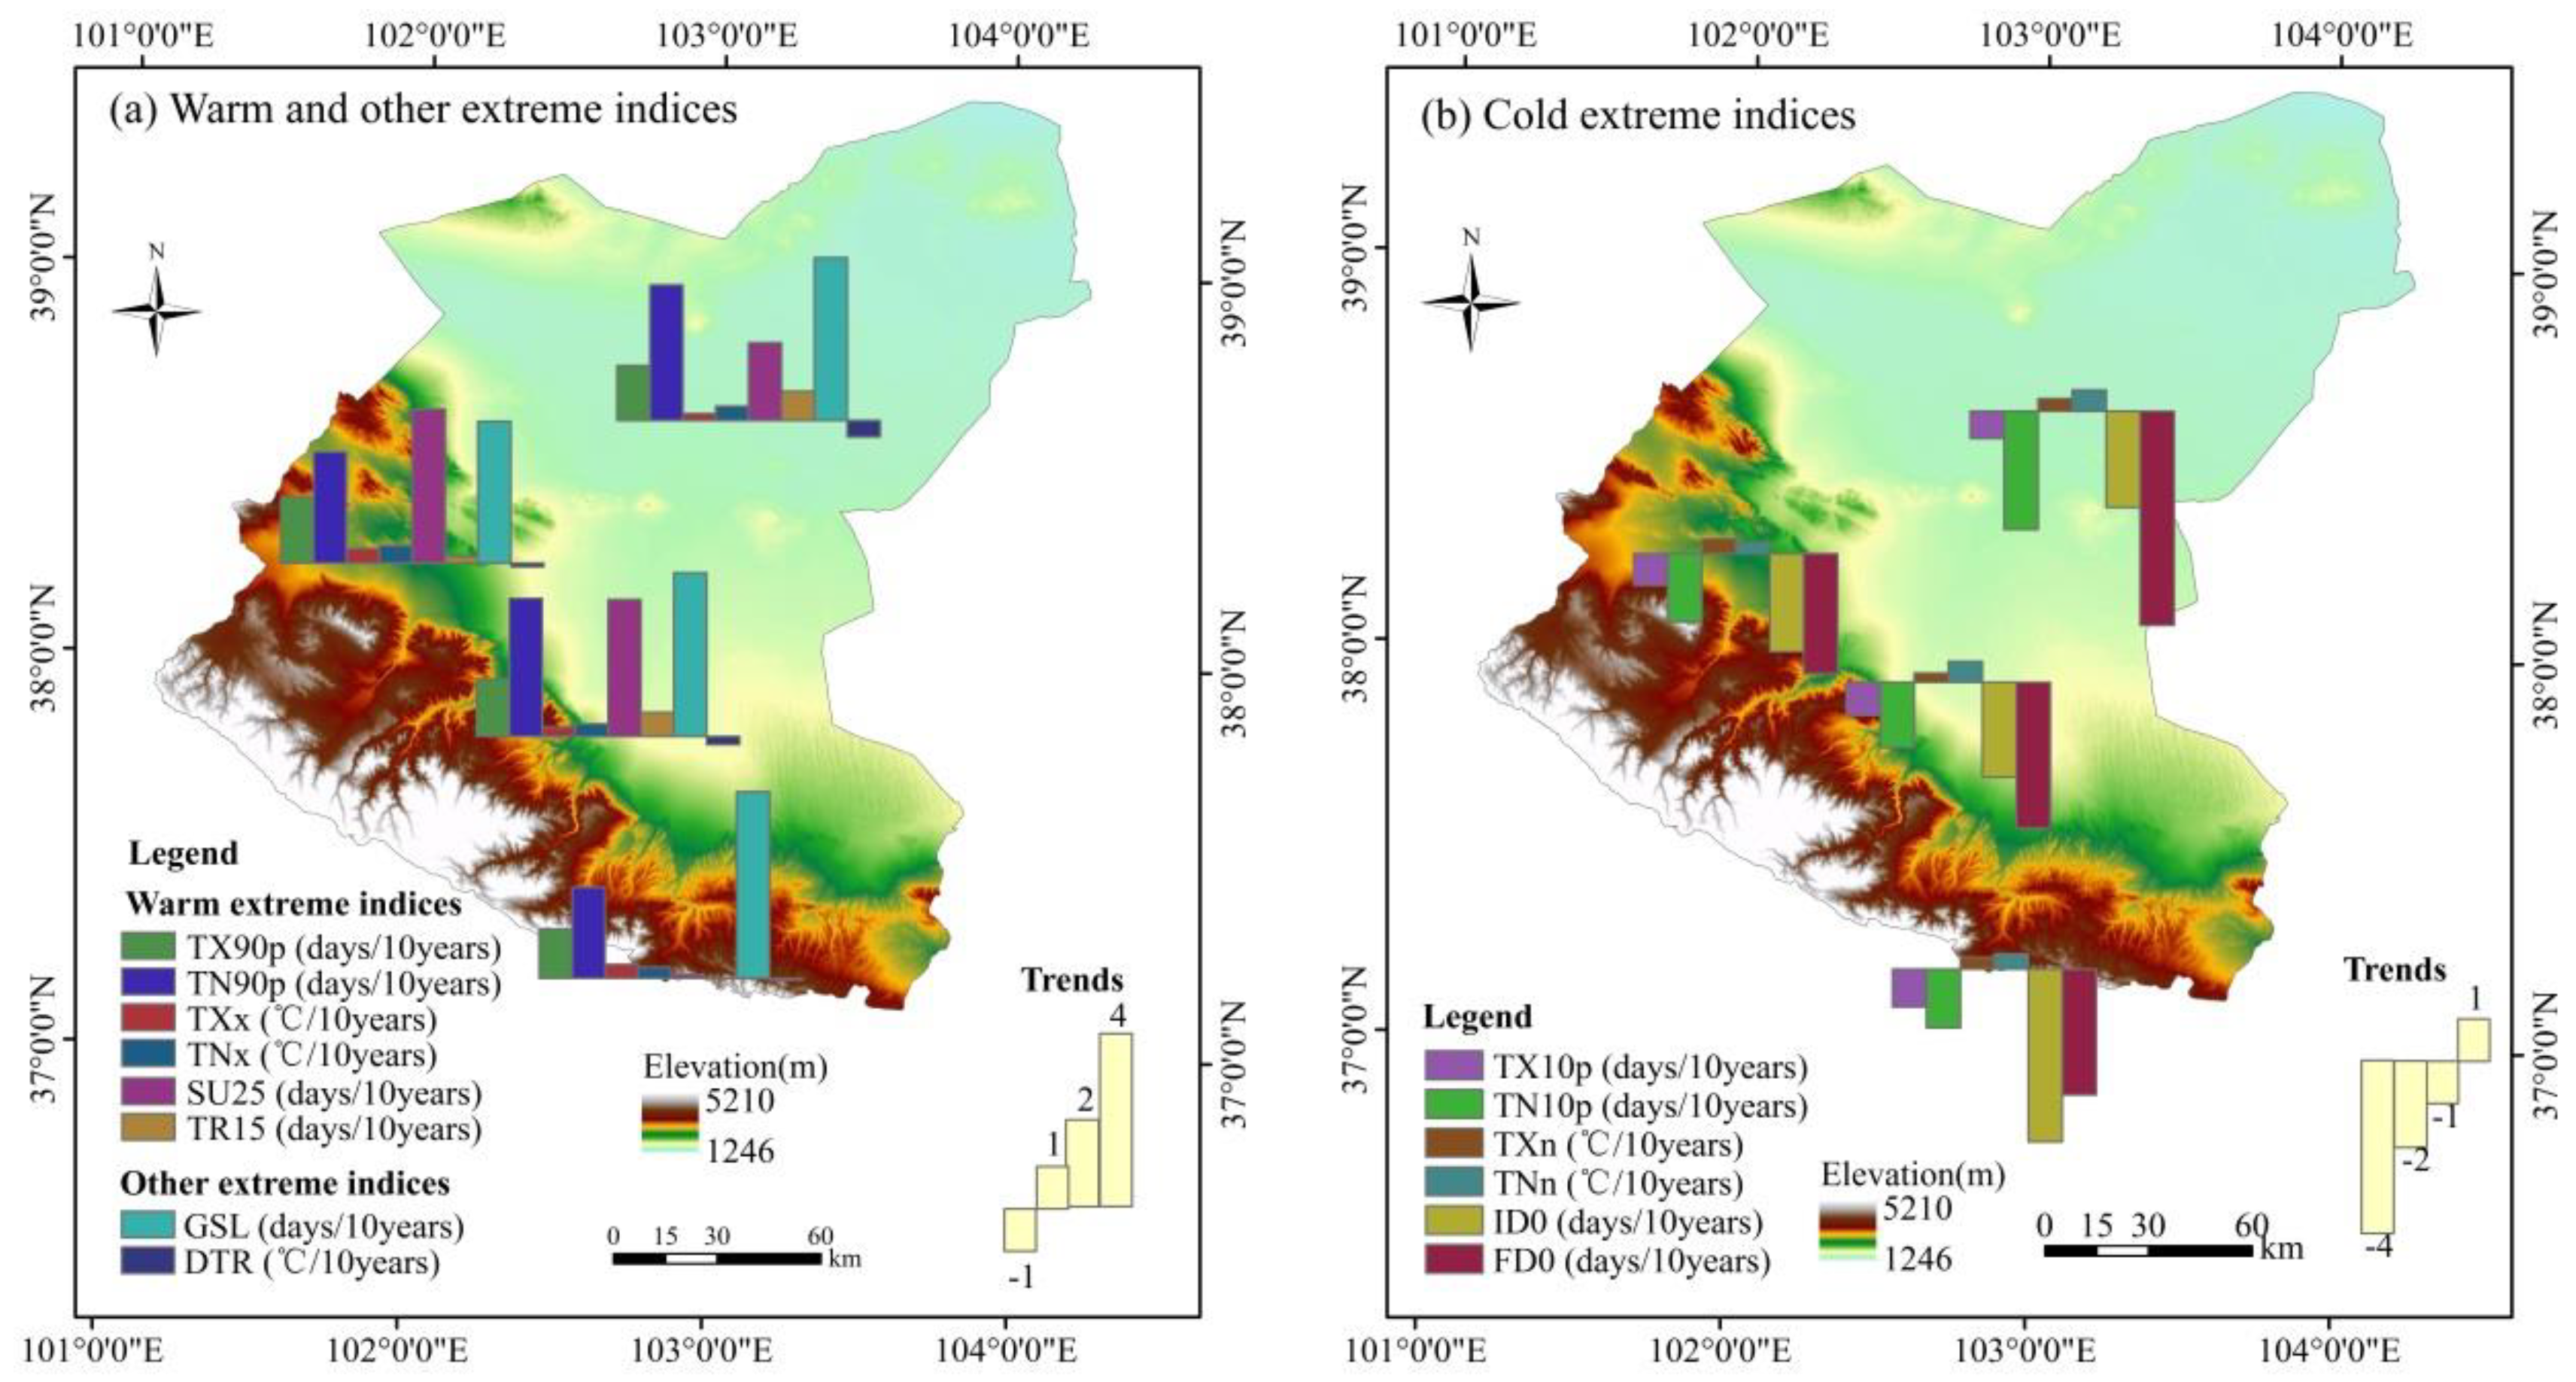
3.2. Spatial Variation Analysis of Extreme Temperatures Indices
3.2.1. Analysis of Spatial Change of Warm Indices
3.2.2. Analysis of Spatial Change of Cold Indices
3.2.3. Analysis of Spatial Change of Other Indices
3.3. Mutation Analysis of Extreme Temperatures Indices
4. Discussion
4.1. Comparison with Other Regions
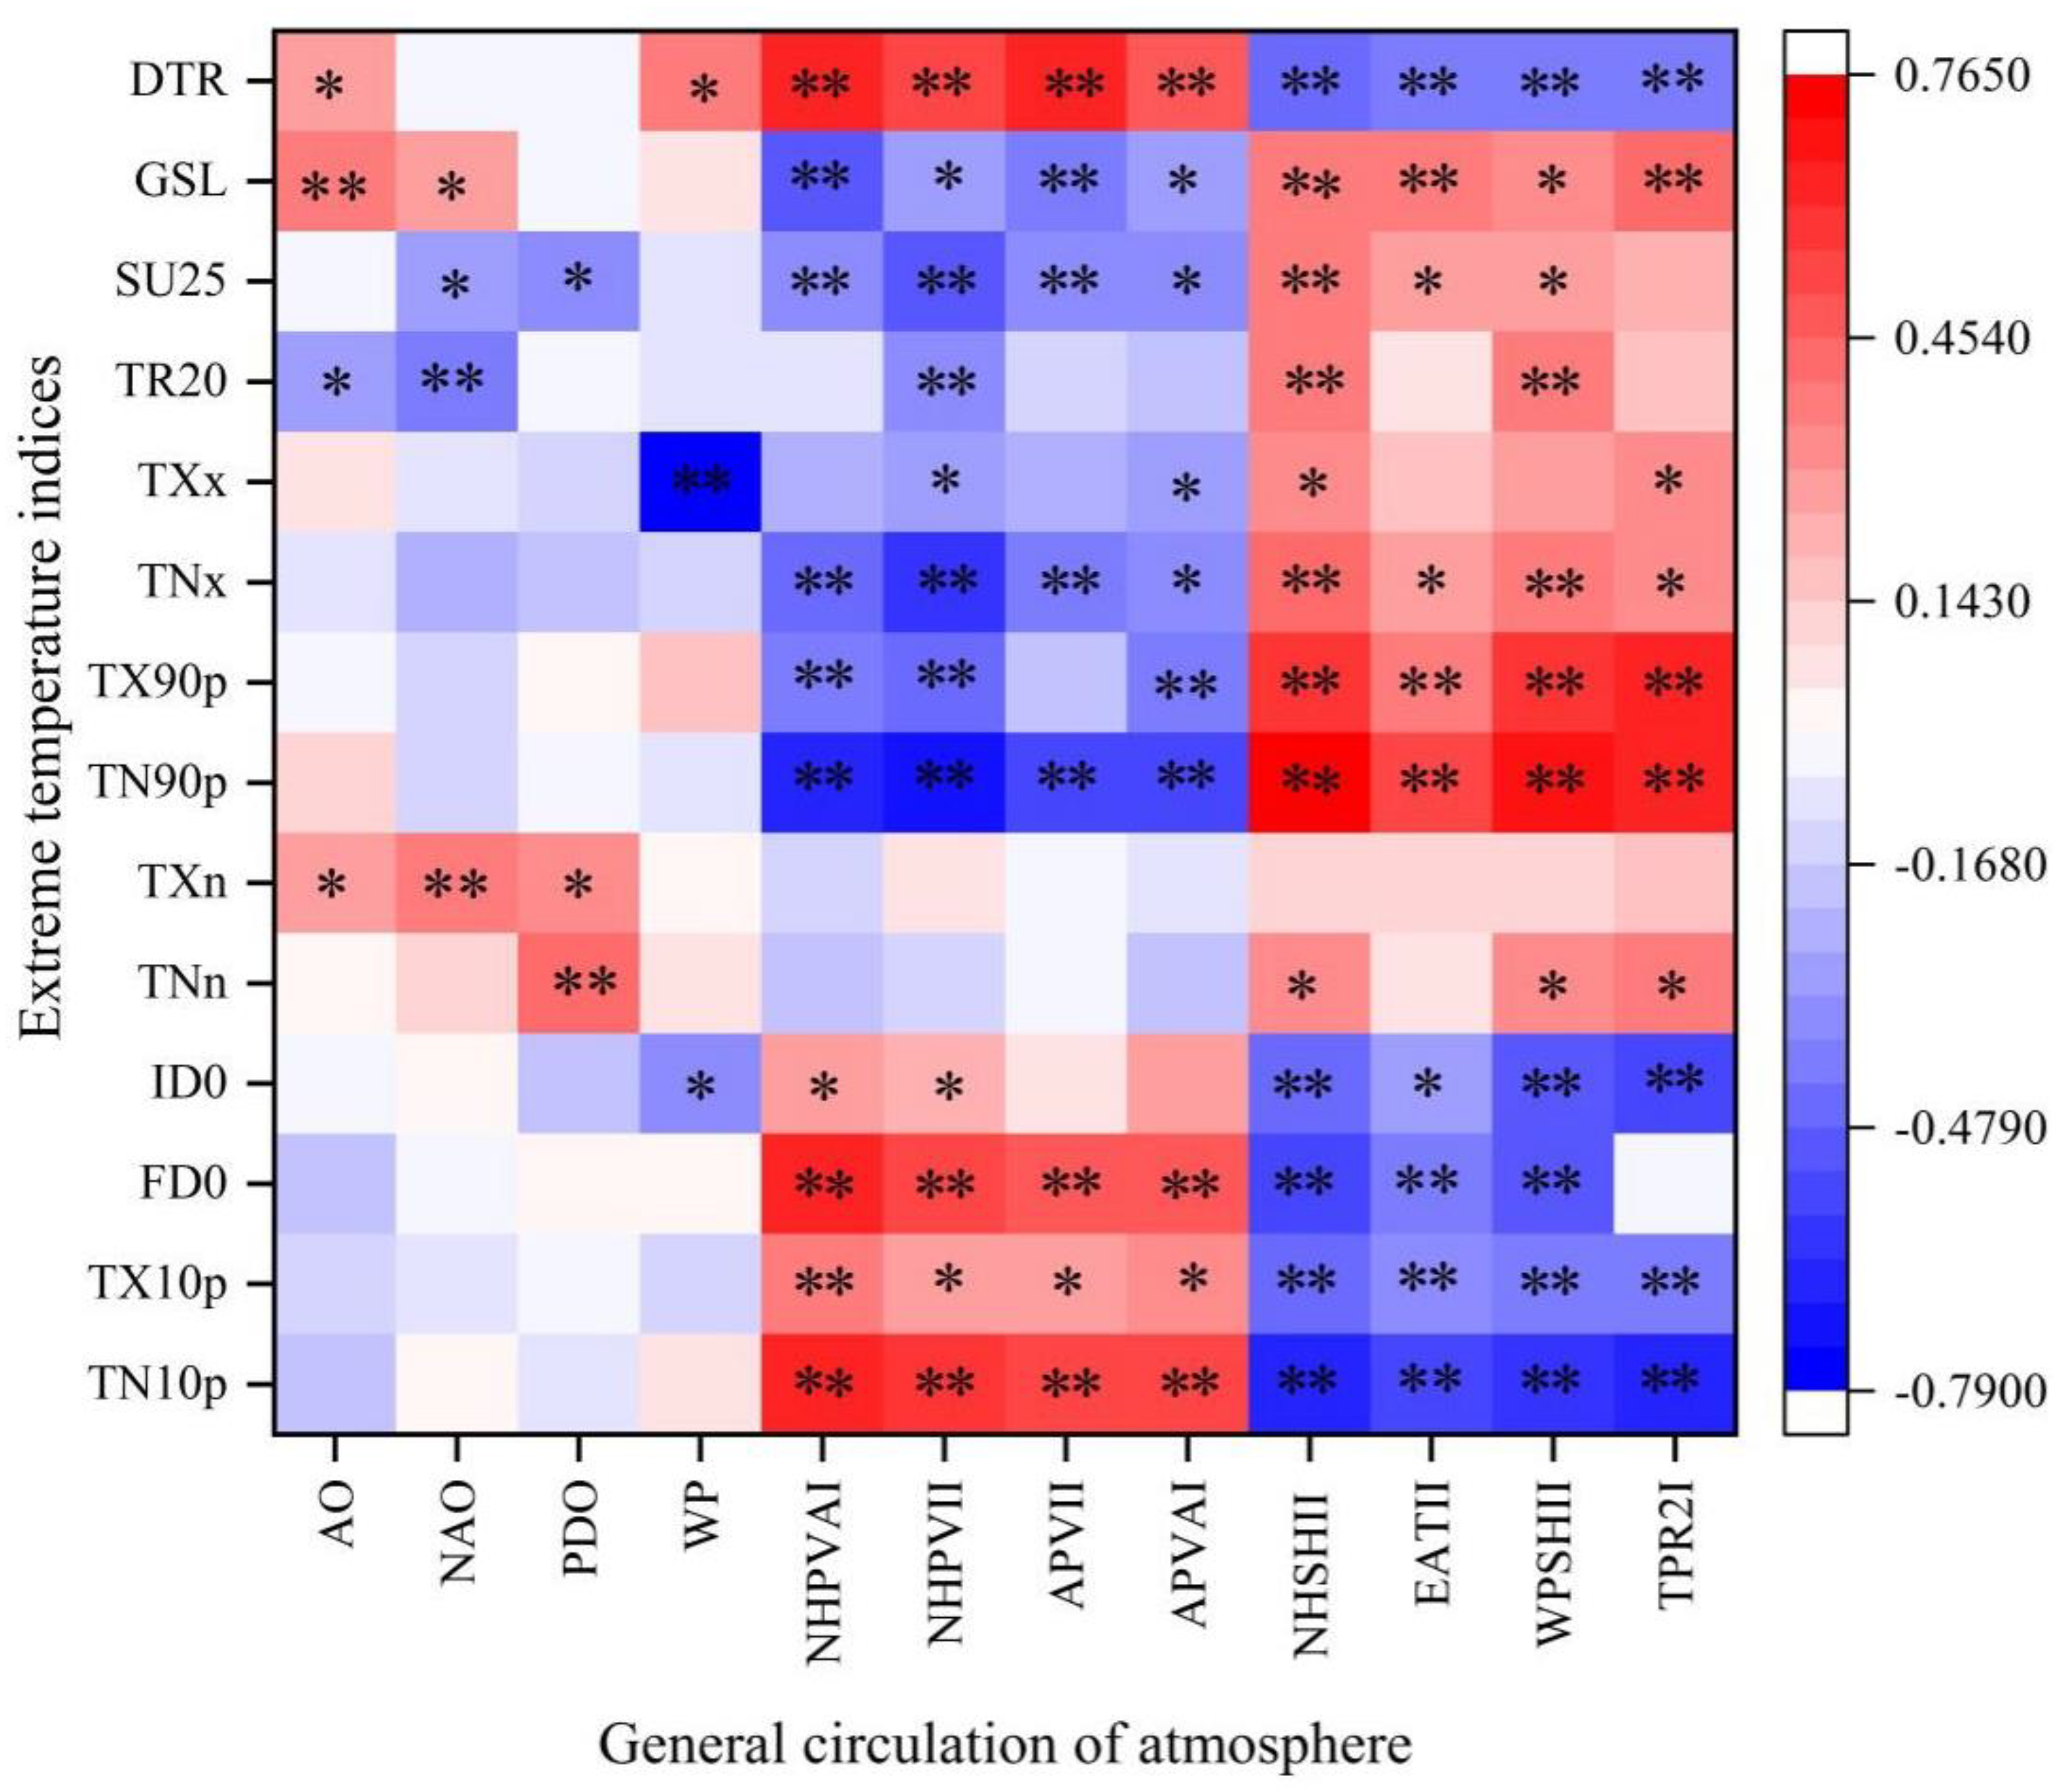
4.2. Analysis of Influencing Factors
4.3. Possible Impact-Influence on Vegetation and Glacier Frozen Soil in Basin
5. Conclusions
Author Contributions
Funding
Conflicts of Interest
References
- IPCC. Intergovernmental Panel on Climate Change (IPCC), 1st ed.; Elsevier Inc.: Amsterdam, The Netherlands, 2013; Volume 1–3, ISBN 9780123750679. [Google Scholar]
- IPCC. 2014: Climate Change 2014: Synthesis Report. Contribution of Working Groups l, Il and Ill to the Fifth Assessment Report of theIntergovernmental Panel on Climate Change; Core Writing Team, Pachauri, R.K., Meyer, L.A., Eds.; IPCC: Geneva, Switzerla, 2013; ISBN 9789291695386. [Google Scholar]
- Weaver, S.J.; Kumar, A.; Chen, M. Recent increases in extreme temperature occurrence over land. Geophys. Res. Lett. 2014, 41, 4669–4675. [Google Scholar] [CrossRef]
- Liu, Y.; Geng, X.; Hao, Z.; Zheng, J. Changes in Climate Extremes in Central Asia under 1.5 and 2 °C Global Warming and their Impacts on Agricultural Productions. Atmosphere 2020, 10, 1076. [Google Scholar] [CrossRef]
- Finkel, J.M.; Katz, J.I. Changing world extreme temperature statistics. Int. J. Climatol. 2018, 38, 2613–2617. [Google Scholar] [CrossRef]
- Gleixner, S.; Demissie, T.; Diro, G.T. Did ERA5 Improve Temperature and Precipitation Reanalysis over East Africa? Atmosphere (Basel) 2020, 11, 996. [Google Scholar] [CrossRef]
- Gao, M.; Franzke, C.L.E. Quantile regression-based spatiotemporal analysis of extreme temperature change in China. J. Clim. 2017, 30, 9897–9914. [Google Scholar] [CrossRef]
- Katz, R.W.; Brown, B.G. Extreme events in a changing climate: Variability is more important than averages. Clim. Chang. 1992, 21, 289–302. [Google Scholar] [CrossRef]
- Chen, H.; Sun, J. Changes in climate extreme events in China associated with warming. Int. J. Climatol. 2015, 35, 2735–2751. [Google Scholar] [CrossRef]
- Alexander, L.V.; Zhang, X.; Peterson, T.C.; Caesar, J.; Gleason, B.; Klein Tank, A.M.G.; Haylock, M.; Collins, D.; Trewin, B.; Rahimzadeh, F.; et al. Global observed changes in daily climate extremes of temperature and precipitation. J. Geophys. Res. Atmos. 2006, 111, 1–22. [Google Scholar] [CrossRef]
- Dittus, A.J.; Karoly, D.J.; Lewis, S.C.; Alexander, L.V. A multiregion assessment of observed changes in the areal extent of temperature and precipitation extremes. J. Clim. 2015, 28, 9206–9220. [Google Scholar] [CrossRef]
- Dong, S.; Sun, Y.; Aguilar, E.; Zhang, X.; Peterson, T.C.; Song, L.; Zhang, Y. Observed changes in temperature extremes over Asia and their attribution. Clim. Dyn. 2018, 51, 339–353. [Google Scholar] [CrossRef]
- Cheong, W.K.; Timbal, B.; Golding, N.; Sirabaha, S.; Kwan, K.F.; Cinco, T.A.; Archevarahuprok, B.; Vo, V.H.; Gunawan, D.; Han, S. Observed and modelled temperature and precipitation extremes over Southeast Asia from 1972 to 2010. Int. J. Climatol. 2018, 38, 3013–3027. [Google Scholar] [CrossRef]
- Bennett, K.E.; Walsh, J.E. Spatial and temporal changes in indices of extreme precipitation and temperature for Alaska. Int. J. Climatol. 2015, 35, 1434–1452. [Google Scholar] [CrossRef]
- Feng, R.; Yu, R.; Zheng, H.; Gan, M. Spatial and temporal variations in extreme temperature in Central Asia. Int. J. Climatol. 2018, 38, e388–e400. [Google Scholar] [CrossRef]
- Panda, D.K.; Mishra, A.; Kumar, A.; Mandal, K.G.; Thakur, A.K.; Srivastava, R.C. Spatiotemporal patterns in the mean and extreme temperature indices of India, 1971–2005. Int. J. Climatol. 2014, 34, 3585–3603. [Google Scholar] [CrossRef]
- Alizadeh-Choobari, O.; Najafi, M.S. Extreme weather events in Iran under a changing climate. Clim. Dyn. 2018, 50, 249–260. [Google Scholar] [CrossRef]
- Rahimi, M.; Hejabi, S. Spatial and temporal analysis of trends in extreme temperature indices in Iran over the period 1960–2014. Int. J. Climatol. 2018, 38, 272–282. [Google Scholar] [CrossRef]
- Li, L.; Zhang, Y.; Liu, Q.; Ding, M.; Mondal, P.P. Regional differences in shifts of temperature trends across China between 1980 and 2017. Int. J. Climatol. 2019, 39, 1157–1165. [Google Scholar] [CrossRef]
- Fang, S.; Qi, Y.; Yu, W.; Liang, H.; Han, G.; Li, Q.; Shen, S.; Zhou, G.; Shi, G. Change in temperature extremes and its correlation with mean temperature in mainland China from 1960 to 2015. Int. J. Climatol. 2017, 37, 3910–3918. [Google Scholar] [CrossRef]
- Deng, H.; Chen, Y.; Shi, X.; Li, W.; Wang, H.; Zhang, S.; Fang, G. Dynamics of temperature and precipitation extremes and their spatial variation in the arid region of northwest China. Atmos. Res. 2014, 138, 346–355. [Google Scholar] [CrossRef]
- Qi, Y.; Chen, H.; Fang, S.; Yu, W. Variation Characteristics of Extreme Climate Events in Northwest China During 1961–2010. J. Arid Meteorol. 2015, 33, 963–969. [Google Scholar]
- Wang, B.; Zhang, M.; Wei, J.; Wang, S. Variation characteristics of extreme events of temperature and precipitation in the northwest region of nearly 50a. J. Nat. Resour. 2012, 27, 1720–1733. [Google Scholar] [CrossRef]
- Shi, Y.; Shen, Y.; Li, D. The characteristics and trend of climate transition from warm and dry to warm and wet in northwest China. Quat. Sci. 2003, 3, 1–5. [Google Scholar] [CrossRef]
- Li, B.; Chen, Y.; Shi, X. Why does the temperature rise faster in the arid region of northwest China? J. Geophys. Res. Atmos. 2012, 117, 1–7. [Google Scholar] [CrossRef]
- Li, B.; Chen, Y.; Shi, X.; Chen, Z.; Li, W. Temperature and precipitation changes in different environments in the arid region of northwest China. Theor. Appl. Climatol. 2013, 112, 589–596. [Google Scholar] [CrossRef]
- Wang, Y. Study on Climate Change and Adaptation of Typical Watersheds in Arid Areas of Northwest China. 2017. Available online: http://cdmd.cnki.com.cn/Article/CDMD-10284-1018151328.htm (accessed on 10 May 2020).
- Wang, Y.; Qin, D. A review on the effects of climate change and human activities on water resources in arid areas of northwest China. Clim. Chang. Res. 2017, 13. [Google Scholar] [CrossRef]
- Brown, P.J.; Bradley, R.S.; Keimig, F.T. Changes in extreme climate indices for the Northeastern United States, 1870-2005. J. Clim. 2010, 23, 6555–6572. [Google Scholar] [CrossRef]
- Donat, M.G.; Peterson, T.C.; Brunet, M.; King, A.D.; Almazroui, M.; Kolli, R.K.; Boucherf, D.; Al-Mulla, A.Y.; Nour, A.Y.; Aly, A.A.; et al. Changes in extreme temperature and precipitation in the Arab region: Long-term trends and variability related to ENSO and NAO. Int. J. Climatol. 2014, 34, 581–592. [Google Scholar] [CrossRef]
- Wang, J.; Fei, X.; Wei, F. Further Study of Temperature Change in Northwest China in Recent 50 Years. J. Desert Res. 2008, 28, 128–236. [Google Scholar]
- Mou, L.T.; Ibrahim, A.L.; Cracknell, A.P.; Yusop, Z. Changes in precipitation extremes over the Kelantan River Basin, Malaysia. Int. J. Climatol. 2017, 37. [Google Scholar] [CrossRef]
- Wang, X.L.; Feng, Y. RHtestsV4 User Manual; Climate Research Division Atmospheric Science and Technology Directorate Science and Technology Branch, Environment Canada: Toronto, ON, Canada, 2013. [Google Scholar]
- Sun, W.; Mu, X.; Song, X.; Wu, D.; Cheng, A.; Qiu, B. Changes in extreme temperature and precipitation events in the Loess Plateau (China) during 1960–2013 under global warming. Atmos. Res. 2016, 168, 33–48. [Google Scholar] [CrossRef]
- You, Q.; Ren, G.; Fraedrich, K.; Kang, S.; Ren, Y.; Wang, P. Winter temperature extremes in China and their possible causes. Int. J. Climatol. 2013, 33, 1444–1455. [Google Scholar] [CrossRef]
- He, S.; Richards, K.; Zhao, Z. Climate extremes in the Kobresia meadow area of the Qinghai-Tibetan Plateau, 1961–2008. Environ. Earth Sci. 2016, 75, 1–15. [Google Scholar] [CrossRef]
- Zhang, J.; Ma, L.; Tijiu, C. Hydrology and Water Resources; China Forestry Press: Beijing, China, 2016; pp. 40–41. [Google Scholar]
- Donat, M.G.; Alexander, L.V.; Yang, H.; Durre, I.; Vose, R.; Caesar, J. Global land-based datasets for monitoring climatic extremes. Bull. Am. Meteorol. Soc. 2013, 94, 997–1006. [Google Scholar] [CrossRef]
- Gallant, A.J.E.; Karoly, D.J. A combined climate extremes index for the Australian region. J. Clim. 2010, 23, 6153–6165. [Google Scholar] [CrossRef]
- Zhou, Y.; Ren, G. Change in extreme temperature event frequency over mainland China, 1961–2008. Clim. Res. 2011, 50, 125–139. [Google Scholar] [CrossRef]
- Yaqing, Z.; Guoyu, R. The Effect of Urbanization on Maximum, Minimum Temperatures and Daily Temperature Range in North China. Plateau Meteorol. Meteorol. 2009, 28, 1158–1166. [Google Scholar]
- Duan, C.; Miu, Q.; Cao, W.; Ma, D. Effect of Urbanization on Variation Trends of Air Temperatures Based on Mountain Stations. Atmos. Sci. 2012, 35, 811–812. [Google Scholar] [CrossRef]
- Chen, Y. Response of Extreme Hydrological Events to Extreme Climate in the Shule River Basin. Plateau Meteorol. 2019, 38, 583–592. [Google Scholar]
- Feng, Q.; Li, Z.; Liu, W.; Li, J.; Guo, X.; Wang, T. Relationship between large scale atmospheric circulation, temperature and precipitation in the Extensive Hexi region, China, 1960–2011. Quat. Int. 2016, 392, 187–196. [Google Scholar] [CrossRef]
- Yu, Z.; Li, X. Recent trends in daily temperature extremes over northeastern China (1960–2011). Quat. Int. 2015, 380–381, 35–48. [Google Scholar] [CrossRef]
- Wang, Y.; Ding, Z.; Ma, Y. Spatial and temporal analysis of changes in temperature extremes in the non-monsoon region of China from 1961 to 2016. Theor. Appl. Climatol. 2019, 137, 2697–2713. [Google Scholar] [CrossRef]
- Zheng, J.; Fan, J.; Zhang, F. Spatiotemporal trends of temperature and precipitation extremes across contrasting climatic zones of China during 1956–2015. Theor. Appl. Climatol. 2019, 138, 1877–1897. [Google Scholar] [CrossRef]
- Zhang, H.; Gao, S.; Liu, Y. Advances in polar vortex research. Plateau Meteorol. 2008, 30, 2. [Google Scholar]
- Gu, S.; Yang, X. The variation of polar vortex in the northern hemisphere and its relationship with climate anomaly in China. Meteorol. Sci. 2006, 26, 135–142. [Google Scholar]
- Thompson, D.W.J.; Wallace, J.M. The Arctic oscillation signature in the wintertime geopotential height and temperature fields. Geophys. Res. Lett. 1998, 25, 1297–1300. [Google Scholar] [CrossRef]
- Gong, D. Prediction of summer precipitation in east Asia by Arctic Qscillation. Meteorol. Mon. 2003, 29, 3–6. [Google Scholar] [CrossRef]
- Wu, B.; Jia, W. Possible impacts of winter Arctic Oscillation on Siberian high, the East Asian winter monsoon and sea-ice extent. Adv. Atmos. Sci. 2002, 19, 297–320. [Google Scholar] [CrossRef]
- Shen, B.; Lian, Y.; Zhang, S.; Li, S. The influence of arctic oscillation and polar vortex activity anomalies on the winter temperature of Eurasia in the northern hemisphere. Progress. Inquisitiones Mutat. Clim. 2012, 8, 434–439. [Google Scholar] [CrossRef]
- Liang, S.; Ding, Y.; Zhao, N.; Sun, Y. Study on interdecadal variation of winter temperature and regional circulation in mainland China in recent 50 years. Chin. J. Atmos. Sci. 2014, 38, 974–992. [Google Scholar] [CrossRef]
- Wang, Y.; Shi, N. The relationship between summer north Atlantic oscillation and weather and climate in China. J. Meteorol. Sci. 2001, 21, 271–278. [Google Scholar] [CrossRef]
- Yang, X.; Ma, Z.; MA, Y.; Wang, R. The Spatial-Temporal Distribution State of Seasonal Frozen Soil and Responses to Temperature Change in the Shiyang River Basin. Resour. Sci. 2013, 35, 2104–2111. [Google Scholar]
- Wang, T. Spatial-Temporal Characteristics and Influencing Factors of Climate Growth Period of Chimonophilous Crop in North China from 1960 to 2016. Master’s Thesis, Northwest Normal Univercity, Lanzhou, Gansu, China, 2018. [Google Scholar]
- Gui, J.; Wang, X.; Li, Z.; Zou, H.; Li, A. Research on the response of vegetation change to human activities in typical cryosphere areas: Taking the Qilian Mountains as an example. J. Glaciol. Geocryol. 2019, 41, 1235–1243. [Google Scholar] [CrossRef]
- Meng, J.; Zhang, S.; Zhang, Y. The Temporal and Spatial Change of Temperature and Precipitation in Hexi Corridor in Recent 57 Years. Acta Geogr. Sin. 2012, 67, 1482–1492. [Google Scholar] [CrossRef]


| Watershed | Station Name | Longitude (E) | Latitude (N) | Elevations (m) | Start | End |
|---|---|---|---|---|---|---|
| upstream | Wushaoling | 37°12′ | 102°52′ | 3045.1 | 1960 | 2015 |
| midstream | Wuwei | 37°55′ | 102°40′ | 1531.5 | 1960 | 2015 |
| Yongchang | 38°14′ | 101°58′ | 1976.9 | 1960 | 2015 | |
| downstream | Minqin | 38°38′ | 103°05′ | 1367.5 | 1960 | 2015 |
| Name | Indicator Index | Definition | Units | |
|---|---|---|---|---|
| cold extreme indices | TX10p | Cool days | Percentage of days when TX <10th percentile | Days |
| TN10p | Cool nights | Percentage of days when TN <10th percentile | Days | |
| TXn | Minimum Tmax | Annual minimum value of daily maximum temperature | °C | |
| TNn | Minimum Tmin | Annual minimum value of daily minimum temperature | °C | |
| ID0 | Ice days | Annual count when TN (daily maximum temperature) <0 °C | Days | |
| FD0 | Frost days | Annual count when TN (daily minimum temperature) <0 °C | Days | |
| Warm extreme indices | SU25 | Summer days | Annual count when TX (daily maximutemperature) >25 °C | Days |
| TR15 | Tropical nights | Annual count when TN (daily minimum temperature) >15 °C | Days | |
| TXx | Maximum Tmax | Annual maximum value of daily maximum temperature | °C | |
| TNx | Maximum Tmin | Annual maximum value of daily minimum temperature | °C | |
| TX90p | Warm days | Percentage of days when TX >90th percentile | Days | |
| TN90p | Warm nights | Percentage of days when TN >90th percentile | Days | |
| Others extreme indice | GSL | Growing season length | Annual count between first span of at least 6 days with TG>5 °C and first span after 1 July of 6 days with TG <5 °C, where TG is daily mean temperature (TX + TN)/2 | Days |
| DTR | Diurnal temperature range | Annual mean difference between TX and TN | °C |
| Warm Extreme Indices | Climate Inclination Rate | Cold Extreme Indices | Climate Inclination Rate | Others Extreme Indice | Climate Inclination Rate |
|---|---|---|---|---|---|
| TX90p (days/10 years) | 1.38 * | TX10p (days/10 years) | −0.85 * | DTR (°C/10 years) | −0.18 ** |
| TN90p (days/10 years) | 3.3 * | TN10p (days/10 years) | −2.13 * | GSL (days/10 years) | 3.56 |
| TXx (°C/10 years) | 0.3 ** | TXn (°C/10 years) | 0.34 * | ||
| TNx (°C/10 years) | 0.33 ** | TNn (°C/10 years) | 0.45 * | ||
| SU25 (days/10 years) | 2.74 | FD0 (days/10 years) | −3.8 | ||
| TR15 (days/10 years) | 2.44 ** | ID0 (days/10 years) | −2.81 |
| Year | 1960s | 1970s | 1980s | 1990s | 2000s | |
|---|---|---|---|---|---|---|
| Warm extreme indices | TX90p (days) | 8.615 | 8.42 | 7.463 | 8.166 | 13.307 |
| TN90p (days) | 6.723 | 5.81 | 6.356667 | 6.296556 | 17.121 | |
| TXx (°C) | 30.99 | 31.155 | 31.0575 | 31.0675 | 32.1675 | |
| TNx (°C) | 16.805 | 16.5725 | 16.0875 | 16.48833 | 17.8325 | |
| SU25 (days) | 45.4 | 39.9 | 38.6 | 41.3 | 54.4 | |
| TR15 (days) | 4.7 | 4.4 | 3.6 | 4.233333 | 11.9 | |
| Cold extreme indices | TX10p (days) | 11.805 | 11.999 | 10.595 | 11.46633 | 8.373 |
| TN10p (days) | 14.346 | 13.506 | 11.121 | 12.991 | 4.997 | |
| TXn (°C) | −12.185 | −12.345 | −11.2825 | −11.9375 | −11.46 | |
| TNn (°C) | −23.1975 | −23.275 | −22.0975 | −22.8567 | −22.185 | |
| FD0 (days) | 183.6 | 183.3 | 181.2 | 182.7 | 169.5 | |
| ID0 (days) | 59.2 | 57.6 | 57 | 57.93333 | 47.5 | |
| Other extreme indices | DTR (°C) | 13.443 | 13.251 | 13.029 | 13.241 | 12.734 |
| GSL (days) | 194 | 198.5 | 200 | 197.5 | 210.4 |
| Warm Extreme Indices | Year of Abrupt Change | Cold Extreme Indices | Year of Abrupt Change | Others Extreme Indice | Year of Abrupt Change |
|---|---|---|---|---|---|
| TX90p | 2001 ** | TX10p | 1989 ** | GSL | 1997 ** |
| TN90p | 2002 ** | TN10p | 1997 ** | DTR | 1997 ** |
| TXx | - | TXn | 1981 ** | ||
| TXn | 2003 ** | TNn | 1991 * | ||
| SU25 | 2000 ** | FD0 | 2005 ** | ||
| TR15 | 2001 ** | ID0 | 1992 * |
| Period | TX10p (Days/10 Years) | TN10p (Days/10 Years) | TXn (°C/10 Years) | TNn (°C/10 Years) | ID0 (Days/10 Years) | FD0 (Days/10 Years) | SU25 (Days/10 Years) | TXx (°C/10 Years) | TNx (°C/10 Years) | TX90p (Days/10 Years) | TN90p (Days/10 Years) | GSL (Days/10 Years) | DTR (°C/10 Years) | Source | |
|---|---|---|---|---|---|---|---|---|---|---|---|---|---|---|---|
| This paper | 1960–2015 | −0.85 * | −2.13 * | 0.34 | 0.45 | −2.81 ** | −3.8 * | 2.74 ** | 0.3 ** | 0.33 * | 1.38 ** | 3.3 * | 3.56 ** | −0.18 * | |
| Shule river basin | 1959–2011 | −1.15 ** | −1.44 ** | - | 0.16 | - | 2.7 ** | 3 * | 0.32 * | - | 1.96 * | 1.89 * | - | - | [43] |
| Hexi Corridor | 1986–2011 | −0.32 | −1.31 | −1.11 | −0.64 | 0.47 | −6.61 | - | 0.59 | 0.86 | 3.32 | 4.93 | 6.5 | 0.19 | [44] |
| Loess Plateau | 1960–2013 | −2.71 * | −4.31 * | - | - | −2.11 * | −3.22 * | 2.76 * | - | - | 2.6 * | 3.14 * | 3.16 * | −0.06 | [34] |
| Northeast China Region | 1960–2011 | −0.86 * | −1.8 * | 0.39 | 0.82 * | −1.74 * | −3.36 * | 2.3 * | 0.11 | 0.23 * | 0.97 * | 2.27 * | 2.62 * | −0.24 * | [45] |
| The monsoon region | 1961–2016 | −2.1 ** | 4.08 ** | 0.29 * | 0.54 ** | −2.23 ** | - | - | 0.23 ** | 0.34 * | 2.81 ** | 4.04 ** | - | −0.19 ** | [46] |
| TCZ | 1956–2015 | −0.79 ** | −1.36 ** | 0.4 ** | 0.55 ** | - | - | - | 0.16 * | 0.22 ** | 0.99 ** | 2.04 ** | - | - | [47] |
| TMZ | −0.72 ** | −1.47 ** | 0.35 ** | 0.63 ** | - | - | - | 0.12 | 0.18 ** | 0.68 ** | 2.06 ** | - | - | ||
| MPZ | −0.89 ** | −1.59 * | 0.36 ** | 0.58 * | - | - | - | 0.23 * | 0.27 * | 1.38 * | 2.29 * | - | - | ||
| SMZ | −0.36 ** | −1.27 ** | 0.22 * | 0.41 ** | - | - | - | 0.1 ** | 0.17 ** | 1.13 ** | 2.08 ** | - | - | ||
| China | −0.7 ** | −1.44 ** | 0.35 ** | 0.55 ** | - | - | - | 0.15 ** | 0.22 ** | 1 ** | 2.12 ** | - | - | ||
| Asia-Pacific Network rregion | −3.3 | −6.4 | - | - | −1.3 | −2.1 | 1.9 | - | - | 3.9 | 5.4 | 3 | −1 |
Publisher’s Note: MDPI stays neutral with regard to jurisdictional claims in published maps and institutional affiliations. |
© 2020 by the authors. Licensee MDPI, Basel, Switzerland. This article is an open access article distributed under the terms and conditions of the Creative Commons Attribution (CC BY) license (http://creativecommons.org/licenses/by/4.0/).
Share and Cite
Zhou, J.; Huang, J.; Zhao, X.; Lei, L.; Shi, W.; Wang, L.; Wei, W.; Liu, C.; Zhu, G.; Yang, X. Changes of Extreme Temperature and Its Influencing Factors in Shiyang River Basin, Northwest China. Atmosphere 2020, 11, 1171. https://doi.org/10.3390/atmos11111171
Zhou J, Huang J, Zhao X, Lei L, Shi W, Wang L, Wei W, Liu C, Zhu G, Yang X. Changes of Extreme Temperature and Its Influencing Factors in Shiyang River Basin, Northwest China. Atmosphere. 2020; 11(11):1171. https://doi.org/10.3390/atmos11111171
Chicago/Turabian StyleZhou, Junju, Jumei Huang, Xi Zhao, Li Lei, Wei Shi, Lanying Wang, Wei Wei, Chunfang Liu, Guofeng Zhu, and Xuemei Yang. 2020. "Changes of Extreme Temperature and Its Influencing Factors in Shiyang River Basin, Northwest China" Atmosphere 11, no. 11: 1171. https://doi.org/10.3390/atmos11111171
APA StyleZhou, J., Huang, J., Zhao, X., Lei, L., Shi, W., Wang, L., Wei, W., Liu, C., Zhu, G., & Yang, X. (2020). Changes of Extreme Temperature and Its Influencing Factors in Shiyang River Basin, Northwest China. Atmosphere, 11(11), 1171. https://doi.org/10.3390/atmos11111171