Article

Ground Level Isoprenoid Exchanges Associated with Pinus pinea Trees in A Mediterranean Turf

1
Consejo Superior de Investigaciones Científicas, Global Ecology Unit CREAF-CSIC-UAB, E08193 Bellaterra, Catalonia, Barcelona, Spain
2
Centre de Recerca Ecològica i Aplicacions Forestals, E08193 Cerdanyola, Catalonia, Spain
*
Author to whom correspondence should be addressed.
Atmosphere 2020, 11(8), 809; https://doi.org/10.3390/atmos11080809
Submission received: 10 July 2020 / Revised: 23 July 2020 / Accepted: 28 July 2020 / Published: 31 July 2020
(This article belongs to the Special Issue Plant Adaptation to Global Climate Change)

Abstract

:
The emissions of isoprenoids, a kind of biogenic volatile organic compounds (BVOCs), from soils is not well characterized. We quantified the exchange of isoprenoids between soil with litter and atmosphere along a horizontal gradient from the trunks of the trees, in a Mediterranean Pinus pinea plantation with dry and green needle litter to open herbaceous turf during mornings at mid-summer. Further, potential associated drivers were identified. Isoprenoid emissions were greatest and most diverse, and also can be roughly estimated by litter dry weight near the trunk, where the needle litter was denser. The composition of emitted isoprenoid by needle litter was different than the composition previously described for green needles. Low exchange rates of isoprenoids were recorded in open turf. Isoprenoid exchange rates were correlated positively with soil temperature and negatively with soil moisture. Given the variations in ground emissions with soil, vegetation, microorganisms, and associated interactions, we recommend widespread extensive spatio-temporal analysis of ground level BVOC exchanges in the different ecosystem types.

1. Introduction

Biogenic volatile organic compounds (BVOCs) represent 90% of total volatile organic compound (VOC) emitted into the atmosphere [1], impacting the atmospheric chemistry and climate processes [2,3,4]. BVOC emission profiles from terrestrial ecosystems tend to be driven by plant species composition [5] which is linked to phenology and climate [2,6] and are usually dominated by isoprenoids [5] with blends of other carbon-based compounds, such as alkanes, alkenes, carbonyls, alcohols, esters, ethers, and acids [5,6]. This key role of terrestrial plants in BVOCs has received much research attention [7,8,9,10]; however, there is emerging evidence that a wide range of BVOCs are also released from terrestrial ecosystem ground [10] regardless of level of vegetation [8,10,11].
Ground level emission of BVOCs from natural and semi-natural ecosystems may derive from organic litter and soil where plant root systems and microorganisms are major sources [11,12] and sometimes also by understory vegetation [13,14]. Most of the ground measurements do not distinguish the emissions from plant roots, decomposing litter, or the microbes themselves [15,16]. Litter has often been suggested as the main BVOC source in the forests besides vegetation [14,17,18,19], in fact, the decomposing litter has been assumed to be the main BVOCs source in the forest ground [8,14,20,21]. It is evident that both decomposers and the decomposing material affect the quantities and types of VOC productions [21], and also that VOCs released through the decomposition processes are strongly dependent on litter type, climate and soil microbial composition [21,22]. Differentiating each of the soil component responsible for these emissions is very complex [10,18,23]. For example, the assessment of the contribution of root emissions to the overall soil VOC fluxes is difficult because of their linkage with soil microbes owing to root exudates can boost microbial activity, which can either increase the production or consumption of VOCs [10]. Some soil microbes, particularly fungi, are capable of producing terpenoid compounds [24], but plant roots are likely to be the dominant source of these compounds [8,23,25]. Isoprenoids are commonly emitted from litters and soils [8,12,22], and are likely adsorbed on the living leaf surfaces which are covered by a lipophilic cuticle layer [14]. Soil and litter microbes can also modify VOC emissions by metabolizing plant-emitted VOCs [26], which may cause low isoprenoid fluxes measured from soil with dense understorey vegetation cover [15]. Some understorey vegetation (grasses, shrubs, mosses, lichens, and other vegetation) [13,14] can also contribute to the exchange of BVOCs by emitting them [7].
Ground level emissions to the atmosphere are often 1–2 orders of magnitude lower than those from aboveground vegetation [10]. Moreover, they may represent up to 50% of net canopy BVOC flux, depending on the type of ecosystem, litter and soil [19], environmental conditions [10,27] and season of the year [19], particularly in coniferous forests that produce large amounts of litter [4,10]. Nevertheless, some studies suggest that these emissions play an insignificant role because they constitute a very low fraction with respect to the total ecosystem emissions [12,19,20,28]. In addition, soil VOCs also have important ecological roles [8,10,29], affecting microbial process such as methane oxidation, nitrification, nitrogen mineralization, and aerobic respiration [8,23,25] and biological interactions as key compounds in communication among soil microorganism and plant roots [4] that release carbon-rich root exudates and thus feed associated populations of bacteria, fungi, arthropod and nematode within the rhizosphere [8].
Soils are considered to be sources and sinks of BVOCs [8,10,12,22] with very low exchanges in Mediterranean-type ecosystems [17,29,30]. Maybe microbial processes play most important roles in atmosphere-soil exchanges of BVOCs [7,12,19]. In this line, there are studies showing the lower VOC emission rates in the litter plus soil treatments indicating many litter VOCs appear to be metabolized in soil [8,12,22], meanwhile, litter VOCs represent an important carbon source to soil and elevate soil microbial activity [22]. In addition, the consumption of some specific VOCs in soils result from microbial activities [7,22] depending on the type of compound and soil [7]. Besides, abiotic processes like adsorption to soil particles [19,31], dissolution in soil water [19], and reactions with soil chemicals [32] are also the mechanism behind the soil uptake [7,19].
Deposition and emission of ground level BVOCs is strongly influenced by environmental conditions [19,29]. Soil temperature and moisture seems to be the most important factors since they control physiological processes both in plants and microorganisms [30]. Temperature affects VOC production [10,12] through the temperature dependence of enzyme production and activity in VOC synthesis [2,21], while soil water content can determine which microbial groups are most active [21,33], which means both the physiological activity and community composition of decomposer microorganisms can be affected by environmental conditions [4,34]. Soil temperature and moisture affect, moreover, soil BVOC physical processes, including dissolution in soil water [7], and physico-chemical processes [2,21], such as diffusion and volatility. The over-arching effects of climate warming on increasing soil temperature and decreasing soil moisture will contribute higher BVOC volatilization from soil into the atmosphere [31], and may influence composition of vegetation and distribution of the associated soil microorganisms, and cause further variations in BVOC exchange profiles [4,8,34].
Isoprenoids are produced by all conifers and are stored in the needles [35] where they readily volatize from needle storing tissues [22]. The distance to the conifer tree can be a qualitative and quantitative determinant of ground level BVOC exchange profiles [17]. Here, we aimed to quantify emissions and exchange of isoprenoids and its potential drivers along a horizontal gradient from dense Pinus pinea litter to open herbaceous turf to improve understanding of spatial-temporal differences in ground level BVOC exchange to the atmosphere.

2. Material and Methods

2.1. Study Site and Experimental Design

We selected four isolated, similar sized (mean trunk circumference at breast height: 1.20 ± 0.06 m) Pinus pinea L. trees in a managed herbaceous turf on a silty-clay Typic Calcixerept soil, with a high proportion of carbonates (pH: 8) [17], near the campus of the Autonomous University of Barcelona (41°30′ N, 2°6′ E). Ground vegetation was dominated by legumes, such as Trifolium repens L., Psoralea bituminosa L., Medicago minima (L.) Bartal, with other herbs, such as Plantago lanceolata L. and grasses (Lolium perenne L., Brachypodium phoenicoides R. and S., and Bromus intermedius Guss). Sampling points (N = 11) were arranged every meter along a single 10 m transect from the trunk of each tree, and avoided canopy effects of other trees, where point 1 was as close to the trunk as possible. Leaf litter was present within 4 m, and most dense within 2 m from the trunk where litter covered ground totally.

2.2. Isoprenoid Sampling

Sampling was carried out during the summer when climate warming effects are most pronounced and BVOCs emissions are greatest at this region [9,29], from 18 July to 8 August of 2018, on sunny or slightly cloudy days, between 09:00 and 13:00 hrs. Emitted isoprenoids were collected with a Teflon® soil VOC chamber and retained in stainless steel tubes (89 mm in length with 6.4 mm external diameter, Markes International Inc. Wilmington, NC, USA) manually filled with adsorbents (115 mg of Tenax TA and 230 mg of SulfiCarb, Markes International Inc. Wilmington, NC, USA) separated by sorbent-retaining springs that were fixed using gauze-retaining springs and closed with air-tight caps. Flow was generated using a Q-MAX air-sampling pump (Supelco, Bellefonte, PA, USA) and measured using a Bios Defender 510 flow meter (Bios International Corporation, Butler, PA, USA) and sampling time was 20 min. This dynamic system was also connected to ambient air with a Teflon® tube of 3 mm of inner diameter and air inside chamber was homogenized using a small fan. The flow rate across the sampling cartridges was adjusted at around 200 mL min−1 [17]. Although the studied emission could be slightly influenced by an addition from ambient air under this situation, it can be counteracted by the subtraction of blank measurements whose emissions were collected prior to the measurement of each sample using Tedlar® PVF film between ground and the chamber (Figure S1). Each point cost around 1 h including twice measurements (blank and sample), the time for operation and movement to next point, and the order of sampling at points along the transect was randomized for every tree and varied with sampling period (Table S1). Soil temperature and moisture content around the soil chamber were measured using a Pt100 4.5 × 150 mm probe (Jules Richard Instruments-ICT, SL, Fesches-le-Chatel, France) and a ML3 ThetaProbe sensor connected to a ML3 ThetaKit (Delta-T Devices, Cambridge, UK), respectively. The litter below the soil chamber was collected after sampling at 0, 1, 2 and 3 m from tree trunks and oven-dried at 60 °C to a constant weight. The sampled cartridges were stored at 4 °C until analysis.

2.3. GC-MS Analyses of BVOCs

BVOCs were analyzed using a GC-MS system (7890A GC-system interfaced with a 5975C VL MSD and a Triple-Axis detector; Agilent Technologies, Palo Alto, CA, USA). An automated thermal desorption unit (Ultra 2 and Unity 2; Markes International Ltd, Llantrisant, UK) was used for desorption of sampled cartridges. Desorbed BVOCs were cryofocused at −25 °C for 2 min, then, the cryotrap was rapidly heated to 320 °C and conducted into a 30 m × 0.25 mm × 0.25 µm film capillary column (HP-5, Crosslinked 5% pH Me Silicone; Supelco, Bellefonte, PA, USA). Carrier gas was helium and column flow was 1 mL min−1. Total run time was 30 min, where initial oven temperature was held at 35 °C for 5 min, then programmed to increase by 15 °C min−1 to 150 °C for 5 min, then by 15 °C min−1 to 250 °C for another 3 min, and finally by 30 °C min−1 to 280 °C for 2 min [17]. Terpenes were identified by comparing retention times with those of standards from Fluka (Buchs, Switzerland) and published spectra from the Wiley275 and NIST05a mass-spectral library using GCD ChemStation G1074A HP. Isoprenoid concentrations were determined by reference to trapped standards of α-pinene, 3-carene, β-pinene, limonene and sabinene every five analyses, and their calibration curves were made using three terpene concentrations (relationship between signal and terpene concentrations: r2 > 0.99) [9,12]. The most abundant isoprenoids, such as α-pinene, 3-carene, β-pinene, limonene and sabinene, had similar sensitivities, with <5% differences among calibration factors.
The exchange rates were expressed as differences between the emission rates of the sample and the corresponding blank in µg m−2 h−1. When the values are positive, they indicate BVOC emission from ground to atmosphere, and the exchange rates are then referred to be “emission rates”. When the values are negative, they indicate BVOC adsorption to ground, and the exchange rates are then referred to be “adsorption rates”.

2.4. Statistical Analyses

Differences in terpene exchange along the horizontal gradient were tested using one-way analysis of variance at P < 0.05 in Statistica v.8.0 (StatSoft, Inc., Tulsa, OK, USA) and covariance in terpene exchanges with soil environmental conditions was analyzed using partial least squares (PLS) regression using the plsdepot package in R v. 3.3.3. A comparison of emission profile was made between the ground covering dense litter and green needle of P. pinea according to the data from this study and Staudt et al (2000) [36].

3. Results

3.1. Soil Environmental Conditions

Mean soil temperatures along the transects of the four trees were 28.5 ± 0.80°C, 28.8 ± 1.16 °C, 33.1 ± 1.01 °C and 34.3 ± 1.46 °C, and soil moisture (v/v) was 12.2 ± 1.06%, 16.7 ± 0.91%, 4.7 ± 0.70% and 2.2 ± 0.39%. There was some variation in soil environmental conditions among the trees due to precipitation, but within-transect variation was lower owing to the randomization of sampling. Mean soil temperature ranged between 28.4 ± 1.00 °C (at 1 m) and 33.2 ± 1.88 °C (at 8 m), and mean soil moisture (v/v) ranged between 7.1 ± 2.23% (at 8 m) and 10.5 ± 3.09% (at 6 m) (Figure S2). The BVOC exchanges at same distance can be considered paralleled in terms of similar environmental conditions, which makes the average value can represent exchange at the distance; the conditional environment for all samplings was concentrated in certain scope which is also optimum to analyse its relationship with exchange.

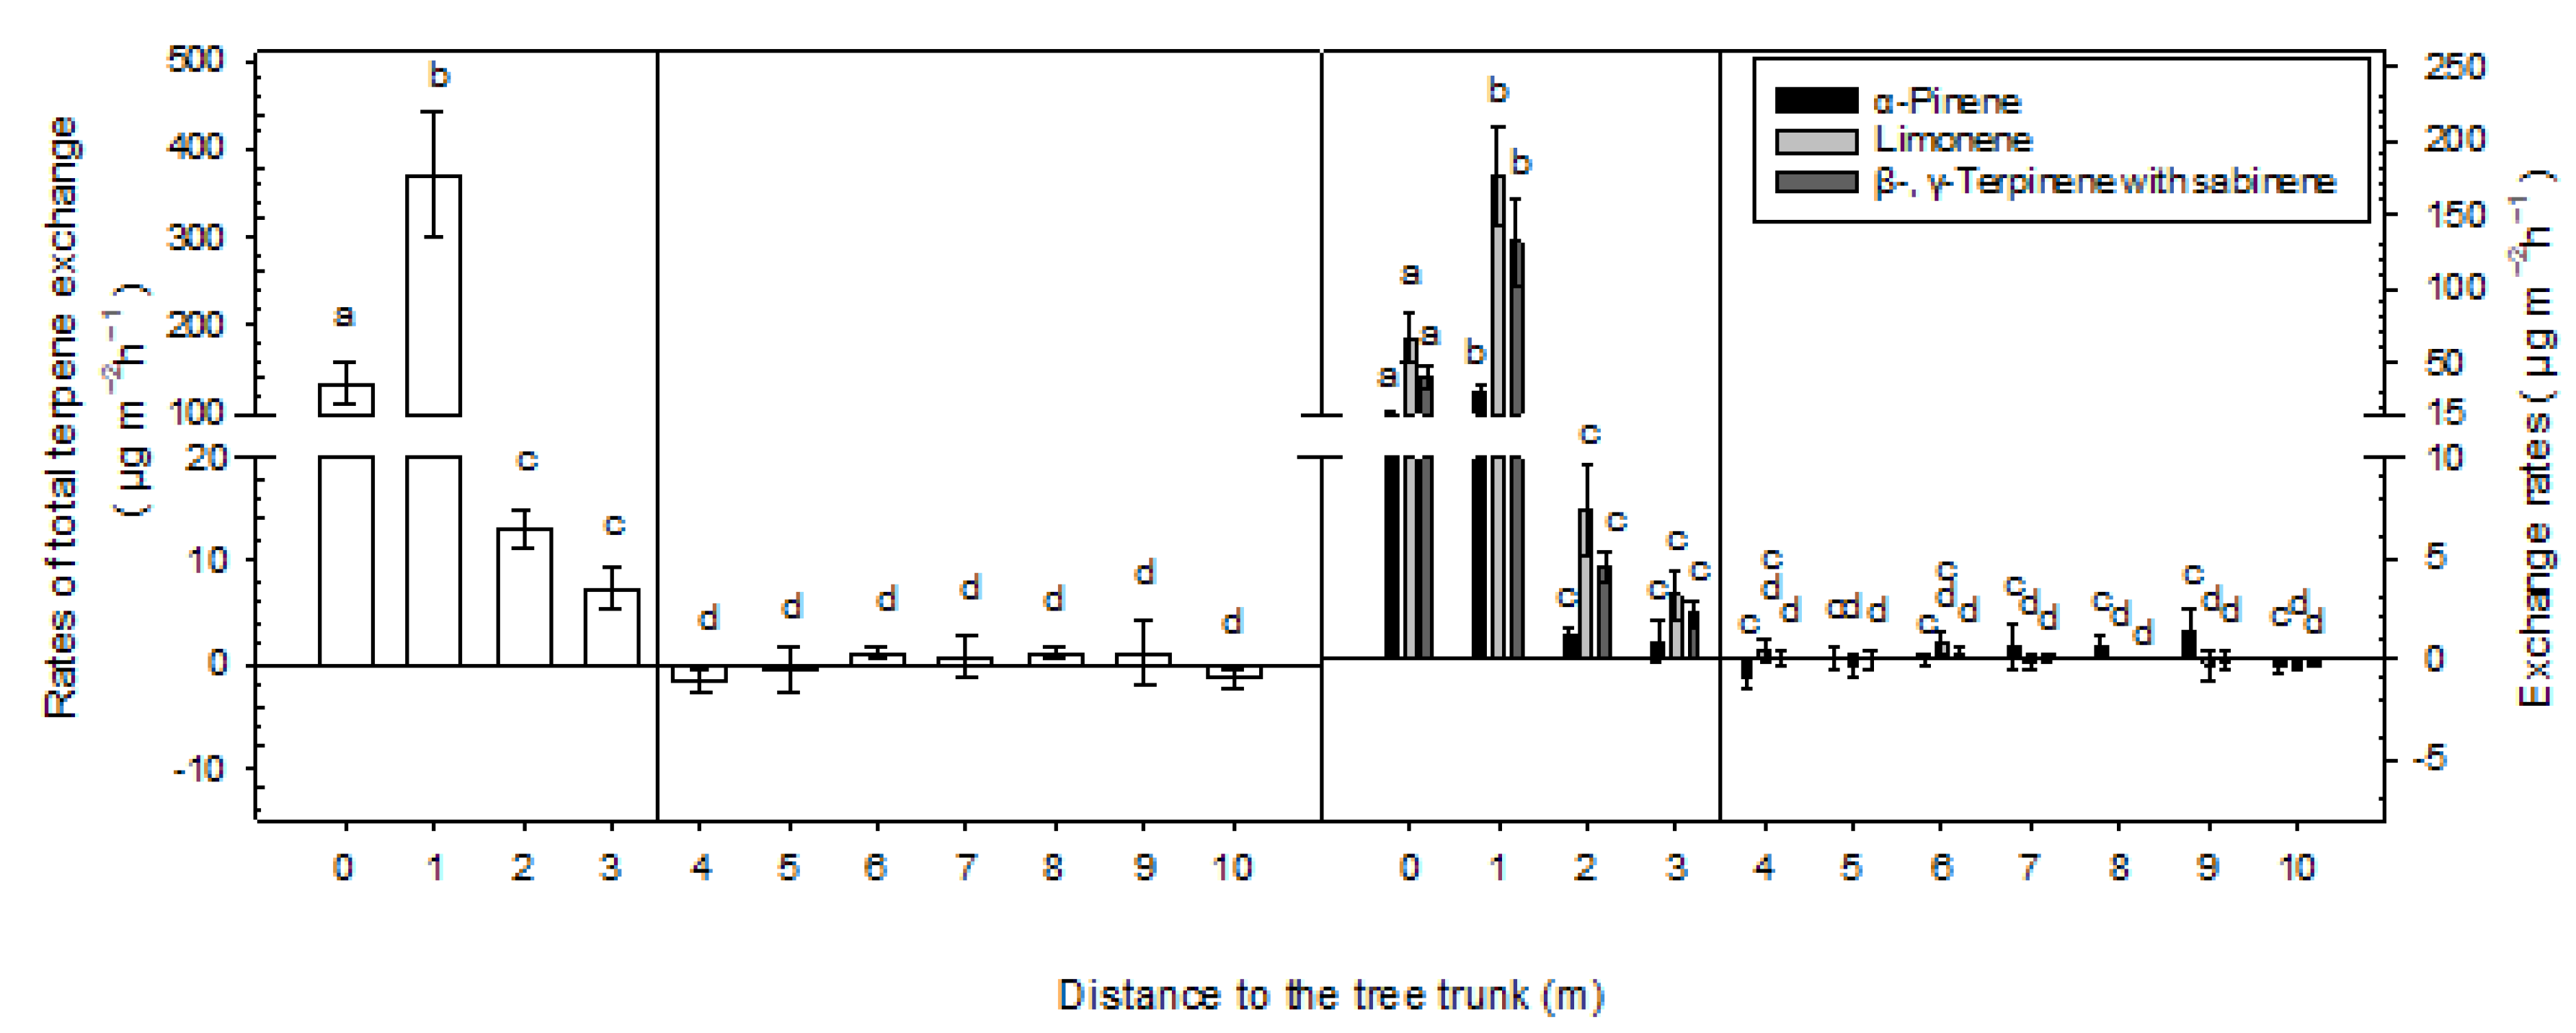
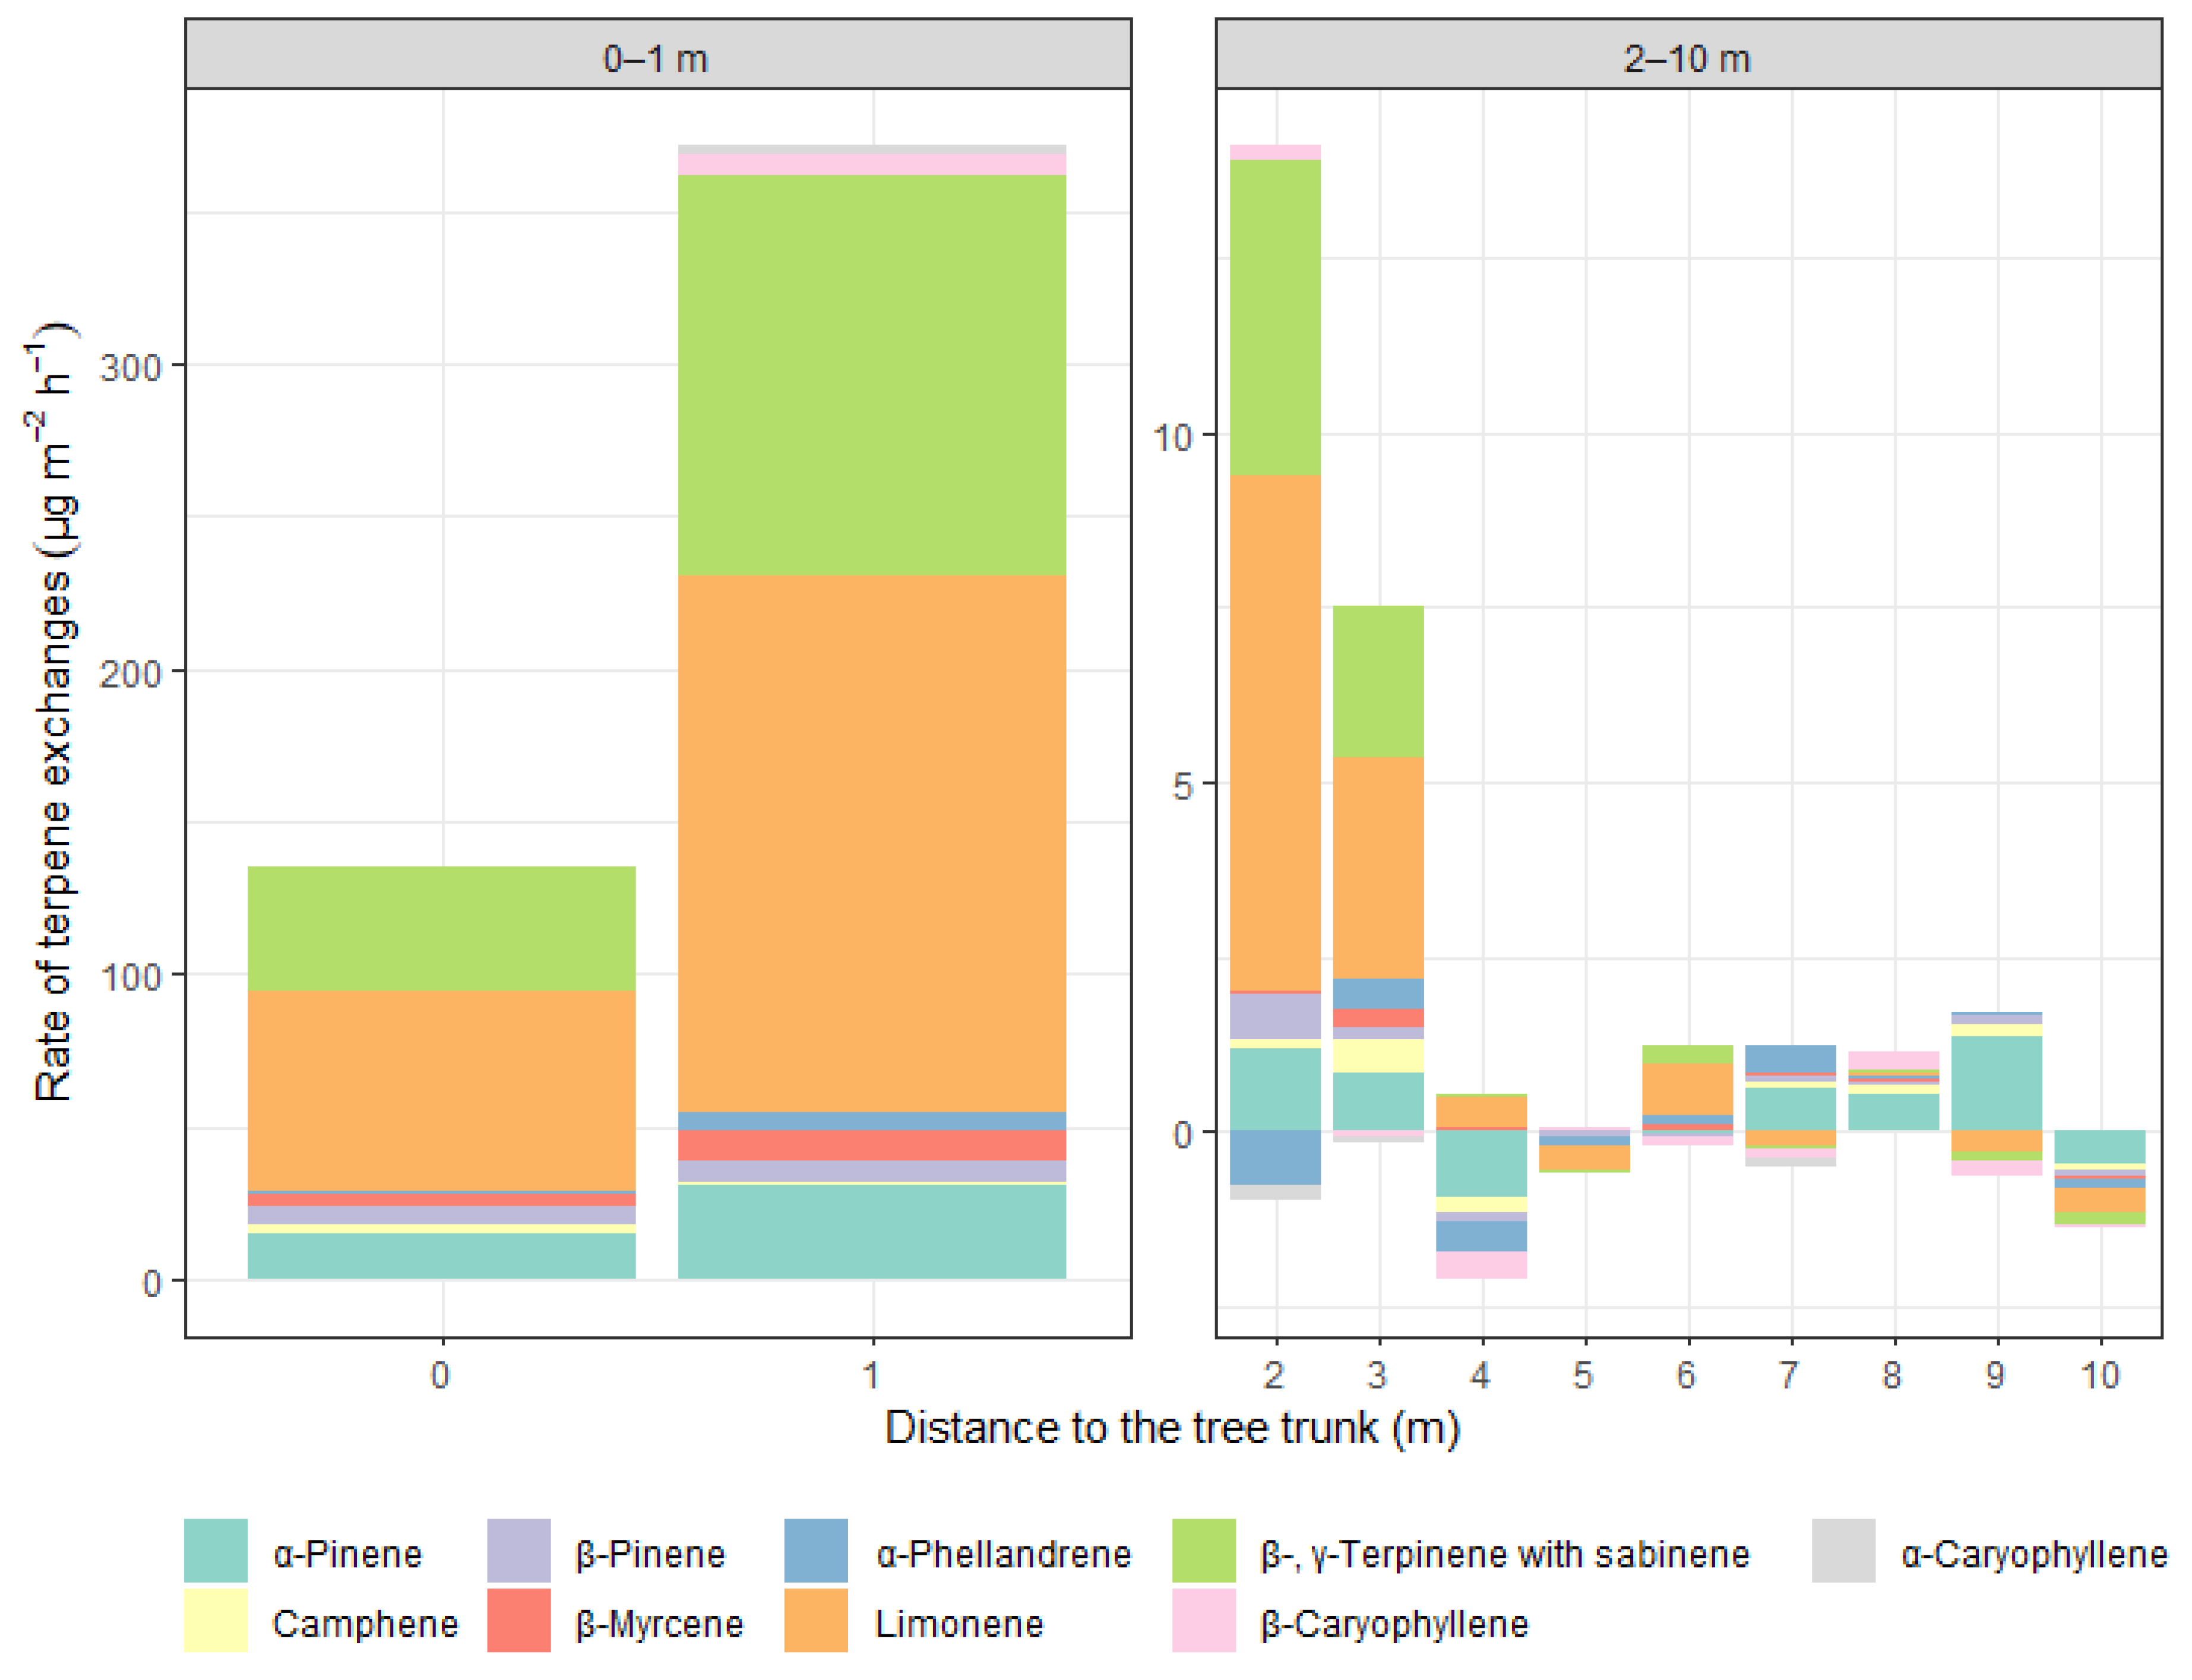
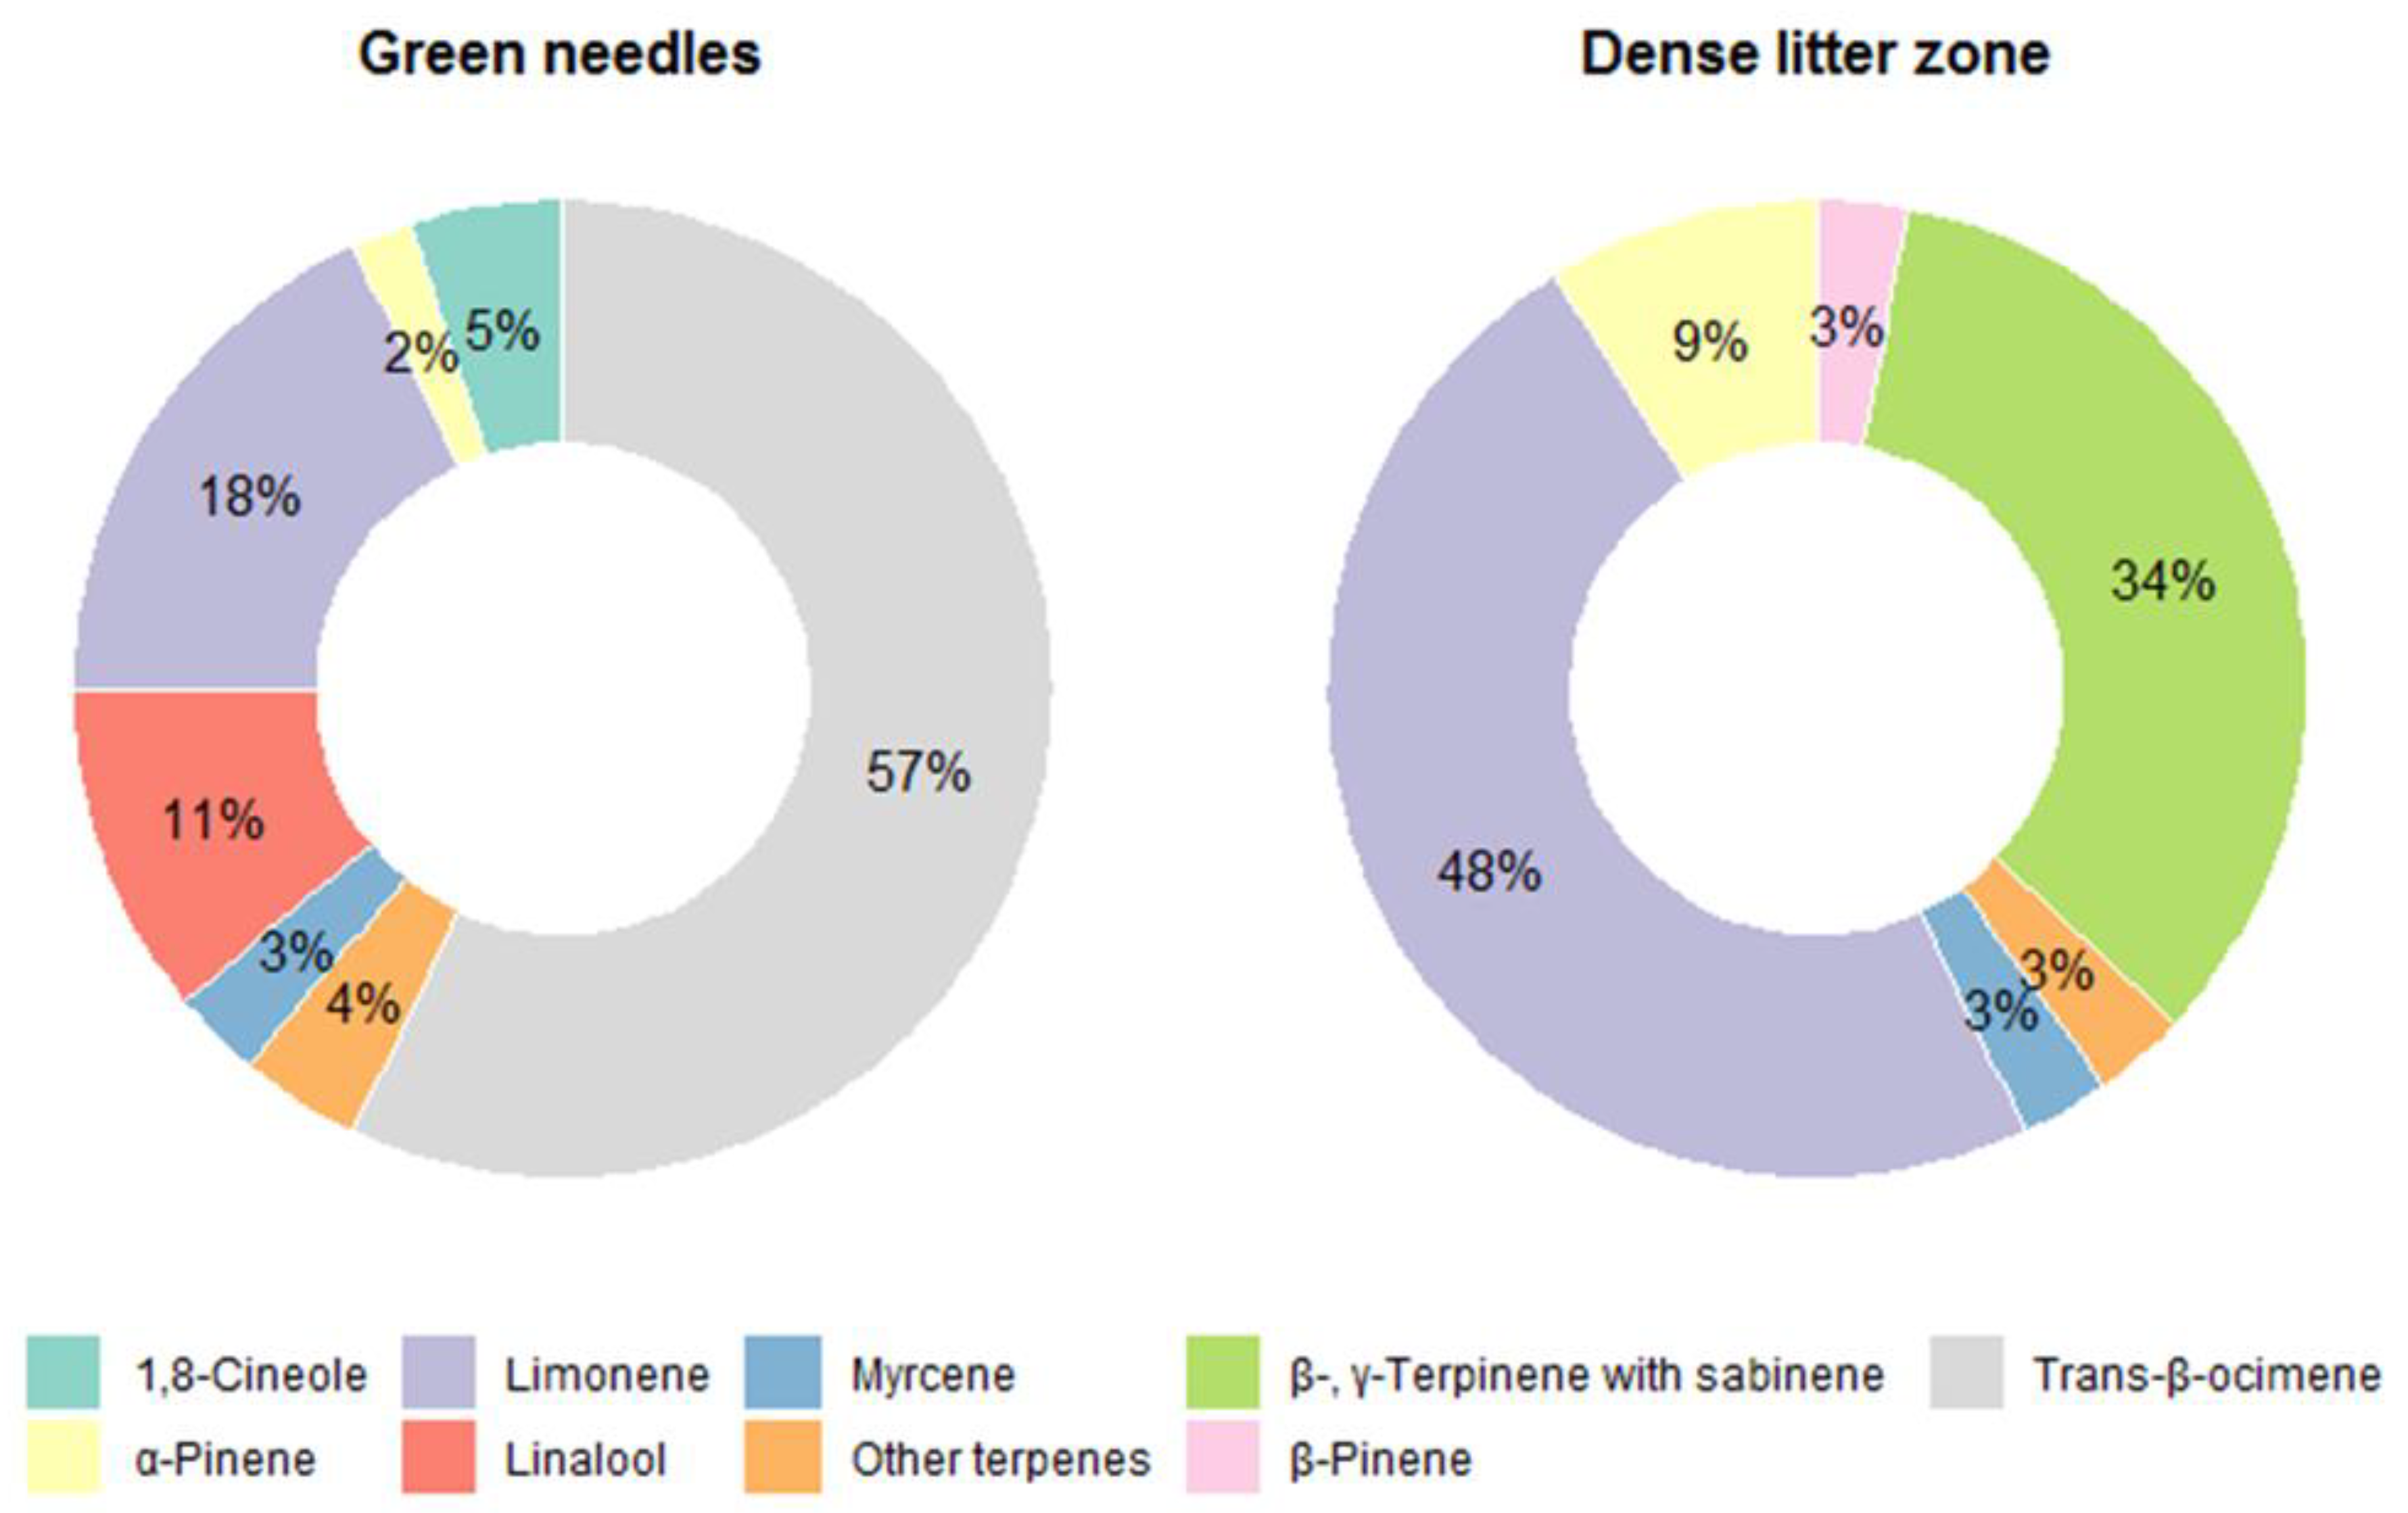
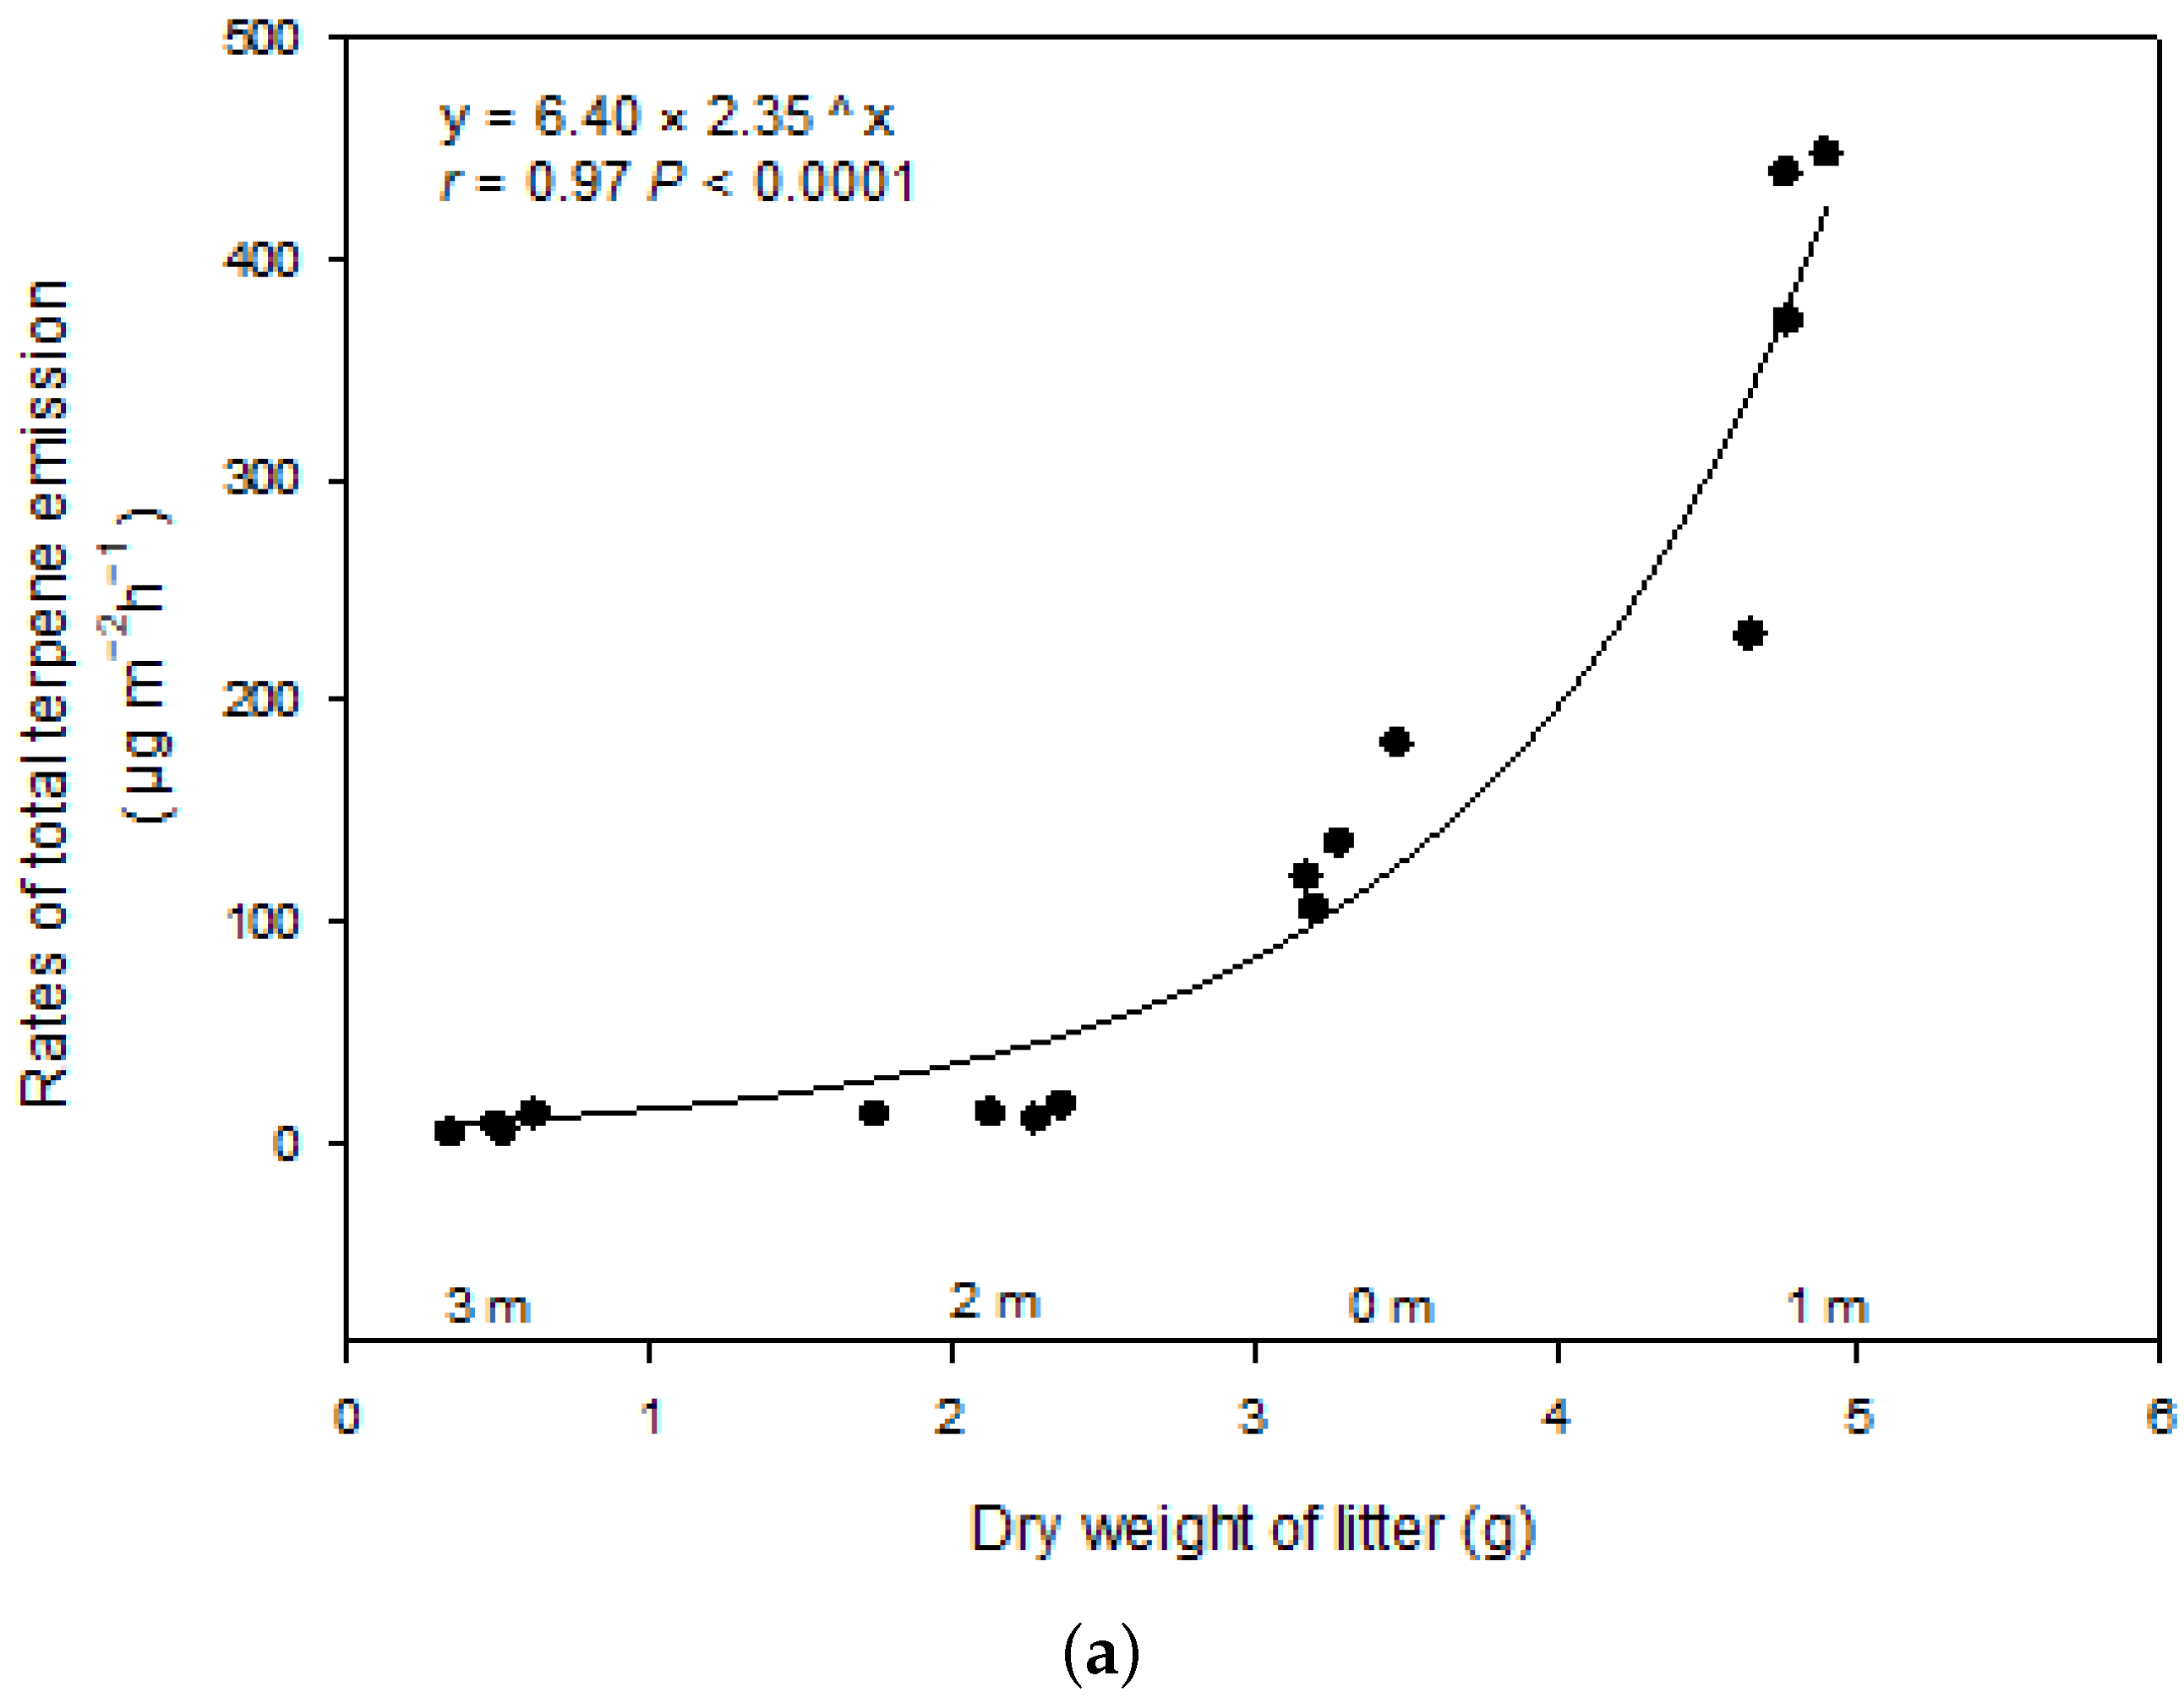
3.2. Terpene Exchange

There were no detectable isoprene emissions, while the terpene emissions varied greatly in terms of amount and composition along the transects. Terpene emissions varied most significantly along the horizontal gradient under litter, where they were greater at 1 m (371.4 ± 71.1 µg m−2 h−1) than at 0 m (135.2 ± 22.9 µg m−2 h−1; P < 0.05) and 2 m (13.1 ± 1.8 µg m−2 h−1; P < 0.01), and greater at 0 m than at 2 m (P < 0.01) (Figure 1); emissions were 7.3 ± 2.0 µg m−2 h−1 at 3 m. Litter was absent from 4 m along the transect and terpene exchange became irregular, where terpenes were emitted or adsorbed at low rates (average < 2 µg m−2·h−1); greatest adsorption rates were recorded at 4m (1.6 µg m−2 h−1) (Figure 1).
Nine monoterpenes and two sesquiterpenes were detected from the transects, all of which were detected for emission at only 0 and 1 m and, with the exception of camphene, tended to be emitted in greater quantities at 1 m than at 0 m (Figure 2). Limonene, β- and γ-terpinene with sabinene, and α-pinene together account for around 90% of total emissions at dense litter zone, while the spectrum of emission of green needles from P. pinea is dominated by trans-β-ocimene, followed by limonene, linalool, and 1,8-cineole, that together, accounted for around 90% (Table S2; Figure 3) of all emissions in summer mornings [36]; α-pinene and limonene account for higher proportion at dense litter zone than green needles, while myrcene showed similar proportion (Table S2; Figure 3).
Limonene was the most dominant compound, followed by β- and γ-terpinene with sabinene, and α-pinene (Figure 1), and their emissions along the transect were similar to those of total terpenes in the litter zone (greater concentrations at 1 m than 0 and 2 m, and greater at 0 m than at 2 m; P < 0.05) (Figure 1), and there were relatively high emissions of other terpenes at 0 and 1 m (<10 µg m−2 h−1), but lower emissions (<1 µg m−2 h−1) at the other distances (Figure 2). While two sesquiterpenes β-caryophyllene and α-caryophyllene were emitted at around 7.5 and 2.5 µg m−2 h−1 at 1 m, they were emitted at <0.5 µg m−2 h−1 at other distances, and were barely detected after 4 m (Figure 2). Almost all terpenes were adsorbed at 4 and 10 m, particularly α-pinene (Figure 2).
The litter dry weight was largest at 1 m (4.768 g), followed by 0 m (3.282 g), 2 m (2.128 g) and 3 m (0.492 g), and it showed strong exponential relationship with terpene emission (Figure 4a). The detected compounds were correlated positively with soil temperature and negatively with soil moisture content and distance to the tree (Figure 4b).

4. Discussion

Terpene exchanges varied with the distance to the trunk of Pinus pinea, a storage species for these compounds [35]. The ground showed totally different emission pattern due to litter coverage or not, with different magnitude, and it is possible to divide the exchange profiles into three groups: short distances (<2 m) covering dense litter, medium distances covering moderate litter (2–4 m), turf (≥4 m), where emission rates were greatest at <2 m and lowest at ≥4 m, reflecting the degree of canopy coverage of the ground. Previous studies also found evidence of a gradient from high levels of monoterpenes in the vicinity of the tree trunk to lower levels at the farthest distance [16,17,37]. These studies suggested that the large source of volatiles result predominantly from a large amount of litter or roots/rhizosphere activity in the soil near trunks [16,19].
The BVOC emissions at short and medium-distances were dominated by litter (Figure 4a), and also probably released by microbial metabolism and sparse ground vegetation, especially by roots owing to emissions decreasing with increasing distance from the tree trunk. However, the points at 0m with less litter, maybe owing to uneven ground near trunk, also showed obviously less emissions compare to that of the points at 1 m, where is supposed to be farther from and have less quantities of underground roots for the species of taproot system. The roots were reported to increase [38] or decrease [29] soil emissions, both with low fluxes indicating root-rhizosphere activity [10,30,39] would be a much smaller source compared to litter in this study. However, roots may represent a strong terpene source for Pinus spp. as well [17,37] and are a non-negligible source of VOCs for some species, like Arabidopsis [30,39]. Soil microbial activity has been shown to correlate with VOC emissions over a range of different forest soils [8,12,16], however, the soil moisture recorded were very low which has probably strongly hampered microbial metabolism [33]. Although activity of soil microorganisms and roots were both decreased in summer [29], the changes towards a decrease in the ratio of microorganisms/roots activities in the rhizosphere was found [30], which may suggest the emission from microbe activity may be a smaller source compared to roots.
The strongly positive relationship between emission rate and litter dry weight (Figure 4a) also indicated that the aboveground plant litter was likely the dominant terpene source [8,16,18] as also reported for aboveground litter of other species storing terpenes [28,34,40]. Turf is a “simpler” ecosystem compared to other ecosystems because it has less vegetation mass and associated interactions, than forests, grasslands or croplands [28,41]. The strong relationship (Figure 4a) may actually indicate that the aboveground plant litter was the most dominant terpene source, while other biotic sources like roots and microorganism, and abiotic factors like soil properties and environmental conditions may play less important roles in ground level isoprenoid emissions. This makes that the emissions can be estimated by litter dry weight in this type of ecosystem while it may be instead unrealistic for other ecosystems.
The quantity of terpenes is thus dominantly linked to the amount of needle litter at short and medium-distances which might mask the variation caused by environmental conditions, although effects of temperature on emissions elicit changes in transport resistance along the diffusion path from the litter [5] and temperature and humidity are always supposed to be main factors acting on terpene emission in Mediterranean summer daytime [29,42]. However, litter emissions associated with microbial decomposition of organic matter have been reported to be quantitatively more dominant than emissions caused only by abiotic factors as temperature and humidity [8,34,40] as suggested by the strong correlation between VOC production and microbial CO2 production [8].
The emitted compounds found in this study follow a pattern similar to other studies of ground VOC emissions which consist of very few abundant compounds associated with several less representative ones (Figure 3) [11,22,29]. The spectrums of emission vary significantly between dense litter zone and green needles from P. pinea (Figure 3), but both contain high amounts of limonene [36]. Emission rates of trans-β-ocimene, linalool and 1,8-cineole are light-dependent, and carbon dioxide exerts a particularly positive influence on the emission rates of trans-β-ocimene [35]. Trans-β-ocimene is directly synthesized in chloroplasts and follow a different metabolic path to other monoterpenes which are stored in resin ducts [35], this can be proved by its presence only in the sampling of green needle. However, this variation was also found in another typical Mediterranean pine species Pinus halepensis whose litter showed remarkably high sesquiterpenes (β-caryophyllene, followed by α-caryophyllene) emissions [17] which represent less than 5% of the total emissions of green needles [43,44]. Although the relative composition of terpenes in needle litter is related to that of green needles, terpene concentrations may change with time during decomposition processes [17]. The increased proportion of limonene and α-pinene and similar proportion of myrcene emission in dense litter zone compared with green needles may showed soil microbes readily consume a diverse array of BVOCs with different ability of utilization which also varied from distinct microbial communities [8,24,34], representing an important sink of BVOCs in terrestrial ecosystems dominated by plants that store terpenes [8]. On the other hand, the high proportion of β- and γ-terpinene with sabinene emissions in dense litter zone could indicate soil microbes producing terpenes that are not emitted by plants [8,17].
We found that terpene exchanges were very low (Figure 1) which was in agreement with the previous studies [17,20,29,30] and not correlated with the distance from the trunk overall (Figure 4b) at the greatest distance from the trees in the herbaceous turf, where there was a lack of needle litter and too far to be influenced by roots as well. Despite potential terpene content in grasses [17,45], there was a negligible impact on exchange rates owing to the small biomass compared with the pine, supporting research that shows terpene emissions from ground in close proximity to trees derives from litter and plant roots [17]. Much less research has been directed towards the more intensively anthropogenic managed turf soils than forest, grassland or cropland systems that have been studied [28,40]. Our findings showed that turf soils produced negligible BVOC emissions, which were much lower than forest soil in Mediterranean summer [30]. Further, BVOC exchange profiles depend on soil type [10,28], and influenced by environmental conditions [10,27]. However, most of the measured fluxes from forest soil probably originated from understory vegetation [21,34]. Previous research suggests that biotic factors affecting the emissions of VOCs from soil are 5–10 times stronger than the abiotic ones [8,27], and soil environmental conditions affect both sources by altering volatility of VOCs and the activity and community composition of microorganisms [34]. In this study, α-caryophyllene was lacking at the greatest distances from the trunks where turf dominated, and emissions of β-pinene were not related to soil temperature or moisture content but positively related to the distance (Figure 4b). However, the emission of the rest of emitted compounds including the most abundant compound, limonene, along with β- and γ-terpinene, sabinene, and α-pinene were correlated positively with soil temperature and negatively with soil moisture content except for α-phellandrene which showed an opposite trend (Figure 4b). Soils in this study emitted a variety of terpenes that varied as a function of soil temperature and moisture [4,32], and slight trend can be found for total terpene exchange (Figure S3). The positive correlation with temperature and negative correlation with moisture of BVOC emissions are also in agreement with previous study in Mediterranean holm oak forest soil [29] and high arctic soil [6]. The diversity of compounds found in this study, although not very high, gives an idea, of the various factors for VOC emissions that can be taken into account, such as temperature, moisture and their interaction. In addition, the type of soil and low vegetation also influences. Mediterranean soil behaves more as a sink than as a source of BVOCs since total soil BVOC adsorption overcame emission over the year [29,30]. However, our results show that soil VOC exchange with the atmosphere might greatly change in response to climate change, with likely increased emissions under the warmer and drier summers expected for the coming decades in the Mediterranean region [41].

5. Conclusions

To conclude, the presence of aboveground litter was the dominant source of ground level terpene emissions in the proximity of Pinus pinea trees and the emission amounts can be estimated by litter dry weight while the components vary significantly from green needle. In addition, soils act as a source or sink of terpenes in managed Mediterranean turf environments with negligible terpene exchanges and the exchange rates of total terpenes were correlated positively with soil temperature and negatively with soil moisture. The soil terpene emissions are expected to increase by climate change in the Mediterranean region. Given the variations in ground emissions with soil, vegetation, microorganisms, and associated interactions, we recommend further spatio-temporal analysis of ground level BVOC exchanges in a wider range of ecosystem types.

Supplementary Materials

The following are available online at https://www.mdpi.com/2073-4433/11/8/809/s1: Figure S1. Schematic of the isoprenoid sampling; Figure S2. Mean soil temperature and moisture content along the transects. Data are means ±SE; n = 4; Figure S3. Relationships for the rates of total terpene exchange with soil temperature and soil moisture along the transects in turf zone (≥4 m); Table S1. Randomized sampling plan for the four studied trees during the morning. T1-T4 are first to fourth study trees, respectively; Table S2. The component of terpene emissions of P. pinea for green needle (a) from the study of Staudt et al. (2000) and dense litter zone (≤1 m) (b) from this study in summer mornings.

Author Contributions

Conceptualization: J.L. and J.P.; Data curation: Z.M.; Formal analysis: Z.M.; Investigation: Z.M.; Methodology: J.L. and J.P.; Visualization: Z.M.; Writing–original draft: Z.M.; Writing–review & editing: J.L. and J.P. All authors have read and agreed to the published version of the manuscript.

Funding

This research was financially supported by the Spanish Government (project PID2019-110521GB-I00), the Catalan government (project SGR2017-1005), and the ERC Synergy project, SyG-2013-610028 IMBALANCE-P. We are also grateful for the financial support from the China Scholarship Council.

Conflicts of Interest

The authors declare no conflict of interest. The funders had no role in the design of the study; in the collection, analyses, or interpretation of data; in the writing of the manuscript, or in the decision to publish the results.

References

  1. Atkinson, R. Atmospheric chemistry of VOCs and NO(x). Atmos. Environ. 2000, 34, 2063–2101. [Google Scholar] [CrossRef]
  2. Peñuelas, J.; Staudt, M. BVOCs and global change. Trends Plant Sci. 2010, 15, 133–144. [Google Scholar] [CrossRef]
  3. Shindell, D.T.; Faluvegi, G.; Koch, D.M.; Schmidt, G.A.; Unger, N.; Bauer, S.E. Improved attribution of climate forcing to emissions. Science 2009, 326, 716–718. [Google Scholar] [CrossRef] [Green Version]
  4. Svendsen, S.H.; Priemé, A.; Voriskova, J.; Kramshøj, M.; Schostag, M.; Jacobsen, C.S.; Rinnan, R. Emissions of biogenic volatile organic compounds from arctic shrub litter are coupled with changes in the bacterial community composition. Soil Biol. Biochem. 2018, 120, 80–90. [Google Scholar] [CrossRef] [Green Version]
  5. Kesselmeier, J.; Staudt, M. Biogenic Volatile Organic Compunds (VOC): An Overview on Emission, Physiology and Ecology. J. Atmos. Chem. 1999, 33, 23–88. [Google Scholar] [CrossRef]
  6. Svendsen, S.H.; Lindwall, F.; Michelsen, A.; Rinnan, R. Biogenic volatile organic compound emissions along a high arctic soil moisture gradient. Sci. Total. Environ. 2016, 573, 131–138. [Google Scholar] [CrossRef]
  7. Albers, C.N.; Kramshøj, M.; Rinnan, R. Rapid mineralization of biogenic volatile organic compounds in temperate and Arctic soils. Biogeosciences 2018, 15, 3591–3601. [Google Scholar] [CrossRef] [Green Version]
  8. Leff, J.W.; Fierer, N. Volatile organic compound (VOC) emissions from soil and litter samples. Soil Biol. Biochem. 2008, 40, 1629–1636. [Google Scholar] [CrossRef]
  9. Mu, Z.; Llusià, J.; Liu, D.; Ogaya, R.; Asensio, D.; Zhang, C.; Peñuelas, J. Seasonal and diurnal variations of plant isoprenoid emissions from two dominant species in Mediterranean shrubland and forest submitted to experimental drought. Atmos. Environ. 2018, 191, 105–115. [Google Scholar] [CrossRef]
  10. Peñuelas, J.; Asensio, D.; Tholl, D.; Wenke, K.; Rosenkranz, M.; Piechulla, B.; Schnitzler, J.P. Biogenic volatile emissions from the soil. Plant Cell Environ. 2014, 37, 1866–1891. [Google Scholar] [CrossRef]
  11. Potard, K.; Monard, C.; Le Garrec, J.L.; Caudal, J.P.; Le Bris, N.; Binet, F. Organic amendment practices as possible drivers of biogenic Volatile Organic Compounds emitted by soils in agrosystems. Agric. Ecosyst. Environ. 2017, 250, 25–36. [Google Scholar] [CrossRef]
  12. Asensio, D.; Peñuelas, J.; Ogaya, R.; Llusià, J. Seasonal soil VOC exchange rates in a Mediterranean holm oak forest and their responses to drought conditions. Atmos. Environ. 2007, 41, 2456–2466. [Google Scholar] [CrossRef]
  13. He, N.P.; Han, X.G.; Pan, Q.M. Variations in the volatile organic compound emission potential of plant functional groups in the temperate grassland vegetation of inner Mongolia, China. J. Integr. Plant Biol. 2005, 47, 13–19. [Google Scholar] [CrossRef]
  14. Mäki, M.; Heinonsalo, J.; Hellén, H.; Bäck, J. Contribution of understorey vegetation and soil processes to boreal forest isoprenoid exchange. Biogeosciences 2017, 14, 1055–1073. [Google Scholar] [CrossRef] [Green Version]
  15. Aaltonen, H.; Aalto, J.; Kolari, P.; Pihlatie, M.; Pumpanen, J.; Kulmala, M.; Nikinmaa, E.; Vesala, T.; Bäck, J. Continuous VOC flux measurements on boreal forest floor. Plant Soil 2013, 369, 241–256. [Google Scholar] [CrossRef]
  16. Bäck, J.; Aaltonen, H.; Hellén, H.; Kajos, M.K.; Patokoski, J.; Taipale, R.; Pumpanen, J.; Heinonsalo, J. Variable emissions of microbial volatile organic compounds (MVOCs) from root-associated fungi isolated from Scots pine. Atmos. Environ. 2010, 44, 3651–3659. [Google Scholar] [CrossRef]
  17. Asensio, D.; Owen, S.M.; Llusià, J.; Peñuelas, J. The distribution of volatile isoprenoids in the soil horizons around Pinus halepensis trees. Soil Biol. Biochem. 2008, 40, 2937–2947. [Google Scholar] [CrossRef]
  18. Hellén, H.; Hakola, H.; Pystynen, K.H.; Rinne, J.; Haapanala, S. C2-C10 hydrocarbon emissions from a boreal wetland and forest floor. Biogeosciences 2006, 3, 167–174. [Google Scholar] [CrossRef] [Green Version]
  19. Tang, J.; Schurgers, G.; Rinnan, R. Process Understanding of Soil BVOC Fluxes in Natural Ecosystems: A Review. Rev. Geophys. 2019, 57, 966–986. [Google Scholar] [CrossRef]
  20. Hayward, S.; Muncey, R.J.; James, A.E.; Halsall, C.J.; Hewitt, C.N. Monoterpene emissions from soil in a Sitka spruce forest. Atmos. Environ. 2001, 35, 4081–4087. [Google Scholar] [CrossRef]
  21. Mäki, M.; Aaltonen, H.; Heinonsalo, J.; Hellén, H.; Pumpanen, J.; Bäck, J. Boreal forest soil is a significant and diverse source of volatile organic compounds. Plant Soil 2019, 441, 89–110. [Google Scholar] [CrossRef] [Green Version]
  22. Ramirez, K.S.; Lauber, C.L.; Fierer, N. Microbial consumption and production of volatile organic compounds at the soil-litter interface. Biogeochemistry 2010, 99, 97–107. [Google Scholar] [CrossRef] [Green Version]
  23. Smolander, A.; Ketola, R.A.; Kotiaho, T.; Kanerva, S.; Suominen, K.; Kitunen, V. Volatile monoterpenes in soil atmosphere under birch and conifers: Effects on soil N transformations. Soil Biol. Biochem. 2006, 38, 3436–3442. [Google Scholar] [CrossRef]
  24. Stahl, P.D.; Parkin, T.B. Microbial production of volatile organic compounds in soil microcosms. Soil Sci. Soc. Am. J. 1996, 60, 821–828. [Google Scholar] [CrossRef] [Green Version]
  25. Paavolainen, L.; Kitunen, V.; Smolander, A. Inhibition of nitrification in forest soil by monoterpenes. Plant Soil 1998, 205, 147–154. [Google Scholar] [CrossRef]
  26. Farré-Armengol, G.; Filella, I.; Llusia, J.; Peñuelas, J. Bidirectional interaction between phyllospheric microbiotas and plant volatile emissions. Trends Plant Sci. 2016, 21, 854–860. [Google Scholar] [CrossRef] [Green Version]
  27. Rossabi, S.; Choudoir, M.; Helmig, D.; Hueber, J.; Fierer, N. Volatile Organic Compound Emissions From Soil Following Wetting Events. J. Geophys. Res. Biogeosciences 2018, 123, 1988–2001. [Google Scholar] [CrossRef]
  28. Greenberg, J.P.; Asensio, D.; Turnipseed, A.; Guenther, A.B.; Karl, T.; Gochis, D. Contribution of leaf and needle litter to whole ecosystem BVOC fluxes. Atmos. Environ. 2012, 59, 302–311. [Google Scholar] [CrossRef]
  29. Asensio, D.; Peñuelas, J.; Llusià, J.; Ogaya, R.; Filella, I. Interannual and interseasonal soil CO2 efflux and VOC exchange rates in a Mediterranean holm oak forest in response to experimental drought. Soil Biol. Biochem. 2007, 39, 2471–2484. [Google Scholar] [CrossRef]
  30. Asensio, D.; Peñuelas, J.; Filella, I.; Llusià, J. On-line screening of soil VOCs exchange responses to moisture, temperature and root presence. Plant Soil 2007, 291, 249–261. [Google Scholar] [CrossRef]
  31. Van Roon, A.; Parsons, J.R.; Te Kloeze, A.M.; Govers, H.A.J. Fate and transport of monoterpenes through soils. Part I. Prediction of temperature dependent soil fate model input-parameters. Chemosphere 2005, 61, 599–609. [Google Scholar]
  32. Insam, H.; Seewald, M.S.A. Volatile organic compounds (VOCs) in soils. Biol. Fertil. Soils 2010, 46, 199–213. [Google Scholar] [CrossRef] [Green Version]
  33. Veres, P.R.; Behrendt, T.; Klapthor, A.; Meixner, F.X.; Williams, J. Volatile Organic Compound emissions from soil: Using Proton-Transfer-Reaction Time-of-Flight Mass Spectrometry (PTR-TOF-MS) for the real time observation of microbial processes. Biogeosci. Discuss. 2014, 11, 12009–12038. [Google Scholar] [CrossRef] [Green Version]
  34. Gray, C.M.; Monson, R.K.; Fierer, N. Emissions of volatile organic compounds during the decomposition of plant litter. J. Geophys. Res. Biogeosci. 2010, 115, 115. [Google Scholar] [CrossRef] [Green Version]
  35. Loreto, F.; Nascetti, P.; Graverini, A.; Mannozzi, M. Emission and content of monoterpenes in intact and wounded needles of the Mediterranean Pine, Pinus pinea. Funct. Ecol. 2000, 14, 589–595. [Google Scholar] [CrossRef]
  36. Staudt, M.; Bertin, N.; Frenzel, B.; Seufert, G. Seasonal variation in amount and composition of monoterpenes emitted by young Pinus pinea trees—Implications for emission modeling. J. Atmos. Chem. 2000, 35, 77–99. [Google Scholar] [CrossRef]
  37. Lin, C.; Owen, S.M.; Peñuelas, J. Volatile organic compounds in the roots and rhizosphere of Pinus spp. Soil Biol. Biochem. 2007, 39, 951–960. [Google Scholar] [CrossRef]
  38. Rinnan, R.; Gierth, D.; Bilde, M.; Rosenørn, T.; Michelsen, A. Off-season biogenic volatile organic compound emissions from heath mesocosms: Responses to vegetation cutting. Front. Microbiol. 2013, 4, 1–10. [Google Scholar] [CrossRef] [Green Version]
  39. Steeghs, M.; Bais, H.P.; De Gouw, J.; Goldan, P.; Kuster, W.; Northway, M.; Fall, R.; Vivanco, J.M. Proton-transfer-reaction mass spectrometry as a new tool for real time analysis of root-secreted volatile organic compounds in Arabidopsis. Plant Physiol. 2004, 135, 47–58. [Google Scholar] [CrossRef] [Green Version]
  40. Gray, C.M.; Fierer, N. Impacts of nitrogen fertilization on volatile organic compound emissions from decomposing plant litter. Glob. Chang. Biol. 2012, 18, 739–748. [Google Scholar] [CrossRef]
  41. Karl, T.G.; Spirig, C.; Rinne, J.; Stroud, C.; Prevost, P.; Greenberg, J.; Fall, R.; Guenther, A. Virtual disjunct eddy covariance measurements of organic compound fluxes from a subalpine forest using proton transfer reaction mass spectrometry. Atmos. Chem. Phys. 2002, 2, 279–291. [Google Scholar] [CrossRef] [Green Version]
  42. Mu, Z.; Llusià, J.; Liu, D.; Ogaya, R.; Asensio, D.; Zhang, C.; Peñuelas, J. Profile of foliar isoprenoid emissions from Mediterranean dominant shrub and tree species under experimental nitrogen deposition. Atmos. Environ. 2019, 216, 116951. [Google Scholar] [CrossRef]
  43. Blanch, J.S.; Peñuelas, J.; Llusià, J. Sensitivity of terpene emissions to drought and fertilization in terpene-storing Pinus halepensis and non-storing Quercus ilex. Physiol. Plant. 2007, 131, 211–225. [Google Scholar] [CrossRef] [PubMed]
  44. Simon, V.; Dumergues, L.; Solignac, G.; Torres, L. Biogenic emissions from Pinus halepensis: A typical species of the Mediterranean area. Atmo. Res. 2005, 74, 37–48. [Google Scholar] [CrossRef]
  45. Tava, A.; Berardo, N.; Odoardi, M. Composition of essential oil of tall fescue. Phytochemistry 1991, 30, 1455–1458. [Google Scholar] [CrossRef]
Figure 1. Rates of total terpene, α-pinene, limonene, β- and γ-terpinene with sabinene exchange along the transects. Data are means ± SE; n = 4. Different letters indicate differences among distances (P < 0.05).
Atmosphere 11 00809 g001
Figure 2. Distribution of terpene exchange along the transects.
Atmosphere 11 00809 g002
Figure 3. The composition of terpene emissions for green needles [36] and dense litter zone of our study (≤1 m) in summer mornings.
Atmosphere 11 00809 g003
Figure 4. Relationship between total terpene emissions and litter dry weight within 4 m of the study trees (a). Partial least squares (PLS) regression between soil temperature or soil moisture content or distance to the trees and terpene exchange along the transects in turf zone (≥4 m) (b). Black represents soil temperature, soil moisture content and distance to the trees as independent variables (X), red represents exchange rates of individual terpenes as dependent variables (Y). α-Pin, α-pinene; Cam, camphene; β-Pin, β-pinene; Myr, myrcene; α-Phe, α-phellandrene; Lim, limonene; β-, γ-ter and sab, β-, γ-terpinene with sabinene; β-Car, β-caryophyllene.
Atmosphere 11 00809 g004aAtmosphere 11 00809 g004b

