1. Introduction
Global climate change is commonly identified with global warming, i.e., the observed, forecasted, and expected increase in air temperature, and the resulting increase in the length of the growing season, the possibility of growing thermophilic plants, summer heat waves, and milder winters. However, other elements of the climate are changing as well, especially precipitation, evaporation, cloud cover, and wind, and their values are not always increasing. Changes in freshwater resources, in terms of the consequences of global climate change, seem to be more significant and important than rising temperatures [
1,
2,
3]. In this case, temperature changes can be considered as the background to or cause of changes in water resources. Non-climatic factors and changes, such as population growth, increased water consumption for industry and intensive agriculture, and growing aspirations regarding the quality of life (housing conditions, hygiene, and recreation), are also important for water management.
The global temperature has risen very clearly for 40 years, and since the 1960s, each decade has been warmer than the previous one [
4,
5,
6]. The greatest warming has occurred in the last 35 years, and 16 of the 17 warmest recorded years have taken place since 2001. The period which is the subject of the present study (2001–2018) is one of the warmest 17-year periods in the world [
7]. The course of precipitation, especially in large cities, is modified by specific urban conditions, with high surface roughness, high aerosol concentrations, and urban heat islands playing a major role. Due to high surface sealing, particular attention should be given to runoff in the water balance of urban areas. In Kraków, for example, sealing is as high as 95% for areas with historical buildings and high-density development in the city center and 66% for modern residential blocks [
8]. In addition to numerous local studies on precipitation in specific cities, as well as regional studies, meta-analyses of information contained in previously published works deserve special attention. Such a meta-analysis also underscores the need to standardize the way results are presented in future studies. In recent decades, new measuring instruments have also been developed, such as weather radars to assess high spatial and temporal variability of precipitation, as well as new hydrological characterization methods and high-resolution models of hydrological processes. Existing drainage infrastructures also play an important role in urban areas, as they influence runoff more or less effectively, and should be taken into account when forecasting floods. Despite these efforts, interactions between rainfall variability, catchment heterogeneity, and the hydrological response remain poorly understood. Meta-analyses thus identify knowledge gaps requiring further research to provide a better understanding of the hydrological response in cities and the ability to predict it [
9,
10,
11].
Without considering the unquestionable regional and seasonal variation or the cyclical nature of rainfall, the following long-term precipitation totals averaged across Poland have been reported for various periods: 602 mm (1891–1930) [
12], 599 mm (1931–1960) [
13], 606 mm (1951–1970) [
14], 600 mm (1951–1980) [
15], 609 mm (1961–1990) [
16], 601 mm (1971–2000) [
17], and 612 mm (1991–2000) [
17]. In 1951–2010, the average annual rainfall, calculated on the basis of data from 38 stations, was 594 mm [
18], while for the period 1951–2013 the average annual rainfall for Poland based on 50 stations was 618 mm [
19].
Analysis of changes in atmospheric precipitation in Poland during global warming shows no clear trends. In the 20th century, they show a slight downward trend −1.49 mm/10 years, but, in the second half of the 20th century, they show an upward trend of 2.85 mm/10 years [
17]. In Poland, which lies between northern Europe, with observed and anticipated upward trends in annual precipitation totals, and southern Europe, where a decrease in annual precipitation totals is observed and predicted, no significant changes in precipitation are observed or forecasted, and no major upward trend is observed in most areas. The highest increases in rainfall, with changes of varying significance, have been observed in the northern half of Poland [
19]. This hypothesis for Central Europe is also supported by previous research by Niedźwiedź and Twardosz [
20]. The authors state that the annual rainfall totals in the second half of the 20th century increased to 642 mm at the Lviv, Kraków, Wrocław, and Warszawa stations, compared to 618 mm in the first half of the 20th century, while annual rainfall totals decreased for stations further south—Prague, Vienna, and Budapest, from 599 mm in the first half of the 20th century to 554 mm in the second half. Niedźwiedź et al. [
21] also found that, after many very wet years in the last decade of the 20th century and at the start of the 21st century, precipitation began to decrease at all weather stations in Central and Eastern Europe.
In the light of the analysis of relevant publications from Poland, it is possible to track the reported increase in the coefficient of variation of annual precipitation totals. Thus, the coefficient of variation in the moving 20-year periods from 1861 to 1990 increased from about 10% at the start of that period to about 16% by the end [
22]. The coefficient of variation of average annual precipitation totals in Poland in the 20th century and in the second half of that century increased from 11% to 13% [
23]. In the years 1951–1980, the isoline values of the coefficient of variation in Poland ranged from 16% to 22% [
24]. In the second half of the 20th century (1951–2000), for five stations representative of Poland, i.e., Szczecin, Wrocław, Łódź, Suwałki, and Przemyśl, it was 16%, 18%, 17%, 18%, and 19%, respectively [
25], while, for the period of 1971–2000, the value averaged across Poland was 17% [
17].
Due to the increasing variability of precipitation, the risk of both floods and droughts is increasing. For this reason, programs are developed for the construction of small retention reservoirs and other projects increasing retention, as well as flood protection programs. In some countries, steps have been taken to take climate change into account in design practice. To maintain a high level of safety in the future as well, the probability of flood is also raised, e.g., from once every 100 years in England or some parts of Germany by 10%, 15%, or even 20% [
26]. In studies covering the whole of Poland, as well as in regional studies or those concerning individual stations, there is a tendency to cover the most recent periods, not necessarily complete decades, e.g., 1951–2013 or 1981–2014 [
19,
27].
The problem of variability of weather conditions and of extreme meteorological and hydrological phenomena has recently been revived in new global realities, in current climate change research problems, and in the new economic and social reality. Due to the migration from villages to cities, in 1966, the number of inhabitants of Poland living in cities surpassed the population in rural areas [
28]. While the rural population remained nearly unchanged, the urban population grew steadily until the last decade of the 20th century, before stabilizing in recent years at about 60%. This means that at present and in the near future most of the Polish population will be affected by the negative effects of the increasing variability of rainfall in cities. For this reason, it is important to examine the contemporary (2001–2018) spatial variability of precipitation in Poland, which is the purpose of this work.
2. Materials and Methods
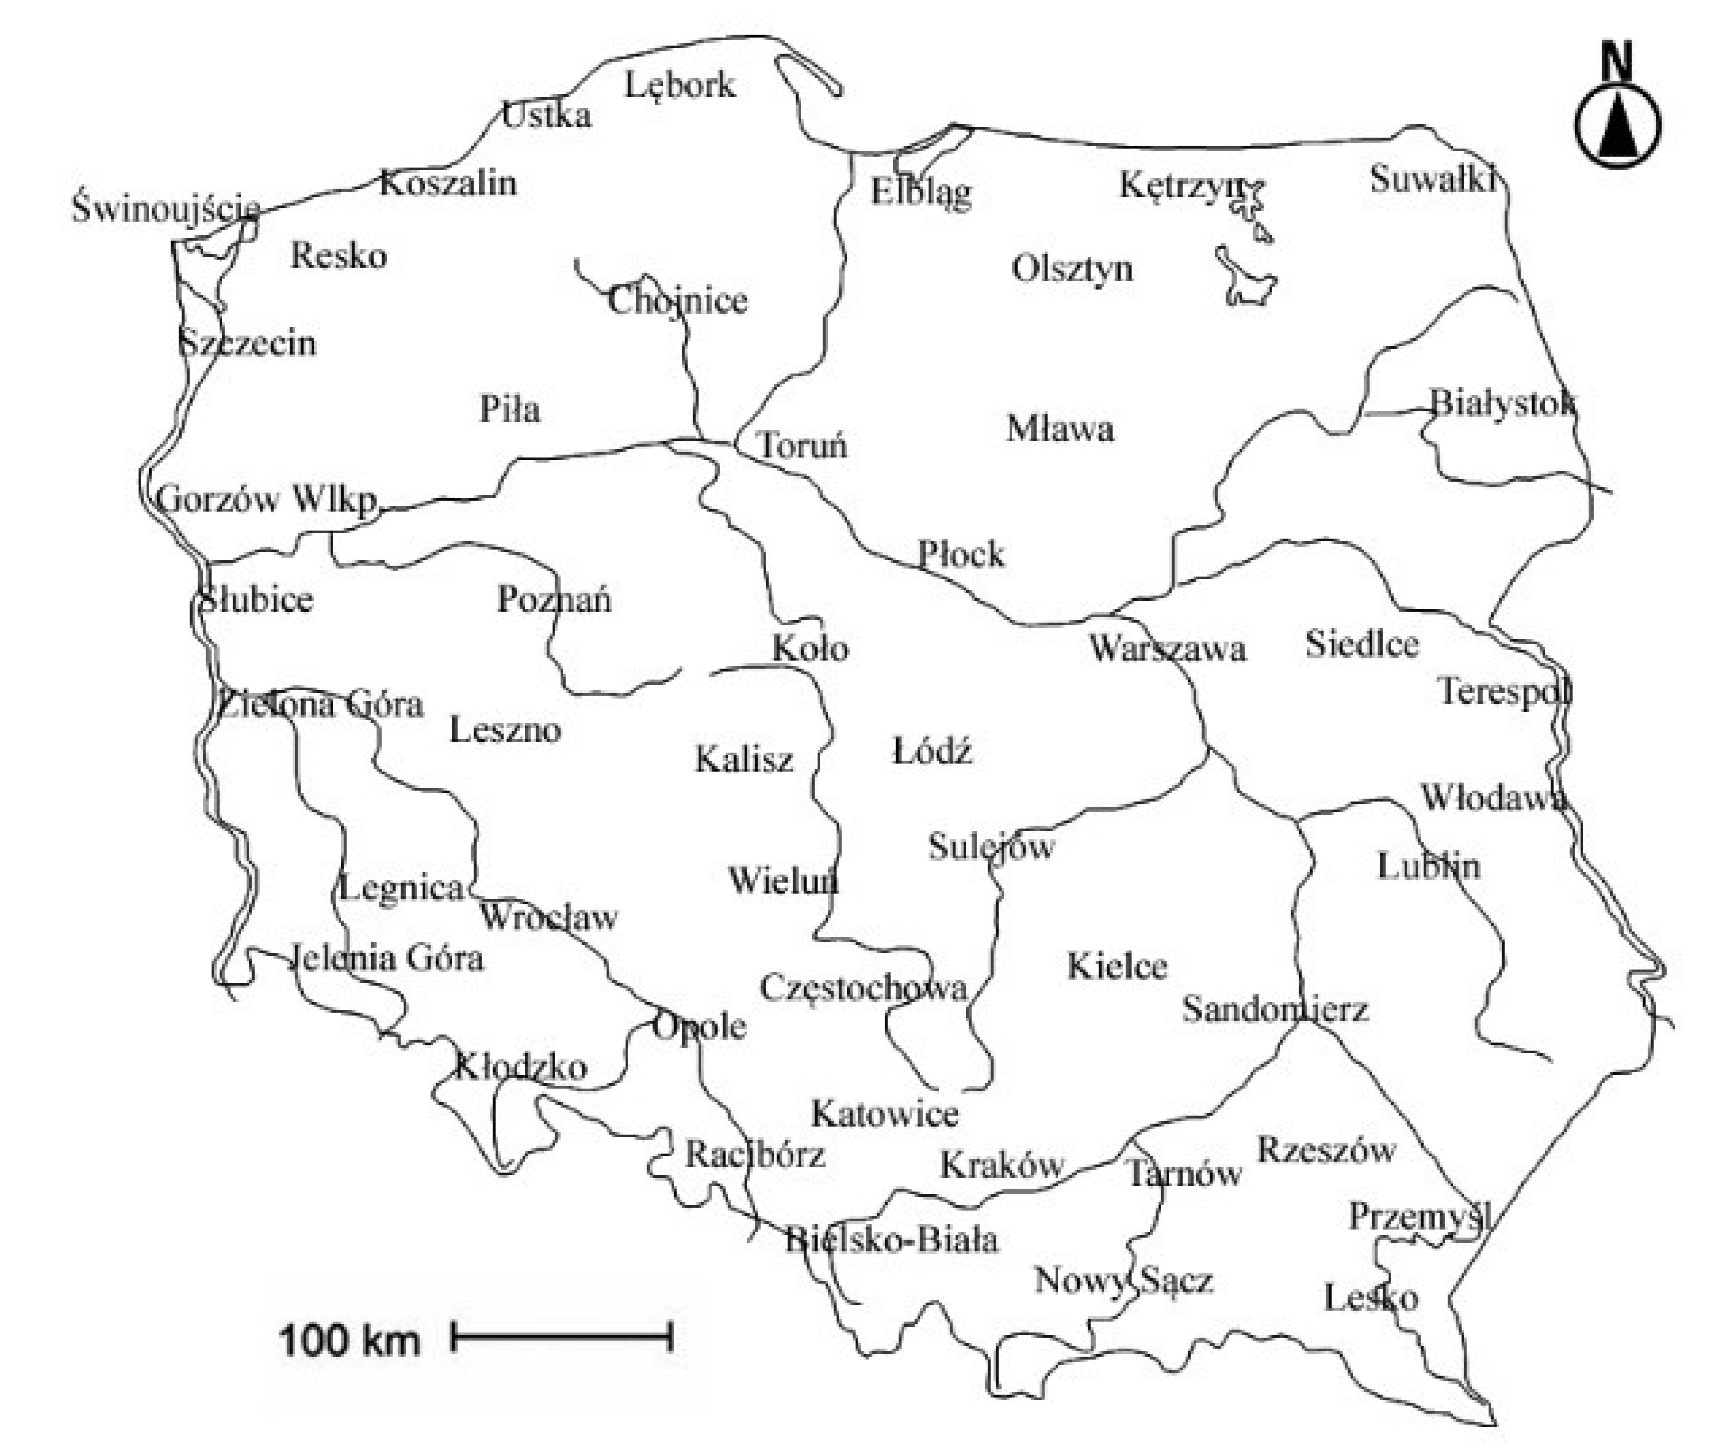
The research material consists of verified, homogeneous values of monthly precipitation totals from 47 weather stations evenly distributed throughout Poland, from 2001 to 2018 (
Figure 1). The locations of the weather stations were as follows (altitude in metres): Białystok (139), Bielsko-Biała (398), Chojnice (172), Częstochowa (261), Elbląg (38), Gorzów Wielkopolski (65), Jelenia Góra (342), Kalisz (140), Katowice (284), Kętrzyn (108), Kielce (268), Kłodzko (316), Koło (95), Koszalin (33), Kraków (237), Legnica (122), Lesko (386), Leszno (91), Lębork (18), Lublin (171), Łódź (187), Mława (141), Nowy Sącz (292), Olsztyn (133), Opole (176), Piła (72), Płock (63), Poznań (86), Racibórz (190), Resko (51), Rzeszów (200), Sandomierz (202), Siedlce (146), Słubice (20), Sulejów (188), Suwałki (165), Szczecin (1), Świnoujście (6), Tarnów (209), Terespol (133), Toruń (69), Ustka (6), Warszawa (106), Wieluń (195), Włodawa (175), Wrocław (116), and Zielona Góra (180). Due to an insufficient number of stations, mountainous areas, especially high mountain areas, are not well represented. Precipitation data were obtained from the Institute of Meteorology and Water Management. The research material was evaluated in terms of the homogeneity of the data. The Bartlett test was used to assess the degree of homogeneity of the annual precipitation totals [
29].
The study included analysis of the spatial variation in precipitation in the study period during the year, in each meteorological season: spring (March–May), summer (June–August), autumn (September–November), and winter (December–February). To determine the spatial diversity of precipitation, we constructed a general model of the dependence of the annual precipitation total on the latitude
φ, longitude
λ, and altitude above sea level h using the stepwise multiple regression method. A highly complex regression function was adopted for the three independent variables:
where:
P—total annual rainfall mm,
a0—absolute term,
a1–9—regression coefficients,
φ—latitude,
λ—longitude,
h—altitude above sea level in meters. IBM multiple step regression software was used to plot the regression function [
30]. The method of adding successive variables was used. The significance of the fit of the regression function to the experimental data was tested using Fisher’s test. The highest F/Fcr value of 15.814 was noted in the fourth step.
The share of precipitation in each season at each station was presented. The spatial distribution of the ratios of rainfall totals for summer and winter, autumn and spring, and the warm (April–September) and cold (October–March) half of the year were calculated and presented. The Mann–Kendall test was used to verify temporal precipitation trends, their significance in particular seasons of the year, and the ratios of rainfall totals for summer and winter, autumn and spring, and the warm and cold half of the year. This test [
31] was used to verify whether we can reject the null hypothesis assuming no trend in the data sequence in favor of the alternative hypothesis of an upward or downward trend in the precipitation (x
i) data. The test determines whether the difference between a given element of the data sequence and the previous element is a positive or negative value (x
j and x
i, where j > i) and assigns the value 1 if the difference is positive, −1 if it is negative, and 0 if it is 0. The S statistic was calculated as the sum of integers according to the following formula:
where
n is the total number of data.
The null hypothesis that there is no trend in the data sequence is rejected when the value of the S statistic is significantly different from zero. The null hypothesis is tested based on the normal Gaussian distribution, standardizing the S statistic according to the following formula:
where
We reject the null hypothesis when the absolute value of the
Z statistic is greater than the theoretical value of the normal distribution
Z1−α/2, where α is the level of significance. The values α = 0.05 and α = 0.1 were adopted. The value of
Z1−α/2 was 1.95 for α = 0.05 and 1.28 for α = 0.1. For data with an upward or downward trend, the magnitude of the changes was estimated by calculating Sen’s slope [
32] according to the following formula:
for
i <
j (
i = 1, 2, …,
n − 1 and
j = 2, 3, …,
n).
This coefficient indicates the change in the analyzed trend over time.
The second part of the study covers variation in precipitation over the study period. Extreme years in terms of annual precipitation were characterized, the periodicity of precipitation was tested, and three-year moving averages were used to distinguish dry and wet periods. Parameters of the linear trend were calculated as well, and its significance was assessed at α = 0.05 [
33]. Particular attention was devoted to the coefficient of variation of precipitation, as the ratio of the standard deviation to the mean. This is a precipitation characteristic which is reported to be increasing in the global warming process. Coefficients of variation are presented for individual months and years, in addition to means, extreme values, amplitudes, and standard deviation. Spatial variation in the coefficient of variation is presented for the month with the lowest variation in the coefficient, i.e., March, the month with the highest variation, i.e., October, and for individual meteorological seasons and per year.
Maps of the spatial distribution of precipitation and variability of precipitation were prepared in Surfer 10 software. They were interpolated by the ordinary kriging method using a spherical function. Given the small scale of the maps, they are presented for illustrative purposes only. In the description of the spatial variability of precipitation, the names of mesoregions according to the physical geographical regionalization by Kondracki [
34] were used.
3. Results
The annual precipitation averaged across Poland in 2001–2018 was 624.5 mm. The most abundant precipitation of 800–900 mm was recorded in southern Poland, with a maximum in the Outer Western Carpathians at the Bielsko-Biała station—994 mm. Areas with slightly lower precipitation totals up to 600–700 mm include the Carpathian Foothills and the Uplands belt. The lowest totals of 500–550 mm were recorded in central Poland, with a minimum in Kalisz—490 mm. Precipitation exceeded 600 mm in the belt of the South Baltic Lakeland Coastland.
The stepwise multiple regression model of the dependence of annual precipitation totals on latitude, longitude, and altitude shows that the relationship between the geographical parameters of the meteorological stations and the total annual precipitation is best described by the following mathematical model:
Fcr(N-K-1,K, α) = 2.60, F = 41.148, F/Fcr = 15.814
Coefficient of multiple correlation R = 0.893
The standard error of estimation is 45.79 mm.
The regression function obtained satisfies the condition F > Fcr. Therefore, the hypothesis that the regression function is insignificant with the risk of error defined by the 0.05 significance level should be rejected, and the regression function should be concluded to be significant. The method of successive addition of variables, whereby the simplest regression function is constructed and gradually enlarged until the last element introduced is insignificant, showed that the first such element was the altitude above sea level. This means that the altitude above sea level is the decisive factor determining the spatial diversity of precipitation in Poland. Latitude had a smaller positive effect, and that of longitude was insignificant.
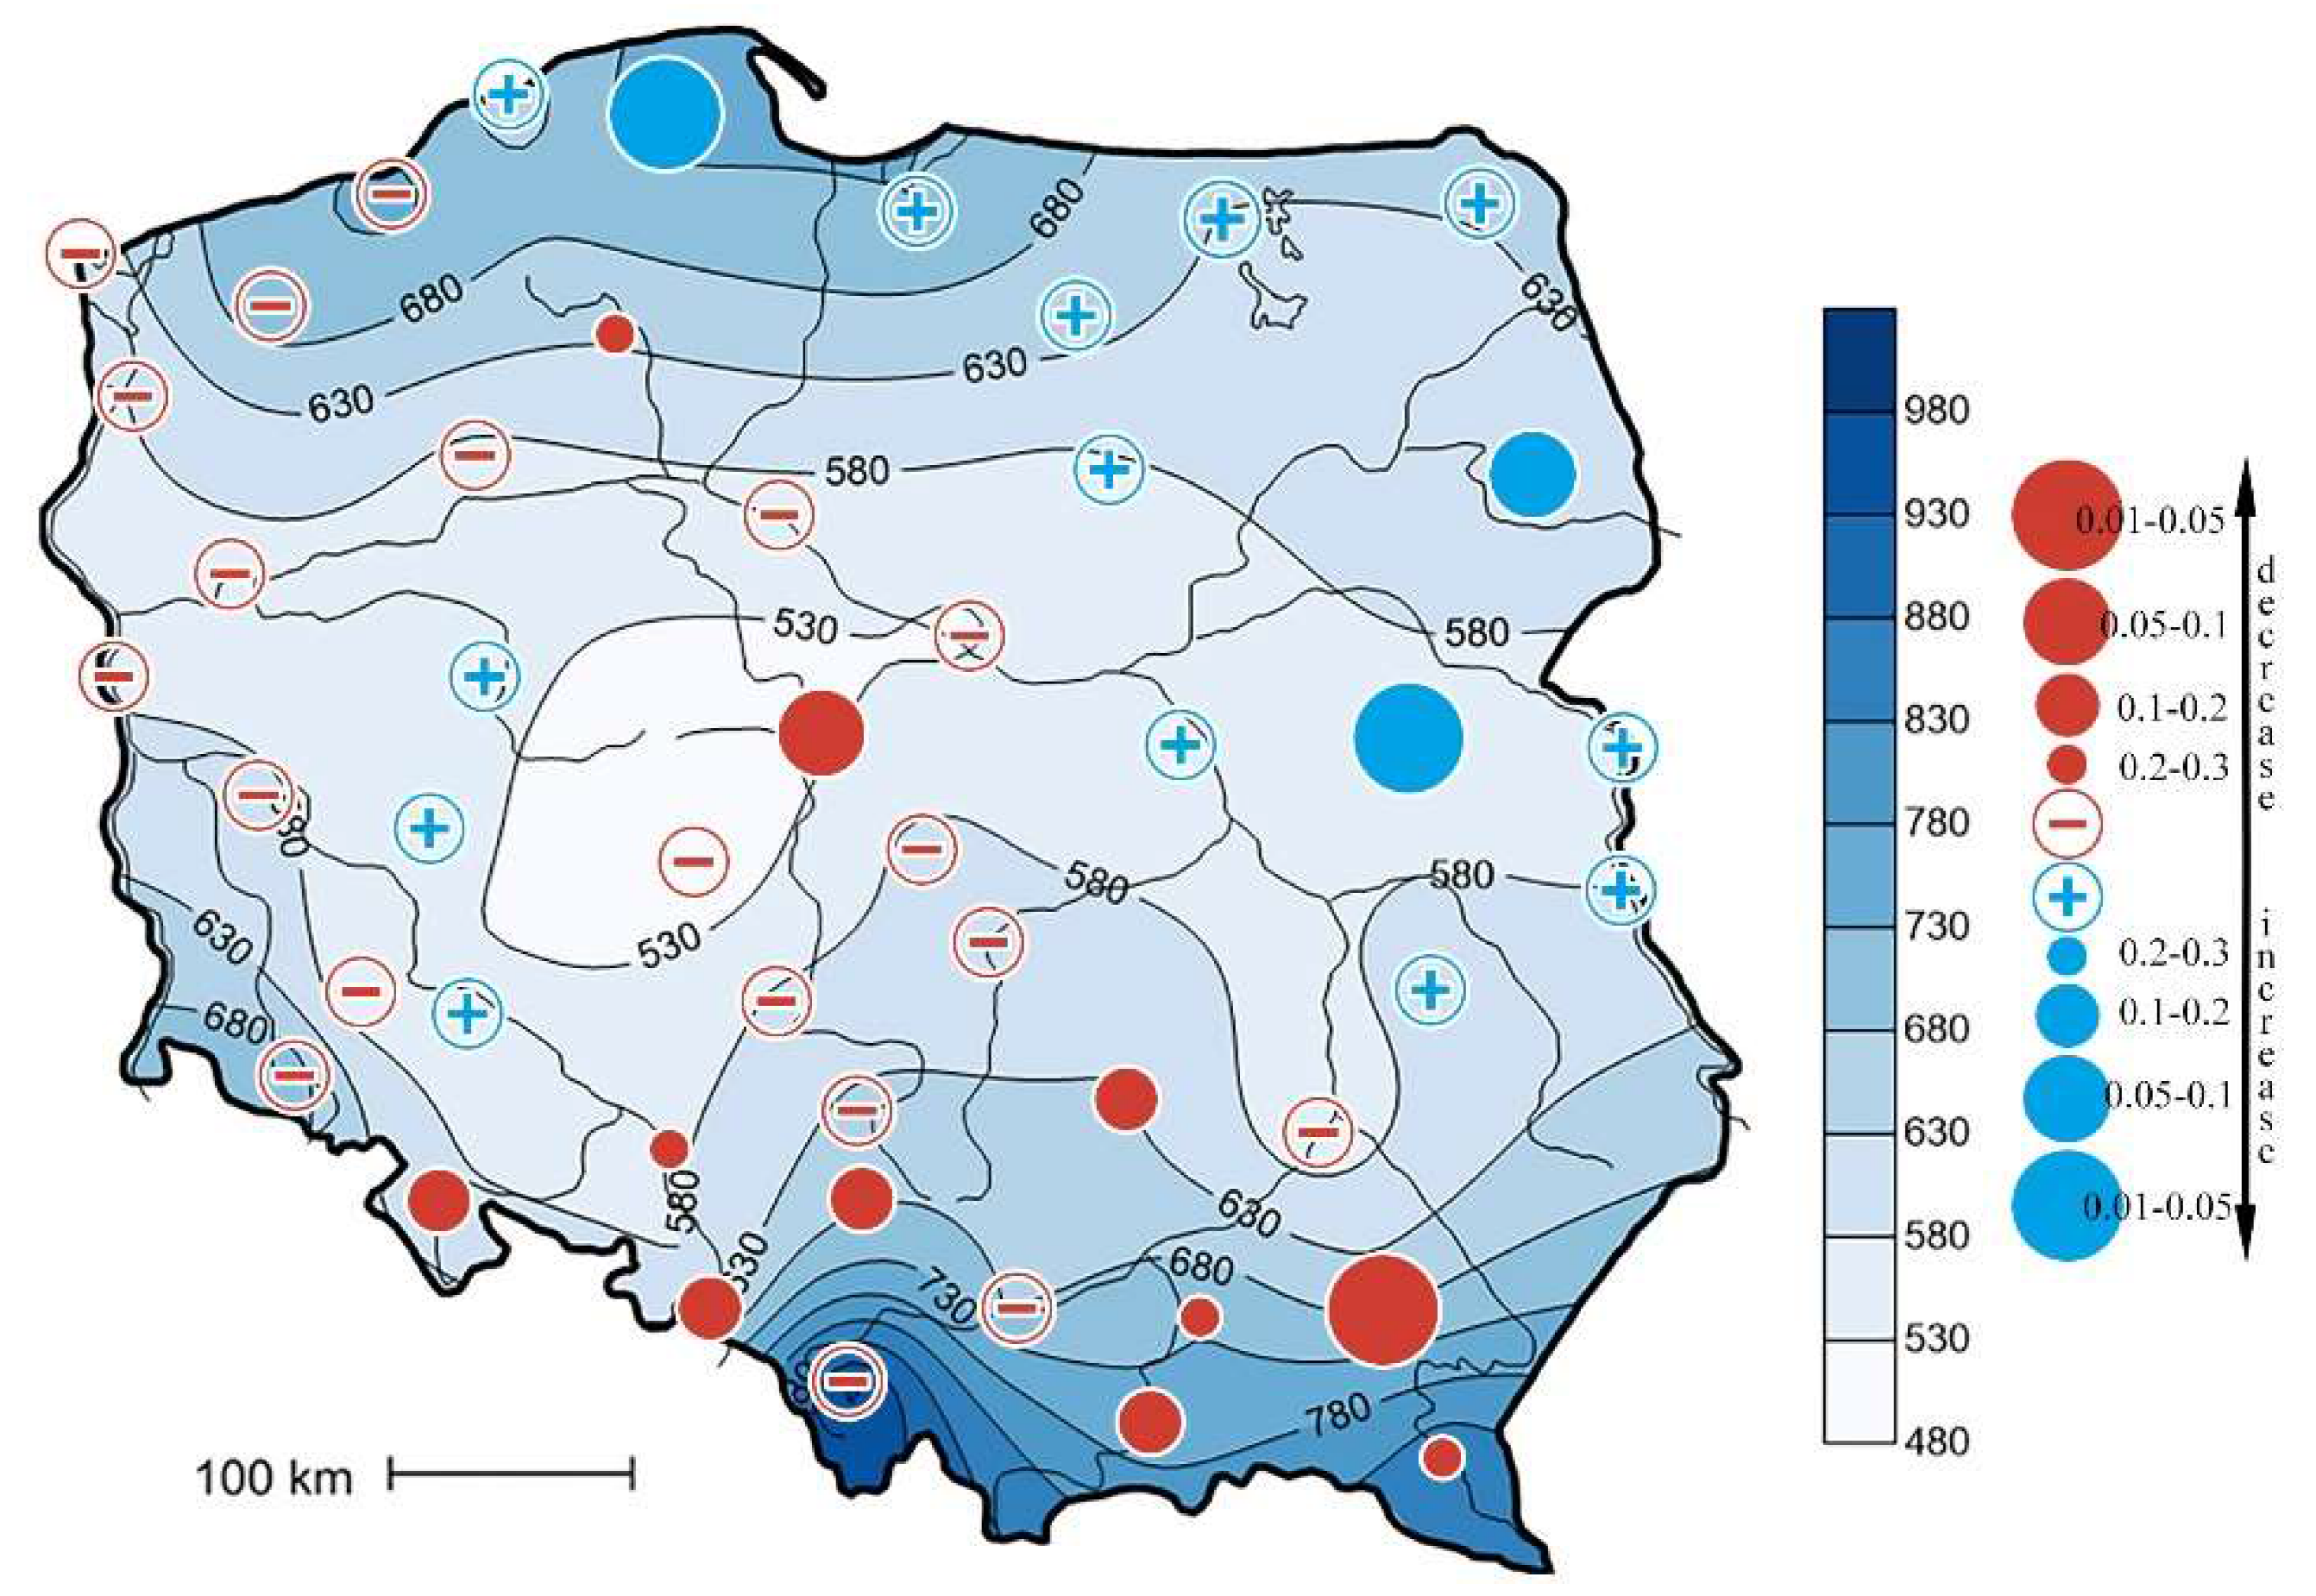
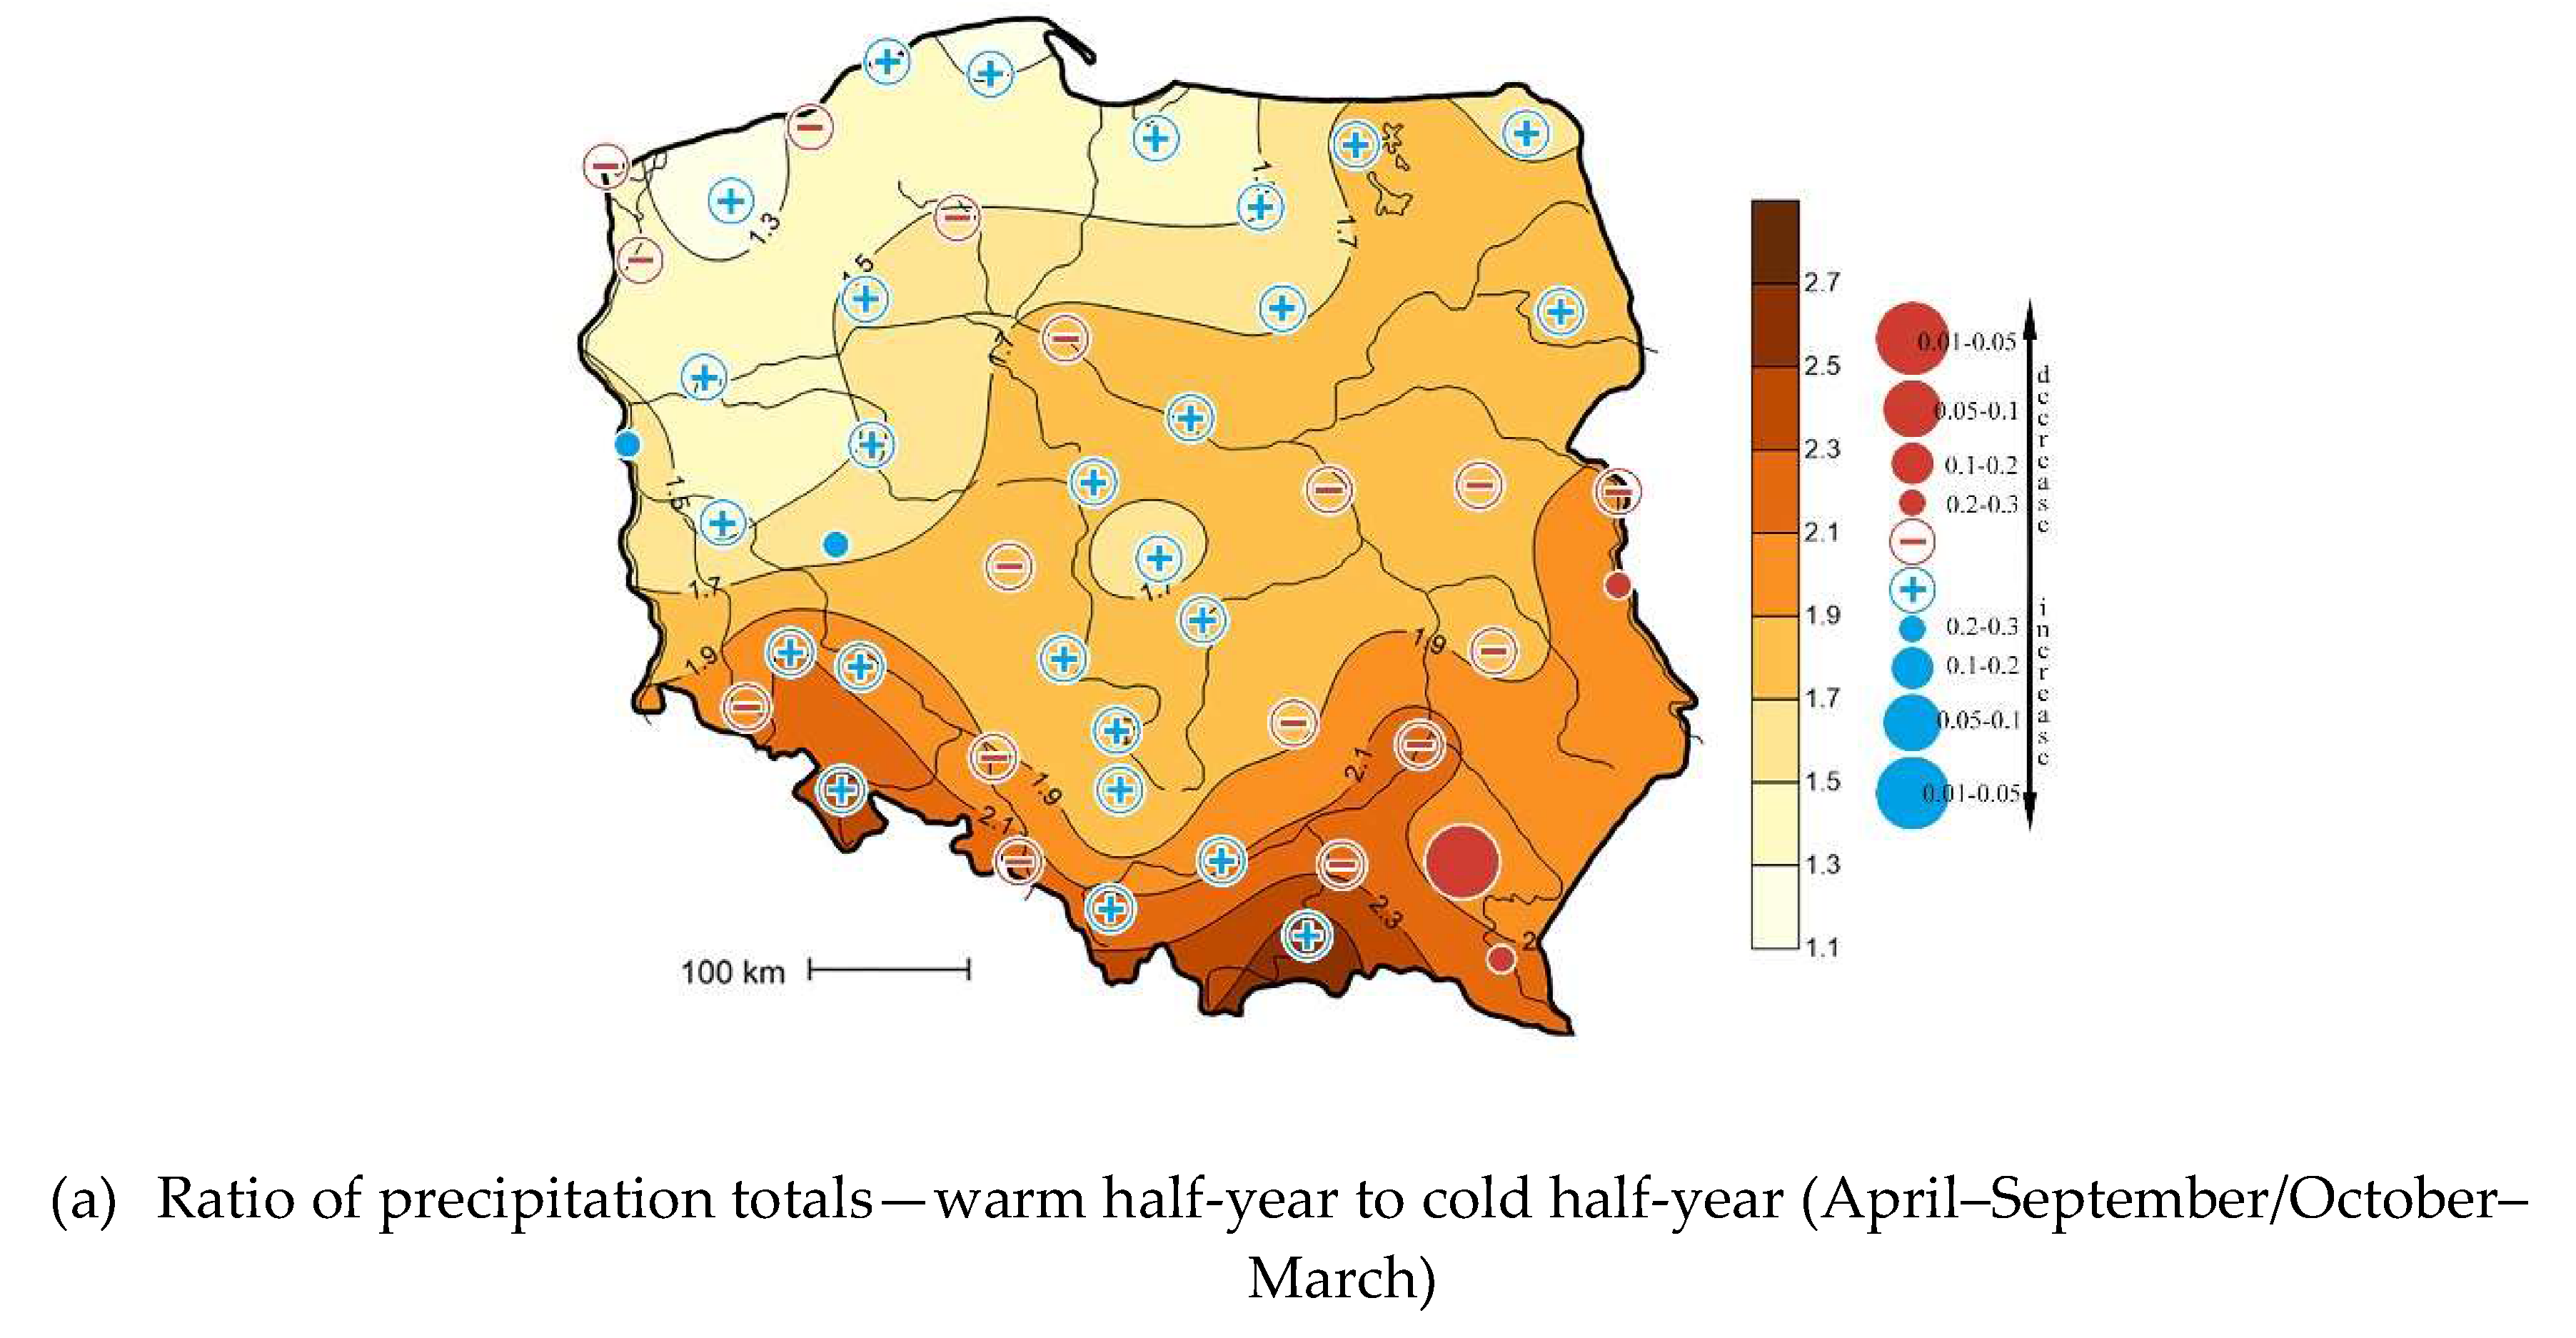
Precipitation in the warm half-year amounted to 181.4% of the level from the cold half-year and 62.4% of the annual total. During the study period (2001–2018), annual precipitation totals increased slightly in northeastern Poland, i.e., the area from Koszalin to Lublin. Of the 13 stations located in this area, these changes were statistically significant at only three—in Lębork and Siedlce at the significance level of 0.01–0.05 and in Białystok at 0.05–0.1. A statistically non-significant increase outside this area was also observed in Leszno, Poznań, and Wrocław. At the other 31 stations, a statistically significant decrease in precipitation was observed at only 11 stations: Rzeszów at a significance level of 0.01–0.05; Koło at 0.05–0.1; Katowice, Kielce, Kłodzko, Nowy Sącz, and Racibórz at 0.1–0.2; and Chojnice, Lesko, Opole, and Tarnów at 0.2–0.3 (
Figure 2).
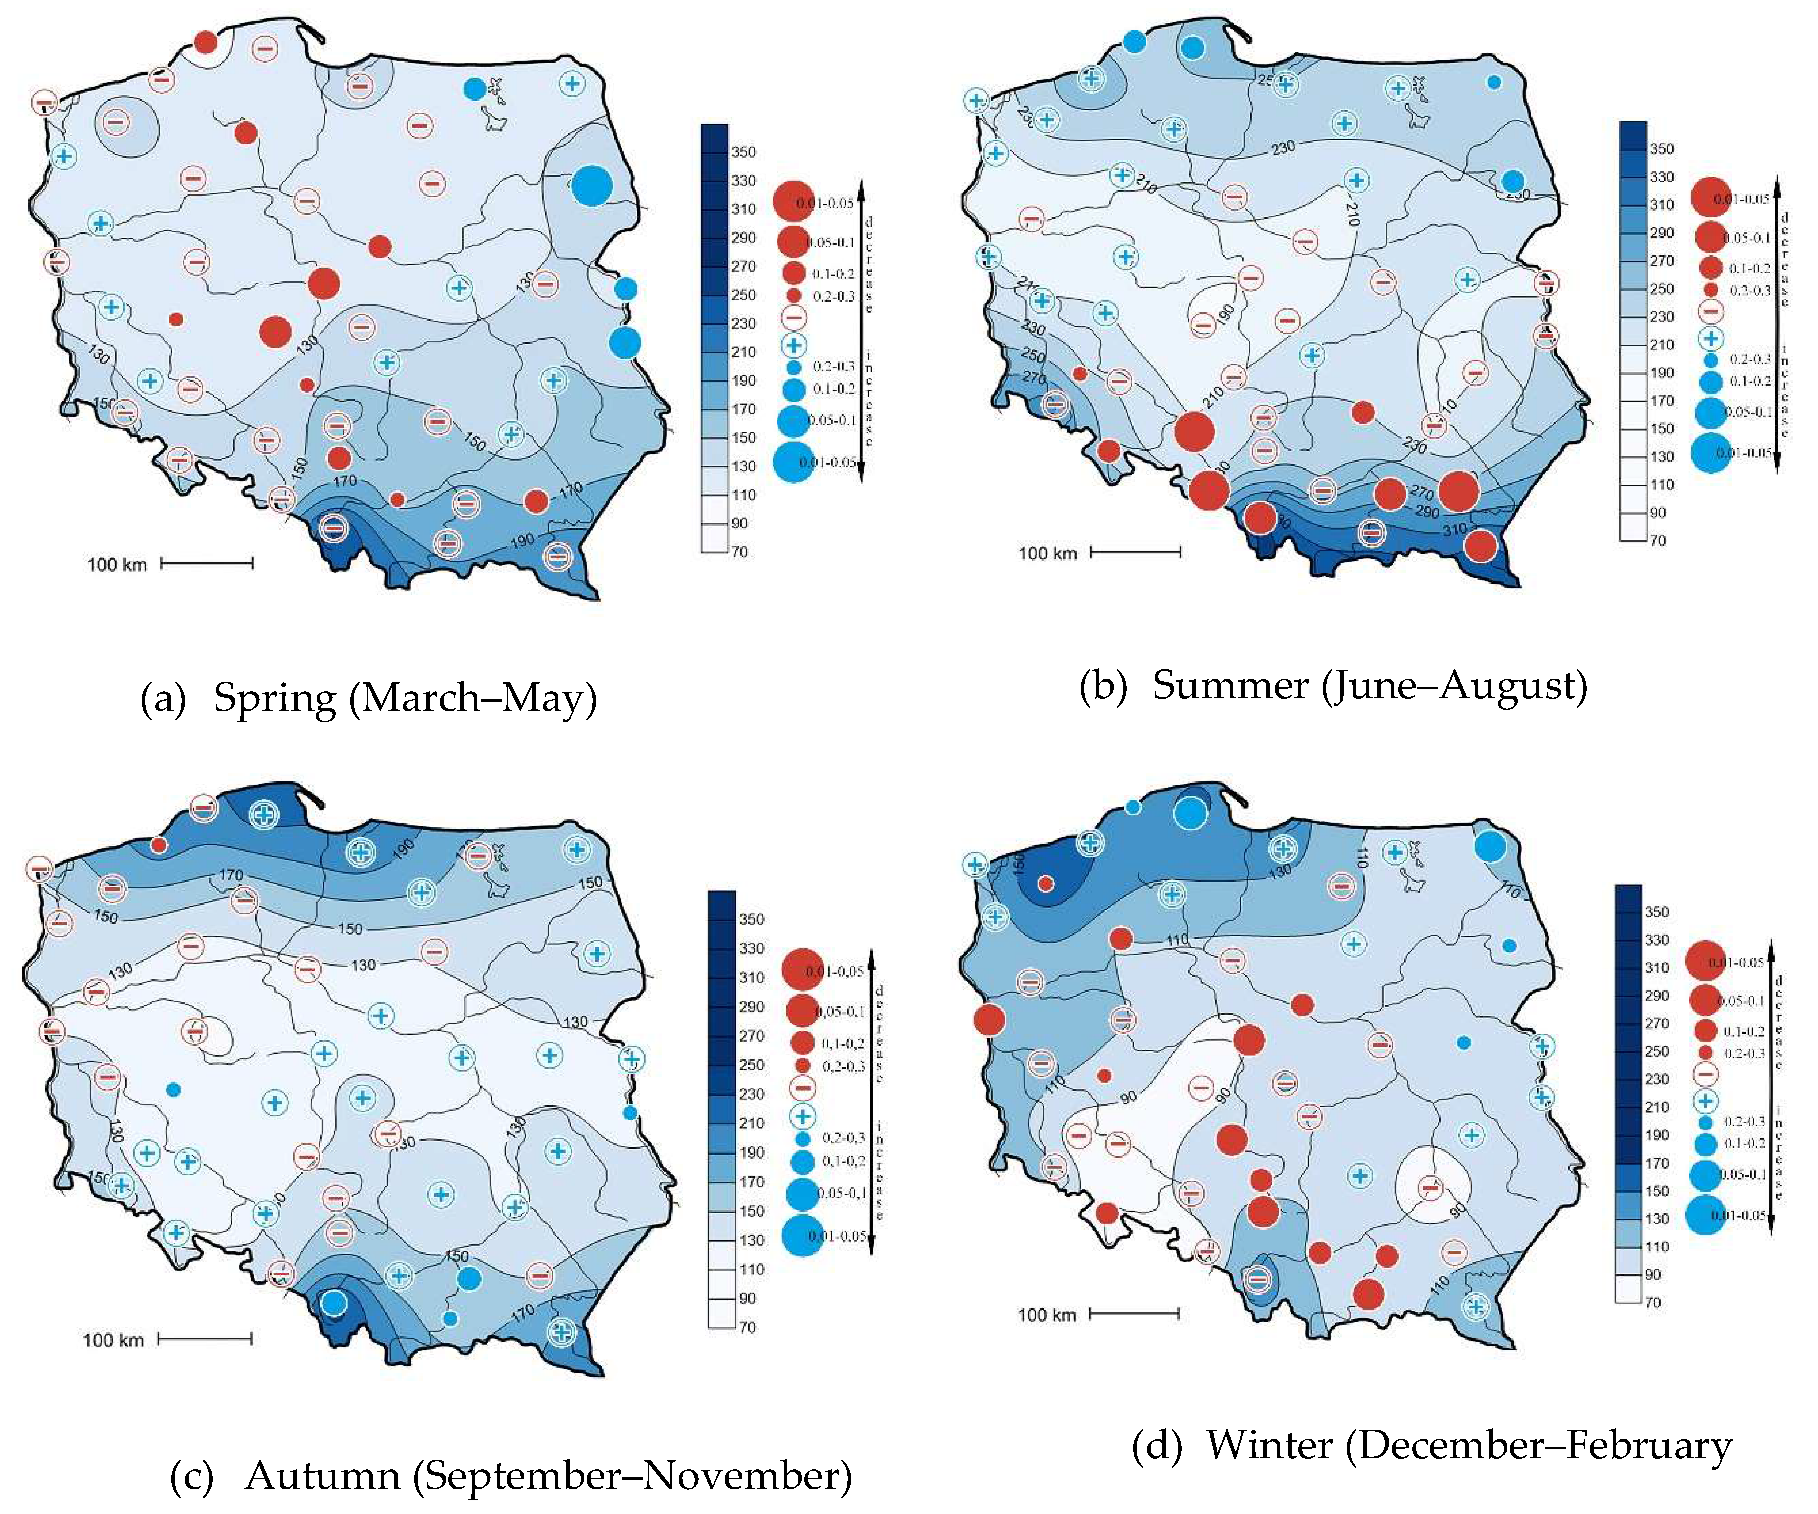
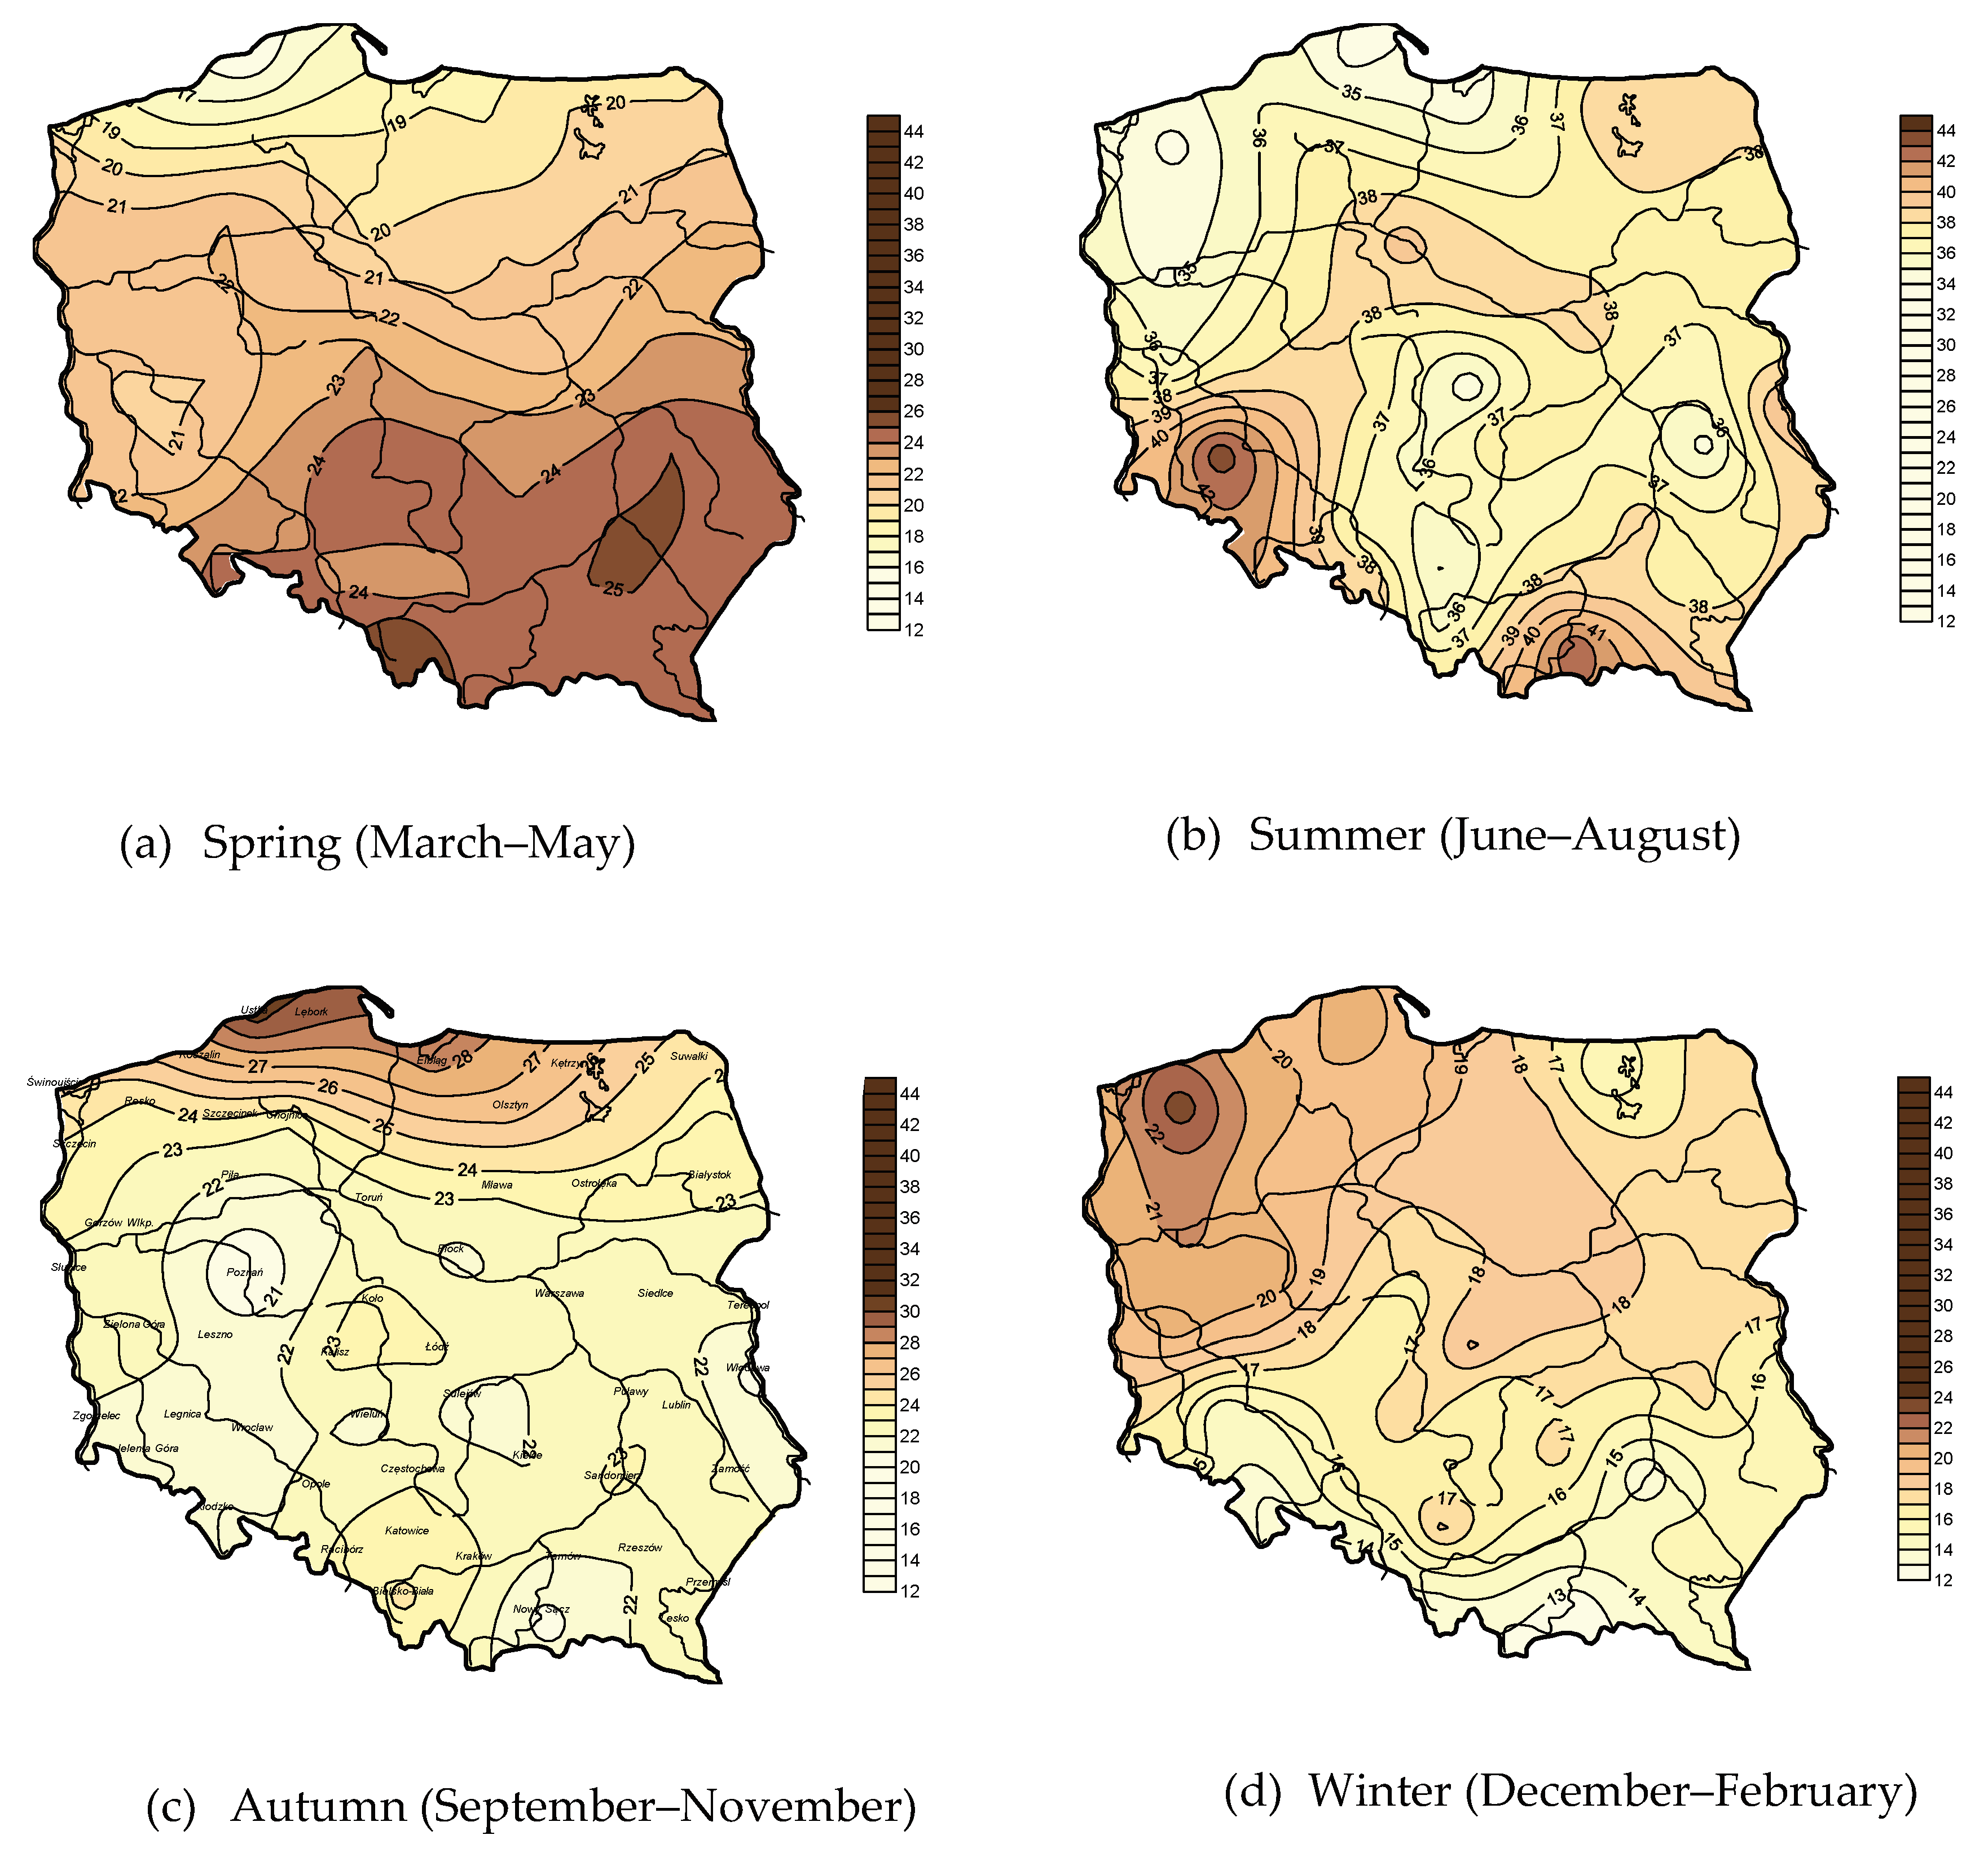
In spring, precipitation totals generally increased from northwest to southeast. Northwestern Poland had rainfall below 130 mm; on the Escarpment of the Carpathian Foothills, it reached 150 mm and in the higher parts of the Carpathians 190 and 210 mm. Only four stations located in eastern Poland showed a statistically significant increase in spring rainfall: Białystok at the level of 0.01–0.05, Włodawa at the level of 0.05–0.1 and Kętrzyn and Terespol at 0.1–0.2. Another three stations located in this part of Poland, i.e., Lublin, Sandomierz, and Suwałki, showed a statistically non-significant increase in spring rainfall. Most of the other stations showed a drop in spring precipitation, including Kalisz and Koło at 0.05–0.1; Chojnice, Katowice, Płock, Rzeszów, and Ustka at 0.1–0.2; and Kraków, Leszno, and Wieluń at 0.2–0.3 (
Figure 3).
In summer, the spatial distribution of precipitation most resembled the annual isotherms. The lowest totals of 190 mm were found in the South Greater Poland Lowland near Kalisz, from where they increased towards the north and south, reaching 290 mm on the Baltic Coast, and similarly in the western Sudetes, exceeding 330 mm in the higher parts of the Carpathians. Summer rainfall totals generally showed an upward trend in northern Poland and a downward trend in the southern part of the country. These relationships were statistically significant only at 13 of 47 stations. A significant increase in summer rainfall was noted at the Białystok, Lębork, and Ustka stations at the level of 0.1–0.2 and at the Suwałki station at 0.2–0.3. A statistically significant decrease in summer rainfall was noted at the Opole, Racibórz, and Rzeszów stations at the significance level of 0.01–0.05; Bielsko-Biała, Lesko, and Tarnów at 0.05–0.1; Kielce and Kłodzko at 0.1–0.2; and Legnica at 0.2–0.3 (
Figure 3).
In autumn, the lowest precipitation was recorded in a wide strip of central Poland narrowing from west to east and covering the southern part of the South Baltic Lowlands and Central Poland Lowlands, with a 130 mm isoline and the center of the lowest rainfall (110 mm) in the vicinity of Poznań. From this region, precipitation increased northwards and southwards, reaching 210 mm on the eastern part of the Koszalin Coastland and similar values in the higher parts of the Carpathians. Rainfall generally increased in central-eastern and southeastern Poland, but this increase was statistically significant at only five stations—at the Bielsko-Biała and Tarnów stations at 0.1–0.2 and at the Leszno, Nowy Sącz, and Włodawa stations at 0.2–0.3. A statistically significant decrease in autumn precipitation was recorded only at the Koszalin station, with a significance level of 0.2–0.3 (
Figure 3).
In winter, precipitation generally decreased from northwest to southeast. The highest totals of 130–150 mm were recorded in the western part of the South Baltic Coastland, reaching the lowest values below 90 mm in the belt with Kłodzko, Wrocław, Kalisz, and Koło and in the vicinity of Sandomierz. In the higher parts of the mountains, precipitation exceeded 110–130 mm. In general, an increase in the winter precipitation totals is observed in northern and eastern Poland. A statistically significant increase was observed at only five stations—in Lębork and Suwałki at 0.05–0.1 and in Bialystok, Siedlce, and Ustka at 0.2–0.3. In central and southwestern Poland, a decrease in winter precipitation was observed during the study period. Statistically significant declines were noted at 13 stations: Katowice, Koło, Nowy Sącz, Słubice, and Wieluń at the level of 0.05–0.1; Częstochowa, Kłodzko, Kraków, Piła, Płock, and Tarnów at 0.1–0.2; and Leszno and Resko at 0.2–0.3 (
Figure 3).
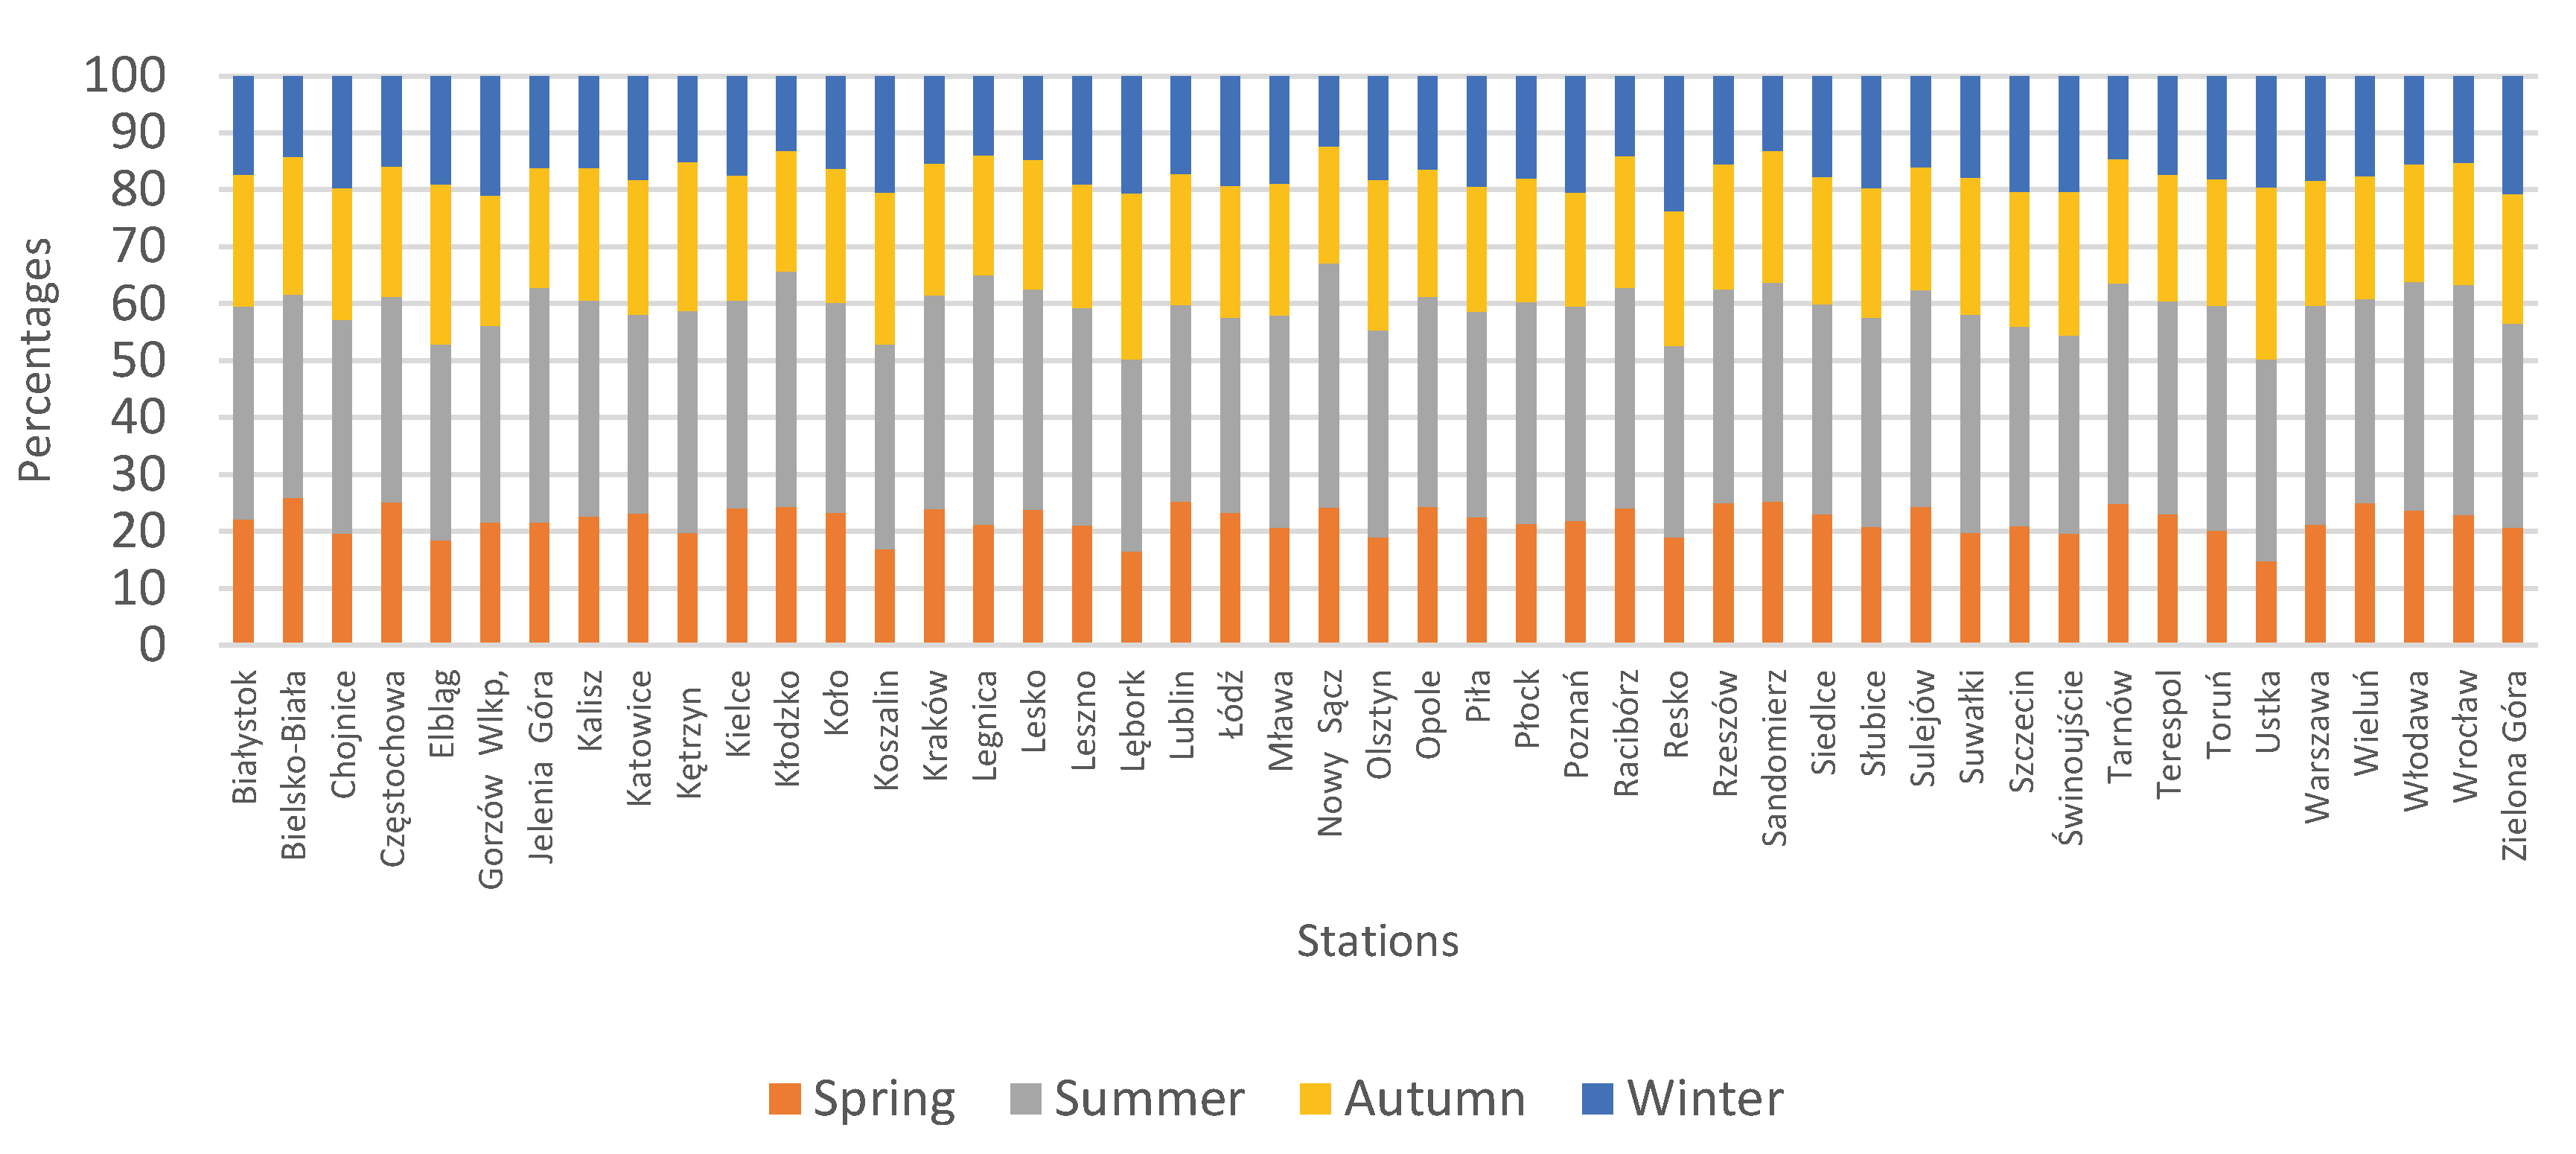
During the study period, the regional precipitation averages (from 47 stations) in spring, summer, autumn, and winter accounted for 22.0%, 37.3%, 23.3%, and 17.4%, respectively, of the annual total, and the differences between stations did not exceed 12%. The percentage share of summer precipitation ranged from 34% to 44%, winter precipitation from 12% to 24%, spring precipitation from 15% to 26%, and autumn precipitation from 20% to 30% (
Figure 4). In the geographic distribution of seasonal precipitation totals, expressed as percentages of the annual total, an increase in summer precipitation and a decrease in winter precipitation from the northwest to the south are most notable. Greater variation in the percentage share of spring and autumn precipitation is only visible at stations representing a small area in northern Poland. This part of the country is distinguished by a greater proportion of autumn rainfall in the annual total and a smaller proportion of spring rainfall (
Figure 5).
The distribution of isolines of the ratio of the warm half-year to the cold half-year is similar to the distribution of the summer-to-winter ratio. Isoline values increase from 1.3 in northwestern Poland to 2.1 in southeastern Poland. In the higher parts of the Carpathians, this ratio reaches a value of 2.5. Of the 47 meteorological stations, the ratio of warm half-year to cold half-year precipitation increased at 28 stations and decreased at 19. There are no clear patterns in the spatial variation of the increase and decrease in precipitation. A statistically significant increase was noted at only two stations, Leszno and Słubice, at the lowest significance level of 0.2–0.3. A significant decrease in the ratio of the warm half-year to cold half-year precipitation totals was noted at only three stations: Rzeszów at the significance level of 0.01–0.05, Lesko and Włodawa at 0.2–0.3 (
Figure 6).
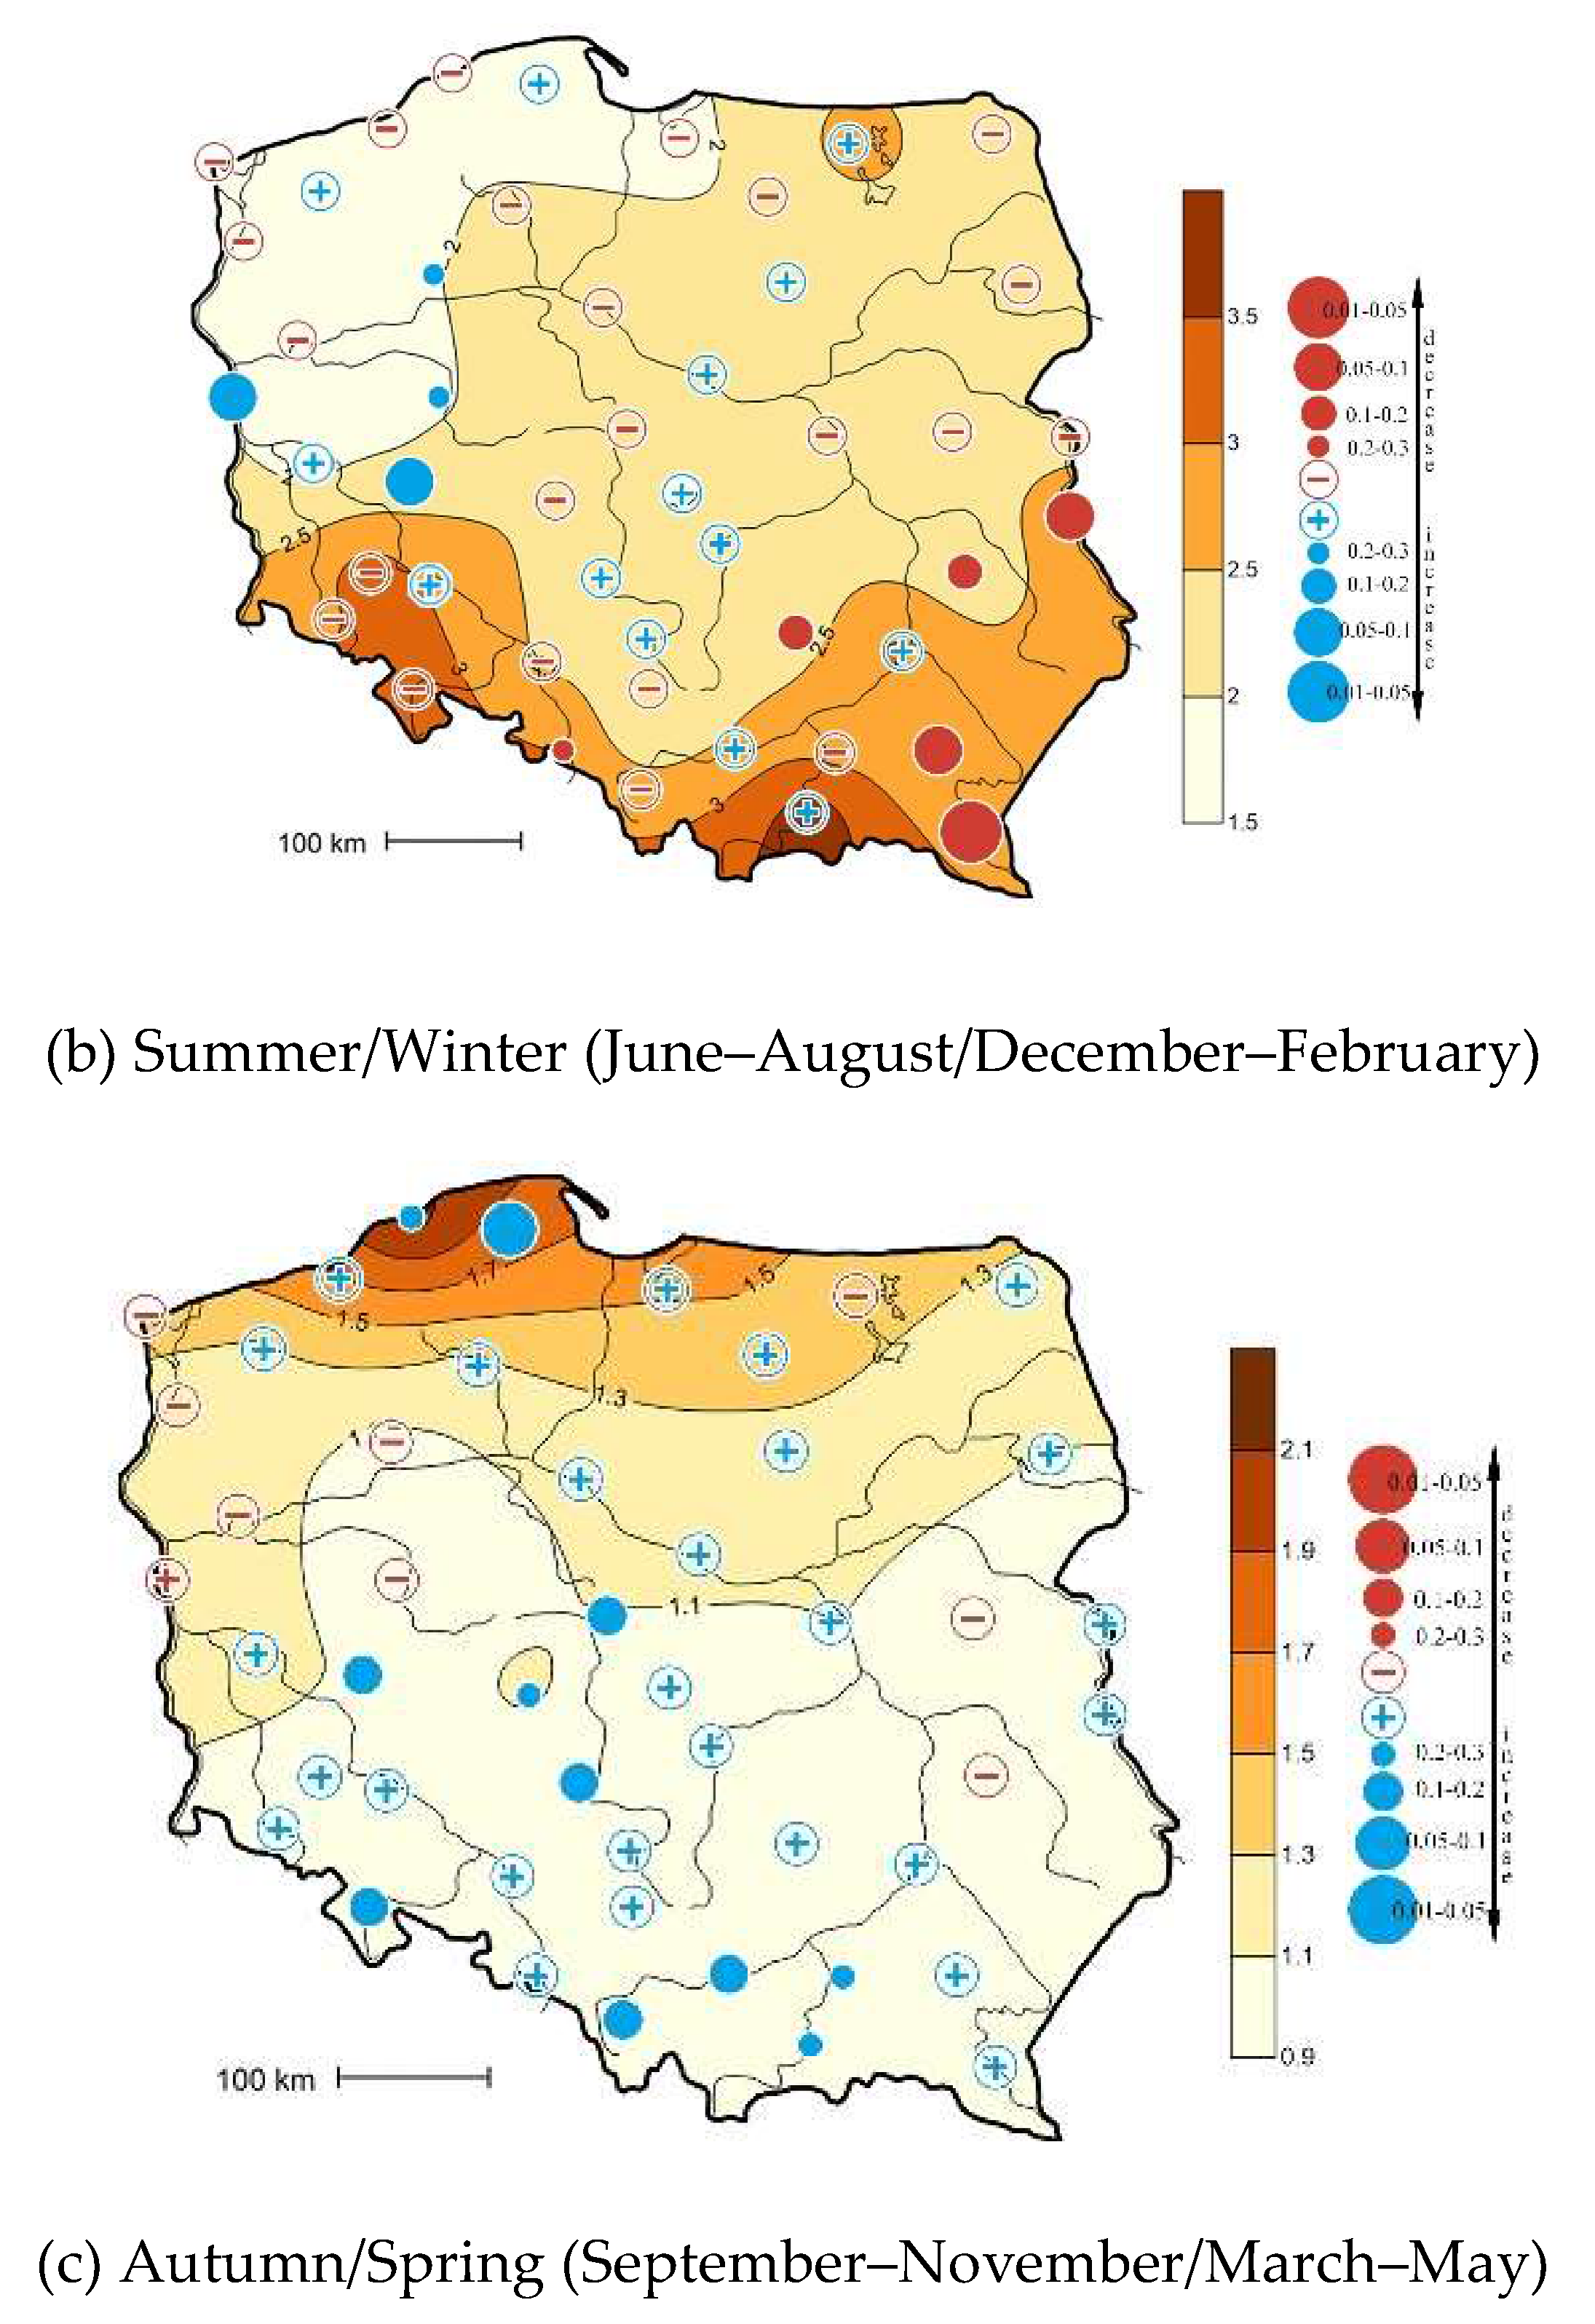
The ratios of the summer precipitation totals to the winter totals are varied, increasing from 1.5–2.0 in northwestern Poland to 2.5–3.0 in southeastern Poland, while in the higher parts of the Carpathians they reach values of 3.0–3.5 and above. There is no clear pattern in the spatial variation of the increase and decrease in the ratio of summer to winter precipitation. Of the 47 stations, decreases in the ratio predominate at 29. An increase in the summer to winter precipitation ratio at the lowest significance level of 0.2–0.3 was noted only at the Piła and Poznań stations. Significant decreases in the ratio were recorded at Lesko at the level of 0.01–0.05; Rzeszów and Włodawa at 0.05–0.1; Kielce and Lublin at 0.1–0.2; and Racibórz at 0.2–0.3 (
Figure 6).
The ratios of the autumn and spring precipitation totals generally increase from the south to the north of Poland, from 0.9–1.1 in the south Poland, gradually increasing to 1.1–1.3, 1.3–1.5, 1.5–1.7, and 1.7–1.9 in the central part of the Baltic coast. A clear majority of stations, 39 of 47, showed an increase in the ratio of autumn to spring precipitation totals. Statistically significant increases were noted at the following stations: Lębork at the significance level of 0.05–0.1; Bielsko-Biała, Kłodzko, Koło, Kraków, Leszno, and Wieluń at 0.1–0.2 and Kalisz, Nowy Sącz, Tarnów, and Ustka at 0.2–0.3. There were no statistically significant decreases in the ratio of autumn to spring precipitation (
Figure 6).
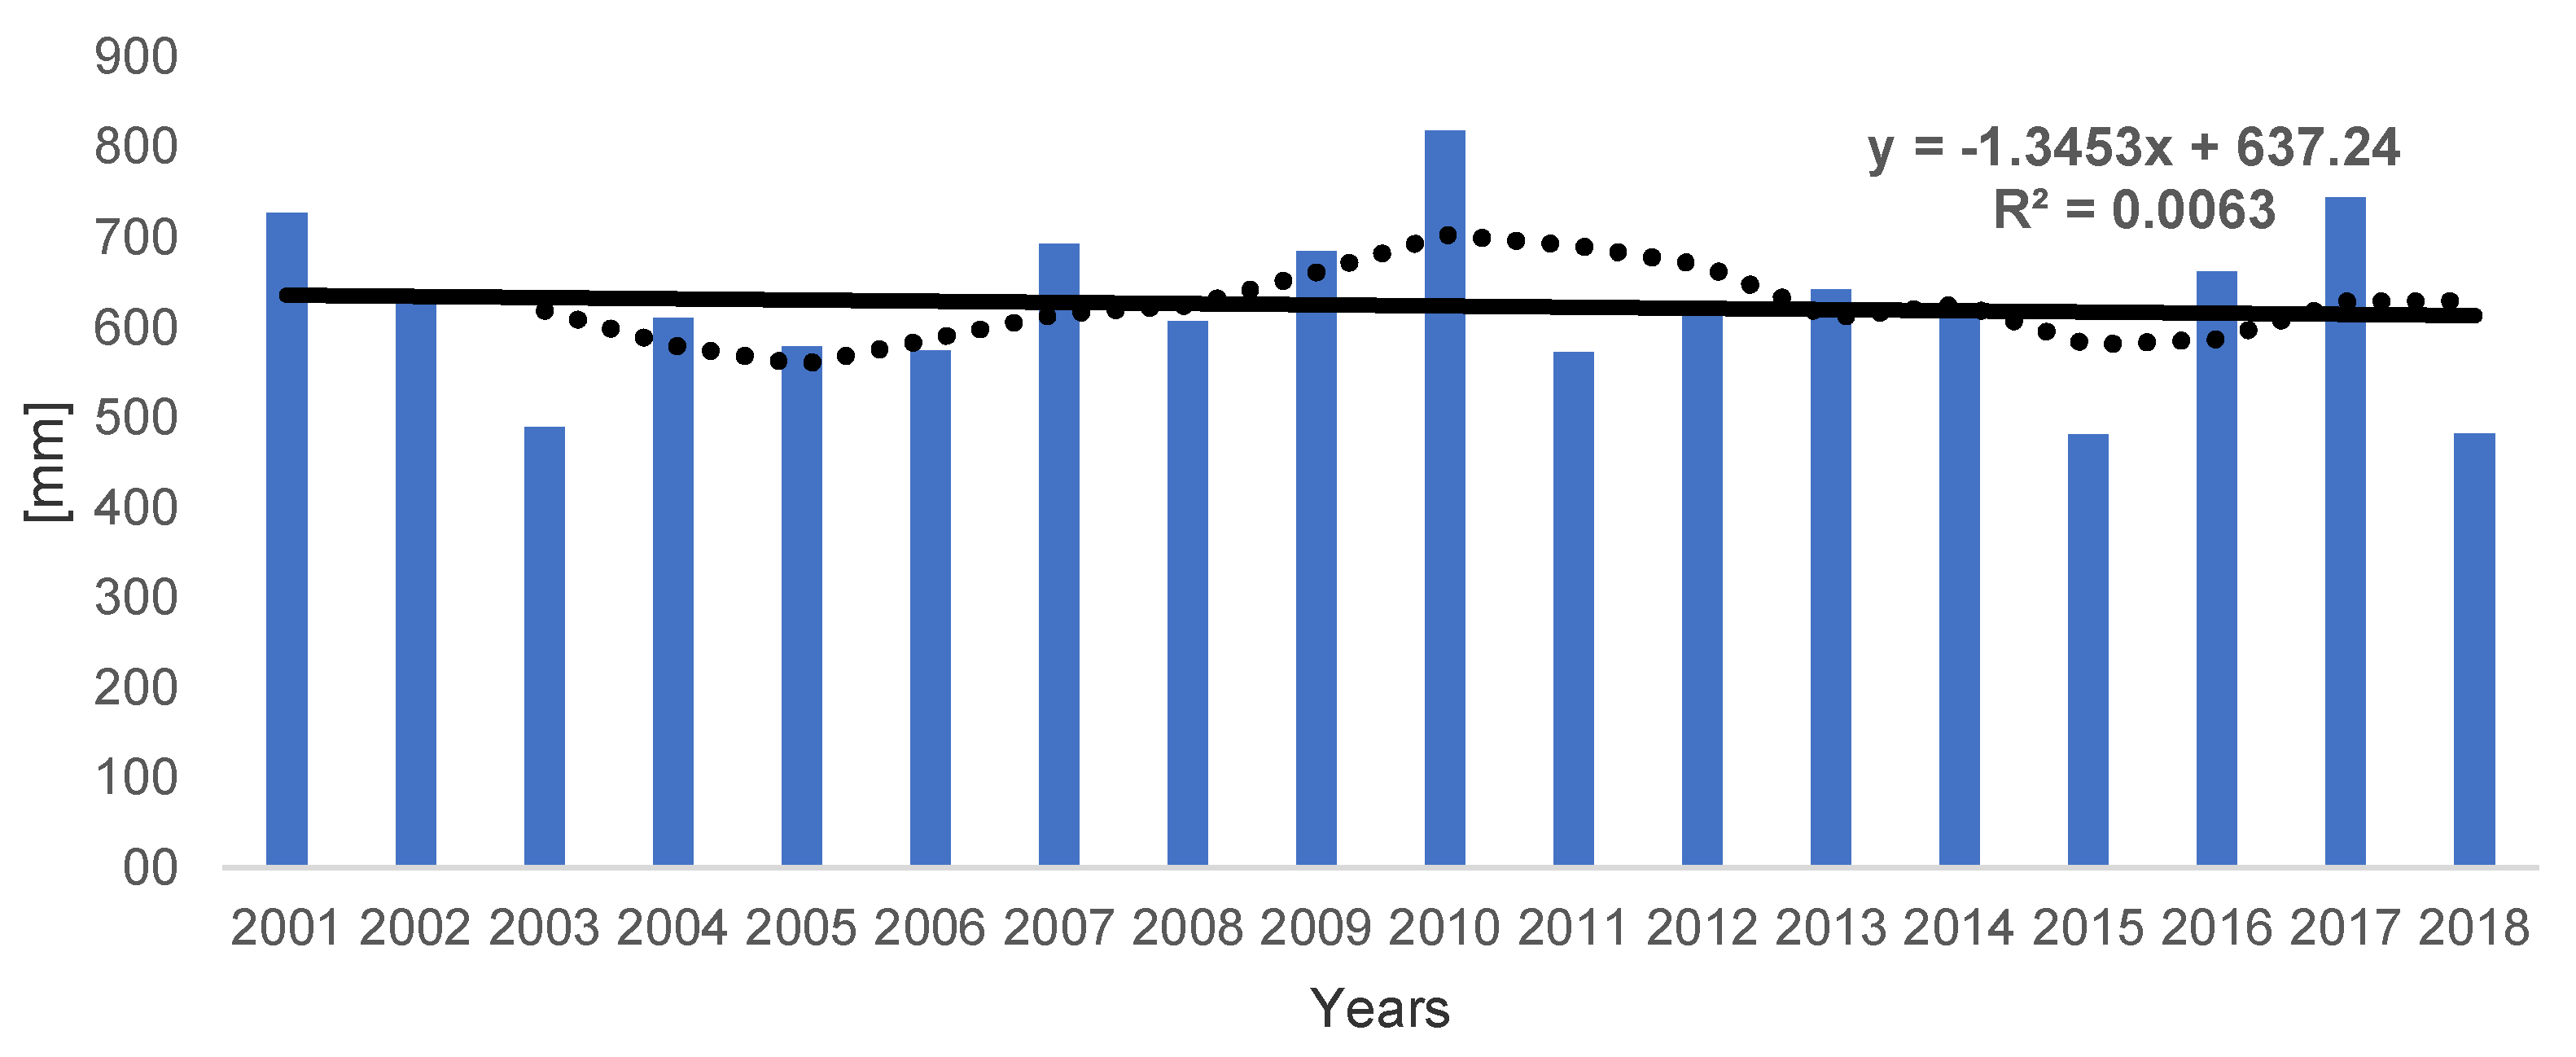
In individual years, the averaged annual rainfall totals were highly variable. The driest year was 2015, with a total of 480.8 mm, representing 77% of the 2001–2018 average. The year 2010 was the wettest, with a total of 818.2 mm, which was 131% of the 2001–2018 average. Two dry periods and one wet one can be distinguished in the study period. Particularly high precipitation totals were noted in the wettest year (2010) as well as in 2017 and 2001. A predominance of years with low rainfall persisted in the period of 2003–2006. At the end of the study period, there was an upward trend in precipitation totals. Analysis of the precipitation trend in the period 2001–2018 showed that it was negative, with a decrease of about 1.3 mm/year. The trend observed was not statistically significant at the level of α = 0.05 (
Figure 7).
In 2001–2018, the lowest average precipitation was recorded in February—30.2 mm, and the highest in July—94.0 mm. The lowest maximum precipitation totals (50–80 mm) were noted in February, March, April, and December. In January, October, and November, they were in the range of 81–110 mm. In September and June, they ranged from 111 to 140 mm, and in May and August they significantly surpassed that value, reaching 175.8 mm in July, the month with the highest rainfall. The lowest monthly precipitation totals averaged across Poland, 2–10 mm, were recorded in November, April, and February. In January, March, August, October, and December, they were over 10 mm. In July and September, they reached 20 mm, and in the remaining months, May and June, they exceeded 30 mm. The differences between the highest and lowest monthly precipitation totals averaged across Poland were the smallest in February and March—46.2 and 41.3 mm, respectively. The largest differences of 153.1 and 133.6 mm were noted in July and August. In the remaining months, they ranged from 61 to 110 mm. Standard deviation values of averaged precipitation totals of about 10–20 mm were recorded in January–March and in December. In April, May, June, and November, they were 20–40 mm, in August they were a few mm higher, and in July they reached 49.3 mm. The highest relative variation in successive months, irrespective of regional variation, was noted in September and October, with a coefficient of variation of 0.66, and the lowest in March—0.45. In the remaining months, the coefficient of variation ranged from 0.49 to 0.61 (
Table 1).
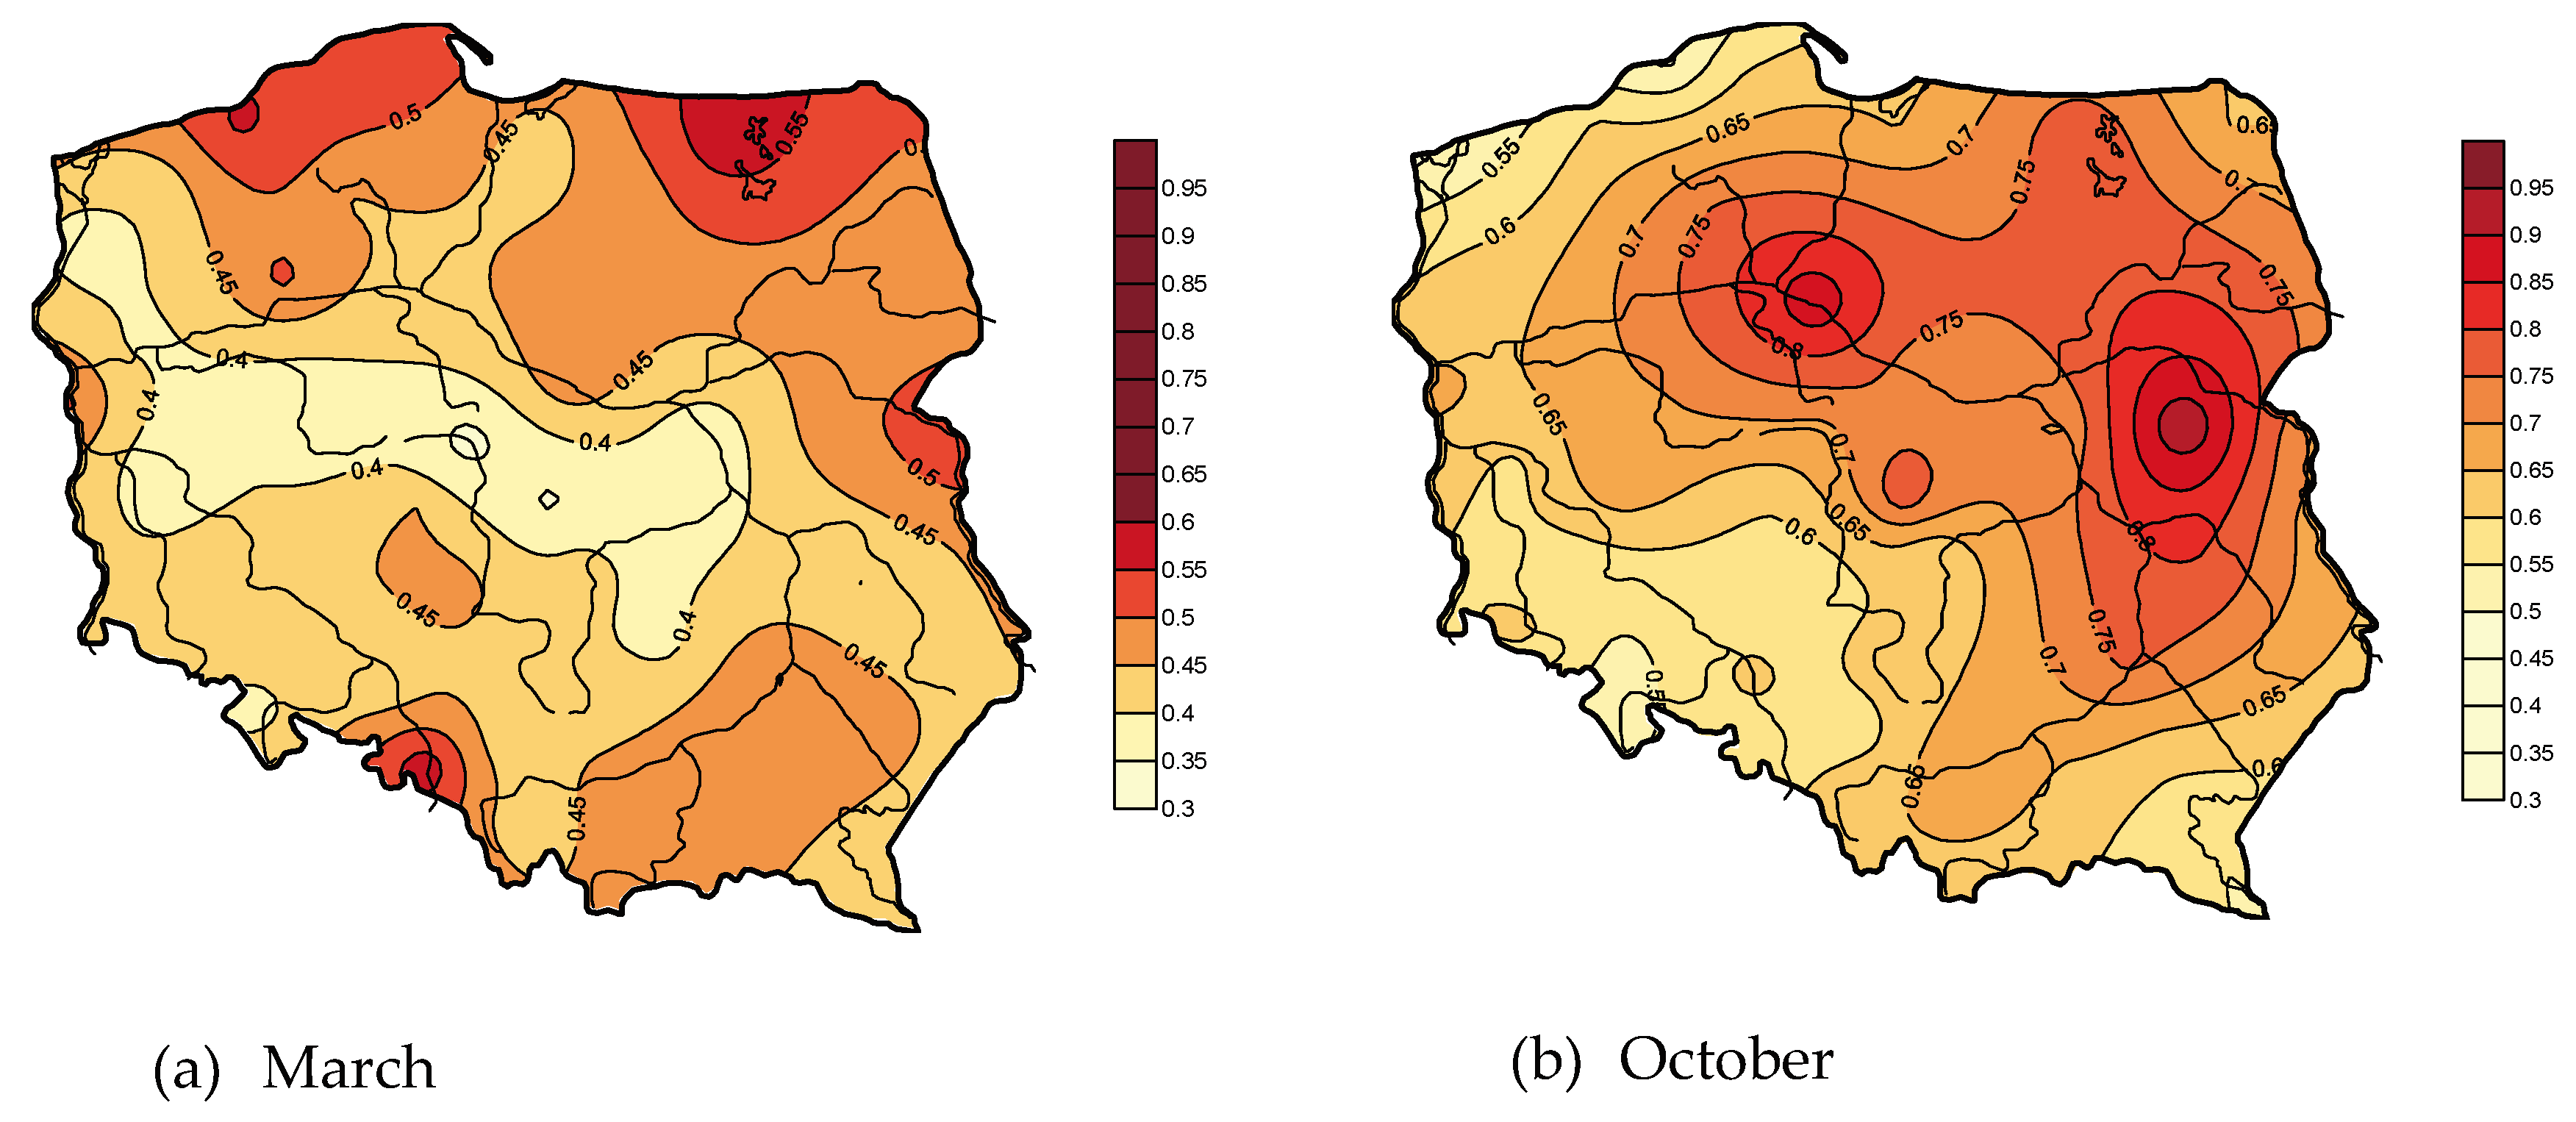
In March, the month with the lowest variation in precipitation, the spatial distribution of the coefficient of variation is varied. The coefficients are lowest in the belt of central Poland, especially its central and western parts, where they are below 0.4, and generally increase towards the north, south and east, reaching 0.50–0.55 on the northern border of Poland, 0.45–0.55 in the south, and 0.45–0.55 in the east (
Figure 8). In October, the month with the highest variation in precipitation, the isarithm of the coefficient of variation of precipitation is marked by distinct zones. Variation in precipitation steadily increases from west to east, where it has the highest values and the largest gradients. The highest values of the coefficient are found in areas located in the eastern part of the Central Poland Lowlands, with a maximum of 0.95 in the vicinity of Siedlce. The areas with the lowest variation in precipitation, with an isoline value of 0.60, are located in the western and central parts of the South Baltic Coastland near Świnoujście and Ustka and in southwestern Poland (
Figure 8).
The highest seasonal precipitation totals—both maximum and minimum values—were noted in summer, and the lowest in winter. When the maximum and minimum totals were compared, rainfall in autumn was shown to be more variable than in spring. The highest standard deviation of precipitation was noted in summer—71.8 mm, and the lowest in winter—29.3 mm. The standard deviation was 54.3 mm in autumn and slightly lower in spring—43.4 mm. The coefficient of variation was highest in autumn—0.37, and lowest in winter—0.27. The same coefficient of variation of precipitation was obtained for spring and summer—0.31 (
Table 2).
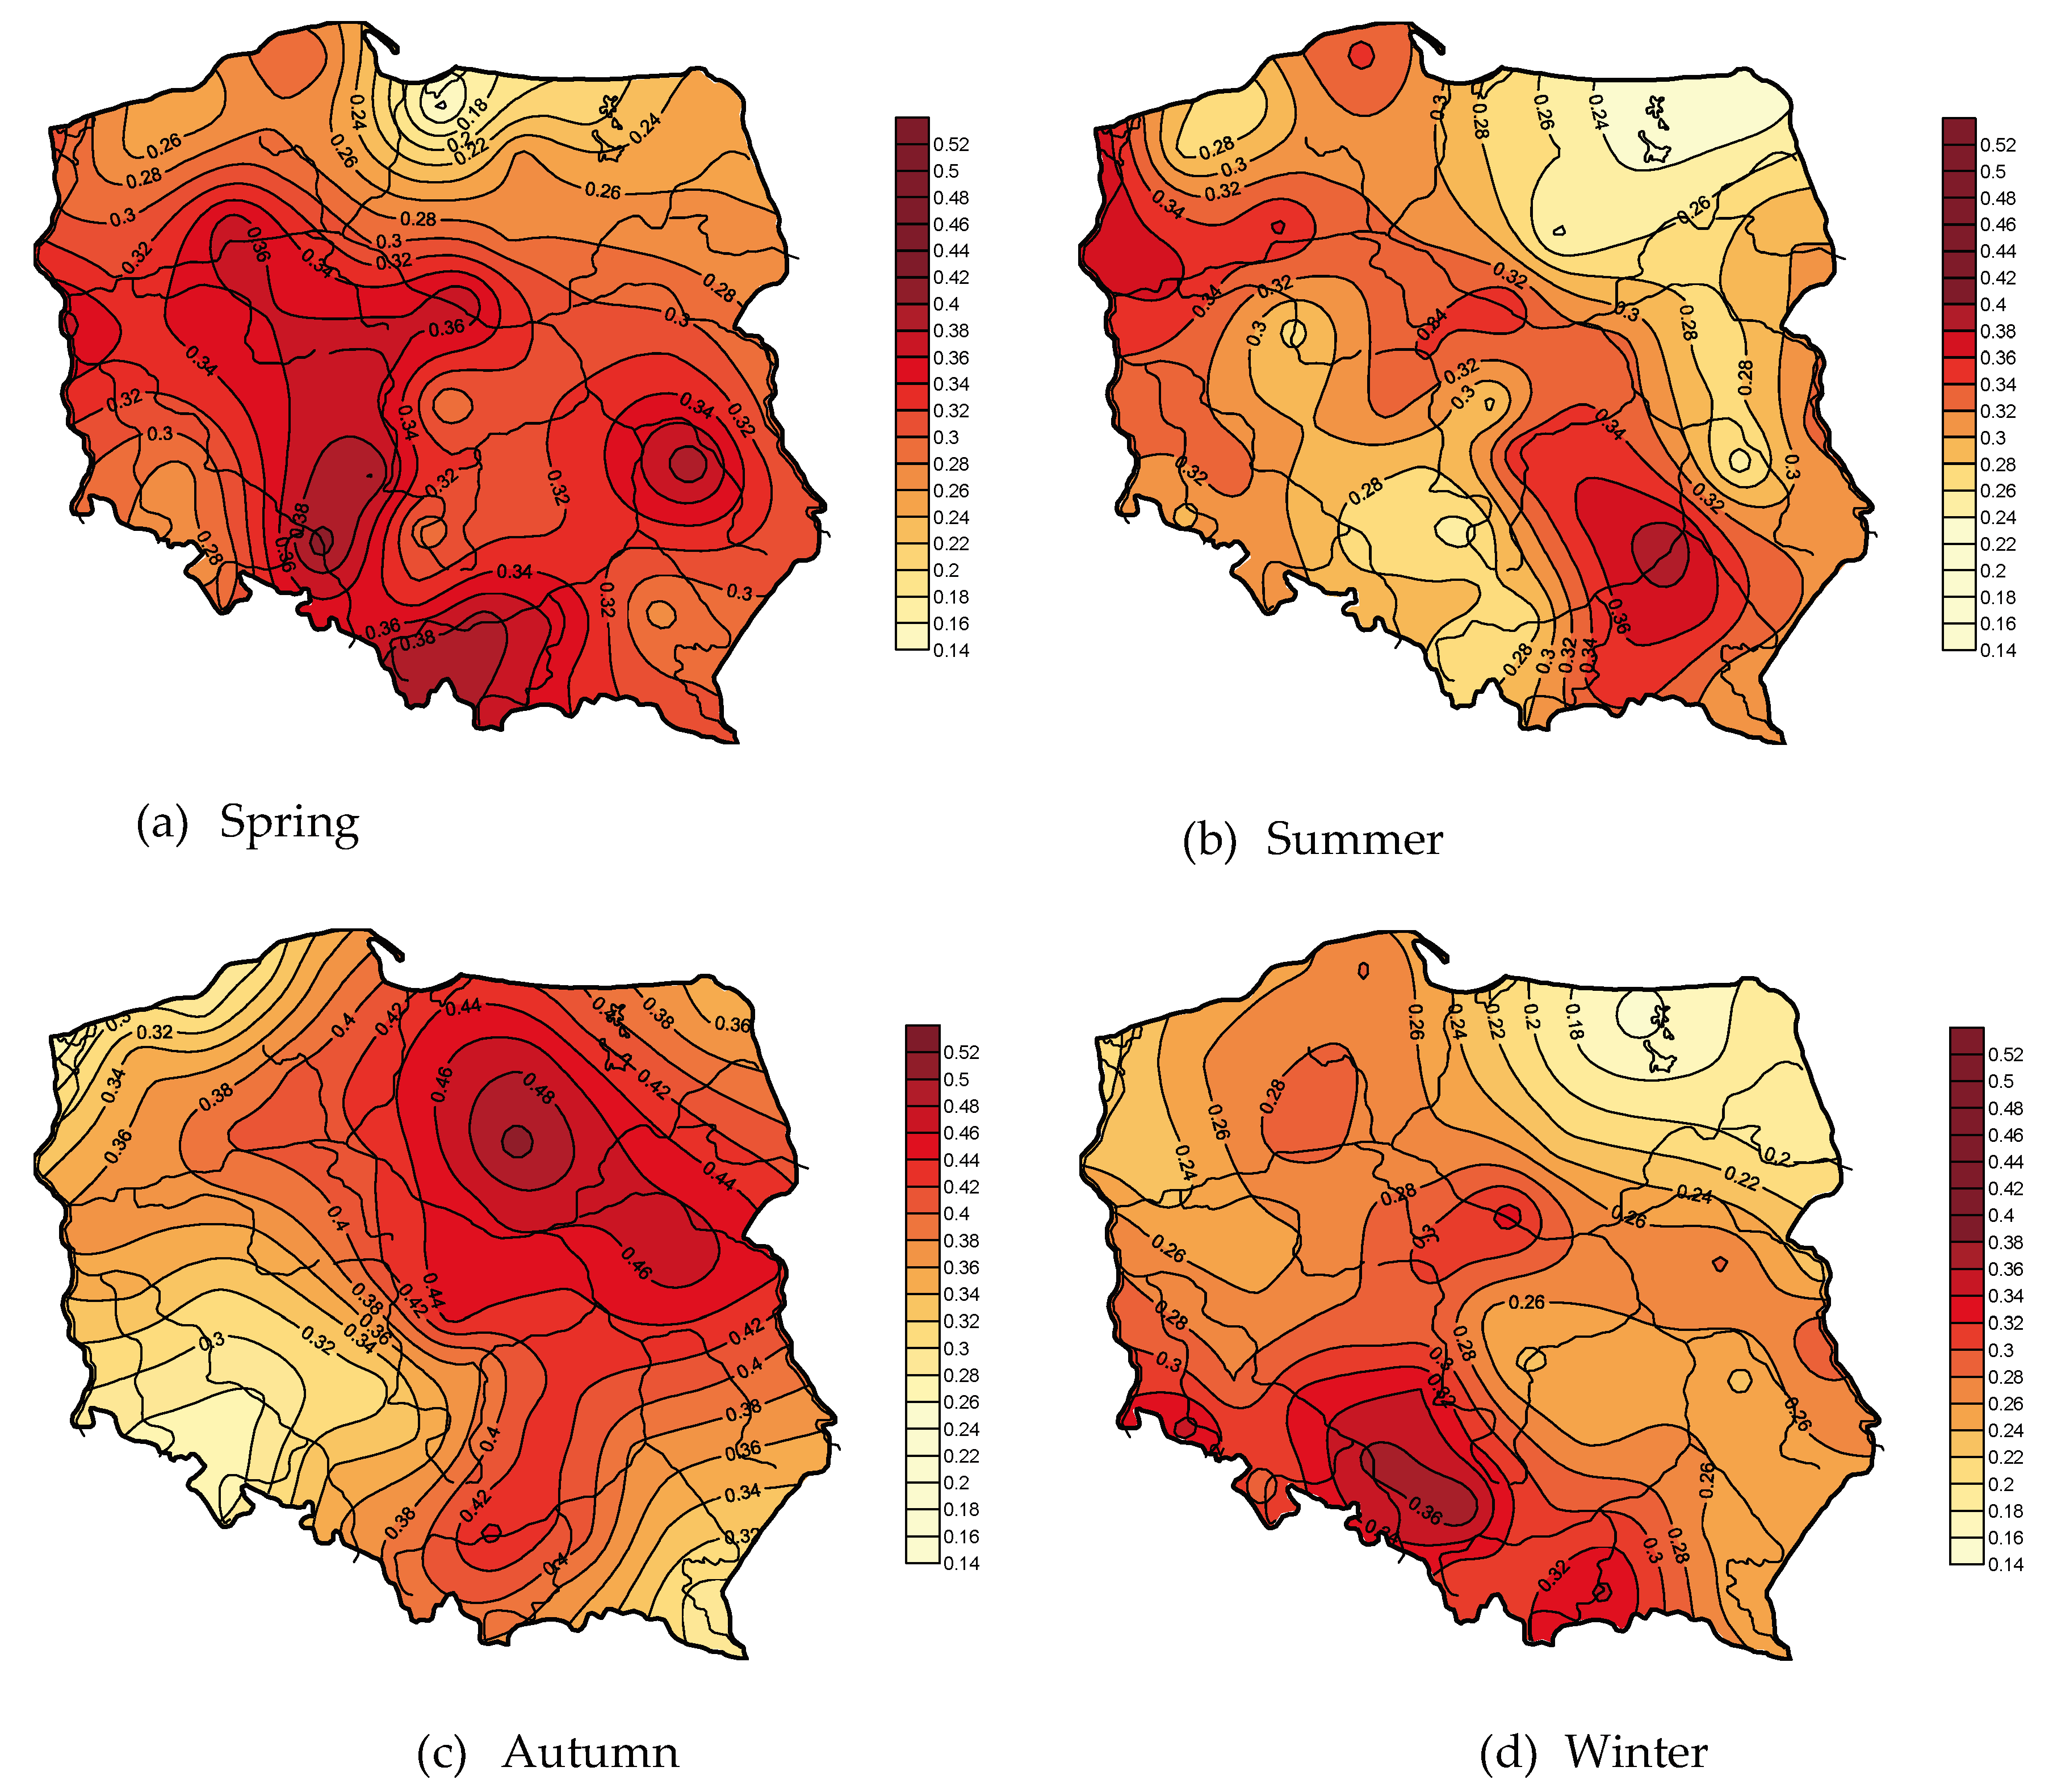
In spring, the highest variation in precipitation was found mainly in areas located in the south and southeast of Poland, with a coefficient of 0.40, and a maximum of 0.41 in Opole. Towards the northeast, the isarithm values decreased, reaching the lowest value in the eastern part of the South Baltic Coastland, with a minimum of 0.13 in Elbląg (
Figure 9). In the summer, the highest coefficients of variation were noted in the western part of the Southern Baltic Coastland and Lakeland, as well as in the Lesser Poland Upland, with a maximum of 0.40 in Sandomierz. In most of the country, the coefficient of variation ranged from 0.26 to 0.34. The lowest variation in precipitation, with a coefficient below 0.24, was noted in the Eastern Baltic Lakeland, with a minimum of 0.22 near Kętrzyn and Suwałki (
Figure 9). In autumn, the northern part of the Central Poland Lowlands was distinguished by the highest variation in precipitation, with a coefficient of over 0.50. As we move away from these regions, the value of the coefficient decreases in all directions. The lowest values of the coefficient, 0.26–0.27, were found in southwestern Poland and in the western part of the South Baltic Coastland (
Figure 9). In winter, the highest coefficients of variation in precipitation, in the range 0.32–0.36, were found in southern Poland, with a maximum of 0.38 in the vicinity of Katowice. The East Baltic Lakeland had the lowest variation in precipitation, with a minimum of 0.15 in Kętrzyn (
Figure 9).
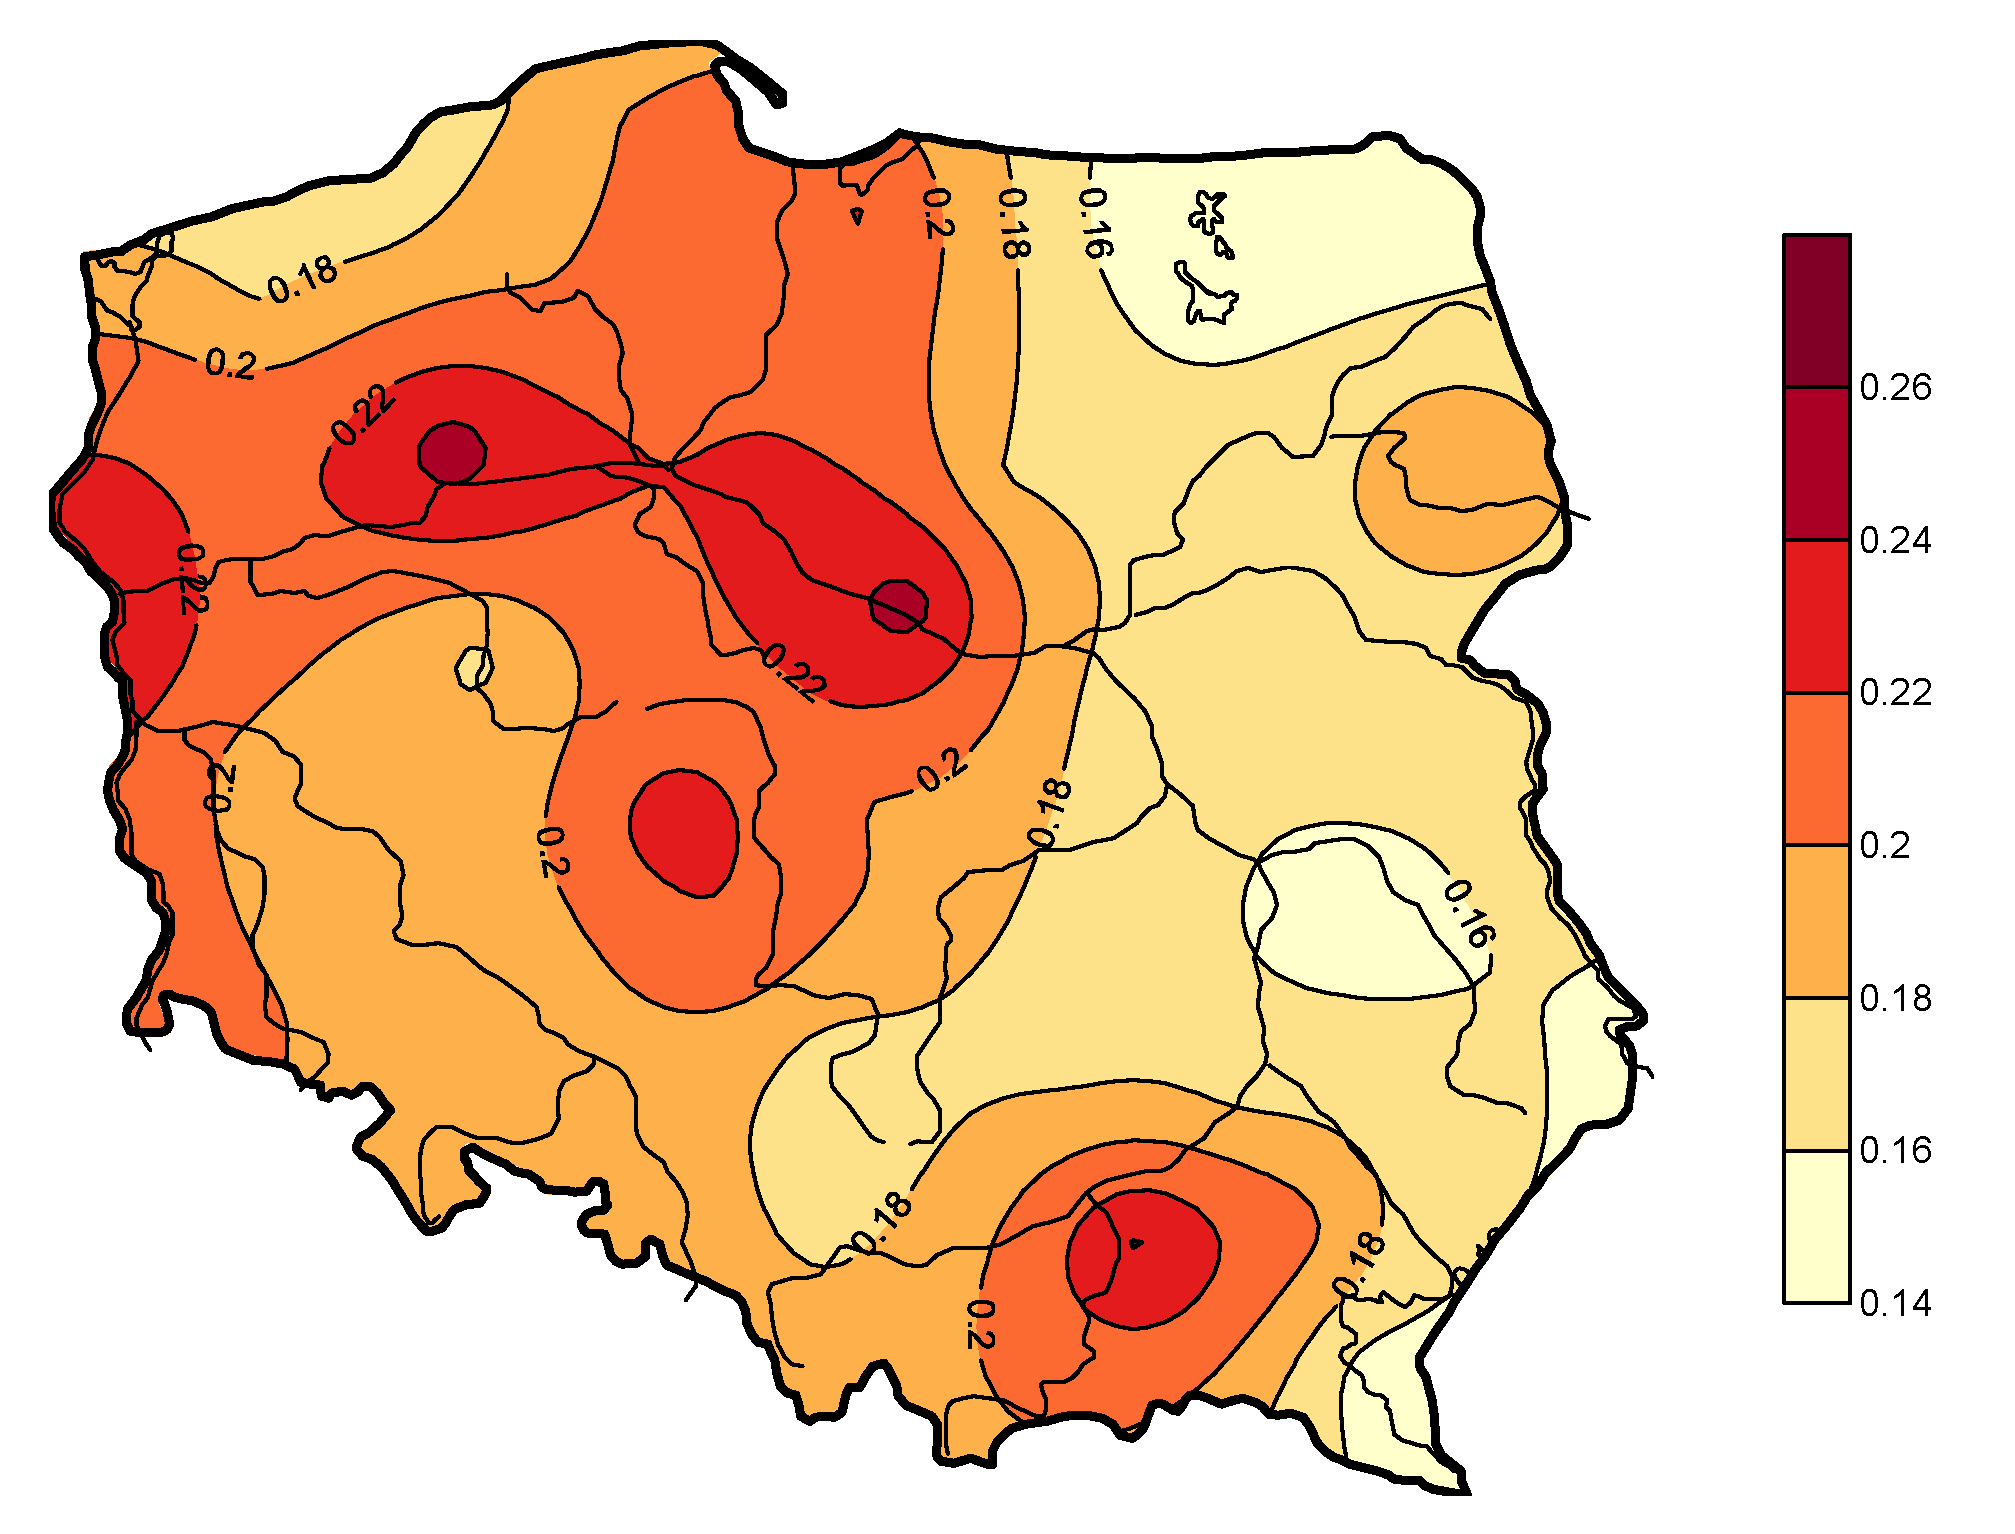
The highest yearly values of the coefficient of variation were found in the South Baltic Lakeland, especially in the vicinity of Piła and Płock (0.25). As we move away from these regions, the coefficient decreases in in all directions. The lowest variation, with a coefficient of 0.14, was noted in northeastern Poland (
Figure 10).
4. Discussion
Comparison of precipitation totals averaged for the whole of Poland with results reported by other authors for selected earlier periods shows that the precipitation total of 624.5 mm for the period of 2001–2018 is the highest. Szwed [
19] estimated the annual precipitation total in Poland for the period 1951–2013 at 618 mm. Ziernicka-Wojtaszek [
17] reported a value of 601 mm for the period 1971–2000. Kożuchowski and Żmudzka [
23] estimated the value at 590 mm for 1951–2000 and 595 mm for 1901–2000, while Czarnecka and Nidzgorska-Lencewicz [
18] reported a value of 594 mm for 1951–2010. Dynowska [
35] estimated the inflow value of the water balance in Poland, in the form of precipitation, at 605 mm for 1951–1970.
The study showed a non-significant increase, and at three stations a significant increase, in precipitation in northeastern Poland in most cases. A significant increase was found at only three stations: Białystok, Siedlce, and Ustka. A comparison by Kożuchowski [
36] of annual precipitation from 1931–1960 with the period 1891–1960 showed that the increase was particularly pronounced in northern Poland. Research by Kołodziej [
37], comparing precipitation from 1891–1930 and 1948–1963, showed increases in the north of Poland and in parts of the Carpathians and the Sudetes. Increased precipitation in the north of Poland was also found by Zawora and Ziernicka [
38], in their comparison of precipitation from the periods 1891–1930, 1931–1960, 1961–1990 and 1991–2000. Research by Szwed [
19] showed that in the current climate annual rainfall is increasing slightly in Poland. These changes, however, are not statistically significant over the entire country; a more pronounced increase is observed in northern Poland, with varied levels of significance, and in a small area of southeastern Poland. Studies carried out in neighboring countries point to rising rainfall trends in the Czech Republic [
39], Slovakia [
40], Ukraine [
41], and Germany, especially its western part [
42]. In contrast, in southern Hungary, a significant decrease in annual rainfall in the 20th century has been reported [
43]. The forecasted changes in precipitation vary considerably depending on the region and season of the year [
44,
45]. Annual rainfall was projected to increase in northeastern and northwestern Europe and to decrease in southern Europe in 1960–2015 [
46,
47].
In the 18-year study period, the average precipitation from the 47 stations in spring, summer, autumn and winter accounted for 22.0%, 37.3%, 23.3% and 17.4%, respectively, of the annual total, which is very similar to the results reported by Czarnecka and Nidzgorska-Lencewicz [
18] for the period 1951–2010, with values of 22%, 37%, 24% and 17%, and by Szwed [
19], who reported values of 37.7% and 17.4% for the share of summer and winter precipitation in the annual total for the period of 1951–2013. It should be emphasized that the most pronounced changes in the percentage of summer rainfall, in terms of both direction and extent, are similar to those noted in the second half of the 20th century. Degirmendžić et al. [
48] showed a downward trend in almost the entire country, which supports views that the continental features of pluvial conditions are weakening slightly. The situation is similar in many regions of Europe, e.g., in Germany [
49] and Belarus [
50].
In the spatial variation of the share of individual seasons in the annual precipitation totals, an increase in summer precipitation and a decrease in winter precipitation are noted from the northwest towards the south. From north to south, the share of spring precipitation in the annual total increases, while that of autumn precipitation decreases. This is in line with results reported by Czarnecka and Nidzgorska-Lencewicz [
18] for 1951–2010. Also in agreement with that results of that study is the spatial distribution of the ratio of precipitation in the warm half-year (April–September) to the cold half-year (October–March), which increases from the northwest to the south. However, a comparison of the extent of the isoline indicates a minor increase in the area with low values for this ratio, especially in northeastern Poland, during the 2001–2018 study period.
Publications on the value of the coefficient of variation of average precipitation for Poland confirm that it has been increasing over time. Research by Kożuchowski [
36] showed a value of 11% for the entire 1881–1980 period, 10% in the first half of the 20th century, and 12% in the second half. In that century, a systematic increase is observed in the coefficient of variation of precipitation in moving 10-year periods in Poland, from a few % at the end of the 19th century to 10–20% at the end of the 1970s and the beginning of the 1980s. According to the author, this tendency was so clear and persistent that it should be described as the fundamental feature of the evolution of precipitation relations in the previous 100 years (1881–1980) [
36]. In Kożuchowski’s work from 1996, ‘Współczesne zmiany klimatyczne w Polsce na tle zmian globalnych (Contemporary climate changes in Poland against the background of global changes)’, the author cites a graph of the variation in precipitation in moving 20-year periods in Poland in 1861–1990—for this period, the average coefficient of variation is already 0.12, and increases over the course of the period. In recent years, the maximum values of the coefficient of variation of precipitation have reached 0.16. In a later study for the period 1951–2000 [
23], the authors reported an even higher coefficient of variation of precipitation averaged across Poland—0.13. For the same period a year later [
25], Kożuchowski reported slightly higher coefficients of variation for stations representing extreme locations and the centre of the country: 0.16, 0.18, 0.18, 0.19, and 0.17 for Szczecin, Wrocław, Suwałki, Przemyśl and Łódź, respectively. Ziernicka-Wojtaszek [
17] estimates the coefficient of variation for Poland at 0.17. The 0.19 coefficient of variation of precipitation for Poland for 2001–2018 is the highest, and together with the results cited indicates a progressive systematic increase in the coefficient of variation of precipitation, which is also clearly visible at the start of the 21st century.
The distribution of the coefficient of variation of precipitation in Europe [
51] shows that its maximum values of about 28% occur in the Mediterranean zone, and slightly lower values on the eastern leeward side of the Scandinavian Mountains. The lowest values, about 8%, are found in northwestern Ireland. The territory of Germany and Poland is within the range of isolines of a 13–14% coefficient of variation. Variation in precipitation increases to the south and east, but the strip with low values for the coefficient runs along the southern and eastern Baltic as far as Finland, following Van Bebber’s track IVb, along which low pressure systems move down from the Atlantic. This is the axis of the most stable precipitation in the temperate zone. The map of the differentiation of the coefficient of variation for Poland from the later period of 1931–1980 [
36] confirms the previously described very general distribution of the coefficient in Europe, with the lowest values of 16% in the northwest of Poland, in the Tatra Mountains and in Podhale, and the highest values of 20% in southeastern Poland, as well as in Żuławy Wiślane and the surrounding area. Similar patterns can be observed for the more recent period of 1951–1980 [
24]. The lowest coefficients of variation of precipitation, 16–18%, are noted in western Poland and in the strip from the upper Warta basin to the Tatra Mountains, and the highest values in southeastern Poland and in the Eastern Baltic Lakeland. The results of the present study regarding the spatial differentiation of the coefficient of variation of precipitation in Poland, with the highest values noted in the South Baltic Lakeland, do not confirm the patterns cited, perhaps because the 18-year study period was relatively short. While in the southeast of Poland there is a smaller area with a high coefficient of variation, with a maximum of 22% in the vicinity of Tarnów, the values around Piła and Płock reach 25%.
To sum up the diagnosis of the contemporary (2001–2018) precipitation regime in Poland, despite the lack of clear tendencies for annual totals, an increase in the coefficient of variation results in an increase in the frequency of both atmospheric drought and floods [
52,
53]. This unfavorable situation is exacerbated by the downward trend observed in the percentage share of summer rainfall in the total annual precipitation. With a progressive increase in air temperature causing an increase in evapotranspiration [
54], the rainfall demands of arable crops were already growing in the study period. Forecasts assuming air scenarios with a temperature rise indicate the possibility of a further increase in rainfall shortages. It should be noted that the increase in variability as global warming increases is compounded by geographic features, such as terrain relief characterized by concave and convex latitudinal belts facilitating the movement of different air masses from the east and west, the predominance of light soils, small water resources, and low outflow values per capita.
The vast majority of weather stations are located in cities, and thus the data describe the climate of a city as an undifferentiated whole. In the literature dealing with the impact of cities on climate, particularly on rainfall, three general approaches are taken: comparison of data from urban and non-urban stations [
48], differentiation of precipitation in the vicinity of cities, even up to several dozen kilometres, and differentiation of precipitation within the city’s administrative boundaries. Research by Zeleňáková et al. on eastern Slovakia [
55] showed no differences in the amount of precipitation in rural and urban areas. The upward trends in precipitation were not significant. Liu and Niyogi [
10], in their meta-analytical syntheses, observed an increase in precipitation about 20–50 km from city centres. In an analysis of maximum daily precipitation, Bogucka [
56] reported higher precipitation on the outskirts of Warsaw than in its centre. Bartnik and Marcinkowski [
57] found that atmospheric precipitation in Łódź was characterized by high spatial variability. The highest rainfall was recorded in the central part of the city—over 600 mm, as compared to 520 mm on the outskirts. The dynamic impact of the city also depends on the current synoptic conditions, i.e., the type and direction of incoming air masses and the type of front, as well as the size and spatial structure of the city.
Progressive urbanization and especially sealing of the catchment exacerbate the adverse effects of climate phenomena, including upward-trending high-intensity rainfall, which causes an increase in surface runoff of rainwater. Therefore, in implementing EU policy on adaptation to climate change, in October 2013, the Council of Ministers of the Republic of Poland adopted the ‘Strategic Adaptation Plan for sectors and areas sensitive to climate change up to 2020, with an outlook to the year 2030’, developed by the Ministry of the Environment. The document mentions the need to take climate change into account in developing urban spatial policy for 44 Polish cities with a population of over 100,000. In Kraków, for example, the following were included among adverse climate phenomena: heat waves, long periods without rainfall in combination with a maximum temperature above 25 °C, torrential rain (short-term high-volume rainfall) causing local flooding (urban floods), floods from rivers, cold waves, and thunderstorms, including hailstorms, with the associated strong wind gusts and torrential rain. The concentration of air pollution and the occurrence of smog were also included among significant hazards. The four sectors most susceptible to climate change were selected in Kraków: public health, water management, transport, and high-intensity housing development with green areas. A register of hazards and means of prevention and adaptation were developed for these sectors.
5. Conclusions
During the study period of 2001–2018, Poland was an area with spatially varied precipitation. With an average of 624.5 mm, the most abundant precipitation was recorded in southern Poland—800–900 mm. High rainfall of 600–700 mm was noted in the Carpathian Foothills and in the Uplands belt. Rainfall exceeded 600 mm in the South Baltic Coastland and Lakeland. The lowest rainfall level of 500–550 mm was noted in central Poland, with a 490 mm minimum in Kalisz.
Upward trends in annual precipitation totals were noted in northeastern Poland. They were statistically significant only at the Białystok, Lębork, and Siedlce stations. Decreases in precipitation were observed in the rest of the country. Statistically significant decreases with varied levels of significance were noted at only 11 stations: Rzeszów–significance level of 0.01–0.05; Koło–0.05–0.1; Katowice, Kielce, Kłodzko, Nowy Sącz, and Racibórz–0.1–0.2; and Chojnice, Lesko, Opole, and Tarnów–0.2–0.3.
The averaged annual precipitation totals were highly varied between years. In the driest year, 2015, the annual total was 77% of the long-term average, while in the wettest year, 2010, it was 131% of the 2001–2018 average. The lowest average precipitation total was noted in February—30.2 mm, and the highest in July—94.0 mm.
Precipitation in spring accounted for 22.0% of annual precipitation, in summer for 37.3%, in autumn for 23.3%, and in winter for 17.4%. In spring, rainfall generally increased from northwest to southeast. In summer, the spatial distribution was most similar to the annual precipitation distribution. In autumn, the lowest rainfall occurred in the broad belt of central Poland, which narrows from west to east, with the center of the lowest rainfall located in the vicinity of Poznań. From this area, rainfall increased northwards and southwards. In winter, precipitation generally decreased from northeast to southeast.
The ratios of the warm half-year to cold half-year precipitation totals did not show clear spatial differentiation or clear temporal trends. Significant positive changes were demonstrated at only two stations and negative changes at three. The ratios of summer and winter precipitation also showed no clear direction or spatial differentiation. An increase in the ratio was demonstrated at two stations and a decrease at six. The ratio of autumn to spring precipitation showed a clear picture at 39 stations: it was positive, and at 11 stations it was statistically significant. No statistically significant decreases were noted.
The coefficient of variation of the annual precipitation totals in 2001–2018 was 19%. The most variable season was autumn, with a 37% coefficient of variation. Winter was the most stable in this regard, with a coefficient of variation of 27%. On a monthly scale, September and October were the most variable, with a coefficient of variation 66%, while March was the least variable, with a coefficient of 45%.
An increase in the coefficient of variation of precipitation will create conditions for an increase in the frequency of atmospheric drought, and subsequently agricultural and hydrological drought, as well as floods. In urban areas with increasing surface sealing, the share of surface runoff in the water balance will increase, and in this situation short-term rainfall will cause local flooding.


