Article

Online Measurement of PM2.5 at an Air Monitoring Supersite in Yangtze River Delta: Temporal Variation and Source Identification

1
State Environmental Protection Key Lab of Environmental Risk Assessment and Control on Chemical Processes, East China University of Science and Technology, Shanghai 200237, China
2
Shanghai Environmental Protection Key Laboratory on Environmental Standard and Risk Management of Chemical Pollutants, East China University of Science and Technology, Shanghai 200237, China
*
Author to whom correspondence should be addressed.
Atmosphere 2020, 11(8), 789; https://doi.org/10.3390/atmos11080789
Submission received: 25 June 2020 / Revised: 18 July 2020 / Accepted: 23 July 2020 / Published: 26 July 2020
(This article belongs to the Special Issue Interaction of Air Pollution with Snow and Seasonality Effects)

Abstract

:
To comprehensively explore the transport of air pollutants, one-year continuous online observation of PM2.5 was conducted from 1 April 2015 to 31 March 2016 at Dianshan Lake, a suburban junction at the central of Yangtze River Delta. The chemical species of PM2.5 samples mainly focused on Organic carbon (OC), Elemental carbon (EC) and Water-Soluble Inorganic Ions (WSIIs). The annual average of PM2.5 concentration was 59.8 ± 31.7 µg·m−3, 1.7 times higher than the Chinese National Ambient Air Quality Standards (CNAAQS) (35 µg·m−3). SNA (SO42−, NO3 and NH4+) was the most dominated species of PM2.5 total WSIIs, accounting for 51% of PM2.5. PM2.5 and all of its chemical species shared the same seasonal variations with higher concentration in winter and spring, lower in autumn and summer. The higher NO3/EC and NOR occurred in winter suggested that intensive secondary formation of nitrate contributed to the higher levels of PM2.5. Cluster analysis based on 72-h backward air trajectory showed that the air mass cluster from nearby inland cities, including Zhejiang, Anhui and Jiangxi Provinces contributed mostly to the total trajectories. Furtherly, potential source contribution function (PSCF) analysis revealed that local sources, namely the emissions in the Yangtze River, were the primary sources. During haze pollution, NO3 was the most important fraction of PM2.5 and the heterogeneous formation of nitrate became conspicuous. All the results suggested that the anthropogenic emissions (such as traffic exhaust) was responsible for the relatively high level of PM2.5 at this monitoring station.

1. Introduction

Due to the rapid industrialization and urbanization, China has suffered severe haze pollution during the past decades, which is characterized by extremely high levels of fine particulate matter (PM2.5) [1,2,3]. Because of the adverse threat to human health, atmospheric visibility and climate change [4,5], PM2.5 has attracted widespread attentions in numerous studies [6]. Indeed, a comprehensive investigation on the properties of chemical consistent and sources could improve our knowledge of the chemical/physical transformations resulting in haze formation, thus promote to draft effective strategies, even legislative actions.
The chemical constitutes of PM2.5 are extremely complexed, including the main species of OC, EC and WSIIs such as sulfate (SO42−), nitrate (NO3) and ammonium (NH4+), namely SNA [7,8]. Except for primary emissions, chemical conversion of gaseous pollutants is also another important sources of PM2.5. The formation mechanism of SNA depends on related precursor pollutants (SO2, NO2 and NH3), oxidative state of atmosphere and the meteorological factors [8,9]. Generally, the main pathways for the formation of sulfate and nitrate was the gas- or liquid-phase reactions of SO2 and NO2. For example, homogeneous gas-phase reaction of SO2 with OH•, H2O2 or catalytic metals (such as Fe(III) and Mn(II)) and heterogeneous processes in the aqueous environment on the surface of particles or in-cloud play a significant role in sulfate formation [8,10,11,12]. While nitrate is mainly formed by photochemical reactions of NO2 with OH• or O3 during daytime and heterogeneous hydrolysis of N2O5 on the surface of aerosols at night [9,13,14]. In past decades, considerable amount of researches have been conducted in China to study the characteristics and source apportionments of PM2.5 [15,16,17]. Generally, the concentration of PM2.5 was much higher in northern China with extremely high levels in winter. Besides, the fraction of SNA in PM2.5 in North China Plain and Pearl River Delta were relatively higher than that reported in Yangtze River Delta.
Shanghai, as the capital city of Yangtze River Delta, is an international metropolis with a population of nearly 25 million. Studies about the compositions in PM on various aspects have been reported recently. For example, Ding focused on the compositions including WSIIs and carbonaceous species of PM in different size ranges in urban Shanghai and found that air pollutants from long-range transport contributed significantly to the air pollution in Shanghai [17]. Huang investigated the evolution of the chemical properties of PM1 during a 72-h sampling period in urban Shanghai with the conclusion that air mass from northwest of Shanghai increased concentrations of NH4+, NO3 and OC [18]. However, few studies on the characteristics of the compositions of PM in suburban areas in Shanghai have been reported. Moreover, many studies carry out experiments on the basis of samples by filters, which have some limitations such as low time resolution compared with online instruments. In addition, the interaction between carbonaceous species and secondary inorganic ions also remains to study.
In this study, water-soluble inorganic ions and carbonaceous compositions of PM2.5 were continuously monitored by hourly real-time online measurement at a suburban site in Western Shanghai. The sampling site is a typical representative of suburban area and located at the junction of Zhejiang province, Jiangsu province and Shanghai, thus it is recognized as ideal for studying the transport for air pollutants. In this study, the temporal variations of chemical compositions in PM2.5 were examined; (2) the potential sources of PM2.5 were investigated based on backward trajectory analysis and PSCF; (3) formation mechanism of sulfate and nitrate were explored during pollution episodes. This study is of great importance for explore the formation of PM2.5 pollutions and provide scientific basis for particulate pollution control for related office of Jiangsu, Zhejiang and Shanghai.

2. Experiments

2.1. Field Observation

The sampling site is located at a super motoring site (30°43′52″ N, 122°27′27″ E) in Qingpu District, approximately 0.3 km west of Huqingping Highway and 0.5 km away from Dianshan Lake, the largest freshwater lake in Shanghai (as shown in Figure 1). The air samplers were set up at the roof of a four story building 18 m above ground level. Thus, this sampling site is mainly affected by vehicular exhaust. Moreover, the surrounding area by agricultural fields and a small number of residential space. There are no large industrial emissions around. Therefore, this sampling site was characterized as a suburban site in this study. The online measurement campaign was conducted from 1 June to 31 December 2014.

2.2. Measurements of Various Parameters

High time-resolved concentrations of water-soluble inorganic cations (Na+, K+ and NH4+) and anions (Cl, NO3 and SO42−) in PM2.5 were automatically monitored by the Metrohm Applikon MARGA (Monitor of Aerosols and Gases in Ambient Air, ADI2080, Metrohm Applikon, ECN, EPA). The system includes a particle collecting system and two ion chromatograph analyzers for the determination of cations and anions. Ambient air was withdrawn into a cyclone inlet at a flow rate of 1 m3/h. First, water-soluble gases were absorbed by WRD (wet rotating denuder for gas sampling), and then PM2.5 were captured by SJAC (stream jet aerosol collector) connected with WRD to grow into small droplets, which were subsequently transported into the two ion chromatograph systems for the determination of WSIIs in PM2.5. The detect limits of each ion are 0.10 (Na+), 0.18 (K+), 0.10 (NH4+), 0.02 (Cl), 0.10 (NO3) and 0.08 µg·m−3 (SO42−), respectively.
The ambient PM2.5 concentrations were hourly monitored using Thermo Fisher 1405-F. OC and EC were analyzed by Model-4 semi-continuous OC-EC field analyzer (Model-4, Sunset Laboratory, USA). The minimum quantifiable levels of OC and EC were 0.5 µg·m−3. Atmospheric O3, SO2 and NO–NO2–NOx were simultaneously determined by online analyzers (49i, 43i, 42i, Thermo Scientific Corp. USA). The meteorological data such as ambient temperature, relative humidity were continuously measured by the automatic weather stations.

2.3. Sources Apportionment of PM2.5

In this study, back trajectory cluster and PSCF model were used to reflect the transport and sources contribution by GIS-based software TrajStat, which includes trajectory calculation modules of HYSPLIT and GIS functions and widely applied to identify the sources of air pollutants [19,20,21].

2.3.1. Back Trajectory Cluster

To study the origins and pathways of air masses to this sampling site, 72-h backward trajectories were calculated were calculated by using HYSPLIT-4 model throughout the sampling period. The back trajectories at the height of 500 m were calculated four times per day (local time: 2:00, 8:00, 14:00, 20:00). Meteorological data were downloaded from NOAA website [22].

2.3.2. PSCF Model

To identify the potential source areas of atmospheric PM2.5 in details, PSCF analysis was used in this study by counting each trajectory segment endpoint that terminates within given cell. The study domain of concern was in the range of 10–50° N, 80–130° E, which is divided into i × j small equal grid cells with 0.5° × 0.5° resolution. nij refers to the number of endpoints that fall in the ij-th cell. mij is defined as the number of segment endpoints when PM2.5 concentrations were higher than the specific criterion value for the same ij-th cell. The polluted criterion in this study is set as the 24 h averaged PM2.5 concentration of 75 µg·m−3 (threshold in ambient air quality standards of China (GB3095-2012)). The PSCF value in the ij-th cell is then calculated as:
P S C F i j = m i j n i j W i j
where Wij is an empirical weight function to better reduce the uncertainty of grid cells with small nij values [23]. Wij is defined as:
W i j   =   { 1.00 ,   80   <   n ij 0.70 ,   20   <   n ij     80 0.42 ,   10   <   n ij     20 0.05 ,   n ij     10 }
In this study, the 72 h back trajectories were generated every 6 h using TrajStat Software. The meteorological data were from National Oceanic and Atmospheric Administration (NOAA).

3. Results and Discussions

3.1. Dynamic Variations of PM2.5

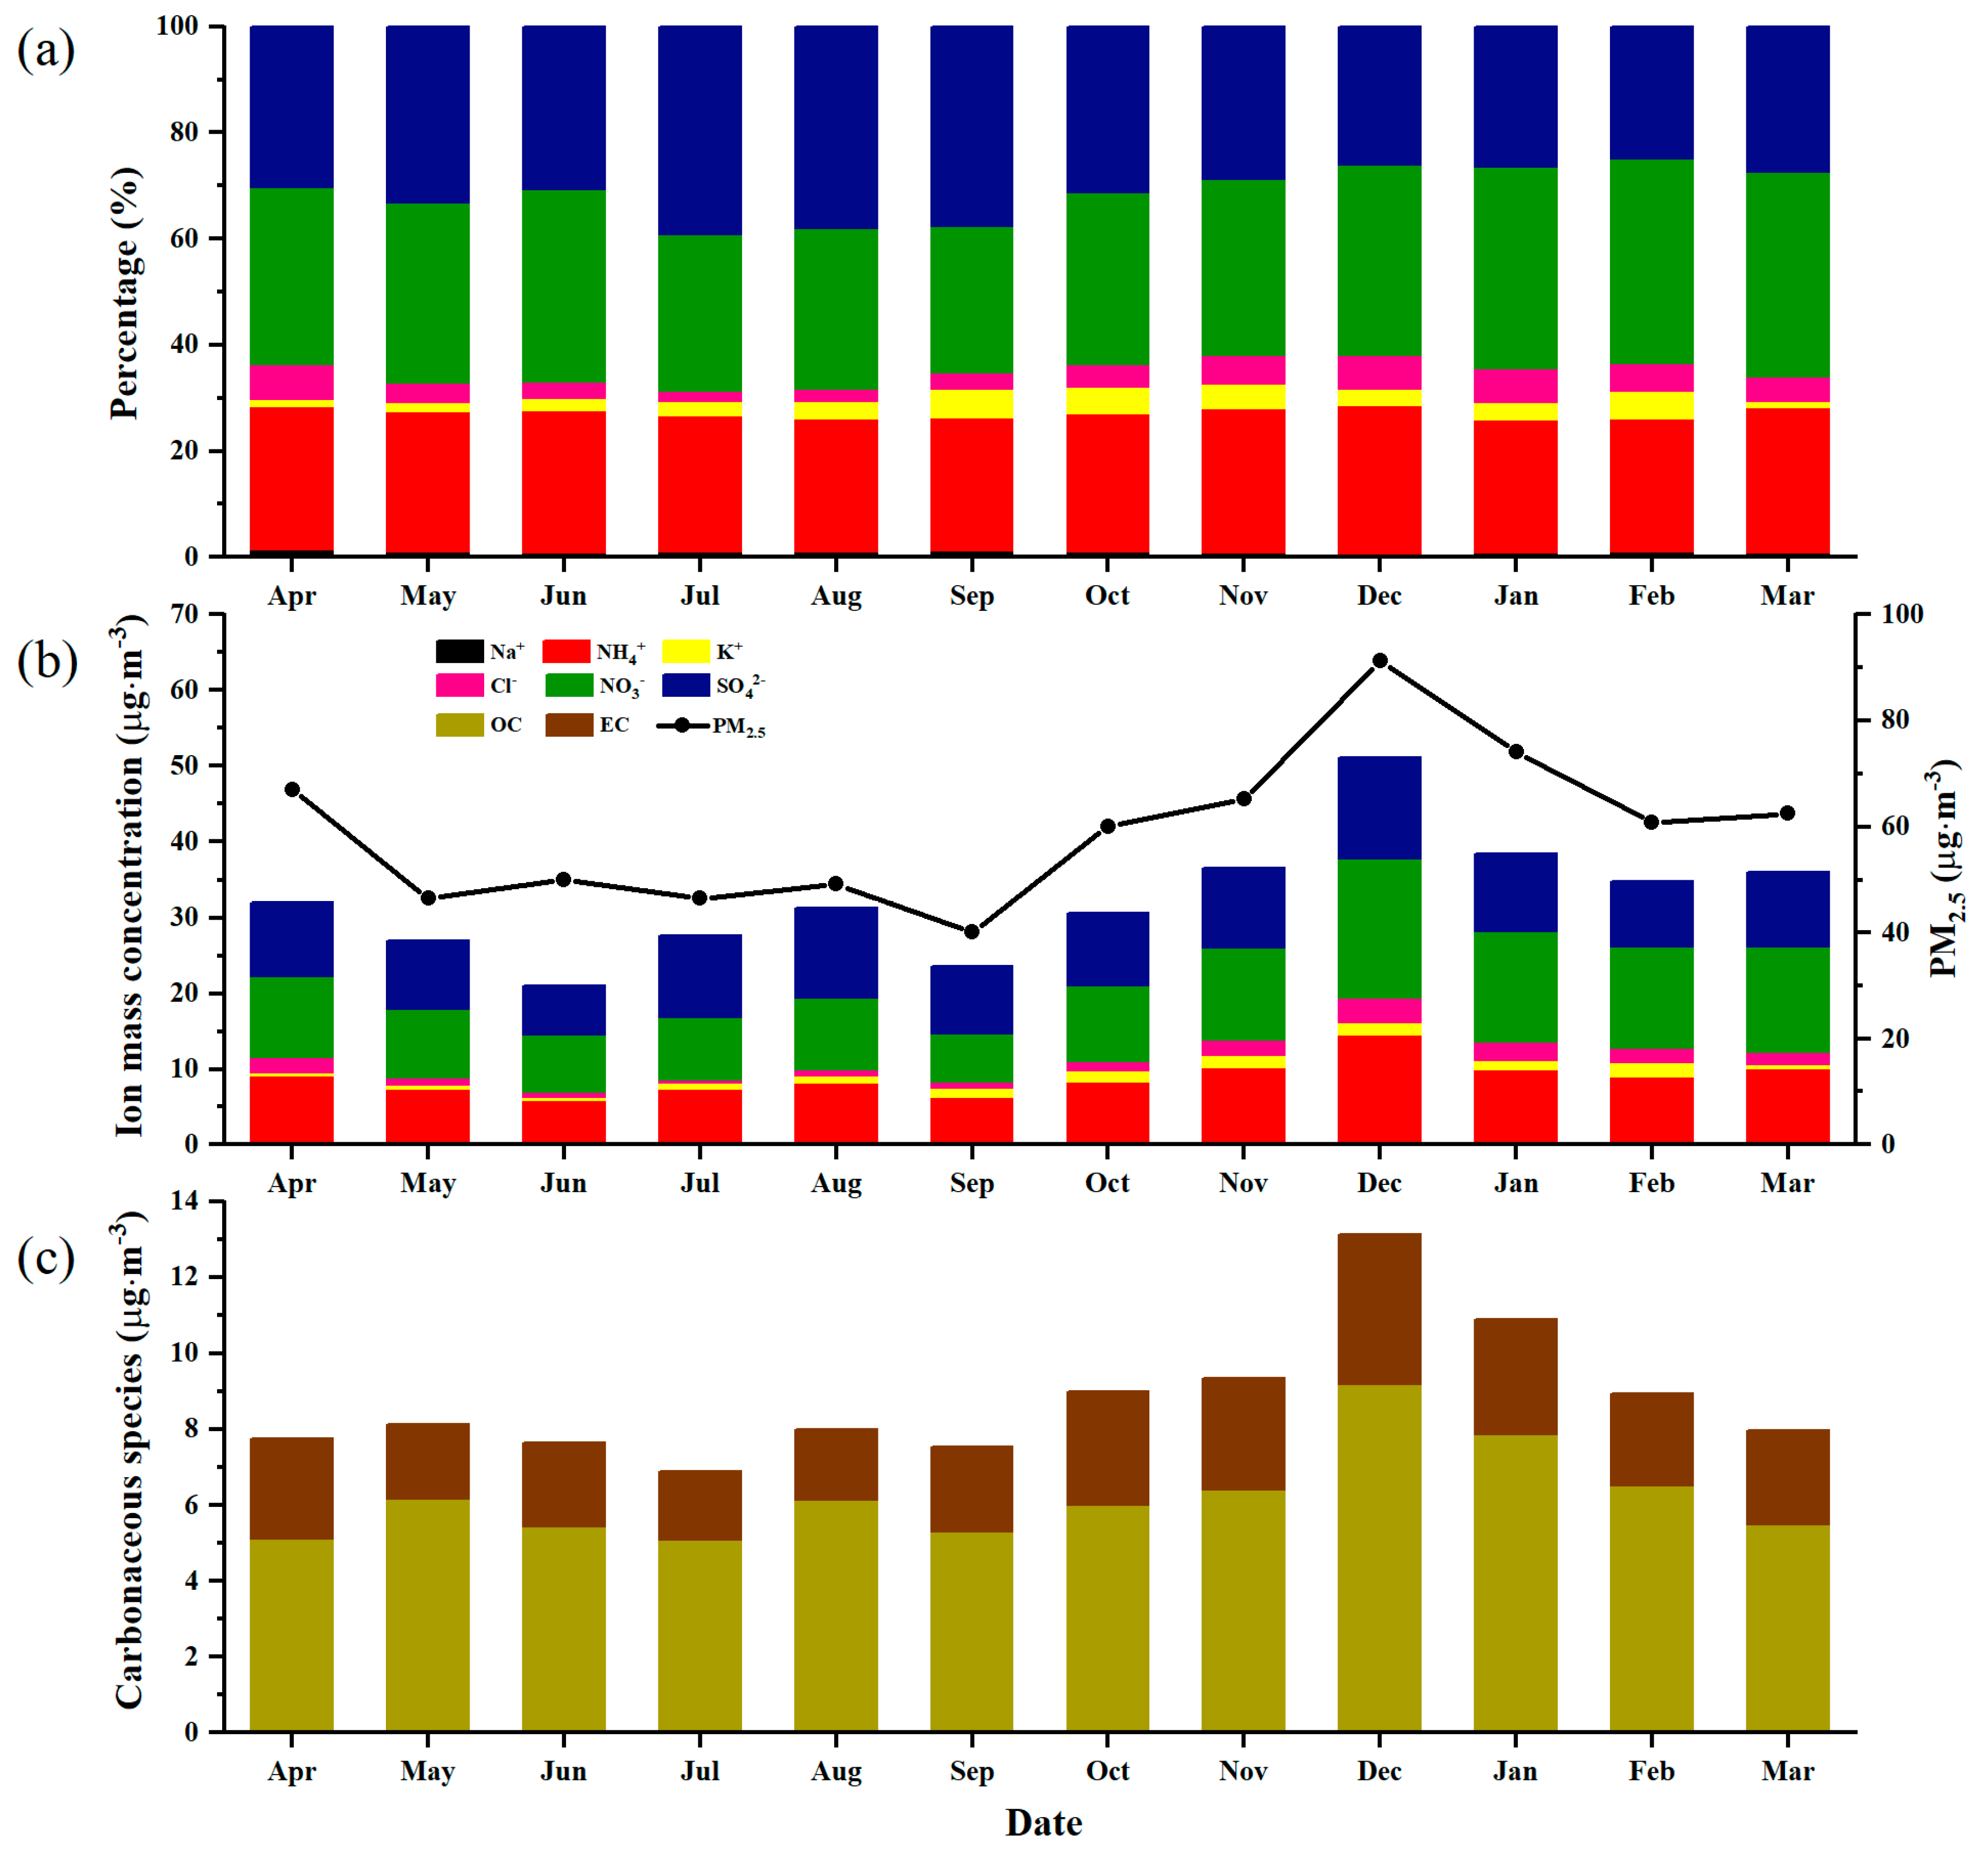
3.1.1. Seasonal Variations of Chemical Composition in PM2.5

To study the seasonality, the sampling campaign was grouped in spring (April, May 2015 to March 2016), summer (June to August 2015), autumn (September to November 2015), winter (December to February 2015). Seasonal variations of water soluble ions and carbonaceous compositions in PM2.5 were summarized statistically in Table 1. The 24-h average PM2.5 concentration observed during the study period ranged from 8 µg·m−3 to 217.6 µg·m−3 with an annual mean of 59.8 ± 31.7 µg·m−3 (Table 1), which was 1.7 times higher than 35 µg·m−3, the Chinese National Ambient Air Quality Standards (CNAAQS). The annual concentration of PM2.5 at this sampling site was lower than those in western and northern China, such as about 60% lower than Xi’an (142.6 µg·m−3) [24], Tianjin (148.9 µg·m−3) [25] and 30% lower than Lanzhou (93.7 µg·m−3) [26], but about 30% higher than those in central and southern China, such as JSH (a regional background CAWNET site, 48.7 µg·m−3) [7], Guangzhou (44.2 µg·m−3) [27].
The seasonal and monthly variations of WSIIs were given in Table 1 and Figure 2. The total concentration of WSIIs was 32.6 ± 18.7 µg·m−3 with a range of 4.93 µg·m−3 to 145 µg·m−3, represented 55.0% of PM2.5. The average concentration of WSIIs in the present study was comparable to the result in Chongqing (38.5 µg·m−3, 57% of PM2.5) [11], but relatively higher than Taiyuan (32.86%) [28] and Suzhou (40%) [8]. The annual SNA concentration was 32.2 ± 17.4 µg·m−3, contributing 91.1% of total WSIIs and 51.2 of PM2.5 mass, comparable to the results in Chongqing (91%) [11] and Suzhou (93%) [8]. In details, the average concentration of NO3 was 11.2 ± 8.01 µg·m−3, followed by SO42− (9.92 ± 5.47 µg·m−3) and NH4+(8.59 ± 5.31 µg·m−3), accounting for 34.4%, 30.4% and 26.3% of WSIIs, respectively. In comparison, Cl(1.52 ± 1.16 µg·m−3), K+(1.07 ± 1.02 µg·m−3), and Na+ (0.306 ± 0.153 µg·m−3) had a small contribution (<4%) to WSIIs.
The average PM2.5 concentration showed minor difference in spring and autumn, which were 58.6 ± 24.8, 55.9 ± 25.8 µg·m−3, respectively. The average PM2.5 concentration of 75.7 ± 42.5 µg·m−3 in winter was the highest, and the lowest average concentration was 48.5 ± 23.6 µg·m−3 in summer. The differences in four seasons could be caused by a combination of factors. For example, the high value of PM2.5 in winter can be owing to the poor dispersion conditions such as low wind speed and lower atmospheric boundary layer height [29]. During summer, the air masses were mainly from the sea and ocean, and the intensive precipitation dominantly occurred in summer, all of these could be the main reasons for the lower PM2.5 concentration during summer. Figure 2b shows that the concentration of PM2.5 had obvious monthly variations, with the lowest value in September (40.2 µg·m−3) and the highest value in December (91.2 µg·m−3). The ratio of NH4+ to the total WSIIs differed slightly in four seasons, around 26%. The proportion of SO42− to the total WSIIs was the largest in summer and the smallest in winter owing to higher conversion rate of SO2 to SO42− resulting from more intensive photochemical reaction under the higher ozone level and temperature in summer [30]. However, the ratio of NO3 to the total WSIIs was opposite to that of SO42− because lower temperature was help for the conversion of nitric acid from gaseous phase to particles [31]. Sulfate and nitrate in the aerosols are mainly formed by their respective gaseous precursor (NOx and SO2) through gas to particle conversion [32]. The NOx are mainly from vehicular exhaust and SO2 mainly comes from stationary emissions related to coal combustions, such as power plants and industrial boilers [33].
The ratio of NO3/SO42− has been usually applied to reveal the relative importance of stationary versus mobile sources of SO2 and NOx in the atmosphere [34]. The annual mean of NO3/SO42− has a higher value of 1.17, reflecting that mobile vehicles contributed greatly to particles. The average ratio of NO3/SO42− was the highest in winter with the value at 1.46 ± 0.581, which may indicate that the contribution of traffic emissions was more significant in winter, and the detailed mechanism would be illustrated in the formation of nitrate during haze (in Section 3.3). The highest concentration of Cl in winter may result from enhanced emission of coal combustion for heating. The proportion of K+ to the total WSIIs increased in autumn (September, October and November) and February with different reasons, the former main due to the biomass burning [20], while the latter main due to the impact of fireworks during the Spring Festival [11].
The average concentrations of OC and EC were 6.22 ± 3.12 µg·m−3 and 2.59 ± 1.44 µg·m−3, contribute 11.1% and 4.48% to PM2.5, respectively. The highest total carbon (TC=OC+EC) concentration occurred in winter and the lowest in summer which could be ascribed to seasonal differences in weather condition and types of air masses. Uplifted marine air masses may be one reason for the lower concentrations in summer and the higher values may be associated with more biofuel/biomass burning emissions in winter. The ratio of OC/EC is often used for identification and evaluation of source characteristics. The annual average value of OC/EC was 2.68 ± 0.952, which was higher than 2.0–2.2, indicating a fraction of OC was secondary organic carbon (SOC) [35].

3.1.2. Diurnal Patterns of Water Soluble Ions in PM2.5

Because of the different meteorological conditions and emission sources, the distinct diurnal patterns of gaseous pollutants and water soluble ions in PM2.5 are shown in Figure 3.
Ammonium, sulfate and nitrate shared the similar diurnal cycles in four seasons. SNA showed distinct diurnal variations in summer and autumn, with concentrations decreasing during daytime, indicating the degree of dispersions was higher than that of secondary formation. In winter, SNA showed two peaks in the morning (8:00–10:00) and afternoon (around 18:00), which was presumably related with the secondary transformation during winter haze. Despite the diurnal cycles were insignificant in spring, the concentrations were relatively higher than that at night. The higher concentrations at night were related to the decreased PBL height and increased atmospheric stability, which favored the accumulation of pollutants.
Chloride showed higher concentrations at night, with a small peak in the morning, and then decreased in the daytime. On one hand, the primary emissions may be higher at night. Moreover, this pattern can be explained by the lower PBL height and temperature. Cl can bound with NH4+ in the form of NH4Cl, which was temperature-dependent and semivolatile, thus Cl showed the opposite patterns with temperature.

3.2. Source Identification

3.2.1. The Ratio of NO3/EC and SO42−/EC, SOR and NOR

In this study, NO3/EC and SO42−/EC [36] were used to evaluate the relative importance of secondary formations of NO3 and SO42−. The SOR (Sulfuritrogen Oxidation Ration) and NOR (Nitrogen Oxidation Ration) had also been used as indicators of secondary transformation processes [37], which were defined as the following equations:
NOR = n   ( NO 3 ) n   ( NO 2 ) + n   ( NO 3 )
SOR = n   ( SO 4 2 ) n   ( SO 2 ) + n   ( SO 4 2 )
where n represents the molar quantity of the chemical species.
As illustrated in Figure 4, SO42−/EC and SOR shared the same seasonal patterns with higher values in summer, indicating that the higher secondary formation for sulfate occurred at summer.
However, the higher average value of NO3/EC and NOR occurred in winter. This is associated with the frequent haze in winter and the details will be described in Section 3.3. The lower value of NO3/EC and NOR in summer can be owing to the high temperature, which would favor the production of gaseous NH3 and HNO3 by decomposition of NH4NO3 in particles [38]. Thus, the degree of secondary formation for sulfate and nitrate was different in four seasons.

3.2.2. Cluster Analysis and PSCF

The source origins and pathways of PM2.5 were identified based on backward trajectory analysis of 72-h air masses. For each day, 4 trajectories (local time: 2:00, 8:00, 14:00, 20:00) were employed with the interval of six hours. The calculated trajectories of air masses were categorized into four clusters (as shown in Figure 5) based on their airflow directions and regions through which air masses are transported, the details of clusters are illustrated as follows:
Cluster 1 (accounting for 30.3%) represented air masses coming from nearby inland cities, including Zhejiang, Anhui and Jiangxi Provinces. Cluster 2 (accounting for 21.0%) referred to air masses originating from northeastern China and transported across Bohai Bay and Yellow Sea. Cluster 3, accounting for 35.0%, represented air masses coming across Yellow Sea, which were originated from south Korea. Cluster 4, accounting for 13.7%, suggest long-range transport tracking back to Mongolia, which passed over Shanxi, Hebei and Shandong Provinces.
The concentrations of PM2.5 and chemical species associated with each cluster are summarized in Table 2. The average concentrations of PM2.5 in airflows from mainland (cluster 1 and cluster 4) were both higher than that in air masses across sea (cluster 2 and cluster 3) and the annual average concentration of sampling site. The results indicated PM2.5 in this sampling site was primarily influenced by the cluster 1—with high proportion and high concentration of PM2.5. Additionally, we found that 62.5% of trajectories in cluster 4 dominantly occurred in winter, which was the second highest PM2.5 concentrations, indicating that in winter airflows from northern China could bring huge amount of PM2.5 toward Shanghai. Noticeably, trajectories in four seasons contribute equally to cluster 1, furtherly indicating that cluster 1 from Anhui, Jiangxi and Zhejiang provinces had a conspicuous contribution to PM2.5 concentration at sampling site.
To reveal the exact sources of PM2.5 during four seasons, the PSCF method was employed based on the results of backward trajectory analysis (as shown in Figure 6). Areas of high contribution were mostly surrounding areas, including most of Anhui, Jiangsu and Zhejiang provinces, which were in the economic circle of the Yangtze River. Different from the results of cluster analysis, northwestern China had surprisingly minor contribution in winter. Therefore, results of PSCF further indicated that local sources, namely the emissions in the Yangtze River, were the primary sources.

3.3. Pollution Episode

As shown in Figure 7, from 10 to 16 December 2015, a heavy haze episode occurred with the highest average concentration of PM2.5 167 µg·m−3. The SOR ratio increased from 0.25 during non-haze episodes to 0.33 in haze episodes, the highest values of SOR were 0.47 in non-haze episodes and 0.54 in haze episodes, respectively. The gas-phase oxidation of SO2 by OH and H2O2 radical or heterogeneous oxidation was thought to be responsible for the formation of SO42− [39,40]. Previous studies suggested that the oxidations in gas-phase depended strongly on temperature and heterogeneous reactions are always intensive when RH is higher [41,42]. In this study, the higher coefficients of SOR with temperature (r = 0.632, p < 0.01) and RH (r = 0.757, p < 0.01) in non-haze periods indicated that the oxidations in gas-phase and heterogeneous reactions also contribute to the formation of sulfate. The secondary formation mechanism of sulfate was complexed in haze and non-haze periods.
A clear increase of nitrates could be observed in Figure 7, and nitrate dominated WSIIs in the studied period, which indicated that nitrate had become the major constitutes of PM2.5 during haze pollution. In terms of PM2.5 concentrations, this polluted episode can be divided into four groups: Clean, transition and polluted, heavily polluted periods. Generally, the ratio of NO3/SO42− is be recognized as an indicator of stationary vs mobile emissions. As shown in Figure 8, the mean ratio of NO3/SO42− increased slightly from clean to slightly polluted periods, then increased sharply to polluted conditions, reflecting that NO3 was more dominant and mobile emissions contribute more to the haze pollution, in accord with the location of sampling site and the legislate control of air pollution in recent years. Additionally, it was reported that NOR was higher than 0.1—when nitrate was primarily formed by the secondary conversion of NOx. During clean days, the average value of NOR was 0.13, while the average value of NOR increased from transition (0.18), polluted (0.34) to heavily polluted (0.39) periods, suggesting that nitrate was more likely formed by secondary transformation of NOx oxidation and enhanced secondary transformation of NO2 and SO2 during severely haze events. Meanwhile, the ratio of NOR/SOR showed a remarkable increase from transition (0.56) to polluted (1.28) periods, implying that NOR increased more rapidly than SOR during severely haze events. The decrease in ratio of NO2/SO2 from transition to polluted conditions furtherly indicated that the secondary transformation of NOx oxidation was more conspicuous in haze episode.
Nitrate is predominantly formed by the homogenous reaction of NO2 and OH radical during daytime and by heterogeneous hydrolysis of N2O5 at night. Generally, the molar ratio [NH4+]/[SO42−] was used to assess NH4+ rich conditions. As shown in Figure 9a,c,e, the intercept of [NH4+]/[SO42−] axis in linear regression models was 2.311 during the whole studied period, indicating that nitrate formation by homogeneous reactions of HNO3 with NH3 became significant at [NH4+]/[SO42−] > 2.311. Thus, the “excess ammonium” were defined as [NH4+] excess = ([NH4+]/[SO42−] − 2.311) × [SO42−] for the whole studied periods, [NH4+] excess = ([NH4+]/[SO42−] − 3.162) × [SO42−] for haze episodes, and [NH4+] excess =([NH4+]/[SO42−] − 1.979) × [SO42−] for non-haze episodes.
The slope of 0.648 for the regression and the scattering of the data of the whole studied periods indicated that in PM2.5 there was approximately 35.2% excess ammonium bounded with such anions as Cl and HSO4. Consequently, the higher slope during haze suggest that there was large amount of nitrate and sulfate in particles during haze. During the whole sampling period and non-haze periods, the concentration of excess ammonium was < 0 and showed significantly linear correlation with nitrate, indicating the formation of nitrate was strongly associated with ammonium. Namely, the pathway of nitrate formation is through the homogenous reaction of NO2. While during haze pollution, the excess ammonium was above 0, implying that gas-phase of NO2 oxidation was decreased due to the low solar radiation and the heterogeneous formation of nitrate became conspicuous.

4. Conclusions

In this study, WSIIs, OC and EC in PM2.5 along with other pollutants were continuously observed based on online instruments at a suburban junction in Yangtze River Delta. The annual average of PM2.5 concentration was 59.8 ± 31.7 µg·m−3, 1.7 times higher than the Chinese National Ambient Air Quality Standards (CNAAQS) (35 µg·m−3). SNA (SO42−, NO3 and NH4+) was the most dominated species of PM2.5 total WSIIs, accounting for 51% of PM2.5. PM2.5 and all of its chemical species shared the same seasonal variations with higher concentration in winter and spring, lower in autumn and summer. The higher NO3/EC and NOR occurred in winter suggested that intensive secondary formation of nitrate contributed to the higher levels of PM2.5. Cluster analysis based on 72-h backward air trajectory showed that the air mass cluster from nearby inland cities, including Zhejiang, Anhui and Jiangxi Provinces contributed mostly to the total trajectories. Furtherly, PSCF analysis revealed that local sources, namely the emissions in the Yangtze River, were the primary sources. During haze pollution, NO3 was the most important fraction of PM2.5 and the heterogeneous formation of nitrate became conspicuous. The results indicated that the excess ammonium was above zero during the studied period and gas-phase homogeneous reaction between the ambient ammonia and nitric acid played an important role in nitrate formation during the studied period. All the results suggested that the anthropogenic emissions (such as traffic exhaust) was responsible for the relatively high level of PM2.5 at this monitoring station.

Author Contributions

Conceptualization, L.D. and L.Y.; methodology, L.D.; software, L.X.; writing—original draft preparation, L.D. and L.Y.; writing—review and editing, L.D. and G.X.; supervision, G.X.; project administration, L.D.; funding acquisition, L.D. All authors have read and agreed to the published version of the manuscript.

Funding

This publication was financially supported by the National Natural Science Foundation of China (No. 21906055), Postdoctoral Research Foundation of China (No. 2019M661411) and Key Laboratory of Eco-geochemistry, Ministry of Natural Resources (No. ZSDHJJ201902).

Acknowledgments

The authors thank the staffs from Shanghai Environmental Monitoring Center (SEMC) for helpful contribution to instrument maintenance and data collection.

Conflicts of Interest

The authors declare no conflict of interest.

References

  1. Zhao, M.; Huang, Z.; Qiao, T.; Zhang, Y.; Xiu, G.; Yu, J. Chemical characterization, the transport pathways and potential sources of PM2.5 in Shanghai: Seasonal variations. Atmos. Res. 2015, 158, 66–78. [Google Scholar] [CrossRef]
  2. Wang, J.; Hu, Z.; Chen, Y.; Chen, Z.; Xu, S. Contamination characteristics and possible sources of PM10 and PM2.5 in different functional areas of Shanghai, China. Atmos. Environ. 2013, 68, 221–229. [Google Scholar] [CrossRef]
  3. Liu, C.; Henderson, B.H.; Wang, D.; Yang, X.; Peng, Z.R. A land use regression application into assessing spatial variation of intra-urban fine particulate matter (PM2.5) and nitrogen dioxide (NO2) concentrations in City of Shanghai, China. Sci. Total Environ. 2016, 565, 607–615. [Google Scholar] [CrossRef] [PubMed]
  4. Makkonen, U.; Hellén, H.; Anttila, P.; Ferm, M. Size distribution and chemical composition of airborne particles in south-eastern Finland during different seasons and wildfire episodes in 2006. Sci. Total Environ. 2010, 408, 644–651. [Google Scholar] [CrossRef] [PubMed]
  5. Qiao, L.; Cai, J.; Wang, H.; Wang, W.; Zhou, M.; Lou, S.; Chen, R.; Dai, H.; Chen, C.; Kan, H. PM2.5 constituents and hospital emergency-room visits in Shanghai, China. Environ. Sci. Technol. 2014, 48, 10406–10414. [Google Scholar] [CrossRef] [PubMed]
  6. Salameh, D.; Detournay, A.; Pey, J.; Pérez, N.; Liguori, F.; Saraga, D.; Bove, M.C.; Brotto, P.; Cassola, F.; Massabò, D. PM2.5 chemical composition in five European Mediterranean cities: A 1-year study. Atmos. Res. 2015, 155, 102–117. [Google Scholar] [CrossRef]
  7. Zhang, F.; Cheng, H.R.; Wang, Z.W.; Lv, X.P.; Zhu, Z.M.; Zhang, G.; Wang, X.M. Fine particles (PM2.5) at a CAWNET background site in Central China: Chemical compositions, seasonal variations and regional pollution events. Atmos. Environ. 2014, 86, 193–202. [Google Scholar] [CrossRef]
  8. Tian, M.; Wang, H.B.; Chen, Y.; Yang, F.M.; Zhang, X.H.; Zou, Q.; Zhang, R.Q.; Ma, Y.L.; He, K.B. Characteristics of aerosol pollution during heavy haze events in Suzhou, China. Atmos. Chem. Phys. 2015, 16, 7357–7371. [Google Scholar] [CrossRef] [Green Version]
  9. Pathak, R.K.; Wu, W.S.; Wang, T. Summertime PM2.5 ionic species in four major cities of China: Nitrate formation in an ammonia-deficient atmosphere. Atmos. Chem. Phys. 2008, 9, 1711–1722. [Google Scholar] [CrossRef] [Green Version]
  10. Liu, X. Secondary formation of sulfate and nitrate during a haze episode in megacity Beijing, China. Aerosol Air Qual. Res. 2015, 15, 2246–2257. [Google Scholar] [CrossRef] [Green Version]
  11. Tian, M.; Wang, H.; Chen, Y.; Zhang, L.; Shi, G.; Liu, Y.; Yu, J.; Zhai, C.; Wang, J.; Yang, F. Highly time-resolved characterization of water-soluble inorganic ions in PM2.5 in a humid and acidic mega city in Sichuan Basin, China. Sci. Total Environ. 2016, 580, 224–234. [Google Scholar] [CrossRef] [PubMed]
  12. Khoder, M.I. Atmospheric conversion of sulfur dioxide to particulate sulfate and nitrogen dioxide to particulate nitrate and gaseous nitric acid in an urban area. Chemosphere 2002, 49, 675–684. [Google Scholar] [CrossRef]
  13. Russell, A.G.; Cass, G.R.; Seinfeld, J.H. On some aspects of nighttime atmospheric chemistry. Environ. Sci. Technol. 1986, 20, 1167–1172. [Google Scholar] [CrossRef]
  14. Pathak, R.K.; Wang, T.; Wu, W.S. Nighttime enhancement of PM2.5 nitrate in ammonia-poor atmospheric conditions in Beijing and Shanghai: Plausible contributions of heterogeneous hydrolysis of N2O5 and HNO3 partitioning. Atmos. Environ. 2011, 45, 1183–1191. [Google Scholar] [CrossRef]
  15. Chen, D.; Cui, H.; Zhao, Y.; Yin, L.; Lu, Y.; Wang, Q. A two-year study of carbonaceous aerosols in ambient PM2.5 at a regional background site for western Yangtze River Delta, China. Atmos. Res. 2016, 183, 351–361. [Google Scholar] [CrossRef]
  16. Wang, F.; Guo, Z.; Lin, T.; Rose, N.L. Seasonal variation of carbonaceous pollutants in PM2.5 at an urban ‘supersite’ in Shanghai, China. Chemosphere 2015, 146, 238. [Google Scholar] [CrossRef]
  17. Ding, X.; Kong, L.; Du, C.; Zhanzakova, A.; Lin, W.; Fu, H.; Chen, J.; Xin, Y.; Cheng, T. Long-range and regional transported size-resolved atmospheric aerosols during summertime in urban Shanghai. Sci. Total Environ. 2017, 583, 334–343. [Google Scholar] [CrossRef]
  18. Huang, Y.; Li, L.; Li, J.; Wang, X.; Chen, H.; Chen, J.; Yang, X.; Gross, D.S.; Wang, H.; Qiao, L.; et al. A case study of the highly time-resolved evolution of aerosol chemical and optical properties in urban Shanghai, China. Atmos. Chem. Phys. 2013, 13, 3931–3944. [Google Scholar] [CrossRef] [Green Version]
  19. Wang, Y.Q.; Zhang, X.Y.; Draxler, R.R. TrajStat: GIS-based software that uses various trajectory statistical analysis methods to identify potential sources from long-term air pollution measurement data. Environ. Model. Softw. 2009, 24, 938–939. [Google Scholar] [CrossRef]
  20. Zhang, R.; Jing, J.; Tao, J.; Hsu, S.C. Chemical characterization and source apportionment of PM2.5 in Beijing: Seasonal perspective. Atmos. Chem. Phys. Discuss. 2013, 13, 7053–7074. [Google Scholar] [CrossRef] [Green Version]
  21. Lian, D.; Wang, X.; Wang, D.; Duan, Y.; Na, C.; Xiu, G. Atmospheric mercury speciation in Shanghai, China. Sci. Total Environ. 2016, 578, 460–468. [Google Scholar]
  22. NOAA. Available online: ftp://arlftp.arlhq.noaa.gov/pub/archives/reanalysis (accessed on 24 July 2020).
  23. Polissar, A.V.; Hopke, P.K.; Paatero, P.; Kaufmann, Y.J.; Hall, D.K.; Bodhaine, B.A.; Dutton, E.G.; Harris, J.M. The aerosol at Barrow, Alaska: Long-term trends and source locations. Atmos. Environ. 1999, 33, 2441–2458. [Google Scholar] [CrossRef]
  24. Wang, P.; Cao, J.J.; Shen, Z.X.; Han, Y.M.; Lee, S.C.; Huang, Y.; Zhu, C.S.; Wang, Q.Y.; Xu, H.M.; Huang, R.J. Spatial and seasonal variations of PM2.5 mass and species during 2010 in Xi’an, China. Sci. Total Environ. 2015, 508, 477–487. [Google Scholar] [CrossRef] [PubMed]
  25. Zhou, J.; Xing, Z.; Deng, J.; Du, K. Characterizing and sourcing ambient PM2.5 over key emission regions in China I: Water-soluble ions and carbonaceous fractions. Atmos. Environ. 2016, 135, 20–30. [Google Scholar] [CrossRef]
  26. Wang, Y.; Jia, C.; Tao, J.; Zhang, L.; Liang, X.; Ma, J.; Gao, H.; Huang, T.; Zhang, K. Chemical characterization and source apportionment of PM2.5 in a semi-arid and petrochemical-industrialized city, Northwest China. Sci. Total Environ. 2016, 573, 1031–1040. [Google Scholar] [CrossRef]
  27. Lai, S.; Zhao, Y.; Ding, A.; Zhang, Y.; Song, T.; Zheng, J.; Ho, K.F.; Lee, S.C.; Zhong, L. Characterization of PM2.5 and the major chemical components during a 1-year campaign in rural Guangzhou, Southern China. Atmos. Res. 2016, 167, 208–215. [Google Scholar] [CrossRef]
  28. He, Q.; Yan, Y.; Guo, L.; Zhang, Y.; Zhang, G.; Wang, X. Characterization and source analysis of water-soluble inorganic ionic species in PM2.5 in Taiyuan city, China. Atmos. Res. 2017, 184, 48–55. [Google Scholar] [CrossRef]
  29. Saxena, M.; Sharma, A.; Sen, A.; Saxena, P.; Saraswati; Mandal, T.K.; Sharma, S.K.; Sharma, C. Water soluble inorganic species of PM10 and PM2.5 at an urban site of Delhi, India: Seasonal variability and sources. Atmos. Res. 2016, 184, 112–125. [Google Scholar] [CrossRef]
  30. Zhao, P.S.; Dong, F.; He, D.; Zhao, X.J.; Zhang, X.L.; Zhang, W.Z.; Yao, Q.; Liu, H.Y. Characteristics of concentrations and chemical compositions for PM2.5 in the region of Beijing, Tianjin, and Hebei, China. Atmos. Chem. Phys. 2013, 13, 4631–4644. [Google Scholar] [CrossRef] [Green Version]
  31. Tao, J.; Shen, Z.; Zhu, C.; Yue, J.; Cao, J.; Liu, S.; Zhu, L.; Zhang, R. Seasonal variations and chemical characteristics of sub-micrometer particles (PM1) in Guangzhou, China. Atmos. Res. 2012, 118, 222–231. [Google Scholar] [CrossRef]
  32. Liu, X.G.; Li, J.; Qu, Y.; Han, T.; Hou, L.; Gu, J.; Chen, C.; Yang, Y.; Liu, X.; Yang, T. Formation and evolution mechanism of regional haze: A case study in the megacity Beijing, China. Atmos. Chem. Phys. 2013, 13, 4501–4514. [Google Scholar] [CrossRef] [Green Version]
  33. Liu, B.; Song, N.; Dai, Q.; Mei, R.; Sui, B.; Bi, X.; Feng, Y. Chemical composition and source apportionment of ambient PM2.5 during the non-heating period in Taian, China. Atmos. Res. 2016, 170, 23–33. [Google Scholar] [CrossRef]
  34. Arimoto, R.; Duce, R.A.; Savoie, D.L.; Prospero, J.M.; Talbot, R.; Cullen, J.D.; Tomza, U.; Lewis, N.F.; Ray, B.J. Relationships among aerosol constituents from Asia and the North Pacific during PEM-West A. J. Geophys. Res. Atmos. 1996, 101, 2011–2023. [Google Scholar] [CrossRef]
  35. Chow, J.C.; Watson, J.G.; Lu, Z.; Lowenthal, D.H.; Frazier, C.A.; Solomon, P.A.; Thuillier, R.H.; Magliano, K. Descriptive analysis of PM2.5 and PM10 at regionally representative locations during SJVAQS/AUSPEX. Atmos. Environ. 1996, 30, 2079–2112. [Google Scholar] [CrossRef]
  36. Zheng, G.J.; Duan, F.K.; Su, H.; Ma, Y.L.; Cheng, Y.; Zheng, B.; Zhang, Q.; Huang, T.; Kimoto, T.; Chang, D. Exploring the severe winter haze in Beijing: The impact of synoptic weather, regional transport and heterogeneous reactions. Atmos. Chem. Phys. 2015, 15, 2969–2983. [Google Scholar] [CrossRef] [Green Version]
  37. Wang, Y.; Zhuang, G.; Tang, A. The ion chemistry and the source of PM2.5 aerosol in Beijing. Atmos. Environ. 2005, 39, 3771–3784. [Google Scholar] [CrossRef]
  38. Yue, D. Pollution properties of water-soluble secondary inorganic ions in atmospheric PM2.5 in the Pearl River Delta Region. Aerosol Air Qual. Res. 2015, 15, 1737–1747. [Google Scholar] [CrossRef] [Green Version]
  39. Wang, Y.; Zhuang, G.; An, S.Z. The variation of characteristics and formation mechanisms of aerosols in dust, haze, and clear days in Beijing. Atmos. Environ. 2006, 40, 6579–6591. [Google Scholar] [CrossRef]
  40. Zhao, X.J.; Zhao, P.S.; Xu, J.; Meng, W. Analysis of a winter regional haze event and its formation mechanism in the North China Plain. Atmos. Chem. Phys. 2013, 13, 5685–5696. [Google Scholar] [CrossRef] [Green Version]
  41. Sun, Y.; Zhuang, G.; Tang, A.; Wang, Y.; An, Z. Chemical characteristics of PM2.5 and PM10 in Haze—Fog Episodes in Beijing. Environ. Sci. Technol. 2006, 40, 3148–3155. [Google Scholar] [CrossRef]
  42. Sun, Y.; Wang, Z.; Fu, P.; Jiang, Q.; Yang, T.; Li, J.; Ge, X. The impact of relative humidity on aerosol composition and evolution processes during wintertime in Beijing, China. Atmos. Environ. 2013, 77, 927–934. [Google Scholar] [CrossRef]
Figure 1. Location of sampling site in Shanghai.
Atmosphere 11 00789 g001
Figure 2. Monthly variation of (a) major water–solute inorganic ions (WSIIs) percentages, (b) their concentrations and (c) carbonaceous species.
Atmosphere 11 00789 g002
Figure 3. Diurnal variations of chemical species in PM2.5, gaseous pollutants and temperature, RH (Relative Humidity) in four seasons. Notes: black—spring, red—summer, blue—autumn, green—winter.
Atmosphere 11 00789 g003
Figure 4. Seasonal variation of SO42−/EC, NO3/EC, SO2, NO2, SOR and NOR. In the plots, the box-and-whiskers indicate the 95th, 75th, 50th (median), 25th and 5th percentiles, respectively.
Atmosphere 11 00789 g004
Figure 5. Seventy-two-hour air mass backward trajectories during the sampling period.
Atmosphere 11 00789 g005
Figure 6. Source regions of PM2.5 from the potential source contribution function (PSCF) model in four seasons.
Atmosphere 11 00789 g006
Figure 7. Time series of (a) temperature (T) and RH, (b) PM2.5 and O3, (c) NO2, SO2 and NO2/SO2 ratio, (d) NOR and SOR, (e) ions and visibility at sampling siten during 10–16 December 2015.
Atmosphere 11 00789 g007
Figure 8. NO3/SO42− ratio, NO2/SO2 ratio, NOR and NOR/SOR ratio at different range of PM2.5.
Atmosphere 11 00789 g008
Figure 9. Linear regressions of [NH4+]/[SO42−] to [NO3]/[SO42−] during (a) whole studied periods, (c) haze periods and (e)non-haze periods and the linear relationship of [NO3] to [NH4+] excess during (b) the whole studied periods, (d) haze periods and (f) non-haze periods.
Atmosphere 11 00789 g009
Table 1. Concentrations of fine particulate matter (PM2.5) and its major chemical compositions (mean concentrations ± standard deviation (SD)) for four seasons (µg·m−3).
AnnualSpringSummerAutumnWinter
Na+0.31 ± 0.150.32 ± 0.160.26 ± 0.140.31 ± 0.090.34 ± 0.12
K+1.07 ± 1.020.454 ± 0.2870.740 ± 0.4021.51 ± 0.391.59 ± 1.68
NH4+8.59 ± 5.318.58 ± 4.436.87 ± 4.207.94 ± 4.2210.9 ± 7.03
Cl1.52 ± 1.161.58 ± 1.020.64 ± 0.371.34 ± 0.812.49 ± 1.34
NO311.2 ± 8.0111.3 ± 6.668.47 ± 6.459.53 ± 6.0915.53 ± 10.29
SO42−9.92 ± 5.479.49 ± 4.479.74 ± 6.299.67 ± 4.8310.76 ± 6.06
WSIIs32.62 ± 18.6831.73 ± 15.0926.68 ± 16.5430.33 ± 14.8241.62 ± 23.85
OC6.22 ± 3.125.58 ± 2.495.34 ± 2.565.91 ± 2.707.87 ± 4.01
EC2.59 ± 1.442.37 ± 1.192.00 ± 0.892.73 ± 1.423.14 ± 1.81
PM2.559.82 ± 31.6858.56 ± 24.7848.54 ± 23.5655.89 ± 25.8475.73 ± 42.53
Table 2. Percentages and mean concentrations of PM2.5 and its major chemical compositions (µg·m−3) from each trajectory cluster.
Cluster 1Cluster 2Cluster 3Cluster 4
Percentage (%)30.3321.1835.9012.59
Na+0.320.300.270.35
K+1.101.050.851.60
NH4+10.847.916.988.97
Cl1.581.841.052.10
NO314.5310.128.3413.22
SO42−11.88.989.179.21
OC7.465.874.717.50
EC3.102.252.123.12
PM2.574.8255.8446.5166.81

