Article

Climate Change and the Future Heat Stress Challenges among Smallholder Farmers in East Africa

by
Genesis Tambang Yengoh
1,* and
Jonas Ardö
2
1
Lund University Centre for Sustainability Studies—LUCSUS, Lund University, Biskopsgatan 5, SE 223 62 Lund, Sweden
2
Department of Physical Geography and Ecosystem Science, Lund University, Sölvegatan 12, SE 223 62 Lund, Sweden
*
Author to whom correspondence should be addressed.
Atmosphere 2020, 11(7), 753; https://doi.org/10.3390/atmos11070753
Submission received: 26 May 2020 / Revised: 13 July 2020 / Accepted: 13 July 2020 / Published: 16 July 2020
(This article belongs to the Special Issue Plant Adaptation to Global Climate Change)

Abstract

:
Agricultural production in sub-Saharan Africa remains dependent on high inputs of human labor, a situation associated with direct exposure to daylight heat during critical periods of the agricultural calendar. We ask the question: how is the Wet-Bulb Globe Temperature (WBGT) going to be distributed in the future, and how will this affect the ability of smallholder farmers to perform agricultural activities? Data from general circulation models are used to estimate the distribution of WBGT in 2000, 2050 and 2100, and for high activity periods in the agricultural calendar. The distribution of WBGT is divided into recommended maximum WBGT exposure levels (°C) at different work intensities, and rest/work ratios for an average acclimatized worker wearing light clothing (ISO, 18). High WBGTs are observed during the two periods of the East African. In February to March, eastern and coastal regions of Kenya and Tanzania witness high WBGT values—some necessitating up to 75% rest/hour work intensities in 2050 and 2100. In August to September, eastern and northern Kenya and north and central Uganda are vulnerable to high WBGT values. Designing policies to address this key challenge is a critical element in adaptation methods to address the impact of climate change.

1. Introduction

Climate change is already adversely affecting the health of populations around the world, with the greatest impacts in low-income countries [1,2]. As a result of climate change, mean annual temperatures and the intensity and frequency of heat waves are expected to increase [3]. An increase in average temperatures, as well as the frequency, duration, and intensity of heat waves, has already been reported in some regions, with significant adverse impacts on local economies, agriculture, water resources and public health [1,4,5,6]. Scenario-based projections forecast that average global surface temperatures will increase by 1.4 to 5.8 °C from 1990 to 2100 [7]. This is bound to have substantial implications for human health, with the potential of contributing to an increase in future heat-related morbidity and mortality [1,8,9,10]. This study sought posits that Wet Bulb Globe Temperature (WBGT) (the concept of Wet Bulb Globe Temperature (WBGT) is further defined and operationalized in the ‘Methods’ section of this paper) in East African croplands in 2000 remains unchanged in 2050 and in 2100. The heat-related human health impacts of climate change are therefore expected to become more widespread and profound in the future. The future health impacts of climate change will vary spatially and temporally and will depend on changing socioeconomic and environmental conditions, as well as the preparedness of communities and health systems to avoid preventable health outcomes. Populations that are particular vulnerable to heat-related conditions include the elderly, children, the chronically ill, the socially isolated, and at-risk occupational groups. Some experts see climate change as “the biggest global health threat of the 21st century” [11].
Research on the impact of climate change on agriculture in Africa has expanded in some fields. These include studies on the impact of severe events associated with a changing climate, on the implications of changes in precipitation amounts and frequencies on cropping cycles, yields, and production [12,13,14,15]. Efforts have also been made to understand the implication of rising sea levels on agriculture in coastal regions, the role of climate change in the distribution of agricultural pests, and outcomes for animal production, including fisheries [16,17,18,19]. Changes in production systems and the spatial distribution of resources that support agricultural production are bound to have implications on social and economic systems dependent on or supported by agriculture [20]. This dimension of climate change impacts has also been widely investigated.
Data on the human element of climate change impacts, especially regarding labor for agricultural production, remain scarce, and our understanding of implications of the impact of climate change on the ability to work in labor-driven economic systems (such as agriculture) remains scarce. Initiatives have been undertaken to understand the implications of climate change on increasing heat impacts on labor productivity [2,21,22]. Kjellström et al. focused on estimating populations exposed to heat stress resulting from climate change [1]. Others have assessed human productivity under conditions of heat stress [6], and compared heat stress and its impacts on the health of workers from different occupational sectors [10].
The potential health impacts of climate change can be relieved through a combination of strategies, including strengthening key health system functions and improving the management of associated risks. To achieve robust health systems and manage human health risks, there is a need for a better understanding of the geography and scale of its potential impacts, especially impacts associated with the most common economic activities of populations.
In this study, we seek to examine whether environmental determinants of heat stress in the croplands of East Africa vary between the periods 2000–2100. East Africa is a diverse environment, with elevations rising from sea level to 5825 m above sea level, and a variety of agroecological zones (Figure 1). This study focuses on three countries of this region: Kenya, Tanzania, and Uganda. Together, these three countries comprise a total land area of over 1.6 million Km2—Kenya (569,140 Km2); Uganda (200,523 Km2); and Tanzania (885,800 Km2). To put in perspective the combined land area of the study area is larger than that of western Europe at 1.4 million Km2 [23].
This study sought to assess the hypothesis that Wet Bulb Globe Temperature (WBGT) (the concept of Wet Bulb Globe Temperature (WBGT) is further defined and operationalized in the ‘Methods’ section of this paper) in East African croplands in 2000 remains unchanged in 2050 and in 2100. This study therefore contributes to assessing the geographical distribution of heat stress. We attempt to associate the geographical distribution of this challenge with the most important economic activity in East Africa, i.e., agriculture. By so doing, we examine the spatial distribution of heat stress, as a current and future challenge to agricultural productivity in East Africa. This initiative constitutes to strengthening the case for planning and investment in health protection within the context of climate change challenges.

1.1. Heat Waves and Heat Stress

Until recently, the severity of heat waves has been largely ignored. The Intergovernmental Panel on Climate Change (IPCC) now emphasizes the risk of drastically increasing incidences of heat waves with severe consequences for human health, livelihoods, agriculture, ecosystems, and societies at large [24]. The IPCC special report on extreme events, Risks of Extreme Events and Disasters to Advance Climate Change Adaptation (SREX), concluded that the length or number of heat waves have increased in many parts of the world and will virtually certainly increase further in the 21st century. Under a medium warming scenario, Coumou, Robinson [25] used a global 2 × 2° grid with roughly 12,500 grid points with monthly data and predicted the number of monthly heat records to be over 12 times more common by the 2040s. This equates, on average, to roughly one record-breaking warm month per year in the tropics, including East Africa. A recent report estimated that mortality in Europe due to heat waves would increase by over 5550% by 2100 in a medium warming scenario [26]. If the global mean temperature increases to +7 °C or more, the habitability of large parts of the tropics and mid-latitudes will be at risk [27].

1.2. Impacts of Heat on Human Health

Excessive heat exposure affects natural and human systems, directly and indirectly, often resulting in severe losses of lives, assets and resources, and even social unrest, and may trigger tipping points in both natural and social systems [1,6,22,28,29]. Even if knowledge of climate change impacts on health has increased markedly in the last decade, research has mainly focused on direct physical rather than indirect mental health impacts. The physical impacts include: (1) mortality and morbidity from extreme weather events; (2) physical health impacts of extreme heat stress and heat waves; an increased intensity and spread of vector-borne disease; (3) effects of air quality on respiratory disorders; climate-induced changes in food and water quality and availability; (4) impacts on hygiene as effects of changed access to water [30]. When subject to heat stress, our cognitive ability is affected. These cognitive tasks may involve decision making, problem solving, memory, attention and judgement. Numerous studies have investigated the impact of heat stress on cognition-related outcomes [31], including performance responses and protective strategies [32], and even its outcomes on labor productivity and the economic implications [33]. Table 1 shows the conditions and symptoms of some common heat-related illnesses. Individuals show varying adaptive and maladaptive responses [34]. Heat stroke is another serious direct impact of heat stress. The role of contributing factors and the pathway to heat stroke from occupational heat stress has been mapped by Seichi Horie [35]. A combination of strenuous physical activity, a hot and humid atmosphere, continuous work without rest, and the use of inappropriate clothing for the heat environment such as some protective clothes and masks as the main contributing factors to elevated body temperatures. This can lead to a reduction of sodium concentration in the blood and dehydration. Elevated body temperature can also cause circulatory disturbance from cutaneous vasodilation, as well as cause elevated brain temperatures. These together have the potential of contributing to heat stroke characterized by symptoms such as heat cramps, muscle weakness, nausea, oliguria, fainting, headaches and high body temperatures [35]. Poverty may act as a barrier preventing adaptive behavior if poor people dependent on outdoor hard physical work consider resting. In a review of barriers to climate change adaptation among natural resource-dependent communities and livelihoods, financial constraints on agricultural production and rural development was identified as a major factor [36]. The inability to afford alternative means of production limits the potential for smallholder communities to easily change from current production practices to practices that limit their exposure to high WBGT.

1.3. Impacts of Heat on Society

The economic effects of heat stress are huge, primarily regarding lower labor productivity [2], higher demands on health care, and increasing welfare costs. In all countries, heat stress is associated with social consequences, such as increasing violence, emotional problems and low life satisfaction including various secondary social stressors [24]. Impacts are highly differential with disproportionate burdens on people (often women and children) who toil daily under a scorching sun [24]. Small-scale farmers and fisher folks are particularly exposed to high temperatures and are already reporting excessive heat as a major burden [24]. From a livelihood perspective, food production is a particular concern. Since around 2010, knowledge about the sensitivity of crops to extreme heat has increased substantially, showing that heat stress is a major reason for productivity declines and crop failures, particularly in the tropics. For tropical systems where moisture availability or extreme heat will limit the length of the growing season, it is likely that the growing season and overall suitability for crops will decline due to heat stress. By 2050, most African countries will experience temperatures—over at least half of their current crop area—that lie outside the currently experienced range. As a further threat to small-scale farming, heat stress affects the health and productivity of livestock in meat and dairy production. As the most predictable, widespread and severe climate change impact on human societies, heat stress is already affecting, directly and indirectly, millions of people every year—and that the situation will get increasingly worse is ‘virtually certain’ according to the IPCC [24].

2. Smallholder Farmers and the Climate Change Context

The definition of smallholder farmers varies across geographies, agroecological zones, and even contexts. More holistic definitions incorporate elements of farm size, education level, knowledge of farming practices, land tenure situation, household demographics, and farming assets (which include access to financial resources, and technologies). Generally, however, smallholders tend to be defined based on the size of their farm holdings and levels of technology integration in the practice of agriculture. In sub-Saharan Africa, farmers operating less than 2 hectares of cropland are commonly categorized as smallholders [37,38]. Data on the distribution of farmland sizes and factors associated have been analyzed in a recent FAO/UNCTAD study [38]. In Ethiopia and Egypt, farms with an area of 2 hectares or less constitute nearly 90% of all farms. While in Kenya, if the classification of smallholders is taken to be those farmers with farmlands of 2 hectares or less is applied, it will cover nearly the entire land. In Tanzania, it will account for nearly 80% of all farms [38]. The focus on smallholder farmers is important because this group of agricultural producers makes up the vast majority of actors in the food production sector in the developing world [39]. An estimated two-thirds of the developing world’s 3 billion rural people live in about 475 million smallholder farming households, working on land plots smaller than 2 hectares. Kenyan and Tanzanian smallholder farmers produce 63% and 69% of the food in the country, respectively [38].
Land management systems of smallholder agriculturalists rely heavily on human (often, family) labor [38]. Manual labor is a key feature of activities such as farm clearing, tillage, planting, weeding, harvesting, as well as traditional processing or farm products. The use of machinery or other labor-saving technologies is minimal [40]. Smallholder agriculture is therefore characterized by high labor inputs [41].
Agricultural practices among smallholder farmers in most of sub-Saharan Africa puts most agriculturalists under the category of outdoor workers. Outdoor workers refer to any workers who spend a substantial portion of the shift outdoors. For these groups of workers, their sources of heat exposure and potential for overheating can come in two ways:
  • The environmental conditions in which they work: most of which are already very warm in many parts of sub-Saharan Africa.
  • The internal heat generated by physical labor: smallholder farming practices depend heavily on manual labor for many strenuous farming activities, such as farm preparation, planting, weeding, harvesting, etc. Levels of technology use in agriculture remain very low.
Heat-related illnesses occur when the body is not able to lose enough heat to balance the heat generated by physical work and external heat sources. Weather conditions are the primary external heat sources for outdoor workers. Smallholder agricultural workers in sub-Saharan Africa are therefore at risk of heat-related illness when the heat index (WBGT) is high.
Four main on-farm activities substantially expose smallholder farmers in our study region to outdoor heat stress. These include (1) farm preparation, which involves clearing, tilling, and the preparation of planting surfaces (mounds or ridges); (2) planting; (3) farm maintenance (weeding); and (4) harvesting [42]. The maize production calendar is taken as a crop of choice for this study because of the importance of maize in the agricultural and food system in the East African region. The maize-mix farming system is the most important food production system in Eastern Africa [38].

2.1. Farm Preparation

Farm preparation is a dominantly manual activity for smallholder farmers in sub-Saharan Africa. In 2006, for example, human muscle power accounted for 65% of the energy used for land preparation in sub-Saharan Africa [43]. This is compared to 40% in East Asia, 30% in South Asia, and 25% in Latin America and the Caribbean [43]. Manual clearing involves the shearing of trees and bush vegetation with a cutting blade for new or fallowed land. In continuously cultivated land, it involves cutting of grasses that have colonized the farmland since the last cropping season. In some cases, the burning of vegetation is used as a means of clearing the land [44]. Tilling refers to turning the soil over so some of the lower soil comes up and some of the upper soil goes down aerating is and, in some cases, burying plant material that will eventually decompose in the process. Manual tilling is still a dominant agricultural practice among most smallholder farmers in sub-Saharan Africa [45]. A hoe with a large blade is the universal tool for tilling, even though there are variations in the design of this tool preferred in different agroecological zones [45]. Tilling and planting are done at the same time. Preparation of mounds or ridges is sometimes done during the tilling process. In more fertile farmlands, farmers may decide to eliminate the use of mounds and ridges altogether. The preparation of the planting surface (mounds and ridges) has been a well-established practice in the agricultural history of East Africa [46,47]. C.G. Knight observed the system of “nkule” in Tanzania in 1980 [48]. Planted crops take advantage of the take advantage of the nutrients provided by decomposing grass under the mounds and released by the process of burning [48]. In Zambia, these ridging systems are referred to as “ibala” [49], and as “ankara” in the North West Region of Cameroon. Common tools used for land preparation include hoes; machete; axes; forks; rakes; spades; grass hooks.

2.2. Planting

Planting for most crops is not done according to precisely measured distances; rather, it is based on estimates of required distances between crops. With a heavy reliance on manual labor, there is little need for adherence to precise measurements and geometrical patterns during most farming practices (including planting). Maize may be planted on mounds, ridges, or on flat, tilled, or untilled fields. Common tools used for planting are dibbers, hoes, and machetes. Better-off farmers occasionally make use of semi-mechanized tools such as jab planters, push-pull seed drills, and manual rotary injection planters [50].

2.3. Weeding

Manual weeding is another backbreaking work intensity in smallholder farming practice. Most weeding is done with the hands and hoe. Weeds are pulled out with the hands while the hoe is used to till and soften the soil, as well as to cover the dislodged vegetation with soil to ease the process of decomposition. As with tilling, the preparation of ridges and planting, the worker undertakes this process in the crouched position as he/she moves from one row to another.

2.4. Harvesting

As with other activities, harvesting is a manual activity for the smallholder farmer. The process of harvesting maize usually involves plucking the maize cob from the standing plant, collecting the harvested crop and transporting the harvested crop. The problem of transportation of harvested produce stems chiefly from the poor development of roads in rural sub-Saharan Africa [51]. This, together with the limited resources of smallholder farmers to afford the high transportation costs makes the arduous task of transportation a practice that relies heavily on human muscle power. The use of human muscle power limits the amount of crop that can be transported per person and trip. This means that smallholder farmers require more trips to transport their crops. Hence, smallholder farmers would be exposed to potential heat stress during the process of harvesting and the transportation of crops.

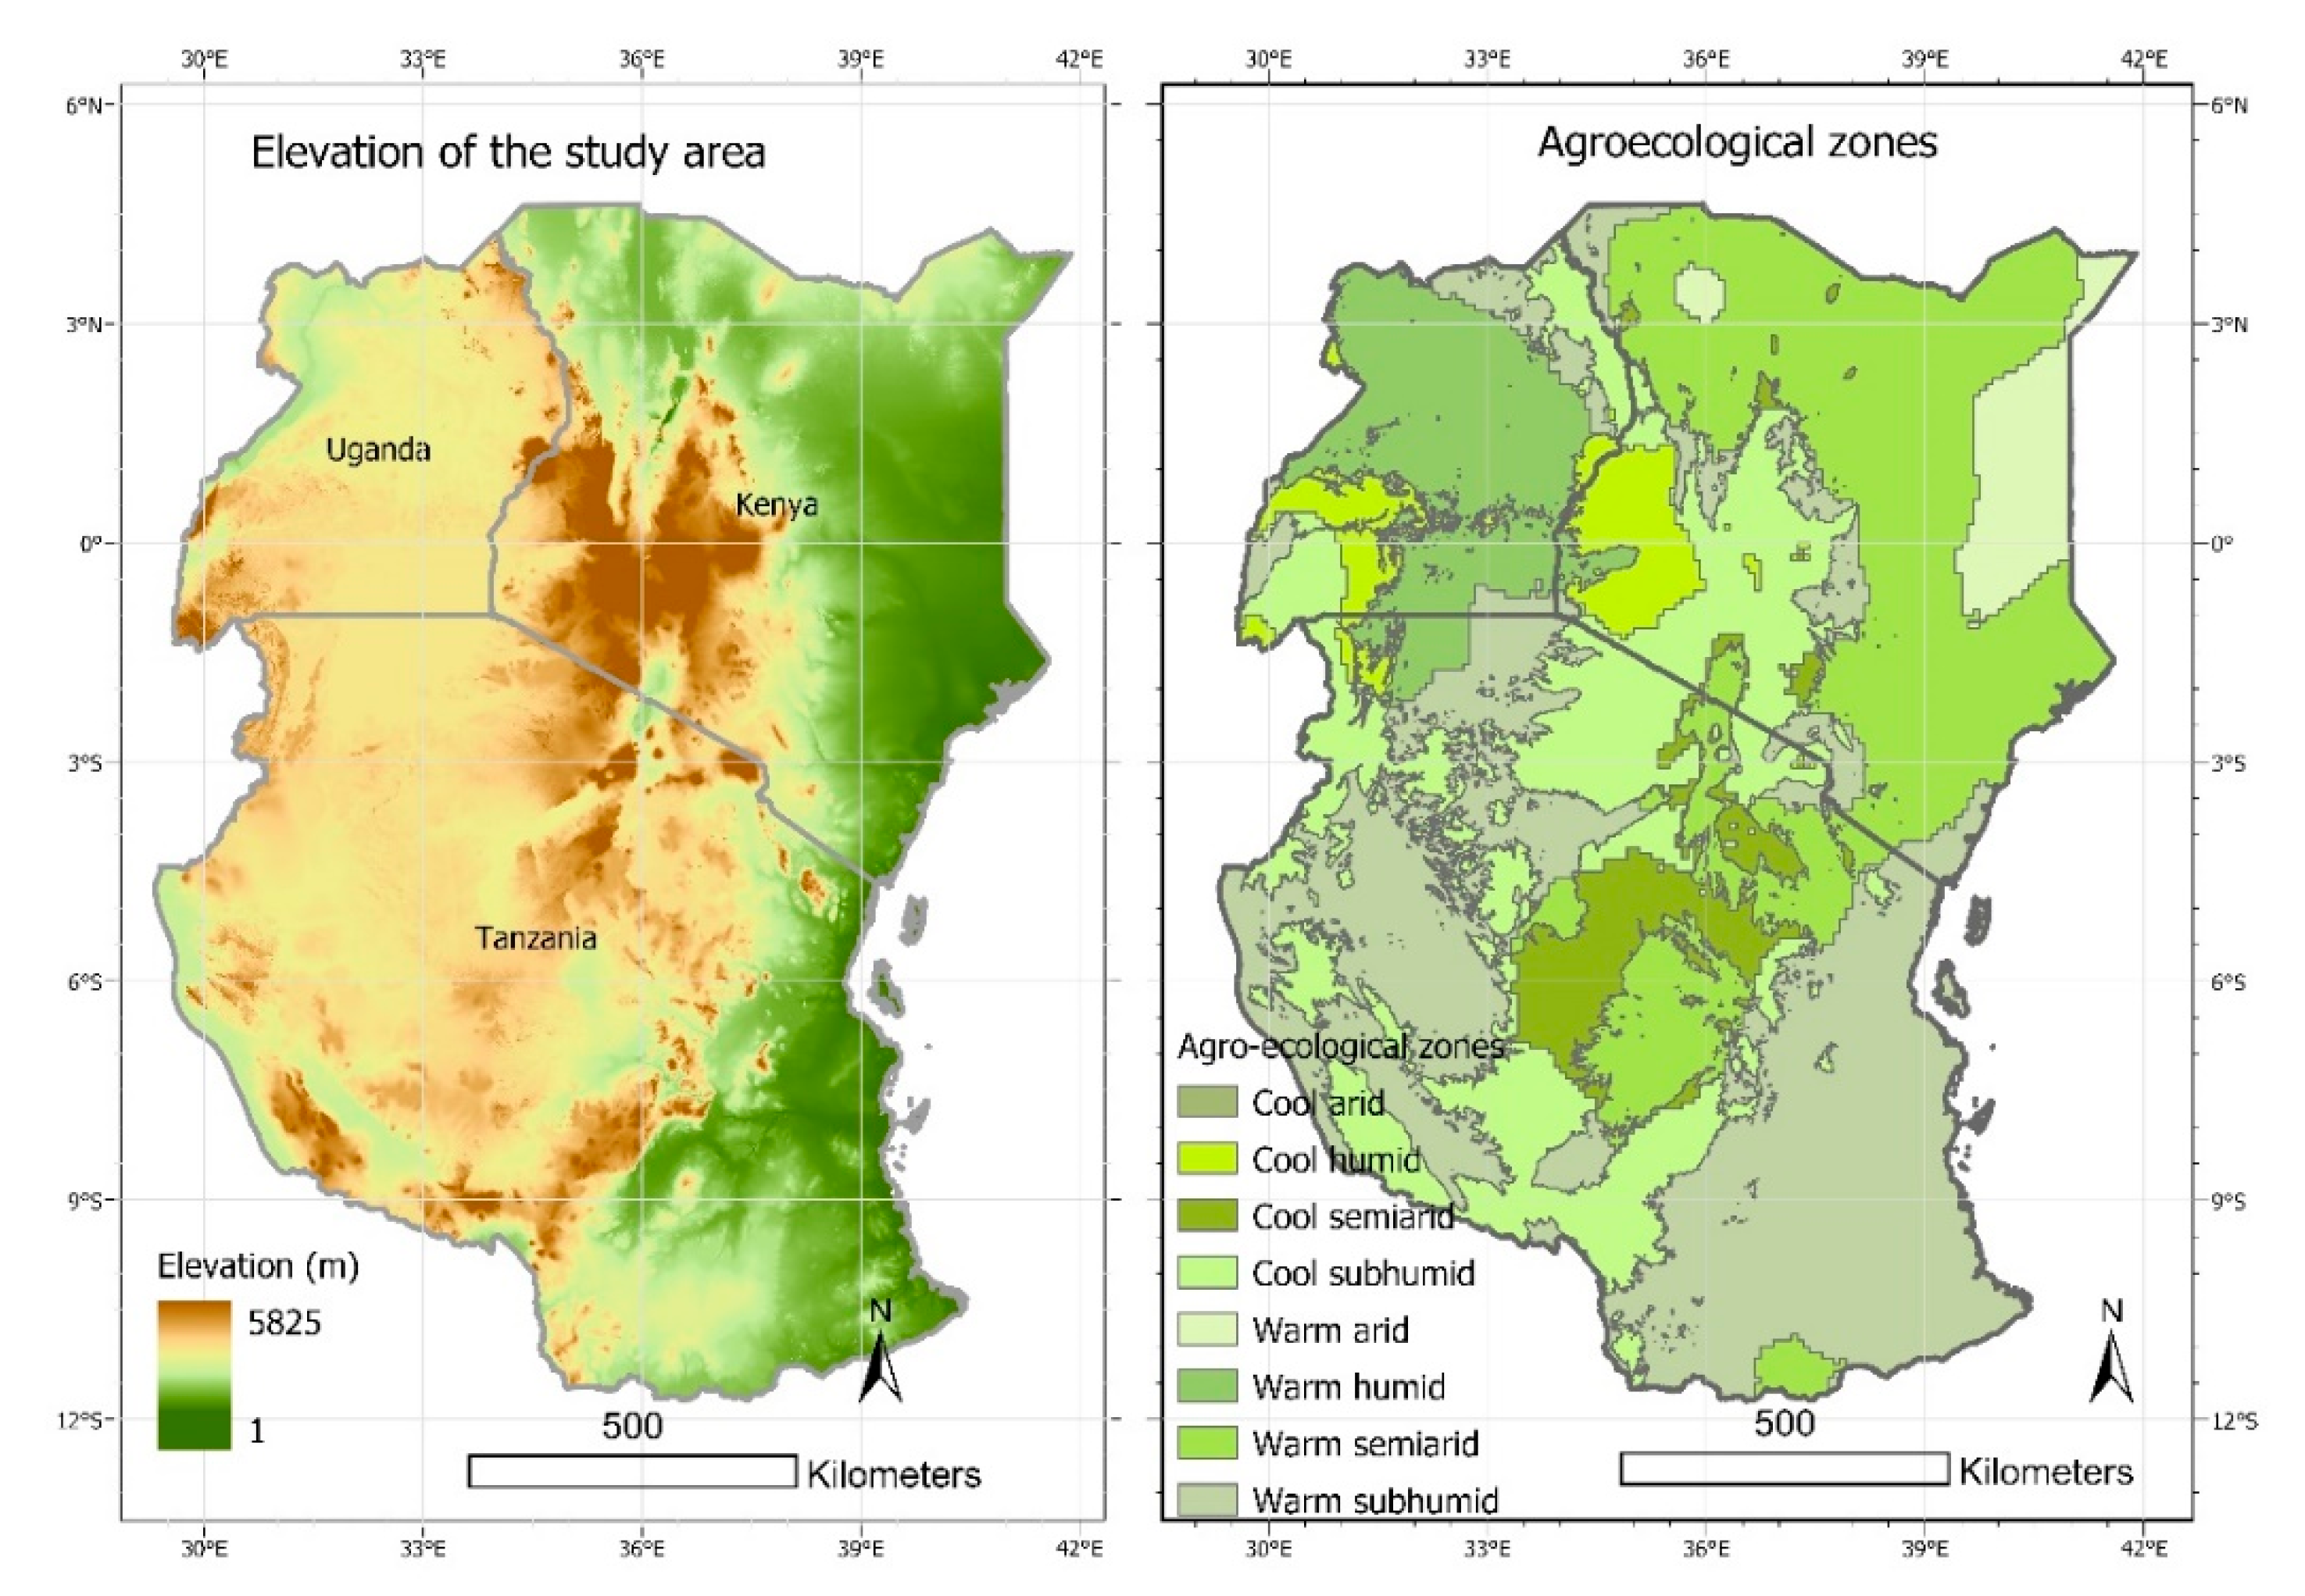
3. Materials and Methods

3.1. Wet Bulb Globe Temperature

Wet Bulb Globe Temperature (WBGT) is the most common index used for assessing heat stress in occupational health. It was developed by the US Army two decades ago [52,53] to guide military and civilian health care providers and allied medical personnel on understanding, identifying and managing heat stress among troops. Early studies investigated total heat stress imposed on military personnel in three camps by physical training, temperature, radiation, humidity and wind [54]. This index considers air temperature, radiant temperature, humidity and air movement, and is the reference for time limitations of work under different heat exposure conditions (Table 2).

3.2. Meteorological Data

Meteorological data for the year 2000, 2050 and 2100 were downloaded from the Earth System Grid Federation repository (https://esg-dn1.nsc.liu.se/) and used for the calculation of WBGT. This data originates from CORDEX—Coordinated Regional Climate Downscaling Experiment, http://www.cordex.org/ [55]. The data have a spatial resolution of 0.44 x 0.44 degrees latitude/longitude and 3h temporal resolution.
Near-surface relative humidity (RH,%), surface down welling shortwave radiation (Rs, W m−2) and surface air temperature (Ta, °C) at 2 m were derived from historical and RCP4.5 simulations with the Second Generation Canadian Center for Climate Modelling and Analysis Earth System Model (CanESM2) [56] (Data ID’s listed in Appendix A). RCP 4.5 was selected as a reasonable lower range scenario with peaking emissions around 2040—a middle scenario among the available ones (RCP2.6, RCP4.5, RCP6, and RCP8.5).

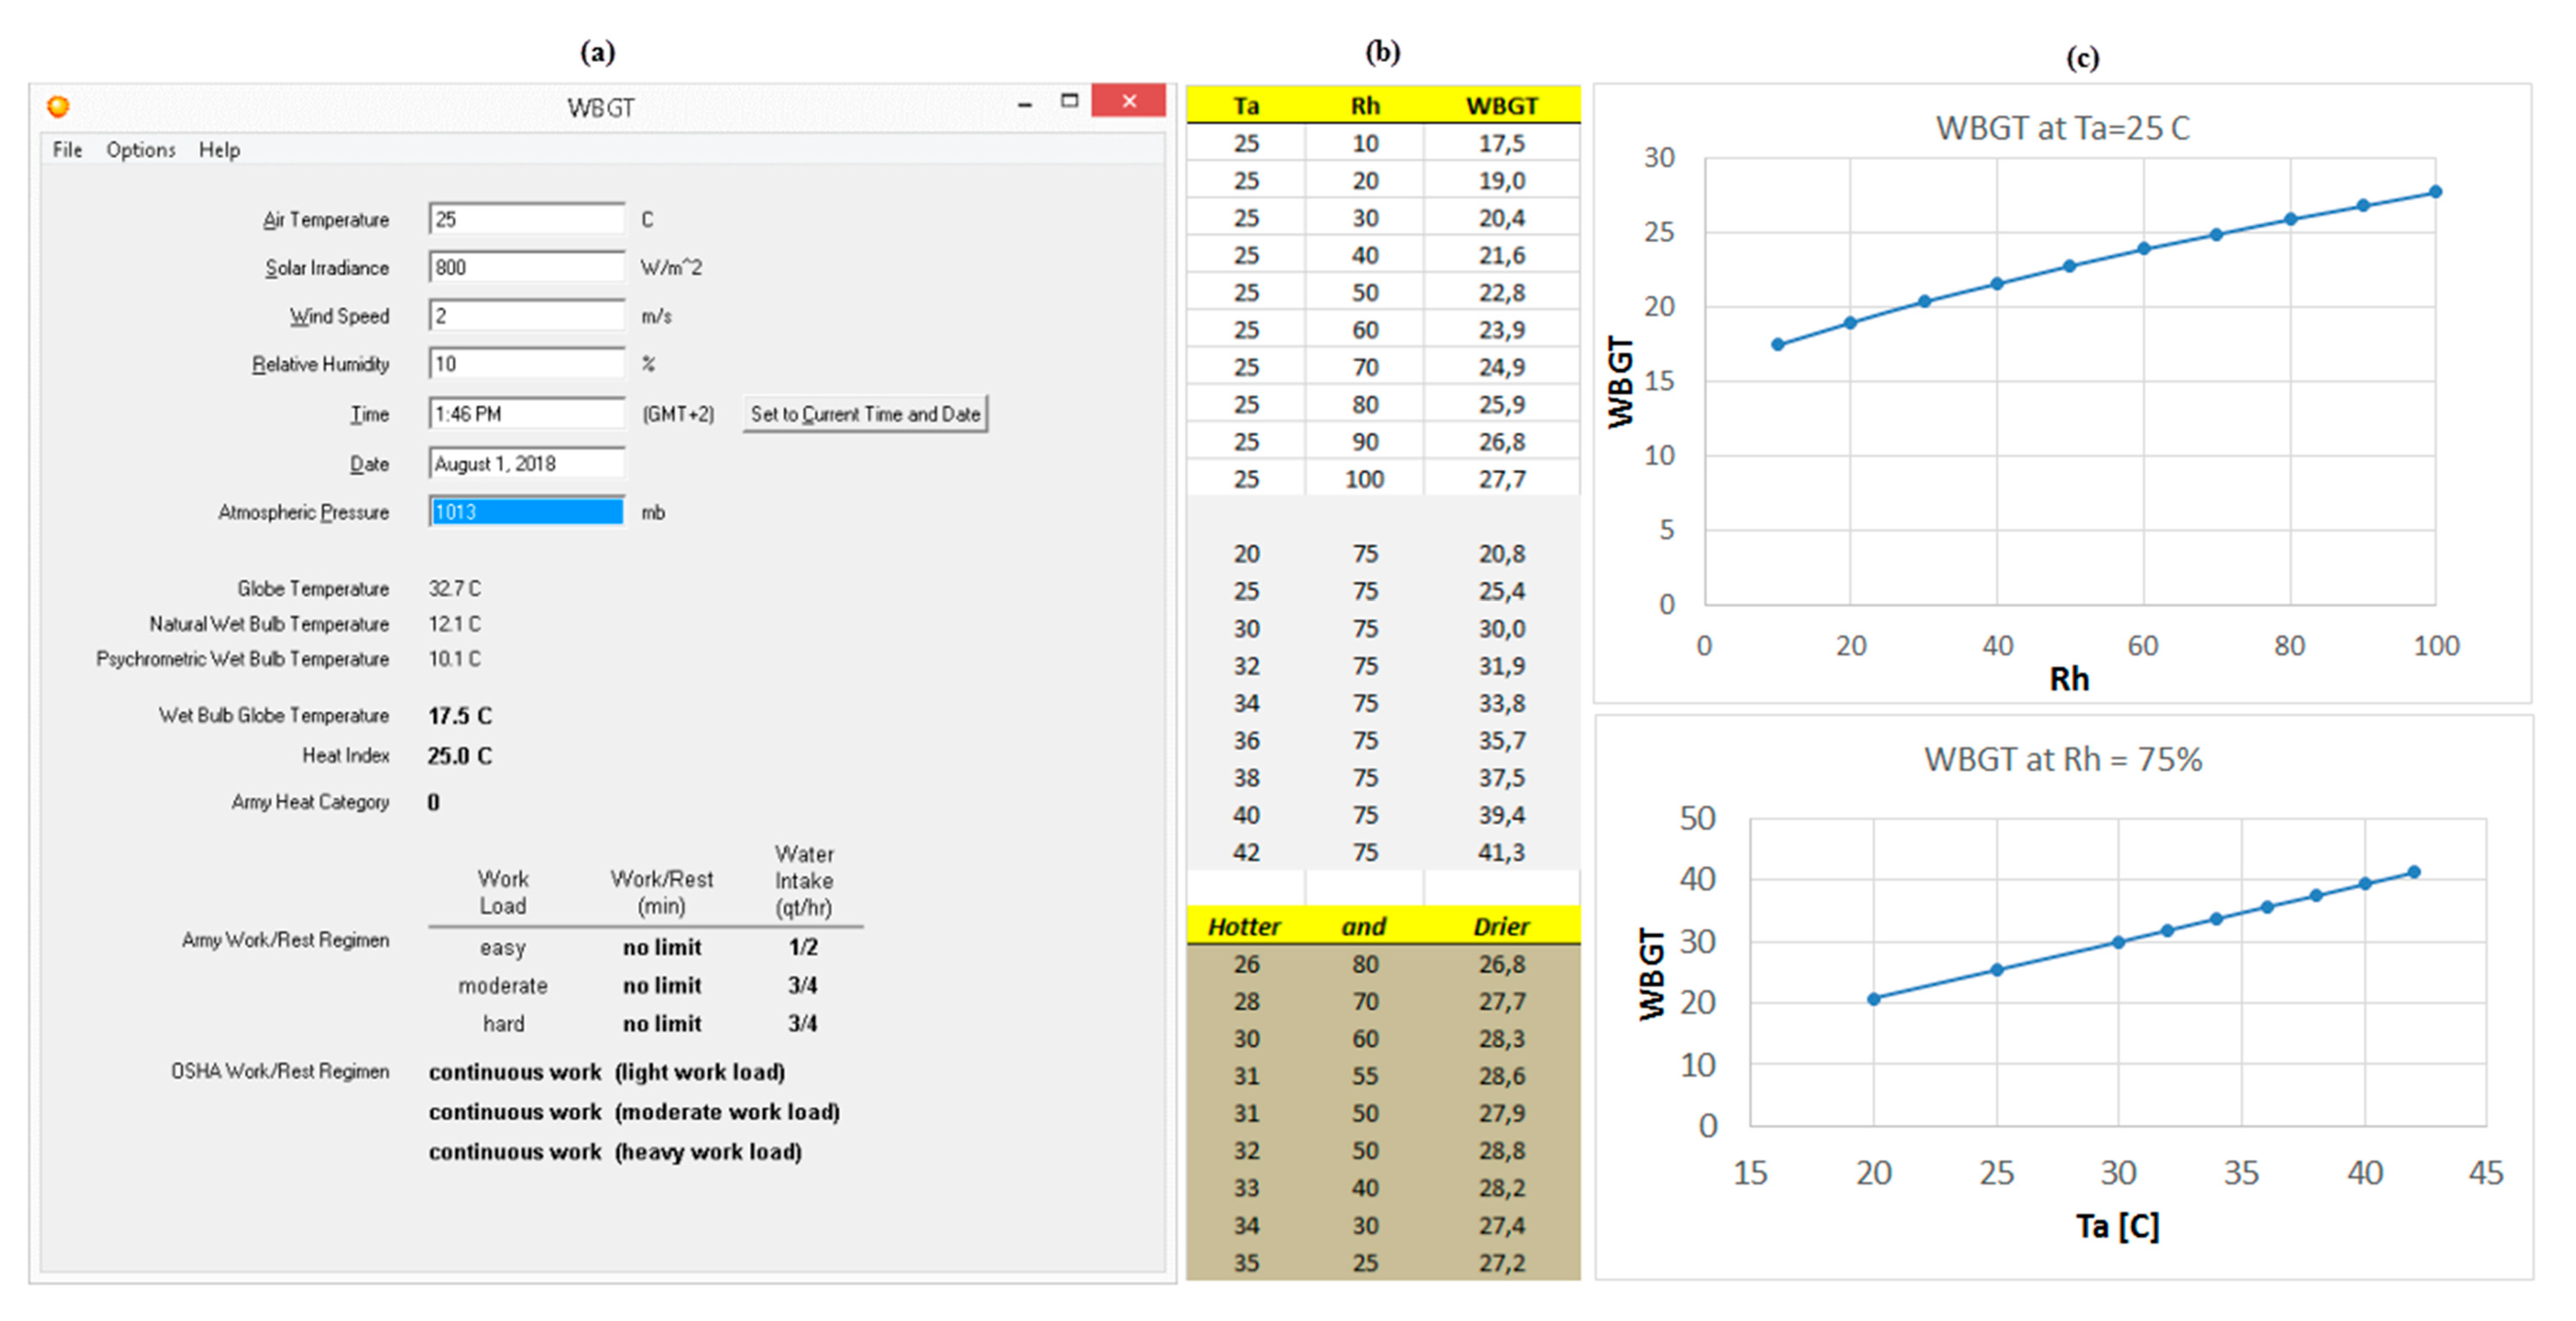
3.3. Calculation of WBGT

To compute WBGT, we used the Natural wet-bulb temperature (combined with dry-bulb temperature indicates humidity, Tw); the Globe thermometer temperature (measured with a globe thermometer, also known as a black globe thermometer, Tg); and the Dry-bulb temperature (actual air temperature, Td).
WBGT = 0.7Tw + 0.2Tg + 0.1Td
where:
  • Tw = natural wet-bulb temperature (combined with dry-bulb temperature indicates humidity, °C);
  • Tg = globe thermometer temperature (measured with a globe thermometer, also known as a black globe thermometer, °C);
  • Td = dry-bulb temperature (actual air temperature, °C).
We calculated Tg according to Hajizadeh et al. [57] as:
Tg = 0.01498 ∗ Rs + 1.184 ∗ Ta − 0.0789 ∗ RH − 2.739
Tw was calculated according to Stull [58] (see units and abbreviations above):
Ta ∗ atan(0.151977 ∗ (RH + 8.313659)0.5) + atan(Ta + RH) − atan(RH-1.676331) +
0.00391838 ∗ (RH)^1.5 ∗ atan(0.023101 ∗ RH) − 4.686035
For each day during the planting period (February–March) and the harvest period (August–September), the maximum WBGT was calculated and used for further analysis. This resulted in about 60 daily maximum WBGT values per grid cell that were further used for analysis.

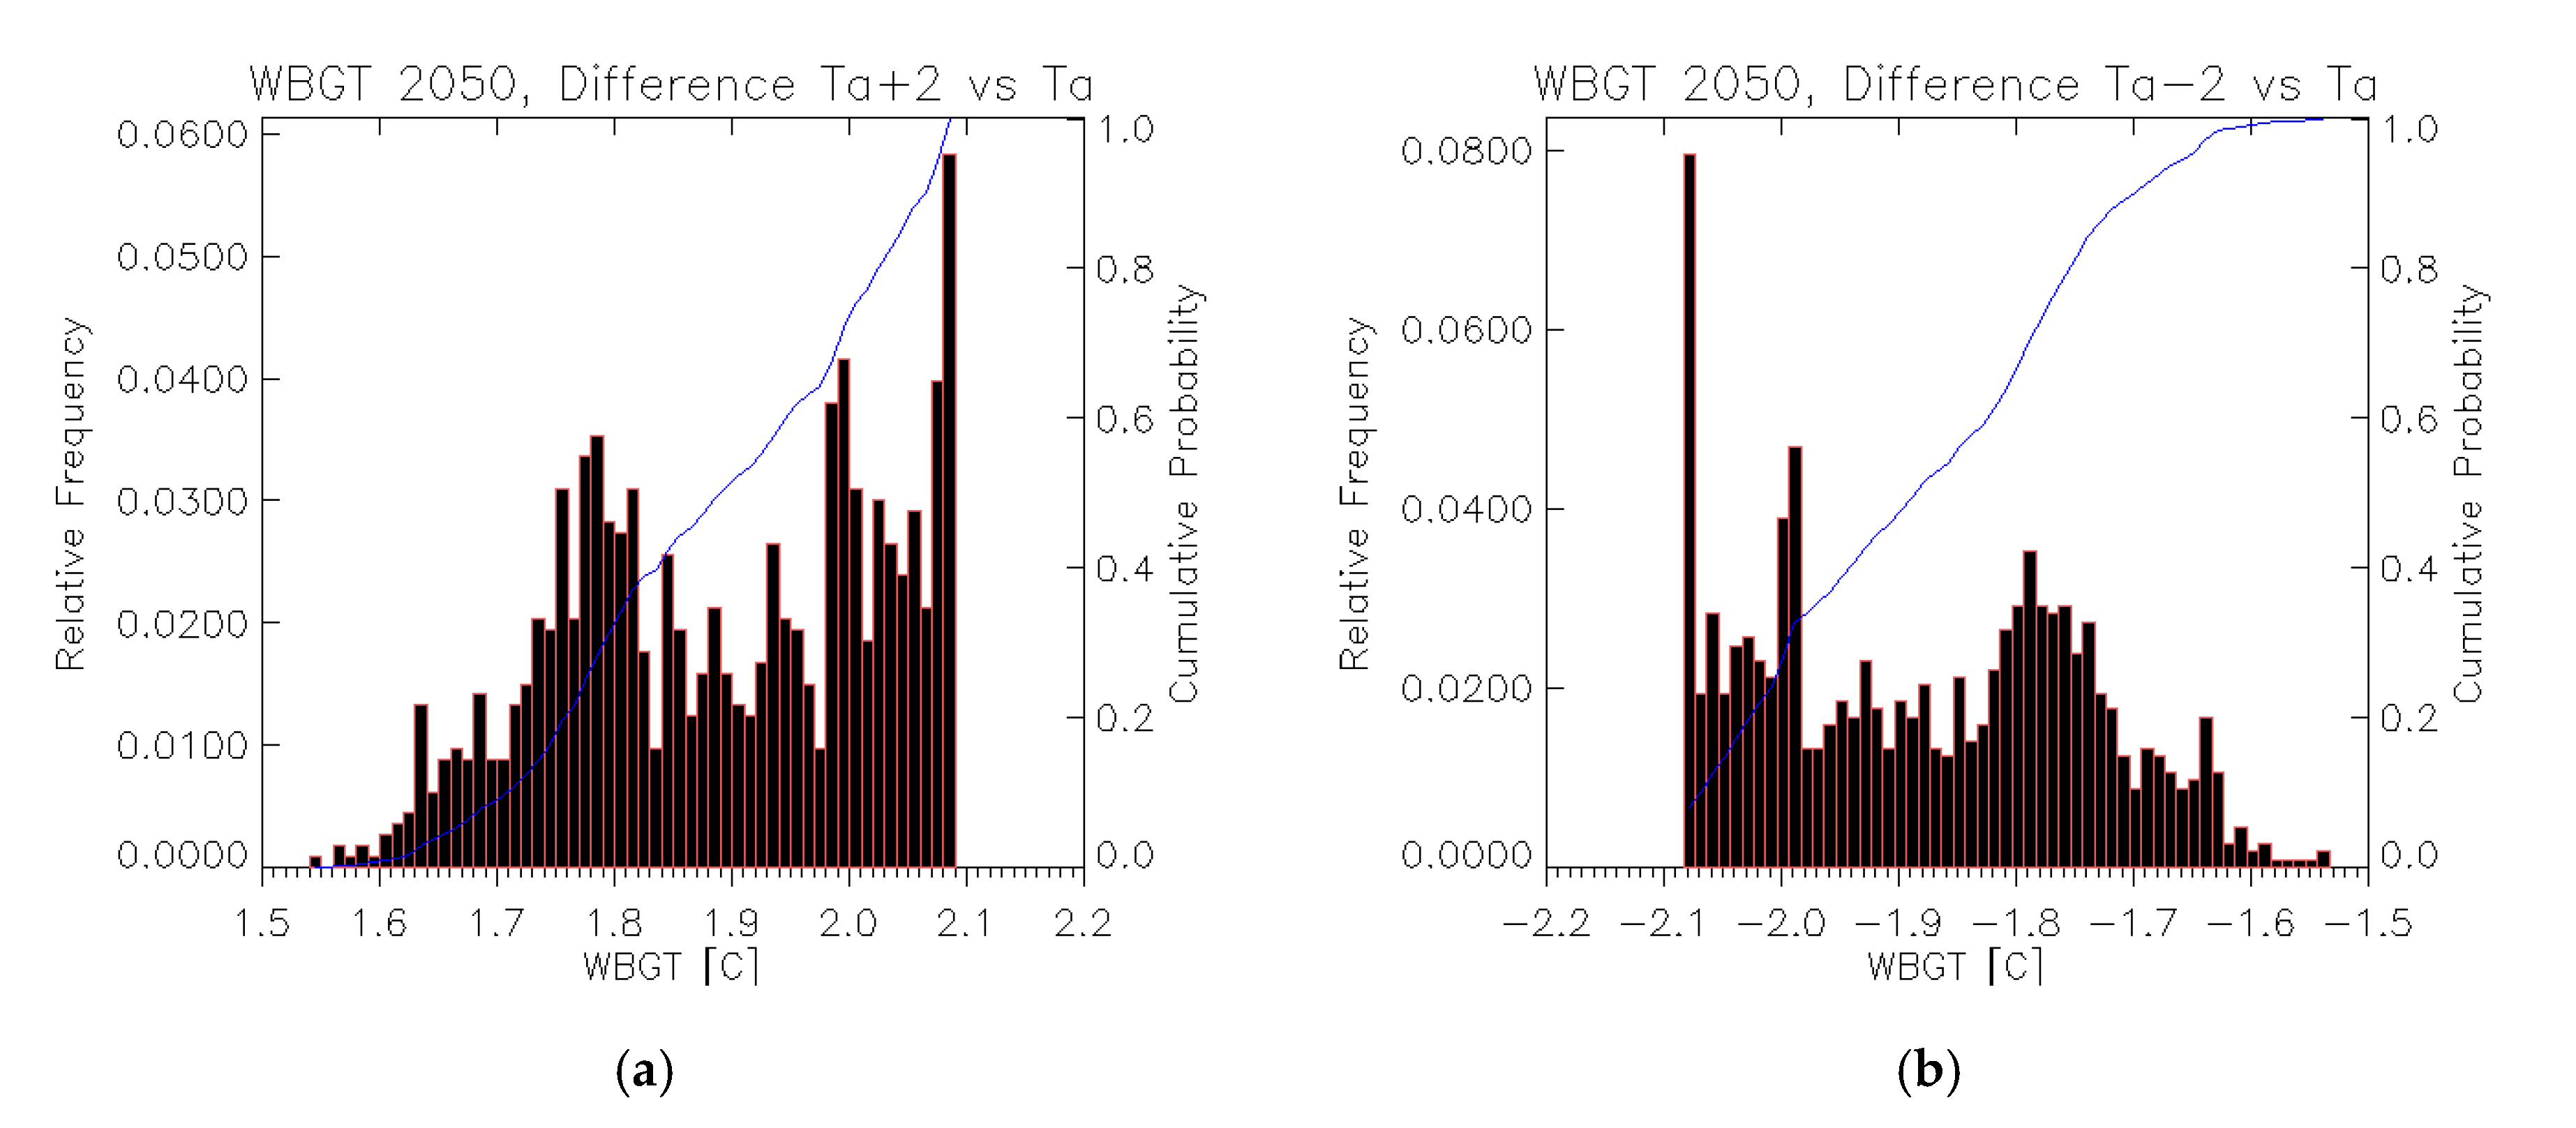
3.4. Uncertainty and Bias Correction

When using climate simulation data for prognostic studies it is important to quantify the bias of observed versus simulated data [59,60] as this bias can cause systematic errors [61]. In the supplement (Appendix C), we compare observed surface air temperature from a set of climate stations to the estimated surface air temperature in order to quantify this bias.
Farm tasks such as manual clearing, hoeing, planting, weeding, and harvesting involve substantial inputs of labor and energy. Given that these energy-demanding activities are carried out mainly in the outdoors with exposure to elements of weather, WBGT is judged to be a suitable index for assessing risks for heat stress among this population of workers. Kohut [62] identifies some activities associated with military exercises in hot, dry climates that fall under the metabolic rate. These activities are matched to activities of comparable categories carried out by smallholder farmers in a typical farming cycle (Table 3).
This research is one study in a project whose goal is to understand the implications of environmental changes on human welfare and health (see Funding for details). In this project, the environmental determinants of human wellbeing, including on the burden of tropical diseases will be investigated. The study area is in the Lake Victoria region, hence the choice of Kenya, Tanzania, and Uganda as locations of interest.
To assess the sensitivity of our computations of WBGT, we used the software (WBGT) developed by Strategic Security Sciences Division, Argonne National Laboratory [53]. For this analysis, we examined the variability of WBGT for the years 2000, 2050 and 2100 (Appendix B Figure A1) as well as assessed the sensitivity of WBGT to Air Temperature (Ta) and Relative humidity (Rh) (Appendix B Figure A2).

3.5. Annual Calendar of Agricultural Activities

Farming activities associated with maize production are used to assess the potential of heat stress on food crop production. Maize is used as the reference crop for assessing farmers’ activities as it is the main food crop in the east African region. In many parts of the region, maize is cultivated in two cycles within the year. The timing of agricultural activities was derived from the database of the Food and Agriculture Organization of the United Nations (FAO) (Found here: www.fao.org/agriculture/seed/cropcalendar/). This database gives the onset and end dates of planting and harvesting cycles for major food crops, including maize (see Appendix D, Table A2). While the database contains planting and harvesting dates, it does not have information on weeding periods.

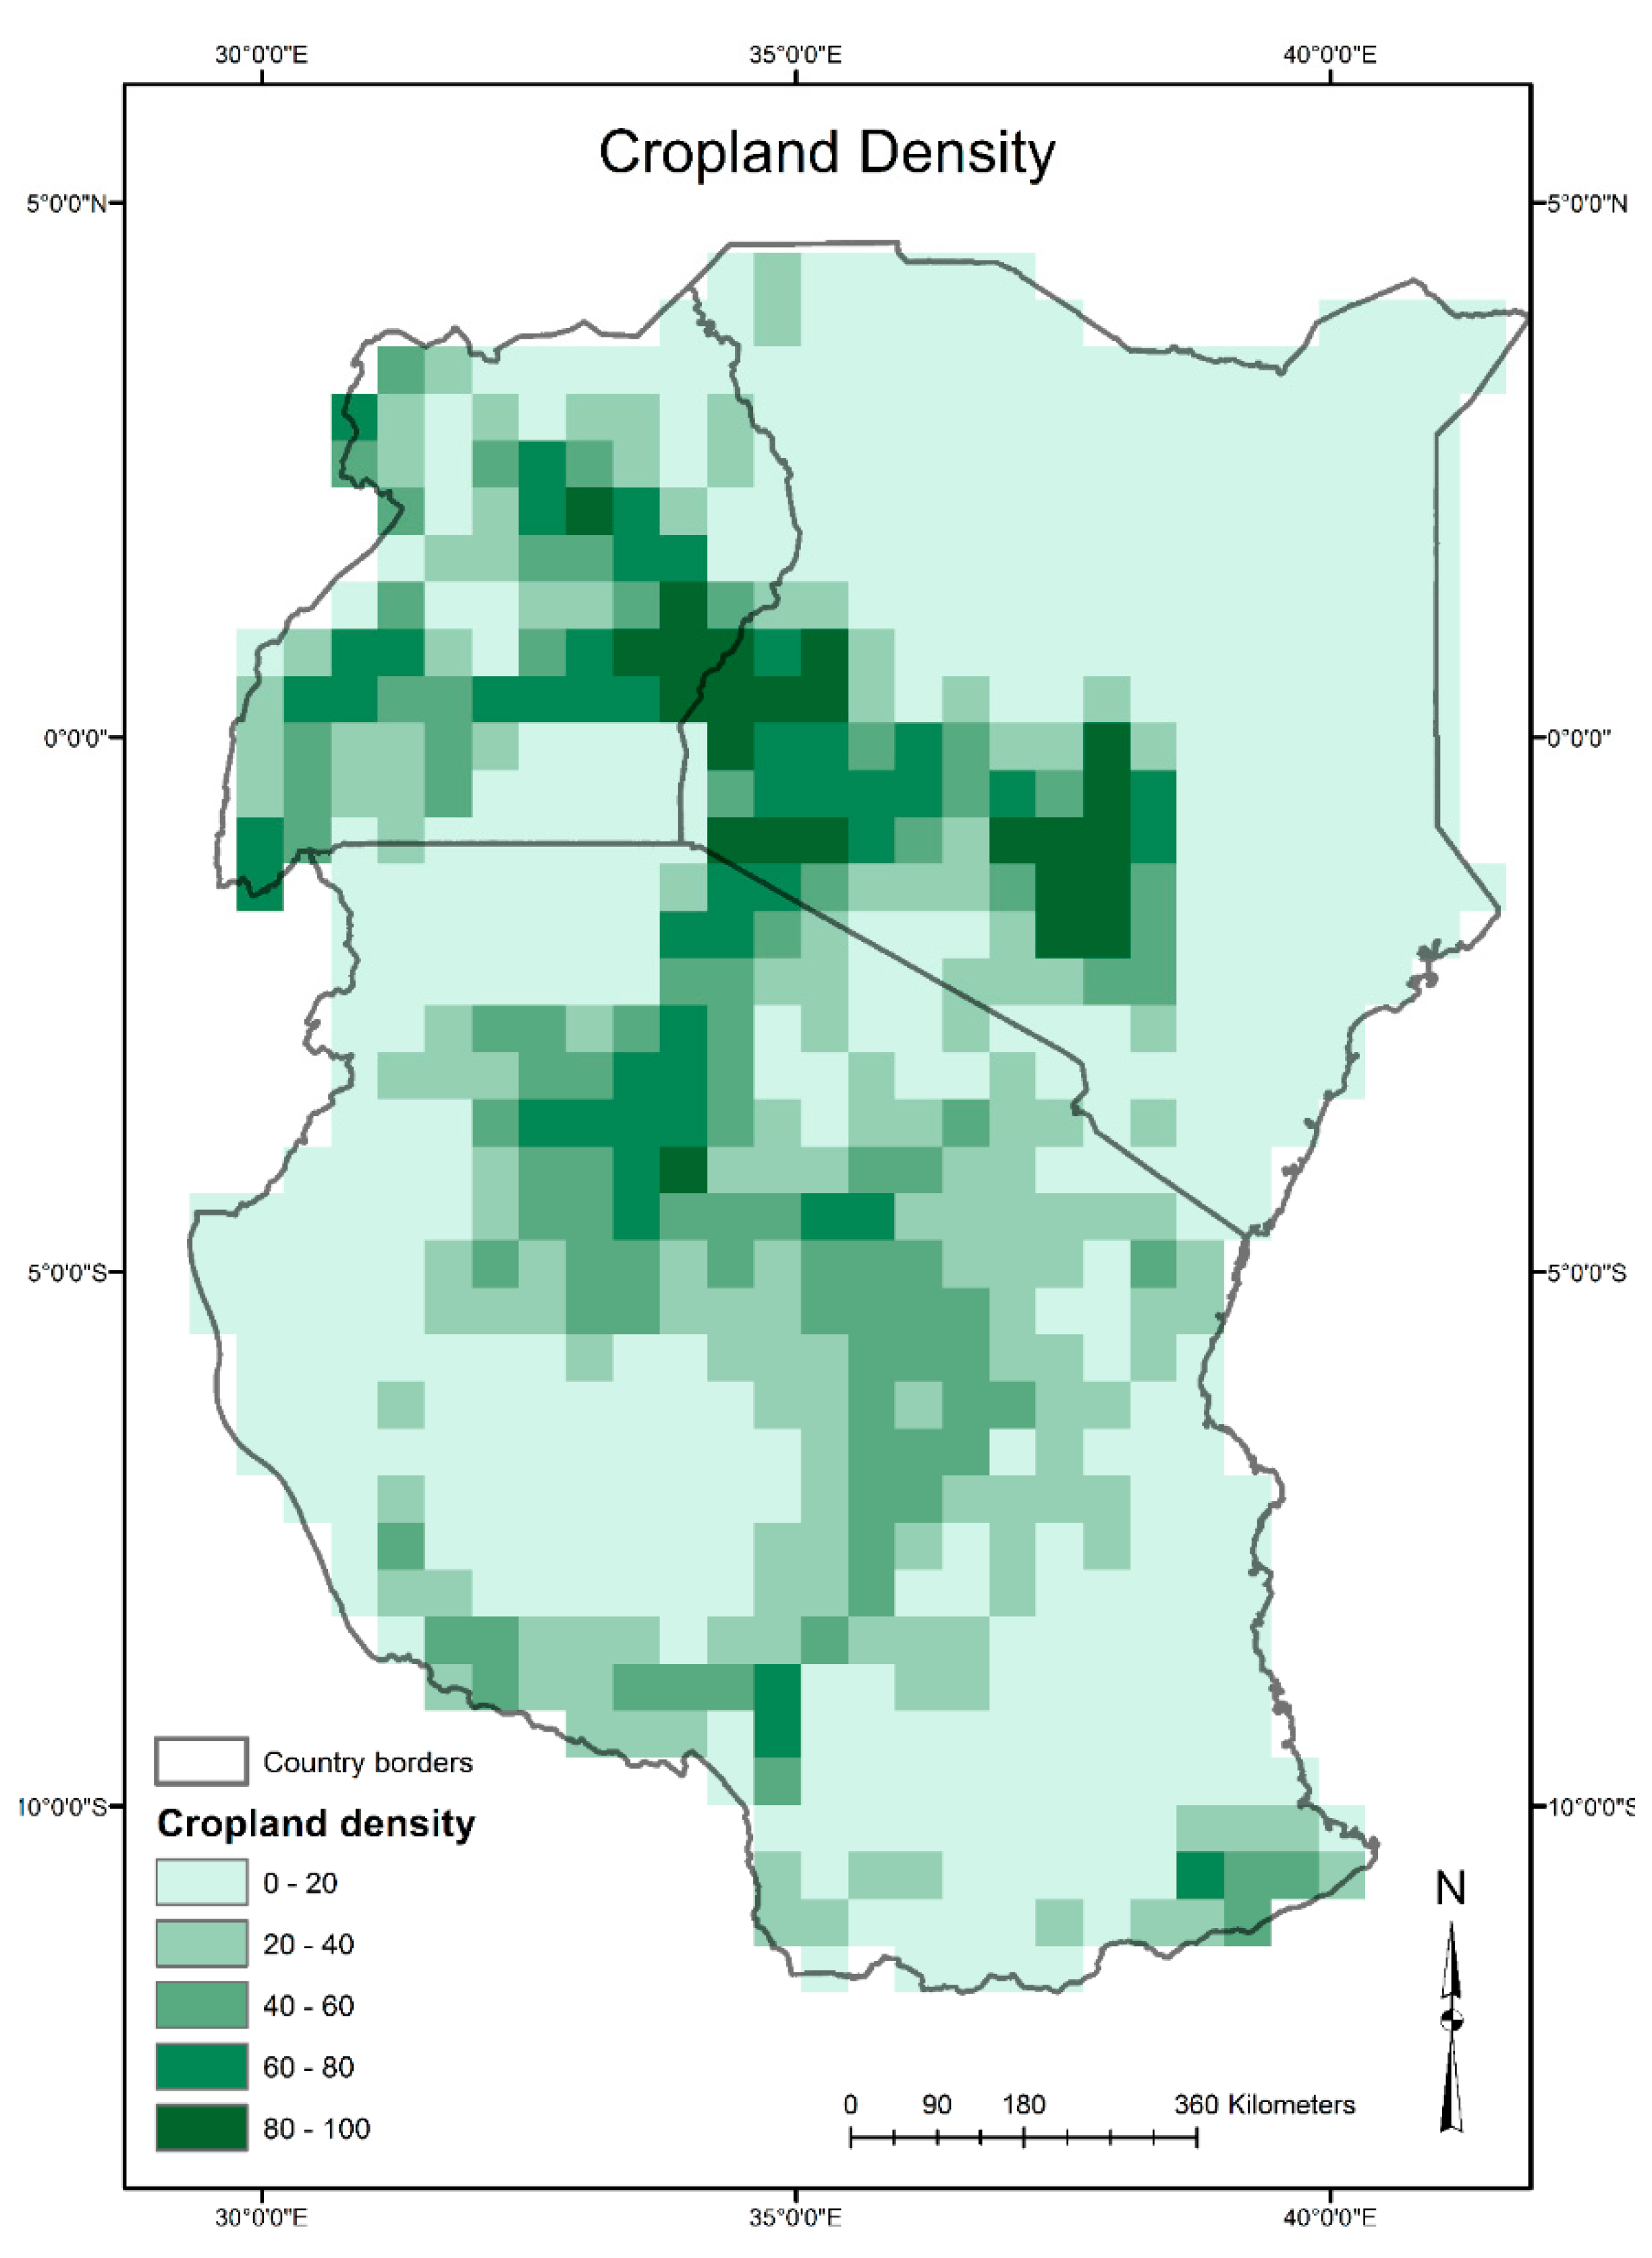
3.6. Cropping Intensity

We used the European Space Agency’s prototype high-resolution LC map over Africa based on 1 year of Sentinel-2A observations from December 2015 to December 2016 (Found here: http://2016africalandcover20m.esrin.esa.int/) to identify areas of cropland. This “Prototype land cover map of Africa” v1.0 dataset was downloaded from http://2016africalandcover20m.esrin.esa.int/. This dataset divides land cover in Africa into 10 generic classes that describe the land surface at a 20m × 20m spatial resolution: “trees cover areas”, “shrubs cover areas”, “grassland”, “cropland”, “vegetation aquatic or regularly flooded”, “lichen and mosses/sparse vegetation”, “bare areas”, “built-up areas”, “snow and/or ice” and “open water”. From the 10 land cover classes included, cropland was extracted and resampled to spatially fit the WBGT data, whereas the percentage of cropland per grid cell was calculated. This data was then used for the stratifications of cropping/cropland intensity (Figure 2).

4. Results and Discussion

The hypothesis advanced by this study that the Wet Bulb Globe Temperature (WBGT) in East African croplands in 2000 remains unchanged in 2050 and in 2100 is rejected, as high WBGT are observed during the two periods of the East African farming calendar studied. We also asked the question: How is the Wet-Bulb Globe Temperature (WBGT) going to be distributed in the future, and how will this affect the ability of smallholder farmers to perform agricultural activities? Generally, in February to March, the eastern and coastal regions of Kenya and Tanzania witness high WBGT values—some necessitating at least 50%, and up to 75% in some cases, rest/hour work intensities in 2050 and 2100. In August to September, the eastern and northern regions of Kenya, as well as the north and central regions of Uganda are vulnerable to high WBGT values. During this maize harvesting period, rest/work intensities with up to 50% rest/hour are expected in 2050 and 2100. Planning to understand and craft policies to address this key challenge is a critical element in adaptation methods to address the impact of climate change.

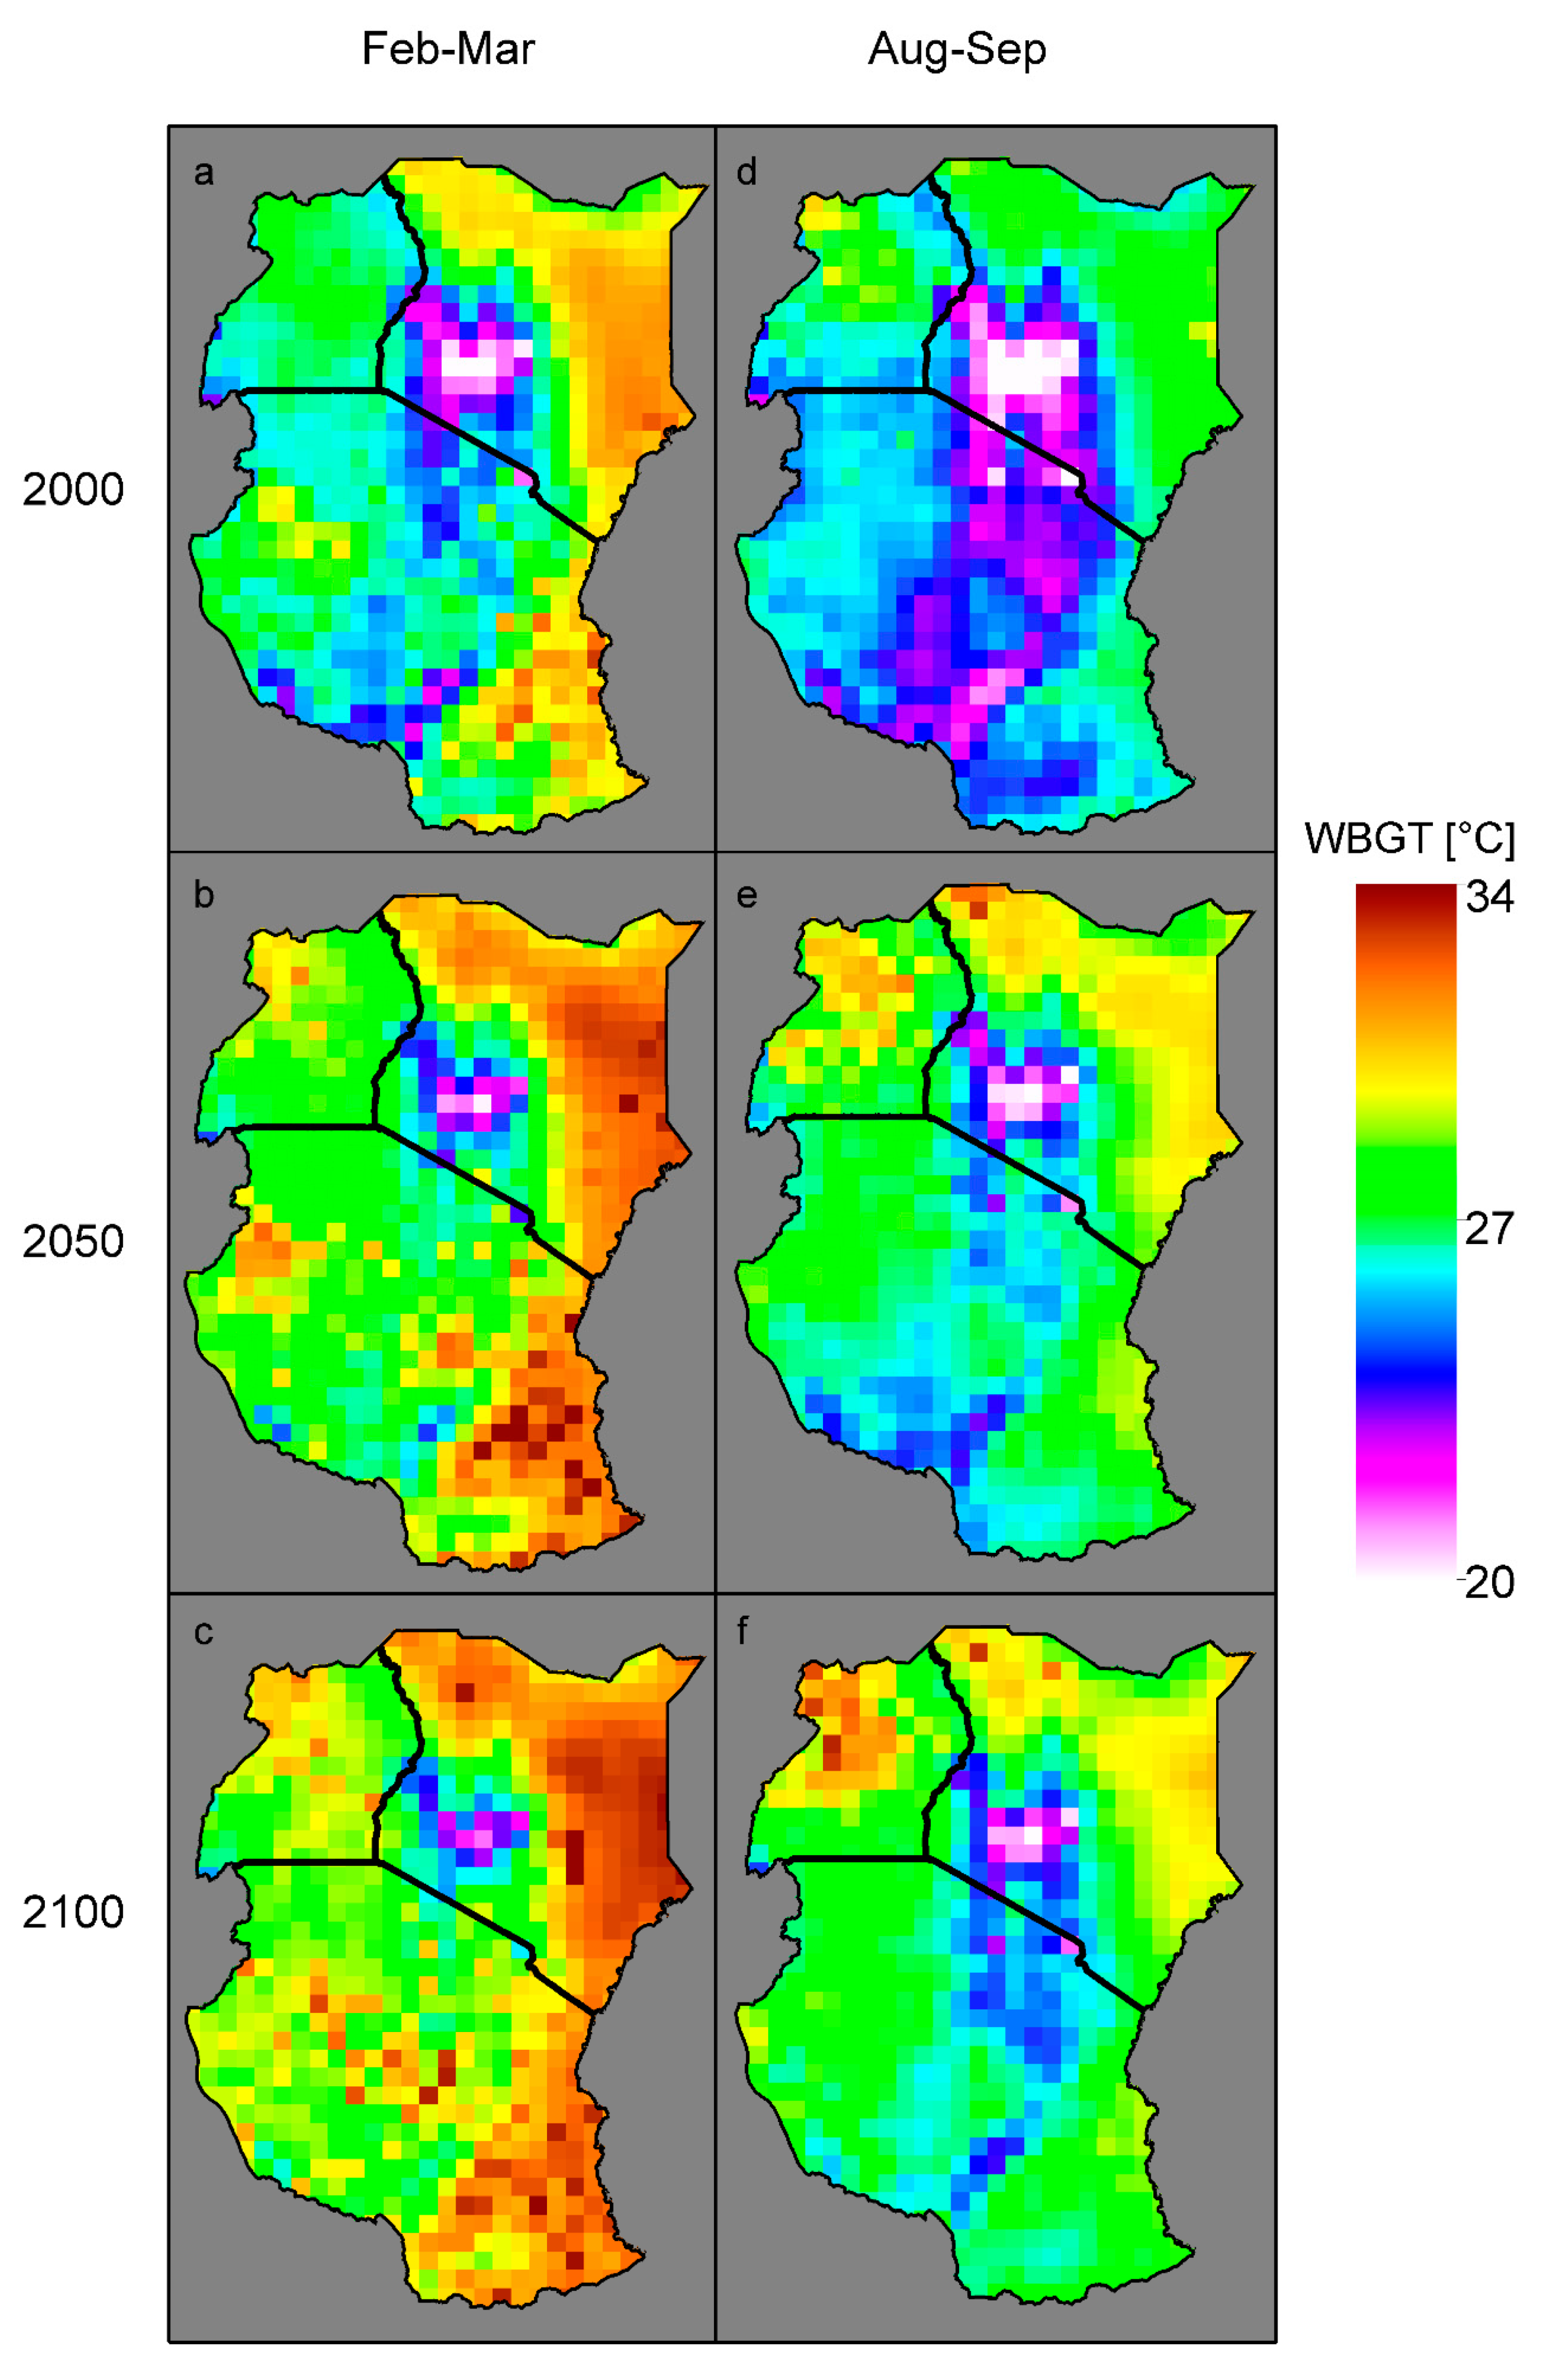
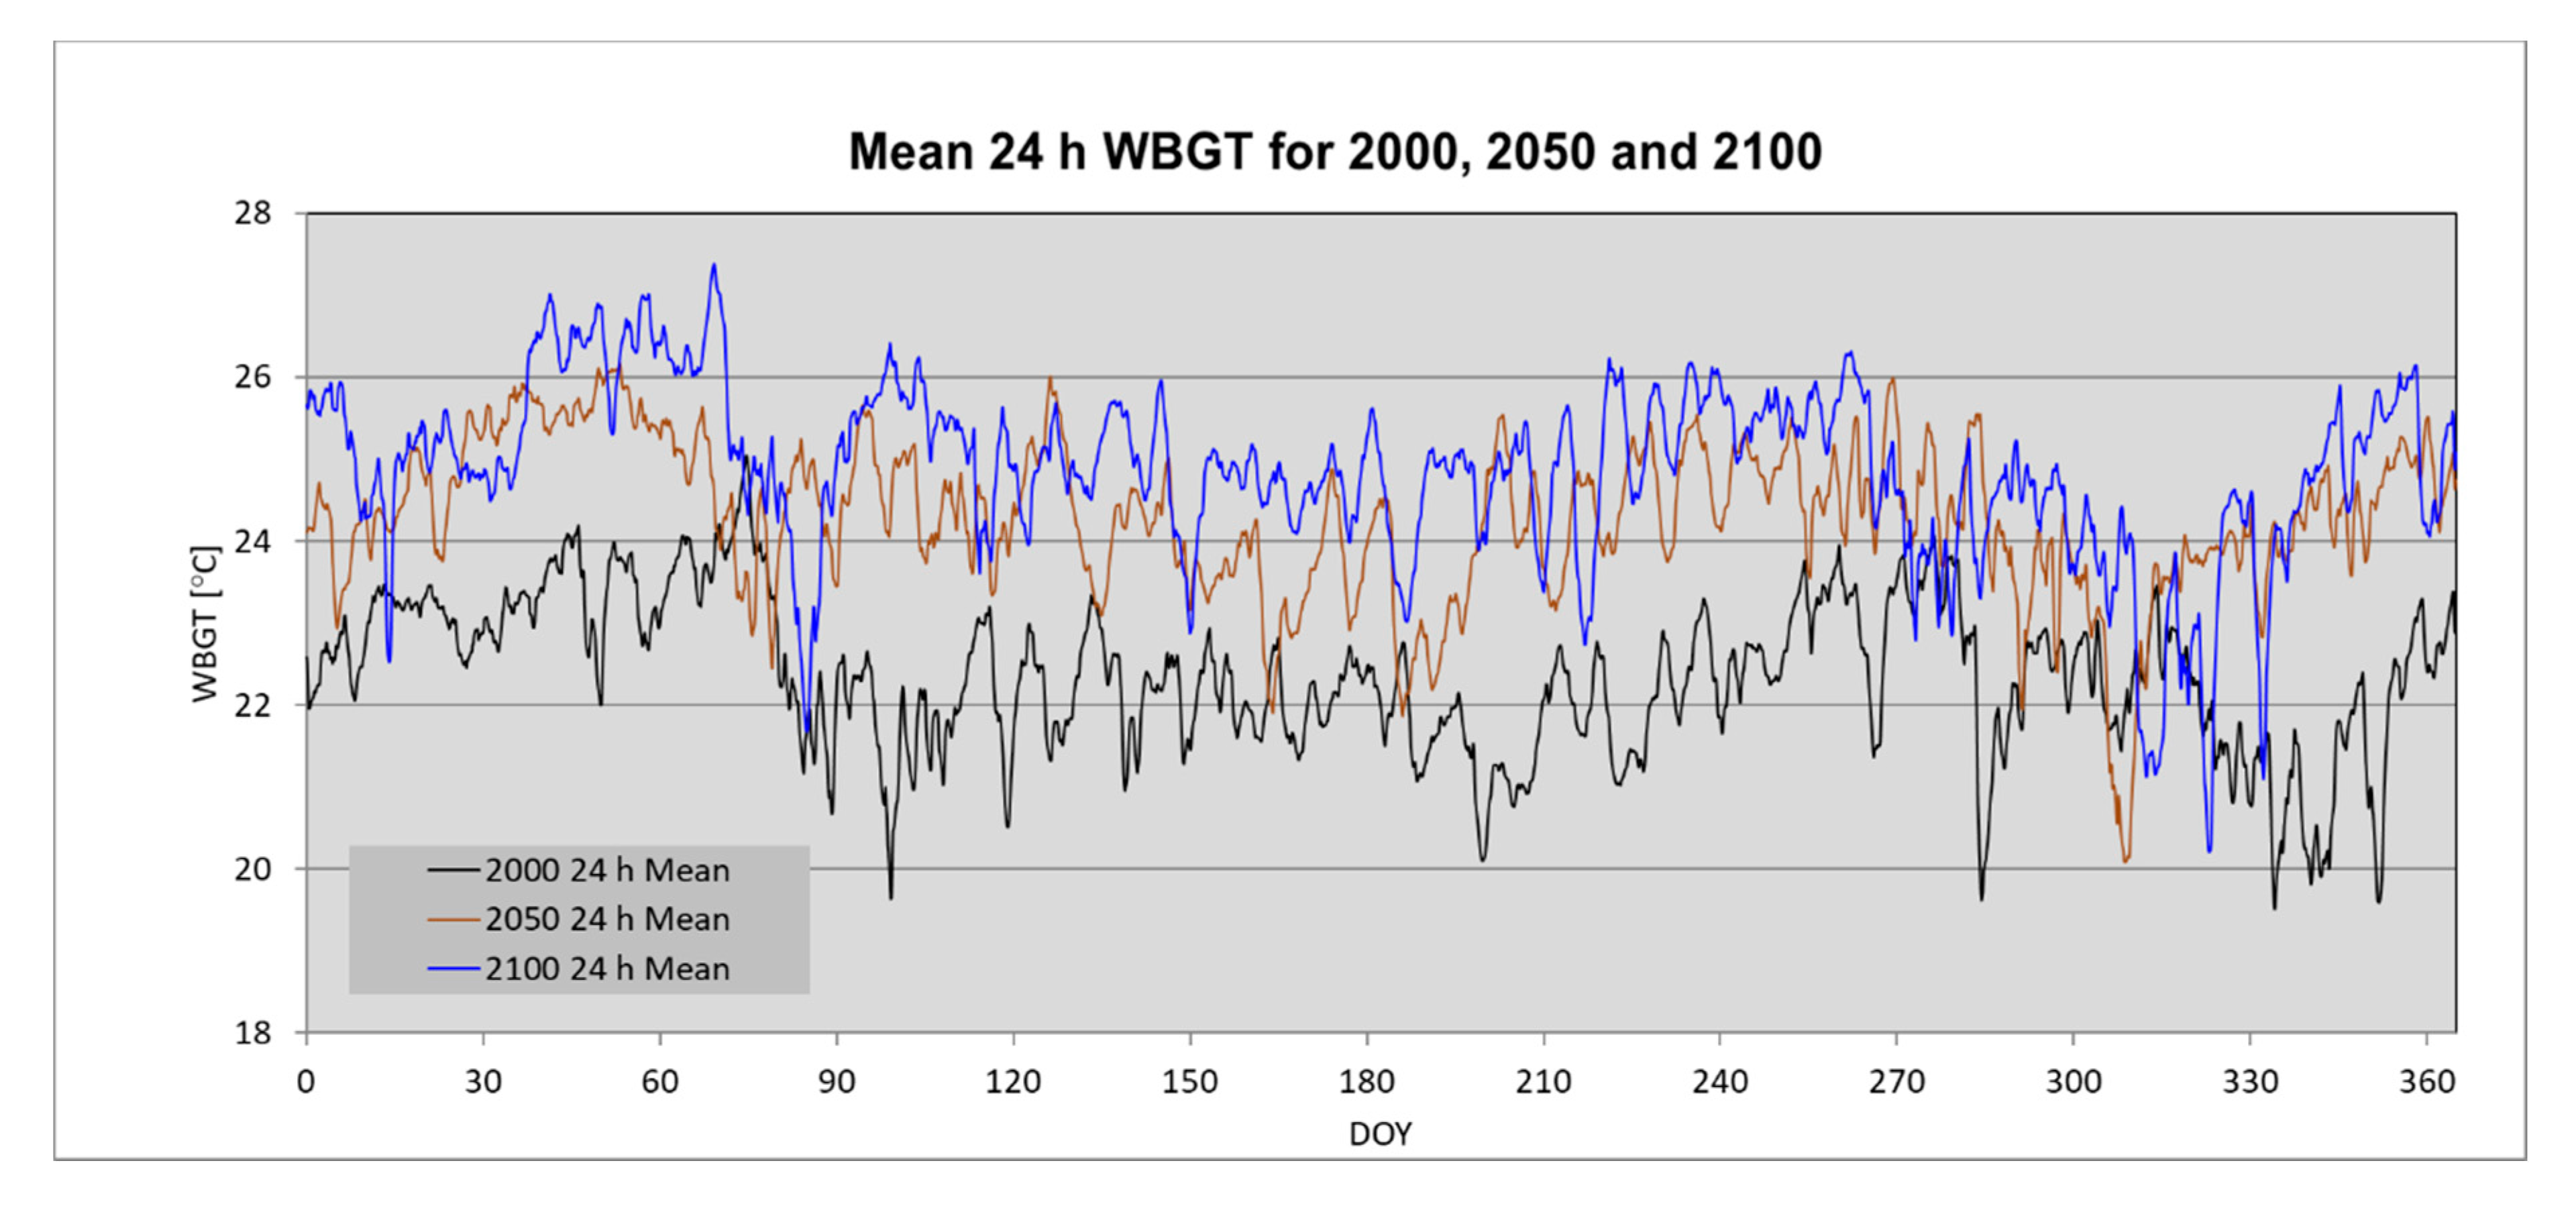
4.1. The Geographical Distribution of Maximum WBGT

The geographical distribution of maximum WBGT generally shows high values along coastal regions of of Kenya and Tanzania (Figure 3). WBGT values in coastal communities remain relatively high (generally above 25 °C), especially for the February–March season in all time segments. In Tanzania, regions with currently high maximum WBGT values and whose condition is going to be sustained in the future include Tanga, Pwani, Lindi, Mtwara, Ruvuma, and sections of Morogoro. In 2000, high maximum WBGT values were also observed in Shinyanga, Tabora, Kigoma, and Rukwa—a condition that becomes more widespread in the southeastern regions in 2100 (Figure 3c).
In August–September, maximum WBGT values affect the eastern and north eastern regions of Kenya more profoundly—with values reaching well above 30 °C in most of these areas (Figure 3e). High values are also observed north of the Rift Valley Region. Comparatively lower maximum WBGT values are observed in the central egion, Nyanza, and the southern portions of the Rift Valley region in all years and seasons. The central regions of Kenya have areas of high cropland density, many above 60%. In many of these areas, observed maximum WBGT values tend to be high, more than 28 °C (Figure 3b–f). In 2000, Uganda had a comparatively lower maximum WBGT (Figure 3a). By 2050, however, higher values are evident in the north-western (north of Gulu) and southern parts of the country (around Kampala) (Figure 3b,e). While generally lower maximum WBGT values are observed in Uganda in February–March, higher values are more widespread in August–September, affecting the central and north-western regions (especially in 2050, Figure 3e).
The distribution of high WBGT values illustrated by Figure 3 above is a cautionary tale of experiences that are already being observed in other parts of the Sub-Saharan Africa region. In a study of heat exposure on farmers in northeast Ghana, Frimpong, Eddie Van Etten [63] suggested that farmers were a population at risk and noted that the farming methods (using rudimentary tools and labor-intensive methods) were at the center of their vulnerability to high WBGT. In a study of the impact of heat stress and farmers’ adaptation to it, Frimpong, Odonkor [64] found that heat stress associated with farming activities was a challenge for small-holder farmers in the region. They also recognized that, even though there were adaptation strategies for coping with heat stress in Baku East in Northern Ghana, these strategies were ineffective. In their study of the impact of heat on health and productivity among maize farmers in the Gombe province of Nigeria, Sadiq, Hashim [65] found that farmers were frequently exposed to heat stress—a condition that was contributing to heat exhaustion and productivity decreases among small-holder producers.

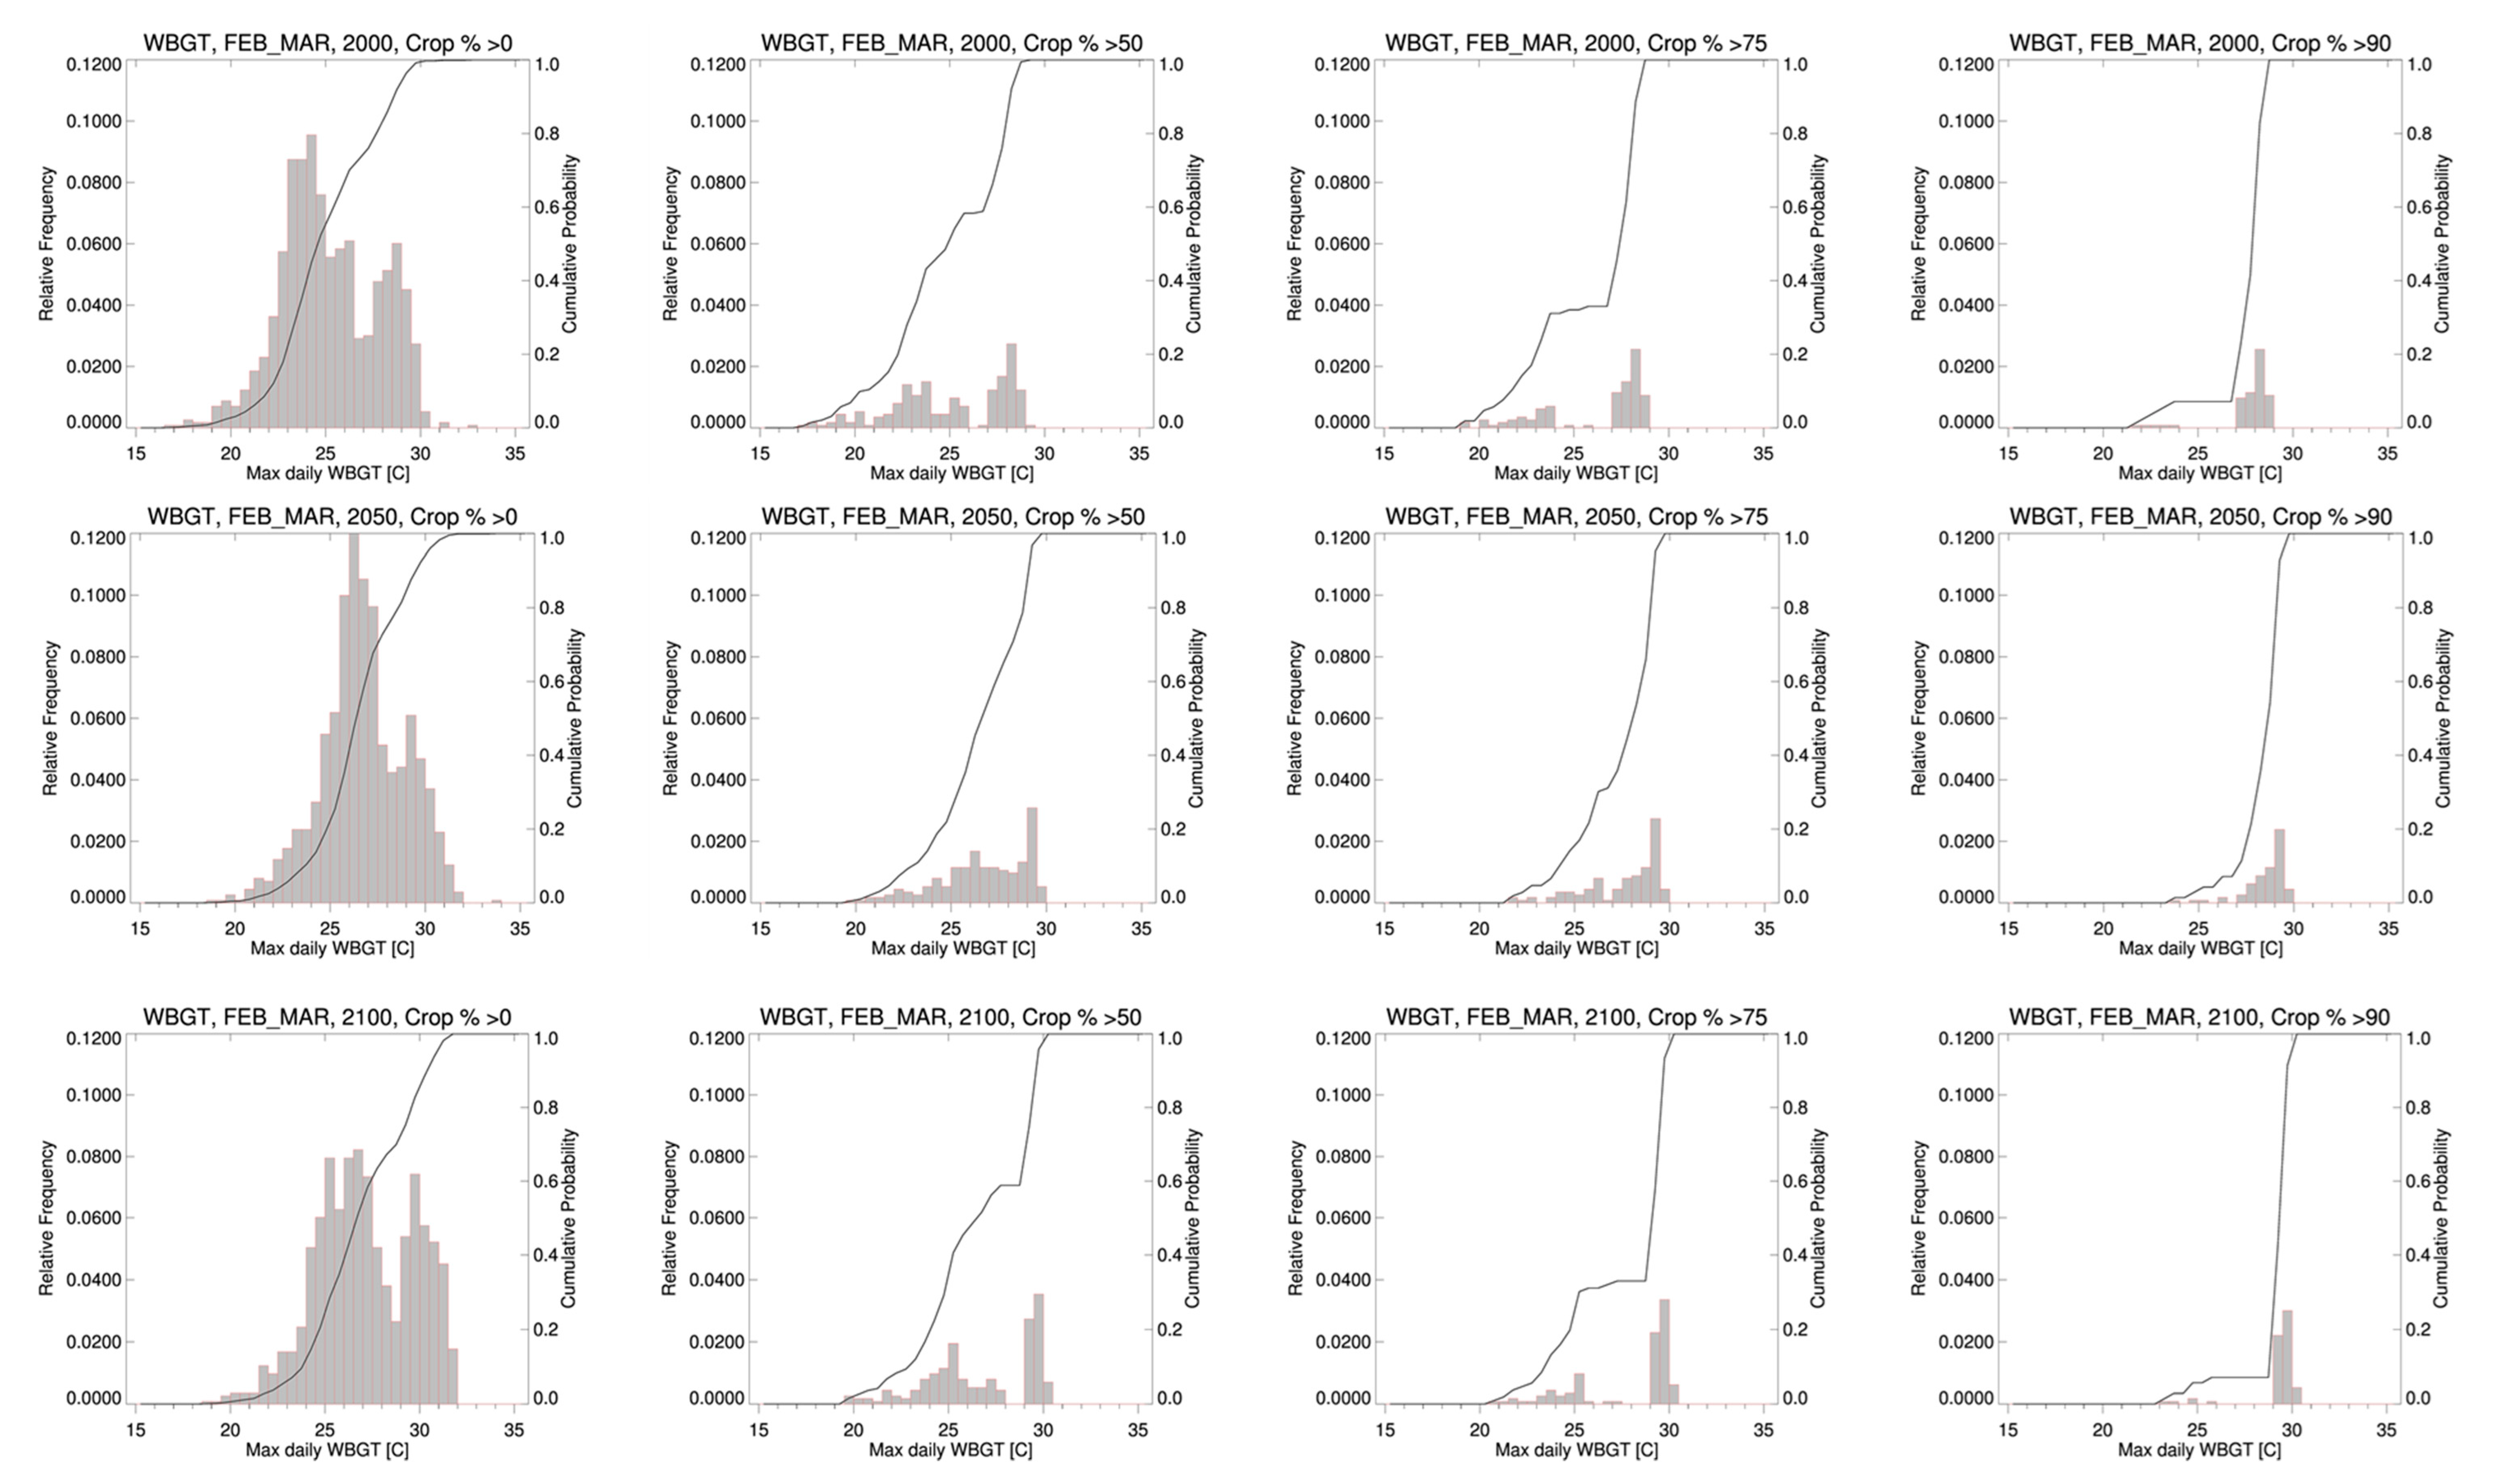
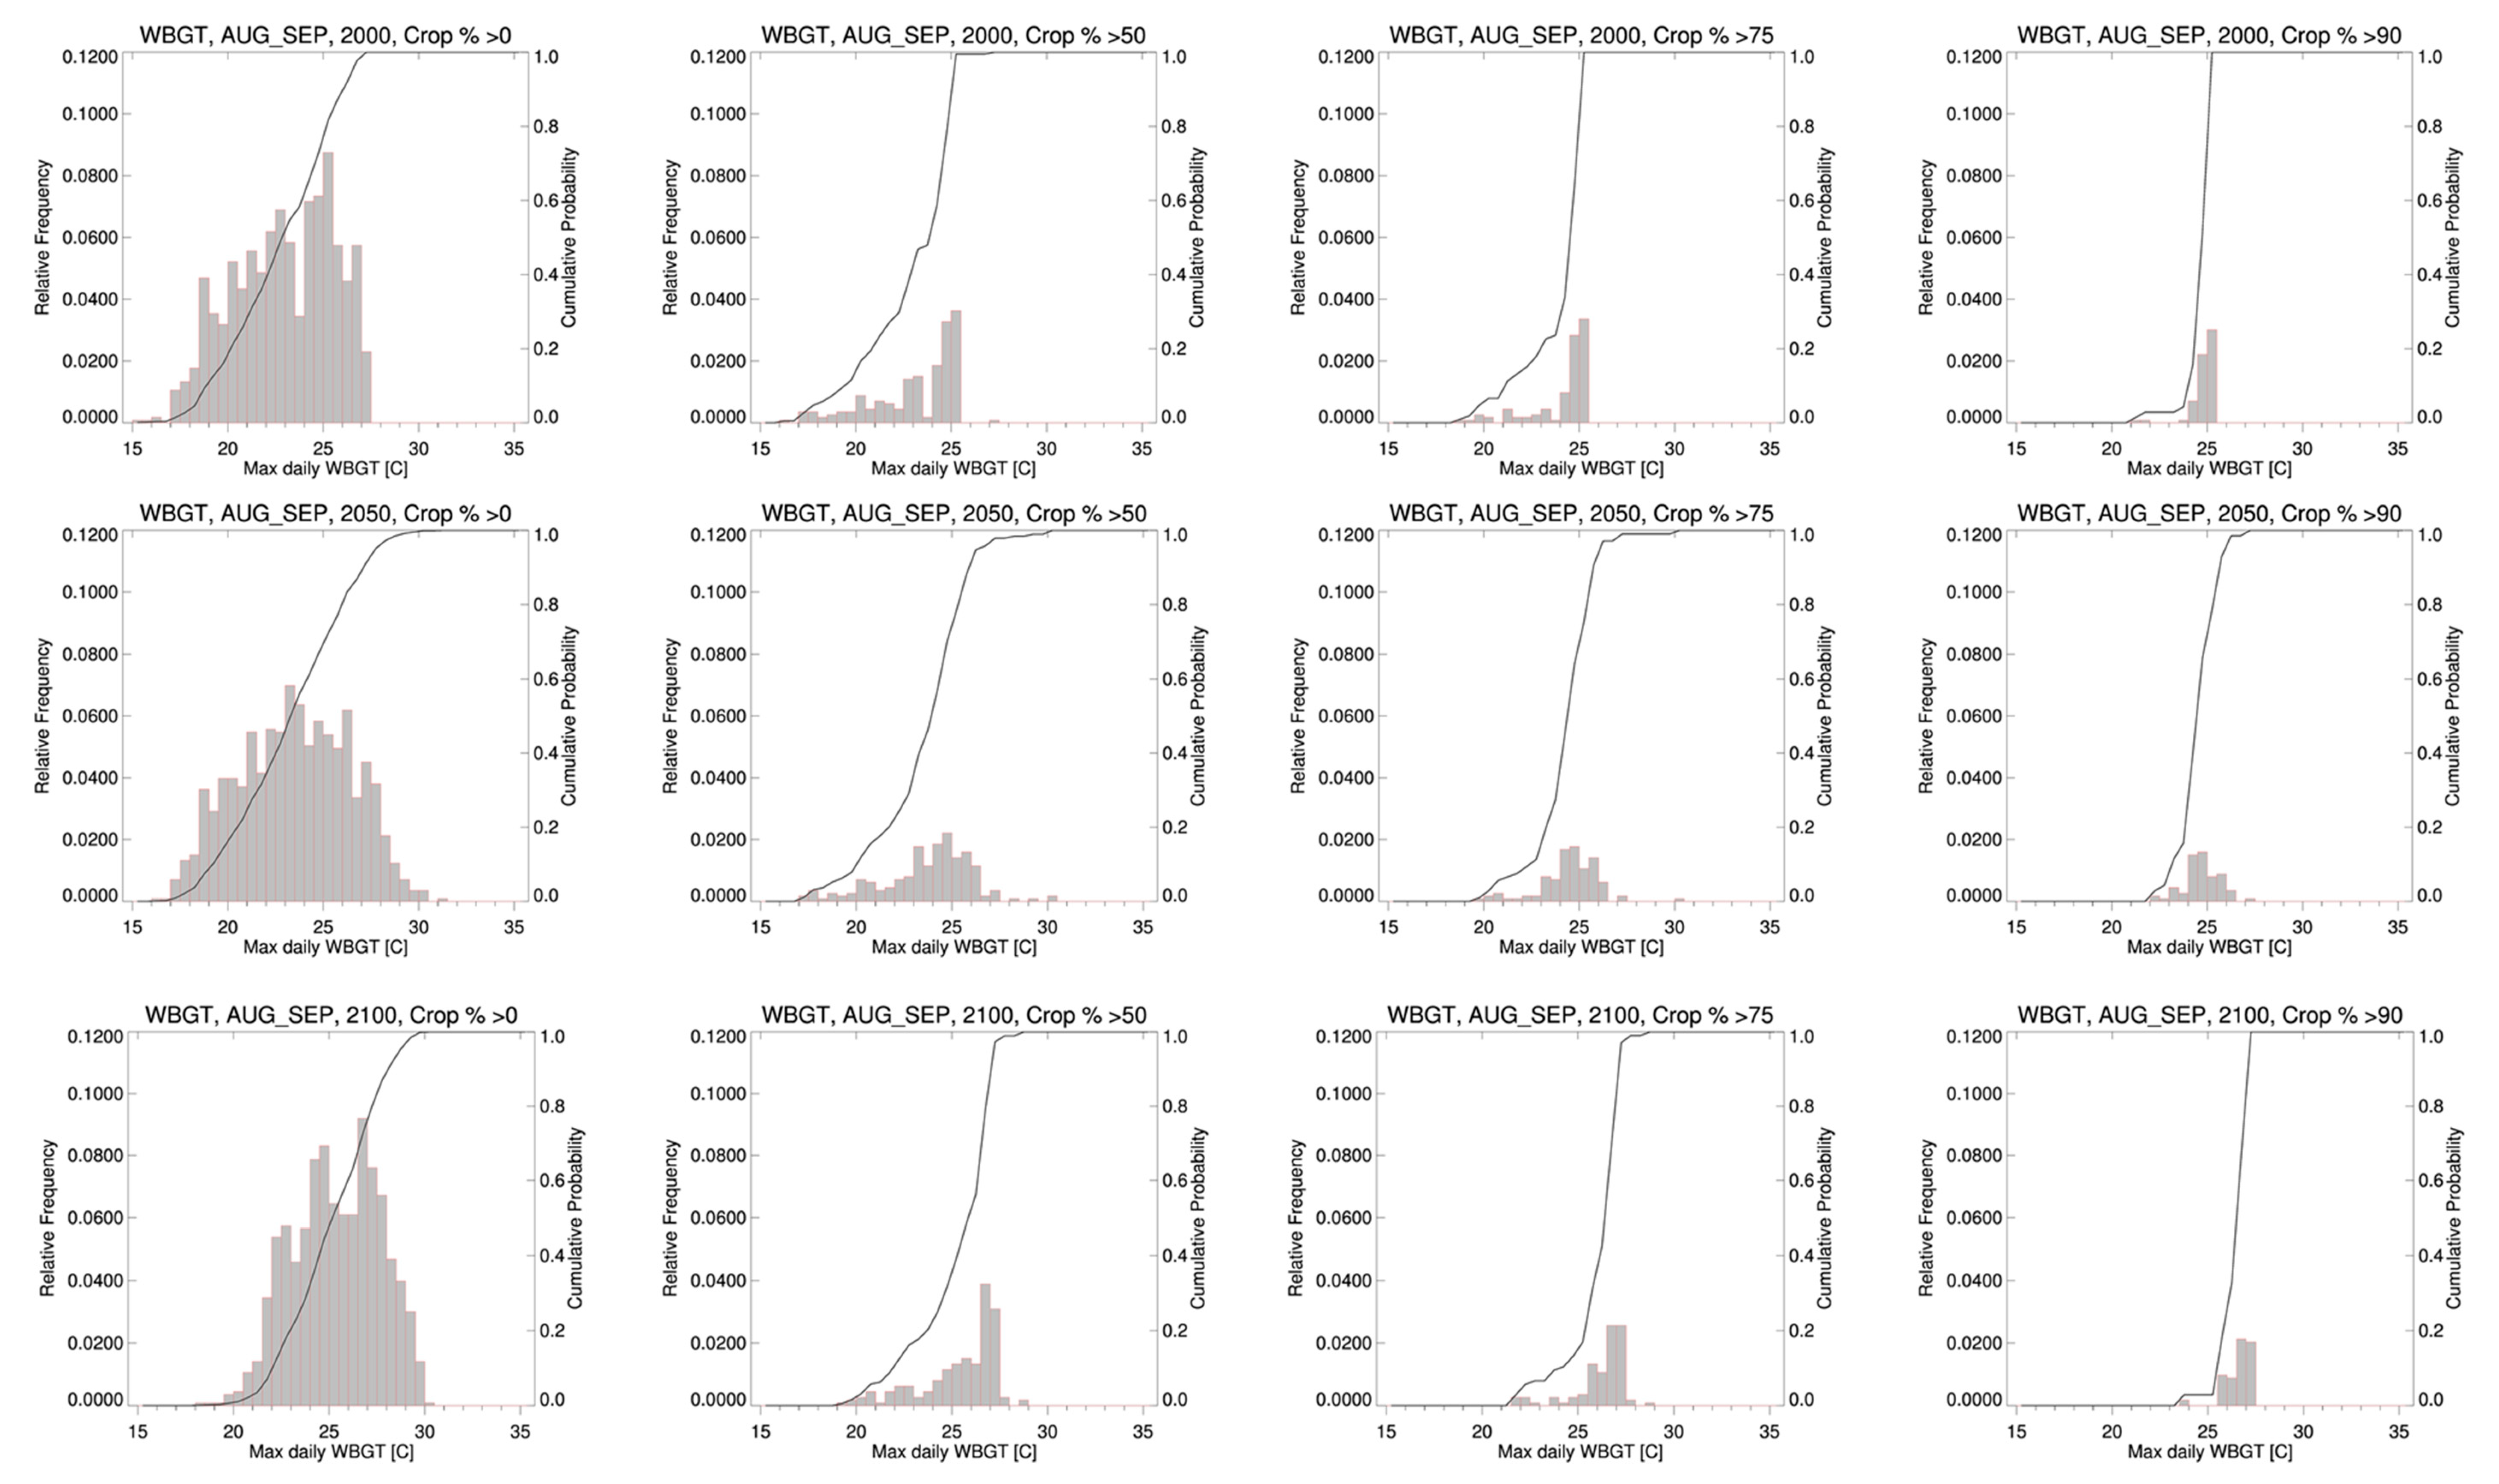
4.2. WBGT Frequncies and Farming Practices

Studies of labor inputs (in man-hours per hectare per year) into smallholder African agriculture reveals that farm preparation is the most labor-intensive activity in the cropping cycle. This has been reported in the study of pure maize cultivation in seven locations in Malawi [66]. Harvesting is the next most labor-intensive activity, then weeding, then planting. This distribution of labor inputs across crop types was also true for millet, legumes, manioc, and peanuts. While up-to-date data on labor use for different crops and different activities is hard to get, the mean amount of time spent on farms by smallholder farmers can give an idea of the potential for their exposure to potential elements of heat stress risk. Table 4 summarizes mean national data for the average amount of days spent on-farm by smallholder farmers. Family labor days on the farm supplied over a day refer to the total number of person-days that family members spend on the farm during one working day [67]. The FAO computes it by taking the total family labor day supplied on the farm over a day period, which is the total number of days at household level divided by the number of working days in a year—here, 300 days. In our case, the yearly labor inputs are presented [67].
Drawing from values presented in Table 4, farmers will be putting in between 189 to 231 days of labor on farms annually. This is well above half the number of days of each year working in farms. If we draw on the Malawi [66] example to examine the distribution of activities between tasks, we find a total of 341 man-hour ha−1 year−1 during the garden preparation and planting seasons in February and March. (We use Malawi for a breakdown of farming activities as we do not have this data for the study area. Malawi has the same agroecological zones as found in portions of the study area (such as Tanzania) and the practice of smallholder agriculture is quite comparable in methods.) These activities connect each other closely regarding the periods in which they are practices (see Appendix D). Assuming an eight-hour work day, this translates to 42.6 days ha−1 of exposure to mean maximum WBGT (i.e., the mean value of all maximum WBGT for February-March 2000) ranging from 23.5 to 24.7 °C in 2050, with maximum reaching 31.3 °C. In 2100, the mean maximum WBGT will be 25.4 to 26.6 °C, with maximums reaching 30.3 °C (Table 5). Based on our classification of the manual planting of maize and associated crops using machete, dibber or hoe as heavy work, it follows that there are regions in which high WBGT will warrant at least 50% rest/hour work intensity (Table 2). Farm preparation tasks are classified as very heavy work (Table 3). These include clearing vegetation using a machete and a grass hook; ridging and mound formation during land preparation; and hand weeding and tilling at a crouched position. Performing these tasks will warrant work intensities with up to 75% rest/hour (see Table 2). A high number of workdays in conditions of high WBGT in February–March will be affecting the eastern half of Kenya, the east and southern regions of Tanzania as well as pockets of regions in Tanzania’s center and north-west in 2050. In 2100, the geography of maximum WBGT values does not change much from the 2050 situation (Figure 4).
During the harvesting season in August–September, labor inputs of 141 person-hours ha−1 year−1 translate to 17.6 days of eight-hour workdays (Table 3). Maximum daily WBGT values during this period have a mean of 26.6 to 28.5 °C in 2050, with the maximum reaching 34.0 °C (Table 4). In 2100, maximum daily WBGT have a mean of 27.1 to 29.2 °C, with the maximum reaching 31.9 °C.
Harvesting maize in a standing position is classified as medium work (Table 2). At WBGTs of up to 30.3 °C in August–September (Table 5), there are regions in which maize harvesting will warrant work intensities with up to 50% rest/hour (Table 2). Areas in the north and northeastern Kenya, including the coastal regions, will be particularly vulnerable to high WBGT in 2050 (Figure 3). The central and northwestern regions of Uganda will also be vulnerable. While the eastern coastal regions of Tanzania will see increased WBGT values compared to other parts of the country, the country as a whole will not be as vulnerable as its northern neighbors in August to September (Figure 5).

4.3. Implications for Climate Change Planning in the Agricultural Sector

There is consensus on the observation that African countries will suffer serious health consequences due to impacts of climate change. The rapidly growing populations in many African countries are among the most vulnerable to climatic changes in the world [30,68]. Beyond the direct negative health impacts, the impact of climate change stands to affect key socio-economic sectors such as agriculture. We demonstrate in this study that the impact of changing climates on the availability and productivity of labor will affect many geographies in East Africa. This study demonstrates that key sectors such as agriculture are particularly vulnerable to the effects of climate change. In many parts of the continent, this vulnerability is due in part to existing problems of poverty, weak institutions, political unrest, and the activities of some international financial institutions, which limit the capacity of some countries to deal with the challenges posed by a changing climate [69,70]. This vulnerability poses threats to human health, well-being and the economic productivity of agriculture-dependent countries in sub-Saharan Africa. Such threats warrant the need for mitigation measures to adapt smallholder agriculture to a warming world and policy engagement on occupational health programs that protect individuals at risk of heat-related morbidity and mortality.

4.4. Mitigation Measures to Adapt Smallholder Agriculture to A Warming World

Mitigation measures that adapt agriculture to changing conditions brought about by climate change. One is inclined to propose a more concerted drive towards practices of agroecological farming and ecological intensification to achieve the goals of sustainable food production and viable food systems in sub-Saharan Africa. In this case, a focus should be on management approaches that reduce human exposure to elements that contribute to heat stress within the agricultural environment. Examples may include:
(a)
Reduction in exposure to heat stress in farm preparation activities (Figure 4 and Table 4). This may include the diffusion of best practices in no-till farming that eliminate the need to spend time and energy clearing, tilling and ridging the land. No-till farming usually involves (a) sustaining the availability of mulch or crop residue, or a careful section of cover crops for maintaining soil cover at all times (including off-farming seasons), and (b) using suitable crop rotations [50]. Within the context of human exposure to the elements of heat stress, the labor savings of no-till farming is especially important. In some cases, it has been observed that planting in a no-till system can reduce labor input by as much as 60% [71]. Notwithstanding the potential to reduce exposure to heat stress be adopting no-till farming, there are constraints associated with making it work in East Africa. Constraints include the small sizes of farms, which make farmers less willing to set aside portions of it to experiment with new approaches; problems of land tenure that decrease incentives for long-term investments in no-till practices; and access to information on the best practices for no-till farming. In addition, the highly degraded soils of the region mean that the transition period to achieving viable no-till farming systems is longer and may not be appreciated by farmers with restricted economic margins.
(b)
Reduction in exposure to heat stress in planting activities (Figure 5 and Table 4). Planting is the activity that has experienced the most diverse innovations in mechanization among smallholder farming practices. Grain planting, in particular, has seen substantial innovation in small-scale mechanization that can reduce the work intensity of the practices [50]. Constraints to accessing and using these planting aids remain at the level of affordability (because many smallholder farmers may not have the financial resources to purchase this machinery) and organization (because, at the level of the institutional framework, it makes it possible for these tools to reach smallholder farmers, farming communities and farming organizations in the first place [72]). In the absence of mechanization, farming activities can be planned to reduce the risk of excessive exposure to heat, through a modification of the timing of practice of some activities. In a study of heat exposure among non-harvest sugarcane workers in Costa Rica, one of the conclusions drawn was that changes in the attitudes of employers that involve creative ways of organizing work shifts, among other things, can reduce worker exposure to heat stress [73].
(c)
Reduction in exposure to heat stress during harvesting. It is challenging identifying what can be done to reduce the work intensity or harvesting for smallholder farmers. The mechanization of the harvesting process for crops such as maize and potatoes, for example, seems to be challenging for a variety of reasons, namely the small size of farms means that they are often not suited to the large-scale mechanization of the harvesting activity. In addition, the haphazard geometry of planted crops also reduces the suitability of mechanizing the process. However, an important component of crop harvesting is its transportation to homes or markets, since the purpose of harvesting is to get produce to where they can be sold or consumed. In this regard, there is a lot that can be done to reduce the long distances over which farmers transport agricultural produce, as well as the number of times that the harvesting of a single farm has to be done because the family can transport only so much at a time. There is also potential for reducing heat exposure through the smart planning of farming activities using existing intervention programs already in use. For example, interventions that make use of the Occupational Safety and Health Administration (OSHA)’s Water–Rest–Shade program (WRS) have been evaluated in El Salvador and found to contribute to reductions in symptoms associated with heat stress and with dehydration [74].

4.5. Policy Engagement on Occupational Health Programs

Policy engagement on occupational health programs that protect individuals at risk of heat-related morbidity and mortality is an essential part of mitigation and adaptation planning [1]. This falls within a recommendation proposed by the 2015 Lancet Commission to scale-up financing for climate resilient health systems worldwide [75]. As warmer temperatures become a reality in many parts of sub-Saharan Africa, redesigning medical services to meet and address the emerging challenges of outdoor occupational heat stress are indispensable. Among some of the areas of concern is the need to include heat-related morbidity and mortality into training programs for personnel in the health sector [76]. Such training will enable emergency medical personnel, clinicians, and doctors to respond to an increase in incidences of heat-related emergencies in a warming world. Just as important is the need to invest in infrastructure and equipment to facilitate the ability of these medical practitioners to meet the challenge. In the countries of Europe, these policy engagements culminate in what is referred to as “heat-health action plans” [77]. A policy engagement plan that responds to the emerging challenges of heat stress would address three key issues:
(a)
Develop an illness prevention plan for outdoor work based on the heat index that is appropriate for specific agro-ecological zones in each country. The goal of such a prevention plan would be to prevent heat-related illnesses and deaths by raising awareness among agricultural practitioners, support personnel, and policymakers about the health risks associated with working in hot environments.
(b)
Train workers in the agricultural sector (practitioners, agricultural extension workers, members of agricultural common initiative groups) how to recognize and prevent heat-related illness. To be fully effective, an interdisciplinary approach that engages stakeholders at different levels of the agricultural production and distribution chain, as well as on associated agricultural support services, would be essential [78].
(c)
Define protective measures for dealing with outdoor work conditions for smallholder farmers. These measures may include work/rest schedules, clothing choices under different heat stress conditions, techniques for keeping cool, the importance of hydration during working hours, as well as how to deal with heat-related emergencies. Many examples of such protective measures have been examined by previous studies [1]. These measures can contribute to addressing heat-related morbidities.

4.6. Uncertainty in the Distribution of Future Agricultural Areas

The African climate is determined by three main processes. Two of these are local processes that determine the regional and seasonal patterns of temperature and rainfall-tropical convection, and the alternation of the monsoons. The third, El Niño-Southern Oscillation is foreign to the continent, but strongly influences interannual rainfall and temperature patterns in Africa. Some of the most reported impacts of anthropogenic global warming and climate change in Africa are higher sea and land surface temperatures, and an increase in the incidence and severity of droughts, floods and other extreme weather events. It is forecast that over the next 100 years, mean temperatures across Africa will rise faster than the global average, exceed 2 °C, and may reach as high as 3 °C to 6 °C greater than 20th century levels [79]. Drier subtropical regions are expected to warm more than the moister tropics, with northern and southern Africa becoming much hotter by as much as 4 °C. It is also expected to become drier, with precipitation falling by as much as 15% or more [79]. In East Africa, climate change is projected to increase temperature and precipitation variability as well [80]. These changes in key factors that determine the suitability of rain-fed agriculture are bound to have an effect on the distribution of suitable areas for smallholder agriculture on the African continent. Indeed, even if rainfall remains constant, existing water stress will be amplified as a result of increased temperatures, putting even more pressure on agricultural systems on the continent, especially in arid and semiarid areas [14]. Climate change is projected to decrease the yields of cereals overall in Africa through shortening growing season length, amplifying water stress and increasing the incidence of diseases, pests and weed outbreaks [80]. In East Africa, cereal mixes, especially the maize mixed cropping system, covers over 40% of the area [12].
This study therefore acknowledges that suitable areas for food crops and agriculture in general may therefore change by the middle and end of the century, meaning that some of the areas that host agriculture today may not be hosting these activities in the future. We also acknowledge that there is a possibility that improved technologies may reduce the burden of human labor in smallholder agricultural systems. However, if we draw from experience over the last three decades, these changes have neither been fast nor widespread enough to expect that substantial radical changes may have changed the agricultural landscape before the middle of the century. Poor agricultural performance in sub-Saharan Africa has led to a situation of stagnating real incomes of farmers, stagnating and often increasing rural poverty, and a farming landscape whose methods and productivity have not changed substantially over the last three decades [81]. Indeed, the Alliance for a Green Revolution in Africa (AGRA) notes that, despite the positive outlook on the role of agriculture and plans for its development in the sub-region, “there remains significant need for improvement to achieve an inclusive agricultural transformation: (i) agricultural growth is still too slow and yield increase too marginal; (ii) food security is not yet sustainable in most places; (iii) new challenges such as climate change, pests and diseases threaten progress, etc. [81]”. Nonetheless, our findings point to the need to take human labor and its vulnerabilities in the face of climate change into consideration when examining or exploring adaptation policies.

4.7. Uncertainty of the CORDEX Data

The results of the comparison of measured surface air temperature versus the CORDEX estimated surface air temperature (Appendix C) show no systematic bias. Approximately 80% of the observations (n = 63,027 daily mean temperature observations) showed a mean absolute error of 1 °C or less, whereas the percent bias was 5% or less for about 60% of the 252 station years studied.

5. Conclusions

We find that heat stress is already affecting regions of East Africa. This condition is set to continue in the middle of the century and beyond. Not all areas of the East African region or all areas inside national boundaries are affected equally. Different regions of each country are affected at different degrees and at different times of the year. While Kenya and Tanzania experience large portions of their national land mass affected by high WBGT values, a neighboring country (Uganda) is relatively less affected in the two seasons of the agricultural calendar examined. High WBGT has implications on the rest/work cycles of smallholder farmers whose use of machinery for many farming practices remains very limited. There is therefore a need to design and implement mitigation measures to adapt smallholder agriculture to a warming world. These could be measures that target exposure to heat stress in different farming cycle activities, such as land preparation, planting, weeding, and harvesting. There is also a need for policy engagement to protect from the risks of heat-related morbidity and mortality. Reduced work capacity in heat-exposed jobs constitutes one of the important effects of climate change. This has implications for the attainment of key social and economic goals for societies in which economic production relies on high inputs of manual labor and high levels of exposure to climatic elements during key production periods.

Author Contributions

G.T.Y. and J.A. contributed equally in the following tasks: conceptualization of the study; methodology development; investigation, data analysis; writing—original draft preparation; as well as the review and editing of the final draft. All authors have read and agreed to the published version of the manuscript.

Funding

This research was funded by Vetenskapsrådet (Swedish Research Council), Grant No: 2016-04884 and the Swedish International Development Cooperation Agency through the BREAD project.

Acknowledgments

We are grateful for the support provided by James C. Liljegren of the Strategic Security Sciences Division, Argonne National Laboratory, Illinois USA for sharing his software WBGT with us. We used this software to perform sensitivity analysis for our computations.

Conflicts of Interest

The authors declare no conflict of interest. The funders had no role in the design of the study; in the collection, analyses, or interpretation of data; in the writing of the manuscript, or in the decision to publish the results.

Appendix A

Identification Values for CORDEX Data Used:
Below are the ID’s for data sets used:
 Historical (1951–2005)
  •   cordex.output.AFR-44.SMHI.CCCma-
  •   CanESM2.historical.r1i1p1.RCA4.v1.3hr.tas.v20180109|esg-dn1.nsc.liu.se
  •   cordex.output.AFR-44.SMHI.CCCma-
  •   CanESM2.historical.r1i1p1.RCA4.v1.3hr.rsds.v20180109|esg-dn1.nsc.liu.se
  •   cordex.output.AFR-44.SMHI.CCCma-
  •   CanESM2.historical.r1i1p1.RCA4.v1.3hr.hurs.v20180109|esg-dn1.nsc.liu.se
 Simulations (2006–2100):
  •   cordex.output.AFR-44.SMHI.CCCma-
  •   CanESM2.rcp45.r1i1p1.RCA4.v1.3hr.tas.v20180109|esg-dn1.nsc.liu.se
  •   cordex.output.AFR-44.SMHI.CCCma-
  •   CanESM2.rcp45.r1i1p1.RCA4.v1.3hr.hurs.v20180109|esg-dn1.nsc.liu.se
  •    cordex.output.AFR-44.SMHI.CCCma-
  •   CanESM2.rcp45.r1i1p1.RCA4.v1.3hr.rsds.v20180109|esg-dn1.nsc.liu.se

Appendix B

Sensitivity of WBGT to Air Temperature (Ta) and Relative humidity (Rh). (WBGT used for the sensitivity analysis is derived using the software “WBGT”, developed by Liljegren JC, Carhart RA, Lawday P, Tschopp S, Sharp RJJoo, hygiene e (2008), who model the wet bulb globe temperature using standard meteorological measurements. 5:645–655).
Figure A1. Mean 24 h WBGT (°C) variability for one grid-cell in the year 2000, 2050 and 2100. WBGT calculated using near-surface relative humidity (RH, %), surface down welling shortwave radiation (Rs, W m−2) and surface air temperature (Ta, °C) at 2 m were derived from historical (year 2000) and RCP4.5 simulations (years 2050 and 2100) with the Second-Generation Canadian Center for Climate Modelling and Analysis Earth System Model (CanESM2) [56].
Atmosphere 11 00753 g0a1
Figure A2. Assessing the sensitivity of WBGT to air temperature (Ta) and relative humidity (Rh): (a) the interface for the software “WBGT” developed by Liljegren et al. (2008) [53]; (b) input data, air temperature (Ta) and relative humidity (Rh) used for the assessment of WBGT; (c) plots of the WBGT response to relative humidity (Rh) and to air temperature (Ta).
Atmosphere 11 00753 g0a2

Appendix C

Appendix C.1. Bias of CORDEX RCM Surface Temperature Data as Compared to Observations from Meteorological Stations

Appendix C.1.1. Introduction

When using climate simulation data for prognostic studies, it is important to quantify the bias between observed and simulated data. Either in order to do a bias correction or to get an estimate of the uncertainty of the prognoses done and the potential effects on downstream calculations. Here, we briefly described such a comparison between observations and model estimates, including potential effects on calculated WBGT.

Appendix C.1.2. Data and Methodology

Data

From the 3h CORDEX, surface air temperature data was a daily mean temperature calculated for the locations of 18 meteorological stations within the study area for the period 2006–2019 (Table A1). In total, 63027 daily mean temperature observations were used. These temperatures were compared to daily mean temperature data for the corresponding stations that were downloaded from the Global Surface Summary of the Day (GSOD) database provided by the National Oceanic and Atmospheric Administration (NOAA) at https://www.nodc.noaa.gov/ (Table A1).
Table A1. Meteorological stations used. United State Air Force number (USAF), station name, country, latitude, longitude and altitude.
USAFStation NameCountryLatitude
[Degrees]
Longitude
[Degrees]
Altitude
[m]
636020ARUAUganda3.0530.9171211
636300GULUUganda2.80632.2721069
636310LIRAKenya2.28332.9331189
637720LAMU MANDAKenya−2.25240.9136
636710WAJIRKenya1.73340.092234
639620SONGEATanzania−10.68335.5831067
637260KABALEUganda−1.2529.9831869
636020ARUAUganda3.0530.9171211
636120LODWARKenya3.12235.609522
639710MTWARATanzania−10.33940.182113
636120LODWARKenya3.12235.609522
636410MARSABITKenya2.30037.9001345
636610KITALEKenya0.97234.9591850
636860ELDORETKenya0.48335.3002120
637170NYERIKenya−0.50036.9671759
637230GARISSAKenya−0.46439.648148
637400NAIROBI JKIAKenya−1.31936.9281623
638700ZANZIBARTanzania−6.22239.22516

Methodology

For each station and year was the corresponding goodness of fit (R2), Mean Absolute Error, M A E = i = 1 n | P o i P s i | n and the Percent Bias P B I A S = i = 1 n ( P o i P s i ) i = 1 n P o i suggested by Luo et al. (2018).

Results

In total, 252 station years and 63027 daily mean temperature observations were used. R2 ranged from 0.0 to 0.42, and PBIAS ranged from −13.9% to 36.5% with a mean of 0.37%. MAE ranged from −2.3 °C to 6.5 °C with a mean of 0.04 °C. Approximately 80% of the observations (Figure A3a) show a MAE of 1 °C or less, whereas the percent bias is 5% or less for about 60% of the 252 station years studied (Figure A3b). Station 636410 (MARSABIT, Kenya) stands out with PBIAS ranging from 23 to 36% and MEA ranging from 1 to 6.5 °C. This indicate that, for most stations, the systematic error is low when described on an annual basis. This does not exclude larger unsystematic errors during shorter periods and individual days (Figure A4 gives an example for one year and one station.).
Figure A3. Distribution describing the relative and cumulative distributions of the mean absolute error (a) and percent bias (b) for 252 station years of Global Surface Summary of the Day (GSOD) daily man temperature compared to surface air temperature from a regional climate model for CORDEX-Africa. Both the error and the bias are centered around 0 indicating no systematic deviations.
Atmosphere 11 00753 g0a3
Figure A4. Comparison of mean daily surface temperature from Zanzibar (Station Temp. in graph) versus the mean daily surface temperature from CORDEX (RCM Temp) for the year 2016. (a) The mean daily observed temperature is in black and the CORDEX temperature is in blue. (b) Daily temperature difference (observed-CORDEX) and (c) scatterplot of observed versus estimated (RCM) temperature.
Atmosphere 11 00753 g0a4

Appendix C.1.3. Implications for WBGT

The effect of the uncertainty or bias of CORDEX-predicted surface air temperature (Ta, the most important input when calculating WBGT) was quantified by recalculation of WBGT for February-March 2050 (corresponding to Figure 2b in the main paper) using Ta − 2 °C and Ta + 2 °C. We consider ±2 °C as a reasonable approximation of the uncertainty of the CORDEX-predicted surface air temperature based on Figure A3b. Figure A5 describe the spatial distribution of the outputs as well as the histograms for WBGT calculated with Ta − 2, Ta, Ta + 2. The increase in WBGT (February-March, 2050) when using Ta+2 compared to using Ta (Figure A6a) range from about 1.5° to 2.1° The decrease in WBGT (February–March, 2050) when using Ta − 2 compared to WBGT calculated with Ta range from approximately −2.1° to −1.5° (Figure A6b).
Figure A5. Maximum WBGT for February-March in 2050 assuming a data uncertainty of the surface air temperature of ±2 °C. Spatial distribution (a) and histograms with cumulative distributions in blue of maximal WBGT (b).
Atmosphere 11 00753 g0a5
Figure A6. Relative and cumulative (blue line) distributions of the effects of an uncertainty of ±2 °C in air surface temperature on maximum WBGT for February-March 2050. WBGT[C] (x-axis) is the difference (WBGTTa+2–WBGTTa) assuming Ta to be CORDEX Ta+2 °C (a) and (WBGTTa-2–WBGTTa) assuming Ta to be CORDEX Ta−2 °C (b).
Atmosphere 11 00753 g0a6

Appendix D

Table A2. Agricultural calendar showing planting and harvesting periods, as well as crop cycles within each agro-ecological zone in Kenya, Uganda and Tanzania. Source: FAO.
CountryAgro-Ecological ZonesCropping CyclePlanting Period-OnsetPlanting Period-EndCrop Cycle (Days)Harvest Period-OnsetHarvest Period-End
KenyaLower Highland Zone 1 (LH1)First28 February31 March180-27001 September20 December
KenyaLower Highland Zone 1 (LH1)Second01 September30 September180–27001 February30 June
KenyaLower Highland Zone 2 (LH2)First01 March31 March180–27001 September20 December
KenyaLower Highland Zone 2 (LH2)Second01 August15 October180–27001 January15 May
KenyaLower Highland Zone 3 (LH3)First15 March31 March180–27015 September20 December
KenyaLower Highland Zone 3 (LH3)Second01 October31 October180–27001 May30 June
KenyaLower Highland Zone 4 (LH4)First15 March31 March180–27015 September20 December
KenyaLower midland zone 1 (LM1)First15 March15 April110–15001 August15 September
KenyaLower midland zone 1 (LM1)Second01 September15 October110–15001 January15 March
KenyaLower midland zone 2 (LM2)First15 March15 April110–15001 August15 September
KenyaLower midland zone 2 (LM2)Second01 August15 October110–15001 December15 March
KenyaLower midland zone 3 (LM3)First01 March31 March110–15001 August31 August
KenyaLower midland zone 3 (LM3)Second15 October31 October110–15001 February31 March
KenyaLower midland zone 4 (LM4)First01 March31 March90–12001 July15 August
KenyaLower midland zone 4 (LM4)Second01 October31 October90–12001 January28 February
KenyaLowerland zone 2 (L2) and (IL2)First01 April15 April90–12015 July15 August
KenyaLowerland zone 3 (L3) 15 April30 April90–12015 July15 August
KenyaLowerland zone 4 (L4) 15 March15 April90–12015 July15 August
KenyaUpper Highland Zone 2 (UH2)First25 March05 April210–28001 July20 December
KenyaUpper Highland Zone 2 (UH2)Second15 October31 October210–28001 May31 July
KenyaUpper Highland Zone 1 (UH 1)First15 March31 March210–28015 September20 December
KenyaUpper Highland Zone 1 (UH 1)Second15 October31 October210–28001 May31 July
KenyaUpper midland zone 1(UM1)First15 February31 March135–16001 August15 September
KenyaUpper midland zone 1(UM1)Second01 August15 October135–16015 December31 March
KenyaUpper midland zone 2 (UM2)First15 March15 April135–16001 August30 September
KenyaUpper midland zone 2 (UM2)Second01 August15 October135–16015 December31 March
KenyaUpper midland zone 3 (UM3)First01 March31 March135–16001 August30 September
KenyaUpper midland zone 3 (UM3)Second15 October31 October135–16001 February31 March
KenyaUpper midland zone 4 (UM4)First01 March15 April135–16015 August30 September
KenyaUpper midland zone 4 (UM4)Second15 October21 October135–16028 February31 March
UgandaBusoga Farming System 25 February15 August110–12015 June15 December
UgandaEastern Highlands 15 March30 April120–18015 August30 October
UgandaEastern Savannah 15 March15 August110–12005 July20 December
UgandaKaramoja Dry Zone 01 April30 April100–11010 July20 August
UgandaKaramoja Wet Zone 20 March20 April100–12030 June20 August
UgandaLake Albert Crescent 20 March31 August110–12010 July31 December
UgandaLake Victoria Crescent 25 January31 August110–12015 May31 December
UgandaNorthern Farming System 15 March20 July110–12005 July20 December
UgandaSouth Western Highlands 15 August15 September150–18015 January15 February
UgandaWest Nile Farming System 20 March20 July110–12010 July20 November
UgandaWestern Range Lands 15 August15 September110–12005 December15 January
TanzaniaCentral Plateaux (Plains) 01 November31 December90–18001 February30 June
TanzaniaCoastal Plains 01 October31 May90–12501 January10 October
TanzaniaEastern Plateaux and Mt. Blocks 01 December15 June90–12501 March10 November
TanzaniaHigh Plains and Plateaux 01 December31 December110–19001 March30 June
TanzaniaInland Sediments 01 May31 May90–11001 August20 September
TanzaniaRuaha Rift Zone - Alluvial Flats 01 December31 December90–11001 March15 April
TanzaniaUfipa Plateau 01 January31 January180–19001 July15 August
TanzaniaVolcanoes and Rift Depressions 01 January30 November90–19001 April31 May
TanzaniaWestern Highlands 01 January31 January90–19001 April15 August

References

  1. Gao, C.; Kuklane, K.; Östergren, P.-O.; Kjellstrom, T. Occupational heat stress assessment and protective strategies in the context of climate change. Int. J. Biometeorol. 2018, 62, 359–371. [Google Scholar] [CrossRef] [PubMed]
  2. Kjellstrom, T.; Lemke, B.; Otto, M.; Hyatt, O.; Briggs, D.; Freyberg, C. Climate Change and Increasing Heat Impacts on Labor Productivity. 2015. Available online: http://unfcc.int/files/science/workstreams/the_2013-2015_review/ (accessed on 12 February 2019).
  3. Perkins-Kirkpatrick, S.; Gibson, P. Changes in regional heatwave characteristics as a function of increasing global temperature. Sci. Rep. 2017, 7, 12256. [Google Scholar] [CrossRef] [PubMed]
  4. Jalloh, A.; Nelson, G.C.; Thomas, T.S.; Zougmoré, R.B.; Roy-Macauley, H. West African Agriculture and Climate Change: A Comprehensive Analysis; International Food Policy Research Institute: Washington, DC, USA, 2013. [Google Scholar]
  5. Thamo, T.; Addai, D.; Pannell, D.J.; Robertson, M.J.; Thomas, D.T.; Young, J.M. Climate change impacts and farm-level adaptation: Economic analysis of a mixed cropping–livestock system. Agric. Syst. 2017, 150, 99–108. [Google Scholar] [CrossRef]
  6. Kjellstrom, T.; Briggs, D.; Freyberg, C.; Lemke, B.; Otto, M.; Hyatt, O. Heat, human performance, and occupational health: A key issue for the assessment of global climate change impacts. Annu. Rev. Public Health 2016, 37, 97–112. [Google Scholar] [CrossRef] [PubMed] [Green Version]
  7. Cubasch, U.; Wuebbles, D.; Chen, D.; Facchini, M.C.; Frame, D.; Mahowald, N.; Winther, J.-G. Introduction. In Climate Change 2013: The Physical Science Basis—Contribution of Working Group I to the Fifth Assessment Report of the Intergovernmental Panel on Climate Change; Stocker, T.F., Qin, D., Plattner, G.-K., Tignor, M., Allen, S.K., Boschung, J., Nauels, A., Xia, Y., Bex, V., Midgley, P.M., Eds.; Cambridge University Press: Cambridge, UK; New York, NY, USA, 2013; Volume 292, p. 1261. [Google Scholar]
  8. Huang, C.; Barnett, A.G.; Wang, X.; Vaneckova, P.; FitzGerald, G.; Tong, S. Projecting future heat-related mortality under climate change scenarios: A systematic review. Environ. Health Perspect. 2011, 119, 1681. [Google Scholar] [CrossRef] [PubMed] [Green Version]
  9. Jones, H.M. Climate Change and Increasing Risk of Extreme Heat. In Human Health and Physical Activity during Heat Exposure; Springer: Berlin/Heidelberg, Germany, 2018; pp. 1–13. [Google Scholar]
  10. Krishnan, S. Assessment of Heat Stress and Its Health Impacts on Health of Workers from Different Occupational Sectors. Ph.D. Thesis, Sri Ramachandra University, Chennai, India, 2017. [Google Scholar]
  11. Costello, A.; Abbas, M.; Allen, A.; Ball, S.; Bell, S.; Bellamy, R.; Friel, S.; Groce, N.; Johnson, A.; Kett, M. Managing the health effects of climate change: Lancet and University College London Institute for Global Health Commission. Lancet 2009, 373, 1693–1733. [Google Scholar] [CrossRef]
  12. Adhikari, U.; Nejadhashemi, A.P.; Woznicki, S.A. Climate change and eastern Africa: A review of impact on major crops. Food Energy Secur. 2015, 4, 110–132. [Google Scholar] [CrossRef]
  13. Descheemaeker, K.; Oosting, S.J.; Tui, S.H.-K.; Masikati, P.; Falconnier, G.N.; Giller, K.E. Climate change adaptation and mitigation in smallholder crop–livestock systems in sub-Saharan Africa: A call for integrated impact assessments. Reg. Environ. Chang. 2016, 16, 2331–2343. [Google Scholar] [CrossRef] [Green Version]
  14. Pereira, L. Climate Change Impacts on Agriculture across Africa. Oxford Research Encyclopedia of Environmental Science, 2017. Available online: https://oxfordre.com/environmentalscience/view/10.1093/acrefore/9780199389414.001.0001/acrefore-9780199389414-e-292 (accessed on 22 September 2018).
  15. Ramirez-Villegas, J.; Thornton, P.K. Climate Change Impacts on African Crop Production; CGIAR Research Program on Climate Change, Agriculture and Food Security (CCAFS): Copenhagen, Denmark, 2015; p. 27. [Google Scholar]
  16. Pecl, G.T.; Araújo, M.B.; Bell, J.D.; Blanchard, J.; Bonebrake, T.C.; Chen, I.-C.; Clark, T.D.; Colwell, R.K.; Danielsen, F.; Evengård, B. Biodiversity redistribution under climate change: Impacts on ecosystems and human well-being. Science 2017, 355, eaai9214. [Google Scholar] [CrossRef]
  17. Rojas-Downing, M.M.; Nejadhashemi, A.P.; Harrigan, T.; Woznicki, S.A. Climate change and livestock: Impacts, adaptation, and mitigation. Clim. Risk Manag. 2017, 16, 145–163. [Google Scholar] [CrossRef]
  18. Weindl, I.; Lotze-Campen, H.; Popp, A.; Müller, C.; Havlík, P.; Herrero, M.; Schmitz, C.; Rolinski, S. Livestock in a changing climate: Production system transitions as an adaptation strategy for agriculture. Environ. Res. Lett. 2015, 10, 094021. [Google Scholar] [CrossRef]
  19. Neumann, B.; Vafeidis, A.T.; Zimmermann, J.; Nicholls, R. Future coastal population growth and exposure to sea-level rise and coastal flooding-a global assessment. PLoS ONE 2015, 10, e0118571. [Google Scholar] [CrossRef] [PubMed]
  20. Serdeczny, O.; Adams, S.; Baarsch, F.; Coumou, D.; Robinson, A.; Hare, W.; Schaeffer, M.; Perrette, M.; Reinhardt, J. Climate change impacts in Sub-Saharan Africa: From physical changes to their social repercussions. Reg. Environ. Chang. 2017, 17, 1585–1600. [Google Scholar] [CrossRef]
  21. Kjellstrom, T.; Holmer, I.; Lemke, B. Workplace heat stress, health and productivity—An increasing challenge for low and middle-income countries during climate change. Glob. Health Action 2009, 2, 2047. [Google Scholar] [CrossRef] [PubMed]
  22. Kjellstrom., T.; Lemke, B.; Otto, M.; Hyatt, O.; Briggs, D.; Freyberg, C. Threats to Occupational Health, Labor Productivity and the Economy from Increasing Heat during Climate Change: An Emerging Global Health Risk and a Challenge to Sustainable Development and Social Equity Vol Technical Report 2014: 2; Climate Change Health Impact & Prevention (ClimateCHIP): Mapua, New Zealand, 2014. [Google Scholar]
  23. FAO. FAOSTAT Statistical Database; Food and Agriculture Organization of the United Nations: Rome, Italy, 2020; Available online: http://www.fao.org/faostat/en/ (accessed on 3 April 2020).
  24. Olsson, L.; Chadee, D.D.; Hoegh-Guldberg, O.; Porter, J.R.; Pörtner, H.-O.; Smith, K.R.; Travasso, M.I.; Tschakert, P. Cross-chapter box on heat stress and heat waves. In Climate Change 2014: Impacts, Adaptation, and Vulnerability. Contribution of WG II to the Fifth Assessment Report of the IPCC; Field, C.B., Barros, V.R., Dokken, D.J., Mach, K.J., Mastrandrea, M.D., Bilir, T.E., Chatterjee, M., Ebi, K.L., Estrada, Y.O., Genova, R.C., et al., Eds.; Cambridge University Press: New York, NY, USA, 2014; pp. 109–111. [Google Scholar]
  25. Coumou, D.; Robinson, A.; Rahmstorf, S. Global increase in record-breaking monthly-mean temperatures. Clim. Chang. 2013, 118, 771–782. [Google Scholar] [CrossRef]
  26. Forzieri, G.; Cescatti, A.; e Silva, F.B.; Feyen, L. Increasing risk over time of weather-related hazards to the European population: A data-driven prognostic study. Lancet Planet. Health 2017, 1, e200–e208. [Google Scholar] [CrossRef]
  27. Miralles, D.G.; Teuling, A.J.; Van Heerwaarden, C.C.; de Arellano, J.V.-G. Mega-heatwave temperatures due to combined soil desiccation and atmospheric heat accumulation. Nature Geosci. 2014, 7, 345. [Google Scholar] [CrossRef]
  28. Lesk, C.; Rowhani, P.; Ramankutty, N. Influence of extreme weather disasters on global crop production. Nature 2016, 529, 84. [Google Scholar] [CrossRef]
  29. Quiller, G.; Krenz, J.; Ebi, K.; Hess, J.J.; Fenske, R.A.; Sampson, P.D.; Pan, M.; Spector, J.T. Heat exposure and productivity in orchards: Implications for climate change research. Arch. Environ. Occup. Health 2017, 72, 313–316. [Google Scholar] [CrossRef]
  30. Mbow, C.; Smith, P.; Skole, D.; Duguma, L.; Bustamante, M. Achieving mitigation and adaptation to climate change through sustainable agroforestry practices in Africa. Curr. Opin. Environ. Sustain. 2014, 6, 8–14. [Google Scholar] [CrossRef] [Green Version]
  31. Wallace, P.J.; Mckinlay, B.J.; Coletta, N.A.; Vlaar, J.I.; Taber, M.J.; Wilson, P.M.; Cheung, S.S. Effects of motivational self-talk on endurance and cognitive performance in the heat. Med. Sci. Sports Exerc. 2017, 49, 191–199. [Google Scholar] [CrossRef] [PubMed]
  32. Schmit, C.; Hausswirth, C.; Le Meur, Y.; Duffield, R. Cognitive functioning and heat strain: Performance responses and protective strategies. Sports Med. 2017, 47, 1289–1302. [Google Scholar] [CrossRef]
  33. Zander, K.K.; Botzen, W.J.; Oppermann, E.; Kjellstrom, T.; Garnett, S.T. Heat stress causes substantial labour productivity loss in Australia. Nat. Clim. Chang. 2015, 5, 647. [Google Scholar] [CrossRef]
  34. Kovats, R.S.; Hajat, S. Heat stress and public health: A critical review. Annu. Rev. Public Health 2008, 29, 41–55. [Google Scholar] [CrossRef]
  35. Horie, S. Prevention of heat stress disorders in the workplace. J. Jpn. Med Assoc. 2012, 141, 289–293. [Google Scholar]
  36. Shackleton, S.; Ziervogel, G.; Sallu, S.; Gill, T.; Tschakert, P. Why is socially-just climate change adaptation in sub-Saharan Africa so challenging? A review of barriers identified from empirical cases. Wiley Interdiscip. Rev. Clim. Chang. 2015, 6, 321–344. [Google Scholar] [CrossRef] [Green Version]
  37. UNCTAD. The Role of Smallholder Farmers in Sustainable Commodities Production and Trade; United Nations Conference on Trade and Development (UNCTAD): Geneva, Switzerland, 2015; p. 17. [Google Scholar]
  38. Rapsomanikis, G. The Economic Lives of Smallholder Farmers—An Analysis Based on Household Data from Nine Countries; United Nations Food and Agriculture Organization (FAO): Rome, Italy, 2016; p. 47. [Google Scholar]
  39. Abraham, M.; Pingali, P. Transforming smallholder agriculture to achieve the SDGs In The Role of Small Farms in Food and Nutrition Security; Riesgo, L., Gomez-Y-Paloma, S., Louhichi, K., Eds.; Springer: New York, NY, USA, 2017; p. 41. [Google Scholar]
  40. Mrema, G.; Baker, D.; Kahan, D. Agricultural Mechanization in Africa: Time for Action; Food and Agriculture Organization of the United Nations (FAO): Rome, Italy, 2008; p. 36. [Google Scholar]
  41. Houmy, K.; Clarke, L.J.; Ashburner, J.E.; Kienzle, J. Agricultural Mechanization in Sub-Saharan Africa—Guidelines for Preparing a Strategy; Food and Agriculture Organization of the United Nations (FAO): Rome, Italy, 2013; p. 105. [Google Scholar]
  42. Falola, T. Africanizing Knowledge: African Studies across the Disciplines; Routledge: London, UK, 2017. [Google Scholar]
  43. Sims, B.G.; Kienzle, J. Farm Power and Mechanization for Small Farms in Sub-Saharan Africa; Food and Agriculture Organization of the United Nations (FAO): Rome, Italy, 2007; p. 92. [Google Scholar]
  44. Lotter, D. Facing food insecurity in Africa: Why, after 30 years of work in organic agriculture, I am promoting the use of synthetic fertilizers and herbicides in small-scale staple crop production. Agric. Hum. Values 2015, 32, 111–118. [Google Scholar] [CrossRef]
  45. Kassa, H.; Dondeyne, S.; Poesen, J.; Frankl, A.; Nyssen, J. Transition from forest-based to cereal-based agricultural systems: A review of the drivers of land use change and degradation in Southwest Ethiopia. Land Degrad. Dev. 2017, 28, 431–449. [Google Scholar] [CrossRef] [Green Version]
  46. Fairhead, J.; Fraser, J.; Amanor, K.; Solomon, D.; Lehmann, J.; Leach, M. Indigenous Soil Enrichment for Food Security and Climate Change in Africa and Asia: A Review. In Indigenous Knowledge-Enhancing Contribution to Natural Resource Management; CABI: Wallingford, UK, 2017; pp. 99–115. [Google Scholar]
  47. Willis, R.G. The Fipa and Related Peoples of South-West Tanzania and North-East Zambia: East Central Africa; Routledge: London, UK, 2017. [Google Scholar]
  48. Knight, C.G. Ethnoscience and the African farmer: Rationale and strategy. In Indigenous Knowledge Systems and Development; University Press of America: Lanham, MD, USA, 1980; pp. 205–231. [Google Scholar]
  49. Joy, P. The crisis of farming systems in Luapula Province, Zambia. Nord. J. Afr. Stud. 1993, 2, 118–141. [Google Scholar]
  50. Murray, S.E. Conservation tillage. In Sustainable Intensification of Crop Production; Reddy, P.P., Ed.; Springer Nature: Singapore, 2016; pp. 27–40. [Google Scholar]
  51. Njoh, A.J. Transportation infrastructure and economic development in sub-Saharan Africa. Public Works Manag. Policy 2000, 4, 286–296. [Google Scholar] [CrossRef]
  52. USDAAF. Heat Stress Control and Heat Casualty Management; US Department of the Army and Air Force (USDAAF): Washington, DC, USA, 2003. [Google Scholar]
  53. Liljegren, J.C.; Carhart, R.A.; Lawday, P.; Tschopp, S.; Sharp, R. Modeling the wet bulb globe temperature using standard meteorological measurements. J. Occup. Environ. Hyg. 2008, 5, 645–655. [Google Scholar] [CrossRef] [PubMed]
  54. Yaglou, C.; Minaed, D. Control of heat casualties at military training centers. Arch. Indust. Health 1957, 16, 302–316. [Google Scholar]
  55. Jones, C.; Giorgi, F.; Asrar, G. The Coordinated Regional Downscaling Experiment: CORDEX–an international downscaling link to CMIP5. CLIVAR Exch. 2011, 16, 34–40. [Google Scholar]
  56. Arora, V.; Scinocca, J.; Boer, G.; Christian, J.; Denman, K.; Flato, G.; Kharin, V.; Lee, W.; Merryfield, W.J.G.R.L. Carbon emission limits required to satisfy future representative concentration pathways of greenhouse gases. Geophys. Res. Lett. 2011, 38, 1–6. [Google Scholar] [CrossRef]
  57. Hajizadeh, R.; Farhang Dehghan, S.; Golbabaei, F.; Jafari, S.M.; Karajizadeh, M. Offering a model for estimating black globe temperature according to meteorological measurements. Meteorol. Appl. 2017, 24, 303–307. [Google Scholar] [CrossRef] [Green Version]
  58. Stull, R. Wet-bulb temperature from relative humidity and air temperature. J. Appl. Meteorol. Climatol. 2011, 50, 2267–2269. [Google Scholar] [CrossRef] [Green Version]
  59. Luo, M.; Liu, T.; Meng, F.; Duan, Y.; Frankl, A.; Bao, A.; De Maeyer, P. Comparing bias correction methods used in downscaling precipitation and temperature from regional climate models: A case study from the Kaidu River Basin in Western China. Water 2018, 10, 1046. [Google Scholar] [CrossRef] [Green Version]
  60. Casanueva, A.; Kotlarski, S.; Herrera, S.; Fischer, A.M.; Kjellstrom, T.; Schwierz, C. Climate projections of a multivariate heat stress index: The role of downscaling and bias correction. Geosci. Model Dev. 2019, 12, 3419–3438. [Google Scholar] [CrossRef]
  61. IPCC. Climate Change 2013: The Physical Science Basis. In Contribution of Working Group I to the Fifth Assessment Report of the Intergovernmental Panel on Climate Change; Stocker, T.F., Qin, D., Plattner, G.-K., Tignor, M., Allen, S.K., Boschung, J., Nauels, A., Xia, Y., Bex, V., Midgley, P.M., Eds.; Cambridge University Press: Cambridge, UK; New York, NY, USA, 2013; p. 1535. [Google Scholar]
  62. Kohut, L. Stress tolerance of military personnel during exercise in hot, dry climates–Prevention and treatment. Medicine 2008, 7, 301–307. [Google Scholar]
  63. Frimpong, K.; Eddie Van Etten, E.; Oosthuzien, J.; Nunfam, V.F. Heat exposure on farmers in northeast Ghana. Int. J. Biometeorol. 2017, 61, 397–406. [Google Scholar] [CrossRef]
  64. Frimpong, K.; Odonkor, S.T.; Kuranchie, F.A.; Nunfam, V.F. Evaluation of heat stress impacts and adaptations: Perspectives from smallholder rural farmers in Bawku East of Northern Ghana. Heliyon 2020, 6, e03679. [Google Scholar] [CrossRef] [PubMed]
  65. Sadiq, L.S.; Hashim, Z.; Osman, M. The Impact of Heat on Health and Productivity among Maize Farmers in a Tropical Climate Area. J. Environ. Public Health 2019, 2019. [Google Scholar] [CrossRef] [PubMed]
  66. ICLARM. The Context of Small-Scale Integrated Agriculture-Aquaculture Systems in Africa: A Case Study of Malawi; Number 5878; International Center for Living Aquatic Resources Management (ICLARM), The WorldFish Center: Manilla, Philippines, 1991; Volume 18, p. 311. [Google Scholar]
  67. FAO. Small Family Farms Data Portrait: Basic Information on Document—Methodology and Data Description; Food and Agriculture Organization of the United Nations Organization: Rome, Italy, 2017; p. 16. Available online: http://www.fao.org/fileadmin/user_upload/smallholders_dataportrait/docs/Data_portrait_variables_description_new2.pdf (accessed on 7 February 2020).
  68. Field, C.B. Climate change 2014–Impacts, Adaptation and Vulnerability: Regional Aspects; Cambridge University Press: Cambridge, UK, 2014. [Google Scholar]
  69. Sonwa, D.J.; Dieye, A.; El Mzouri, E.-H.; Majule, A.; Mugabe, F.T.; Omolo, N.; Wouapi, H.; Obando, J.; Brooks, N. Drivers of climate risk in African agriculture. Clim. Dev. 2017, 9, 383–398. [Google Scholar] [CrossRef]
  70. Shiferaw, B.; Tesfaye, K.; Kassie, M.; Abate, T.; Prasanna, B.; Menkir, A. Managing vulnerability to drought and enhancing livelihood resilience in sub-Saharan Africa: Technological, institutional and policy options. Weather Clim. Extrem. 2014, 3, 67–79. [Google Scholar] [CrossRef] [Green Version]
  71. Lankoski, J.; Ollikainen, M.; Uusitalo, P. No-till Technology: Benefits to Farmers and the Environment; Agrifood Research Finland: Helsinki, Finland, 2004; p. 36. [Google Scholar]
  72. Mukasa, A.N.; Woldemichael, A.D.; Salami, A.O.; Simpasa, A.M. Africa’s Agricultural Transformation: Identifying Priority Areas and Overcoming Challenges. Afr. Econ. Brief 2017, 8, 1–16. [Google Scholar]
  73. Crowe, J.; Manuel Moya-Bonilla, J.; Román-Solano, B.; Robles-Ramírez, A. Heat exposure in sugarcane workers in Costa Rica during the non-harvest season. Glob. Health Action 2010, 3, 5619. [Google Scholar] [CrossRef] [Green Version]
  74. Bodin, T.; García-Trabanino, R.; Weiss, I.; Jarquín, E.; Glaser, J.; Jakobsson, K.; Lucas, R.A.I.; Wesseling, C.; Hogstedt, C.; Wegman, D.H. Intervention to reduce heat stress and improve efficiency among sugarcane workers in El Salvador: Phase 1. Occup. Environ. Med. 2016, 73, 409–416. [Google Scholar] [CrossRef] [Green Version]
  75. Watts, N.; Adger, W.N.; Agnolucci, P.; Blackstock, J.; Byass, P.; Cai, W.; Chaytor, S.; Colbourn, T.; Collins, M.; Cooper, A.J.T.L. Health and climate change: Policy responses to protect public health. Lancet 2015, 386, 1861–1914. [Google Scholar] [CrossRef]
  76. Ngwenya, B.; Oosthuizen, J.; Cross, M.; Frimpong, K. Heat Stress and Adaptation Strategies of Outdoors Workers in the City of Bulawayo, Zimbabwe. Community Med. Public Health Care 2018, 5, 034. [Google Scholar] [CrossRef]
  77. WHO. Protecting Health in Europe from Climate Change—2017 Update; The Regional Office for Europe of the World Health Organization (WHO): Copenhagen, Denmark, 2017; p. 85. [Google Scholar]
  78. Wilhelmi, O.; Hayden, M. Reducing vulnerability to extreme heat through interdisciplinary research and stakeholder engagement. In Extreme Weather, Health, and Communities; Springer: Berlin/Heidelberg, Germany, 2016; pp. 165–186. [Google Scholar]
  79. Conway, G. The science of climate change in Africa: Impacts and adaptation. Grantham Inst. Clim. Chang. Discuss. Pap. 2009, 1, 24. [Google Scholar]
  80. Niang, I.; Ruppel, O.; Abdrabo, M.; Essel, A.; Lennard, C.; Padgham, J.; Urquhart, P. Contribution of Working Group II to the Fifth Assessment Report of the Intergovernmental Panel on Climate Change. In Climate Change 2014: Impacts, Adaptation and Vulnerability; Cambridge University Press: Cambridge, UK, 2014. [Google Scholar]
  81. AGRA. Africa Agriculture Status Report: Catalyzing Government Capacity to Drive Agricultural Transformation; Alliance for a Green Revolution in Africa (AGRA): Nairobi, Kenya, 2018; p. 234. [Google Scholar]
Figure 1. Location of the countries studied in East Africa, Kenya, Tanzania, and Uganda—showing the varied altitudinal ranges as well as the diversity of agro-ecological zones.
Atmosphere 11 00753 g001
Figure 2. The distribution of cropland density—computed as a percent of cropland per 0.44° × 0.44° grid cell. This is input data for the stratification of cropping intensity.
Atmosphere 11 00753 g002
Figure 3. Distribution of maximum WBGT for the months of February–March (ac), and August–September (df) in the years 2000, 2050 and 2100.
Atmosphere 11 00753 g003
Figure 4. Frequency distribution and cumulative probability of WBGT and varying cropping intensities for February–March 2000, 2050, and 2100.
Atmosphere 11 00753 g004
Figure 5. Frequency distribution and cumulative probability of WBGT and varying cropping intensities for August–September 2000, 2050, and 2100.
Atmosphere 11 00753 g005
Table 1. Some heat related illnesses (condition and symptoms)—modified from the Centres for Disease Control (CDC).
ConditionSymptoms
Heat stroke
The body’s response to loss of water and salt from heavy sweating.
  • High body temperature (103°F or higher)
  • Hot, red, dry, or damp skin
  • Fast, strong pulse
  • Headache
  • Dizziness
  • Nausea
  • Confusion
  • Losing consciousness (passing out)
Heat exhaustion
Develops when a person is working or exercising in hot weather and does not drink enough liquids to replace those lost liquids.
  • Heavy sweating
  • Cold, pale, and clammy skin
  • Fast, weak pulse
  • Nausea or vomiting
  • Muscle cramps
  • Tiredness or weakness
  • Dizziness
  • Headache
  • Fainting (passing out)
Heat cramps
Caused by the loss of body salts and fluid during sweating. Low salt levels in muscles cause painful cramps.
  • Heavy sweating during intense exercise
  • Muscle pain or spasms
Sunburn
A painful sign of skin damage from spending too much time outdoors without wearing a protective sunscreen
  • Painful, red, and warm skin
  • Blisters on the skin
Heat rash
Caused by sweat that does not evaporate from the skin.
  • Red clusters of small blisters that look like pimples on the skin (usually on the neck, chest, groin, or in elbow creases)
Heatstroke (also known as sunstroke)
Occurs when the body fails to regulate its own temperature and body temperature continues to rise, often to or above 40.6 °C.
  • Unconsciousness for longer than a few seconds.
  • Confusion, severe restlessness, or anxiety.
  • Convulsion (seizure).
  • Symptoms of moderate to severe difficulty breathing.
  • Fast heart rate.
  • Sweating that may be heavy or may have stopped.
  • Skin that may be red, hot, and dry, even in the armpits.
  • Nausea and vomiting.
Table 2. Recommended maximum Wet Bulb Globe Temperature (WBGT) exposure levels (°C) at different work intensities and rest/work ratios for an average acclimatized worker wearing light clothing. Source: compiled by Kjellström et al. 2009 from the International Organization for Standardization (ISO) 18 and the National Institute for Occupational Safety and Health (NIOSH) (criteria for a recommended standard: occupational exposure to hot environments. NIOSH Publication No. 86113. Atlanta, GA: National Institute of Occupational Health; 1986).
Metabolic Rate Class (Work Intensity)1
(Light)
2
(Medium)
3
(Heavy)
4
(Very Heavy)
Continuous work, 0% rest/hour31282725.5
25% rest/hour31.52927.526.5
50% rest/hour3230.529.528
75% rest/hour32.53231.531
No work at all (100% rest/hour)39373634
Table 3. Examples of activities within metabolic rate categories (from Naval Medical Command, 1988, Manual Of Naval Preventive Medicine, Washignton DC, 20372–5120, https://www.med.navy.mil/directives/CanPublications/5010-3.pdf) equated to farming practices undertaken by smallholder farmers. (Estimated from Monica Dungarwal and Maya Choudhry, 2003, Energy Balance of Farm Labourers. J. Hum. Ecol., 14(1): 51–55. Starred activities are estimates of the metabolic category of farm activities by authors.)
Physical ActivityAverage Metabolic Rate Kcal/hrComparative Farm ActivitiesAverage Metabolic Rate Kcal/hr
(a) Sitting
Moderate arm and trunk movement (e.g., typing, drafting, driving a car in light traffic)
68
Moderate arm and leg movement (e.g., general laboratory work, slow movement about an office)
82
Heavy arm and leg movement (e.g., driving a car in moderate traffic)
99
(b) Standing
Light work at machine or bench, mostly arms
82
Threshing
Weeding
Harvesting maize in a standing position
95
Light work at machine or bench, some moving about (e.g., using a table saw, driving a truck in light traffic)
99
Moderate work at machine or bench, some walking about (e.g., replacing tires, driving a car in heavy traffic)
119
Manual planting of maize using machete, dibber or hoe
109
(c) Walking About, with Moderate Lifting or Pushing (e.g., driving a truck in moderate traffic, scrubbing in a standing position)164Hoeing179.6
(d) Intermittent Heavy Lifting, Pushing or Pulling (e.g., sawing wood by hand, callisthenic exercise, pick and shovel work)238Bunding—Ridging and mound formation during land preparation205
(e) Hardest Sustained Work300
Table 4. Mean national summaries of on-farm labour (days per year).
Family on-Farm Labour (Days per Year)
Kenya, 2005231
United Republic of Tanzania, 2013189
Uganda, 2012192
Table 5. Maximum daily WBGT per grid cell, disaggregated to areal cropland percentage for the months of February–March and August–September for the years 2000, 2050 and 2100. The values hence describe the variability of the max daily WBGT (n, min mean, max and standard deviation, (stdev)).
AUG-SEP WBGT200020502100
Cropland%nMinMeanMaxStdevnMinMeanMaxStdevnMinMeanMaxStdev
>0%113116.7425.1932.582.57113118.8926.7234.002.23113118.5027.1431.992.57
>50%19317.4125.0129.103.0319319.8526.6329.882.3719319.5726.7330.322.84
>75%10719.2626.2328.812.7610721.7427.5729.882.0510720.9027.8530.182.67
>90%7121.5727.6828.811.497123.7428.5529.881.177123.0729.2330.071.39
FEB-MAR WBGT200020502100
Cropland%nMinMeanMaxStdevnMinMeanMaxStdevnMinMeanMaxStdev
>0%113115.3022.9427.4§92.61113116.4223.4931.302.90113118.4325.3830.332.27
>50%19316.3023.1327.482.2719317.1123.7230.262.3819319.2225.4028.882.03
>75%10718.6424.1325.431.5910719.5224.4730.261.5510721.8226.1828.731.40
>90%7121.2824.8125.420.657122.1724.7027.140.957123.5326.5727.460.74

