Article

Occurrence and Development of an Extreme Precipitation Event in the Ili Valley, Xinjiang, China and Analysis of Gravity Waves

1
Key Laboratory of Cloud-Precipitation Physics and Severe Storms, Institute of Atmospheric Physics, Chinese Academy of Sciences, Beijing 100029, China
2
College of Earth and Planetary Sciences, University of Chinese Academy of Sciences, Beijing 100049, China
3
Institute of Desert Meteorology, China Meteorological Administration, Urumqi 830002, China
4
State Key Laboratory of Severe Weather, Chinese Academy of Meteorological Sciences, Beijing 100081, China
*
Author to whom correspondence should be addressed.
Atmosphere 2020, 11(7), 752; https://doi.org/10.3390/atmos11070752
Submission received: 23 June 2020 / Revised: 12 July 2020 / Accepted: 13 July 2020 / Published: 16 July 2020
(This article belongs to the Section Meteorology)

Abstract

:
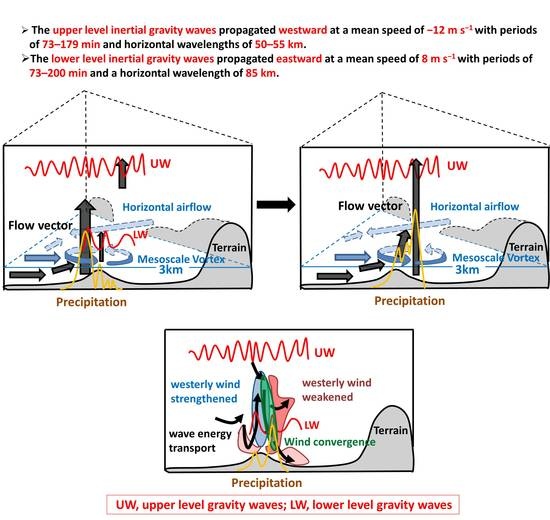
We used observational data and the results from a high-resolution numerical simulation model to analyze the occurrence and development of an extreme precipitation event in the Ili Valley, Xinjiang, China on 26 June 2015. We analyzed the horizontal wavelength, period, speed, ducting, energy propagation and feedback mechanism of inertial gravity waves. A low-level convergence line was formed in the valley by the northerly and westerly winds as a result of Central Asian vortices and the trumpet-shaped topography of the Ili Valley. There was sufficient water vapor in the valley for the precipitation event to develop. A mesoscale vortex formed and developed on the low-level convergence line and the rainfall was distributed either near the convergence line or the mesoscale vortex. The low-level convergence line and the uplift caused by the terrain triggered convection, and then the convection triggered waves at lower levels. The combination of ascending motion induced by the lower level waves and the mesoscale vortex led to the development of convection, causing the precipitation to intensify. When the convection moved eastward to Gongliu County, it was coupled with the ascending phase of upper level waves, causing both the convection and precipitation to intensify again. We applied spectral analysis methods to verify that the waves were inertial gravity waves. The upper level inertial gravity waves propagated westward at a mean speed of −12 m s−1 with periods of 73–179 min and horizontal wavelengths of 50–55 km. The lower level inertial gravity waves propagated eastward at a mean speed of 8 m s−1 with periods of 73–200 min and a horizontal wavelength of 85 km. The more (less) favorable waveguide conditions determined whether the gravity waves persisted for a long (short) time and propagated for a longer (shorter) distance. Based on the mesoscale Eliassen–Palm flux theory, the wave energy of inertial gravity waves had an important effect on the maintenance and development of convection and precipitation by affecting wind strength and wind divergence. Feedback was mainly through the meridional and vertical transport of zonal momentum and the meridional transport of heat.

Graphical Abstract

1. Introduction

Xinjiang is located in an arid and semiarid region of northwestern China. Previous studies in this region have focused on drought disasters and there has been little research on extreme precipitation events, although rainstorms and floods often occur during the summer and can have serious impacts on both the economy and peoples’ lives [1,2,3]. The characteristics of precipitation in Xinjiang are very different from the monsoon regions in eastern and southern China and show a strong locality and variability. Research on precipitation in the arid and semiarid regions of northwestern China is clearly lagging behind that in the monsoon regions of China [1]. Zhang and Deng [3] reported that heavy precipitation in Xinjiang is confined to the windward slopes of mountains and mountainous regions, such as the Ili Valley, which has some of the heaviest precipitation in Xinjiang. Further work is therefore required into the mechanisms of precipitation in this area, especially extreme precipitation events.
Xinjiang forecasters generally agree that precipitation in the Ili Valley is greatly affected by the topography. However, the role of topography is difficult in precipitation research and there are still a number of uncertainties. Studies on the mechanisms of precipitation have shown that topography is crucial in the movement of the air and it has important dynamic and thermal effects on the occurrence, development, intensity and distribution of precipitation [4,5]. The dynamic effects of topography include uplift due to blocking by mountains [6,7,8,9], which results in convergence and divergence that affect the occurrence and development of precipitation. Even if the uplift caused by terrain-induced convergence is mainly at low levels, it can also affect the mid- to high-level circulation via the release of latent heat and therefore also affects the local mesoscale convection [10,11,12,13,14,15,16].
Many studies have shown that, under the background of an appropriate large-scale weather system, meso- and micro-scale weather systems are the direct cause of heavy rain and that the occurrence and development of such meso- and micro-scale weather systems are often related to the topography. Wang et al. [17] found that the blocking effect of the mesoscale terrain can cause the airflow to converge at low altitudes, causing the formation of mesoscale wind shear lines and mesoscale vortices, accelerating ascending motion and leading to the development of mesoscale convection. Some studies have found that a trumpet-shaped topography enhances ascending motion and the mesoscale convergence line, increasing the likelihood of rainstorms [18,19]. The Ili Valley, which is surrounded by mountains to the north, east and south and is open to the west, has a typical trumpet-shaped topography (Figure 1). There have been a few cases studies and statistical analyses of the impact of the topography of Ili Valley on precipitation [2,20,21], but these studies are not sufficiently detained. In addition, the topographic effects are restricted by weather systems, so the mechanisms of the occurrence and development of orographic precipitation in the Ili Valley, especially extreme precipitation events, still require further research.
Gravity waves are an important mechanism affecting the occurrence and development of precipitation. Gravity waves have the ability to organize belt-shaped precipitation, which directly affects mesoscale rain belts and the intensity and distribution of precipitation [22,23,24,25,26,27,28,29,30,31,32,33,34]. Li [24] showed that gravity waves can trigger rainstorms by affecting the organization of cumulus convection. Zhang et al. [34] found that wet convection transports gravity wave energy downward and therefore enhances convection. Fovell et al. [23] found that the formation of convection cells in front of the squall line is related to the gravity waves caused by latent heat. Su and Zhai [30] found that the gravity waves generated by previous convection propagate to the convergence line, after which convection is triggered at the intersection. One case study has suggested the existence of gravity waves during heavy rain in Xinjiang [35], but the process by which gravity waves affect extreme precipitation events in Xinjiang is still unclear.
Mesoscale inertial gravity waves have a horizontal wavelength of 50–500 km and a period of 0.5–4 h [31,36,37]. Since the range of the inertial gravity wave spectrum is broad, the observational techniques (e.g., satellite, radar and radiosonde) can only capture part of the wave information [38]. Numerical simulations can provide a higher spatial and temporal resolution that better represents the characteristics of inertial gravity waves than observational data and they are therefore important tools for studying their characteristics and development [30,35,38,39]. Spectral analysis is an important tool. Fourier analysis is often used to analyze atmospheric waves to detect the various types of waves present [34,40,41]. Fourier analysis can be used to decompose the total energy of the time series into components at different frequencies and then diagnose the main period of the sequence based on the contribution of waves with different frequencies [38,39,42,43,44,45,46]. The cross-spectrum method based on Fourier analysis can be used to analyze the correlation and phase difference of two stationary sequences (such as two physical quantities) in the frequency domain. Based on the polarization theory of inertial gravity waves [47,48,49], cross-spectrum analysis can be used to identify and analyze inertial gravity waves. However, as Fourier analysis uses a global transform, the specific spatiotemporal information of these frequency signals cannot be determined. To overcome this shortcoming, wavelet analysis has been developed and applied to the analysis of the Earth’s atmosphere [46,50,51,52,53,54]. Wavelet cross-spectrum analysis is based on the wavelet transform, which can be used to study the correlation and phase difference between two time series in the time–frequency domain [48,55,56]. In addition, Lomb–Scargle analysis is a powerful technique to compute periodicity of unequally spaced data [57,58,59]. Since it can allow the gap in the time series data, this method has been used to analyze gravity waves in some studies [60,61].
Wave flow interaction is an important area of research in atmospheric dynamics and includes the forcing of waves by the mean flow (the wave activity relation) and the feedback to the mean flow from the waves (the Eliassen–Palm flux theory). The Eliassen–Palm flux was first proposed in 1961 [62] and is one of the most basic tools for studying the interaction between small-amplitude waves and the mean flow. It can separate the disturbance in the equation from the mean flow and describes the influence of the disturbed momentum flux and the disturbed heat flux on the mean flow. There has been much research on Eliassen–Palm flux theory [63,64,65,66,67,68,69,70,71,72,73,74,75,76,77,78,79,80] and previous studies have shown that the large-scale Eliassen–Palm flux is parallel to the group velocity of Rossby waves. When other conditions remain unchanged, the Eliassen–Palm flux divergence can accelerate the mean westerly wind, whereas Eliassen–Palm flux convergence can weaken it.
This theory can explain some important weather phenomena and is therefore widely used in weather analysis [81,82,83], though it is mainly concentrated on large-scale systems. However, there are relatively few theoretical studies at the mesoscale. Liu et al. [84] derived an Eliassen–Palm flux suitable for meso- and micro-scale weather systems and verified that the flux is parallel to the group velocity of inertial gravity waves. In another word, the Eliassen–Palm flux can indicate the direction of propagation of inertial gravity wave energy. We can therefore study the energy propagation of inertial gravity waves and the feedback mechanisms between inertial gravity waves and the mean flow of extreme precipitation events.
More than 24 mm of precipitation fell in the Ili Valley on 26 June 2015, reaching more than 40 mm in some areas. The 24-h rainfall in Gongliu County was 94.8 mm and the total rainfall reached 104 mm, exceeding the local historical extremes. This is definitely an extreme precipitation event. The mechanisms of this extreme precipitation event are unclear and the relationship between the topography, convection and gravity waves in the Ili Valley and their role in this event remain undefined. We focus here on an analysis of their interactions and their roles in this extreme precipitation event.

2. Case Overview

Figure 1a shows the distribution of topography in the focused region, with the red star marking the center of the Ili Valley. The Ili Valley is located in the northwestern corner of Xinjiang, China and is a triangular area surrounded on three sides by mountains, with an opening to the west, leading to a typical trumpet-shaped topography. The distribution of the six-hour cumulative precipitation was based on a merged precipitation product from the China Meteorological Administration (Figure 1b, Available at http://data.cma.cn/data/cdcdetail/dataCode/SEVP_CLI_CHN_MERGE_CMP_PRE_HOUR_GRID_0.10.html) [85]. Precipitation was mainly distributed in the center of the Ili Valley, with a maximum cumulative precipitation >50 mm. Precipitation data from an automatic weather station in Gongliu County (Figure 1c) show that the precipitation mainly occurred from 17:00 UTC on 26 June to 00:00 UTC on 27 June 2015, with heavy rain starting at 17:00 UTC on 26 June. The one-hour cumulative precipitation reached nearly 20 mm at 19:00 UTC on 26 June. This extreme precipitation event therefore had a strong intensity, concentrated period of rainfall and strong locality.
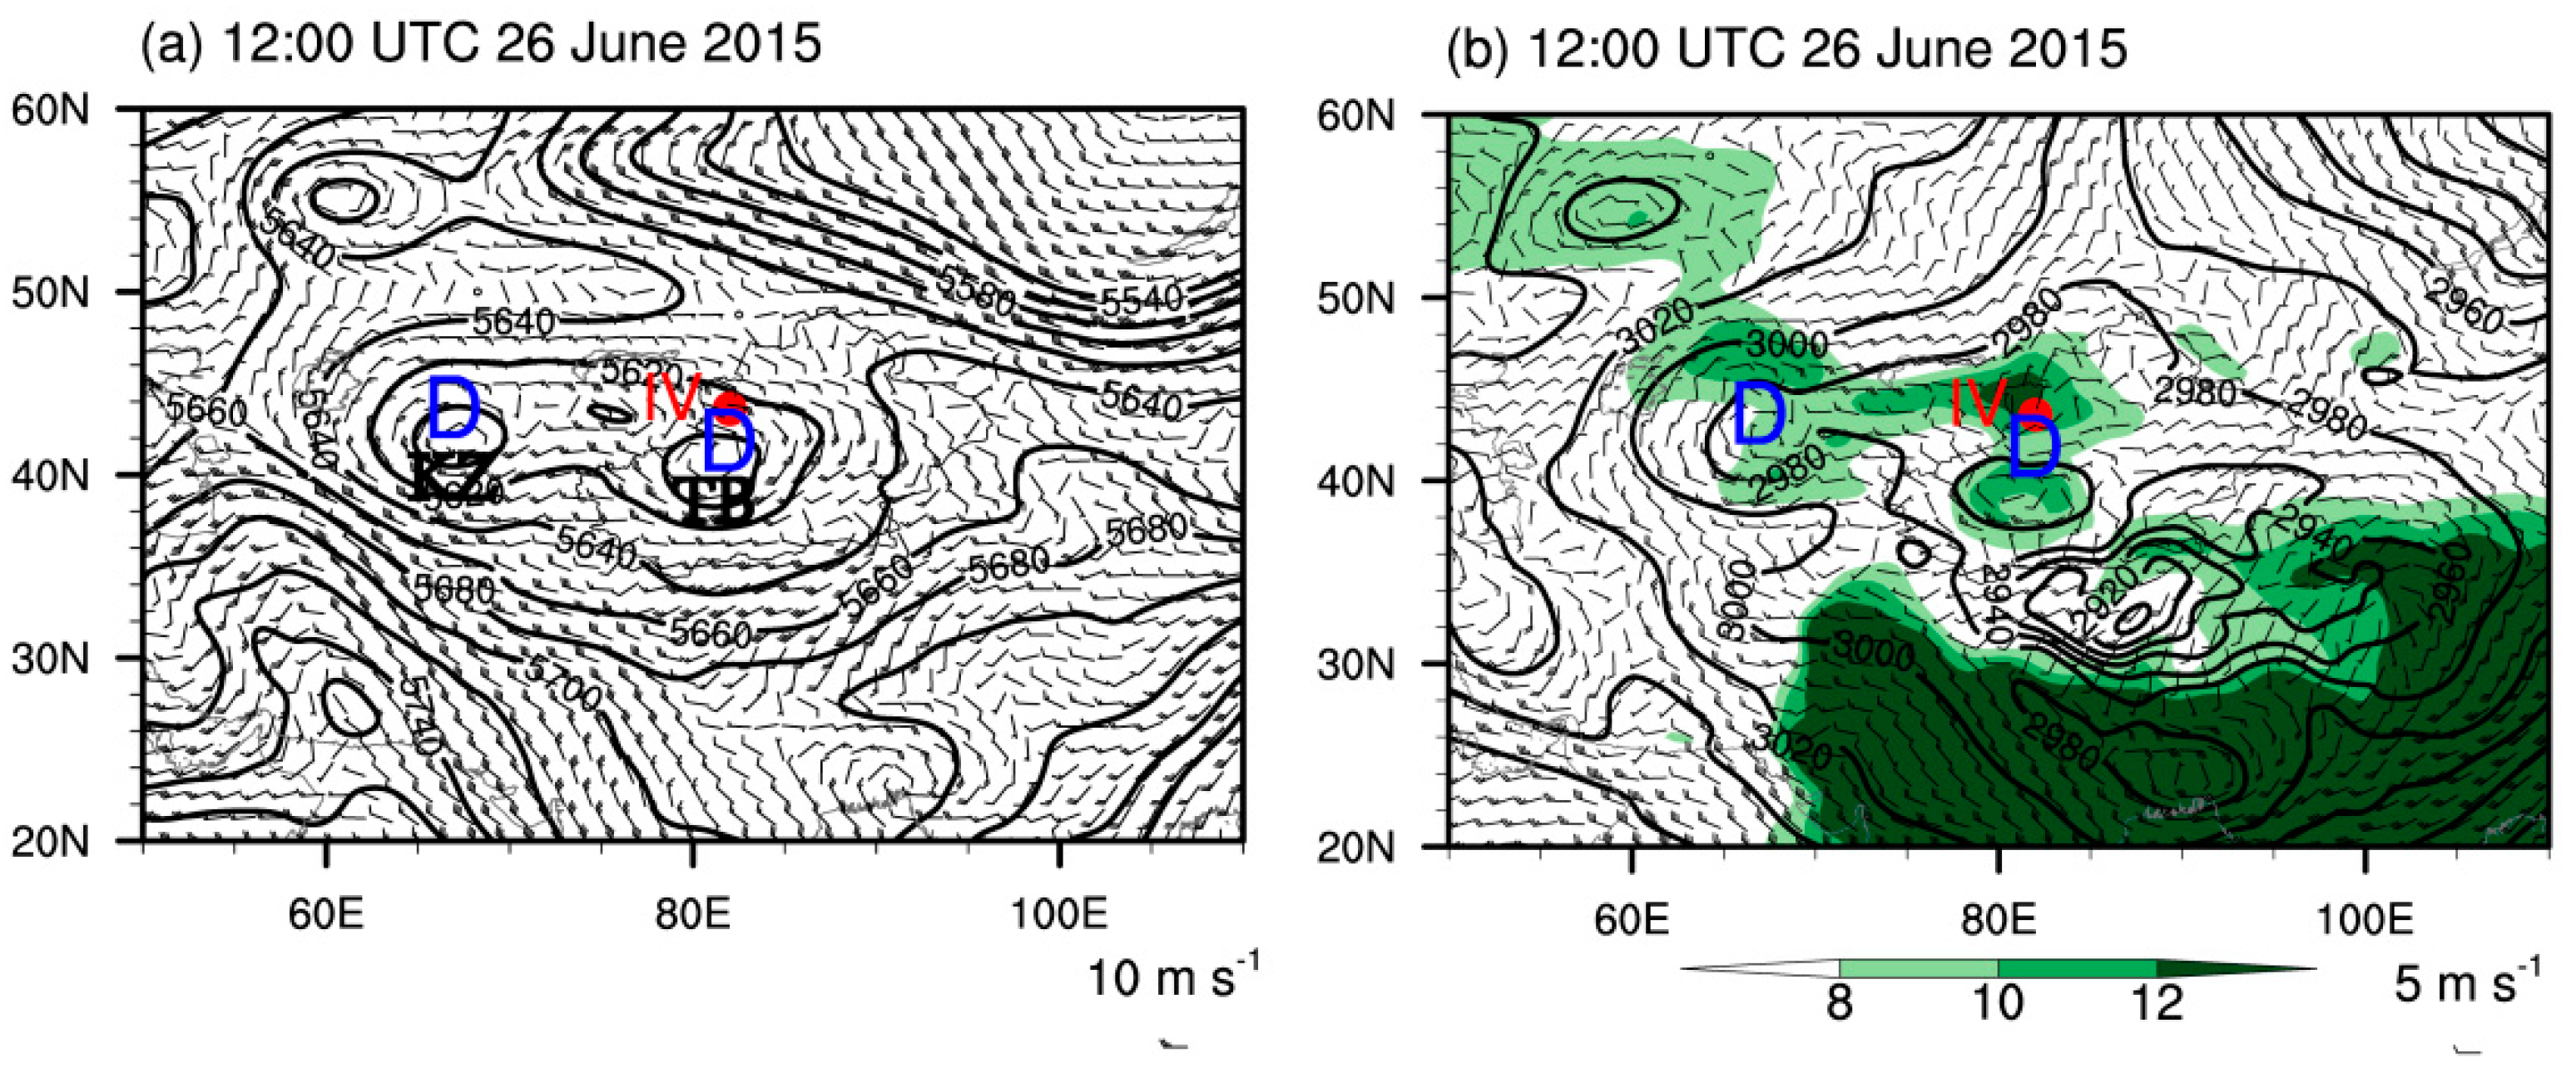
Favorable large-scale conditions are required for an extreme precipitation event to occur. We used ERA-Interim reanalysis data [86] from the European Center for Medium-Range Weather Forecasts (ECMWF) with a spatial resolution of 0.25° × 0.25° and a time interval of six hours to analyze the background circulation at 12:00 UTC on 26 June 2015. The mid-latitude circulation at 500 hPa (Figure 2a) presented two ridges and one trough—that is, there was a Central Asian vortex in Kazakhstan and the Tarim Basin, with a high pressure ridge on either side of the vortices. As a result of this favorable circulation [87,88], the two Central Asian vortices were stable and slow-moving, affecting the weather in the Ili Valley over a long period of time. The Ili Valley was mainly controlled by southeasterly winds on the northern side of the Central Asian vortex in the Tarim Basin. There were also two vortices at 700 hPa (Figure 2b), the centers of which corresponded to the positions of the Central Asian vortices at 500 hPa. The Ili Valley was therefore mainly controlled by westerly winds, which converged with a northerly wind flow in the northern Ili Valley.
The specific humidity at 850 hPa (Figure 2b) shows that, except for the area south of 36° N, the distribution of water vapor was closely related to the vortices and the topography of the Ili Valley. The specific humidity in the Ili Valley was up to 12 g kg−1, indicating that there was sufficient water vapor in the valley. The westerly winds transported water vapor into the valley through the western opening of the trumpet-shaped topography of the Ili Valley. Water vapor accumulated in the valley as a result of blocking by the mountains surrounding the valley. The circulation at 18:00 UTC on June 26 was the same as that at 12:00 UTC (not shown).
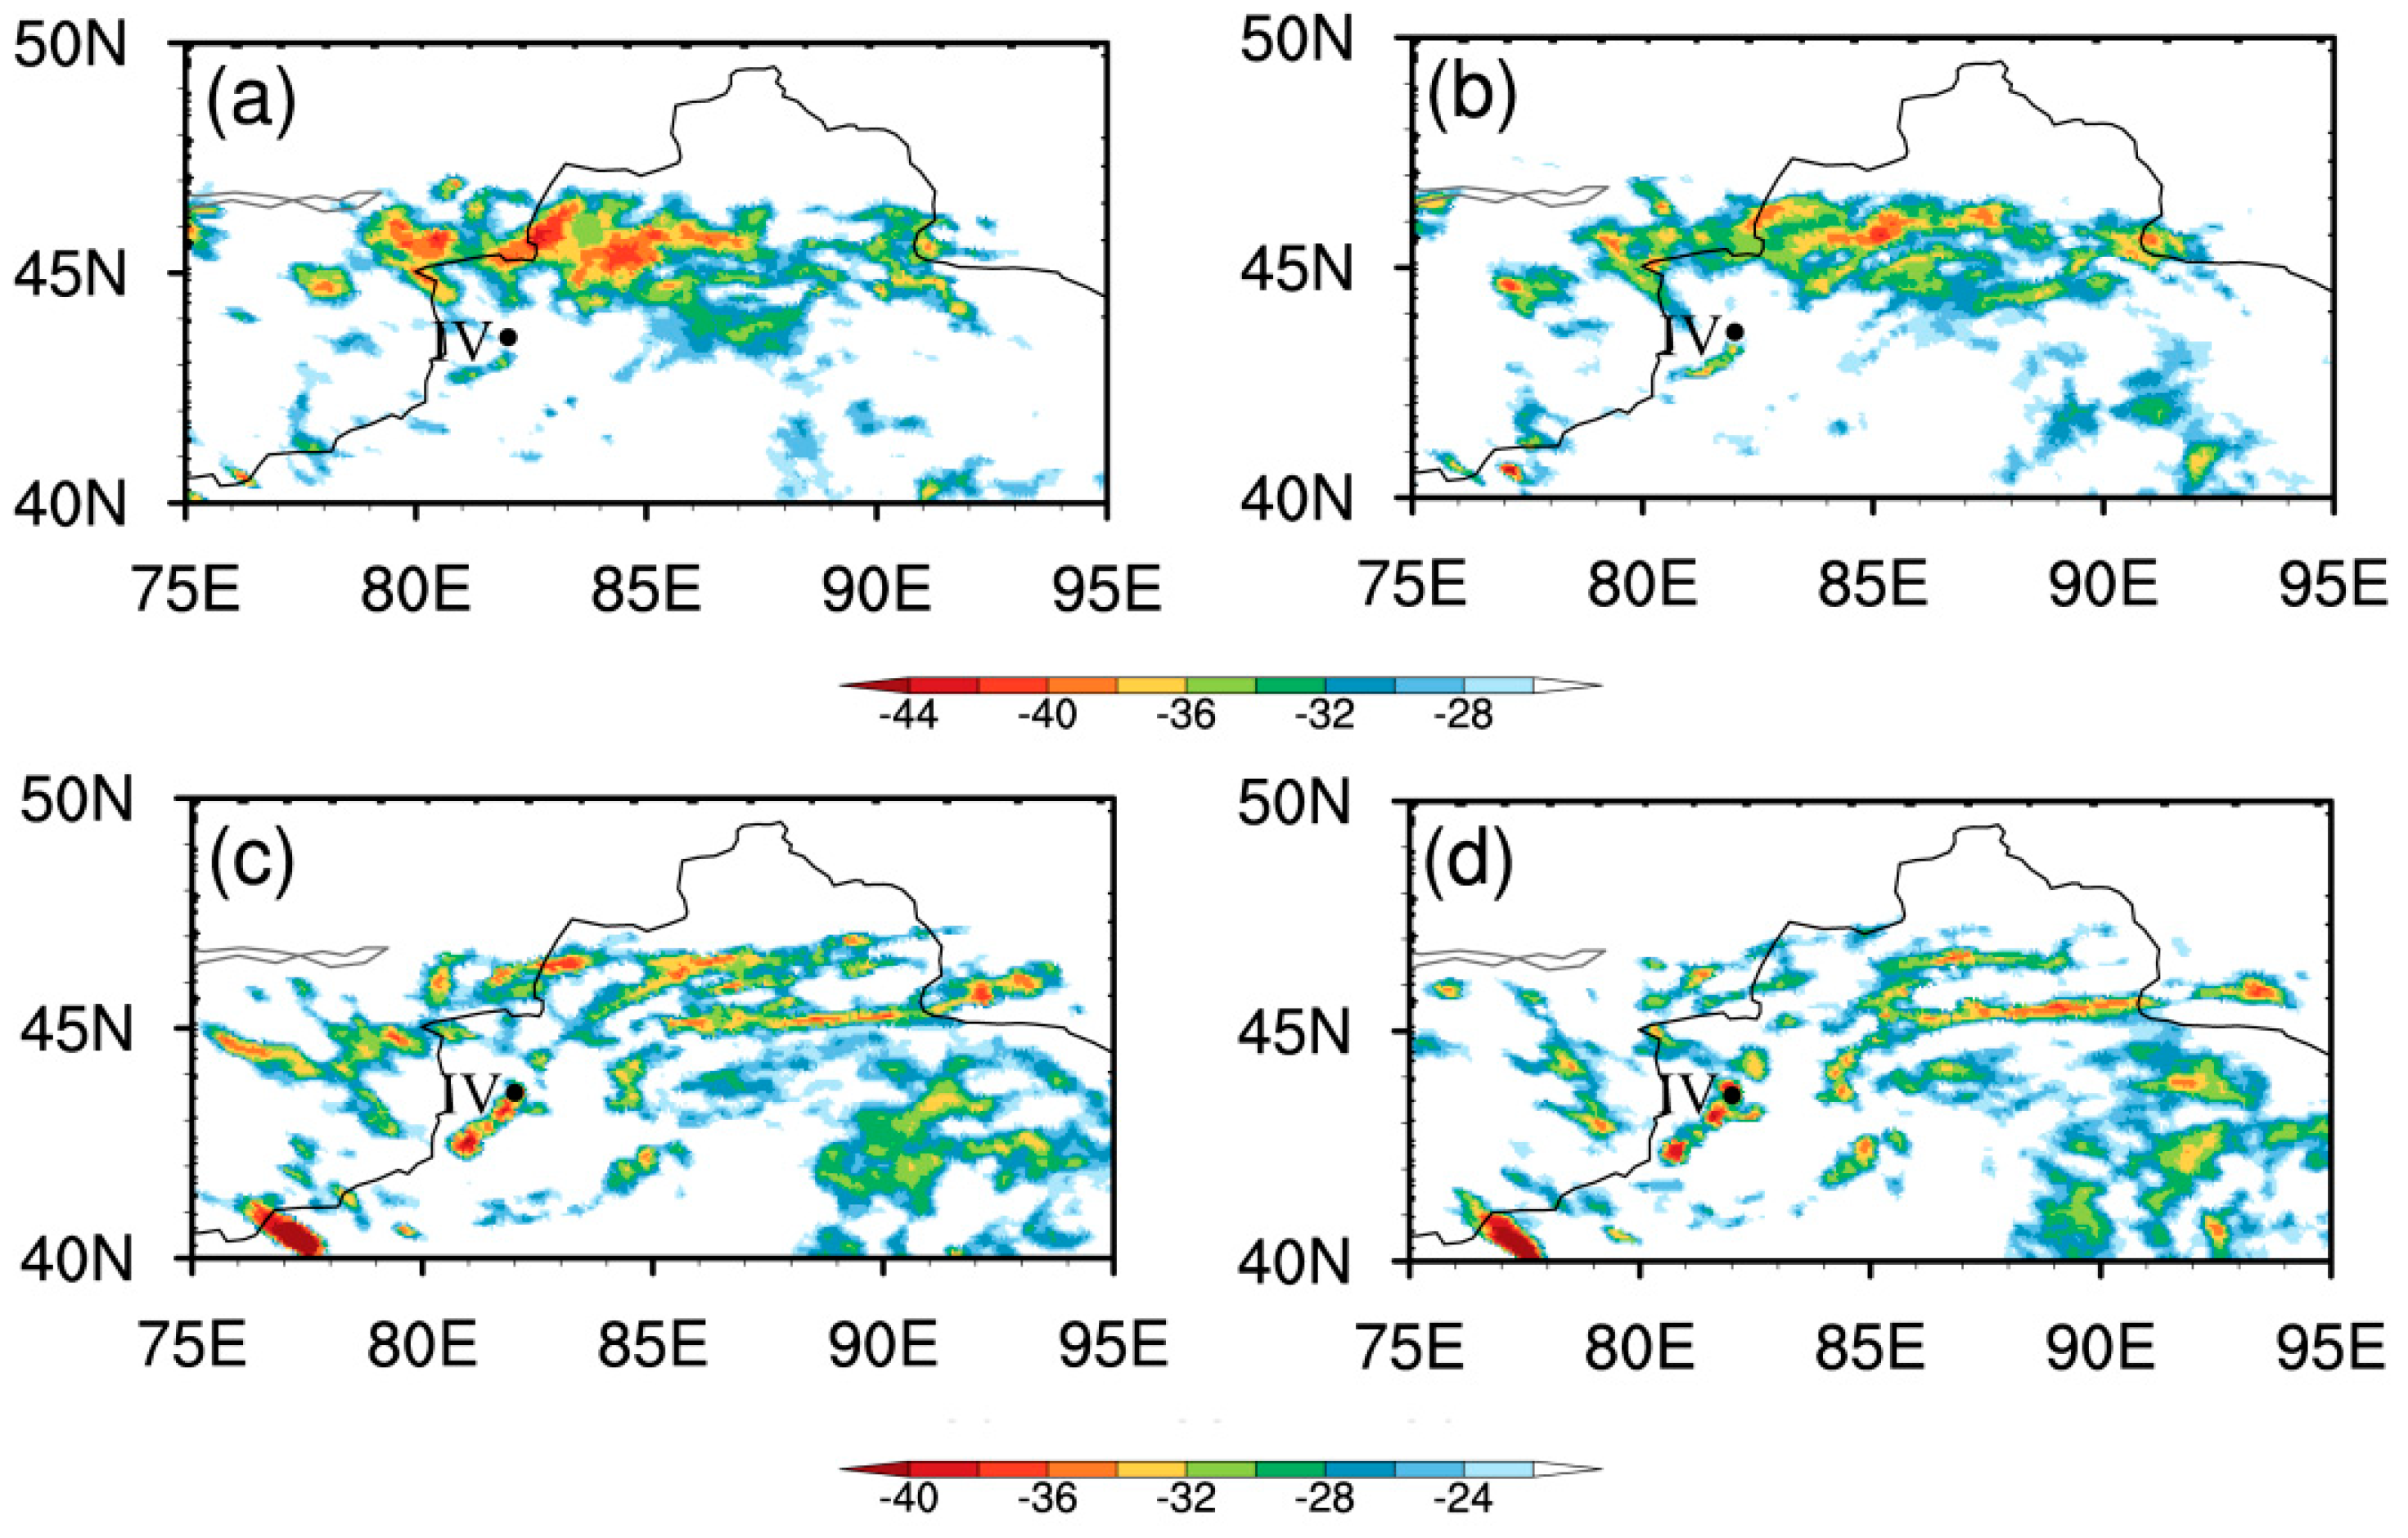
The terrain in Xinjiang is complex and routine observations are both scarce and unevenly distributed. It is therefore difficult to capture the characteristics and evolution of meso- and micro-scale weather systems using routine observations. By contrast, satellite observations are a powerful tool for analyzing meso- and micro-scale weather systems in this area. We used the FY-2F hourly black body temperature data (spatial resolution 0.1° × 0.1°, time interval one hour) provided by the China Meteorological Administration (Available at http://data.cma.cn/data/detail/dataCode/SK.0483.001.html) to analyze the activity and evolution of the mesoscale weather system related to this extreme precipitation event.
Several banded convective cells with a southwest–northeast orientation began to develop near the Ili Valley on its northern side at 15:00 UTC on 26 June 2015 (Figure 3a). These convection cells showed a wave-like cluster, and there was weaker convection in the Ili Valley itself. The intensity of the band of convective cells weakened slightly at 16:00 UTC (Figure 3b), but showed a clearer wave-like structure. There was still a clear wave-like convective structure in the Ili Valley and on its northern side at 18:00 UTC (Figure 3c), and the intensity of the banded convective cells in the Ili Valley increased significantly; the observational data show heavy rain in the Ili Valley at this time. The intensity of the banded convective cells on the northern side of the Ili Valley continued to weaken at 19:00 UTC (Figure 3d), whereas the banded convective cells in the Ili Valley were maintained and slightly strengthened, affecting the amount of precipitation. There was a wave-like structure—namely, banded convective cells—over the Ili Valley during this precipitation process. Previous studies [39,40] have shown that this extreme precipitation event was probably affected by waves. However, the satellite data cannot describe the complete characteristics of the waves, nor can they investigate how the waves were maintained and developed, or their effect on precipitation in the Ili Valley.

3. Model Simulation

3.1. Model Configuration

It is difficult to capture the meso- and micro-scale weather systems, especially waves, for this extreme precipitation event using observational data due to the high intensity of precipitation, the concentrated period of rainfall and the strong locality. As a result, the mechanisms of the occurrence and development of precipitation cannot be analyzed well. We therefore carried out high-resolution numerical analysis using the Weather Research and Forecasting (WRF) model to simulate this extreme precipitation event in the Ili Valley.
The model was initialized at 12:00 UTC on 26 June 2016 using the initial and lateral boundary conditions from the ECMWF ERA-Interim reanalysis dataset [86] with a spatial resolution of 0.25° × 0.25° and a time interval of six hours. The simulations used a two-way nested grid setup with two domains (Figure 1). The grid spacing in the outer domain (Dom1) was 12 km and that in the inner domain (Dom2) was 4 km. The vertical grid contained 51 layers with the model top set at 100 hPa. The adapted physical parameterizations are the Morrison two-moment microphysics scheme [89] and the ACM2 planetary boundary layer scheme [90]. According to previous studies [30,39], the Kain–Fritsch (new Eta) convection parameterization [91] was applied in the 12 km mesh outer domain, but not in the 4 km mesh inner domain.

3.2. Evaluation of the Simulation

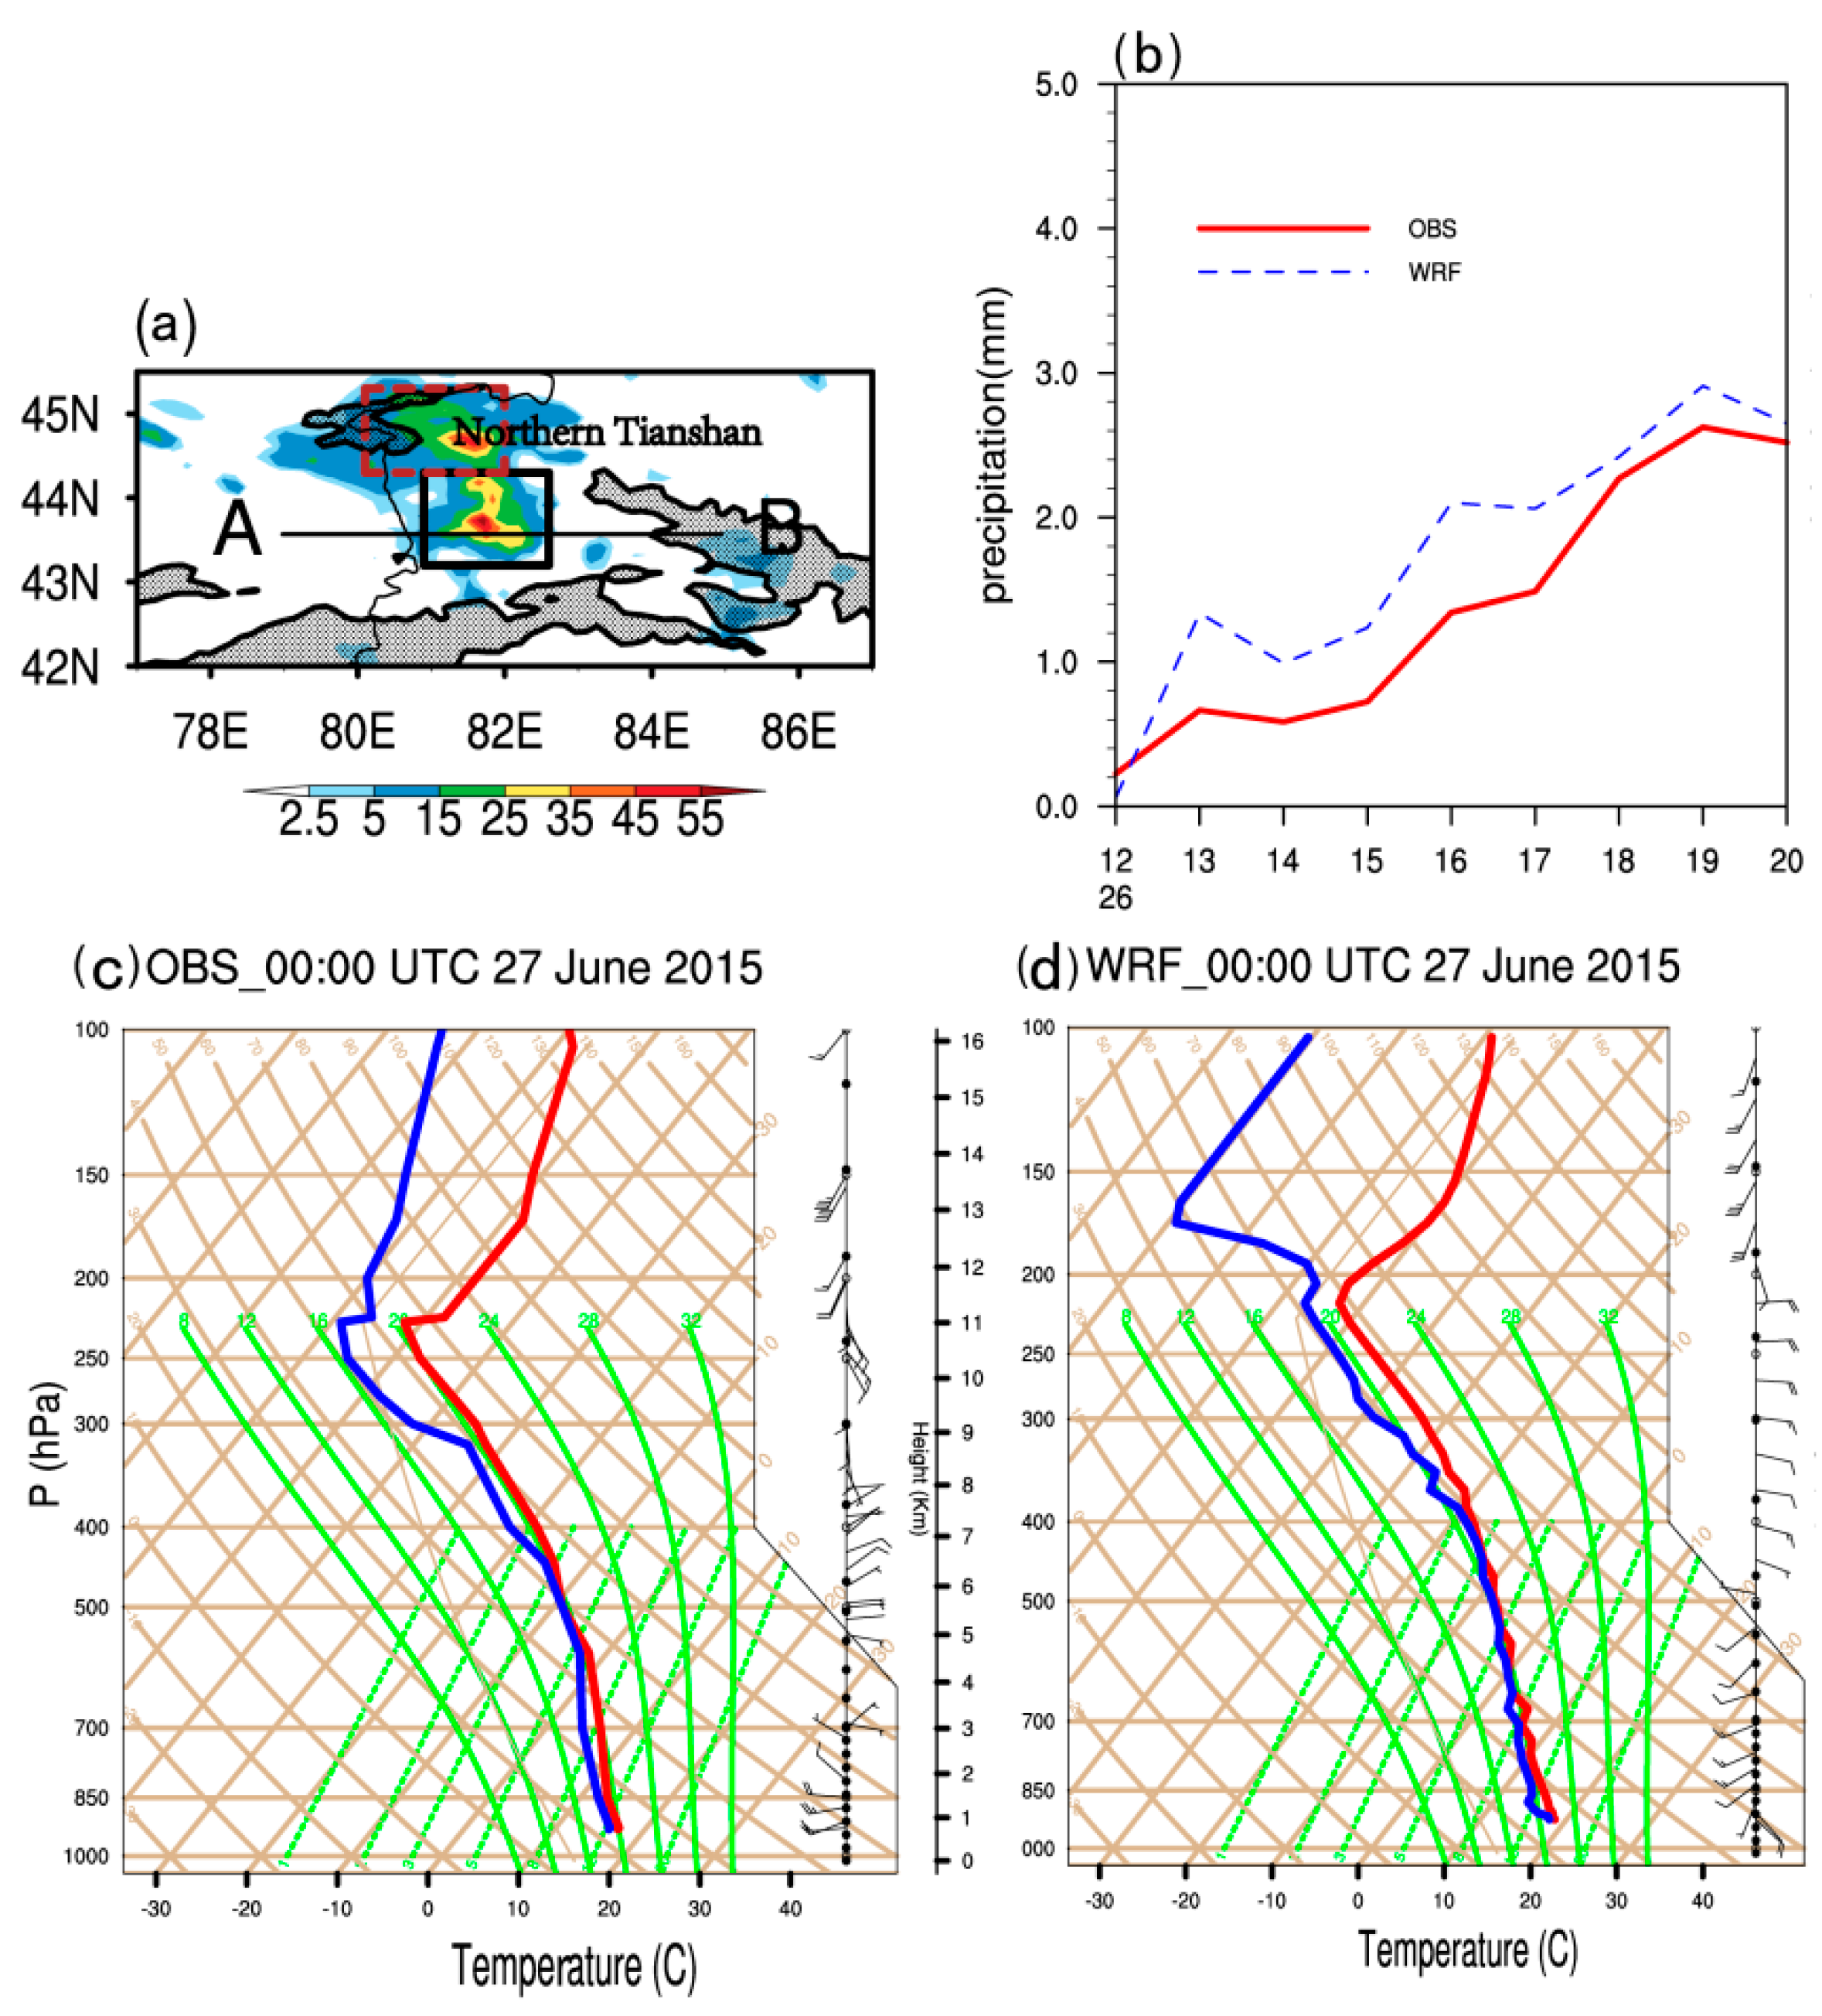
The simulation reproduced the location of the extreme precipitation in the center of the Ili Valley (Figure 4a, black frame) as slightly offset westward by about 0.2° latitude from the observed six-hour cumulative precipitation data (Figure 1b). The shape and extent of the center of the simulated precipitation were consistent with the observations, reproducing the center of extreme precipitation with an east–west orientation in the center of the Ili Valley and an area of relatively heavy rain with a north–south orientation in the northern Ili Valley. The intensity of the simulated precipitation in the study area was also consistent with the observations, especially the maximum intensity of >50 mm, though the intensity of precipitation in the northern Ili Valley was slightly stronger than the observed intensity. These results show that the simulation can generally reproduce the distribution, shape, extent and intensity of the extreme precipitation event. The intensity of the simulated precipitation near the Northern Tianshan mountains (Figure 4a, red frame), outside the study area, is stronger than the intensity in the observations. This may be due to the sparse number of observations in this area, which makes it difficult to reflect heavy precipitation. However, the precipitation near the Northern Tianshan mountains is not relevant to the extreme precipitation event studied here and is not the focus of this paper.
We compared the change in the observed regional average precipitation (i.e., the regional average precipitation in the black frame in Figure 1b, Pobs) with the simulated regional average precipitation (i.e., the regional average precipitation in the black frame in Figure 4a, Psim) over time (Figure 4b). Although Psim is slightly higher than Pobs, the overall trends of Psim and Pobs are consistent, including the three peak values (at 13:00, 16:00 and 19:00 UTC) and the two valley values (14:00 and 17:00 UTC), indicating that the simulation can generally reproduce the entire extreme precipitation process in this study area. We focused on the center of extreme precipitation in Gongliu County. As the simulated center of precipitation is slightly offset westward and northward from the observed center, we examined the simulated precipitation in Gongliu County (Gsim) using the regional average precipitation of a small area lying to the west and north (43.5–43.6° N, 81.9–82.0° E). A comparison of Gsim with the observed precipitation from the automatic weather station in Gongliu County (43.47° N, 82.23° E) (Figure 1c) showed that the simulation reproduced the change in extreme precipitation in Gongliu County, especially the peak of precipitation, further confirming that the simulation was able to capture the process of extreme precipitation.
We further examined the observed and simulated atmospheric conditions. Figure 4c,d show the skewed T–logP diagram at Yining sounding station (the only sounding station in the Ili Valley; 43.95° N, 81.33° E) from the observations and the simulation at 00:00 UTC on 27 June 2015, which suggests a similar pattern in the two datasets. The atmosphere was almost saturated below 450 hPa and relatively humid from 450 to 225 hPa, but relatively dry above 225 hPa. In terms of the wind field, although the simulated low-level westerly winds developed at a higher level, the simulation accurately characterized the wind field distribution of the low-level westerly winds, the mid-level easterly winds and the high-level southwesterly winds at Yining station, with simulated wind speeds close to the observations. This analysis shows that the simulation can capture the stratification and wind field of this extreme precipitation event in the Ili Valley.
This evaluation shows that the model can reproduce the precipitation process, stratification and wind field conditions during the extreme precipitation event in the Ili Valley and that the errors are within an acceptable range. It is therefore reasonable to investigate the mechanisms of the extreme precipitation event in the Ili Valley further using this simulation (for further evaluation, see Huang et al. [20]).

4. Mechanisms of the Extreme Precipitation Event

4.1. Spatiotemporal Evolution of Low-Level Systems

The WRF simulation can be used to observe the spatial and temporal evolution of the low-level mesoscale systems in the Ili Valley in more detail. A strong northerly wind entered the Ili Valley from a terrain gap in the middle of the Northern Tianshan mountains at 14:00 UTC on 26 June (Figure 5a). This northerly wind then converged with the westerly wind in the valley, forming a mesoscale convergence line in the center of the valley (80.2–84.0° N along the black line AB). Precipitation occurred near the center of the valley (43.3° N, 80.5° N) and the maximum rainfall exceeded 12 mm. The northerly wind in the northern Ili Valley then turned to an easterly wind at 15:00 UTC (Figure 5b). The convergence line was maintained in the center of the valley and the center of precipitation moved slightly eastward.
A mesoscale vortex located (43.7° N, 81.0–82.2°E) developed on the convergence line in the center of the valley at 17:30–18:30 UTC (Figure 5c,d). The center of precipitation was located near the center of the mesoscale vortex with a maximum rainfall >24 mm, indicating that the mesoscale vortex was essential in the formation of the extreme precipitation event. The northwesterly and easterly winds formed a convergence line with a northwest–southeast orientation on the northwestern side of the mesoscale vortex. A new mesoscale vortex developed on the convergence line in the northwestern Ili Valley at 20:00 UTC (Figure 5e). The maximum rainfall was still in the center of the valley, but the intensity weakened to 18 mm. The new mesoscale vortex strengthened and moved northeastward at 22:00 UTC (Figure 5f) and the maximum rainfall outside the new mesoscale vortex weakened to 12 mm. The location of the black line AB in Figure 5 is the same as the location of the black line AB in Figure 4a, indicating that the cross-section along the black line AB (cross-section AB) not only passes through the mesoscale convergence line, the center of the mesoscale vortex and centers of multiple-hour precipitation, but also passes through the main center of precipitation of this extreme precipitation event.

4.2. Occurrence and Development of Convection

The topography, convergence of airflow and the low-level mesoscale vortex in the valley were all essential in the formation of the extreme precipitation event in the Ili Valley. This section analyzes the formation of the extreme precipitation event using the simulation data for the cross-sections along the black lines AB and CD in Figure 5.
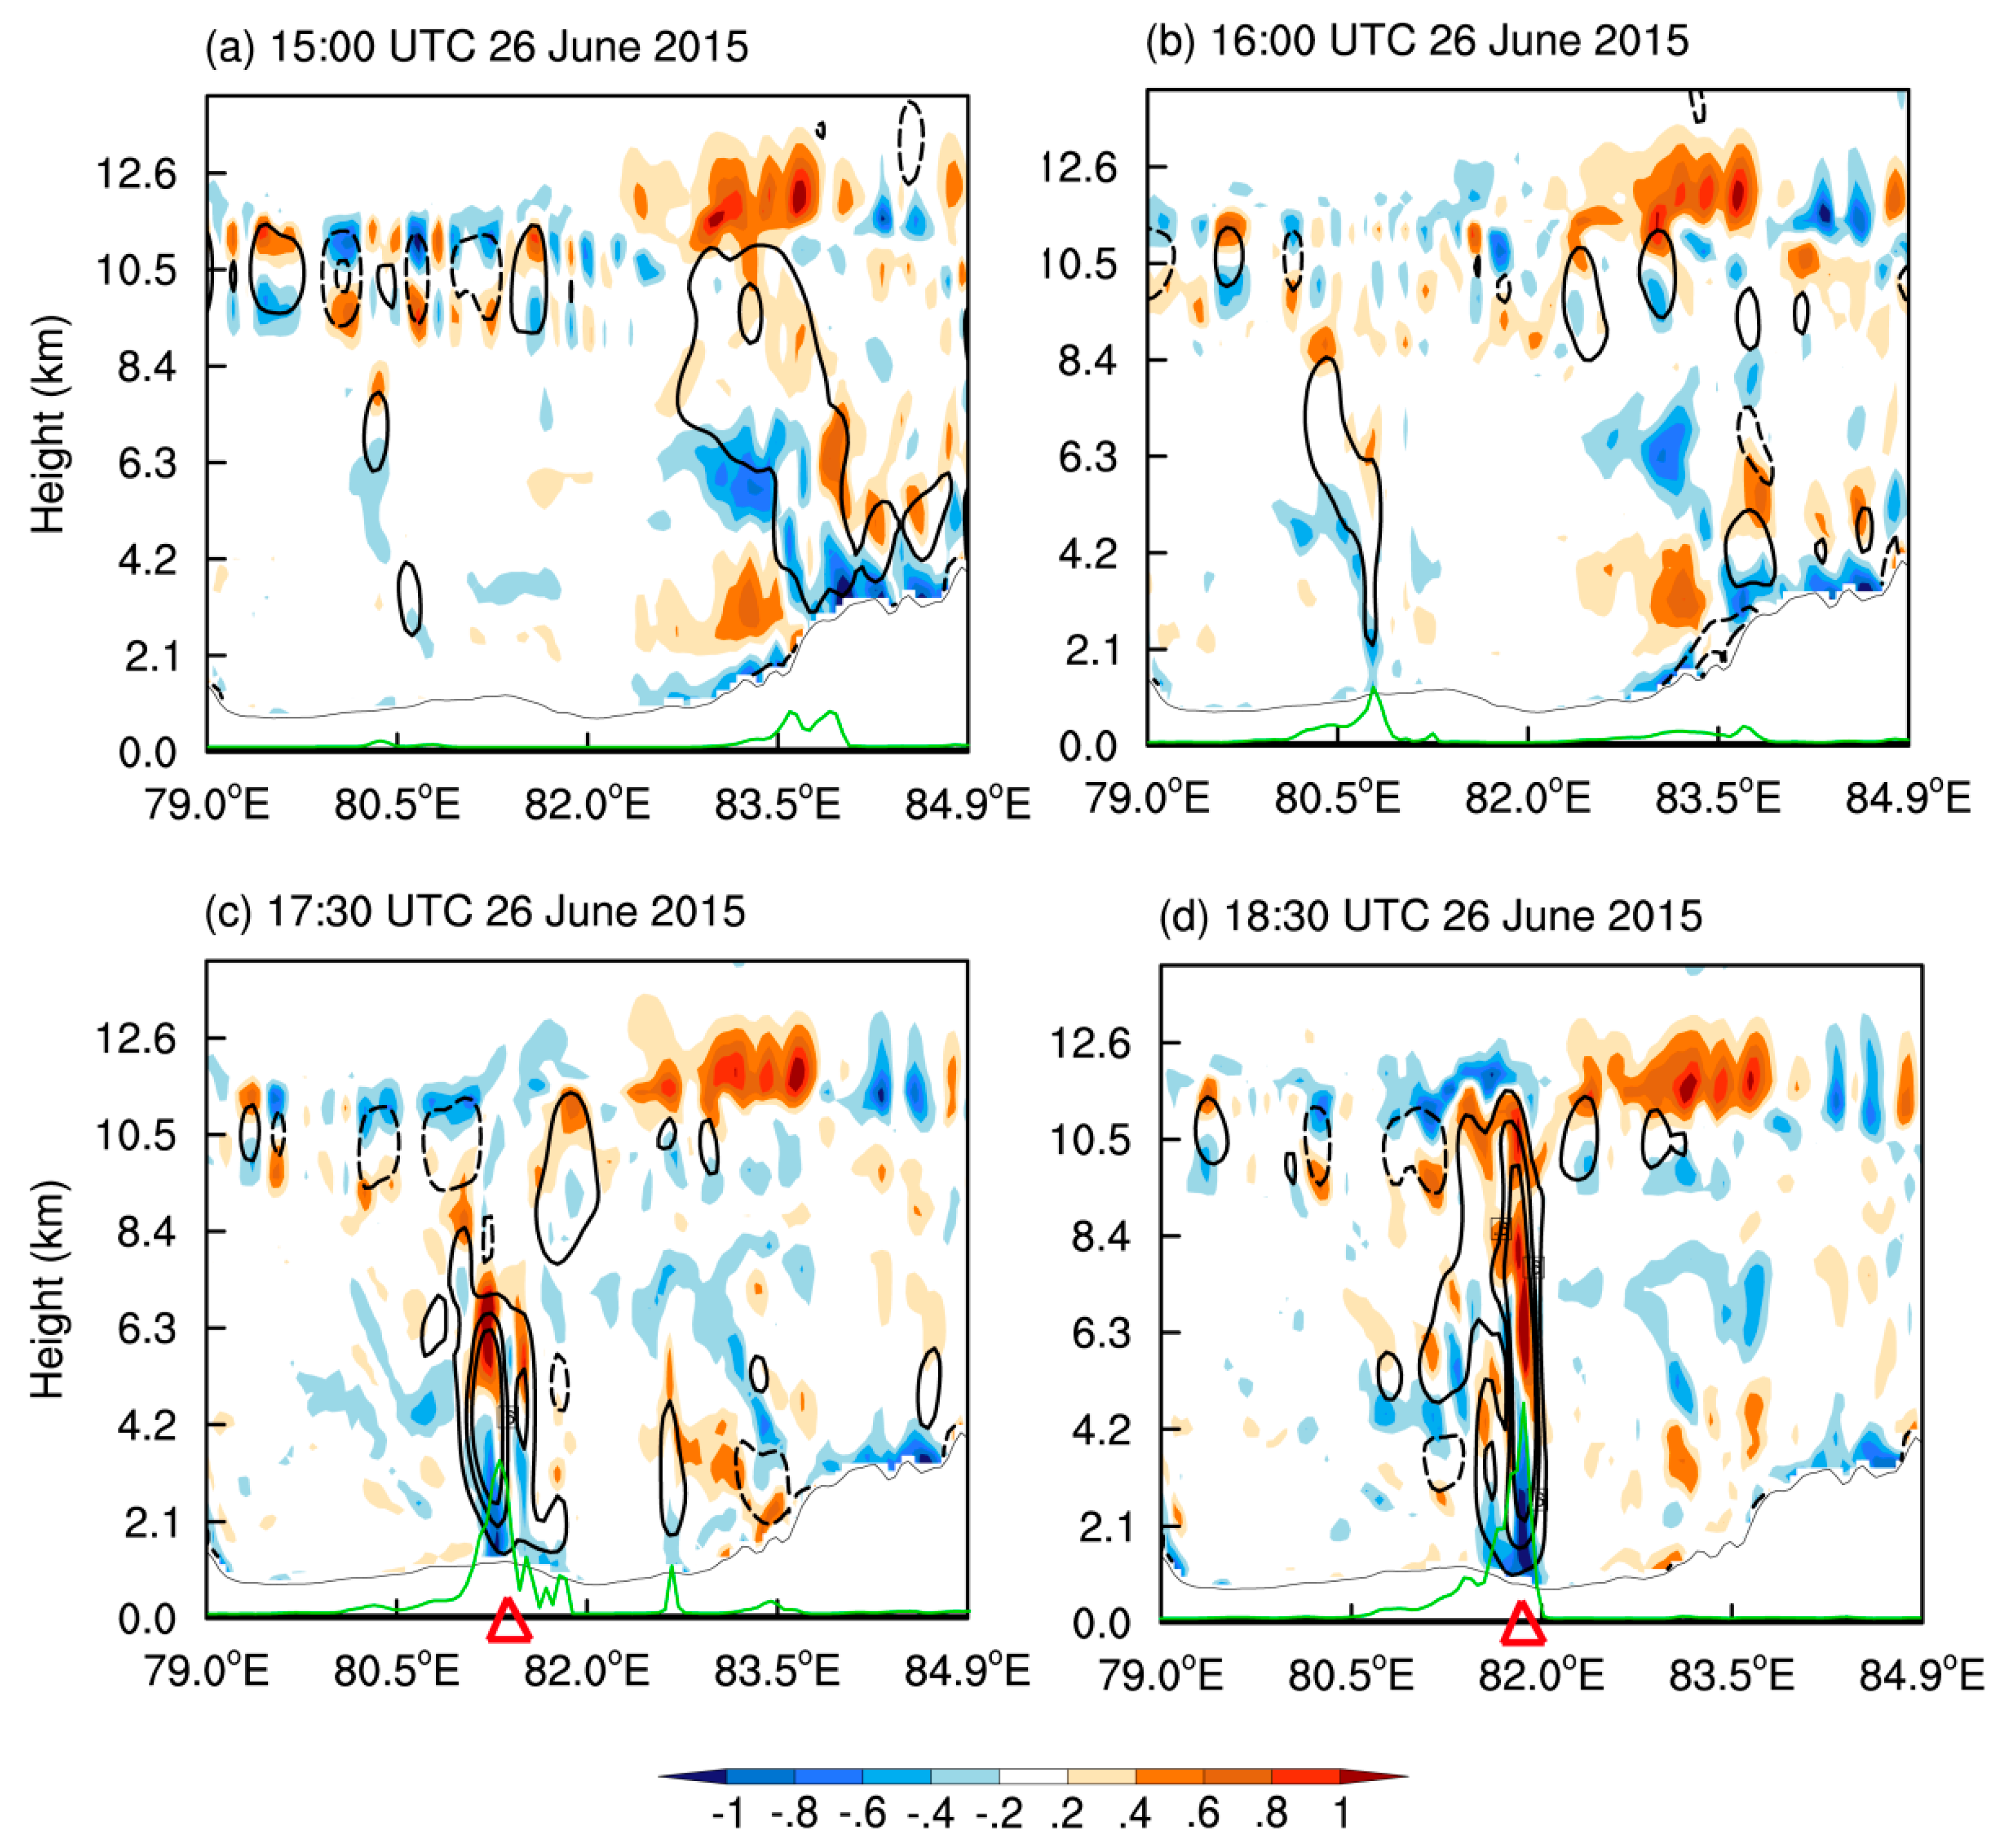
We analyzed the evolution of the vertical motion of the cross-section along the black line CD in Figure 5 (cross-section CD) (43.1–43.9° N, 80.4° E) (Figure 6). The low-level northerly wind was lifted on the windward slope in the center of the Ili Valley at 14:00 UTC on 26 June (Figure 6a) and converged with the southerly wind, resulting in strong upward motion and precipitation. Affected by the southerly winds at mid- and high-level, the ascending motion tilted northward at 15:00 UTC (Figure 6b), causing a relatively strong ascending motion at heights of 6–8 km near (43.6° N, 80.4° E) (the intersection of cross-sections AB and CD in Figure 5, indicated by the black line in Figure 6). The vertical motion at the lower levels of the northern slope of the mountain became a sinking motion and the amount of precipitation decreased.
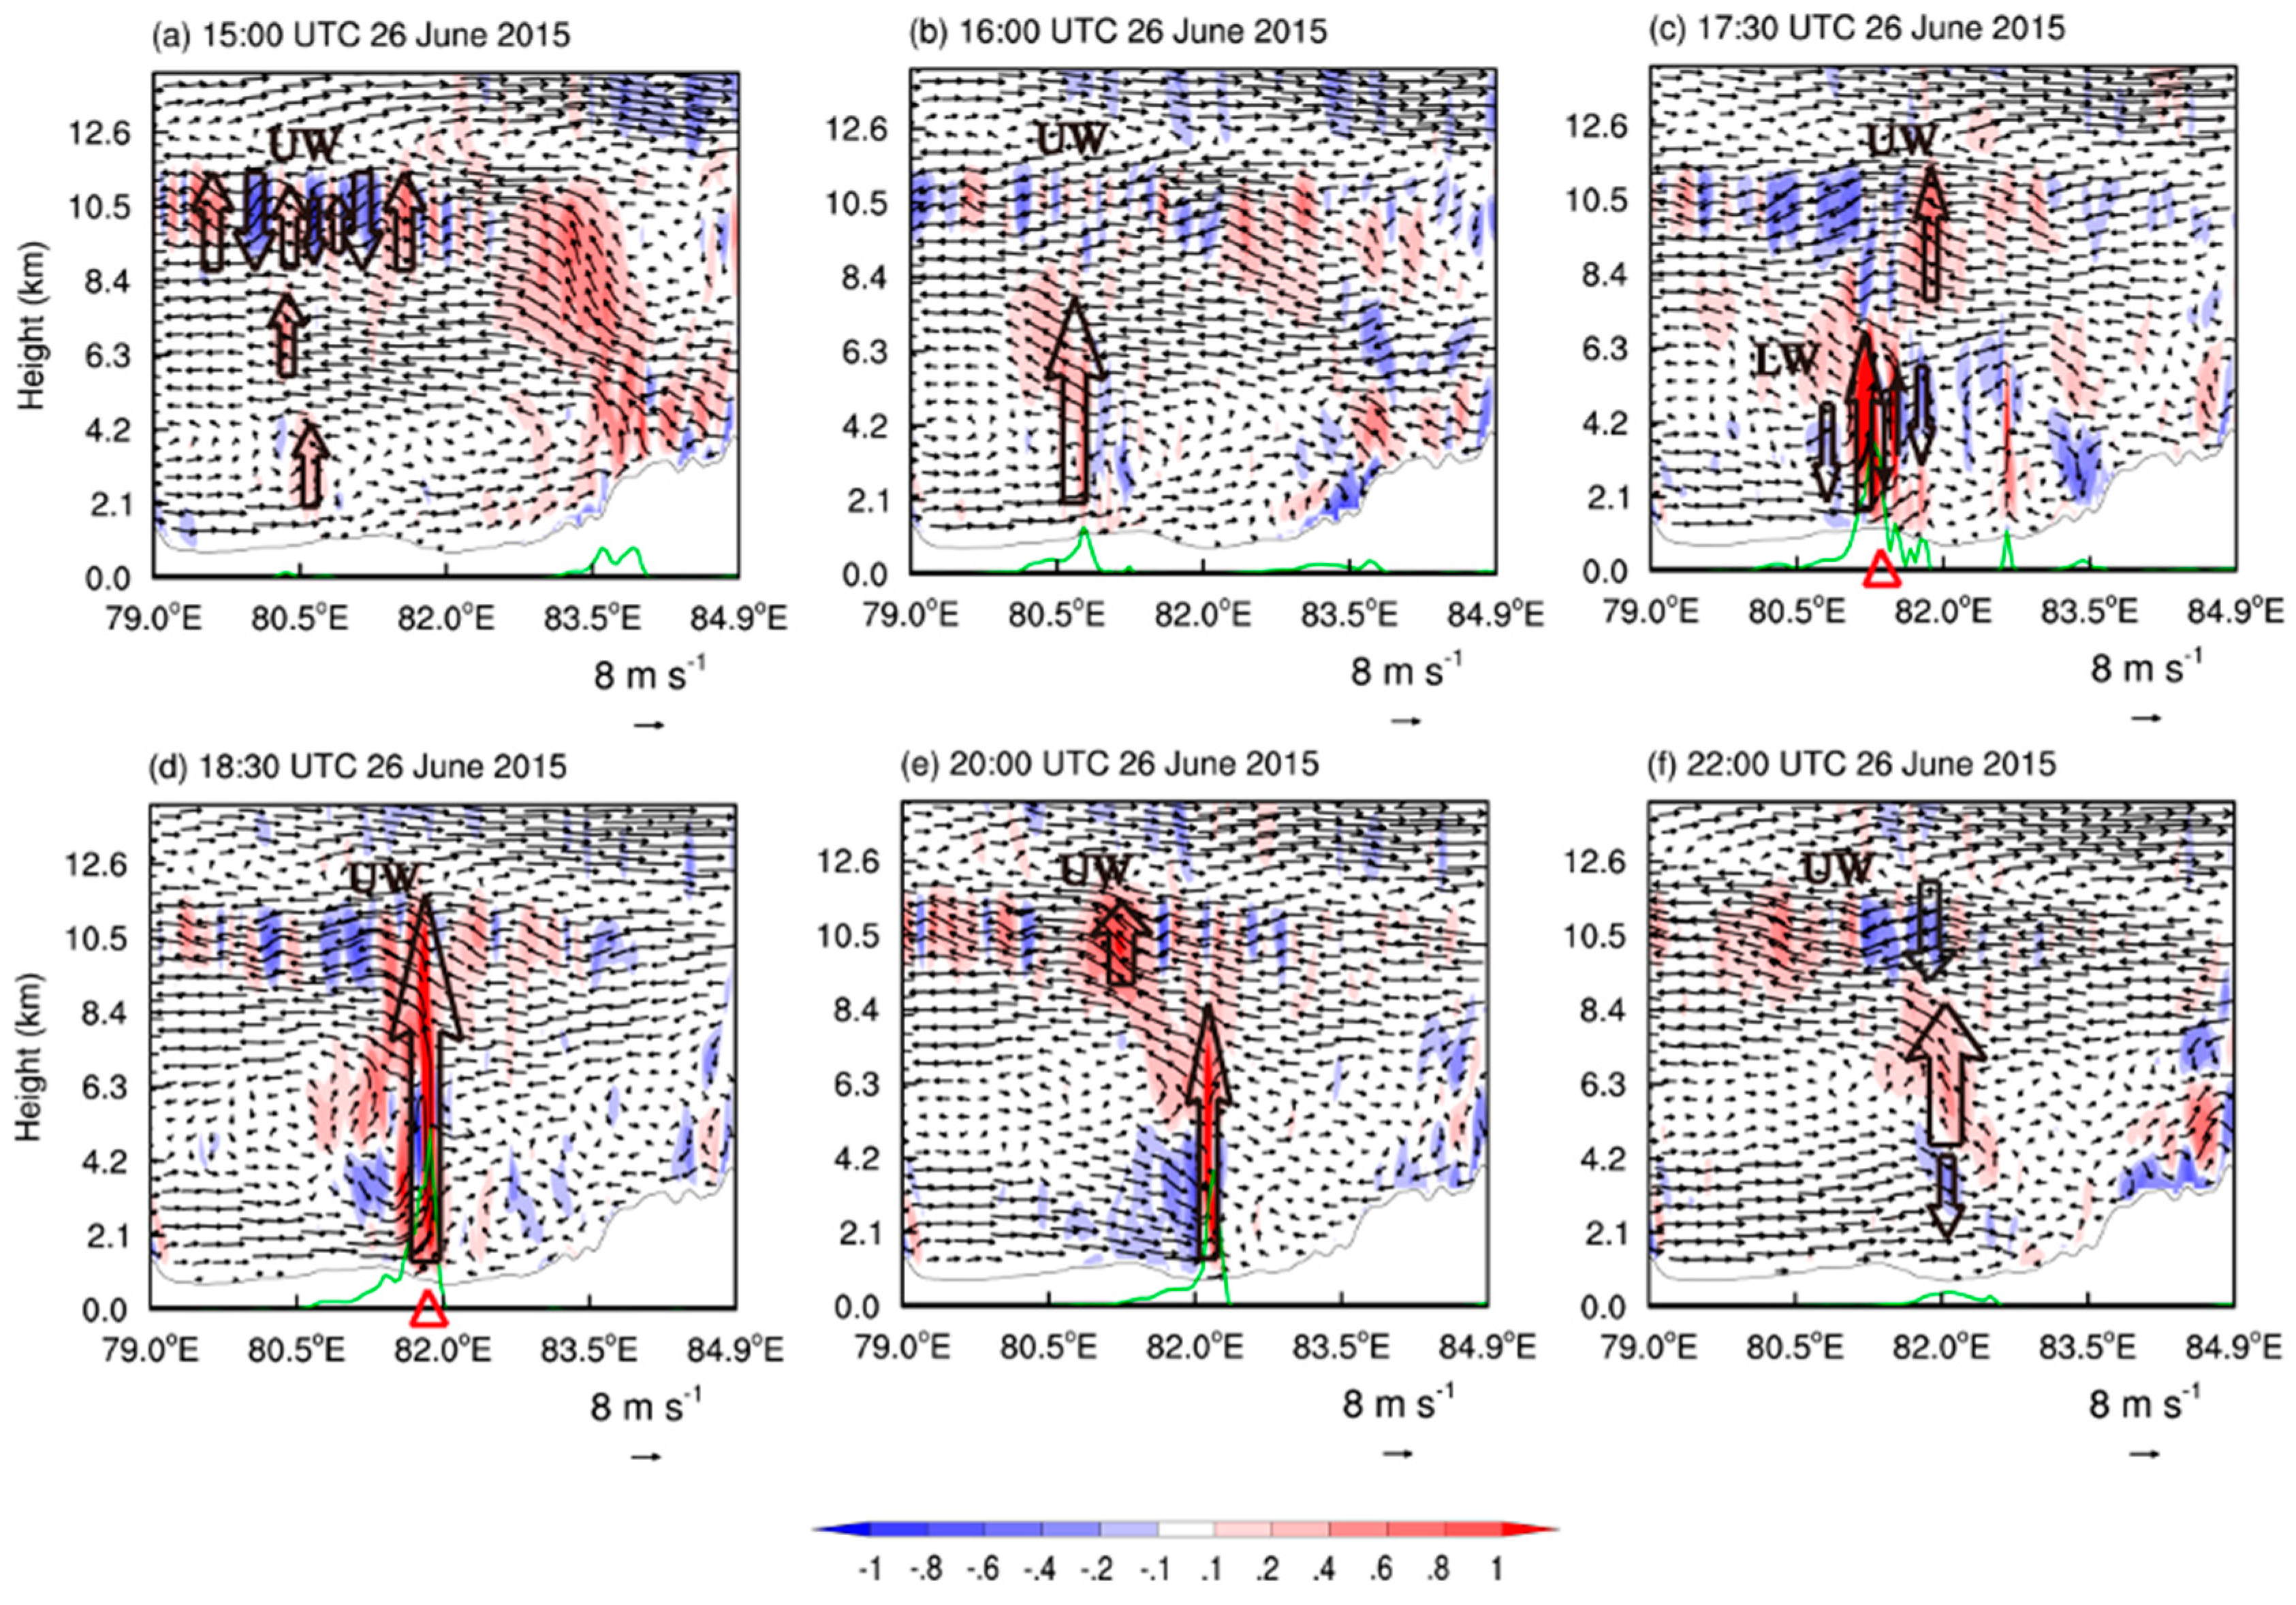
We then analyzed the evolution of the vertical motion of the cross-section AB in Figure 5 (43.6° N, 79° E–85° E) (Figure 7). In addition to the effect of the low-level mesoscale convergence line, the ascending motion over the windward slope of the uplifted terrain near 80.5° E was enhanced by the terrain at 15:00 UTC on June 26 (Figure 7a). There was also a relatively strong ascending motion at heights of 6–8 km. This mid- to high-level ascending motion was the result of the tilted development of the ascending motion caused by terrain uplift and the convergence of airflows (Figure 6b). There was also a clear wave signal in the upper troposphere at heights of 9.5–11.5 km (hereafter referred to as upper level waves). The mid-level ascending motion near 80.4° E merged with the low-level ascending motion near the uplifted terrain at 16:00 UTC (Figure 7b), triggering new convection and precipitation. The convection developed rapidly at 17:30 UTC (Figure 7c), accompanied by relatively strong precipitation, as a result of strong convection instability and the abundant water vapor [20].
Strong convection is an important cause of gravity waves, which have been confirmed in many observational and simulation studies [36,92,93,94]. Therefore, in addition to the existence of upper level waves, low-level waves were excited at heights of 2–6 km after convection had been triggered. The cross-section AB passed through the center of the low-level mesoscale vortex, and therefore the ascending phase of the low-level waves was combined with effect of the low-level mesoscale vortex (Figure 7c, red triangle), causing the development of strong convection and intense precipitation. The convective system moved eastward into Gongliu County at 18:30 UTC (Figure 7d) and merged with the ascending phase of the upper level waves at heights of 8.5–11.5 km, forming extremely strong convection from low to upper levels. The combination of extremely strong convection and the low-level mesoscale vortex (Figure 7d, red triangle) intensified the precipitation further, although the low-level waves had almost weakened and disappeared at this time. The convection and precipitation continued to move slowly eastward within Gongliu County at 20:00 UTC (Figure 7e), but was slightly weakened. The low-level airflow eventually became a subsiding motion and the mid-level ascending motion was superimposed on the subsidence phase of the upper level waves and therefore the precipitation almost disappeared (Figure 7f).
To better illustrate the development of ascending motion, the evolution of the wind divergence of the cross-section AB in Figure 5 was analyzed further (Figure 8). The airflow at heights of 2.1–3 km converged at 15:00 UTC on 26 June (Figure 8a) and enhanced the low-level ascending motion near 80.5° E. Coupling of the convergence at heights of 4.2–7 km and the weak divergence at 8 km strengthened the mid-level ascending motion near 80.4° E. Precipitation had not yet occurred. Coupling of the convergence from the ground to a height of 5 km and the divergence at heights of 5–8.4 km near 80.7° E at 16:00 UTC (Figure 8b) strengthened the ascending motion at 2–8 km, leading to precipitation. Coupling of convergence from the ground to 4 km and divergence at 4–7.5 km near 81° E at 17:30 UTC (Figure 8c) strengthened the ascending motion at 2–8 km, causing precipitation to intensify. The coupling of convergence from the ground to a height of 6 km and divergence at 4–10.5 km near 82° E at 18:30 UTC (Figure 8c) strengthened the ascending motion from the ground to 11 km, causing precipitation to intensify further.
The low-level convergence at 15:00–16:00 UTC was mainly caused by the low-level mesoscale convergence line in the center of the Ili Valley, whereas the low-level convergence at 17:30–18:30 UTC was mainly caused by the mesoscale vortex. The upper level waves mainly strengthened the divergence at high levels. The high-level divergence also had an important role in the occurrence and development of the extreme precipitation event in the Ili Valley.

5. Analysis of the Waves

The analysis in the previous section shows that there were clear waves structures at upper and lower levels during the development of convection and the increase in precipitation in the Ili Valley. The waves played an important role in the occurrence and development of the extreme precipitation event in the Ili Valley, especially in Gongliu County. What were these waves and what were their characteristics? Why were the upper level waves maintained for a long time, while the low-level waves quickly weakened and disappeared? Did these waves affect the development of convective through feedback to the mean flow? These problems require further analysis to reveal the characteristics of the waves and their impact on precipitation.

5.1. Wave Characteristics

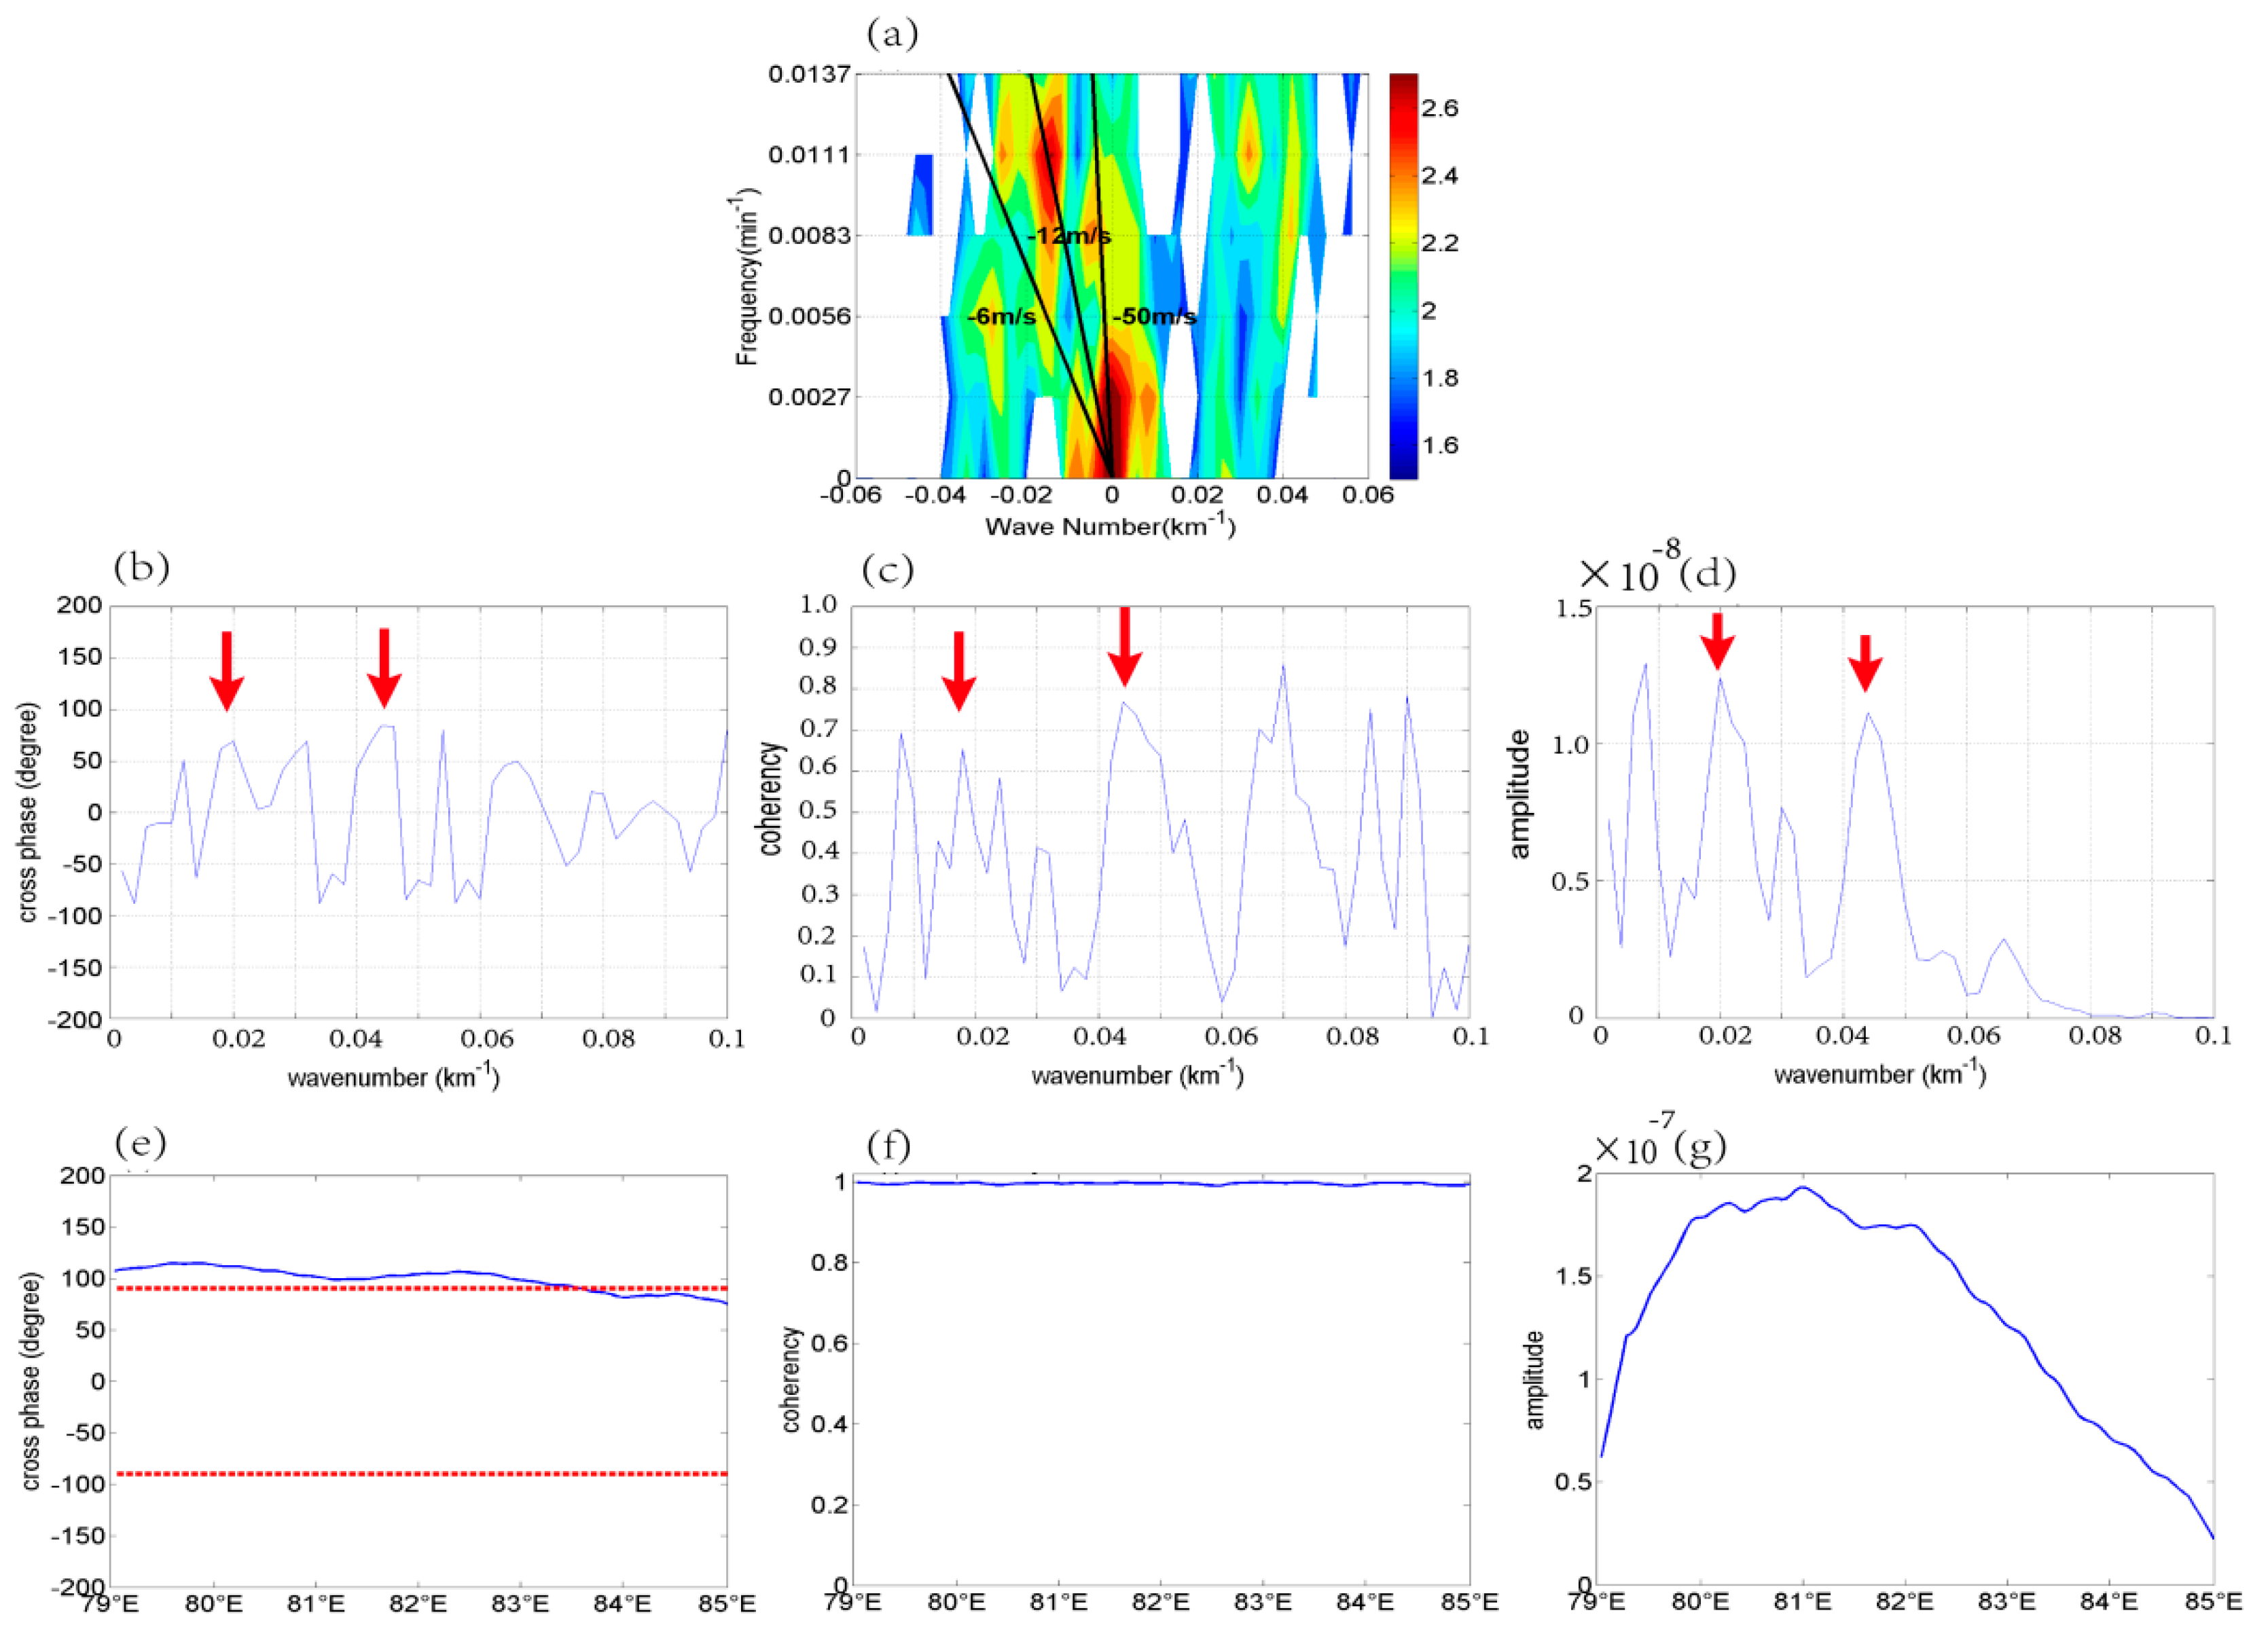
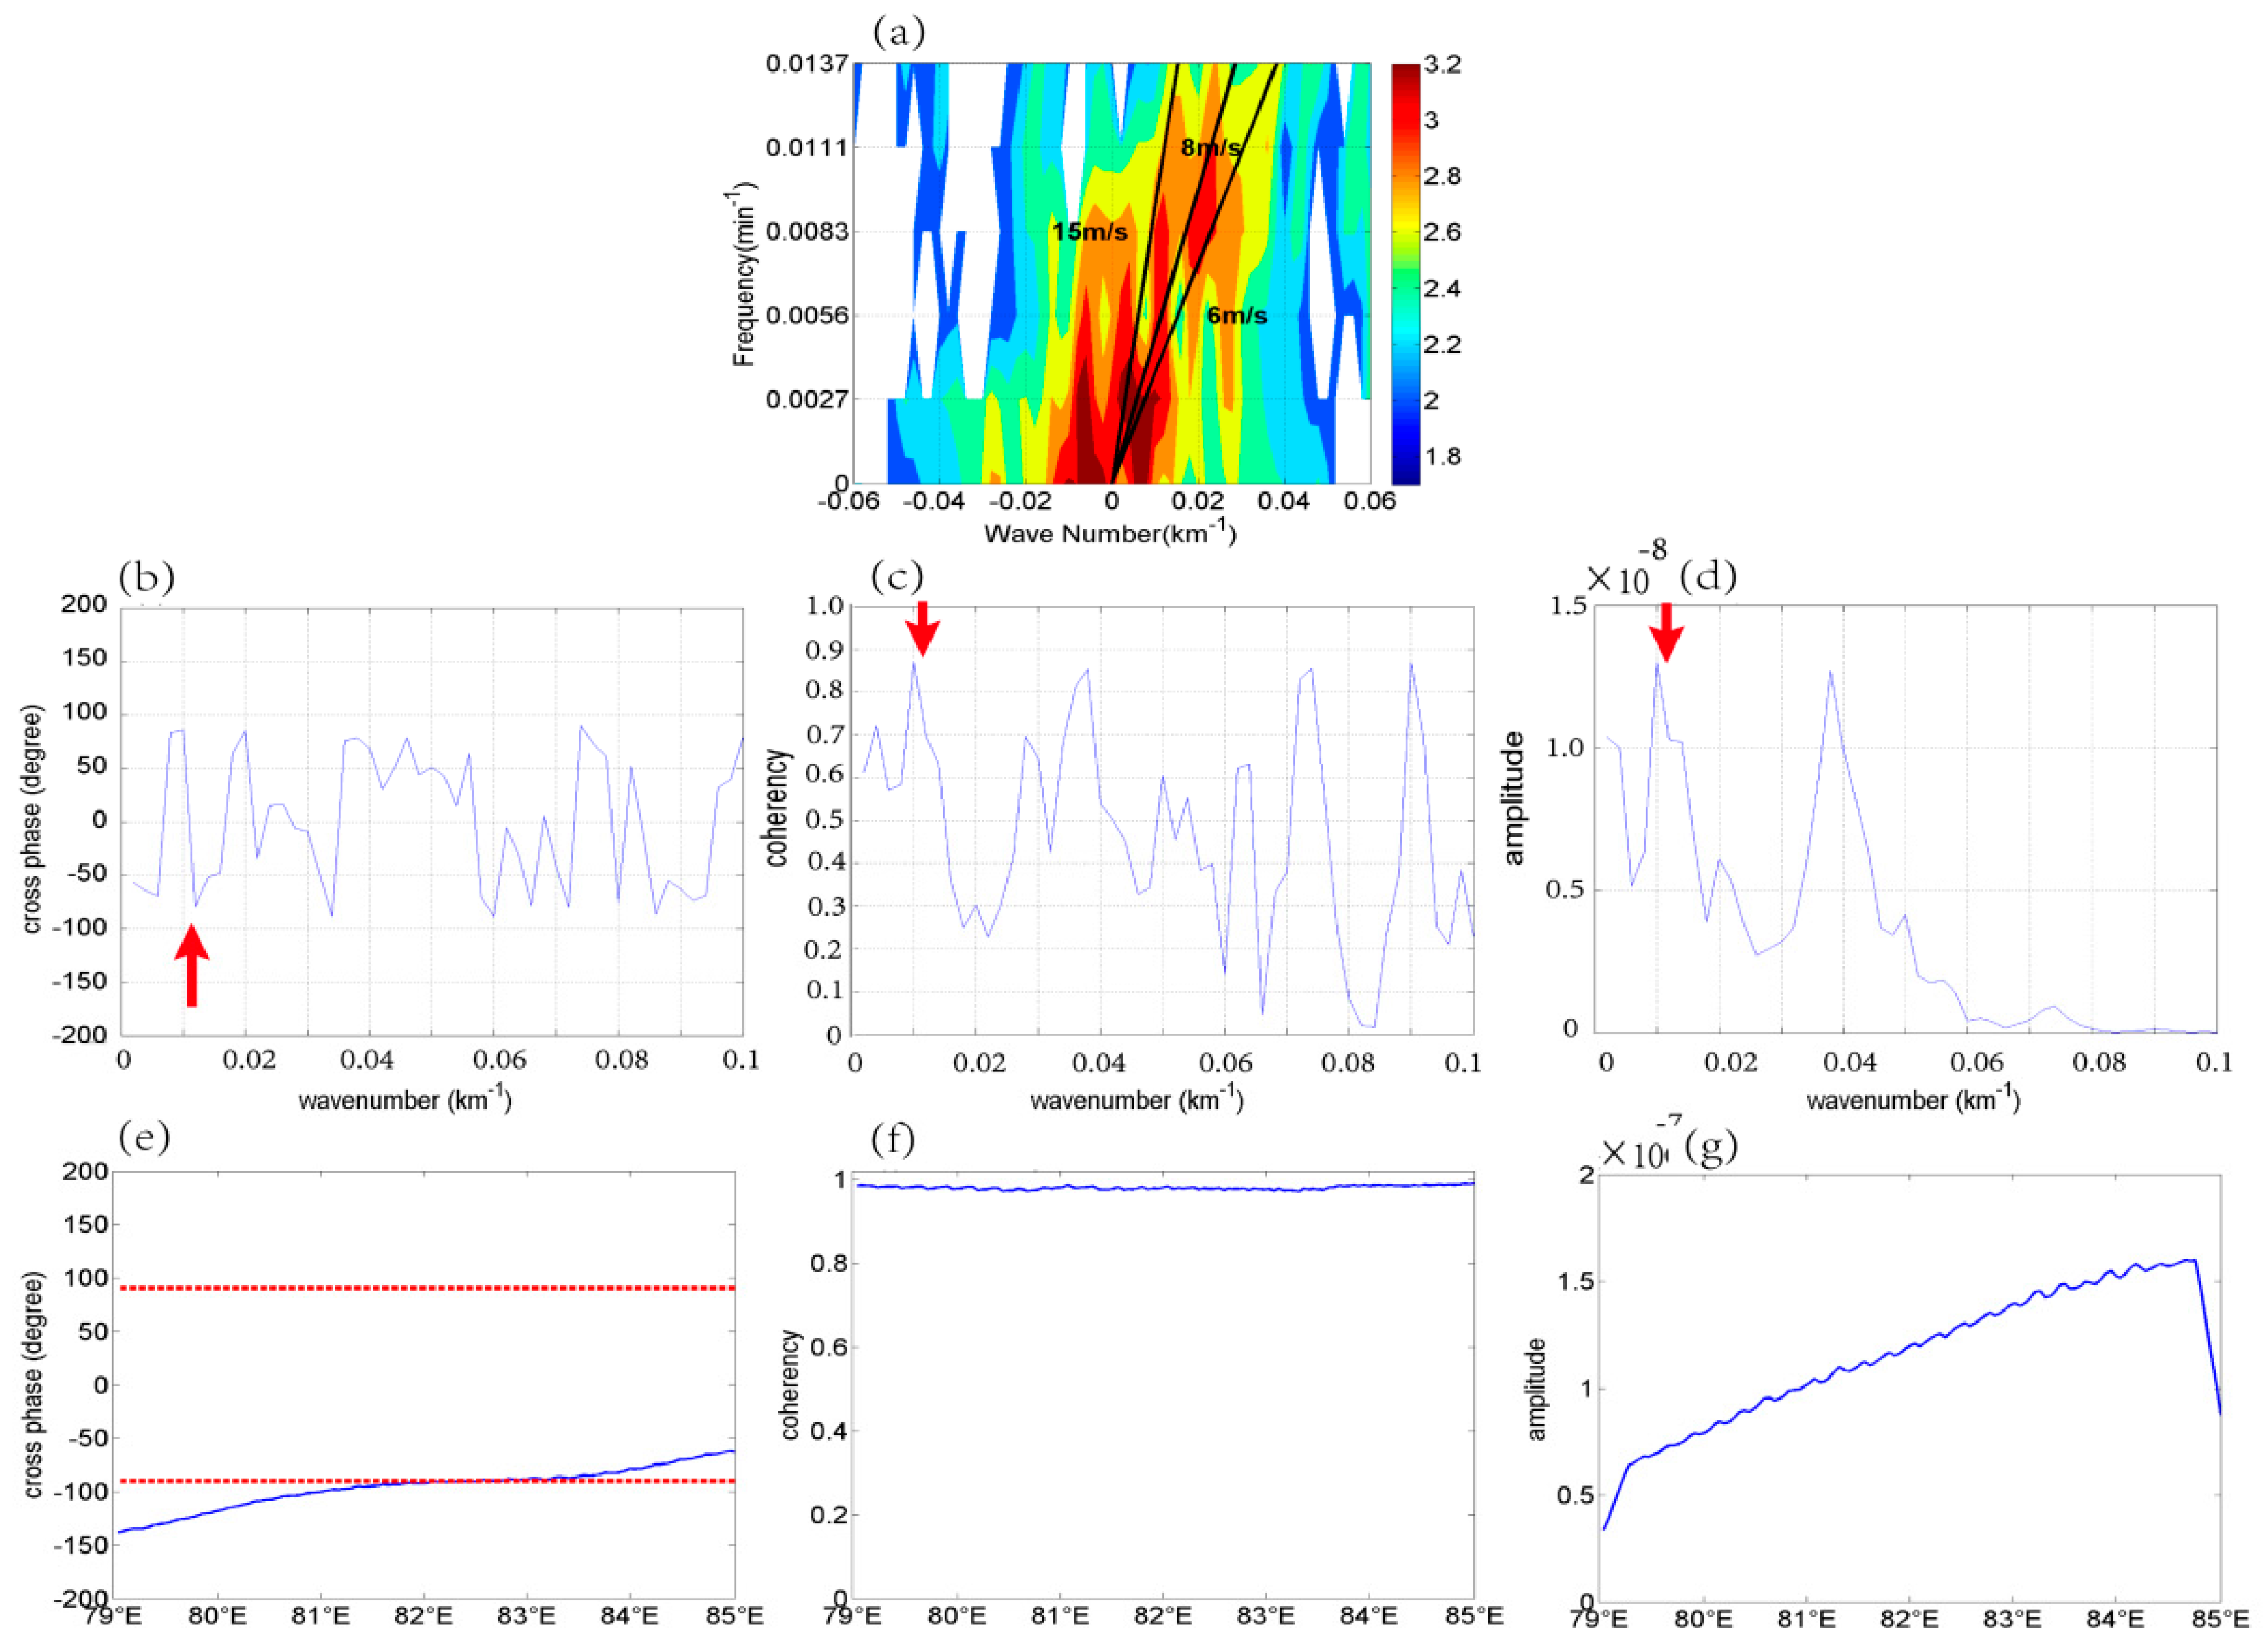
Three wavenumber–frequency spectral analysis methods were applied to examine the wave characteristics and identify the wave type: the power spectrum (Figure 9a and Figure 10a); the cross-spectrum (Figure 9b–d and Figure 10b–d); and the wavelet cross-spectrum (Figure 9e–g and Figure 10e–g).

5.1.1. Fourier Analysis

Fourier analysis is one of the most important methods used to analyze the characteristics of atmospheric waves [34,41]. Fourier analysis can convert a physical quantity, such as the vertical velocity, from a two-dimensional spatiotemporal field to a two-dimensional wavenumber–frequency field and show the characteristics of the waves through their power spectrum. We used Fourier analysis to transform the vertical velocity over the Ili Valley. Based on the simulation data of the consecutive six-hour intervals, Figure 9 and Figure 10 provide a preliminary understanding of the mean characteristics (e.g., the period and horizontal wavelength) of the upper and lower level waves during the extreme precipitation event in the Ili Valley. Figure 9 shows the power spectrum of the vertical velocity at a height of 10 km along the cross-section AB in Figure 5. Two domains with exceptionally high power values were observed. One maximum was located in the low-frequency wavenumber area, which was consistent with earlier results [40,41]—that is, the wave energy was concentrated in the mean flow. The other maximum was observed in a region with a frequency (ω) of 0.0056–0.0137 min−1 (period 73—179 min) and a negative wavenumber (k) in the range 0.005–0.03 km−1 (horizontal wavelength 33–200 km). The peaks followed the lines in the wavenumber–frequency space corresponding to a ω/k range of −6 to −50 m s−1 with an average of −12 m s−1, indicating that the waves on different spatiotemporal scales propagated westward at a mean speed of −12 m s−1.
Figure 10 shows the power spectrum of the vertical velocity at 4 km along the cross-section AB in Figure 5. Two domains with exceptionally high power values were also observed in this power spectrum. In addition to the mean flow, a maximum was also observed in the region with ω = 0.005–0.0137 min−1 (period 73—200 min) and a positive k of 0.01–0.03 km−1 (horizontal wavelength 33–100 km). The peaks followed the lines in the wavenumber–frequency space that corresponded to a ω/k range of 5–15 m s−1 with a mean of 8 m s−1, indicating that waves on different spatiotemporal scales propagated eastward at a mean speed of 8 m s−1.
The positive wavenumber corresponds to an eastward-propagating wave signal and the negative wavenumber corresponds to a westward-propagating wave signal. During the extreme precipitation event in the Ili Valley, the high-level waves with a period of 73–179 min and a horizontal wavelength of 33–200 km propagated westward at a mean speed of −12 m s−1 and the low-level waves with a period of 73–200 min and a horizontal wavelength of 33–100 km propagated eastward at a mean speed of 8 m s−1.

5.1.2. Cross-Spectrum Analysis

The previous subsection has shown that the power spectra with significant spectral peaks indicated there were prominent waves during the extreme precipitation event and the characteristics of these waves were in the general range of inertial gravity waves. However, whether these waves were inertial gravity waves requires further verification.
The traditional cross-spectrum method can determine the phase difference relationship between two different sequences and is therefore an effective method to extract inertial gravity waves using cross-spectrum analysis and polarization theory. Based on the polarization theory of inertial gravity waves, the phase difference between the vertical vorticity and the horizontal divergence of 90° is an essential characteristic. When the waves propagated eastward, the vertical vorticity lags 90° behind the horizontal divergence, whereas when the waves propagated westward, the vertical vorticity leads 90° by the horizontal divergence. Figure 9b–d show the cross-phase, coherency and amplitude spectra, respectively, of the vertical vorticity and horizontal divergence at a height of 10 km along the cross-section AB in Figure 5 using the traditional cross-spectrum method. Waves with distinct wavenumbers of 0.018–0.02 and 0.044 km−1, corresponding to horizontal wavelengths of about 50–55 and 23 km, respectively, were selected because they each displayed phase differences of about 90°, high coherency and a large amplitude (shown by the red arrows in the figures), indicating that the upper level waves with these wavenumbers were significant inertial gravity waves. Among them, the wavenumbers of 0.018–0.02 km−1 belonged to the spectral peaks of the power spectrum of the upper level waves (wavenumbers 0.005–0.03 km−1) obtained in the previous subsection, indicating that the upper level inertial gravity waves with horizontal wavelengths of about 50–55 km were the primary upper level waves during the extreme precipitation event.
Figure 10b–d show the cross-phase, coherency and amplitude spectra, respectively, of the vertical vorticity and horizontal divergence at a height of 4 km along the cross-section AB in Figure 5 using the traditional cross-spectrum method. Waves with distinct wavenumbers of 0.012 km−1, corresponding to horizontal wavelengths of about 85 km, was selected because it showed phase differences of about −90°, high coherency and a large amplitude (shown by the red arrow in the figures), indicating that the low-level waves with this wavenumber were significant inertial gravity waves. In addition, the wavenumber of 0.012 km−1 belonged to the spectral peaks of the power spectrum of the low-level waves (wavenumber 0.01–0.03 km−1) obtained in the previous subsection, indicating that the lower level inertial gravity waves with a horizontal wavelength of about 85 km were the primary low-level waves during the extreme precipitation event.

5.1.3. Wavelet Cross-Spectrum Analysis

Traditional cross-spectrum analysis based on the Fourier method can prove the existence of inertial gravity waves and their corresponding frequencies, but cannot distinguish the specific spatiotemporal information about the inertial gravity waves. Wavelet cross-spectrum analysis performs a one-dimensional continuous wavelet transformation on physical quantities and therefore obtains information such as the phase difference [95]. Therefore, in contrast with traditional cross-spectrum analysis, wavelet cross-spectrum analysis can not only determine the wave frequency and wave number, but also provide the time and location of waves.
Based on the wave information in the previous subsection, the spatial variations in the cross-phase, coherency and amplitude spectra of the waves with a horizontal wavelength of 50 km were computed from the wavelet cross-spectrum for vertical vorticity and horizontal divergence at a height of 10 km along the cross-section AB in Figure 5 (Figure 9d–f). The Gaussian wave was selected as the basic wave. A wide spatial range (79–85° E) with a phase difference of about 90°, a strong coherency near 1 and the maximum cross-amplitude indicates that a significant inertial gravity wave with a strong wave energy propagated westward at a height of 10 km in the area 79–85° E. This result is consistent with the location of the upper level waves shown in Figure 7a.
Similarly, the spatial variations in the cross-phase, coherency and amplitude spectra of the waves with a horizontal wavelength of 85 km were computed from the wavelet cross-spectrum for vertical vorticity and horizontal divergence at a height of 4 km along the cross-section AB in Figure 5 (Figure 10d–f). A wide spatial range (81–83.5° E) with a phase difference of about −90°, a strong coherency near 1 and a relatively large cross-amplitude indicates that significant inertial gravity waves with a relatively strong wave energy propagated eastward at a height of 4 km in the area 81–83.5° E. This result is consistent with the location of the low-level waves shown in Figure 7c.

5.2. Wave Ducting

The analysis in Section 4.2 showed that the upper level waves in the Ili Valley persisted for a long time, whereas the low-level waves quickly dissipated. This section focuses on the analysis of the conditions for the propagation of inertial gravity waves, especially the difference between the conditions for the propagation of upper and lower level inertial gravity waves.
Inertial gravity waves tend to propagate freely in the vertical direction with a loss of wave energy, rather than propagating in the horizontal direction. Thus the stable and long-term horizontal propagation of inertial gravity waves generally requires the existence of critical levels and wave ducting. The critical level is the level when the horizontal wind equals to the projection on this direction’s wave horizontal phase speed. Wave ducting occurs when a statically or conditionally stable layer with sufficiently thick stratification is present with a stable critical level above [96]. When the stable layer is combined with the critical level, it is difficult for the wave energy to dissipate in the vertical direction, and the waves can extract the energy of the mean flow in the critical level and affect the life history of the wave [38,39,96]. The Richardson number (Ri) can be used to characterize the stability of the atmosphere, where Ri < 1 represents symmetrical instability, Ri < 0.25 represents shear instability and Ri < 0 represents stratification instability [46,47,97,98]. Waves can extract energy from the shear instability area of the mean flow and then develop further.
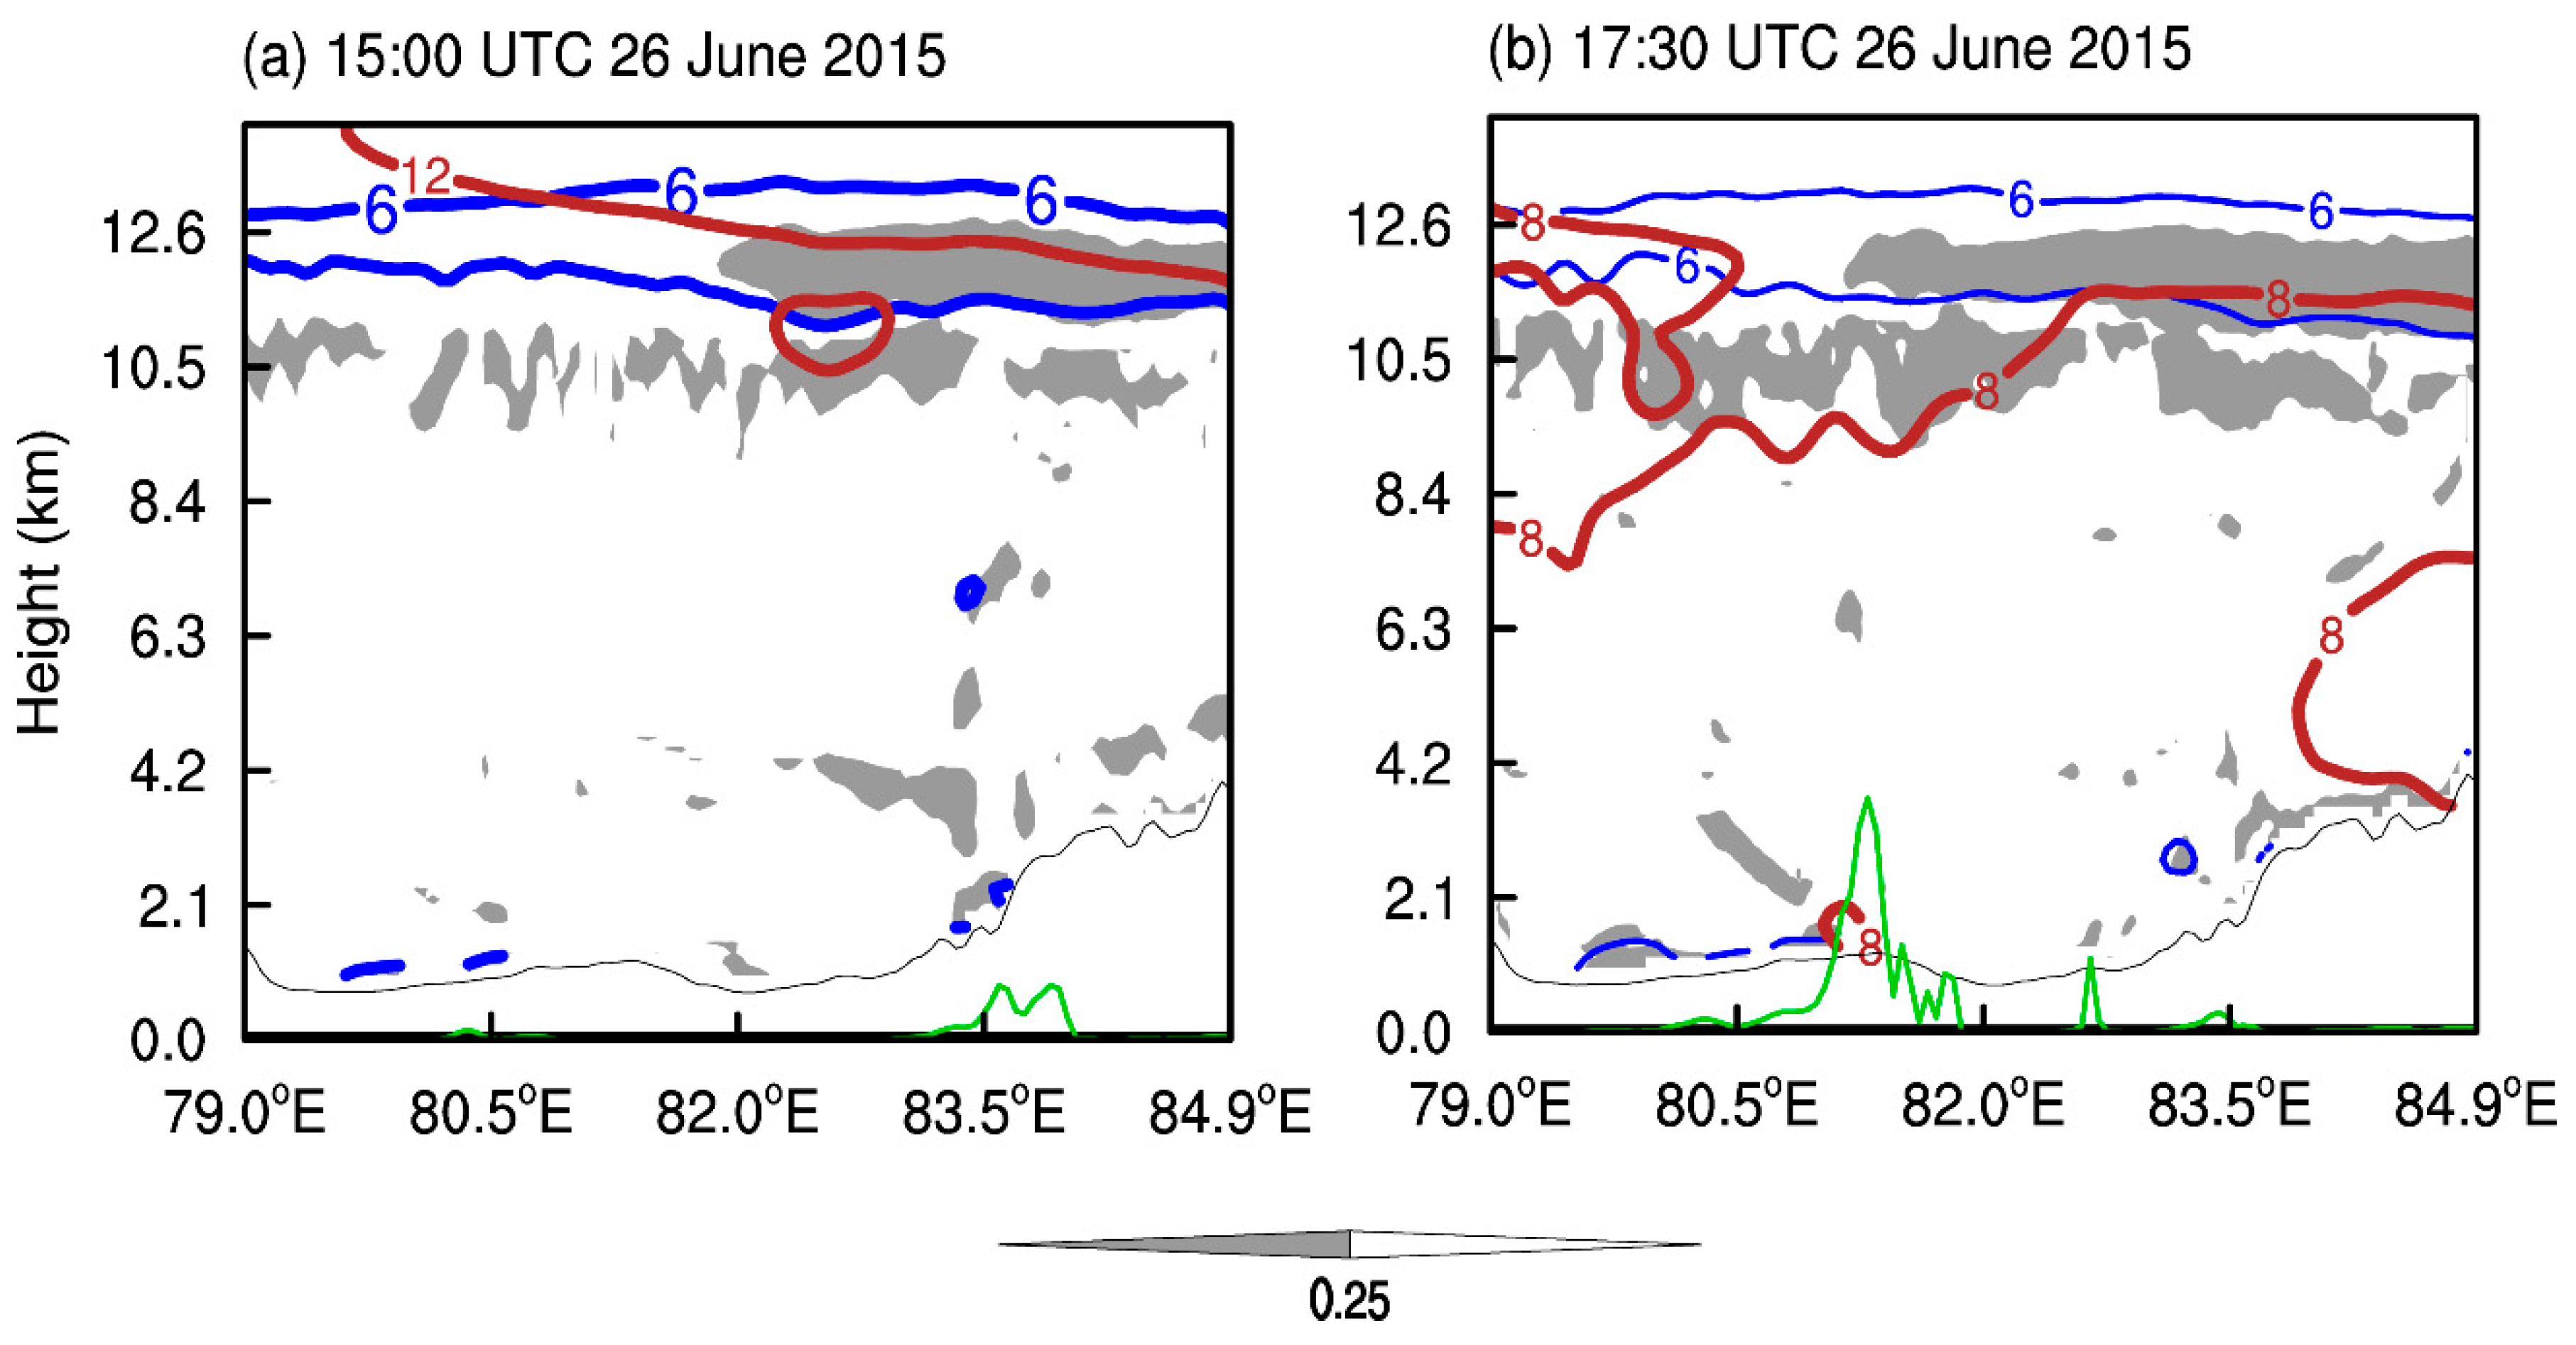
Figure 11a shows that the upper atmosphere was basically stable (Ri > 0.25) at 15:00 UTC on June 26, which favored the horizontal propagation of upper level waves in the Ili Valley. There was an area with Ri < 0.25 at 9–12.6 km, which provided unstable shear energy for the maintenance and development of upper level inertial gravity waves. The layers above the upper level inertial gravity waves had a horizontal wind speed of −12 m s−1, consistent with the mean phase speed of the upper level inertial gravity waves calculated in Section 5.1. Therefore, there were critical levels above the upper level inertial gravity waves, and they tend to trap vertical wave propagation. The upper level inertial gravity waves tend to extract energy from the mean flow.
Ding [93] showed that strong vertical wind shear can hinder the upward transport of gravity waves and reduce the dissipation of gravity wave energy. Figure 11a shows that the upper level inertial gravity waves in the easterly wind layers were coupled with the upper level westerly jet to provide strong vertical wind shear. Therefore the upper level inertial gravity waves in the Ili Valley were below layers of strong vertical shear, which favors the maintenance and horizontal propagation of waves.
These results show that upper level inertial gravity waves in the Ili Valley were present in the stable layer below the critical level during the extreme precipitation event and that there was strong vertical wind shear. This indicates that the upper level inertial gravity waves were not easy to dissipate in the vertical direction via wave ducting and were able to extract energy from the mean flow. Thus the upper level inertial gravity waves tended to maintain for a long time and propagated over a long distance.
Figure 11b shows that the low-level atmosphere was basically stable (Ri > 0.25) at 17:30 UTC on 26 June, which favored the horizontal propagation of upper level waves in the Ili Valley. As shown in Section 5.1, the mean phase speed of the lower level inertial gravity waves was 8 m s−1, indicating that there was no critical level above the lower level inertial gravity waves. Thus, unlike the upper level inertial gravity waves, there was no critical level, shear unstable energy area nor strong vertical wind shear layer coupled with the lower level inertial gravity waves. The lower level inertial gravity waves tended to propagate vertically and dissipate their wave energy under these wave ducting conditions, with the result that the lower level inertial gravity waves tended to maintain for a short time and propagate over a short distance. However, it is necessary to note that ducting of gravity waves depends not only on the existence of critical level, but on vertical distribution of static stability or profile of buoyancy frequency. The ducting may arise in the troposphere even in the absence of critical level.

5.3. Wave Energy

The mesoscale three-dimensional Eliassen–Palm flux under a non-hydrostatic and non-geostrophic assumption can indicate the propagation direction of inertial gravity wave energy and the Eliassen–Palm flux divergence can affect the intensity of the atmospheric mean flow [84]. We used Eliassen–Palm flux theory to analyze the propagation of energy and the feedback mechanism of inertial gravity waves to the background atmosphere during the extreme precipitation event in the Ili Valley. Previous studies have shown that the mean flow is provided by a moving average of time [69,70,71,72,74]. According to the energy spectrum in Section 5.1.1, the upper level waves have a period of 73-179 min, the maximum wave energy occurred at 90 min (0.0111 min-1) (Figure 9a); and the low level waves have a period of 73–200 min, the maximum wave energy occurred at 90–120 min (0.0083–0.0111 min-1) (Figure 10a). In this study, 90 min is selected as the time-moving average. We were also concerned with the 120-min results (not shown), that were basically consistent with the 90-min results.
Figure 12a shows the longitude–height cross-section of the Eliassen–Palm flux F 1 and the Eliassen–Palm flux divergence F 1   during the mature stages of the extreme precipitation event. F 1 = ( F 11 , F 12 , F 13 ) is the zonal component of the Eliassen–Palm flux. The expressions derived from Liu et al. [84] are given by:
F 11 = u 2 ¯ S ¯ ,   F 12 =   u     v   ¯ ,   F 13 =   u     w   ¯ f   v     θ   ¯ N 2 g θ ¯ ,
where S ¯ = [ u 2 ¯ + v 2 ¯ + w 2 ¯ ( θ 2 ¯ g 2 ) / ( N 2 θ ¯ 2 ) ] / 2 is the difference between the kinetic and potential energy; N 2 = ( θ ¯ / z ) ( g / θ ¯ )     is the Brunt–Vaisala frequency squared; u, v and w are the zonal, meridional and vertical velocities, respectively; θ is the potential temperature; and f is the Coriolis parameter. The variables are separated into the time mean (¯) and the deviation from the time mean (′). The Eliassen–Palm flux divergence is given by F 1 = ( F 11 / x ) + ( F 12 / y ) + ( F 13 / z ) .
Figure 12a shows that the lower level Eliassen–Palm flux to the west of the convection (precipitation) center (81.2–81.8° E) indicates that the wave energy was transported upward to the east, whereas the lower level Eliassen–Palm flux to the east of the convection (precipitation) center (81.8–82.0° E) indicates that the wave energy was strongly transported downward to the ground and then transported to the east, which favored the generation, development and movement of convection. The upper level wave energy was also transported downward into the convection (precipitation) center. A positive Eliassen–Palm flux divergence weakened the intensity of the mean flow and a negative Eliassen–Palm flux divergence enhanced the intensity of the mean flow [84]. The Eliassen–Palm flux divergence can therefore change the distribution of the environmental wind field, which can enhance the vertical wind shear or change the distribution of horizontal divergence.
The Eliassen–Palm flux divergence at mid-levels in the convection (precipitation) center was mainly negative, indicating that the wave energy was mainly convergent. The westerly wind was therefore strengthened. By contrast, the Eliassen–Palm flux divergence at mid-levels in the east of the convection (precipitation) center was mainly positive, indicating that the wave energy was mainly divergent, which caused the westerly wind to weaken. The strongest Eliassen–Palm flux divergence at low levels of the convection (precipitation) center showed that the westerly wind in the convection (precipitation) center weakened significantly. The lower level Eliassen–Palm flux showed that the strongest Eliassen–Palm flux divergence was in the convection (precipitation) center—that is, the westerly wind in the center of convection (precipitation) weakened significantly. This suggests that, from west to east of the convection (precipitation) center, the transport of wave energy allowed the mid-level westerly wind to first strengthen and then weaken and the low-level westerly wind to strongly weaken in the convection (precipitation) center. This favored strengthening of the wind convergence of the mid- and lower levels of the convection (precipitation) center and strengthened the wind divergence of the mid-level to the east of the convection (precipitation) center.
The Eliassen–Palm flux divergence at heights of 9.5–12.5 km mainly alternated between positive and negative, indicating there was almost no acceleration or deceleration [38]. The Eliassen–Palm flux divergence—that is, the weakening of the westerly wind—at heights of 9.5–10.5 km above the west of the convection (precipitation) center (81.2–81.8° E) was conducive to enhancing upper level wind divergence in this area. The Eliassen–Palm flux convergence at heights of 10.5–11.5 km—that is, the strengthening of the westerly wind—was conducive to strengthening the vertical wind shear, which favored the maintenance of waves. Similarly, in the east of the convection (precipitation) center (82.0–82.5° E), the low-level Eliassen–Palm flux divergence was negative and the mid-level Eliassen–Palm flux divergence was positive. It favored strengthening of the low-level wind convergence and the mid-level wind divergence, thereby favoring the enhancement of the subsequent convection and precipitation. Figure 12a shows that precipitation subsequently did appear in this area.
Figure 12b also shows that the low-level wind convergence and the mid- to high-level wind divergence of the convection (precipitation) center (81.5–82.0° E) did be strengthened during this period. In the west of the convection (precipitation) center, the area where the low-level wind divergence and the mid-level wind convergence were strengthened (81.0–81.5° E) corresponds to the area with relatively strong precipitation.
To further study the cause of the variation in the Eliassen–Palm flux divergence, we disassembled the Eliassen–Palm flux divergence into three parts, where the zonal component is   F 11 / x (Figure 12c), the meridional component is F 12 / y (Figure 12d) and the vertical component is F 13 / z (Figure 12e). F 11 / x represents the zonal transport of the zonal momentum ( u 2 ¯ ) and the difference between the disturbance kinetic energy and the disturbance potential energy ( S ¯ ), F 12 / y represents the meridional transport of zonal momentum, and F 13 / z represents the vertical transport of zonal momentum and the meridional transport of the heat flux.
It can be seen that the zonal component F 11 / x , the meridional component F 12 / y and the vertical component F 13 / z had same order of magnitude, which means they all had an effect on the Eliassen–Palm flux divergence, but the contribution of the zonal component F 11 / x was relatively small. Comparing the Eliassen–Palm flux divergence (Figure 12a) and the components of the Eliassen–Palm flux divergence (Figure 12c–e),   F 12 / y near the center of convection (precipitation) made the greatest contribution to the mid-level Eliassen–Palm flux divergence; the lower level Eliassen–Palm flux divergence was most affected by F 13 / z ; and the upper level Eliassen–Palm flux divergence was most affected by F 13 / z . In addition, the mid- and lower level Eliassen–Palm flux divergence in the center area of the subsequent precipitation was more significantly affected by F 13 / z .
Based on the analysis in Section 4.2, the ascending phase of the inertial gravity waves, including the lower level waves excited by convection, can enhance convection. Wind divergence also played an important role in the occurrence and development of the extreme precipitation event in the Ili Valley. We found that inertial gravity waves can also feed back to the mean flow through the transport of wave energy and affect the distribution of wind divergence in the convection. The inertial gravity waves strengthened the mid- and lower level wind convergence and the mid- and upper-level wind divergence, playing an important part in the maintenance and development of convection and precipitation in the Ili Valley. The inertial gravity waves mainly presented positive feedback to the environmental field through the meridional and vertical transport of the zonal momentum and the meridional transport of heat.

6. Discussion and Conclusions

A numerical experiment was conducted using the WRF model to simulate an extreme precipitation event that occurred in the Ili Valley on 26 June 2015. This extreme precipitation event had the characteristics of a strong intensity of precipitation, a concentrated period of rainfall and strong locality. The center of precipitation was in Gongliu County. Observational data and high-resolution numerical simulation results were used to investigate the mechanisms of the occurrence and development of this extreme precipitation event. The major findings can be summarized as follows:
(1)
Our analysis of the circulation based on the observational dataset indicates that there were two stable and slow-moving Central Asian vortices at mid- and lower levels. Affected by both the vortices and the topography, the Ili Valley is mainly controlled by southeasterly winds at 500 hPa; the northerly airflow converges with the westerly winds in the valley at 700 hPa and sufficient water vapor accumulates in the valley at lower levels.
(2)
Based on the WRF simulation, the low-level northerly winds and the westerly winds in the valley formed a mesoscale convergence line in the center of the Ili Valley. A mesoscale vortex formed and developed on the low-level convergence line and the rainfall was distributed near either the convergence line or the mesoscale vortex. The low-level mesoscale convergence line combined with the uplift effect of the upwind slope of the terrain in the center of the Ili Valley to form an ascending motion at lower levels. There was also a relatively strong ascending motion at mid- and high levels as a result of the tilted development of ascending motion caused by terrain uplift and airflow convergence. Convection was triggered and developed rapidly when these two ascending motions were combined and therefore lower level inertial gravity waves were excited. The ascending position of the lower level inertial gravity waves coupled with the convergence of the lower level mesoscale vortex center led to the development of convection and an increase in precipitation. The convection moved eastward to Gongliu County and was vertically coupled with the ascending phase of the upper level inertial gravity waves, which allowed strong convection to develop and the rainfall to significantly intensify.
(3)
Spectral analysis methods were used to explore the characteristics of the waves and to identify the wave types. Based on the spectral analysis methods, the upper level waves with horizontal wavelengths of 50–55 km and periods of 73–179 min were mainly located at 79–85° E. The upper level waves propagated westward with a mean wave speed of −12 m s−1 and satisfied the polarization relationship of the westward inertial gravity waves. The upper level inertial gravity waves persisted for a long time and propagated a long distance because of the relatively more favorable waveguide conditions with the critical levels, the strong vertical wind shear and unstable shear energy. The lower level waves with a horizontal wavelength of 85 km and a period of 73–200 min were mainly located at 81–83.5° E. The lower level waves propagated eastward with a mean wave speed of 8 m s−1 and satisfied the polarization relationship of eastward inertial gravity waves. The lower level inertial gravity waves were only maintained for a short time and only propagated over a short distance because of the relatively less favorable waveguide conditions without the critical levels, the strong vertical wind shear and unstable shear energy.
(4)
Based on mesoscale Eliassen–Palm flux theory, the inertial gravity waves can feed back to the mean flow through the transport of wave energy and affect the intensity of the mean wind, enhancing lower and mid-level wind convergence and the mid- and upper level wind divergence. This favors the maintenance and development of convection and precipitation. The mid-level of the convection center was dominated by the meridional transport of zonal momentum, whereas the upper and lower levels of the convection center were dominated by the vertical transport of zonal momentum and the meridional transport of heat.
We analyzed and simulated an extreme precipitation event in the Ili Valley, Xinjiang, investigating the possible physical mechanisms leading to this extreme event. We showed that orographic precipitation in the Ili Valley may be affected by the mesoscale convergence line, the mesoscale vortex and inertial gravity waves. We carried out a study of the respective roles and relationships between the topography, strong convection and inertial gravity waves in this extreme precipitation event and found that inertial gravity waves were crucial in its development. There have been few previous studies of gravity waves related to precipitation in Xinjiang, and we therefore focused on these waves.
However, there are still some problems in this study. For example, because the local convection and related gravity waves are difficult to reproduce in a mesoscale model [39,99], we used a late start time to simulate the extreme precipitation event and therefore the source of upper level wave could not be explored. There have been some studies that can optimize simulation. For example, Lund et al. [100] described a method for producing a realistic turbulent boundary layer. Spalart et al. [101] presented a new version of detached-eddy simulation in thin boundary layers that is resistant to ambiguous grid densities. In addition, Caccamo et al. [102] investigated the impact of different grid spacing and geographic data on the performance of forecasts over complex orographic areas. Castorina et al. [103] performed the optimization of the physical parametrizations of the Weather Research and Forecasting (WRF) model. Based on these studies, the resolution of the simulation can be improved and simulation results can be optimized in the further work. Furthermore, the thermal mechanism in conjunction with the complex terrain of the Ili Valley will be discussed in depth in future work.

Author Contributions

Conceptualization, X.H.; Data curation, X.H. and Y.Z.; Formal analysis, X.H. and Y.Z.; Funding acquisition, Y.Z.; Investigation, X.H., Y.Z. and L.L.; Methodology, X.H. and L.L.; Project administration, Y.Z.; Software, X.H., Y.Z. and L.L.; Writing—original draft, X.H.; Writing—review and editing, X.H. and Y.Z. All authors have read and agreed to the published version of the manuscript.

Funding

This research was funded by the National Key Research and Development Project of China (2018YFC1507104), National Natural Science Foundation of China (Grants 41975137, 41661144024 and 41705027) and project of Institute of Desert Meteorology, CMA Urumqi (IDM2019007).

Acknowledgments

The authors acknowledge Ran Lingkun and Yang Rui for help with the gravity waves analysis and Zhang Zhe for help with the Weather Research and Forecasting simulation. The authors thank the anonymous reviewers for their valuable suggestions and constructive criticism.

Conflicts of Interest

The authors declare no conflict of interest.

References

  1. Yang, L.M.; Li, X.; Zhang, G.X. Some advances and problems in the study of heavy rain in Xinjiang. Clim. Environ. Res. 2011, 16, 188–198. (In Chinese) [Google Scholar]
  2. Zeng, Y.; Zhou, Y.S.; Yang, L.M. A preliminary analysis of the formation mechanism for a heavy rainstorm in western Xinjiang by numerical simulation. Chin. J. Atmos. Sci. 2019, 43, 372–388. (In Chinese) [Google Scholar]
  3. Zhang, J.B.; Deng, Z.F. Introduction to Precipitation in Xinjiang; Meteorological Press: Beijing, China, 1987. (In Chinese) [Google Scholar]
  4. Liao, F.; Hong, Y.C.; Zheng, G.G. Review of orographic influences on surface precipitation. Meteorol. Sci. Technol. 2007, 35, 309–316. (In Chinese) [Google Scholar]
  5. Smith, R. The influence of mountains on the atmosphere. Adv. Geophys. 1979, 21, 87–230. [Google Scholar]
  6. Houze, R.A., Jr. Orographic effects on precipitating clouds. Rev. Geophys. 2012, 50. [Google Scholar] [CrossRef]
  7. Roe, G.H. Orographic precipitation. Annu. Rev. Earth Planet. Sci. 2005, 33, 645–671. [Google Scholar] [CrossRef]
  8. Rudari, R.; Entekhabi, D.; Roth, G. Terrain and multiple-scale interactions as factors in generating extreme precipitation events. J. Hydrometeorol. 2004, 5, 390–404. [Google Scholar] [CrossRef]
  9. Tao, S.Y. Rainstorms in China; Science Press: Beijing, China, 1980. (In Chinese) [Google Scholar]
  10. Gao, K.; Zhai, G.Q.; Yu, Z.X.; Tu, C.H. The simulation study of the meso-scale orographic effects on heavy rain in East China. Sci. Atmos. Sin. 1994, 52, 157–164. (In Chinese) [Google Scholar]
  11. Li, B.; Liu, L.P.; Zhao, S.X.; Huang, C.Y. Numerical experiment of the effect of local low terrain on heavy rainstorm of South China. Plateau Meteorol. 2013, 32, 1638–1650. (In Chinese) [Google Scholar]
  12. Pierrehumbert, R.T. Linear results on the barrier effects of mesoscale mountains. J. Atmos. Sci. 1984, 41, 1356–1367. [Google Scholar] [CrossRef] [Green Version]
  13. Pierrehumbert, R.T.; Wyman, B. Upstream effects of mesoscale mountains. J. Atmos. Sci. 1985, 42, 977–1003. [Google Scholar] [CrossRef] [Green Version]
  14. Sun, J.S. The effects of vertical distribution of the lower level flow on precipitation location. Plateau Meteorol. 2005, 24, 62–69. (In Chinese) [Google Scholar]
  15. Zang, Z.L.; Zhang, M.; Shen, H.W.; Yao, H.H. Experiments on the sentivity of meso-scale terrains in Janghuai area to a heavy mold rain. Sci. Meteorol. Sin. 2004, 24, 26–34. (In Chinese) [Google Scholar]
  16. Zhu, M.; Yu, Z.H.; Lu, H.C. The effect of meso-scale lee wave and its application. Acta Meteorol. Sin. 1999, 57, 705–714. (In Chinese) [Google Scholar]
  17. Wang, J.; Shen, X.Y.; Shou, S.W.; Xu, Z.F. Numerical simulation and analysis of influence of complex topography on a Fujian rainstorm. J. Nanjing Inst. Meteorol. 2008, 30, 546–554. (In Chinese) [Google Scholar]
  18. Li, Z.G.; Liang, B.Q.; Bao, C.L. The Causes and Forecasting Problems of Heavy Rain of Early-Summer Rainstorms in Southern China; Meteorological Press: Beijing, China, 1981. (In Chinese) [Google Scholar]
  19. Sun, M.S.; Yang, L.Q.; Yin, Q.; Niu, Z.Y.; Gao, L.M. Analysis on the cause of a torrential rain occurring in Beijing on 21 July 2012(II):Vertical motion, wind vertical shear and terrain effect. Torrential Rain Disasters 2013, 32, 218–223. [Google Scholar]
  20. Huang, X.; Zhou, Y.S.; Ran, L.K.; Kalim, U.; Zeng, Y. Analysis of environment field and unstable condition on a rainstorm event in Ili Valley of Xinjiang. Chin. J. Atmos. Sci. 2020. in Press. [Google Scholar] [CrossRef]
  21. Zheng, B.H.; Li, B.; Huang, Q.X.; Li, R.Q.; Zhao, K.M. Diurnal variation characteristics of precipitation in the cold and warm season of Ili River Valley, Xinjiang. Desert Oasis Meteorol. 2019, 13, 80–87. (In Chinese) [Google Scholar]
  22. Bretherton, C.S.; Smolarkiewicz, P.K. Gravity-waves, compensating subsidence and detrainment around cumulus clouds. J. Atmos. Sci. 1989, 46, 740–759. [Google Scholar] [CrossRef] [Green Version]
  23. Fovell, R.G.; Mullendore, G.L.; Kim, S.-H. Discrete propagation in numerically simulated nocturnal squall lines. Mon. Weather Rev. 2006, 134, 3735–3752. [Google Scholar] [CrossRef] [Green Version]
  24. Li, M.C. The triggering effect of gravity wave on heavy rain. Sci. Atmos. Sin. 1978, 02, 201–209. (In Chinese) [Google Scholar]
  25. Liu, J.; Wang, W. Characteristics of gravity wave during a rainstorm process. J. Arid Meteorol. 2010, 28, 65–70+75. (In Chinese) [Google Scholar]
  26. Ma, Z.F. The relations between the index of low-frequency gravitational wave and heavy rain proceed from developmentof southwest vortex. Plateau Meteorol. 1994, 13, 51–57. (In Chinese) [Google Scholar]
  27. Nicholls, M.E.; Pielke, R.A.; Cotton, W.R. Thermally forced gravity-waves in an atmosphere at rest. J. Atmos. Sci. 1991, 48, 1869–1884. [Google Scholar] [CrossRef] [Green Version]
  28. Sharman, R.D.; Wurtele, M.G. Three-dimensional structure of forced gravity waves and lee waves. J. Atmos. Sci. 2004, 61, 664–681. [Google Scholar] [CrossRef]
  29. Stobie, J.G.; Einaudi, F.; Uccellini, L.W. A case-study of gravity-waves convective storms interaction—9 May 1979. J. Atmos. Sci. 1983, 40, 2804–2830. [Google Scholar] [CrossRef] [Green Version]
  30. Su, T.; Zhai, G. The role of convectively generated gravity waves on convective initiation: A case study. Mon. Weather Rev. 2017, 145, 335–359. [Google Scholar] [CrossRef]
  31. Uccellini, L.W.; Koch, S.E. The synoptic setting and possible energy-sources for mesoscale wave disturbances. Mon. Weather Rev. 1987, 115, 721–729. [Google Scholar] [CrossRef] [Green Version]
  32. Wang, W.; Liu, J.; Cai, X.J. Impact of mesoscale gravity waves on a heavy rainfall event in the east side of the Tibetan Plateau. Trans. Atmos. Sci. 2011, 34, 737–747. (In Chinese) [Google Scholar]
  33. Xu, X.F.; Sun, Z.B. Dynamic studyon influence of gravity wave induced by unbalanced flow on Meiyu front heavy rain. Acta Meteorol. Sin. 2003, 61, 655–660+790-793. (In Chinese) [Google Scholar]
  34. Zhang, F.Q.; Koch, S.E.; Davis, C.A.; Kaplan, M.L. Wavelet analysis and the governing dynamics of a large-amplitude mesoscale gravity-wave event along the East Coast of the United States. Q. J. R. Meteorol. Soc. 2001, 127, 2209–2245. [Google Scholar] [CrossRef]
  35. Yang, R.; Liu, Y.; Ran, L.K.; Zhang, Y.L. Simulation of a torrential rainstorm in Xinjiang and gravity wave analysis. Chin. Phys. B 2018, 27, 059201. [Google Scholar] [CrossRef]
  36. Fovell, R.; Durran, D.; Holton, J.R. Numerical simulations of convectively generated stratospheric gravity-waves. J. Atmos. Sci. 1992, 49, 1427–1442. [Google Scholar] [CrossRef] [Green Version]
  37. Piani, C.; Durran, D.; Alexander, M.J.; Holton, J.R. A numerical study of three-dimensional gravity waves triggered by deep tropical convection and their role in the dynamics of the QBO. J. Atmos. Sci. 2000, 57, 3689–3702. [Google Scholar] [CrossRef] [Green Version]
  38. Liu, L.; Ran, L.; Gao, S. Analysis of the characteristics of inertia-gravity waves during an orographic precipitation event. Adv. Atmos. Sci. 2018, 35, 604–620. [Google Scholar] [CrossRef]
  39. Du, Y.; Zhang, F. Banded convective activity associated with mesoscale gravity waves over southern China. J. Geophys. Res. -Atmos. 2019, 124, 1912–1930. [Google Scholar] [CrossRef]
  40. Lane, T.P.; Zhang, F. Coupling between gravity waves and tropical convection at mesoscales. J. Atmos. Sci. 2011, 68, 2582–2598. [Google Scholar] [CrossRef]
  41. Wheeler, M.; Kiladis, G.N. Convectively coupled equatorial waves: Analysis of clouds and temperature in the wavenumber-frequency domain. J. Atmos. Sci. 1999, 56, 374–399. [Google Scholar] [CrossRef]
  42. Chen, C.; Chu, X.; McDonald, A.J.; Vadas, S.L.; Yu, Z.; Fong, W.; Lu, X. Inertia-gravity waves in Antarctica: A case study using simultaneous lidar and radar measurements at McMurdo/Scott Base (77.8 degrees S, 166.7 degrees E). J. Geophys. Res. Atmos. 2013, 118, 2794–2808. [Google Scholar] [CrossRef]
  43. Chen, D.; Chen, Z.Y.; LÜ, D.R. Spatiotemporal spectrum and momentum flux of the stratospheric gravity waves generated by a typhoon. Sci. China: Earth Sci. 2013, 43, 889–897. (In Chinese) [Google Scholar] [CrossRef]
  44. Lane, T.P.; Moncrieff, M.W. Stratospheric gravity waves generated by multiscale tropical convection. J. Atmos. Sci. 2008, 65, 2598–2614. [Google Scholar] [CrossRef]
  45. Zhang, Y.C.; Zhang, F.Q.; Sun, J.H. Comparison of the diurnal variations of warm-season precipitation for East Asia vs. North America downstream of the Tibetan Plateau vs. the Rocky Mountains. Atmos. Chem. Phys. 2014, 14, 10741–10759. [Google Scholar] [CrossRef] [Green Version]
  46. Cai, X.; Yuan, T.; Zhao, Y.; Pautet, P.-D.; Taylor, M.J.; Pendleton, W.R., Jr. A coordinated investigation of the gravity wave breaking and the associated dynamical instability by a Na lidar and an Advanced Mesosphere Temperature Mapper over Logan, UT (41.7 degrees N, 111.8 degrees W). J. Geophys. Res. Space Phys. 2014, 119, 6852–6864. [Google Scholar] [CrossRef]
  47. Gao, S.T.; Ran, L.K.; Li, X.F. The Mesoscale Dynamic Meteorology and Its Prediction Method; Meteorological Press: Beijing, China, 2015. (In Chinese) [Google Scholar]
  48. Lu, C.G.; Koch, S.; Wang, N. Determination of temporal and spatial characteristics of atmospheric gravity waves combining cross-spectral analysis and wavelet transformation. J. Geophys. Res. Atmos. 2005, 110. [Google Scholar] [CrossRef] [Green Version]
  49. Lu, C.U.; Koch, S.E.; Wang, N. Stokes parameter analysis of a packet of turbulence-generating gravity waves. J. Geophys. Res. Atmos. 2005, 110. [Google Scholar] [CrossRef]
  50. Gamage, N.; Blumen, W. Comparative-analysis of low-level cold fronts—Wavelet, fourier, and empirical orthogonal function decompositions. Mon. Weather Rev. 1993, 121, 2867–2878. [Google Scholar] [CrossRef] [Green Version]
  51. Grivet-Talocia, S.; Einaudi, F.; Clark, W.L.; Dennett, R.D.; Nastrom, G.D.; VanZandt, T.E. A 4-yr climatology of pressure disturbances using a barometer network in central Illinois. Mon. Weather Rev. 1999, 127, 1613–1629. [Google Scholar] [CrossRef] [Green Version]
  52. Lu, X.; Chen, C.; Huang, W.; Smith, J.A.; Chu, X.; Yuan, T.; Pautet, P.-D.; Taylor, M.J.; Gong, J.; Cullens, C.Y. A coordinated study of 1 h mesoscale gravity waves propagating from Logan to Boulder with CRRL Na Doppler lidars and temperature mapper. J. Geophys. Res. Atmos. 2015, 120, 10006–10021. [Google Scholar] [CrossRef] [Green Version]
  53. Weng, H.Y.; Lau, K.M. Wavelets, period-doubling, and time-frequency localization with application to organization of convection over the tropical Western Pacific. J. Atmos. Sci. 1994, 51, 2523–2541. [Google Scholar] [CrossRef] [Green Version]
  54. Yuan, T.; Heale, C.J.; Snively, J.B.; Cai, X.; Pautet, P.D.; Fish, C.; Zhao, Y.; Taylor, M.J.; Pendleton, W.R., Jr.; Wickwar, V.; et al. Evidence of dispersion and refraction of a spectrally broad gravity wave packet in the mesopause region observed by the Na lidar and Mesospheric Temperature Mapper above Logan, Utah. J. Geophys. Res. -Atmos. 2016, 121, 579–594. [Google Scholar] [CrossRef] [Green Version]
  55. Lee, D. Analysis of phase-locked oscillations in multi-channel single-unit spike activity with wavelet cross-spectrum. J. Neurosci. Methods 2002, 115, 67–75. [Google Scholar] [CrossRef]
  56. Torrence, C.; Compo, G.P. A practical guide to wavelet analysis. Bull. Am. Meteorol. Soc. 1998, 79, 61–78. [Google Scholar] [CrossRef] [Green Version]
  57. Lomb, N.R. Least-squares frequency-analysis of unequally spaced data. Astrophys. Space Sci. 1976, 39, 447–462. [Google Scholar] [CrossRef]
  58. Scargle, J.D. Studies in astronomical time-series analysis. 2. Statistical aspects of spectral-analysis of unevenly spaced data. Astrophys. J. 1982, 263, 835–853. [Google Scholar] [CrossRef]
  59. VanderPlas, J.T. Understanding the Lomb-Scargle Periodogram. Astrophys. J. Suppl. Ser. 2018, 236, 16. [Google Scholar] [CrossRef]
  60. Cai, X.; Yuan, T.; Liu, H.-L. Large-scale gravity wave perturbations in the mesopause region above Northern Hemisphere midlatitudes during autumnal equinox: A joint study by the USU Na lidar and Whole Atmosphere Community Climate Model. Ann. Geophys. 2017, 35, 181–188. [Google Scholar] [CrossRef] [Green Version]
  61. Ford, E.A.K.; Aruliah, A.L.; Griffin, E.M.; McWhirter, I. Statistical analysis of thermospheric gravity waves from Fabry-Perot Interferometer measurements of atomic oxygen. Ann. Geophys. 2008, 26, 29–45. [Google Scholar] [CrossRef] [Green Version]
  62. Eliassen, A.; Palm, E. On the transfer of energy in stationary mountain waves. Geofys. Publ. 1961, 22, 1–23. [Google Scholar]
  63. Andrews, D.G.; McIntyre, M.E. Planetary waves in horizontal and vertical shear—Generalized Eliassen-Palm relation and mean zonal acceleration. J. Atmos. Sci. 1976, 33, 2031–2048. [Google Scholar] [CrossRef] [Green Version]
  64. Andrews, D.G.; McIntyre, M.E. Generalized Eliassen-Palm and Charney-Drazin theorems for waves on axisymmetric mean flows in compressible atmospheres. J. Atmos. Sci. 1978, 35, 175–185. [Google Scholar]
  65. Gao, S.T.; Tao, S.Y.; Ding, Y.H. The generalized E-P flux that characterizes the interaction between wave and flow. Sci. China (Ser. B) 1989, 774–784. (In Chinese) [Google Scholar] [CrossRef]
  66. Hoskins, B.J.; James, I.N.; White, G.H. The shape, propagation and mean-flow interaction of large-scale weather systems. J. Atmos. Sci. 1983, 40, 1595–1612. [Google Scholar] [CrossRef] [Green Version]
  67. Huang, R.H. The role of Greenland Plateau in the formation of the northern hemispheric stationary planetary waves in winter. Sci. Atmos. Sin. 1983, 07, 393–402. (In Chinese) [Google Scholar]
  68. Huang, R.H.; Kanzaburo, G. A study on the steady propagation of the planetary wave in the northern hemisphere in another waveguide in winter. Sci. China (Ser. B) 1983, 10, 940–950. (In Chinese) [Google Scholar]
  69. Kinoshita, T.; Sato, K. A formulation of three-dimensional residual mean flow applicable both to inertia-gravity waves and to Rossby waves. J. Atmos. Sci. 2013, 70, 1577–1602. [Google Scholar] [CrossRef]
  70. Kinoshita, T.; Sato, K. A formulation of unified three-dimensional wave activity flux of inertia-gravity waves and Rossby waves. J. Atmos. Sci. 2013, 70, 1603–1615. [Google Scholar] [CrossRef]
  71. Kinoshita, T.; Tomikawa, Y.; Sato, K. On the three-dimensional residual mean circulation and wave activity flux of the primitive equations. J. Meteorol. Soc. Jpn. 2010, 88, 373–394. [Google Scholar] [CrossRef] [Green Version]
  72. Miyahara, S. A three dimensional wave activity flux applicable to inertio-gravity waves. Sola 2006, 2, 108–111. [Google Scholar] [CrossRef] [Green Version]
  73. Plumb, R.A. On the 3-dimensional propagation of stationary waves. J. Atmos. Sci. 1985, 42, 217–229. [Google Scholar] [CrossRef]
  74. Plumb, R.A. 3-dimensional propagation of transient quasi-geostrophic eddies and its relationship with the eddy forcing of the time mean flow. J. Atmos. Sci. 1986, 43, 1657–1678. [Google Scholar] [CrossRef] [Green Version]
  75. Scinocca, J.F.; Shepherd, T.G. Nonlinear wave-activity conservation-laws and Hamiltonian-structure for the 2-dimensional anelastic equations. J. Atmos. Sci. 1992, 49, 5–27. [Google Scholar] [CrossRef] [Green Version]
  76. Takaya, K.; Nakamura, H. A formulation of a wave-activity flux for stationary Rossby waves on a zonally varying basic flow. Geophys. Res. Lett. 1997, 24, 2985–2988. [Google Scholar] [CrossRef]
  77. Takaya, K.; Nakamura, H. A formulation of a phase-independent wave-activity flux for stationary and migratory quasigeostrophic eddies on a zonally varying basic flow. J. Atmos. Sci. 2001, 58, 608–627. [Google Scholar] [CrossRef]
  78. Tung, K.K. Nongeostrophic theory of zonally averaged circulation. 1. Formulation. J. Atmos. Sci. 1986, 43, 2600–2618. [Google Scholar] [CrossRef] [Green Version]
  79. Wu, G.X.; Chen, B. Non-acceleration theorem in a primitive Equation system: I. Acceleration of zonal meanflow. Adv. Atmos. Sci. 1989, 6, 1–20. [Google Scholar]
  80. Xu, X.D.; Gao, S.T. The Theorem of External Forcing and Wave-Flow Interaction; Ocean Press: Beijing, China, 2002. (In Chinese) [Google Scholar]
  81. Chen, W.; Huang, R.H. A Numerical Study of Seasonal and Interannual Variabilities of Ozone due to Planetary Wave Transport in the Middle Atmosphere Part II. The Case of Wave- Flow Interaction. Sci. Atmos. Sin. 1996, 20, 64–73. (In Chinese) [Google Scholar]
  82. Gao, S.T.; Tao, S.Y. The lower layer frontogenesis induced by the acceleration of upper jet stream. Sci. Atmospheirca Sin. 1991, 15, 11–22. (In Chinese) [Google Scholar]
  83. Ran, L.K.; Gao, S.T.; Lei, T. Relation between acceleration of basic zonal flow and EP flux in the upper-level jet stream region. Chin. J. Atmos. Sci. 2005, 29, 409–416. (In Chinese) [Google Scholar]
  84. Liu, L.; Ran, L.; Gao, S. A three-dimensionalwave activity flux of inertia-gravity waves and its application to a rainstorm event. Adv. Atmos. Sci. 2019, 36, 206–218. [Google Scholar] [CrossRef]
  85. Shen, Y.; Pan, Y.; Yu, J.; Zhao, P.; Zhou, Z. Quality assessment of hourly merged precipitation product over China. Trans. Atmos. Sci. 2013, 36, 37–46. (In Chinese) [Google Scholar]
  86. Dee, D.P.; Uppala, S.M.; Simmons, A.J.; Berrisford, P.; Poli, P.; Kobayashi, S.; Andrae, U.; Balmaseda, M.A.; Balsamo, G.; Bauer, P.; et al. The ERA-Interim reanalysis: Configuration and performance of the data assimilation system. Q. J. R. Meteorol. Soc. 2011, 137, 553–597. [Google Scholar] [CrossRef]
  87. Huang, Y.; Liu, T.; Zhang, Y.H. Features of a Regional Rainstorm in Midsummer of 2010 in Western Xinjiang. J. Arid Meteorol. 2012, 30, 615–622. (In Chinese) [Google Scholar]
  88. Zhang, Y.H.; Chen, C.Y.; Yang, L.M.; Jia, L.H.; Yang, X. Cause analysis on rare rainstorm in west of southern Xinjiang. Plateau Meteorol. 2013, 32, 191–200. (In Chinese) [Google Scholar]
  89. Morrison, H.; Thompson, G.; Tatarskii, V. Impact of cloud microphysics on the development of trailing stratiform precipitation in a simulated squall line: Comparison of one- and two-moment schemes. Mon. Weather Rev. 2009, 137, 991–1007. [Google Scholar] [CrossRef] [Green Version]
  90. Pleim, J.E. A combined local and nonlocal closure model for the atmospheric boundary layer. Part I: Model description and testing. J. Appl. Meteorol. Climatol. 2007, 46, 1383–1395. [Google Scholar] [CrossRef]
  91. Kain, J.S. The Kain-Fritsch convective parameterization: An update. J. Appl. Meteorol. 2004, 43, 170–181. [Google Scholar] [CrossRef] [Green Version]
  92. Clark, T.L.; Hauf, T.; Kuettner, J.P. Convectively forced internal gravity-waves—Results from two-dimensional numerical experiments. Q. J. R. Meteorol. Soc. 1986, 112, 899–925. [Google Scholar] [CrossRef]
  93. Ding, X. Gravity Waves Generated by Convection and Their Interactions with Mean Flow; Wuhan University: Wuhan, China, 2011. (In Chinese) [Google Scholar]
  94. McLandress, C.; Alexander, M.J.; Wu, D.L. Microwave Limb Sounder observations of gravity waves in the stratosphere: A climatology and interpretation. J. Geophys. Res. Atmos. 2000, 105, 11947–11967. [Google Scholar] [CrossRef] [Green Version]
  95. Misiti, M.Y.; Misiti, G. Oppenheim. Wavelet Toolbox; The MathWorks Inc.: Natick, MA, USA, 1996. [Google Scholar]
  96. Lindzen, R.S.; Tung, K.K. Banded convective activity and ducted gravity-waves. Mon. Weather Rev. 1976, 104, 1602–1617. [Google Scholar] [CrossRef] [Green Version]
  97. Andrioli, V.F.; Batista, P.P.; Xu, J.; Yang, G.; Wang, C.; Liu, Z. Strong temperature gradients and vertical wind shear on MLT region associated to instability source at 23 degrees S. J. Geophys. Res. Space Phys. 2017, 122, 4500–4511. [Google Scholar] [CrossRef]
  98. Yuan, T.; Pautet, P.D.; Zhao, Y.; Cai, X.; Criddle, N.R.; Taylor, M.J.; Pendleton, W.R., Jr. Coordinated investigation of midlatitude upper mesospheric temperature inversion layers and the associated gravity wave forcing by Na lidar and Advanced Mesospheric Temperature Mapper in Logan, Utah. J. Geophys. Res. Atmos. 2014, 119, 3756–3769. [Google Scholar] [CrossRef] [Green Version]
  99. Zhang, F.Q.; Koch, S.E.; Kaplan, M.L. Numerical simulations of a large-amplitude mesoscale gravity wave event. Meteorol. Atmos. Phys. 2003, 84, 199–216. [Google Scholar] [CrossRef]
  100. Lund, T.S.; Wu, X.H.; Squires, K.D. Generation of turbulent inflow data for spatially-developing boundary layer simulations. J. Comput. Phys. 1998, 140, 233–258. (In English) [Google Scholar] [CrossRef] [Green Version]
  101. Spalart, P.R.; Deck, S.; Shur, M.L.; Squires, K.D.; Strelets, M.K.; Travin, A. A new version of detached-eddy simulation, resistant to ambiguous grid densities. Theor. Comput. Fluid Dyn. 2006, 20, 181–195. (In English) [Google Scholar] [CrossRef]
  102. Caccamo, M.T.; Castorina, G.; Colombo, F.; Insinga, V.; Maiorana, E.; Magazu, S. Weather forecast performances for complex orographic areas: Impact of different grid resolutions and of geographic data on heavy rainfall event simulations in Sicily. Atmos. Res. 2017, 198, 22–33. (In English) [Google Scholar] [CrossRef]
  103. Castorina; Caccamo, M.T.; Magazù, S. Study of convective motions and analysis of the impact of physical parametrization on the WRF-ARW forecast model. AAPP Atti della Accademia Peloritana dei Pericolanti, Classe di Scienze Fisiche, Matematiche e Naturali 2019, 97, A20. [Google Scholar]
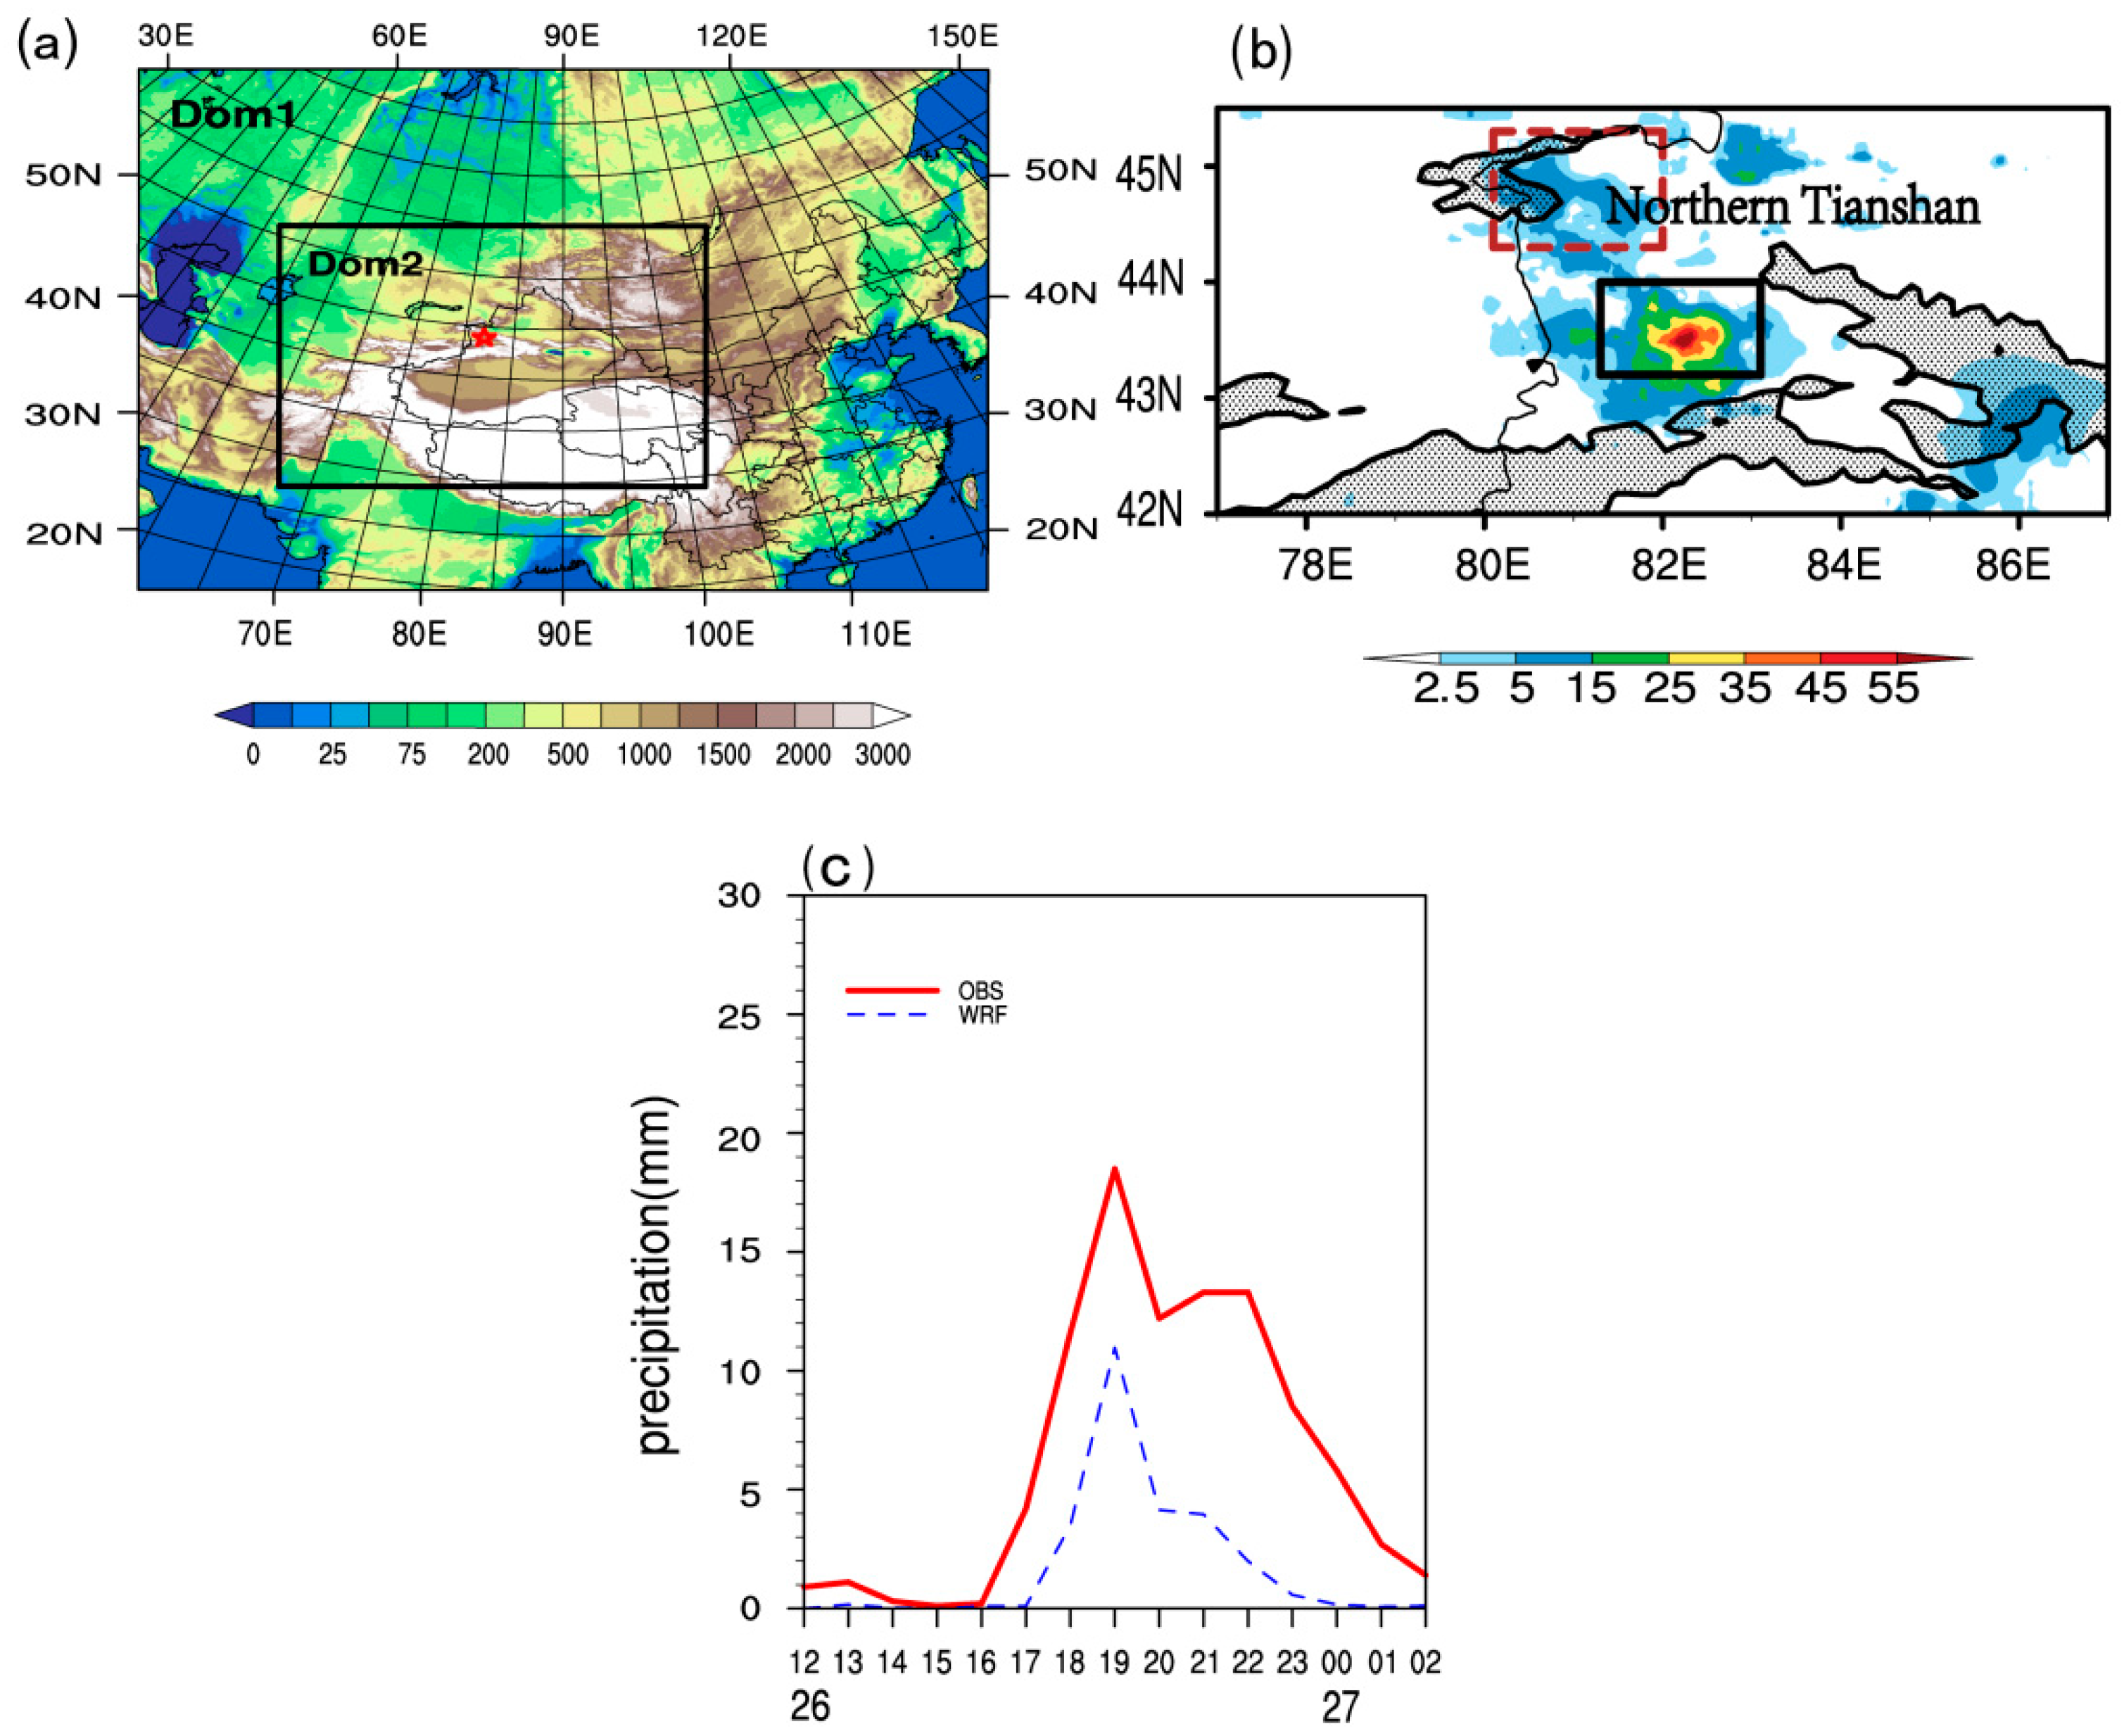
Figure 1. (a) Model domains. The shading denotes the topography (units: m) and the red star shows the location of the Ili Valley. (b) Six-hour accumulated precipitation (shaded, units: mm) from 17:00 UTC to 22:00 UTC on 26 June 2015 based on APCP observational data. The gray shading shows the elevation of the terrain above 3 km. (c) Precipitation from Gongliu national surface weather station (solid line) and the regional average precipitation in the Gongliu representative area from the WRF simulation data (dotted line) from 12:00 UTC on 26 June 2015 to 02:00 UTC on 27 June 2015.
Atmosphere 11 00752 g001
Figure 2. ECMWF ERA-Interim global atmospheric reanalysis data at 12:00 UTC on 26 June 2015showing the geopotential height (solid lines, units: gpm) and wind bars (units: m s−1) at (a) 500 hPa and (b) 700 hPa and the specific humidity (shaded, units: g kg−1) at 850 hPa. The location of the center of the Ili Valley is indicated by the red dot marked IV. The locations of the Central Asian vortices are indicated by the letter D. KZ, Kazakhstan; TB, Tarim Basin.
Atmosphere 11 00752 g002
Figure 3. Hourly changes in the black body temperature data from the FY-2F satellite (shaded, units: °C) at (a) 15:00 UTC on 26 June 2015, (b) 16:00 UTC on 26 June 2015, (c) 18:00 UTC on 26 June 2015 and (d) 19:00 UTC on 26 June 2015. The location of the center of the Ili Valley is indicated by the black dot (marked IV).
Atmosphere 11 00752 g003
Figure 4. (a) Six-hour accumulated precipitation (color-shaded, units: mm) from 17:00 UTC to 22:00 UTC on 26 June 2015 simulated by the WRF model. The gray shading shows the elevation of the terrain above 3 km. (b) Regional average precipitation near Gongliu County from the APCP observational data (solid line, units: mm) and the WRF simulation data (dotted line, units: mm) from 12:00 UTC to 20:00 UTC on 26 June 2015. (c) Observed and (d) simulated sounding at 00:00 UTC on 27 June 2015, where the thick solid line is the ambient temperature and the thin solid line is the environmental dew point temperature.
Atmosphere 11 00752 g004
Figure 5. Horizontal flow vectors (vectors; m s−1) and maximum 30-min accumulated precipitation (dots; mm) at (a) 14:00 UTC on 26 June 2015, (b) 15:00 UTC on 26 June 2015, (c) 17:30 UTC on 26 June 2015, (d) 18:30 UTC on 26 June 2015, (e) 20:00 UTC on 26 June 2015 and (f) 22:00 UTC on 26 June 2015. The gray shading shows the elevation of the terrain above 3 km.
Atmosphere 11 00752 g005
Figure 6. Cross-sections of the vertical velocity (shaded; m s−1) and flow vectors (black vectors; m s−1; wind component along the cross-section and the 10 times vertical velocity) along the black line CD in Figure 5 at (a) 14:00 UTC on 26 June 2015 and (b) 15:00 UTC on 26 June 2015. The green lines show the 30-min accumulated precipitation and the white shadings at the bottom of the figures denote the terrain. The black line shows the intersection with the cross-section along the black line AB in Figure 5.
Atmosphere 11 00752 g006
Figure 7. Cross-sections of vertical velocity (shaded; m s−1) and flow vectors (black vectors; m s−1; wind component along the cross-section and 10 times vertical velocity) along the black line AB shown in Figure 5 at (a) 15:00 UTC on 26 June 2015, (b) 16:00 UTC on 26 June 2015, (c) 17:30 UTC 26 June 2015, (d) 18:30 UTC 26 June 2015, (e) 20:00 UTC 26 June 2015 and (f) 22:00 UTC 26 June 2015. The green lines show the 30-min accumulated precipitation and the black thin solid lines denote the terrain. UW, upper level waves; LW, low-level waves. The red triangle shows the location of the center of the mesoscale vortex.
Atmosphere 11 00752 g007
Figure 8. Cross-sections of horizontal wind divergence (shaded; 10−4 s−1) and vertical velocity (lines; m s−1) along the black line AB shown in Figure 5 at (a) 15:00 UTC on 26 June 2015, (b) 16:00 UTC on 26 June 2015, (c) 17:30 UTC on 26 June 2015 and (d) 18:30 UTC on 26 June 2015. The green lines show the 30-min accumulated precipitation and the black thin solid lines denote the terrain. The red triangle shows the location of the center of the mesoscale vortex.
Atmosphere 11 00752 g008
Figure 9. (a) Power spectrum of the 10 km vertical velocity along the black line AB shown in Figure 5. The black solid lines show the phase speed ω/k. (bd) Corresponding cross-spectra of the vertical vorticity and horizontal divergence at 10 km along the black line AB shown in Figure 5 at 15:00 UTC on 26 June 2015: (b) phase difference (blue line), (c) coherency and (d) amplitude. The red arrows indicate the significant peaks discussed in the text. (eg) Wavelet cross-spectra corresponding to the horizontal wavelength (50 km) of the vertical vorticity and horizontal divergence at 10 km along the black line AB shown in Figure 5 at 15:00 UTC on 26 June 2015: (e) phase difference (blue line), red dashed lines show ±90°, (f) coherency and (g) amplitude.
Atmosphere 11 00752 g009
Figure 10. (a) Power spectrum of the 4 km vertical velocity along the black line AB shown in Figure 5. The black solid lines show the phase speed ω/k. (bd) Cross-spectra corresponding to the vertical vorticity and horizontal divergence at 4 km along the black line AB shown in Figure 5 at 17:30 UTC on 26 June 2015: (b) phase difference (blue line), (c) coherency and (d) amplitude. The red arrows emphasize the significant peaks discussed in the text. (eg) Wavelet cross-spectra corresponding to the horizontal wavelength (85 km) of the vertical vorticity and horizontal divergence at 4 km along the black line AB shown in Figure 5 at 17:30 UTC on 26 June 2015: (e) phase difference (blue line), red dashed lines show ±90°, (f) coherency and (g) amplitude.
Atmosphere 11 00752 g010
Figure 11. Cross-sections of the Richardson number (shaded; m s−1) along the black line AB shown in Figure 5 at (a) 15:00 UTC on 26 June 2015 (the brown line shows the wind speed of 12 m s−1) and (b) 17:30 UTC on 26 June 2015 (the brown line shows the wind speed of 8 m s−1). The blue lines show the level at which vertical wind shear is 6×10⁻³ s−1. The green lines show the 30-min accumulated precipitation and the black thin solid lines denote the terrain.
Atmosphere 11 00752 g011
Figure 12. Cross-sections of (a) the Eliassen–Palm flux divergence (shading; 10−3 m s−2) and Eliassen–Palm flux (vectors; m2 s−2, 10 times zonal component and 100 times vertical component) and (b) the change in divergence (shading; 10−3 s−1), (c) F 11 / x (shading; 10−3 m s−2), (d) F 12 / y (shading; 10−3 m s−2) and (e)   F 13 / z (shading; 10−3 m s−2) along the black line AB shown in Figure 5 from 17:30 to 19:00 UTC on 26 June 2015. The green line shows the accumulated precipitation from 17:30 to 19:00 UTC on 26 June 2015, the brown line shows the accumulated precipitation from 19:00 to 20:30 UTC on 26 June 2015 and the white shading denotes the terrain.
Atmosphere 11 00752 g012