Abstract
Along with its rapid urban development, Ho Chi Minh City (HCMC) in recent years has suffered a high concentration of air pollutants, especially fine particulate matters or PM2.5. A comprehensive study is required to evaluate the air quality conditions and their health impact in this city. Given the lack of adequate air quality monitoring data over a large area of the size of HCMC, an air quality modeling methodology is adopted to address the requirement. Here, by utilizing a corresponding emission inventory in combination with The Air Pollution Model-Chemical Transport Model (TAPM-CTM), the predicted concentration of air pollutants is first obtained for PM2.5, NOx, and SO2. Then by associating the pollutants exposed with the mortality rate from three causes, namely Ischemic Heart Disease (IHD), cardiopulmonary, and lung cancer, the impact of air pollution on human health is obtained for this purpose. Spatial distribution has shown a high amount of pollutants concentrated in the central city with a high density of combustion vehicles (motorcycles and automobiles). In addition, a significant amount of emissions can be observed from stevedoring and harbor activities, including ferries and cargo handling equipment located along the river. Other sources such as household activities also contribute to an even distribution of emission across the city. The results of air quality modeling showed that the annual average concentrations of NO2 were higher than the standard of Vietnam National Technical Regulation on Ambient Air Quality (QCVN 05: 2013 40 µg/m3) and World Health Organization (WHO) (40 µg/m3). The annual average concentrations of PM2.5 were 23 µg/m3 and were also much higher than the WHO (10 µg/m3) standard by about 2.3 times. In terms of public health impacts, PM2.5 was found to be responsible for about 1136 deaths, while the number of mortalities from exposure to NO2 and SO2 was 172 and 89 deaths, respectively. These figures demand some stringent measures from the authorities to potentially remedy the alarming situation of air pollution in HCM City.
1. Introduction
Currently, air pollution is a big concern in many metropoles due to its adverse effect directly on human health. Many large cities around the world have been facing air pollution problems since combustion engine transportation remains one of the major contributors. The proportion of this source of the total air emission from London UK was 50% (for NOx and PM) [1], more than 60% (for substances except SO2) in Bangkok [2], 39% (PM2.5) in Madrid, Spain; and 29% (PM2.5) in Paris, France [3]. Likewise, in 2018, emissions from traffic activities in Ho Chi Minh City (HCMC) accounted for more than 90% emissions of NOx and CO, while the contribution to SO2 and the Total Suspended Particles (TSP) was 78% and 46%, respectively [4]. This is a consequence of overusing private vehicles for transportation as per statistics in 2018. Indeed, while the total population of the city was 8.8 million, the number of registered vehicles was 8,658,087, including 762,581 automobiles and 7,895,506 motorcycles (not to mention the vehicles from surrounding provinces entering the city) [5].
As a result, in recent years the city experienced the exacerbated problem of air pollution with more frequent high Air Quality Index (AQI) during the year. The index is based on PM2.5 levels since the particles are less than 2.5 micrometers in diameter, also known as fine particles or PM2.5, which poses a risk to human health at all levels. The concentration value was measured and obtained mostly from the US Embassy station and via low-cost sensor systems around the city by a Vietnamese company called PAMAIR. In the case of Vietnam in general and HCMC in particular, there is a shortage in continuous automatic monitoring stations that measure five major pollutants at the same time to calculate AQI, while compared to other pollutants, the effect of PM2.5 is most dominant in Vietnam and particularly in HCMC. Therefore, the AQI in the HCMC is mainly attributed by the concentrations of PM2.5. Overall, for the past few years, the annual concentration of PM2.5 has always been higher than the WHO recommended value (10 µg/m3) and the Vietnamese standard QCVN 05:2013 (25 µg/m3), even though the PM2.5 distribution slightly decreased from 28 µg/m3 in 2016 to 26.4 µg/m3 in 2018 [6,7]. The proportion of AQI from 101 to 150, which is unhealthy for sensitive groups, also experienced a downward trend from 22.3% in 2016 to 15.6% in 2018. In contrast, there is an increase in the number of days with good air quality (AQI < 50), from 2.4% in 2016 to 6.1% in 2018. From the monitoring data obtained from the government agency (Department of Natural Resources and Environment, DONRE), which are collected manually, the city is often subject to a high concentration of Particulate Matter (PM), NOx, CO, and Ozone. Noted that 93.8% of PM data recorded from the 19 traffic locations have exceeded The National Technical Regulation on Ambient Air Quality (QCVN 05: 2013/BTNMT). These high pollutant concentrations were associated with an increase in the risk of human health in HCMC [8,9,10]. The previous study on the relationship between air pollution and human health pointed out that over 90% of children less than 5 years old in HCMC were infected with some respiratory issues [9]. This study considered only two Children’s Hospitals in HCMC with the application of the correlation/statistical method. Another study [10] shows that the number of deaths related to PM10 in District 5, an administrative region in HCMC with a large population, was five persons/year in 2015, or 0.0025% in the total population of 194,228 and the PM10 pollution caused economic losses of more than USD 45 million. District 5, over a long history of development with many commercial activities and concentrated markets, is always crowded with tourists and shoppers. Moreover, the district is well-known for its dense road network covering the main axes North-South, East-West of the city. When extrapolating for HCMC, the death related to PM10 was 204 persons/year, equivalent to economic losses of USD 1.836 billion. Up to now, there has been a lack of works focusing on evaluating the overall impact of PM2.5 as well as SO2 and NO2 on public health for HCMC. In 2019, an air pollution map over HCMC for many contaminations was released [4], together with the estimation of air emissions loading capacity for O3, NO2, SO2, and CO [11]. However, a PM2.5 concentration map has not been available for HCMC. Therefore, addressing this gap, this research aims to (i) Model the air pollutant profiles in simulation to obtain a comprehensive air pollution map of NO2, SO2 and PM2.5 over HCMC; and (ii) Use the air pollution map of NO2, SO2, and PM2.5 to estimate the impact of these pollutants levels to mortality caused by ischemic heart disease (IHD), cardio-pulmonary and lung cancer for the whole HCMC.
2. Modeling Methodology
2.1. Emissions Data
There are several approaches to identify contribution sources to air pollution for a city. One of them is to conduct full air emission inventory (EI) and the other is to estimate source apportionment by chemical analysis for PM2.5 and PM10 [12]. In this paper, we will update a detailed air emission inventory for HCMC from a previous work by Bang et.al. in 2019 [4], and then simulate the dispersion throughout the year, but focusing on PM2.5 since it was unaccounted for in the previous study. The emission inventory was implemented in detail for four source groups: point sources, area sources, line sources, and biogenic sources. The emissions of each source were estimated using a specific approach following the European Environment Agency guideline, in accordance with available data obtained in HCMC. All input information was collected via a survey with more than 4442 questionnaires (including 1099 for on-road sources; 750 for point sources; 2593 for area sources) and by counting traffic vehicle-flow for over 85 streets across the city. The survey objective was to find out how much energy an activity consumed at the mean levels included in Equation (1) for point sources and Equation (3) for area sources shown hereafter. For example, the mean value of fuel consumption of a motorcycle per day and the volume of gases (LPG) burning in a house for 1 day (or a certain period). PM2.5 emissions are depending on the quantity of fuel consumption and current combustion technologies, indicated by the relevant emission factors and emission treatment technologies.
PM2.5 emissions for point sources are calculated using emission factors (EFs) and activities data as
where E is emissions (usually in tons/year), A is the activities rate (amount of fuel use, capacity or number of products), EF is the emission factor (related to A), and ER is the emission reduction (only if abatement devices are installed).
In the emissions for pointed sources estimated above, the activity rate was the amount of fuel used and the productivity gained from the survey. Moreover, we also gathered the data from the energy consumption report of the enterprises. The industry of HCMC is diverse with many sectors and sub-sectors. Among that, according to the Ho Chi Minh Statistic Office in 2018 [13], the manufacturing industry for wearing apparel and textiles has witnessed the most remarkable number of factories (more than 11,000 factories), followed by fabricated metal products (except machinery and equipment) with more than 6000 facilities, and food production with more than 3000 factories. Most of those factories are installed with boilers and chimneys that emit a significant amount of pollutants into the atmosphere. Therefore, to estimate the amount of emissions, the quantity of each type of energy consumed, the capacity and the production of the company was the key information to obtain in the survey. From this, selecting suitable EFs was based on AP-42 [14] and the air pollutant emission inventory guidebook of EMEP/EEA [15] for both emissions exhausted from burning fuel and during the operation processes.
For on-road traffic sources, the EMISENS model [16] was chosen. The model divides the emissions into three emission stages: hot emission (Ehot), cold emission (Ecold), and evaporation emissions (Eevap) as in Equation (2).
Therein, emissions during the warming up stage are cold emissions; hot emissions start when the engine runs with a steady temperature; and evaporation emissions occur during the varying temperatures throughout the day as running losses, hot soak, and diurnal losses. Classified in the model, vehicles were divided into five categories: motorcycles, automobiles (under 25 seats), buses/coaches (more than 25 seats), heavy-duty vehicles (more than 3.5 tons weight), and light-duty vehicles (under 3.5 tons weight); while roads were categorized as highway/national road, ring road/provincial highway, main urban road, residential road, and industrial zone road. The input data for the model were gathered from the questionnaires that include the information about the number of trips per day, the engine technology, type of fuel use, number of trips per day, and average mileage.
Area sources cover the emissions from household activities, street-cooking, construction sites, gas stations, etc. with even distribution. Emissions from area sources were estimated based on the average amount of fuel consumption (including LPG, coal, charcoal, wood, etc.) that were collected from 2593 questionnaires, completed by each district to indicate the characteristic properties of the primary source of energy use. The questions were focused on the type of fuel use in the house/restaurants and its quantity of consumption; operation time was also recorded. The simplified equation used for this source is as follows (Equation (3)), with the corresponding emission factors (EF) for fuel types (k) and source type (j).
The total of questionnaires collected for this study was shown in Table 1 with source classifications. Area sources were entirely collected in 2017 and 2018, similarly for the industrial sources, while the data of on-road transport had been gathered from 2010 until 2017 with the total number of questionnaires reaching 4023. Due to the long service life of the vehicles (more than 10 years), the data from the previous studies in the past years were also considered by re-calculation for the baseline year of 2017, hence the reliability of the survey data could be increased. Moreover, based on the manufacture year of the vehicle model and the Vietnam emission standard roadmap, vehicles were classified according to the Euro Standard, which is referred to in the emission factors used for the model.

Table 1.
The number of samples examined by the source types (Bang et al., 2018 [4]).
2.2. Air Quality Modeling Using TAPM-CTM System
The Air Pollution Model (TAPM) model was developed by the Commonwealth Scientific and Industrial Research Organization (CRISO) of Australia. This mesoscale model is used to predict meteorological conditions within an area using synoptic data input provided by global meteorological model (such as NCEP GFS or ACCESS-G) and air pollution concentration in three dimensions. This model has been applied in many areas such as Melbourne (Australia) [17], Cabauw Tower (Netherlands) [18]. Data on topographic, soil and crop data, and sea surface temperature, are integrated in TAPM, allowing it to analyze meteorological conditions applied to many countries and regions around the world.
The TAPM was developed by Hurley et.al, since 1999 [19]. From 1999 up to now the model has still been developed and improved. The research was a comparison between the simulation of air quality for the Port Phillip and the observed values at monitoring stations of EPA Victoria, Australia [18], and between the simulation of PM10 and the observed values at monitoring station Christchurch, New Zealand [20]. A Chemical Transport Model (CTM) based on Carbon Bond 5 photochemistry was incorporated into the TAPM-CTM model. This model has also been used for modeling air quality in the Greater Metropolitan Region in New South Wales, Australia [21,22,23]. The TAPM-CTM model was applied in HCMC to simulate the photochemical smog in HCMC in 2018, and in the Southern of Vietnam for simulating meteorology and air pollutants dispersion [24]. Built on previous studies, in this paper, the TAPM-CTM version 4 was also used as the modeling method.
Here, TAPM-CTM was applied to simulate emissions of NO2, SO2 and PM2.5 over HCMC, by using nesting-grid technique to down-scale the weather data from global scale (ACCESS-G) to the city scale. The four nesting-grids are used in the TAPM-CTM run. Each domain was divided into 40 squared-cells in horizontal and 40 squared-cells in vertical; only the size of the domain is different, ranging from largest to smallest: 800 km, 400 km, 200 km, and 100 km, with the resolution of each cell respectively being 20, 10, 5, and 2.5 km. After generating the meteorology by TAPM, the model will automatically use the obtained data for calculating the dispersion and chemical reaction in CTM. More details of the TAPM-CTM model and configuration was described in [4]. The most inner grid was used as the main study area, generally covering the boundary of HCMC. In CTM model, by selecting the CB05-aerosol mechanism, it allows the users to generate a specific dispersion for PM2.5, taking into account the precursors as NO2 and SO2 [25]. The CTM has been used as a part of Australian Air Quality Forecasting System in the study of modeling primary and secondary particles in the study of Cope, taking into account the emission from urban sources and from natural sources [26].
The models have been set up to cover appropriately the HCMC area as well as in verification tasks [4,24]. For meteorology, the simulation data was compared with monitoring data at Tan Son Hoa station (near the Tan Son Nhat international airport) and for air quality data; the results were compared with monitoring data at Nguyen Van Cu station (10.762549° N, 106.682428° E). The comparison between the predicted meteorology and observed results from January to December in 2017 shows a strong correlation, as shown in Figure 1 and Figure 2, respectively, for ozone and fine particles. As for temperature, the difference was about 1.0 °C and 1.4 °C respectively in February and June 2017. The coefficient of determination R2 between simulation and monitoring for temperature was 0.77 in February and 0.74 in June [4]. TAPM model also well performed for simulating the wind speed in the study area, whereby the mean values of wind speed in both predicted and observed were approximately 2 m/s during the study period.
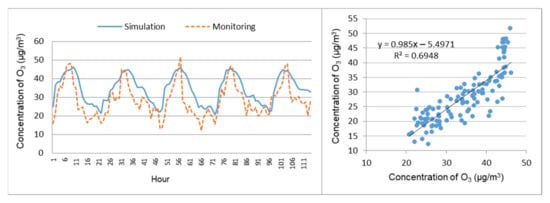
Figure 1.
Comparison of simulation and monitoring data for O3 at Nguyen Van Cu station from 12–16 June 2017.
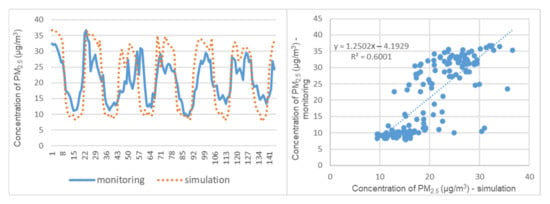
Figure 2.
Comparison results of PM2.5 simulation and monitoring from Nguyen Van Cu station from 12–17 June 2017.
Table 2 provided the results of validation for SO2, NO2, O3, and PM2.5 generated by TAPM-CTM models, using the coefficient of determination R2 and the mean normalized gross error (MNGE) [4]. In comparison with the air quality monitoring data taken from Nguyen Van Cu station located in District 5, it shows that the predicted outcomes from the air quality model were quite comparable with the hourly monitoring data of SO2, NO2, O3, and PM2.5 for the period of 12/06/2017 to 17/06/2017; the R-squared coefficient recorded for this was 0.677, 0.635, 0.694, and 0.60, respectively (see also Figure 1 and Figure 2). Therefore, the previous setting of the TAPM-CTM model remained unchanged for simulation of this study for PM2.5, NO2, and SO2.

Table 2.
Results of air quality model validation for SO2, NO2, O3, and PM2.5.
2.3. Air Pollution and Health Impact Calculation Methodology
The effects of air pollution on health have been studied and proven on a global scale. There are many studies that have been carried out to find the correlation of air pollution exposure and mortality, especially in the US and in European countries, and most of them strongly confirm the significant associations between air pollution and mortality [12,26,27,28]. In the report of WHO as “Review of evidence on health aspects of air pollution—REVIHAAP” Project [29] and “Health risks of air pollution in Europe—HRAPIE” project [30], they illustrated clearly the correlation of air pollution (for PM10, PM2.5, O3 and NO2) to human health, interpreted by concentration–response functions. Moreover, in the research of Pope et al. in 2002 [31], they give the results that fine particulate and sulfur oxide-related pollution were associated with all-cause, lung cancer, and cardiopulmonary mortality, by an increase of 10 µg/m3 in fine PM; air pollution was associated with approximately a 4% increase risk of all-cause mortality, 6% of cardiopulmonary mortality and 8% lung cancer mortality. Moreover, in 2006, the analysis of the Harvard Six Cities adult cohort study showed an association between long-term ambient PM2.5 and mortality from 1979 to 1988. The results showed that PM2.5 exposure was associated with lung cancer (RR, 1.27; 95% CI, 0.96–1.69) and cardiovascular deaths (RR, 1.28; 95% CI, 1.13–1.44) [32].
Generally, there are many approaches to estimate the health effect from air quality, such as sampling exposure and cell analysis [28], cohort study [32,33], etc. In this research, we applied the second approach by using an impact function relating the levels of air pollution change, the exposure population, the baseline incidence rate and the relative risk coefficient from epidemiological study. The function can be described as the following formula (Equation (4)):
where Y0 is the death rate baseline in the study area (%); β—the effect estimate calculated by relative risk relating to the specific change in pollutant concentration and can be found in the cohort studies; ∆PM—the air quality change (increase or decrease) in pollutant concentration (µg/m3 or ppb); and Pop—the exposed population in the study area (people). This study presents these parameter as a map layer, including: the pollutant concentration data which is the output of CTM model for yearly-average of PM2.5, NO2 and SO2 at cell resolution; the number of exposed people collected from the HCMC Statistic Office for the year of 2017; the relative risk (RR) coefficients for each parameter are obtained from the report of Health Effects Institute by Daniel Krewski and colleagues (Table 3) [33]; and the death rate baseline is from Vietnamese A6 mortality reporting system (A6 system).

Table 3.
The relative risk of pollutants and selected cause of deaths [33].
The study of Krewski has been carried out for 18 years, involving approximately 360,000 participants residing around the USA in 1980 and increasing up to around 500,000 people in 2000. These people were fully tracked for the levels of PM2.5 exposure and their status are also recorded on their diseases and mortality. The RR value in Table 3 shows that PM2.5 was strongly associated with the death due to lung cancer and IDH with the RR being higher than those of the other pollutants. Meanwhile, there is a weaker association between the disease and the mass of the larger size of particles, as well as with the concentration of SO2.
For the mortality baseline incident rate in HCMC, the total number of deaths was gathered from the Ministry of Public Health in the form of the Vietnamese A6 mortality reporting system. This is a data set built from 1992 to record the death from the commune level, aggregated then and posted to the central level. Health storage system A6 in Vietnam recorded relatively full (94%) the number of deaths and correctly classified the top three causes of death (accounting for 66% of total deaths), which is related to the circulatory system, cancer, and trauma. The mortality data for three main causes of deaths such as IHD, cardio-pulmonary, and lung cancer was defined based on the classification in the cohort study of Krewski [33] and Pope [34] on the studies of health impact assessment of air pollution on mortality in the US. These codes are related to the diseases that Krewski et al. was given throughout his cohort researches about health impact assessment [35]. In their studies, they classified the diseases according to the International Classification of Diseases (ICD) 9th version—ICD-9, which is a medical classification list by WHO; therefore, these codes need to be converted into the corresponding code in the 10th version. Table 4 below shows the classification of disease according to the ICD code, comparing the 9th version and the 10th version for the diseases concerned. According to this, cardio- pulmonary can be defined with the code in the ICD-10 for Disease of the circulatory system ranging from I10–I15, I20–I28, I30–I52, I60–I79, and Disease of the Respiratory system, which is ranging from J00–J99, while IHD corresponding to I20–I25 and Lung cancer is C33–C34.

Table 4.
Disease classification codes in ICD-9 and ICD-10.
As recorded from A6 health system of Ho Chi Minh City, there were about 6630 deaths per year related to cardiopulmonary disease (accounting for 30.05% of total deaths), 3314 deaths due to IHD (accounting for 15.02% of total deaths) and 437 deaths from lung cancer (accounting for 2.00% of total deaths).
3. Results and Discussion
3.1. Emissions Maps
Figure 3 demonstrated the main sources of PM2.5 in HCMC, in which the industrial sources account for around 30% of total PM2.5 emissions (textiles (3%), food processing (6%), and paper processing (4%)); area sources accounted for 20% the total emissions, while emissions from transportation sources including on-road and non-road sources were about 50%. Therein, the largest proportion belonged to the emissions of motorcycles (18%), following by vehicles’ brake wear and road surface (14%) and household activities (14%).
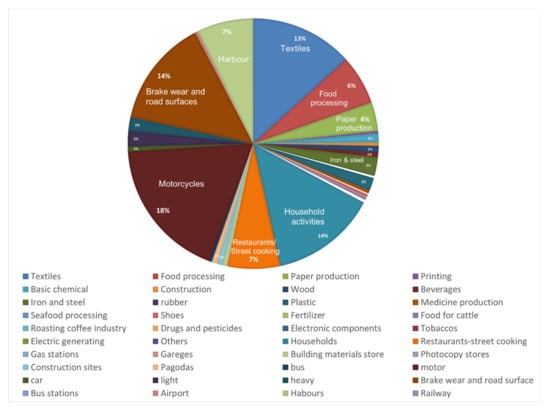
Figure 3.
Source component of PM2.5 in HCMC.
The total of PM2.5 emissions is shown in Table 5, together with the percentage of source components of the other pollutants. Accordingly, transportation was the main air emission sources of the city, accounting for more than 90% of NOx, CO, NMVOC (Non-Methane Volatile Organic Compound), and 45% of PM2.5, while point sources contributed a notable amount to emissions of PM2.5, SO2, and TSP with 32%, 22%, and 21% respectively. Area sources only contributed 33% of the total amount of TSP, 23% of PM2.5, and a negligible amount of other pollutants (<3%).

Table 5.
The proportion of source types in total emissions in HCMC in 2017 [4].
In order to prepare the input data for the air quality simulation model, the emissions of PM2.5 distributed over the city were collated and calculated over the HCMC domain, as shown in Figure 4. Similarly to the distribution pattern of other pollutants, the emission pattern of PM2.5 was concentrated in the middle of the area―which is the city center with a lot of activities, such as highest road network density and highest population density (Table 6) in core center districts of 1, 3 and 5 (Figure 4).
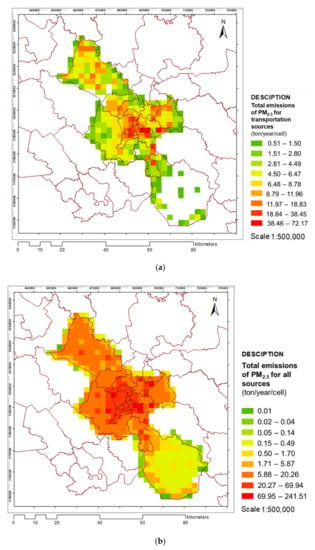
Figure 4.
Spatial distribution of PM2.5 emissions for transportation sources (a); PM2.5 emissions distribution for all sources (b) in HCMC.

Table 6.
Area, population and population density of HCMC in 2018 by District [13].
Overall, transportation was the main source of PM2.5, which contributed up to 44.8% of total emissions, whereas industry ranked second with 33.6% and area sources contributed to 22.6%. This figure is similar to the study of Cohen et al., 2010 who reported that the main source of PM2.5 in Hanoi from 2001–2008 was traffic sources, contributing 40%, whereas the proportion of industrial sources was 36% [35]. Despite the difference in the approach of the two studies, the sources apportionment of air pollution shared the same pattern [36] between HCMC and Hanoi. It could be understood since Hanoi and HCMC are principal cities in Vietnam having similarities of vehicle composition in the fleet and also industrial location pattern outside the city and in the neighboring provinces. For instance, they are the two largest cities in Vietnam with the highest population density and the highest number of personal vehicles, especially for motorcycles. Moreover, industrial production in general has many similarities in technologies and sectors of works. This would be considered to affect the character of sources of pollutants in the two cities.
Comparing with the study of Hien et al. 2001 [36], on source apportionment of PM2 concentration in Ho Chi Minh City from 1996 to 1998, there are some similarities. For example, the proportions of particles from road dust and vehicles in Hien’s study were 13% and 17%, respectively. This contribution is also quite similar when comparing the source contribution of the friction of vehicle to the road surface and motorcycle exhausts, being 14% and 18.3%, respectively, in our study. The percentage of emissions from industrial sources in this study was 33.6%, larger than that in the study [36] (13%). It can also be explained by the difference in conducting source apportionment in the two studies. Therein, source apportionment was conducted at only one site, located at the rooftop of an eight-floor building in the city center, surrounded by compact houses, narrow streets, and high vehicle density, with no big industrial plant within a radius of 10 km. In our study, many major sources throughout the city were taken into account, including line, point, and area sources. In addition, the industrial sources in this study were determined by both the production process and fuel combustion, so the results partially cover the coal source, which contributes 10% [36]. It can be seen that in these two studies, despite having different approaches, the formerly used receptor modeling, and the later applied emission inventory, they share some certain similarities.
3.2. Air Quality Modeling
Air quality simulation was carried out for the whole year of 2017 over HCMC. The results show that the maximum 1-h concentrations of NO2 were 353 µg/m3, exceeding QCVN 05:2013/BTNMT (200 µg/m3) (QCVN). The maximum 1-h concentrations of SO2 were 61.9 µg/m3 and much lower than the standard in QCVN. The results in Figure 5 also showed that the annual average concentrations of NO2 were 67.1 µg/m3, higher than QCVN (40 µg/m3). In contrast, the annual levels of PM2.5 were 23 µg/m3, levels of SO2 were 19.2 µg/m3, lower than QCVN (25 µg/m3 and 50 µg/m3). However, the PM2.5 levels in most areas in the city were about two times higher than WHO recommendations (10 µg/m3), with the exception of some areas in the south of the city (Can Gio District). The highest concentration was in District 4 and District 2 (detail location of each district is in Figure 6) where there were concentrated ports. There are 34 ports in HCMC. These results were relatively similar to the PM2.5 pattern observed by using continuous monitoring in the period of 2011–2015.
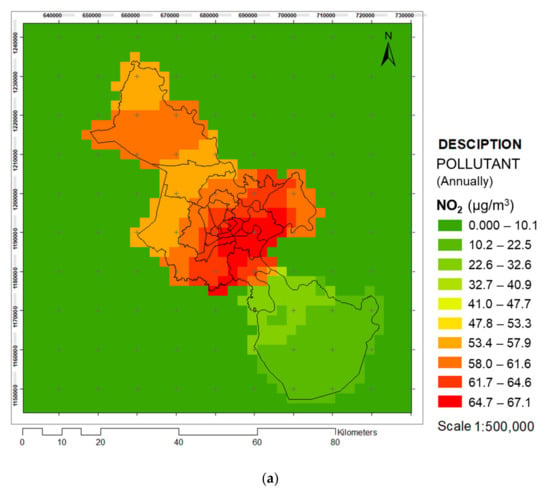
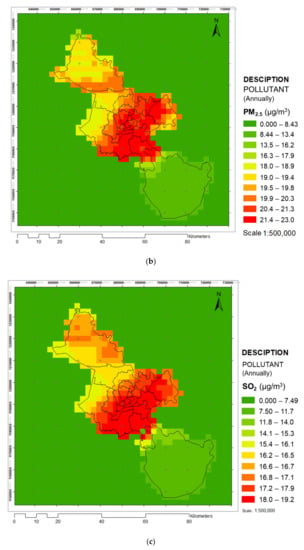
Figure 5.
Air pollution dispersion map for (a) NO2, (b) PM2.5, and (c) SO2 annually in HCMC.
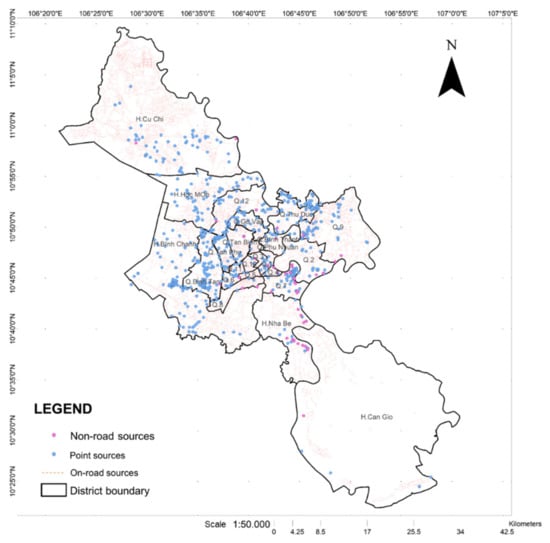
Figure 6.
District boundary of Ho Chi Minh City Map and distribution of emissions sources.
3.3. Results of Impacts of Air Pollution on Public Health
As the current work aimed to investigate the health impact of PM 2.5 in HCMC, here all prepared data used for impact assessment were presented as the maps of air pollution, health baseline incidence rate, and the exposed population. Indeed, the map of mortality for three diseases (Lung cancer, Cardio-pulmonary, and IHD) related to PM2.5, SO2, and NO2 were generated as shown in Figure 7a–c. The pattern of deaths due to Cardio-pulmonary and IHD associated with PM2.5, SO2, and NO2 are similar to the pattern in Figure 5. The number of death cases is high in the center of HCMC because the population density is high and the air in the center of HCMC is more polluted than in suburban districts such as Cu Chi and Hoc Mon in Northwest of HCMC, and suburban districts as Can Gio and Nha Be in Southeast of HCMC. In addition, in the impact function formula (Equation (4)) which was used to calculate health effect (number of mortalities) related to air pollutant, concentration does not only depend on the air pollution map but also depends on the map of health baseline incidence of HCMC and exposed population map. The exposed population map also shows that population density is higher in the center of HCMC since almost all social and economic activities concentrate in this area. The map of health baseline incidence of HCMC referred from the A6 system also shows that there are higher deaths in the city center than in the suburban areas.
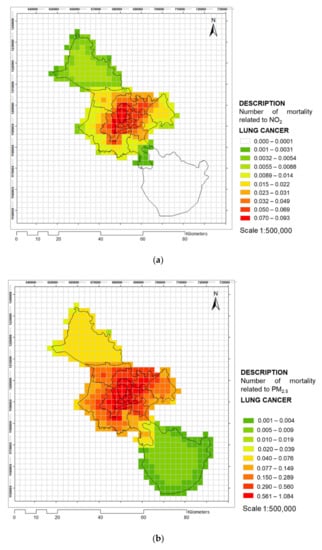
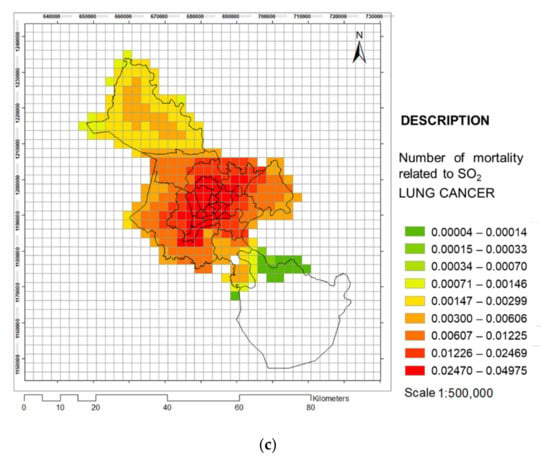
Figure 7.
Mortality map (death/year/cell) related to lung cancer cases over HCMC due to (a) NO2, (b) PM2.5, and (c) SO2.
The calculated result of the impact of air pollution due to PM2.5 on public health is shown in Table 7, which shows that the number of deaths from PM2.5 accounts for 81% of total deaths among 3 pollutants (PM2.5, SO2, and NO2). The second-largest impact was NO2, accounting for about 12.2%, and the third pollutant was SO2 with 6.3%. These results can also be explained by the fact that PM2.5 is very dangerous and has a higher impact as mentioned by WHO: “PM2.5 pollution has health impacts even at very low concentrations – indeed no threshold has been identified below which no damage to health is observed. Therefore, the WHO 2005 guideline limits aimed to achieve the lowest concentrations of PM possible” [37]. This result of highest death due to PM2.5 is consistent with the air quality monitoring data done by HCMC environmental monitoring center (the PM2.5 is usually higher than QCVN) and is consistent with the results of PM2.5 air quality modeling in this study (the annual average concentrations of PM2.5 is much higher than WHO (10 µg/m3) about 2.3 times).

Table 7.
Mortality burden from air pollution in HCMC (Unit: Death case).
The above results are compared with the health record system for HCMC, namely the Vietnamese A6 mortality reporting system. The results show that lung cancer deaths due to air pollution (PM2.5, SO2, and NO2) account for about 16.6% of whole lung cancer deaths in HCMC. The record shows that cardio-pulmonary deaths due to air pollution (PM2.5, SO2, and NO2) account for about 12.68% of whole cardio-pulmonary deaths in HCMC. In addition, our results show that IHD deaths due to air pollution (PM2.5, SO2, and NO2) account for about 14.57% of whole IHD deaths in HCMC. PM2.5 is responsible for the largest number of deaths from cardio-pulmonary disease with 715 cases, followed by NO2 with 83 cases, and finally SO2 with 43 cases. The number of deaths due to heart-lung disease is quite similar to that in the study of Yorifuji in 2015 when they calculated the number of deaths due to this disease caused by PM2.5 was 964 cases in Ho Chi Minh City [38].
3.4. Sensitivity Analysis
This is the first study in Vietnam for assessing the impact of air pollution on human health in Vietnam, in particular HCMC, by applying the air quality modeling approach. Here, some limitations and sensitivity of results could be mentioned: (i) The total number of deaths was gathered from the Ministry of Public Health in the form of the Vietnamese A6 mortality reporting system. An evaluation of the A6 system shows that the sensitivity of the A6 system varies according to the cause of death. The sensitivity for death from injury was 75.4%, for cancer 66.9% and for circulatory system disease 63.1% [39]; (ii) Since HCMC does not have a reliable system for recording detail data for air emission inventory, the air emission inventory results may have uncertainty, and this is unavoidable and requires future improvements for air quality modeling. Currently, the validation of the TAPM-CTM model at R2 about 0.7 (comparing air quality modeling results and air quality monitoring results) appears to be acceptable. The future study should focus on increasing the air emission inventory accuracy and also a more rigorous evaluation of the local A6 health recording system.
4. Conclusions
This paper has presented the first effort to assess the overall impact of air pollutants (PM2.5, NO2, and SO2) on public health by modeling methods in HCMC Vietnam. The results of air quality modeling show that the maximum 1-h concentrations of NO2 were 353 µg/m3, exceeding QCVN (200 µg/m3). The annually average concentrations of NO2 were higher than that of QCVN and WHO (i.e., 40 µg/m3). The annually average concentrations of PM2.5 were 23 µg/m3, which appears to be much higher (about 2.3 times) than the WHO guideline (10 µg/m3).
The outcome of this study on the impact of air pollution on public health showed that air pollution in HCMC was seriously affecting public health. The approximate total death cases are found to be 1396 for three diseases (lung cancer, cardio-pulmonary, and IHD) due to population exposure to the combination of PM2.5, SO2, and NO2 pollutant levels. Among these air pollutants, PM2.5 has the highest impact in terms of mortality with a total of 1.136 deaths, followed by NO2 with 172 cases and 89 cases by SO2. These concerning results demand some stringent measures from the authorities to potentially remedy the alarming situation.
Author Contributions
B.Q.H. was responsible for developing research methodology, together with D.H.N., while H.N.K.V., T.T.N., and T.T.H.N. were responsible for calculating PM2.5 emissions. H.N.K.V. is in charge of running TAPM-CTM model and estimating the effect of air pollution on public health, with the support of N.D.T. for the health data analysis and supervising for health impact assessment. B.Q.H. collected data and performed the validation of the models, D.H.N. helped in converting the output of CTM to grid format. T.T.T.N. contributed to the overview and discussion tasks. The manuscript was developed, revised, and edited by B.Q.H., H.N.K.V., Q.P.H., D.H.N., and T.T.T.N. All authors have read and agreed to the published version of the manuscript.
Funding
This research is funded by Vietnam National University Ho Chi Minh City (VNU-HCM) under grant number B2019-24-01.
Acknowledgments
We thank The Vietnam National University Ho Chi Minh City and The Institute of Environment and Resources for accepting to conduct the research project B2019-24-01. Special thanks to Le Thanh Hai, Associate Dinh Xuan Thang, Associate To Thi Hien, Associate Dao Nguyen Khoi, Nguyen Nhat Huy, Do Thi Thu Huyen for their pertinent comments to this research.
Conflicts of Interest
The authors declare no conflict of interest.
References
- London Councils. Demystifying Air Pollution in London; London Councils: London, UK, 2018. Available online: https://www.londoncouncils.gov.uk/sites/default/files/Policy%20themes/Environment/Demystifying%20air%20pollution%20in%20London%20FINAL%20FULL%20REPORT_IM_0.pdf (accessed on 15 May 2020).
- Supat, W. Air Quality Management: Thailand’s Experiences. In Proceedings of the ISAP 2013, Kanagawa, Japan, 23–31 July 2013; Available online: https://www.iges.or.jp/isap/2013/PDF/L1/ISAP_L1_4_Supat.pdf (accessed on 15 May 2020).
- Thunis, P.; Degraeuwe, B.; Peduzzi, E.; Pisoni, E.; Trombetti, M.; Vignati, E.; Wilson, J.; Belis, C.A.; Pernigotti, D. Urban PM2.5 Atlas: Air Quality in European Cities. 2017. Available online: https://ec.europa.eu/jrc/en/publication/eur-scientific-and-technical-research-reports/urban-pm25-atlas-air-quality-european-cities (accessed on 15 May 2020).
- Bang, H.Q.; Vu, H.N.K.; Nguyen, T.T.; Nguyen, T.T.H.; Nguyen, T.T.T. A combination of bottom-up and top-down approaches for calculating of air emission for developing countries: A case of Ho Chi Minh City, Vietnam. Air Qual. Atmos. Health 2019, 12, 1059. [Google Scholar]
- Department of Transportation Ho Chi Minh City. Controlling the Demand for Private Vehicles in HCMC—Reality, and Solutions. 2017. Available online: http://congan.com.vn/giao-thong-24h/tp-hcm-ban-cach-han-che-xe-may-phuongtien-ca-nhan_37514.html (accessed on 20 April 2017). (In Vietnamese).
- Thu, N.T.A.; Blume, L. Air Quality Report in 2017. 2018. Available online: http://www.greenidvietnam.org.vn//app/webroot/upload/admin/files/140518_AQR_VIE_FINAL_compressed.pdf (accessed on 15 May 2020).
- Thu, N.T.A.; Hang, V.T.D.; Blume, L. Air Quality Report in 2018. 2019. Available online: http://www.greenidvietnam.org.vn//app/webroot/app/webroot/upload/admin/files/GreenID_Bao_cao_chat_luong_khong_khi_2018.pdf (accessed on 15 May 2020).
- HEI. Effects of Short-Term Exposure to Air Pollution on Hospital Admissions of Young Children for Acute Lower Respiratory Infections in Ho Chi Minh City, Vietnam; Health Effects Institute: Boston, MA, USA, 2012. [Google Scholar]
- Mehta, S.; Long, H.N.; Dzung, D.V.; Cohen, A.; Thach, T.Q.; Dan, V.X.; Tuan, N.D.; Giang, L.T. Air pollution and admissions for acute lower respiratory infections in young children of Ho Chi Minh city. Air Qual. Atmos. Health 2013, 6, 167–179. [Google Scholar] [CrossRef]
- Bang, H.Q. Modeling PM10 in Ho Chi Minh City, Vietnam and evaluation of its impact on human health. Sustain. Environ. Res. 2017, 27, 95–102. [Google Scholar]
- Study Loading Capacties of Air Pollutant Emissions for Developing Countries: A Case of Ho Chi Minh City, Vietnam. Available online: https://doi.org/10.1038/s41598-020-62053-4 (accessed on 15 May 2020).
- Soggiu, M.E.; Inglessis, M.; Gagliardi, R.V.; Settimo, G.; Marsili, G.; Notardonato, I.; Avino, P. PM10 and PM2.5 qualitative source apportionment using selective wind direction sampling in a port-industrial area in Civitavecchia, Italy. Atmosphere 2020, 11, 94. [Google Scholar] [CrossRef]
- Statistic Year Book of Ho Chi Minh City in 2018; Ho Chi Minh Department of Statistic Offices: Ho Chi Minh City, Vietnam, 2018.
- US EPA.2009.AP-42 Compilation of Air Pollutant Emission Factors. Available online: https://www.epa.gov/air-emissions-factors-and-quantification/ap-42-compilation-air-emissions-factors (accessed on 11 November 2019).
- European Environment Agency (EEA). EMEP/CORINAIR Emission Inventory Guidebook; EEA: Kobenhavn K, Denmark, 2016.
- Bang, H.Q.; Clappier, A.; Blond, N. Fast and optimized methodology to generate road traffic emission inventories and their uncertainties. Clean Soil Air Water 2014, 42, 1344–1350. [Google Scholar] [CrossRef]
- Hurley, P.; Manins, P.; Lee, S.; Boyle, R.; Ng, Y.L.; Dewundege, P. Year-long, high-resolution, urban airshed modelling: Verification of TAPM predictions of smog and particles in Melbourne, Australia. Atmos. Environ. 2003, 37, 1899–1910. [Google Scholar] [CrossRef]
- Hurley, P.J.; Physick, W.L.; Luhar, A.K. Tapm: A practical approach to prognostic meteorological and air pollution modelling. Environ. Model. Softw. 2005, 20, 737–752. [Google Scholar] [CrossRef]
- Hurley, P.J. The Air Pollution Model (TAPM) Version 1: Technical Description and Examples; CSIRO Atmospheric Research: Aspendale, Australia, 1999. [Google Scholar]
- Zawar-Reza, P.; Kingham, S.; Pearce, J. Evaluation of a year-long dispersion modelling of PM10 using the mesoscale model TAPM for Christchurch, New Zealand. Sci. Total Environ. 2005, 349, 249–259. [Google Scholar] [CrossRef] [PubMed]
- Wahid, H.; Ha, Q.P.; Duc, N.D.; Azzi, M. Neural network-based meta-modelling approach for estimating spatial distribution of air pollutant levels. Appl. Soft Comput. 2013, 13, 4087–4096. [Google Scholar] [CrossRef]
- Metia, S.; Ha, Q.P.; Duc, N.D.; Scorgie, Y. Urban air pollution estimation using unscented Kalman filtered inverse modeling with scaled monitoring data. Sustain. Cities Soc. 2020, 54, 101970. [Google Scholar] [CrossRef]
- Ha, Q.P.; Wahid, H.; Duc, N.D.; Azzi, M. Enhanced Radial Basis Function Neural Networks for Ozone Level Estimation. Neurocomputing 2015, 155, 62–70. [Google Scholar] [CrossRef]
- Photochemical Smog Modelling Using the Air Pollution Chemical Transport Model (TAPM-CTM) in Ho Chi Minh City, Vietnam. Available online: https://doi.org/10.1007/s10666-018-9613-7 (accessed on 15 May 2020).
- Updates to the Carbon Bond Chemical Mechanism: CB05. Available online: https://www.semanticscholar.org/paper/Updates-to-the-Carbon-Bond-Chemical-Mechanism%3A-CB05-Yarwood-Rao/f15280b096436bfc04998bccc4c4bceb15444dce (accessed on 15 May 2020).
- Hoek, G.; Krishnan, R.M.; Beelen, R.; Peters, A.; Ostro, B.; Brunekreef, B.; Kaufman, J.D. Long-term air pollution exposure and cardio-respiratory mortality: A review. Environ. Health 2013, 12, 43. [Google Scholar] [CrossRef] [PubMed]
- Settimo, G.; Mudu, P.; Viviano, G. Air pollution: General problems in the area of Gela. Epidemiol. Prev. 2009, 33 (Suppl. 1), 37–42. [Google Scholar] [PubMed]
- Bastonini, E.; Verdone, L.; Morrone, S.; Santoni, A.; Settimo, G.; Marsili, G.; La Fortezza, M.; Di Mauro, E.; Caserta, M. Transcriptional modulation of a human monocytic cell line exposed to PM10 from an urban area. Environ. Res. 2011, 111, 765–774. [Google Scholar] [CrossRef] [PubMed]
- WHO. Review of Evidence on Health Aspects of Air Pollution—REVIHAAP Project; WHO: Geneva, Switzerland, 2013. [Google Scholar]
- WHO. Health Risks of Air Pollution in Europe—HRAPIE Project. Recommendations for Concentration–Response Functions for Cost-Benefit Analysis of Particulate Matter, Ozone and Nitrogen Dioxide; WHO: Geneva, Switzerland, 2013. [Google Scholar]
- Cope, M.; Lee, S. Chemical Transport Model—User Manual CAWCR Technical Report No. 016; CSIRO Atmospheric Research: Aspendale, Australia, 2009. [Google Scholar]
- Laden, F.; Schwartz, J.; Speizer, F.E.; Dockery, D.W. Reduction in fine particulate air pollution and mortality: Extended follow-up of the Harvard Six Cities study. Am. J. Respir. Crit. Care Med. 2006, 173, 667–672. [Google Scholar] [CrossRef] [PubMed]
- Krewski, D.; Jerrett, M.; Burnett, R.T.; Ma, R.; Hughes, E.; Shi, Y.; Turner, M.C.; Pope, C.A., III; Thurston, G.; Calle, E.E.; et al. Extended Follow-Up and Spatial Analysis of the American Cancer Society Study Linking Particulate Air Pollution and Mortality; Health Effects Institute: Boston, MA, USA, 2009. [Google Scholar]
- Pope, C.A., III; Burnett, R.T.; Thun, M.J.; Calle, E.E.; Krewski, D.; Ito, K.; Thurston, G.D. Lung cancer, cardiopulmonary mortality, and long-term exposure to fine particulate air pollution. JAMA 2002, 287, 1132–1141. [Google Scholar] [CrossRef] [PubMed]
- Cohen, D.D.; Crawford, J.; Stelcer, E.; Bac, V.T. Characterisation and source apportionment of fine particulate sources at Hanoi from 2001 to 2008. Atmos. Environ. 2010, 44, 320–328. [Google Scholar] [CrossRef]
- Hien, P.D.; Binh, N.T.; Truong, Y.; Ngo, N.T.; Sieu, L.N. Comparative receptor modelling study of TSP, PM2 and PM2− 10 in Ho Chi Minh City. Atmos. Environ. 2001, 35, 2669–2678. [Google Scholar] [CrossRef]
- WHO (World Health Organization). Ambient (Outdoor) Air Pollution. 2018. Available online: https://www.who.int/news-room/fact-sheets/detail/ambient-(outdoor)-air-quality-and-health (accessed on 15 December 2019).
- Yorifuji, T.; Bae, S.; Kashima, S.; Tsuda, T.; Doi, H.; Honda, Y.; Kim, H.; Hong, Y.-C. Health impact assessment of PM10 and PM2.5 in 27 Southeast and East Asian Cities. J. Occup. Environ. Med. 2015, 57, 751–756. [Google Scholar] [CrossRef] [PubMed]
- Stevenson, M.; Hung, D.V.; Hoang, T.H.; Mai Anh, L.; Nguyen Thi Hong, T.; Le Tran, N. Evaluation of the Vietnamese A6 mortality reporting system: All-cause mortality. Asia Pac. J. Public Health 2015, 27, 733–742. [Google Scholar] [CrossRef] [PubMed]
© 2020 by the authors. Licensee MDPI, Basel, Switzerland. This article is an open access article distributed under the terms and conditions of the Creative Commons Attribution (CC BY) license (http://creativecommons.org/licenses/by/4.0/).