Review

Covid-19 Airborne Transmission and Its Prevention: Waiting for Evidence or Applying the Precautionary Principle?

Laboratory of Hygiene and Environmental Virology, Department of Biology, University of Pisa, Via S. Zeno 35/39, 56127 Pisa, Italy
*
Author to whom correspondence should be addressed.
Atmosphere 2020, 11(7), 710; https://doi.org/10.3390/atmos11070710
Submission received: 12 June 2020 / Revised: 30 June 2020 / Accepted: 1 July 2020 / Published: 3 July 2020
(This article belongs to the Special Issue Bioaerosol Exposure and Risk Assessment)

Abstract

:
Besides the predominant ways of transmission of SARS-CoV-2 (namely, contacts and large droplets) the airborne one is increasingly taken into consideration as a result of latest research findings. Nevertheless, this possibility has been already suggested by previous studies on other coronaviruses including SARS-CoV and MERS-CoV. To describe the state of the art of coronaviruses and airborne transmission, a systematic review was carried out using the PRISMA methodology. Overall, 64 papers were selected and classified into three main groups: laboratory experiments (12 papers), air monitoring (22) and epidemiological and airflow model studies (30). The airborne transmission of SARS-CoV-2 is suggested by the studies of the three groups, but none has yet obtained complete evidence. The sampling and detection methods have not been validated, therefore monitoring results are affected by a possible underestimation. Then, epidemiological investigations only hypothesize the airborne transmission as a possible explanation for some illness cases, but without estimating its attributable risk. Nevertheless, while waiting for more evidence, it is urgent to base advice on preventive measures, such as the use of masks, safe distancing and air ventilation, on the precautionary principle.

1. Introduction

Severe acute respiratory syndrome coronavirus 2 (SARS-CoV-2) virus is a new β-coronavirus, which originated from a spill over from an animal reservoir and is responsible for a respiratory disease in humans, just like Middle East respiratory syndrome coronavirus (MERS-CoV) and severe acute respiratory syndrome coronavirus (SARS-CoV). The first cases raised in Wuhan, Hubei Province, China at the end of 2019, then a rapid spread was reported worldwide, thus the WHO declared this disease (named COVID-19 on 11 February 2020) firstly, a Public Health Emergency of International Concern and then a pandemic on 11 March, 2020 [1]. At present (7 June 2020), SARS-CoV-2 has caused more than six and a half million confirmed cases across the world and approximately 400,000 people have died [2]. Analysis of clinical specimens revealed the presence of SARS-CoV-2 RNA in various bodily fluids from infectious patients, not only respiratory secretions, typically nasopharyngeal or oropharyngeal specimens [3,4], but also fecal material [5,6] and often in multiple sites [7,8], even from asymptomatic patients [9,10], and sometimes for a long time, so causing super spreading events [11].The presence of infectious SARS-CoV-2 in clinical samples was less frequently detected because of the technical and safety problems linked to the infectivity tests in cell cultures [12]. However, the virus has been isolated from higher and lower respiratory tract specimens [13,14], from saliva [15], stool [7,16] and urine [17].
Similarly to SARS-CoV and MERS-CoV, the main routes of transmission of SARS-CoV-2 are contact transmission with the infected people (direct contact) or with contaminated surfaces or fomites (indirect contact) and respiratory transmission by large droplets, within 1 m distance from an infected person. The World Health Organisation (WHO) defines “droplets” the liquid particles greater than 5 µm, and “aerosol” the smaller ones [18]. The SARS-CoV-2 transmission by aerosol (airborne) has been considered plausible by WHO only in the case of healthcare settings, as a result of medical procedures, such as intubation, ventilation, or drug delivery via nebulizer [19]. Nevertheless, the airborne transmission has been also hypothesized in other circumstances, both in hospital and in community settings [20,21]. In fact, human expiratory activities (coughing, sneezing, speaking and singing, but also just breathing) release particles in a wide range of size, from 1 to 2000 µm, with the majority of them between 2 and 100 µm [22]. Moreover, the production of droplets and aerosol from the toilet flow or the sewage treatment processes was demonstrated also for respiratory viruses [23]. The droplet/aerosol dispersion has been widely studied, so that pictures of the mouth “cloud” have been captured firstly by photos with incident light [24] and then by the sophisticated new recording graphic processing systems [25,26], and numerous experiments have been carried out to study the dynamic of airborne particles [27].
The largest droplets, up to 5 µm, fall next to the source, within a distance of 1–2 m, as a result of gravitational force. On the other hand, the smaller droplets (aerosols) can remain suspended and spread at greater distances. The suspended droplets can shrink and transform into “droplet nuclei”, even smaller, as postulated for the first time by Wells [28].
The fate of droplets depends not only on their size, but also on their speed and force of emission, on their density and composition, on the air humidity and movements. Some authors performed aerosol dispersion experiments through measurements carried out in indoor settings [29,30,31]. Other experimental studies included the presence of a thermal manikin inside the room [32,33]. Moreover, several numerical modeling studies investigated the role of environmental factors in droplet dispersion, such as the air relative humidity (RH) [34,35] or the configuration of the air distribution systems in buildings [29,30,36,37].
Overall, these modeling studies focused on aero dispersion characteristics of droplets during expiratory activities, without considering biological aspects of pathogen-laden bioaerosol, such as pathogen survival and/or concentration. In fact, droplets or suspended particles containing viruses can be inhaled by a susceptible person, which becomes infected if the virus is viable and at a sufficient concentration. This possibility decreases moving away from the infected person, not only owing to the pathogen load dilution but also due to viral survival reduction as a result of drying, solar radiation, temperature or virucidal substances in the air (i.e., ozone). Respiratory viruses can have different environmental resistance relating to their biological characteristics; moreover, the symptoms and infection localization affect the size, emission rate and composition of the droplets, and, consequently, the viral survival and spreading [38].
The potential of airborne transmission of pathogens has been studied with laboratory experiments in controlled physical and chemical conditions, but useful information has also come from environmental monitoring studies and from the epidemiological evidence. The integration of these studies in some reviews [39,40] has allowed the estimation of the plausibility of airborne transmission of some respiratory viruses: for example, it seemed to be higher for SARS-CoV than for the influenza virus [41].
As the amount of research on SARS-CoV-2 and air increases, it is more and more important to collect and summarize their findings. We carried out a systematic review to describe the state of the art of coronavirus airborne transmission.

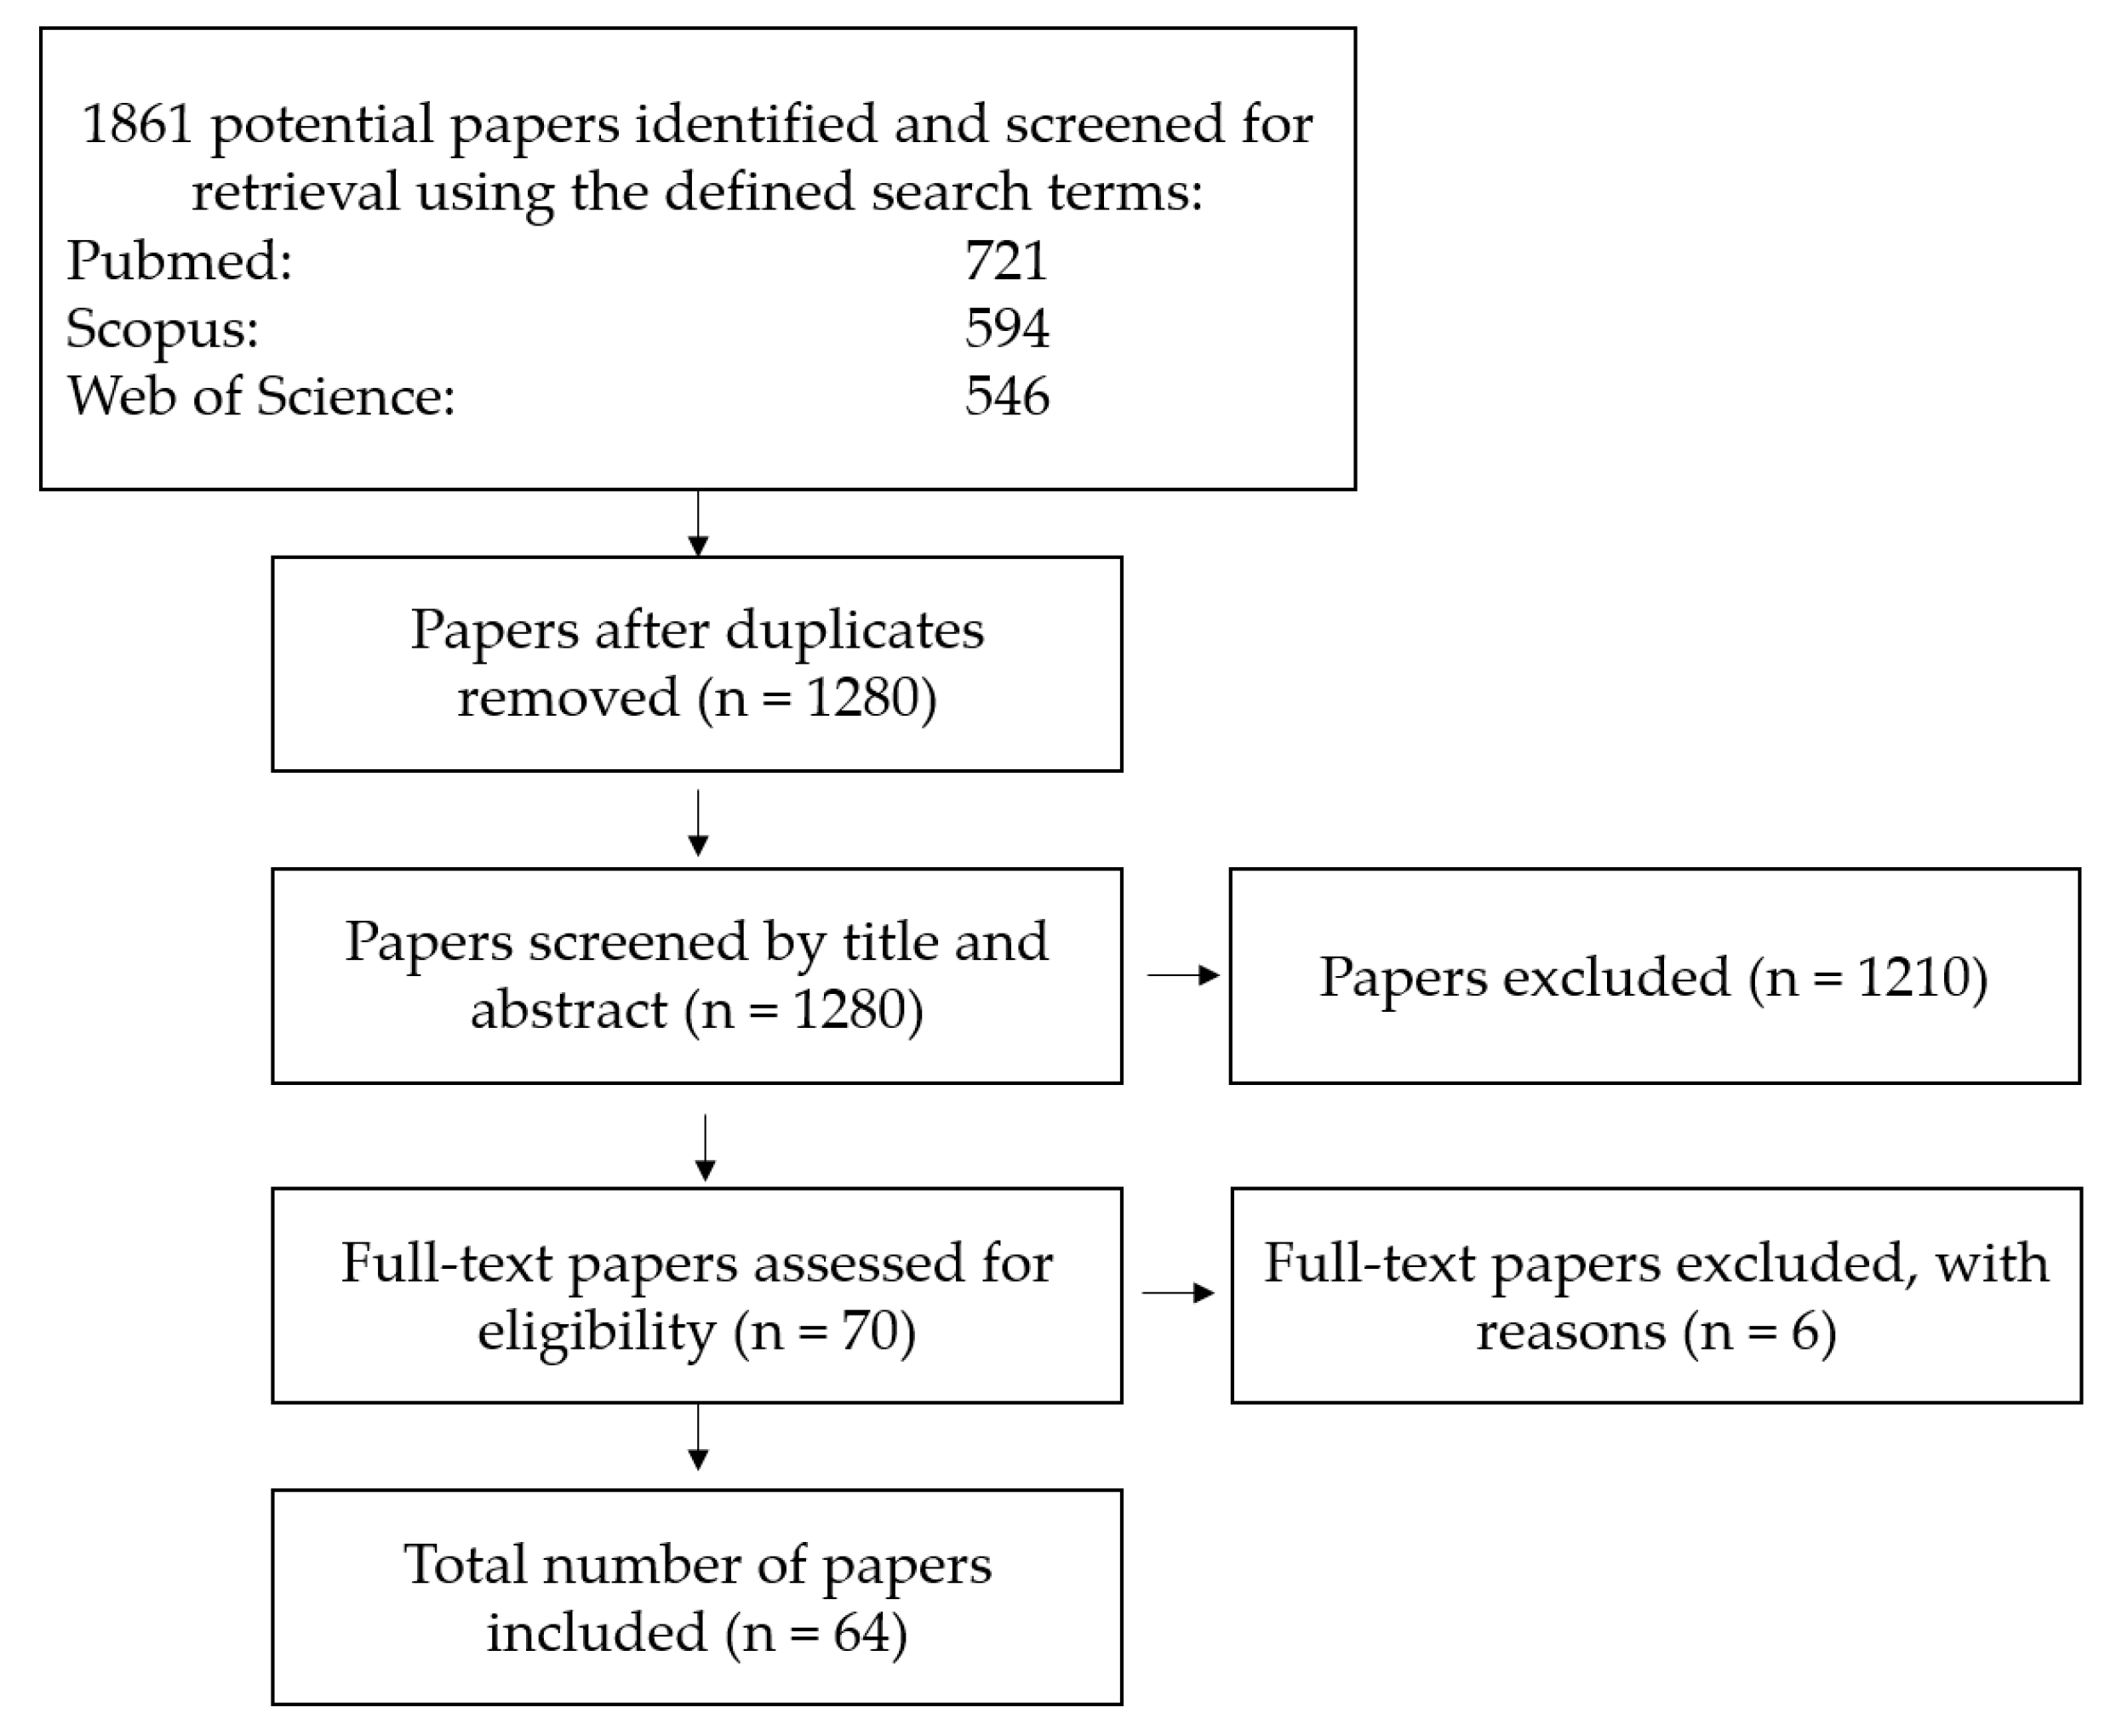
2. Materials and Methods

The systematic review has been performed following the Preferred Reporting Items for Systematic reviews and Meta-Analyses (PRISMA) guidelines [42], and the relevant research studies have been retrieved, as reported in Figure 1. The goal of the review was to thoroughly understand the plausibility, mechanisms, and evidence of the aerosol transmission of SARS-CoV-2 from the peer-reviewed literature on human coronaviruses and their viral surrogates (animal coronaviruses and phages), as previously described for water environments [43]. The literature search was conducted on 5 June, 2020 using three electronic databases (PubMed, Scopus, and Web of Science core collection) without time limitations. The searches were performed using the following search terms in the query: (aerosol OR bioaerosol OR airborne OR air transmission) AND (coronavirus OR SARS OR MERS OR COVID-19). The database searches provided 1861 hits: 721 retrieved from Pubmed, 594 from Scopus and 546 from Web of Science. These articles were assembled, and duplicates were removed. Then, papers were screened in terms of three main inclusion criteria based on title and abstract: (1) studies focused on coronavirus in air/aerosol (so, not on fomites, surfaces or various types of waters); (2) peer-reviewed research articles or surveillance reports presenting primary data, (3) written in English. Documents deemed relevant were kept for a full reading. In total, 70 original articles were selected for full reading, then seven papers were removed after inclusion because they addressed the description of an index patient, but without secondary cases that hampered the epidemiological investigation. Overall, 64 studies were complied with the selection criteria and included in this review. The list of the references excluded, with reasons, are reported in Appendix 1 of the Supporting Information.

3. Results

The collected papers have been classified according to their topic into three categories: in vitro (12 papers), monitoring (22 papers) and epidemiological and airflow models studies (30 papers) (Figure 2a, Table 1). Their time trend shows a small increase after 2003 (when the SARS epidemic occurred) and in 2014 due to the MERS appearance, followed by a higher raise in 2020 owing to COVID-19. The time trend of the studies according to the identified topic is depicted in Figure 2b.

3.1. In Vitro Studies on Coronavirus

Twelve papers performed experiments with coronaviruses at lab-scale with different aims: to evaluate performance of sampling methods [44,45,46,47,48] and to address the survival of coronavirus in experimental aerosolization scenarios [44,49,50,51,52,53,54], also considering UV susceptibility [55].
The majority of authors used human coronaviruses [44,45,49,51,52,53,54], while the other studies considered surrogates, namely two animal coronaviruses, transmissible gastroenteritis virus (TGEV) [47,48] and murine hepatitis virus (MHV) [55], and the phage phi 6 [46,50]. Only two studies used the SARS-CoV-2, which requires strict safety containment and procedures (Biosafety Level 3). The study aims and designs of the papers are reported in Table S1 of the Appendix 2.

3.1.1. Evaluation of Sampling Methods

The methods for viral bioaerosol sampling can be based on different principles, such as impact, impingement, electrostatic precipitation, filtration, cyclone, etc. [56,57]. The viral recovery rate for each method is dependent on the type of virus, the sampling protocol (i.e., duration, volume, speed of aspiration), and the sampling conditions (temperature and RH). Then, some studies focused on the method evaluation and set up.
Ijaz et al. [44] addressed various aspects of the experimental set-up for aerosol generation, storage and collection before studying the survival of various airborne viruses, including human coronavirus (HCoV)-229E. Authors evaluated the possible impact of the nebulization process on virus viability and the initial loss of virus infectivity attributable to aerosolization at 20 °C and at different RH. At 20 °C, HCoV-299E showed the best recovery (87–91%) at middle RH, while high RH was deleterious. At 6° C, the recovery rate at high RH was 100%.
Agranovski et al. [45] tested a personal bioaerosol sampler based on virus collection in a liquid medium containing a submerged filter, continuously operating for 4 h assay. For safety reasons, SARS-CoV was not aerosolized but added to the liquid and its decay rate was calculated after 2 and 4 h: it was 0.75 Log10 after 2 h and 1.76 Log10 at the end of the sampling period. The physical efficiency of the device was derived from the literature. Based on these data, authors calculated 55% theorical viral recovery rate for 1 h of operation, that reduces to 19% after 2 h.
Tseng and Li [46] evaluated the collection efficiency of four types of sampling devices, namely Andersen one-stage (1-STG) impactor, all-glass impinger (AGI) impinger (AGI-30 impinger), gelatin filter, and nuclepore polycarbonate filter. Authors tested four bacteriophages as surrogates of mammalian viruses, classified according to the presence of the envelope in hydrophilic (unenveloped) viruses (phi X174, MS2 and T7) and hydrophobic (enveloped) viruses (phi 6). The test viruses were aerosolized in sterile and deionized water at a concentration of 109–1010 PFU/mL, under three different conditions of RH. Moreover, the size distributions of the virus aerosols were evaluated using the Andersen 6-STG impactor, obtaining that more than 95% of the cultured phages were collected in particle size diameters smaller than 2.1 µm (in accordance with Ijaz et al. [44]). The recovery efficiencies for hydrophobic viruses were 10–100 times lower than for the hydrophilic ones. Overall, the Andersen impactor, impinger, and gelatin filter performed better than the nuclepore filter, owing to biological stress during filtration and dehydration. However, hydrophilic viruses showed a lower decay rate of infectivity (1–2 Log) than phage phi 6 (3–4 Log). The air RH did not affect the sampler’s collection efficiency. The reduction in infectivity caused by storage conditions (temperature and time after collection) was evaluated for AGI-30 the impinger: results demonstrated that samples should be refrigerated (4 °C) for a maximum of 1 day.
Farnsworth et al. [48] tested the collection efficiency of filters commonly used in heating, ventilation and air conditioning (hereafter HVAC filters) and their recovery rates, in the perspective of using them as a sampling system for airborne microorganisms in indoor environments. They used three aerosolized viruses: TGEV, avian pneumovirus (APV) and fowlpox virus (FPV) as surrogates of SARS-CoV, respiratory syncytial virus, and smallpox virus, respectively. The experimental apparatus was based on a ventilated duct, in which the HVAC filter was installed. A nebulizer was placed upstream the filter and two AGI-30 impinger samplers were put both upstream and downstream of the test filter for bioaerosol titration before and after HVAC filtration. No viable virus was recovered downstream of the HVAC filter, thus the authors assumed a collection efficiency of 100%. Nevertheless, the recovery efficiency from the HVAC filter was very low, 8% for TGEV, 2% for APV and 0.5% for FPV, probably owing to a rapid inactivation. Conversely, the system performed very well with bacteria, with 97% collection efficiency and 100% recovery efficiency.
Kim et al. [47] studied the recovery efficiency of HVAC filters and collection efficiency of two types of impinger samplers (AGI-30 impinger and BioSamplers), under different conditions of RH, using TGEV as a surrogate for SARS-CoV. The experimental apparatus was equipped with a HVAC filter and both impinger samplers were located upstream of the filter. Authors found that the collection efficiency of samplers reduced as the RH increased, and that BioSamplers performed better than AGI-30. Recovery efficiency from the HVAC filter was less than 10%, with the worst values obtained for high levels of RH (70%, 90%). This result confirms that airborne coronavirus remains infectious for a long time and it is sampled more effectively at low RH.
Although the reviewed studies on sampling and recovery techniques for coronavirus and surrogates are quite scarce and not comparable, the recovery efficiency appears to be low. The viruses have been analyzed using cultural methods, thus the low recovery efficiency could be attributable to the effect of sampling on structural integrity and viability. This aspect is also supported by some authors [58,59] who performed aerosolization experiments of bacteriophages (with and without envelope) and analyzed the collection fluid by both culture and real time PCR. Authors demonstrated that phage recovery by culture was strongly lower compared to the recovery by real time PCR, mainly in the case of enveloped phage (the number of infectious particles were 1000-fold less than the number of viral genome copies). Overall, the revision of these papers highlights the need for research to evaluate and improve the recovery efficiency of different aerosol sampling methods also in relation to environmental conditions, detection methods (cultural or biomolecular assays) and aims. In fact, if the aerosol monitoring would aim to evaluate the viral exposure for risk assessment, the information on recovery efficiency and virus survival would be essential.

3.1.2. Survival Experiments

Ijaz et al. [49] tested a combination of environmental factors on HCoV-229E survival, namely two temperatures representative of the two extreme indoor atmospheric conditions in temperate countries (6 and 20 °C) and three RHs representing low (30%), medium (50%) and high (80%) conditions in both indoor and outdoor environments. Aerosolization was performed in a rotating drum by a Collison nebulizer with 6 jets of a virus suspension in Triptose Phospahte Broth (TPB) of HCoV-229E with a titer of 3.0 × 10⁷ to 4.2 × 10⁷ PFU/mL. Sample collection from the drum was conducted using an AGI-30 impinger. Poliovirus type I has been used as an internal control for the experiment carried out at 20 °C. After 24 h assay at 20 °C, recovery percentages of HCoV-229E were 65%, 75% and 3% at low, medium and high RH levels, respectively. The corresponding recovery for poliovirus was 0%, 0% and 90%. The half-life for HCoV-229E at 20 °C was 3 h at low RH, 67 h at medium RH, and 27 at high RH. At 6 °C, HCoV-229E survival increased, with a virus half-life of 34, 103, 86 h at low, medium, and high RH, respectively.
Walker and Ko [55] characterized the survival of viruses under UV exposure (254 nm UV-C), considering phage MS2, adenovirus type 2 (HAdV2) and MHV. MS2 and HAdV2 were the most resistant, with approximately 30% survival after the 15 min exposure to 2608 µW s/cm2. On the contrary, only 10% of MHV survived after the exposure to a UV dose of 599 µW s/cm2. These results highlighted that UV air disinfection may be an effective strategy in indoor environments against coronaviruses.
Van Doremalen et al. [52] studied the survival of MERS-CoV and H1N1 viruses under low and high humidity levels (40%, 70%). Authors performed sampling with a liquid impinger and analyzed collection liquid using a molecular technique. Then, they expressed the results in TCID50 equivalents, generated using a standard curve of diluted MERS-CoV RNA in the qRT-PCR. At low humidity, MERS-CoV is highly stable with 93% survival, that decreased to 11% at a high humidity level. Instead, H1N1 survival was 5% and 38% at low and high humidity, respectively.
Pyankov et al. [51] investigated MERS-CoV survival in two different experimental conditions: middle temperature and high humidity (25 °C, 79%) typical of an office environment, and high temperature and low humidity (38 °C, 24%) to reproduce the climatic condition of the Middle Eastern region. After 60 min aerosol, 63.5% MERS-CoV remained infectious in the office scenario, whereas 4.7% survival was obtained in the hot air environment with the greater abatement occurring after the first 15 min. Prussin et al. [50] performed a survival experiment on phage phi 6 using stationary droplets as a model of suspended aerosol: 10 droplets of 1-µL of a viral solution in tryptic soy broth were spotted onto a cell culture dish and then exposed to a wide range of RH (from 23% to 98%), temperature (from 14 to 37 °C) and absolute humidity (AH) (from 2.7 g/m3 to 41.6 g/m3). The relations between survival RH showed a typical U-shaped curve: phi 6 survived better at high (>85%) and low (<60%) RHs, with a significant decrease in infectivity at middle range RH (60% to 85%), especially at 25 and 37 °C. Moreover, at a fixed RH of 75%, phi 6 was very sensitive to temperature variations, decreasing 6 Log10 when exposed to 34 °C. An AH greater than 22 g/m3 (achievable at 37 °C) was associated with a loss in infectivity greater than 6 Log10. The phi 6 survival modeling based on environmental variables showed that RH was the most important parameter.
Experimental evidence on the airborne survival of SARS-CoV-2 was recently obtained by van Doremalen et al. [53] and Smither et al. [54] on different virus variants. van Doremalen et al. [53] performed a bench-scale study in which both SARS-CoV-1 and SARS-CoV-2 were aerosolized, then the infectious viruses were quantified (TCID50/mL). The authors demonstrated a 0.8 Log10 reduction in SARS-CoV-2 after 3 h and a half-life of approximately 1 h. Similar results were obtained for SARS-CoV-1. Smither et al. [54] focused their research on SARS-CoV-2 aerosolized in artificial saliva or tissue culture media (TCM) under two different conditions of RH, medium (40–60%) and high (68–88%), at room temperature. Apart from the type of aerosolization fluid, authors found that infectious viruses could still be detected at 90 min. However, the type of spray fluid influenced the stability at different RHs, namely SARS-CoV-2 aerosolized in TCM is more stable at medium RH compared to higher RH, in agreement with other studies on human coronaviruses [49,52]. Conversely, when SARS-CoV-2 is aerosolized in artificial saliva, it survived better at high RH. These experimental studies show that the coronaviruses’ survival in air is strictly influenced by environmental conditions. Coronaviruses aerosolized in water or maintenance medium have a better survival at low–medium humidity, and a cold temperature. However, these findings can be influenced by the type of aerosolization fluid, as reported in a very recent paper [54]. Further studies are needed to understand the role of saliva composition in coronavirus stability in air.

3.2. Environmental Monitoring (Air Samples)

The presence of infectious viruses in human fluids that could be aerosolized cannot be considered alone as evidence for aerosol transmission, but it is necessary that infectious pathogens would be detected in air samples. Among the reviewed studies on environmental monitoring, four papers monitored animal coronaviruses owing to their importance in farm animal infections, six papers addressed common human coronaviruses, while SARS-CoV, MERS-CoV and SARS-CoV-2 were monitored in three, two, and seven papers, respectively. Overall, the monitoring studies were carried out using different sampling devices at different flowrates and sampling times. These studies (methodology and main results) are summarized in Table S2 of the Appendix 2.

3.2.1. Animal Coronaviruses

Hermann et al. [60] artificially infected 46 pigs, each of them with one respiratory microorganism, among whom the porcine respiratory coronavirus (PRCoV). Then, authors characterized the respiratory excretion by collection of oral and nasal swabs, expired air by the pigs, and air samples from the room. The pigs’ swab samples revealed the presence of all the targeted pathogens, while none of the air samples (both air exhalated and ambient room air) were positive, probably due to the low analytical sensitivity of the sampling and detection procedures.
Alonso et al. [61,62,63] carried out a series of studies aimed at deeply investigating the aerosolization of animal viruses, including the alphacoronavirus porcine epidemic diarrhea virus (PEDV). In 2014 [61], the authors used a liquid cyclonic collector for air sampling under two different conditions: after artificial infection of pigs and in field conditions (without artificial infection). Under experimental condition, all samples were positive for PEDV using both RT-PCR and the bioassay, consisting of inoculating susceptible pigs with the air samples to assess their infectivity. Instead, under field conditions, 11/62 (18%) air samples were positive for the presence of the viral genome but not for the bioassay. Again in 2015 [62], the authors performed an artificial infection of pigs, but with various viruses: influenza A virus (IAV), porcine reproductive and respiratory syndrome virus (PRRSV), and PEDV. Authors sampled air as previously described [61], and in addition, they studied the size distribution of inhalable virus-laden particles, using the Andersen cascade impactor. IAV and PRRSV were analyzed using real time (RT)-PCR and cell culture, and PEDV using bioassay. PEDV was detected in all particle sizes and in higher quantities than IAV and PRRSV, ranging from 1.3 × 10⁶ to 3.5 × 10⁸ RNA copies/m3. All positive samples were infectious. In 2017 [63], the same viruses (PRRSV and PEDV) were used to evaluate the efficiency of two size-differentiating air samplers, the Andersen and the Tisch cascade impactors. The air monitoring was performed during active outbreaks in 9 swine and poultry farms, for a total of 68 air samples both inside (44) and outside (24) farms. PEDV was detected with the highest virus concentrations, followed by IAV and PRRSV. Both air collectors performed equally for the detection of total virus concentration and for all three viruses. Overall, higher numbers of RNA copies were associated with larger particles.

3.2.2. Common Human Coronavirus (HCoV)

In the majority of the studies, the search of HCoV is associated with the monitoring of other respiratory viruses, to better understand the role of air in viral transmission.
Borkenhagen et al. [64] focused on the animal–human interface in various working settings (farms, abattoirs and animal markets). The authors monitored various samples, including air samples, which were collected using the National Institute for Occupational Safety and Health (NIOSH) air sampler, which separated the particles into three size fractions (>4, 1–4, and <1 μm). HCoV was detected in 2.6% of worker nasal wash, while no positivity was obtained in the animal and air samples. These data underlined the necessity to improve the sampling method.
Coleman et al. [65] performed air sampling in Singapore’s Mass Rapid Transit (MRT) heavy rail lines, using a NIOSH air sampler described above [64]. The samples were analyzed for the presence of a wide range of viruses: influenza viruses (A and B), enteroviruses, coronaviruses, respiratory syncytial virus (RSV) subtypes A and B and adenovirus. A total of 89 aerosol samples were collected and viruses were detected by real time (RT)-PCR, cell culture, and sequencing. Fourteen air samples (16%) resulted positive for one or more viruses, but all were negative for coronavirus.
Memish et al. [66] performed a monitoring campaign for air and surface in an airport in Saudi Arabia. The authors used a liquid biosampler and analyzed the samples for various respiratory pathogens, including HCoV 229E/NL63 and OC43/HKU1. A total of 40 surfaces and 18 air samples were analyzed by a respiratory multiplex array. Only 1 air sample (1/18, 5.5%) was positive for influenza B virus, and 7 surface samples (7/40, 17.5%) were positive, of which 3 were for adenovirus and 3 were for HCoV-OC43/HKU1.
Xie et al. [67] evaluated the potential airborne transmission of influenza A and B viruses, human rhinoviruses (HRV), RSV, and HCoV-229E and OC43 in a University Campus in Hong Kong. Samples were collected from canteens, lecture halls, shuttle buses and the University Health Service. A total of 1028 air samples were collected using a NIOSH bioaerosol sampler, analyzed with real time (RT)-PCR and cell culture for positive samples. Viral RNA of influenza viruses, HRV and RSV was detected, while no positivity for coronavirus was found.
Nguyen et al. [68] carried out environmental monitoring in some healthcare settings in Singapore, for the research of influenza viruses (A and B), coronavirus and adenovirus, comparing two aerosol samplers, a liquid air sampler and a portable air sampler equipped with a polytetrafluoroethylene (PTFE) filter cassette. The collected air samples were analyzed by real time (RT)-PCR and only positive samples were further analyzed using cell culture. In 16 (33.3%) of the samples, at least one respiratory pathogen was found, but no samples were positive for coronavirus. The portable sampler identified higher rates of target viruses with 1/24 (4%) IVA-positive, 3/24 (12.5%) influenza B-positive and 8/24 (33.33%) adenovirus-positive specimens, while the other sampler revealed only 4/24 adenovirus positive samples.
Yadana et al. [69] monitored the prevalence of influenza viruses (A, B, and D), coronavirus and enterovirus in aerosol of a general paediatric ward in Singapore. Twenty-eight aerosol samples were collected with a NIOSH air sampler and a SKC filter cassette preloaded with a PTFE filter (0.3 μm pore size). Samples were tested with real time (RT)-PCR, then positive samples for adenovirus and IVA were further analyzed by cell culture. The monitoring revealed 8 (28.5%) samples positive for adenovirus and one (3.5%) for IVA and none for influenza B or D viruses, enterovirus or coronavirus. All adenovirus-positive samples were retrieved from the NIOSH samplers, namely 3 (37.5%) of >4 μm particle diameter and 5 (62.5%) of ≤4 μm particle diameter. The IVA positive samples were found from a mobile SKC filter cassette; therefore, the particle size was ≥0.3 μm.

3.2.3. SARS-CoV

Booth et al. [70] investigated environmental contamination (air and surfaces) in SARS units during the Toronto outbreak. Thirty-eight air samples were collected from 19 rooms of infected patients in 4 health-care facilities. Air samples were divided into wet and dry: wet air sampling was performed using a high-resolution impinger sampler system, while dry air samples were collected on a PTFE membrane filter with a pore size of 0.3 μm. Viruses were detected by RT-PCR and real time RT-PCR, and positive samples were seeded on Vero-E6 cell culture to verify the infectivity. Only 2 samples from the wet air sampling were positive for genome presence, not for infectivity.
In a hospital of Taiwan, Tsai at al. [71] evaluated airborne SARS-CoV RNA concentrations in a negative-pressure isolation room with SARS infected patients mechanical ventilated. A total of 11 environmental samples were obtained in the different patient’s assistance conditions. An air sampler and a filter cassette with a 1 µm PTFE filter were used for environmental samples. Moreover, HEPA filters (0.023 and 0.3 µm pore size) connected to the breathing circuit were tested to measure their removal efficiency for airborne SARS-CoV under experimental conditions. All samples were negative for SARS-CoV RNA and the maximum filtration efficiency of the HEPA filters was detected for a pore size of 0.023 µm, that was able to remove 100% of aerosolized SARS-CoV.
Again, in Taiwan, a similar study was performed by Wan et al. [72], who evaluated airborne SARS-CoV RNA concentrations using filter sampling and RT-PCR assay when a SARS patient was treated with a humidifier or a large-volume nebulizer in a negative pressure isolation room. Additionally, in this case, none of the 6 air samples (3 for each procedure) resulted positive. As in the study by Tsai et al. [71], the authors compared the air filtration efficiency by experimental tests on three different filters (1 and 0.2 µm PTFE filters and a 0.2 µm polycarbonate filter): all negative airborne SARS-CoV PCR results were obtained from 1 µm PTFE filters.

3.2.4. MERS-CoV

Azhar et al. [73] investigated the role of air in MERS-CoV transmission. Three air samples were collected from a camels’ barn on three consecutive days, using an MD8 airscan sampling device with sterile gelatin filters (3 µm pore size). The samples were analyzed by real time RT-PCR followed by sequencing and only one resulted positive: it was collected the same day when a camel was positive for MERS-CoV. Moreover, the sequencing of the genome obtained from the air sample produced the same sequence coming from the infected animal and the ill worker. This result suggested the air as vehicle of transmission from the dromedary camel.
Kim et al. [74] studied air and surface contamination in MERS-CoV-infected patient rooms during the 2015 MERS outbreak in South Korea. Environmental samples were collected from two infected patients in one hospital and one patient in another hospital, both in negative-pressure rooms. A total of 7 air samples were collected using the same sampling method described by Azhar et al. [73]. RT-PCR was used to detect the virus, and positive samples were analyzed onto Vero E6 cells, by electron microscope and immunofluorescence assay. All air samples were positive to RT-PCR, with 4 infectious samples collected from the patients’ rooms (2) and restroom (1) and from the common corridor (1). The data demonstrated the presence of MERS-CoV in the hospital air, although they did not provide direct insight into the routes of transmission.

3.2.5. SARS-CoV-2

Some environmental evidence is raising on the presence of airborne SARS-CoV-2 in hospital settings in Wuhan, China [75,76]. These studies performed air monitoring in wards assigned to receive COVID-19 patients. In China, Guo et al. [75] monitored the air and surface of objects in both an intensive care unit (ICU) and a general COVID-19 ward housing 15 and 24 patients, respectively. Air samples were collected using a SASS air sampler and analyzed with RT-PCR. Three types of sampling points were considered: near the air outlets, inside the patient’s room, and in the doctors’ office area. SARS-CoV-2 genome was detected in all the sampling sites, with the highest frequency near the patients (8/18, 44.4%) and at the air outlets (5/14, 35.7%). These results demonstrated that SARS-CoV-2 can spread in air approximately 4 m from patients. Again, in China, Liu et al. [76] confirmed the possibility of SARS-CoV-2 dispersion in air by measuring a positive air sample in two Wuhan hospitals, using a droplet digital PCR-based detection method. All air samples were collected on presterilized gelatin filters, but using different sampling methods: aspiration using a Casella portable pump for the collection of the total suspended particles (without size range), a miniature SKC cascade impactor for the collection of particles according to their size (separated into five size fractions) and a filter packed in a holder for particle deposition. Authors found very low viral concentration, with the highest level (19 RNA copies/m3) detected in the toilet area. This result could suggest the releasing of airborne SARS-CoV-2 not only through breathing, but also by the aerosolization of patients’ faeces or urine. Positive samples were detected also in the medical staff area, with concentrations ranging from 16 to 42 GC/m3. Whereas in the public area outside the hospitals, concentrations were undetectable in most sampling sites, except for two crowding-prone locations. Finally, authors analyzed the size of aerosol in which the genome had been detected, namely the submicron region (0.25–1 µm) and the supermicron region (>2.5 µm).
Cheng et al. [77] published a report on Hong Kong infection control measures in the first 6 weeks after the official announcement of a cluster of pneumonia of unknown aetiology, in Wuhan. Air and surfaces samples for SARS-CoV-2 RNA were collected with an SAS air sampler in the room of the first confirmed case in Hong Kong. The study revealed the absence of SARS-CoV-2 RNA in air samples collected at a distance of 10 cm from the patient’s chin while he was performing various expiratory activities (normal breathing, deep breathing, speaking and coughing continuously), with or without wearing a surgical mask.
Similar results were obtained by Faridi et al. [78], who investigated the air samples of patient rooms with severe and critical symptoms of COVID-19 in ICU. The air sampler was installed approximately 2 to 5 m away from the patients’ beds. A total of 10 air samples were collected with a liquid impinger in rooms with different characteristics in terms of number of patients and medical staff, RH, temperature, number of windows and ventilation systems. All samples were negative for SARS-CoV-2 by real time (RT)-PCR.
In Singapore, Ong et al. [79] tried to explain the route of SARS-CoV-2 transmission in a nosocomial environment. The authors collected both air and surface samples from infection isolation rooms housing 3 patients. Two different air samplers were used for the room-anteroom and for outside the room: an SKC air sampler preloaded with a PTFE filter cassette and a Sartorius MD8 microbiological sampler with a gelatin membrane filter. A specific real time RT-PCR was used to detect SARS-CoV-2 RNA. Although all the air samples were negative, the presence of positive surface samples taken from air exhaust outlets suggested that small viral droplets could be spread by airflows and deposited onto equipment.
Again in Singapore, Chia et al. [80] performed a similar environmental monitoring in three infection isolation rooms with positive patients in the ICU and in the general ward. A total of 245 surfaces were collected but only 3 air samples, using a NIOSH bioaerosol sampler. Then, the SARS-CoV-2 genome was quantified. Two (66.7%) of three air isolation rooms were positive in the particle sizes > 4 and 1–4 μm. RNA concentrations ranged from 1.84 × 10³ to 3.38 × 10³ copies/m3. Surfaces of these rooms were contaminated, namely the floor (65%), the air exhaust vent (60%), the bed rail (59%), and the bedside locker (47%). SARS-CoV-2 contamination of the toilet seat and automatic toilet flush button was also detected in 5/27 sampling sites. These data suggested that SARS-CoV-2 could be shed in the air from a patient in particles sized between 1 and 4 μm. These small particles exhibit a prolonged suspension time; thus, it could justify the contamination of the surrounding surfaces.
On the other hand, the detection of SARS-CoV-2 RNA in open air samples has been reported [81], and it has been supposed that atmospheric air particulate would be a potential carrier of SARS-CoV-2. This has induced a strong public debate and has generated a confusing information dichotomy: on the one hand, the advised safety distance of 1 m, and on the other, the possibility of an open-air transmission. Besides its scarce plausibility, this opinion is contradicted by another paper (yet preprint) [82] which examined 318 clusters of 3 or more cases demonstrating that all of them occurred in an indoor environment, which confirms that sharing indoor spaces is a major SARS-CoV-2 infection risk.

3.3. Epidemiological and Airflow Model Studies

The hypothesis that SARS-CoV-2 could be spread through aerosol is very difficult to demonstrate because epidemic clusters are generated by a mix of different ways of transmission where droplets and contacts are predominant. Additionally, considering SARS and MERS, the majority of epidemiological evidence that they could be airborne are anecdotal. In some cases, the outbreaks’ evolution has been deeply studied with the help of models to highlight the probability of this transmission.
On the whole, our literature search found 30 papers describing 13 events: 5 of them occurred in health care settings and 8 in community settings. Three outbreaks were reported in more than one paper and analyzed from different points of view. Table S3 of the Appendix 2 summarizes the findings of these studies.

3.3.1. SARS and MERS

A very popular and studied SARS outbreak, suggesting the airborne transmission and also the generation of faecal aerosol was the large epidemic that occurred in the apartment complex of Amoy Garden (Hong Kong) [83]. Yu et al. [84] performed an epidemiological investigation to identify the spatial distribution of the SARS cases in four buildings of the housing complex. Then, authors used computational fluid dynamics (CFD) and multizone modeling to carefully study the airflow dynamic. Finally, the source of infection was attributed to the plume of contaminated warm air generated from a toilet in a middle-level apartment unit in one block and then diffused by an air shaft through empty traps in the drainage system. A further study of the same outbreak was performed by Li et al. [85] with a multi-zone airflow modeling method and showed the association between the predicted bio-aerosol concentration and the spatial infection pattern, suggesting an airborne transmission route. Moreover, a survey of nasopharyngeal viral loads of SARS patients from Amoy Garden on admission to hospital showed a higher viral load in patients living in adjacent units to the index patient, thus suggesting an important role of airborne transmission [86]. Further analysis of this outbreak was performed by Yip et al. [87] that considered the meteorological conditions (namely temperature, wind speed, wind direction and height of temperature inversion) six days before the outbreak, evidencing a marked decrease in the temperature that could have facilitated the viral survival and spread.
The possibility that the air exhaust from the upper part of a window that re-enters the lower part of the open-window at the immediate upper floor, has been shown by Niu and Tung [88] using tracer gases of CO2 and SF6 in a building similar to the Amoy Garden Apartments. These data were furtherly analyzed and modeled using the CFD technique [89] to show that wind influences the upward transport, depending on the wind speed.
The same authors [90] used the Eulerian–Lagrangian approach to model the vertical dispersion of expiratory aerosol particles between two flats, demonstrating that 1 µm particles dispersed like gas, while the ones of 20 µm were more settled and remained close to the source. Finally, in 2014 the Amoy Garden outbreak was re-examined including the nearby residential complexes [91]. The results indicated the aerosol as the most probable way of transmission and that it could have spread up to 200 m from the source.
Another case of the SARS epidemic was described by Olsen et al. [92] concerning three aircrafts leaving Honk Kong to Beijin (3 h) and Taipei (90 min): only in the first one a wide spread of SARS was detected, with a global incidence of 18.3% among passengers. Although most of the cases were seated in the three rows in front or behind the index case, 7 (32% of the infected people) were seated farer and at a distance of up to seven rows. The authors concluded that aerosol could have played an important role in the virus diffusion. This event was also analyzed with an Eulerian–Lagrangian model to estimate the effects of human movements of the airborne transmission [93]: the simulation results showed that people walking in the cabin increased the air mixing and the aerosol diffusion, therefore producing an increase in their infection risk in the cabin. The same outbreak was also analyzed by Lei at al. [94] by a mathematical model aimed at simulating a multi-route disease transmission for SARS, norovirus and H1N1 influenza. For SARS, the airborne component was higher than for the other two diseases accounting for 21% (95% CI: 19–23%) of cases. Another study [95] used data from this outbreak and a simulation of three different ventilation systems in aircrafts to evaluate their effectiveness in controlling contamination and its diffusion.
A further outbreak in Hong Kong was partially related to airborne transmission: it occurred in the Hotel Metropole where the index case stayed for one night and infected 17 people. It was considered a super spreading event that also generated the SARS diffusion in other countries (Canada, Hong Kong, Singapore and Viet Nam) with further super spreading events [96]. The epidemiological investigation was accompanied by an environmental monitoring and both led to considering the corridor in front of the room of the index case as the origin of the spread: possible vomit or intense coughing could have occurred there leaving an environmental contamination of suspended or re-suspended infected particles [97].
During the SARS epidemic, other suggestions for aerosol transmission came from hospital clusters. Varia et al. [98] described a large nosocomial outbreak in Toronto (Canada), with 128 cases, among family members and hospital staff, who had close contact with the SARS case. Authors ranked the risks associated with different exposures to the SARS case according to the distance from the index patient and the wearing of contact or droplets precautions. Among the scenarios without personal protective equipment (PPE), the lowest risk was associated with the exposure within 3–10 m from the case. Nevertheless, one patient contracted SARS in the emergency ward at a distance of 5 m from the bed of the index case, but he was also assisted by the same nurse. Therefore, although transmission through small aerosol should not be ruled out, it was not proven. The airborne transmission was also supposed in a cluster of three cases in nurses participating in a cardiopulmonary resuscitation in a Toronto Hospital, despite the use of contact and droplet precautions [99].
Li et al. [100] analyzed the largest nosocomial outbreak in Hong Kong and performed a ventilation study to investigate the role of bioaerosol dispersion in a spatial infectious pattern in the hospital ward with a total of 138 infected cases. In particular, authors studied in detail the airflow pattern in the ward, considering the design of the air distribution system, the air temperature and retrospective on-site measurement of ventilation. Then, the aerosol dispersion was modeled with the CFD technique using CO2 as a marker. During the experimental study of airflow, authors found an imbalance between supply and exhaust airflows, with an inoperative exhaust outlet only in the index patient’s cubicle. The aerosol dispersion patterns obtained from the simulation were compared with the spatial distribution of the infected people retrieved from epidemiological retrospective studies regarding medical students attending clinical training [101]. The illness risk evaluated in relation to the proximity to the patient’s bed resulted in 100% within 1 m, 50% in the same cubicle but in beds >1 m and 0% in other cubicles (0/8, 0%). Moreover, the authors modeled the aerosol dispersion using the CFD approach, including the ventilation rate of the ward of approximately 8 air changes per hour. Authors did not exclude the spreading by small aerosol because the retrospective ventilation study highlighted the imbalance between supply and exhaust airflows that could have promoted the spreading of SARS-CoV by aerosol.
The same outbreak was also analyzed by Yu et al. [102] with the same methods taking inpatients into consideration. The attack rate was 65% for patients in the same bay as the index case, and 52% and 18% for patients in the adjacent and distant bays, respectively. CFD modeling indicated that the normalized concentration of virus-laden aerosols was the highest in the same bay and the lowest in the distant bays. Again Chen et al. [103] studied the outbreak in a Hong Kong hospital using a multi-zone airflow model, but focusing the attention on the role of a two-way airflow effect determined by the temperature difference between the cubicles and corridor. The model was validated in lab scale experiments and demonstrated that this phenomenon played a significant role in SARS transmission during the nosocomial outbreak. Furthermore, another analysis was performed on this outbreak [104] using a multi-agent mathematical model to simulate the infection risk distributions of close contact, airborne and fomite transmission in different scenarios and compare them with that of the reported cases in order to select the hypotheses with the best fit. The results showed that the most probable ways of spreading raised from combining long-range airborne and fomite routes. Using the same method of the multi agent modeling framework, the same research group [105] examined also a nosocomial outbreak of MERS that occurred in the Republic of Korea in 2015. Their findings were also confirmed by Jo et al. [106] who also considered the wind speed and direction. All these studies were coherent with the aerosol spreading of SARS and MERS, although none of them provided epidemiological nor laboratory evidence as requested to prove the airborne transmission without any doubt.

3.3.2. COVID-19

The airborne transmission of SARS-CoV-2 can be suggested by numerous reports: a simple case report of a person in inner Mongolia and 4 laboratory technicians in Wuhan [107], a cluster of 97 cases in a call center in South Korea [108], other clusters related to a shopping mall in Wenzhou (China) [109], to a choir practice in Skagit County (Washington) [110], to a business meeting in Munich [111] and to an air-conditioned restaurant in Guangzhou (China) [112]. In all these cases the airborne spreading has been supposed to explain some of the reported cases, while close contact and droplets were still considered the most probable ways of transmission. These events, not studied with aerosol simulations and environmental monitoring, when carried out, gave negative results. In a nosocomial study performed in California (USA) [113], contact tracing was carried out for healthcare workers (HCWs) exposed to a patient with unrecognized COVID-19. Three HCWs with laboratory-confirmed COVID-19 had unprotected patient contact and performed (or assisted) with aerosol-generating procedures (i.e., nebulizer treatment). These results support a transmission based on close contact and highlight the importance of general precautions and PPE. The role of PPE in avoiding SARS-CoV-2 transmission is suggested also by another nosocomial study carried out in Hong Kong [114]. The index case was a woman staying in a normal ward with only standard precautions before the COVID-19 diagnosis. None of the HCWs or inpatients that came into contact with her were infected, thus demonstrating the preventive efficacy of general precautions as disinfection and the use of N95 and surgical masks.

4. Discussion

A complete understanding of the transmission pathways of COVID-19 can allow a better prevention strategy, taking into consideration also minor ways of spreading that, nevertheless, can be responsible for a non-negligible fraction of cases. These include the airborne route, that implies the diffusion of the virus far beyond the 1 m indicated by the WHO as a safety distance, especially for non-healthcare settings.
This review considered the main fields where the airborne transmission was investigated, namely laboratory experiments, environmental monitoring and epidemiological studies.
From the first studies, the need emerged for a better validation of methods for aerosol monitoring and study because the recovery efficiency of the available techniques appeared low and variable according to environmental conditions. Without a reliable method, survival and monitoring studies cannot be used to evaluate the presence and amount of virus in the air and its infectivity. Unfortunately, the method efficiency is rarely declared in these studies, therefore the lack of detected virus cannot be the proof of its real absence. Despite the (presumed) low recovery, some monitoring papers have demonstrated the presence of viral RNA in air samples. Nevertheless, these data come from small surveys, with a limited number of samples and sampling sites and without any detection of virus infectivity. On the other hand, the experiments on virus survival at lab-scale would indicate the persistence of viable particles from hours to days, depending on temperature and RH conditions. From an epidemiological point of view, for the most studied SARS outbreaks (i.e., the Amoy Garden, Hotel Metropole, flight CA112, and Ward 8A events), the role of the aerosol is recognized, although its attributable risk was not estimated [97].
All the three categories of studies reviewed in this paper suggest the airborne transmission of SARS-CoV-2, but none has yet reached complete evidence. The sampling and detection methods and protocols have not been evaluated and validated, therefore monitoring results are affected by a possible underestimation. Moreover, epidemiological investigations only hypothesize the airborne transmission as a possible explanation for some cases without contacts or proximity with other cases. Nevertheless, our review takes into account only published papers, without considering preprints (not yet peer reviewed), that have been produced in huge amounts for SARS-COV-2 and COVID-19. Among them, some could give more evidence of airborne transmission, if they are eventually published. For example, Shen et al. [115] made a comparison between two buses that travelled to the same religious meeting on the same day. An infected person was seated in only one of them, and among the 67 passengers of this bus, 23 cases were revealed (even at a distance greater than 1 m), while no cases occurred in the other bus.
While the pandemic is still ongoing and the number of studies on it increases, it is urgent to clarify the dynamics and conditions of SARS-CoV-2 transmission through air, both by droplets and by aerosol, and its relevance for preventive measures, such as social distancing, the use of masks and air treatments, but also treatment of fomites or surfaces contaminated by sedimentation of infectious droplets. At present, some case reports on SARS-CoV-2 have suggested the role of general precautions in reducing the disease spreading, as reported by two nosocomial studies described above [113,114].

5. Conclusions

This review was aimed at highlighting findings in SARS-CoV-2 airborne transmission taking into consideration previous studies on other coronaviruses, including papers on bioaerosol science. Although many of the revised studies partially validated the hypothesis of airborne transmission, none of them alone were sufficient to provide conclusive evidence, probably because airborne transmission is generally a minority component, combined with droplet and contact transmission.
However, our review, as a whole, supports this kind of transmission and induces a reflection on the ways of making preventative decisions. The evidence-based medicine [116] requires that medical interventions would be based on solid scientific bases derived from a consistent amount of agreed studies. Nevertheless, the prevention, although preferably evidence-based, should also be inspired by the precautionary principle: this means that if the efficacy of a preventive measure is even partially demonstrated, it should be applied without waiting for further confirmation.
The example of face mask use and safe distancing recommendations is paradigmatic: the ones given at the beginning of the pandemic have been progressively changed until the compulsory use of masks everywhere and the increasing of safety distance from 1 to 2 or more meters. These new recommendations are based on the above cited reports on COVID-19 suggesting airborne transmission, but could have been proposed even before, considering the previous knowledge, and their logical preventive value, as already discussed by other authors [117,118]. We cannot know how many cases would have been avoided with timelier advice, but we can say that the initial position of many institutions was quite superficial and unaware of possible consequences.
As the data increase, due to the huge amount of studies, the airborne risk of COVID-19 should be taken into consideration more, and its quantitative evaluation using quantitative microbial risk assessment (QMRA) models could allow wise decisions and the application of preventive actions [119,120], especially in community settings where the probability of infection is lower but widely diffused and the identification of risk situations is more complex than in healthcare settings.
To this aim, we should face the following research needs:
  • Viral load of infected clinical materials (upper and lower air ways, saliva, feces, urines, etc.) in symptomatic and asymptomatic persons and determination of the infectivity in those samples;
  • Probability of aerosolization, droplet sizes and speed for different acts (sneezing, coughing, talking, breathing, singing, etc.), procedures (intubation, resuscitation, etc.) and plants (toilets, wastewater treatments, etc.);
  • Virus survival in air according to different temperature and humidity conditions;
  • Viral aerosol dynamics in the air according to the airflows and the viral survival;
  • Minimal Infectious Dose and dose-response relations;
  • Ways and amount of exposure for susceptible people in different settings (community, healthcare and non-healthcare working environments), including the fecal–oral route;
  • Estimated reduction in exposure of different preventive measures (use of different types of masks, ventilation systems, etc.).

Supplementary Materials

The following are available online at https://www.mdpi.com/2073-4433/11/7/710/s1, Appendix 1: list of papers removed with reasons, Appendix 2: description of the papers included in the literature revision, divided on the basis of the aim of the study (Table S1: In vitro studies on the air contamination by coronaviruses (listed in chronological order); Table S2: environmental air monitoring studies classified according to the type of coronavirus, Table S3: epidemiological studies taking into consideration aerosol transmission, classified according to the type of coronavirus).

Funding

This research received no external funding.

Conflicts of Interest

The authors declare no conflict of interest.

References

  1. World Health Organization. 2020. WHO Director-General’s Opening Remarks at the Media Briefing on COVID-19-11 March 2020. Available online: https://www.who.int/dg/speeches/detail/who-director-general-s-opening-remarks-at-the-media-briefing-on-covid-19---11-march-2020 (accessed on 7 June 2020).
  2. World Health Organization. 2020. WHO Coronavirus Disease (COVID-19) Dashboard. Available online: https://covid19.who.int/ (accessed on 7 June 2020).
  3. Han, H.; Luo, Q.; Mo, F.; Long, L.; Zheng, W. SARS-CoV-2 RNA more readily detected in induced sputum than in throat swabs of convalescent COVID-19 patients. Lancet Infect. Dis. 2020, 20, 655–656. [Google Scholar] [CrossRef] [Green Version]
  4. Zou, L.; Ruan, F.; Huang, M.; Liang, L.; Huang, H.; Hong, Z.; Yu, J.; Kang, M.; Song, Y.; Xia, J.; et al. SARS-CoV-2 Viral Load in Upper Respiratory Specimens of Infected Patients. N. Engl. J. Med. 2020, 382, 1177–1179. [Google Scholar] [CrossRef] [PubMed]
  5. Holshue, M.L.; DeBolt, C.; Lindquist, S.; Lofy, K.H.; Wiesman, J.; Bruce, H.; Spitters, C.; Ericson, K.; Wilkerson, S.; Tural, A.; et al. Washington state 2019-nCoV case investigation team. First case of 2019 novel coronavirus in the United States. N. Engl. J. Med. 2020, 382, 929–936. [Google Scholar] [CrossRef] [PubMed]
  6. Chen, L.; Lou, J.; Bai, Y.; Wang, M. COVID-19 Disease with positive fecal and negative pharyngeal and sputum viral tests. Am. J. Gastroenterol. 2020, 115, 790. [Google Scholar] [CrossRef] [PubMed]
  7. Wang, J.; Feng, H.; Zhang, S.; Ni, Z.; Ni, L.; Chen, Y.; Zhuo, L.; Zhong, Z.; Qu, T. SARS-CoV-2 RNA detection of hospital isolation wards hygiene monitoring during the Coronavirus Disease 2019 outbreak in a Chinese hospital. Int. J. Infect. Dis. 2020, 94, 103–106. [Google Scholar] [CrossRef]
  8. Xiao, F.; Tang, M.; Zheng, X.; Liu, Y.; Li, X.; Shan, H. Evidence for Gastrointestinal Infection of SARS-CoV-2. Gastroenterology. 2020, 158, 1831–1833. [Google Scholar] [CrossRef]
  9. Ma, X.; Su, L.; Zhang, Y.; Zhang, X.; Gai, Z.; Zhang, Z. Do children need a longer time to shed SARS-CoV-2 in stool than adults? J. Microbiol. Immunol. Infect. 2020, 53, 373–376. [Google Scholar] [CrossRef]
  10. Tang, A.; Tong, Z.D.; Wang, H.L.; Dai, Y.X.; Li, K.F.; Liu, J.N.; Wu, W.J.; Chen, Y.; Yu, M.L.; Li, P.; et al. Detection of Novel Coronavirus by RT-PCR in Stool Specimen from Asymptomatic Child, China. Emerg. Infect. Dis. 2020, 26, 1337–1339. [Google Scholar] [CrossRef]
  11. Frieden, T.R.; Lee, C.T. Identifying and Interrupting Superspreading Events—Implications for Control of Severe Acute Respiratory Syndrome Coronavirus 2. Emerg. Infect. Dis. 2020, 26, 1059–1066. [Google Scholar] [CrossRef]
  12. European Commission Directive 2020/739 of 3 June 2020 Amending Annex III to Directive 2000/54/EC of the European Parliament and of the Council as Regards the Inclusion of SARS-CoV-2 in the List of Biological Agents Known to Infect Humans and Amending Commission Directive (EU) 2019/1833. Available online: https://op.europa.eu/en/publication-detail/-/publication/26c2097f-a626-11ea-bb7a-01aa75ed71a1/language-en (accessed on 7 June 2020).
  13. Guan, W.J.; Ni, Z.Y.; Hu, Y.; Liang, W.H.; Ou, C.Q.; He, J.X.; Liu, L.; Shan, H.; Lei, C.L.; Hui, D.S.; et al. Clinical Characteristics of Coronavirus Disease 2019 in China. N. Engl. J. Med. 2020, 382, 1708–1720. [Google Scholar] [CrossRef]
  14. Pan, Y.; Zhang, D.; Yang, P.; Poon, L.L.M.; Wang, Q. Viral load of SARS-CoV-2 in clinical samples. Lancet Infect. Dis. 2020, 20, 411–412. [Google Scholar] [CrossRef]
  15. To, K.K.W.; Tsang, O.T.Y.; Yip, C.C.Y.; Chan, K.H.; Wu, T.C.; Chan, J.M.C.; Leung, W.S.; Chik, T.S.H.; Choi, C.Y.C.; Kandamby, D.H.; et al. Consistent detection of 2019 novel coronavirus in saliva. Clin. Infect. Dis. 2020, ciaa149. [Google Scholar] [CrossRef] [Green Version]
  16. Zhang, Y.; Chen, C.; Zhu, S.; Shu, C.; Wang, D.; Song, J.; Song, Y.; Zhen, W.; Feng, Z.; Wu, G.; et al. Isolation of 2019-nCoV from a stool specimen of a laboratory-confirmed case of the coronavirus disease 2019 (COVID-19). China CDC Weekly 2020, 2, 123–124. [Google Scholar] [CrossRef]
  17. Sun, J.; Zhu, A.; Li, H.; Zheng, K.; Zhuang, Z.; Chen, Z.; Shi, Y.; Zhang, Z.; Chen, S.B.; Liu, X.; et al. Isolation of infectious SARS-CoV-2 from urine of a COVID-19 patient. Emerg. Microbes Infect. 2020, 9, 991–993. [Google Scholar] [CrossRef]
  18. World Health Organization. Infection Prevention and Control of Epidemic- and Pandemic-Prone Acute Respiratory Infections in Health Care; World Health Organization: Geneva, Switzerland, 2014; Available online: https://apps.who.int/iris/bitstream/handle/10665/112656/9789241507134_eng.pdf?sequence=1 (accessed on 7 June 2020).
  19. World Health Organization. 2020. Modes of Transmission of Virus Causing COVID-19: Implications for IPC Precaution Recommendations. Scientific brief 29 March 2020. Available online: https://www.who.int/news-room/commentaries/detail/modes-of-transmission-of-virus-causing-covid-19-implications-for-ipc-precaution-recommendations (accessed on 7 June 2020).
  20. Haas, C.N. Coronavirus and Environmental Engineering. Sci. Environ. Eng. Sci. 2020, 37. [Google Scholar] [CrossRef] [Green Version]
  21. Favre, J. No Evidence the New Coronavirus Spreads through the Air–but it’s Still Possible. The Conversation, UK, 13 February 2020. Available online: https://theconversation.com/theres-no-evidence-the-new-coronavirus-spreads-through-the-air-but-its-still-possible-131653 (accessed on 7 June 2020).
  22. Duguid, J.P. The size and duration of air-carriage of respiratory droplets and droplet-nuclei. J. Hyg. 1946, 4, 471–480. [Google Scholar] [CrossRef] [PubMed] [Green Version]
  23. Johnson, D.L.; Mead, K.R.; Lynch, R.A.; Hirst, D.V. Lifting the lid on toilet plume aerosol: A literature review with suggestions for future research. Am. J. Infect. Control 2013, 41, 254–258. [Google Scholar] [CrossRef]
  24. Deacon, J. The Microbial World—Airborne Microorganisms. Institute of Cell and Molecular Biology, and Biology Teaching Organisation, University of Edinburgh. 2001. Available online: http://archive.bio.ed.ac.uk/jdeacon/microbes/airborne.htm#Top (accessed on 7 June 2020).
  25. Anfinrud, P.; Stadnytskyi, V.; Bax, C.E.; Bax, A. Visualizing Speech-GeneratedOral Fluid Droplets with Laser Light Scattering. N. Engl. J. Med. 2020. [Google Scholar] [CrossRef]
  26. Somsen, G.A.; van Rijn, C.; Kooij, S.; Bem, R.A.; Bonn, D. Small droplet aerosols in poorly ventilated spaces and SARS-CoV-2 transmission. Lancet Respir. Med. 2020, S2213–S2600, 30245–30249. [Google Scholar] [CrossRef]
  27. The American Society of Heating Refrigerating and Air-Conditioning Engineers. ASHRAE 2009. Available online: http://www.ashrae.org (accessed on 7 June 2020).
  28. Wells, W.F. On air-borne infection. Study II. Droplets and droplet nuclei. Am. J. Hyg. 1934, 20, 611–618. [Google Scholar]
  29. Chao, C.Y.; Wan, M.P. A study of the dispersion of expiratory aerosols in unidirectional downward and ceiling-return type airflows using a multiphase approach. Indoor Air 2006, 16, 296–312. [Google Scholar] [CrossRef]
  30. Wan, M.P.; Chao, C.Y.H. Transport characteristics of expiratory droplets and droplet nuclei in indoor environments with different ventilation air flow patterns. J. Biomech. Eng. T-ASME 2007, 129, 341–353. [Google Scholar] [CrossRef]
  31. Wan, M.P.; Chao, C.Y.H.; Ng, Y.D.; Sze To, G.N.; Yu, W.C. Dispersion of expiratory droplets in a general hospital ward with ceiling mixing type mechanical ventilation system. Aerosol. Sci. Technol. 2007, 41, 244–258. [Google Scholar] [CrossRef]
  32. Qian, H.; Li, Y.; Nielsen, P.V.; Hyldgaard, C.E.; Wong, T.W.; Chwang, A.T.Y. Dispersion of exhaled droplet nuclei in a two-bed hospital ward with three different ventilation systems. Indoor Air 2006, 16, 111–128. [Google Scholar] [CrossRef]
  33. Qian, H.; Li, Y.; Nielsen, P.V.; Hyldgaard, C.E. Dispersion of exhalation pollutants in a two-bed hospital ward with a downward ventilation system. Build. Environ. 2008, 43, 334–354. [Google Scholar] [CrossRef]
  34. Wang, B.; Zhang, A.; Sun, J.; Liu, H.; Hu, J.; Xu, L. Study of SARS transmission via liquid droplets in air. Trans. ASME 2005, 127, 32–38. [Google Scholar] [CrossRef] [PubMed]
  35. Xie, X.; Li, Y.; Chwang, A.T.Y.; Ho, P.L.; Seto, W.H. How far droplets can move in indoor environments – revisiting the Wells evaporation–falling curve. Indoor Air 2007, 17, 211–225. [Google Scholar] [CrossRef] [PubMed]
  36. Zhao, B.; Zhang, Z.; Li, X.T. Numerical study of the transport of droplets or particles generated by respiratory system indoors. Build. Environ. 2005, 40, 1032–1039. [Google Scholar] [CrossRef]
  37. Chen, C.; Zhao, B. Some questions on dispersion of human exhaled droplets in ventilation room: Answers from numerical investigation. Indoor Air. 2010, 20, 95–111. [Google Scholar] [CrossRef]
  38. National Academies of Sciences, Engineering, and Medicine. Rapid Expert Consultation on the Possibility of Bioaerosol Spread of SARS-CoV-2 for the COVID-19 Pandemic (1 April 2020); The National Academies Press: Washington, DC, USA, 2020. [Google Scholar] [CrossRef]
  39. Kutter, J.S.; Spronken, M.I.; Fraaij, P.L.; Fouchier, R.A.; Herfst, S. Transmission routes of respiratory viruses among humans. Curr. Opin. Virol. 2018, 28, 142–151. [Google Scholar] [CrossRef]
  40. Tellier, R.; Li, Y.; Cowling, B.J.; Tang, J.W. Recognition of aerosol transmission of infectious agents: A commentary. BMC Infect. Dis. 2019, 19, 101. [Google Scholar] [CrossRef]
  41. Jones, R.M.; Brosseau, L.M. Aerosol transmission of infectious disease. J. Occup. Environ. Med. 2015, 57, 501–508. [Google Scholar] [CrossRef] [PubMed]
  42. Moher, D.; Liberati, A.; Tetzlaff, J.; Altman, D.G. The PRISMA Group. Preferred Reporting Items for Systematic Reviews and Meta-Analyses: The PRISMA Statement. PLoS ONE Med. 2009, 6, e1000097. [Google Scholar] [CrossRef] [PubMed] [Green Version]
  43. Carducci, A.; Federigi, I.; Liu, D.; Thompson, J.R.; Verani, M. Making Waves: Coronavirus detection, presence and persistence in the water environment: State of the art and knowledge needs for public health. Water Res. 2020, 179, 115907. [Google Scholar] [CrossRef] [PubMed]
  44. Ijaz, M.K.; Karim, Y.G.; Sattar, S.A.; Johnson-Lussenburg, C.M. Development of methods to study the survival of airborne viruses. J. Virol. Methods 1987, 18, 87–106. [Google Scholar] [CrossRef]
  45. Agranovski, I.E.; Safatov, A.S.; Pyankov, O.V.; Sergeev, A.N.; Agafonov, A.P.; Ignatiev, G.M.; Ryabchikova, E.I.; Borodulin, A.I.; Sergeev, A.A.; Doerr, H.W.; et al. Monitoring of viable airborne SARS virus in ambient air. Atmos. Environ. 2004, 38, 3879–3884. [Google Scholar] [CrossRef]
  46. Tseng, C.C.; Li, C.S. Collection efficiencies of aerosol samplers for virus-containing aerosols. J. Aerosol Sci. 2005, 36, 593–607. [Google Scholar] [CrossRef]
  47. Kim, S.W.; Ramakrishnan, M.A.; Raynor, P.C.; Goyal, S.M. Effects of humidity and other factors on the generation and sampling of a coronavirus aerosol. Aerobiologia 2007, 23, 239–248. [Google Scholar] [CrossRef] [Green Version]
  48. Farnsworth, J.E.; Goyal, S.M.; Kim, S.W.; Kuehn, T.H.; Raynor, P.C.; Ramakrishnan, M.A.; Anantharaman, S.; Tang, W. Development of a method for bacteria and virus recovery from heating, ventilation, and air conditioning (HVAC) filters. J. Environ. Monit. 2006, 8, 1006–1013. [Google Scholar] [CrossRef]
  49. Ijaz, M.K.; Brunner, A.H.; Sattar, S.A.; Nair, R.C.; Johnson-Lussenburg, C.M. Survival characteristics of airborne human coronavirus 229E. J. Gen. Virol. 1985, 66, 2743–2748. [Google Scholar] [CrossRef]
  50. Prussin, A.J.; Schwake, D.O.; Lin, K.; Gallagher, D.L.; Buttling, L.; Marr, L.C. Survival of the Enveloped Virus Phi6 in Droplets as a Function of Relative Humidity, Absolute Humidity, and Temperature. Appl Environ. Microbiol. 2018, 84, e00551-e18. [Google Scholar] [CrossRef] [Green Version]
  51. Pyankov, O.V.; Bodnev, S.A.; Pyankova, O.G.; Agranovski, I.E. Survival of aerosolized coronavirus in the ambient air. J. Aerosol Sci. 2018, 115, 158–163. [Google Scholar] [CrossRef] [PubMed]
  52. Van Doremalen, N.; Bushmaker, T.; Munster, V.J. Stability of Middle East respiratory syndrome coronavirus (MERS-CoV) under different environmental conditions. Eurosurveillance 2013, 18, 20590. [Google Scholar] [CrossRef] [PubMed] [Green Version]
  53. Van Doremalen, N.; Bushmaker, T.; Morris, D.H.; Holbrook, M.G.; Gamble, A.; Williamson, B.N.; Tamin, A.; Harcourt, J.L.; Thornburg, N.J.; Gerber, S.I.; et al. Aerosol and Surface Stability of SARS-CoV-2 as Compared with SARS-CoV-1. N. Engl. J. Med. 2020, 382, 1564–1567. [Google Scholar] [CrossRef] [PubMed]
  54. Smither, S.J.; Eastaugh, L.S.; Findlay, J.S.; Lever, M.S. Experimental Aerosol Survival of SARS-CoV-2 in Artificial Saliva and Tissue Culture Media at Medium and High Humidity. Emerg. Microbes Infect. 2020, 1–9. [Google Scholar] [CrossRef] [PubMed]
  55. Walker, C.M.; Ko, G. Effect of ultraviolet germicidal irradiation on viral aerosols. Environ. Sci. Technol. 2007, 41, 5460–5465. [Google Scholar] [CrossRef] [PubMed]
  56. Verreault, D.; Moineau, S.; Duchaine, C. Methods for sampling of airborne viruses. Microbiol. Mol. Biol. Rev. 2008, 72, 413–444. [Google Scholar] [CrossRef] [Green Version]
  57. Bosch, A.; Sánchez, G.; Abbaszadegan, M.; Carducci, A.; Guix, S.; Le Guyader, F.S.; Netshikweta, R.; Pintó, R.M.; van der Poel, W.H.M.; Rutjes, S.; et al. Analytical Methods for Virus Detection in Water and Food. Food Anal. Methods 2011, 4, 4–12. [Google Scholar] [CrossRef] [Green Version]
  58. Gendron, L.; Verreault, D.; Veillette, M.; Moineau, S.; Duchaine, C. Evaluation of filters for the sampling and quantification of RNA phage aerosols. Aerosol Sci. Technol. 2010, 44, 893–901. [Google Scholar] [CrossRef]
  59. Turgeon, N.; Toulouse, M.-J.; Martel, B.; Moineau, S.; Duchaine, C. Comparison of five bacteriophages as models for viral aerosol studies. Appl. Environ. Microbiol. 2014, 80, 4242–4250. [Google Scholar] [CrossRef] [Green Version]
  60. Hermann, J.R.; Brockmeier, S.L.; Yoon, K.J.; Zimmerman, J.J. Detection of respiratory pathogens in air samples from acutely infected pigs. Can. J. Vet. Res. 2008, 72, 367–370. [Google Scholar] [PubMed]
  61. Alonso, C.; Goede, D.P.; Morrison, R.B.; Davies, P.R.; Rovira, A.; Marthaler, D.G.; Torremorell, M. Evidence of infectivity of airborne porcine epidemic diarrhea virus and detection of airborne viral RNA at long distances from infected herds. Vet. Res. 2014, 45, 73. [Google Scholar] [CrossRef] [PubMed]
  62. Alonso, C.; Raynor, P.C.; Davies, P.R.; Torremorell, M. Concentration, Size Distribution, and Infectivity of Airborne Particles Carrying Swine Viruses. PLoS ONE 2015, 10, e0135675. [Google Scholar] [CrossRef] [PubMed]
  63. Alonso, C.; Raynor, P.C.; Goyal, S.; Olson, B.A.; Alba, A.; Davies, P.R.; Torremorell, M. Assessment of air sampling methods and size distribution of virus-laden aerosols in outbreaks in swine and poultry farms. J. Vet. Diagn. Invest. 2017, 29, 298–304. [Google Scholar] [CrossRef]
  64. Borkenhagen, L.K.; Mallinson, K.A.; Tsao, R.W.; Ha, S.J.; Lim, W.H.; Toh, T.H.; Anderson, B.D.; Fieldhouse, J.K.; Philo, S.E.; Chong, K.S.; et al. Surveillance for respiratory and diarrheal pathogens at the human-pig interface in Sarawak, Malaysia. PLoS ONE 2018, 13, e0201295. [Google Scholar] [CrossRef]
  65. Coleman, K.K.; Nguyen, T.T.; Yadana, S.; Hansen-Estruch, C.; Lindsley, W.G.; Gray, G.C. Bioaerosol Sampling for Respiratory Viruses in Singapore’s Mass Rapid Transit Network. Sci. Rep. 2018, 8, 17476. [Google Scholar] [CrossRef] [Green Version]
  66. Memish, Z.A.; Almasri, M.; Assirri, A.; Al-Shangiti, A.M.; Gray, G.C.; Lednicky, J.A.; Yezli, S. Environmental sampling for respiratory pathogens in Jeddah airport during the 2013 Hajj season. Am. J. Infect. Control. 2014, 42, 1266–1269. [Google Scholar] [CrossRef]
  67. Xie, C.; Lau, E.H.; Yoshida, T.; Yu, H.; Wang, X.; Wu, H.; Wei, J.; Cowling, B.; Peiris, M.; Li, Y.; et al. Detection of Influenza and Other Respiratory Viruses in Air Sampled From a University Campus: A Longitudinal Study. Clin. Infect. Dis. 2020, 70, 850–858. [Google Scholar] [CrossRef]
  68. Nguyen, T.T.; Poh, M.K.; Low, J.; Kalimuddin, S.; Thoon, K.C.; Ng, W.C.; Anderson, B.D.; Gray, G.C. Bioaerosol Sampling in Clinical Settings: A Promising, Noninvasive Approach for Detecting Respiratory Viruses. Open Forum Infect. Dis. 2016, 4, ofw259. [Google Scholar] [CrossRef] [Green Version]
  69. Yadana, S.; Coleman, K.K.; Nguyen, T.T.; Hansen-Estruch, C.; Kalimuddin, S.; Thoon, K.C.; Low, J.G.H.; Gray, G.C. Monitoring for airborne respiratory viruses in a general pediatric ward in Singapore. J. Public Health Res. 2019, 8, 1407. [Google Scholar] [CrossRef] [Green Version]
  70. Booth, T.F.; Kournikakis, B.; Bastien, N.; Ho, J.; Kobasa, D.; Stadnyk, L.; Li, Y.; Spence, M.; Paton, S.; Henry, B.; et al. Detection of airborne severe acute respiratory syndrome (SARS) coronavirus and environmental contamination in SARS outbreak units. J. Infect. Dis. 2005, 191, 1472–1477. [Google Scholar] [CrossRef] [PubMed]
  71. Tsai, Y.H.; Wan, G.H.; Wu, Y.K.; Tsao, K.C. Airborne severe acute respiratory syndrome coronavirus concentrations in a negative-pressure isolation room. Infect. Control Hosp. Epidemiol. 2006, 27, 523–525. [Google Scholar] [CrossRef] [PubMed] [Green Version]
  72. Wan, G.H.; Tsai, Y.H.; Wu, Y.K.; Tsao, K.C. A large-volume nebulizer would not be an infectious source for severe acute respiratory syndrome. Infect. Control Hosp. Epidemiol. 2004, 25, 1113–1115. [Google Scholar] [CrossRef] [PubMed]
  73. Azhar, E.I.; Hashem, A.M.; El-Kafrawy, S.A.; Sohrab, S.S.; Aburizaiza, A.S.; Farraj, S.A.; Hassan, A.M.; Al-Saeed, M.S.; Jamjoom, G.A.; Madani, T.A. Detection of the Middle East respiratory syndrome coronavirus genome in an air sample originating from a camel barn owned by an infected patient. mBio 2014, 5, e01450-e14. [Google Scholar] [CrossRef] [PubMed] [Green Version]
  74. Kim, S.H.; Chang, S.Y.; Sung, M.; Park, J.H.; Kim, H.B.; Lee, H.; Choi, J.P.; Choi, W.S.; Min, J.Y. Extensive Viable Middle East Respiratory Syndrome (MERS) Coronavirus Contamination in Air and Surrounding Environment in MERS Isolation Wards. Clin. Infect. Dis. 2016, 63, 363–369. [Google Scholar] [CrossRef] [Green Version]
  75. Guo, Z.D.; Wang, Z.Y.; Zhang, S.F.; Li, X.; Li, L.; Li, C.; Cui, Y.; Fu, R.B.; Dong, Y.Z.; Chi, X.Y.; et al. Aerosol and Surface Distribution of Severe Acute Respiratory Syndrome Coronavirus 2 in Hospital Wards, Wuhan, China, 2020. Emerg. Infect. Dis. 2020, 26, 10–3201. [Google Scholar] [CrossRef]
  76. Liu, Y.; Ning, Z.; Chen, Y.; Guo, M.; Liu, Y.; Gali, N.K.; Sun, L.; Duan, Y.; Cai, J.; Westerdahl, D.; et al. Aerodynamic analysis of SARS-CoV-2 in two Wuhan hospitals. Nature 2020, 582, 557–560. [Google Scholar] [CrossRef]
  77. Cheng, V.C.C.; Wong, S.C.; Chen, J.H.K.; Yip, C.C.Y.; Chuang, V.W.M.; Tsang, O.T.Y.; Sridhar, S.; Chan, J.F.W.; Ho, P.L.; Yuen, K.Y. Escalating infection control response to the rapidly evolving epidemiology of the coronavirus disease 2019 (COVID-19) due to SARS-CoV-2 in Hong Kong. Infect. Control Hosp. Epidemiol. 2020, 41, 493–498. [Google Scholar] [CrossRef] [Green Version]
  78. Faridi, S.; Niazi, S.; Sadeghi, K.; Naddafi, K.; Yavarian, J.; Shamsipour, M.; Jandaghi, N.Z.S.; Sadeghniiat, K.; Nabizadeh, R.; Yunesian, M.; et al. A field indoor air measurement of SARS-CoV-2 in the patient rooms of the largest hospital in Iran. Sci. Total Environ. 2020, 725, 138401. [Google Scholar] [CrossRef]
  79. Ong, S.W.X.; Tan, Y.K.; Chia, P.Y.; Lee, T.H.; Ng, O.T.; Wong, M.S.Y.; Marimuthu, K. Air, Surface Environmental, and Personal Protective Equipment Contamination by Severe Acute Respiratory Syndrome Coronavirus 2 (SARS-CoV-2) From a Symptomatic Patient. JAMA 2020, 323, 1610–1612. [Google Scholar] [CrossRef] [Green Version]
  80. Chia, P.Y.; Coleman, K.K.; Tan, Y.K.; Ong, S.W.X.; Gum, M.; Lau, S.K.; Lim, X.F.; Lim, A.S.; Sutjipto, S.; Lee, P.H.; et al. Detection of air and surface contamination by SARS-CoV-2 in hospital rooms of infected patients. Nat. Commun. 2020, 11, 2800. [Google Scholar] [CrossRef] [PubMed]
  81. Setti, L.; Passarini, F.; De Gennaro, G.; Barbieri, P.; Pallavicini, A.; Ruscio, M.; Piscitelli, P.; Colao, A.; Miani, A. Searching for SARS-COV-2 on Particulate Matter: A Possible Early Indicator of COVID-19 Epidemic Recurrence. Int. J. Environ. Res. Public Health 2020, 17, 2986. [Google Scholar] [CrossRef] [PubMed]
  82. Qian, H.; Miao, T.; Liu, L.; Zheng, X.; Luo, D.; Li, Y. Indoor transmission of SARS-CoV-2. medRxiv 2020. [Google Scholar] [CrossRef]
  83. McKinney, K.R.; Gong, Y.Y.; Lewis, T.G. Environmental transmission of SARS at Amoy Gardens. J. Environ. Health 2006, 68, 26–52. [Google Scholar] [PubMed]
  84. Yu, I.T.; Li, Y.; Wong, T.W.; Tam, W.; Chan, A.T.; Lee, J.H.W.; Leung, D.Y.C.; Ho, T. Evidence of airborne transmission of the severe acute respiratory syndrome virus. N. Engl. J. Med. 2004, 350, 1731–1739. [Google Scholar] [CrossRef] [PubMed] [Green Version]
  85. Li, Y.; Duan, S.; Yu, I.T.; Wong, T.W. Multi-zone modeling of probable SARS virus transmission by airflow between flats in Block E, Amoy Gardens. Indoor Air 2005, 15, 96–111. [Google Scholar] [CrossRef]
  86. Chu, C.M.; Cheng, V.C.; Hung, I.F.; Chan, K.S.; Tang, B.S.F.; Tsang, T.H.F.; Chan, K.H.; Yuen, K.Y. Viral load distribution in SARS outbreak. Emerg. Infect. Dis. 2005, 11, 1882–1886. [Google Scholar] [CrossRef]
  87. Yip, C.; Chang, W.L.; Yeung, K.H.; Yu, I.T. Possible meteorological influence on the severe acute respiratory syndrome (SARS) community outbreak at Amoy Gardens, Hong Kong. J. Environ. Health 2007, 70, 39–46. [Google Scholar]
  88. Niu, J.; Tung, T.C. On-site quantification of re-entry ratio of ventilation exhausts in multi-family residential buildings and implications. Indoor Air 2008, 18, 12–26. [Google Scholar] [CrossRef]
  89. Gao, N.P.; Niu, J.L.; Perino, M.; Heiselberg, P. The airborne transmission of infection between flats in high-rise residential buildings: Tracer gas simulation. Build. Environ. 2008, 43, 1805–1817. [Google Scholar] [CrossRef]
  90. Gao, N.P.; Niu, J.L.; Perino, M.; Heiselberg, P. The airborne transmission of infection between flats in high-rise residential buildings: Particle simulation. Build. Environ. 2009, 44, 402–410. [Google Scholar] [CrossRef]
  91. Yu, I.T.; Qiu, H.; Tse, L.A.; Wong, T.W. Severe acute respiratory syndrome beyond Amoy Gardens: Completing the incomplete legacy. Clin. Infect. Dis. 2014, 58, 683–686. [Google Scholar] [CrossRef]
  92. Olsen, S.J.; Chang, H.L.; Cheung, T.Y.; Tang, A.F.Y.; Fisk, T.L.; Ooi, S.P.L.; Kuo, H.W.; Jiang, D.D.S.; Chen, K.T.; Lando, J.; et al. Transmission of the severe acute respiratory syndrome on aircraft. N. Engl. J. Med. 2003, 349, 2416–2422. [Google Scholar] [CrossRef]
  93. Han, Z.; To, G.N.; Fu, S.C.; Chao, C.Y.; Weng, W.; Huang, Q. Effect of human movement on airborne disease transmission in an airplane cabin: Study using numerical modeling and quantitative risk analysis. BMC Infect. Dis. 2014, 14, 434. [Google Scholar] [CrossRef] [Green Version]
  94. Lei, H.; Li, Y.; Xiao, S.; Lin, C.H.; Norris, S.L.; Wei, D.; Hu, Z.; Ji, S. Routes of transmission of influenza A H1N1, SARS CoV, and norovirus in air cabin: Comparative analyses. Indoor Air 2018, 28, 394–403. [Google Scholar] [CrossRef] [Green Version]
  95. You, R.; Lin, C.H.; Wei, D.; Chen, Q. Evaluating the commercial airliner cabin environment with different air distribution systems. Indoor Air 2019, 29, 840–853. [Google Scholar] [CrossRef]
  96. Centers for Disease Control and Prevention (CDC). Update: Outbreak of severe acute respiratory syndrome--worldwide, 2003 [published correction appears in MMWR Morb Mortal Wkly Rep. 2003 Apr 4;52(13):284]. MMWR Morb. Mortal. Wkly Rep. 2003, 52, 241–248. [Google Scholar]
  97. World Health Organization. SARS-How a Global Epidemic Was Stopped; WHO Press: Geneva, Switzerland, 2006. [Google Scholar]
  98. Varia, M.; Wilson, S.; Sarwal, S.; McGeer, A.; Gournis, E.; Galanis, E.; Henry, B. Hospital Outbreak Investigation Team Investigation of a nosocomial outbreak of severe acute respiratory syndrome (SARS) in Toronto, Canada. CMAJ 2003, 169, 285–292. [Google Scholar]
  99. Christian, M.D.; Loutfy, M.; McDonald, L.C.; Martinez, K.F.; Ofner, M.; Wong, T.; Wallington, T.; Gold, W.L.; Mederski, B.; Green, K.; et al. Possible SARS coronavirus transmission during cardiopulmonary resuscitation. Emerg Infect. Dis. 2004, 10, 287–293. [Google Scholar] [CrossRef] [Green Version]
  100. Li, Y.; Huang, X.; Yu, I.T.; Wong, T.W.; Qian, H. Role of air distribution in SARS transmission during the largest nosocomial outbreak in Hong Kong. Indoor Air 2005, 15, 83–95. [Google Scholar] [CrossRef]
  101. Wong, T.W.; Lee, C.K.; Tam, W.; Lau, J.T.F.; Yu, T.S.; Lui, S.F.; Chan, P.K.S.; Li, Y.; Bresee, J.S.; Sung, J.J.Y.; et al. Cluster of SARS among medical students exposed to single patient, Hong Kong. Emerg. Infect. Dis. 2004, 10, 269–276. [Google Scholar] [CrossRef] [PubMed]
  102. Yu, I.T.; Wong, T.W.; Chiu, Y.L.; Lee, N.; Li, Y. Temporal-spatial analysis of severe acute respiratory syndrome among hospital inpatients. Clin. Infect. Dis. 2005, 40, 1237–1243. [Google Scholar] [CrossRef] [PubMed] [Green Version]
  103. Chen, C.; Zhao, B.; Yang, X.; Li, Y. Role of two-way airflow owing to temperature difference in severe acute respiratory syndrome transmission: Revisiting the largest nosocomial severe acute respiratory syndrome outbreak in Hong Kong. J. R. Soc. Interface 2011, 8, 699–710. [Google Scholar] [CrossRef] [PubMed] [Green Version]
  104. Xiao, S.; Li, Y.; Wong, T.W.; Hui, D.S.C. Role of fomites in SARS transmission during the largest hospital outbreak in Hong Kong. PLoS ONE 2017, 12, e0181558. [Google Scholar] [CrossRef]
  105. Xiao, S.; Li, Y.; Sung, M.; Wei, J.; Yang, Z. A study of the probable transmission routes of MERS-CoV during the first hospital outbreak in the Republic of Korea. Indoor Air 2018, 28, 51–63. [Google Scholar] [CrossRef]
  106. Jo, S.; Hong, J.; Lee, S.E.; Ki, M.; Choi, B.Y.; Sung, M. Airflow analysis of Pyeongtaek St Mary’s Hospital during hospitalization of the first Middle East respiratory syndrome patient in Korea. R. Soc. Open Sci. 2019, 6, 181164. [Google Scholar] [CrossRef] [Green Version]
  107. Wang, J.; Du, G. COVID-19 may transmit through aerosol. Ir. J. Med. Sci. 2020, 1–2. [Google Scholar] [CrossRef] [Green Version]
  108. Park, S.Y.; Kim, Y.M.; Yi, S.; Lee, S.; Na, B.J.; Kim, C.B.; Kim, J.I.; Kim, H.S.; Kim, Y.B.; Park, Y.; et al. Coronavirus Disease Outbreak in Call Center, South Korea. Emerg. Infect. Dis. 2020, 26, 8. [Google Scholar] [CrossRef]
  109. Cai, J.; Sun, W.; Huang, J.; Gamber, M.; Wu, J.; He, G. Indirect Virus Transmission in Cluster of COVID-19 Cases, Wenzhou, China, 2020. Emerg. Infect. Dis. 2020, 26, 1343–1345. [Google Scholar] [CrossRef]
  110. Hamner, L.; Dubbel, P.; Capron, I.; Ross, A.; Jordan, A.; Lee, J.; Lynn, J.; Ball, A.; Narwal, S.; Russell, S.; et al. High SARS-CoV-2 Attack Rate Following Exposure at a Choir Practice-Skagit County, Washington, March 2020. MMWR Morb. Mortal. Wkly Rep. 2020, 69, 606–610. [Google Scholar] [CrossRef]
  111. Hijnen, D.; Marzano, A.V.; Eyerich, K.; GeurtsvanKessel, C.; Giménez-Arnau, A.M.; Joly, P.; Vestergaard, C.; Sticherling, M.; Schmidt, E. SARS-CoV-2 Transmission from Presymptomatic Meeting Attendee, Germany. Emerg. Infect. Dis. 2020, 26, 8. [Google Scholar] [CrossRef]
  112. Lu, J.; Gu, J.; Li, K.; Xu, C.; Su, W.; Lai, Z.; Zhou, D.; Yu, C.; Xu, B.; Yan, Z. COVID-19 Outbreak Associated with Air Conditioning in Restaurant, Guangzhou, China, 2020. Emerg. Infect. Dis. 2020, 26, 1628–1631. [Google Scholar] [CrossRef]
  113. Heinzerling, A.; Stuckey, M.J.; Scheuer, T.; Xu, K.; Perkins, K.M.; Resseger, H.; Magill, S.; Verani, J.R.; Jain, S.; Acosta, M.; et al. Transmission of COVID-19 to Health Care Personnel During Exposures to a Hospitalized Patient-Solano County, California, February 2020. MMWR Morb. Mortal. Wkly Rep. 2020, 69, 472–476. [Google Scholar] [CrossRef] [Green Version]
  114. Wong, S.C.; Kwong, R.T.; Wu, T.C.; Chan, J.W.; Chu, M.Y.; Lee, S.Y.; Wong, H.Y.; Lung, D.C. Risk of nosocomial transmission of coronavirus disease 2019: An experience in a general ward setting in Hong Kong. J. Hosp. Infect. 2020, 105, 119–127. [Google Scholar] [CrossRef]
  115. Shen, Y.; Li, C.; Dong, H.; Wang, Z.; Martinez, L.; Sun, Z.; Handel, A.; Chen, Z.; Chen, E.; Ebell, M.; et al. Airborne Transmission of COVID-19: Epidemiologic Evidence from Two Outbreak Investigations (11 May 2020). Available online: https://ssrn.com/abstract (accessed on 7 June 2020).
  116. Guyatt, G.; Cairns, J.; Churchill, D.; Cook, D.; Haynes, B.; Hirsh, J.; Irvine, J.; Levine, M.; Levine, M.; Nishikawa, J.; et al. Evidence-based medicine. A new approach to teaching the practice of medicine. JAMA 1992, 268, 2420–2425. [Google Scholar] [CrossRef]
  117. Rajagopaian, S.; Huang, S.; Brook, R.D. Flattening the curve in COVID-19 using personalised protective equipment: Lessons from air pollution. Heart 2020, 1–3. [Google Scholar] [CrossRef]
  118. Greenhalgh, T.; Schmid, M.B.; Czypionka, T.; Bassler, D.; Gruer, L. Face masks for the public during the covid-19 crisis. BMJ 2020, 369, m1435. [Google Scholar] [CrossRef] [Green Version]
  119. Adhikari, U.; Chabrelie, A.; Weir, M.; Boehnke, K.; McKenzie, E.; Ikner, L.; Wang, M.; Wang, Q.; Young, K.; Haas, C.N.; et al. A Case Study Evaluating the Risk of Infection from Middle Eastern Respiratory Syndrome Coronavirus (MERS-CoV) in a Hospital Setting Through Bioaerosols. Risk Anal. 2019, 39, 2608–2624. [Google Scholar] [CrossRef] [Green Version]
  120. Buonanno, G.; Stabile, L.; Morawska, L. Estimation of airborne viral emission: Quanta emission rate of SARS-CoV-2 for infection risk assessment. Environ. Int. 2020, 141, 105794. [Google Scholar] [CrossRef]
Figure 1. PRISMA flow diagram for the study selection procedure.
Atmosphere 11 00710 g001
Figure 2. Distribution of the collected paper: (a) topic distribution; (b) time trend and topic.
Atmosphere 11 00710 g002
Table 1. Number of reviewed papers according to the topic and the type of coronavirus or surrogate.
Type of StudyPhage phi6Animal CoronavirusesCommon Human Coronaviruses *SARS-CoVMERS-CoVSARS-CoV-2Total Number of the Studies
In vitro studies23222212 **
Monitoring studiesNonhealthcare settings or communityNA4401110
Healthcare settingsNA0231612
Epidemiological and airflow models studiesNonhealthcare settings or communityNA00130619
Healthcare settingsNA0072211
NA = not applicable. * Common human coronaviruses are the coronaviruses that are known to infect humans, generally causing mild, self-limiting upper respiratory tract symptoms, such as HCoV-OC43 and HCoV-HKU1 (β-coronavirus) and HCoV-229E and HCoV-NL63 (α-coronavirus). ** The study by Van Doremalenn et al. (2020) analyzed both SARS-CoV and SARS-CoV-2.

