Article

The Impact of MJO, Kelvin, and Equatorial Rossby Waves on the Diurnal Cycle over the Maritime Continent

1
Applied Science and Technology PhD Program, North Carolina A&T State University, Greensboro, NC 27411, USA
2
Cooperative Institute for Marine & Atmospheric Studies (CIMAS), University of Miami, Miami, FL 33149, USA
3
Department of Physics, North Carolina A&T State University, Greensboro, NC 27411, USA
4
North Carolina Institute for Climate Studies (NCICS), North Carolina State University, Asheville, NC 28801, USA
*
Author to whom correspondence should be addressed.
Atmosphere 2020, 11(7), 711; https://doi.org/10.3390/atmos11070711
Submission received: 15 June 2020 / Accepted: 30 June 2020 / Published: 3 July 2020
(This article belongs to the Section Meteorology)

Abstract

:
The impacts of the Madden–Julian Oscillation (MJO), Kelvin waves, and Equatorial Rossby (ER) waves on the diurnal cycle of rainfall and types of deep convection over the Maritime Continent are investigated using rainfall from the Tropical Rainfall Measurement Mission Multisatellite Precipitation Analysis and Infrared Weather States (IR–WS) data from the International Satellite Cloud Climatology Project. In an absolute sense, the MJO produced its strongest modulations of rainfall and organized deep convection over the islands, when and where convection is already strongest. The MJO actually has a greater percentage modulation over the coasts and seas, but it does not affect weaker diurnal cycle there. Isolated deep convection was also more prevalent over land during the suppressed phase, while organized deep convection dominated the enhanced phase, consistent with past work. This study uniquely examined the effects of Kelvin and ER waves on rainfall, convection, and their diurnal cycles over the Maritime Continent. The modulation of convection by Kelvin waves closely mirrored that by the MJO, although the Kelvin wave convection continued farther into the decreasing phase. The signals for ER waves were also similar but less distinct. An improved understanding of how these waves interact with convection could lead to improved subseasonal forecast skill.

1. Introduction

This study investigates the influence of various wave modes on the diurnal cycle of rainfall and deep convection over the Maritime Continent. The Maritime Continent is bounded by the Indian and Pacific Oceans. In between lies a complex terrain with thousands of islands, shallow seas, bays, and peninsulas (Figure 1). Sumatra, Borneo, and Papua New Guinea are the largest islands. The region is situated in the tropical “Warm Pool” that has a significant influence on large-scale moist convection and atmospheric circulations [1].
The diurnal cycle explains about 40% of the total convective variability in the tropics [2]. The diurnal cycle and the intraseasonal variability over Maritime Continent are among the strongest in the tropics [2,3,4]. It is strongly modulated by a complex terrain and the contrasts between land and sea [5]. Generally, rainfall peaks in the afternoon (15:00–18:00 Local Solar Time; LST) over land and the morning (06:00–09:00 LST) over the coast and ocean [5,6,7]. The peak rainfall over land is much larger than the peak rainfall over the coast and sea, mainly associated with differential heating between elevated terrain and low-lying areas and seas and the attendant circulation.
The diurnal cycle of rainfall and convection over the Maritime Continent is strongly modulated by the Madden–Julian Oscillation (MJO) [7,8,9]. For example, the diurnal range increases when the real-time multivariate MJO (RMM) [10] index is in phases 2–3 and the MJO’s enhanced convection is over the Maritime Continent [7]. It decreases during the suppressed phases (RMM 6–7) when the MJO is over the western Pacific [7]. However, it does not affect the timing of peak activity. Similarly, the wet part of the diurnal cycle gets wetter during the enhanced MJO phase (RMM 3), while the dry part gets drier in the suppressed phase of MJO (RMM 7) [9]. The current study builds on past work by examining diurnal variations of different types of convection over the Maritime Continent and their interactions with the MJO. It also uniquely expands this research to examine other equatorial waves (Kelvin waves and equatorial Rossby waves).
The MJO is the dominant mode of tropical intraseasonal variability, and the circulation associated with it has a significant impact on weather around the globe [11]. The MJO’s convection forms over the Indian Ocean and dissipates over the western Pacific [12]. Its propagation over the Maritime Continent is irregular: many MJO events either stall or even decay over the region. The MJO’s circulation is disrupted by the high terrain over the larger islands including Sumatra and Papua New Guinea [13,14]. The disruption is particularly strong when SSTs around the Maritime Continent are cooler because of El Niño or a positive Indian Ocean Dipole [15]. The MJO can also lose energy to the strong diurnal cycle in the Maritime Continent [16]. For example, MJO events that fail to cross the Maritime Continent produce higher rainfall there than those that continue across [17]. These interactions between that diurnal cycle and broader scale circulations like the MJO remain unresolved [18,19,20].
A better knowledge of the MJO variability and its impact on daily rainfall and convection can have an important influence on subseasonal to seasonal forecasting. Dynamical model skill for predicting the MJO is generally limited to 2–3 weeks at present [21,22,23]. One critical challenge in extending this forecast horizon has been the multiscale interactions with diurnal cycle [8,24,25,26,27]. These interactions have been the focus of many studies in recent years [28]. Most models are biased towards having the MJO stall over the Maritime Continent, and resolving the diurnal cycle could be the key to addressing that bias [13,29].
Numerous studies have investigated the interaction between the MJO and the diurnal cycle over the Maritime Continent [16,17,18,19,20]. However, we are not aware of any studies that examine similar interactions within convectively coupled equatorial waves [30]. The MJO’s convective envelope frequently consists of a hierarchy of these equatorial waves [31,32,33]. Models with stronger Kelvin waves (KW) and equatorial Rossby (ER) waves also tend to have better representations of the MJO [34]. Mekonnen and Rossow [35] showed that the interactions with mountain ranges over Africa can change the modes of convection in easterly waves. Similar interactions between the MJO and the mountain chains of the Maritime Continent could be critical to simulating the MJO’s propagation in this region. Feedbacks between the MJO’s circulation, equatorial waves, the diurnal cycle, and the convective population over the Maritime Continent may be critical to understanding the MJO’s propagation in this region.
Most studies of the MJO and equatorial waves have used cold–cloud infrared brightness temperature (TB), outgoing long-wave radiation (OLR), or rainfall datasets, as proxies for deep convection. Each of these treat convection as a monoculture. Although proxies such as TB give an estimate of the location of convection, this approach might mix different convective and nonconvective weather states. For example, it is not easy to distinguish the cold upper tropospheric cirrus from a deep convective cumulus cloud. We overcome this using the weather state (WS) dataset from the International Satellite Cloud Climatology Project (ISCCP) [36,37]. Different WSs describe distinct mesoscale patterns of cloud properties that closely approximate different types of deep convection. This approach allows us to analyze different types of deep convection. WS data, together with other satellite observations such as Tropical Rainfall Measuring Mission (TRMM) rainfall, will provide a clearer picture of different types of deep convection and their association with the MJO and equatorial waves.
This study leverages the TRMM and ISCCP WS datasets to uniquely examine the effects of the MJO and equatorial waves on modes of deep convection over the Maritime Continent. Numerical models struggle to leverage the potential subseasonal skill of these modes, particularly over the Maritime Continent [22,23]. The results of this study will provide a new benchmark against which those models can be compared and improved.

2. Data and Methods

2.1. Data Sources

2.1.1. TRMM Multisatellite Precipitation Analysis

Rainfall estimates were derived from the TRMM multisatellite precipitation analyses (TMPA) version 7 [38]. This dataset combines rainfall estimates from microwave and infrared satellite sensors along with the TRMM precipitation radar. The resulting estimates are calibrated with gauge data. TMPA has been available on 0.25° latitude–longitude grid every 3 h since December 1997. We used data through December 2015.

2.1.2. Infrared Weather State (IR-WS) Data from ISCCP Version D

ISCCP provides various satellite-observed products, including cloud-top pressure and cloud optical thickness. Cloud-top pressure (CTP) represents the radiating top level of clouds and indicates cloud vertical height. Cloud optical thickness (τ) measures cloud reflectivity at visible wavelengths (near 0.6 µm), assuming the satellite pixel is covered by clouds. Based on joint frequency distributions of CTP- τ and using k-means cluster analysis method [39], past work [40,41,42] identified different types of weather states (WSs) for different regions of the world. Therefore, WSs are objectively identified distinct patterns that are associated with different atmospheric conditions [42]. Eight different types of convective states are identified for the extended global tropics within ±35 latitude [35].
Since τ is derived from the visible wavelength, the original WS data are not available during the nighttime and are thus are not suitable for the diurnal cycle studies. Fortunately, Tan et al. [43] produced an Infrared Weather States (IR-WSs) version based on CTP retrievals from infrared (IR) information that is available at all times. Tan et al. [43] first reproduced the original eight WSs for ±35° latitude and determined corresponding IR-only CTP histograms. Finally, CTP histograms were assigned a new cloud regime according to the shortest distance, and these are referred to as IR-WSs. Tan et al. [43] classified eight different types of cloud regimes that correspond to the original WS.
Three of the eight IR-WSs represent deep convective types, and the remaining represent suppressed convection. The three deep convective types are classified as IR-WS1, IR-WS2, and IR-WS3. The IR-WS1 types are define by high-tops (low CTP) and large optical thicknesses. They represent large-scale, well organized convection mainly associated with mesoscale convective systems. IR-WS2 are defined by relatively lower areal coverage of thick high-topped clouds. They represent convection with high incidences of thick cirrus and anvil clouds. IR-WS3 represent isolated and scattered convection (such as isolated cumulonimbus clouds). IR-WS3 types are high-topped and lower incidences of thickness. IR-WS1, IR-WS2, and IR-WS3 define different types of deep convection.
We use IR-WS1, IR-WS2, and IR-WS3 to study diurnal cycle of moist convection over the Maritime Continent. Note that IR-WS1 is the core of deep convection and IR-WS2 is the convective thick anvil part of the core cloud system and they live together. Therefore, we combine them (IR-WS12 [6,35]) for this study. IR-WSs are available every 3 h on a 2.5° × 2.5° grid for the extended global tropics within ±35 latitude from June 1983–2009 [43,44]. IR-WS have been used to study the diurnal cycles of convection and African easterly wave initiation [37], and the study of diurnal cycle over the Maritime Continent [6].

2.2. Methods

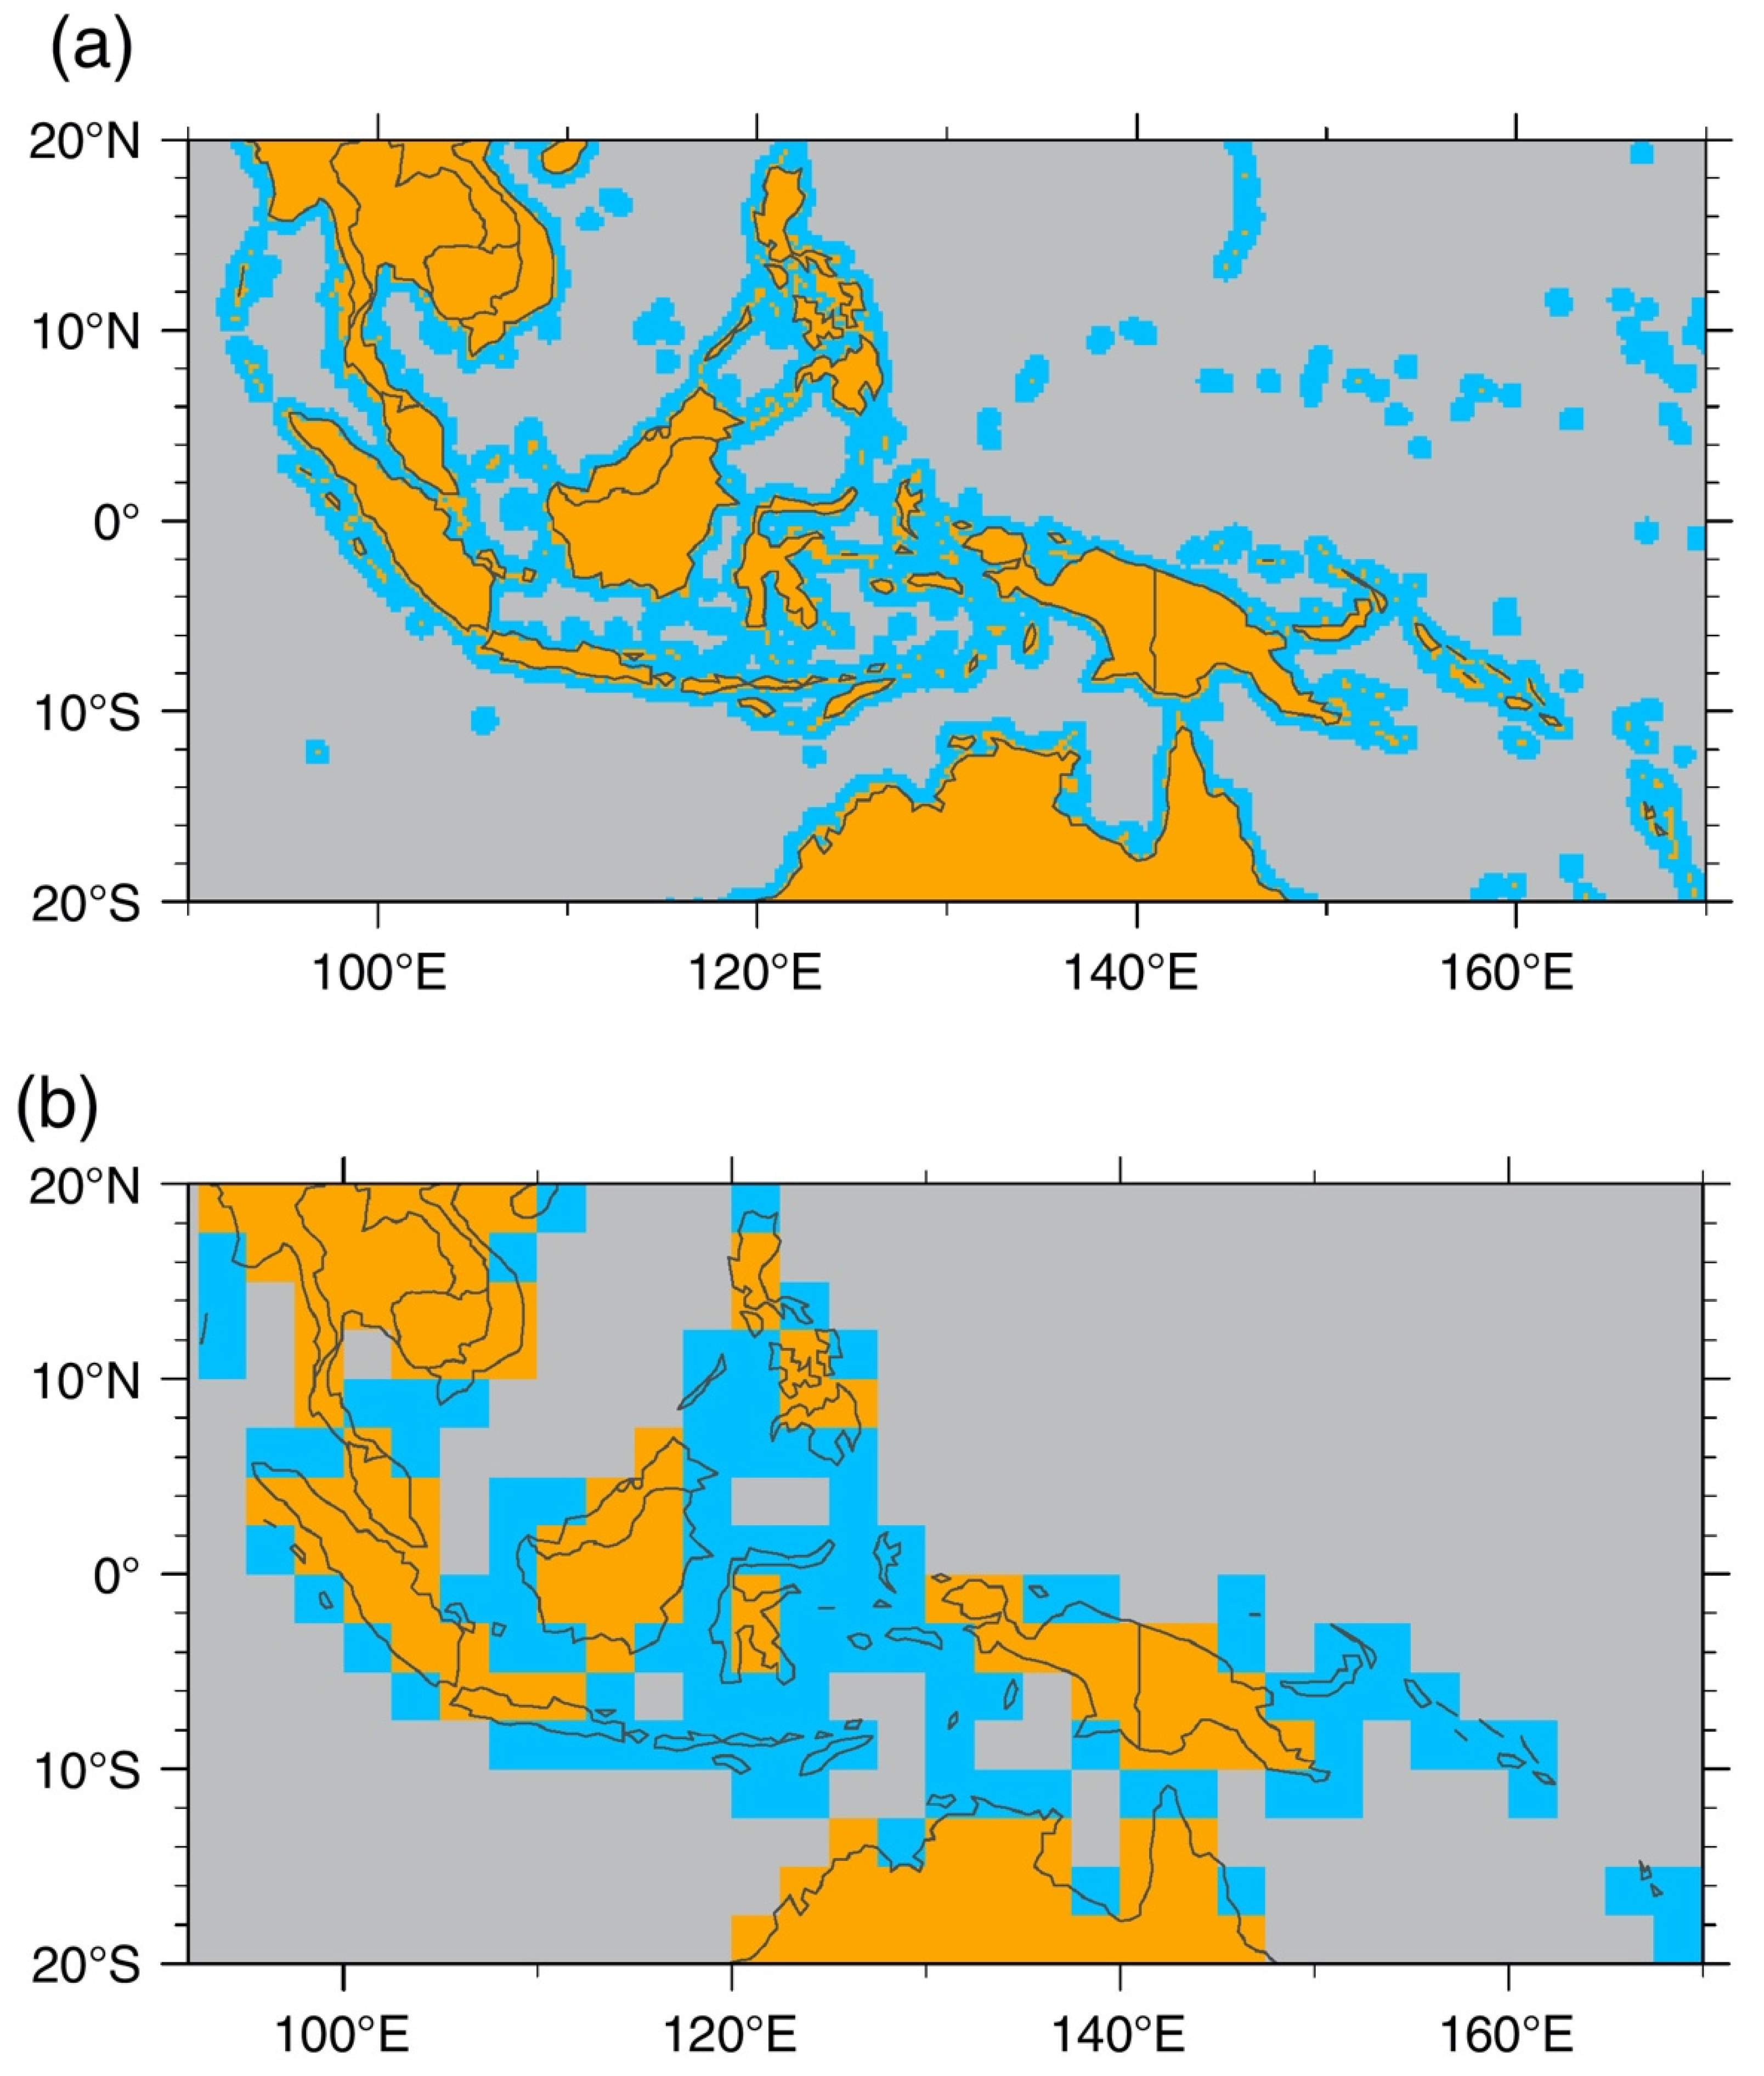
2.2.1. Separating Land, Coast, and Ocean

We partitioned the Maritime Continent into land, coast, and ocean areas as in Worku et al. [6]. For the TMPA data, pixels were categorized based on the distance between the pixel center and land using the Naval Oceanographic Office’s (NAVOEANO) 1-km Very High-Resolution land/sea tag map with distance from land. Pixels centered on land were classified as land, those within 50 km of land were considered coast, and those farther than 50 km were classified as ocean (Figure 1a).
Also as in Worku et al. [6], the IR-WSs were binned according to the fraction of each 2.5° box contained ocean due to its coarser resolution (Figure 1b). If more than 30% of the grid box consisted of ocean, then it was classified as ocean. If 97% of the box contained land, then it was classified as land. The remaining pixels were considered as coast. These thresholds were selected to provide the best qualitative match with the TRMM mask (compares Figure 1a,b).

2.2.2. MJO and Equatorial Wave Phases

The TRMM and IR-WS data were binned into MJO and equatorial wave phases using two methods. First, we employed the commonly used Wheeler–Hendon [10] real-time multivariate MJO (RMM) index. Only days when the RMM amplitude was greater than 1 were used to reduce the influence of weaker events.
The second method identified both the MJO and equatorial waves using zonal wavenumber–frequency filtering of OLR [45] and TMPA. The MJO filter was defined as eastward propagating wavenumbers 0–9 and periods of 20–100 days [46]. Equatorial Rossby waves were identified with westward propagating wavenumber 1–10 and periods shorter than 72 days but longer than the ER-wave dispersion curve for a shallow water equivalent depth of 90 m [30]. Finally, Kelvin waves were identified within eastward moving wavenumbers 1–14, periods of 2.5–20 days, and falling between the Kelvin waves dispersion curves for equivalent depths of 8–90 m [47].
For each wave type, we obtained a time series by averaging the filtered data from 10° S–10° N at 100° E (near Sumatra in the western Maritime Continent). A second time series was created using the time derivative of the first. Both time series were standardized and used to create a phase space analogous to that used in Janiga and Thorncroft [48]. The x-axis was the filtered data, and y-axis was the time tendency (Figure 2). Similar to the RMM, amplitude was calculated as the vector magnitude of the two-time series. Magnitudes less than 1.5-σ were discarded as they were associated with inactive wave states. The remaining dates were categorized based on the relative values of the two-time series into four categories: wet (or enhanced), decreasing, dry (or suppressed), and increasing. The TMPA rainfall estimates were binned using filtered TMPA data, while the IR-WS data were binned by filtered OLR to match its longer period of record.

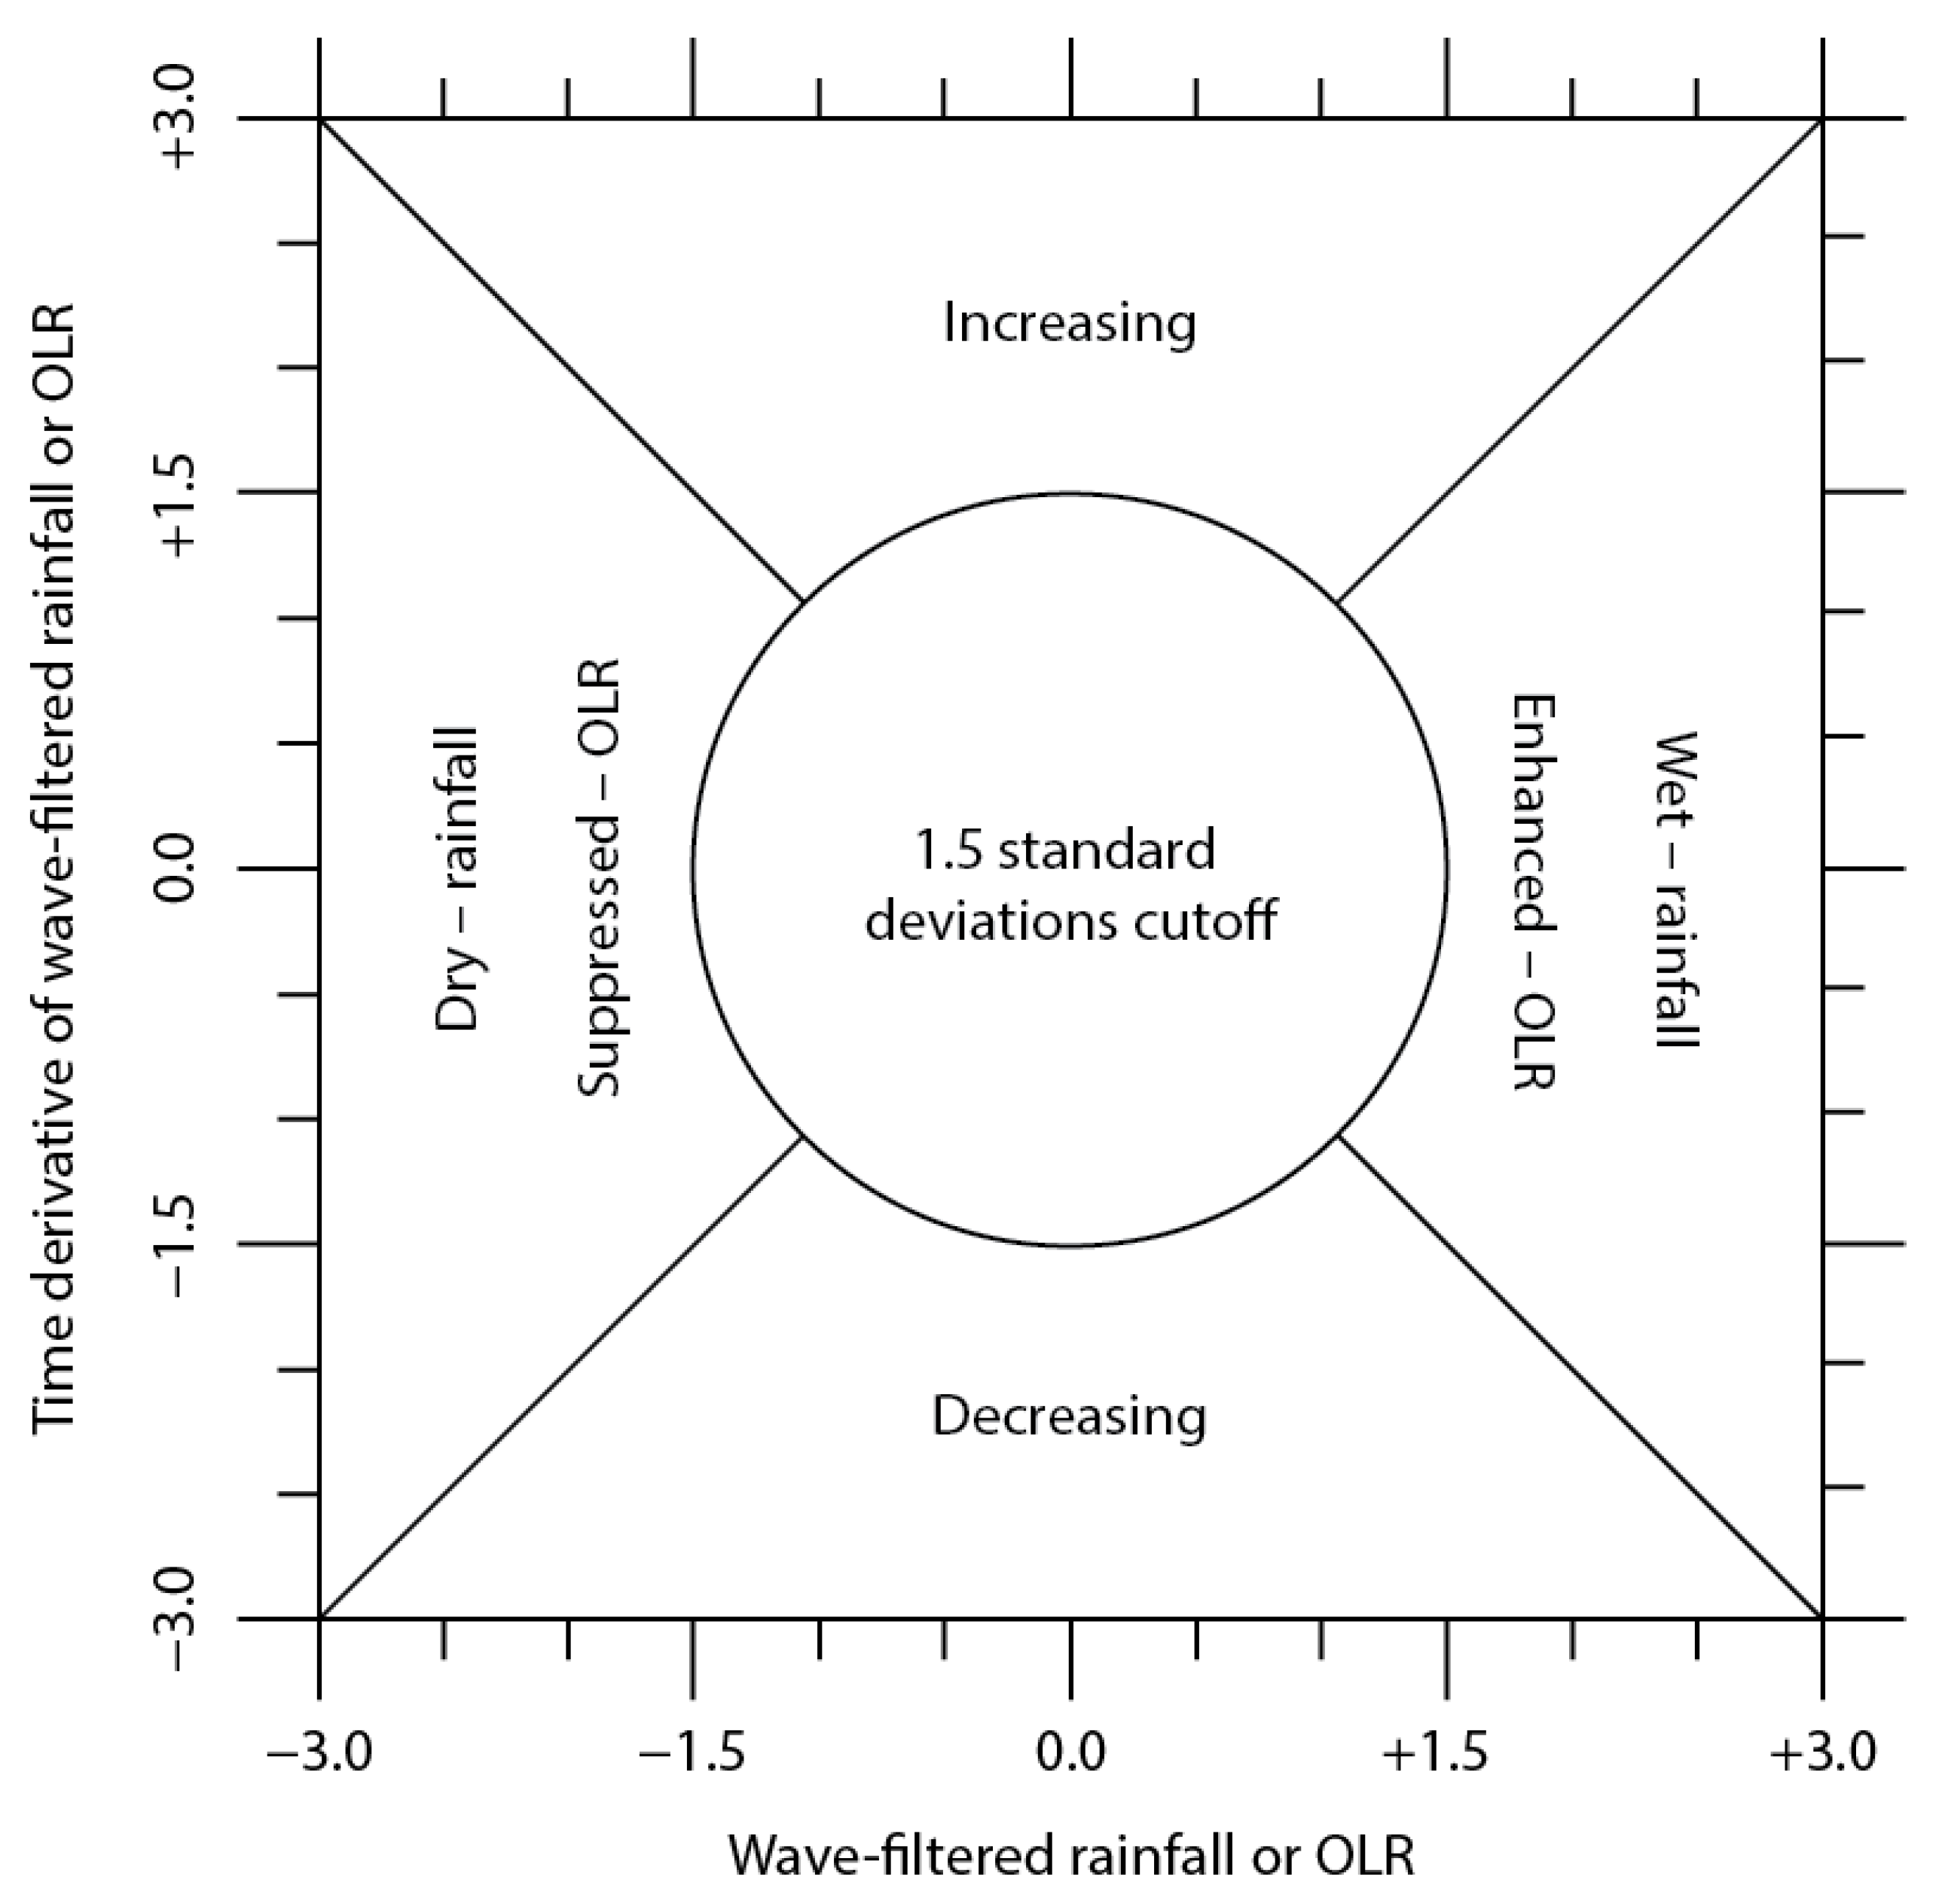
2.2.3. Statistical Analysis

The results are presented in the form of box-and-whisker plots. The samples are constructed by first identifying some subset of times from the data (see Section 2.2.2). For TMPA, the rainfall estimates over our domain are averaged for all points (Figure 1a). For IR-WS, number of pixels categorized in the particular IR-WS (e.g., IR-WS12) are counted and divided by the total number of pixels in the domain (Figure 1b). In each case, these calculations are performed separately for land, coast, and ocean. Once these values are obtained for all times within a given subset, their medians, quartiles, and deciles are used to create the plots. All results are shown only for December–February, since the diurnal cycle is significantly stronger during those months [6].

3. Results

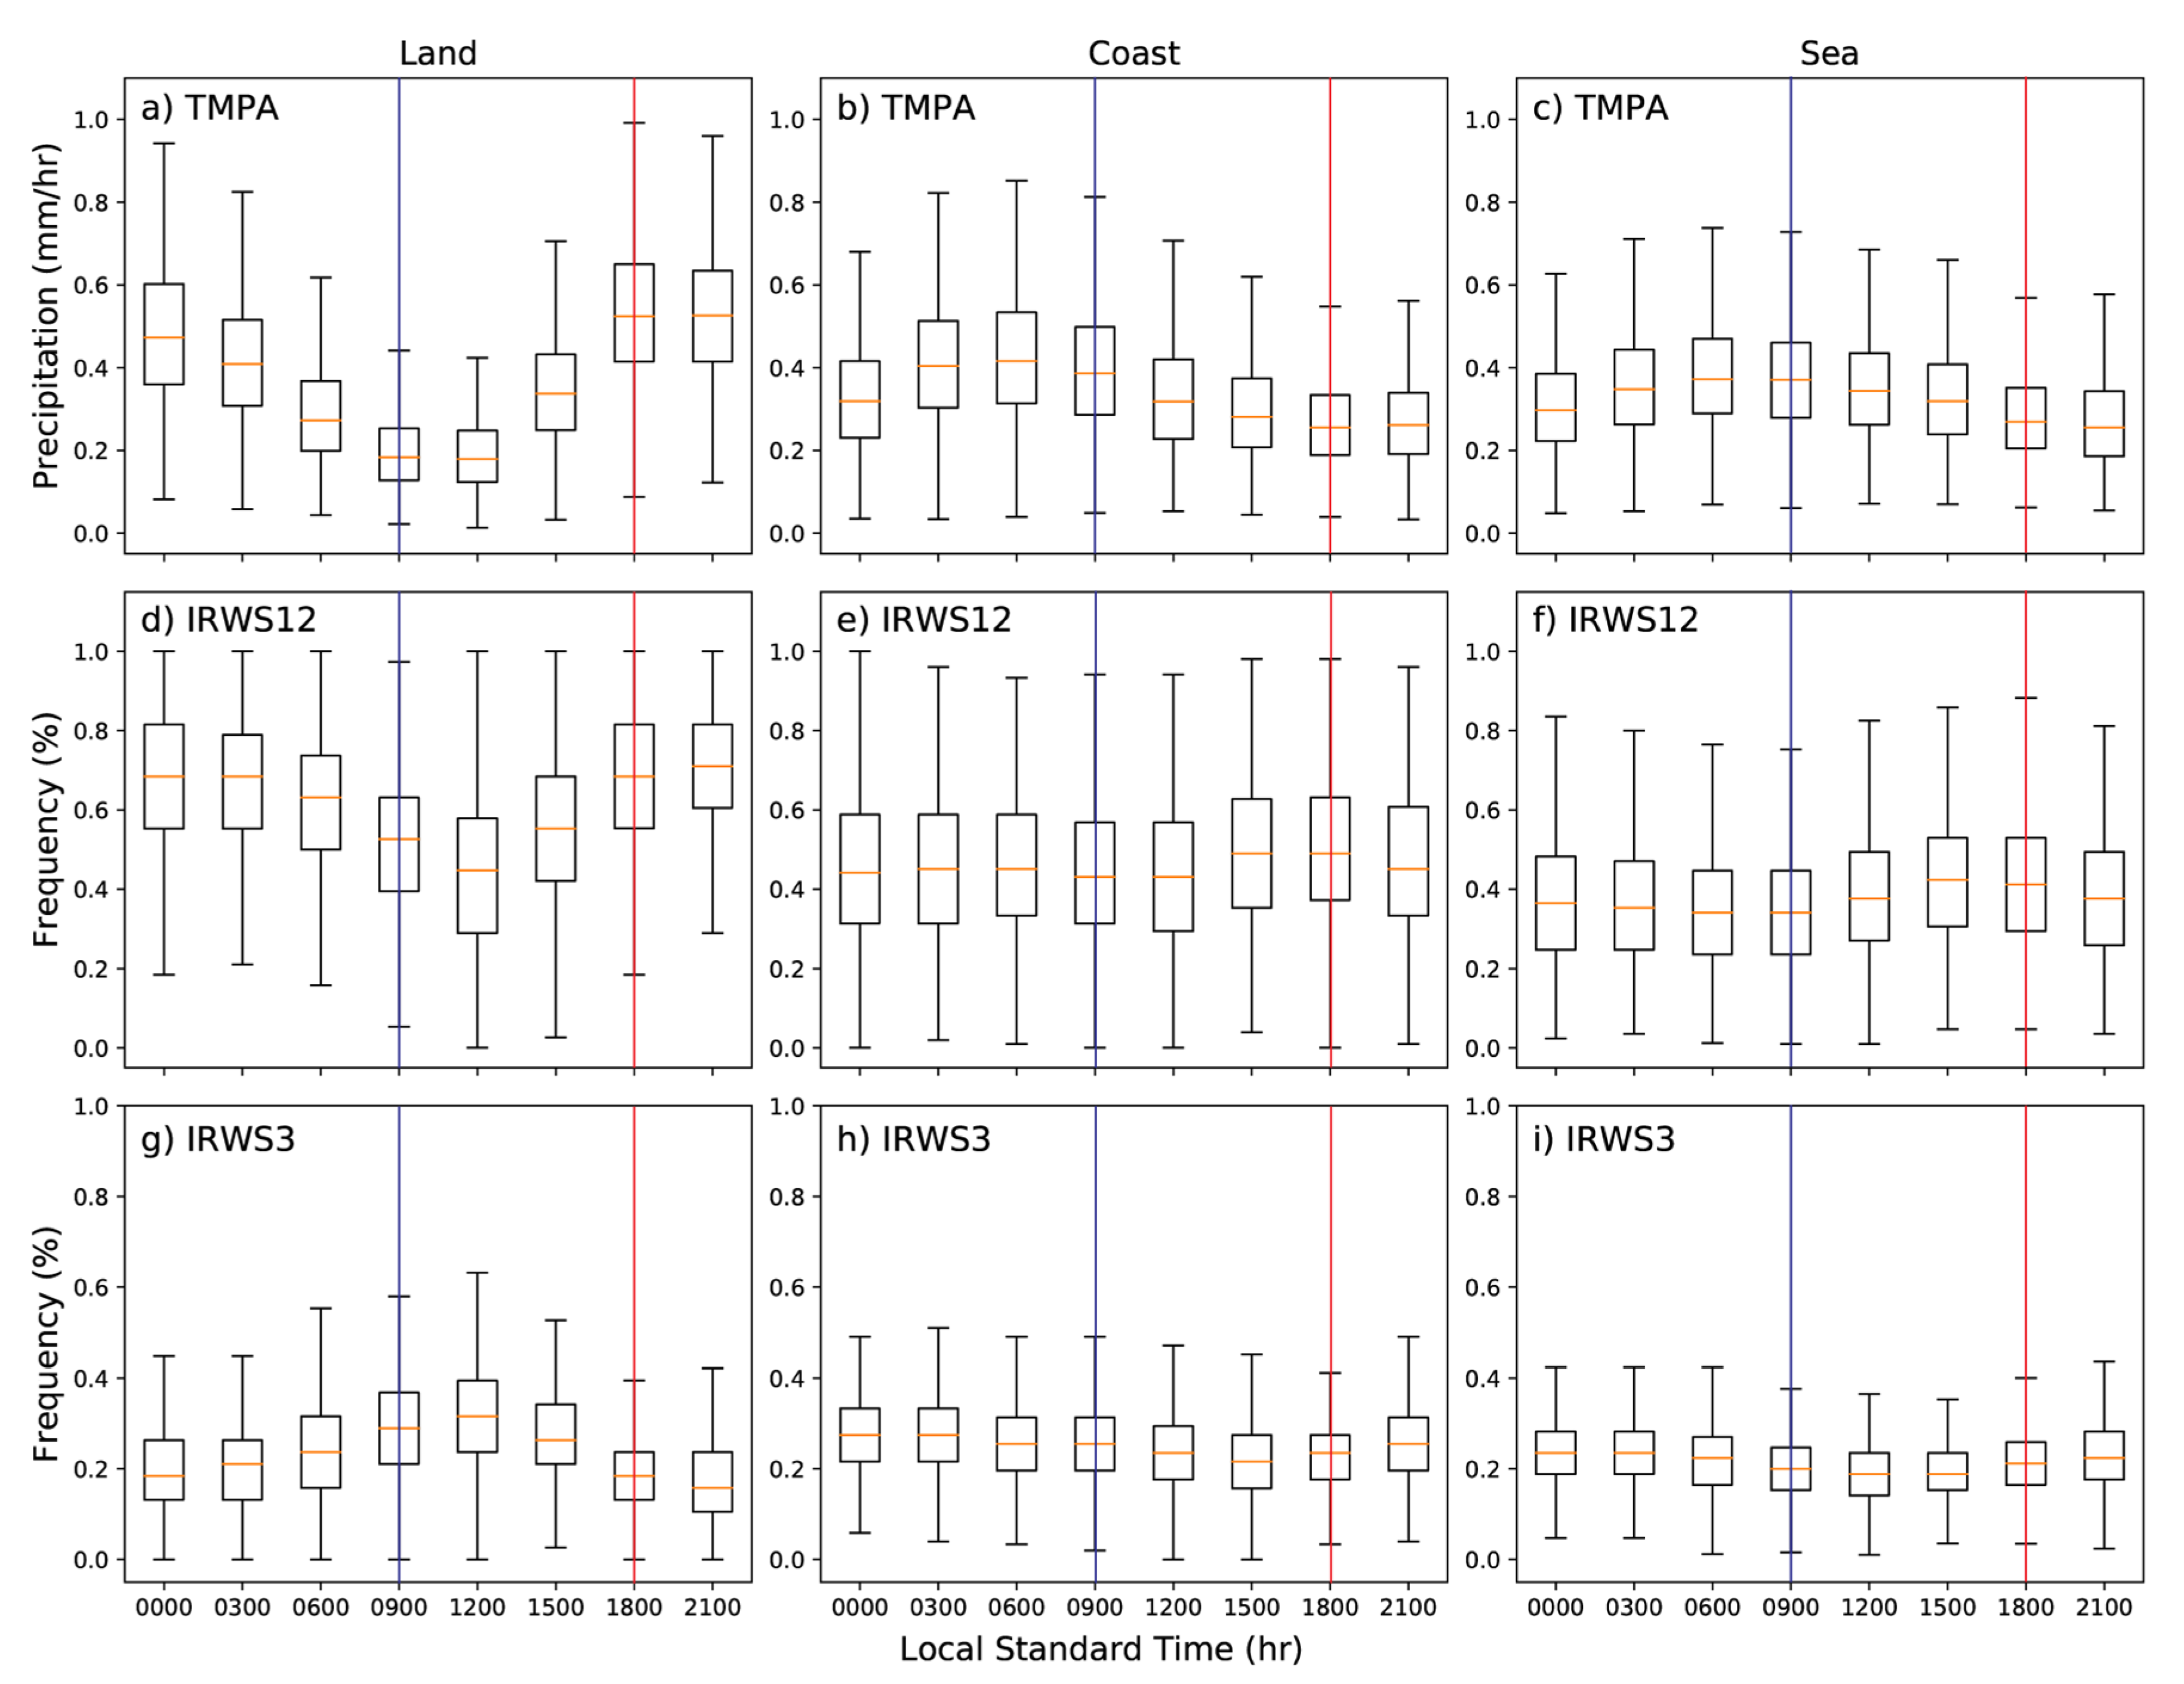
3.1. Diurnal Cycle of Rainfall and Deep Convection

Figure 3 presents box plots of TMPA rainfall, IR-WS12 (MCS type convection and associated thick anvil), and IR-WS3 (scattered deep convection including isolated cumulonimbus clouds) over land, coastal, and ocean areas. Worku et al. [6] showed a similar plot with daily means (their Figure 6). The box plots shown here illustrate the variability between days in these values.
Rainfall over land is minimum between 09:00 and 12:00 LST and maximum between 18:00 and 21:00 LST (Figure 3a). The rainfall distributions during morning–midday and later afternoon–evening are markedly different (e.g., the 25th percentile at 18:00 LST is near the 90th percentile at 09:00 LST). This difference is consistent with the diurnal cycle of total rainfall in Mori et al. [5], although they showed only Sumatra Island for the full year.
The diurnal cycle of organized deep convection (IR-WS12) over land (Figure 3d) closely resembles that for rainfall. For the IR-WSs, these are frequencies of occurrence on each day, so the values are bound from 0 to 1. For almost any time of day, the 90th percentile is near 1 (complete coverage), which means that broad convective events can happen at any time of day. Even so, the quartiles do not overlap between the diurnal maximum at 21:00 LST and the minimum at 12:00 LST.
The diurnal cycle of IR-WS3 over land (Figure 3g) is much less dramatic than the rainfall and IR-WS12. It is also almost exactly out of phase with the others. IR-WS3 peaks near 12:00 LST and reaches its minimum near 21:00 LST. The decline after midday indicates smaller-scale isolated convection (IR-WS3) transitioning or clustering into better organization and larger scales (IR-WS12). Mekonnen and Rossow [37] observed similar evolutions for the deep convection types over Africa. Although some of the rainfall can be associated with scattered convective activity, most of the afternoon rainfall appears to be related to the more well organized and larger-scale deep convection (IR-WS12 [39,41]).
Results for coastal and sea areas (Figure 3, middle and right columns) show much less dramatic variations than land (Figure 3, left column). Median rainfall and the overall distributions over coast and ocean areas are relatively higher between 06:00–09:00 LST and lower around 18:00–21:00 LST (Figure 3b,c). However, the diurnal rainfall range is small and the quartiles for each hour overlap with one another, particularly for the ocean. In contrast to this, Mori et al. [5] (their Figure 3b) show a marked diurnal cycle over the coastal seas of Sumatra. However, here, coast is defined as an area within 50 km of land over the entire Maritime Continent. Mori et al. defined coast as a single 1.5° square area on the western side of the Sumatran island.
Neither IR-WS12 nor IR-WS3 show significant diurnal cycles over coast or sea (Figure 3e,f,h,i). IR-WS12 is slightly higher at 15:00 LST and 18:00 LST, but the median frequencies remain well within the quartile ranges for other times of day. Similarly, IR-WS3 is slightly more frequent around 03:00 LST and least frequent around 15:00 LST. In this case, the median of the peak is near the upper quartile of the minimum and vice versa. Weak though it is, this diurnal cycle of IR-WS3 roughly follows that of rainfall (Figure 3b,c), which suggests that isolated convection may be more important in these regions.
To sum, peak rainfall and well-organized deep convection over land occurs in the afternoon around 18:00 LST, while minimum activities occur around 09:00 LST. Over coastal and ocean areas, although much weaker, higher rainfall is observed during the early hours and minimum occurs in the afternoon. For the remainder of the paper, we will focus on 09:00 LST and 18:00 LST as a proxy for diurnal range as we investigate the influence of the MJO and equatorial waves.

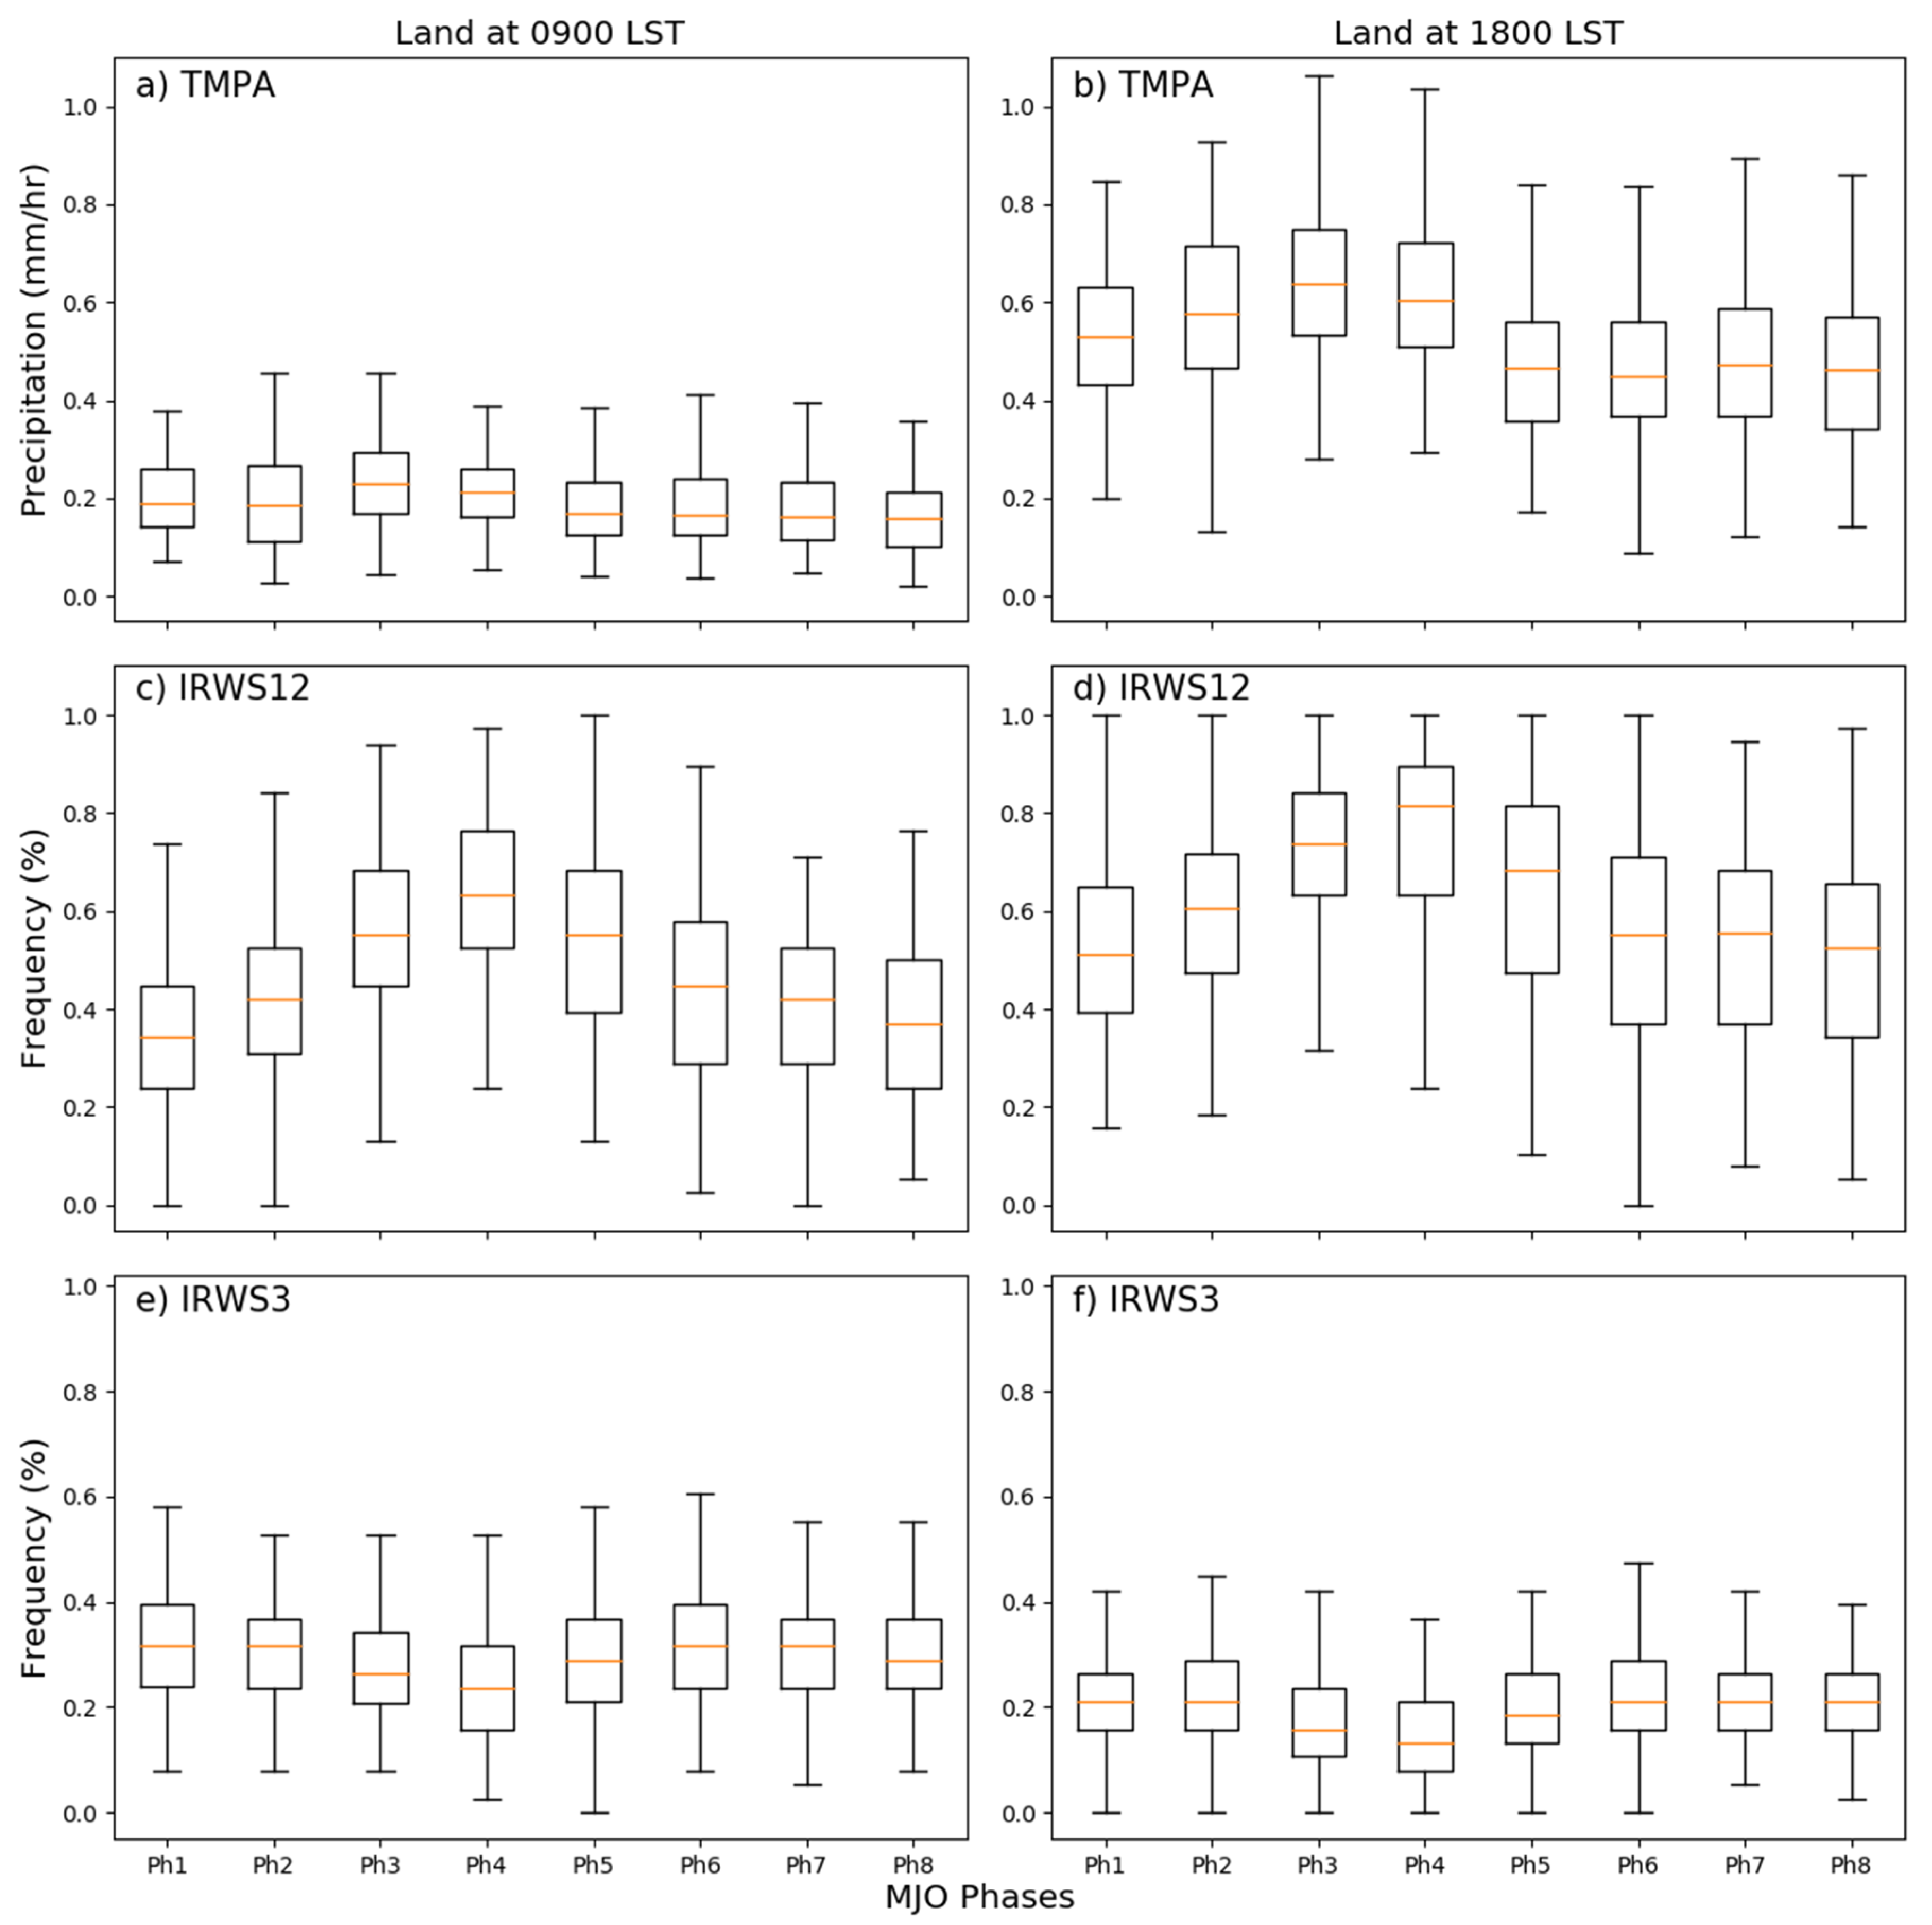
3.2. Variations Diurnal Cycle with the MJO

Figure 4, Figure 5 and Figure 6 present the DJF rainfall and IR-WS during the eight RMM phases at 09:00 LST and 18:00 LST, separately, for land, coast, and ocean areas. Over land, rainfall is heaviest is phase 3, closely followed by phase 4, and is smallest during phases 5–8. The morning median rainfall (Figure 4a) is small (median ~0.2 mm·h−1) during all phases. Despite the small range of values, the rainfall in the enhanced phases (3–4) is about 40% higher than during the suppressed phases (5–8). Even though the absolute difference is less than 0.05 mm·h−1, the median rainfall during the enhanced phases would be at the upper quartile of the suppressed phases. The afternoon rainfall (Figure 4d) has a similar fractional modulation with the median for the enhanced phases, being about 30% higher than the suppressed. However, the rainfall is more than twice as high in the afternoon than the morning, so the observed median rainfall is 0.2 mm·h−1 higher during the enhanced phase than the suppressed.
Figure 4b,e shows the distribution of IR-WS12 with respect to MJO phases over land at both times of day. The overall evolution is similar to but somewhat delayed from rainfall. IR-WS12 has a clear maximum in phase 4 and a minimum in phases 8–1. Unlike rainfall, the modulation of IR-WS12 by the MJO is similar in both the morning and the afternoon. The IR-WS data are measured as the frequency of occurrence, so they cannot exceed 100%. At 18:00 LST (Figure 4e), the 90th percentile is near 100% IR-WS12 for all phases except 7 and 8. During the peak of the MJO, even the 75th percentile is near 90% IR-WS12. These large percentages mean that the IR-WS12 is so prevalent at 18:00 that the enhanced MJO phases can only increase them so much.
IR-WS3 is less frequent than IR-WS12 at all times of day (Figure 4c,f). Even so, the MJO significantly decreases the amount of IR-WS3 during the enhanced phase (3–5). During these phases, the frequency of IR-WS3 is about 25% less at 0900 LST and about 40% less at 18:00 LST. This pattern is consistent with the diurnal cycle itself where IR-WS3 is in an opposite phase compared with rainfall and IR-WS12.
The diurnal cycle is much weaker over coastal and sea areas, so the MJO’s modulation of rainfall is similar at both times of day in these regions (Figure 5a,d and Figure 6a,d). Over both regions and both times of day, the rainfall is more than 50% higher during its peak in phase 4 than at its minimum in phase 8 (Figure 5a,d and Figure 6a,d). Rainfall is higher in the morning than the afternoon (consistent with Figure 3) regardless of MJO phase, but they both go up and down together with the MJO. IR-WS12 shows very similar patterns to the MJO phase as rainfall, but the differences between morning and evening are smaller (Figure 5b,e and Figure 6b,e). IR-WS3 shows little dependence on the MJO over either region or time of day.

3.3. Comparing Kelvin and ER Waves with the MJO

Figure 7, Figure 8 and Figure 9 compare the modulation of rainfall and convection at 18:00 LST between the MJO, Kelvin waves, and ER waves. We focus on 18:00 LST, since the MJO had the most consistent impact during that time of day (Figure 4, Figure 5 and Figure 6). Similar figures for 09:00 LST (not shown) had similar patterns to those at 18:00 LST. The only difference was that, as with the RMM (Figure 4, Figure 5 and Figure 6), the 09:00 LST values were shifted by the diurnal cycle. The phases are identified as in Figure 2 based on filtered rainfall or OLR at 100° E averaged 10° S–10° N. This time series and its first derivative are used to categorize the waves into four phases based on the relative amplitudes of the time series and its tendency: wet/enhanced, decreasing, dry/suppressed, and increasing (Figure 2). All times in which the combined amplitude is greater than 1.5 standard deviations (circle in Figure 2) are used.
The MJO modulations over land (Figure 7a,d,g) are consistent but larger than with the RMM phases (Figure 4d–f). The median rainfall is more than twice as high during the wet phase than during the dry phase. Similar to with the RMM phases, the rainfall is strongly reduced in the decreasing phase as well, which suggests that the enhanced rainfall ends suddenly as the MJO’s convective envelope moves eastward. As with rainfall, the IR-WS patterns in Figure 7 are consistent but larger than those in Figure 4. Perhaps most notable is that the decrease of IR-WS3 during the enhanced phase of the MJO is even stronger when using the filtered OLR index.
The larger signals in Figure 7 than in Figure 4 likely arise for several reasons. Figure 7 uses a smaller domain (90° E–110° E in Figure 7 compared with 90° E–170° E in Figure 4), which will reduce the noise in the sample. Figure 7 also uses a local MJO index instead of the global RMM [25], so it can be expected to be more closely related to local variations in convection. Finally, we used a higher event threshold: 1.5 standard deviations for the local index compared with the 1.0 typically used for the RMM.
The modulation of rainfall and convection by Kelvin and ER waves over land (Figure 7b–i) is similar to that of the MJO. The primary differences are that the enhanced/wet phase is slightly weaker for both waves. They also have more rainfall and particularly IR-WS12 convection during their decreasing phases than the MJO. The modulation of IR-WS3 by Kelvin waves is similar to that by the MJO. ER waves, on the other hand, show the opposite pattern with more IR-WS3 during the enhanced phase and less in the suppressed.
The modulations of afternoon convection over the coastal regions (Figure 8) are similar to those over land (Figure 7). The rainfall rates are lower over the coastal regions (Figure 8), but the relative modulation closely follows that over land. As with the RMM (Figure 5c,f), the MJO and equatorial waves have no consistent effect on IR-WS3 over the coasts (Figure 8g–i). The other notable difference is that for ER waves the rainfall over the coast is the same between the enhance/wet phase and the decreasing phase. Similarly, IR-WS12 is actually higher during the decreasing phase. The convective variability over the sea (Figure 9) is also similar to that over the coasts. Interestingly, the relative modulation of both rainfall and IR-WS12 is largest over the sea (Figure 9), while it is smallest over the coasts (Figure 8).

4. Conclusions

This study examined modulations of the diurnal cycle of rainfall and convection over the Maritime Continent by the MJO and equatorial waves. The MJO exerts its largest absolute modulation of rainfall over land and during the afternoon when the precipitation is heaviest. During the enhanced phase of the MJO, this rainy part of the diurnal cycle gets about 30% wetter, consistent with Peatman et al. [9]. The fractional impact on the diurnal minimum is actually larger (~40%), but the observed change in rainfall is smaller due to the lower observed rates. Rainfall rates are generally lower over the coasts and seas, regardless of time of day, but the fractional impact of the MJO is greater in these regions. However, the diurnal cycle is also weaker in these regions, so the MJO has less impact on the diurnal variability.
The MJO’s modulation of organized large-scale convection (IR-WS12) was also more uniform throughout times of days and regions. The most notable variation was that IR-WS12 over ocean peaks about one RMM phase later than it does over land or coast. This difference likely reflects the geography in our analysis region. Land is more common in the western half of the domain (including Java and Borneo), while ocean is more common in the eastern half (north and east of Papua New Guinea). As the MJO moves eastward, its enhanced convection will encompass more of that eastern ocean.
Scattered deep convection (IR-WS3) primarily was modulated by the MJO over land. It is out of phase with rainfall and organized deep convection (IR-WS12). IR-WS3 is inhibited over land during the enhanced phase of the MJO. The more favorable environment during the enhanced phase of the MJO promotes the growth of more organized modes of convection, which naturally reduces the amount of isolated convection. Conversely, during the dry phase of the MJO, the remaining deep convective cells lack a favorable environment to grow and organize. This pattern is consistent with other studies [49,50] that found isolated convection was always present and could actually be more common during the MJO suppressed phase. The enhanced phase of the MJO allows these cells to grow, organize, and produce more precipitation through their associated broad stratiform regions [51].
Many studies have examined the interactions of the MJO and the diurnal cycles of rainfall and convection. This study uniquely expanded that research to examine convectively coupled Kelvin and ER waves. The modulation of rainfall and convection by Kelvin waves closely mirrored that of the MJO. This similarity is consistent with the MJO and Kelvin waves existing on a continuum of disturbances and individual events evolving between the two disturbance types [52,53,54]. One notable difference was that the increase in rainfall and IR-WS12 from Kelvin waves extended from the enhanced/wet phase into the decreasing phase. In contrast, the MJO showed a more rapid decline between these two phases. That difference likely relates to the larger temporal and spatial scale of the MJO, which may produce a clearer distinction between phases.
ER waves were broadly similar to Kelvin waves and the MJO, but the ER wave signals were not as distinct. The difference between the enhanced/wet phase and the decreasing phase were even smaller or sometimes reversed for ER waves. The modulation of IR-WS3 over land was also opposite for ER waves, compared to the MJO and Kelvin waves. For ER waves, the IR-WS3 is more in phase with the rainfall and the IR-WS12.
Future studies should continue to investigate the modulations of rainfall and convection by equatorial waves to understand how they compare with the MJO and how they might affect the wave dynamics. Examining how these modulations vary by MJO phase could also provide insight into the MJO’s hierarchy of convection. An improved understanding of these interactions could be critical to helping numerical models harness more of the potential subseasonal forecast skill from these waves [23].
Finally, past studies [13,14,17] have suggested that the strong diurnal cycle over land in the Maritime Continent plays a key role in slowing the MJO’s propagation there. The magnitude of the diurnal cycle is larger over land than coastal or sea region. However, the relative impact of the MJO on rainfall and organized convection is greatest over the ocean and smallest over land. More observational and modeling studies are needed to fully understand these complex interactions.

Author Contributions

A.M. contributed to the project administration, supervision, and writing. L.Y.W. was responsible for the investigation and visualization. C.J.S.III provided conceptualization, funding acquisition, and writing. All authors have read and agreed to the published version of the manuscript.

Funding

This research was funded by NASA grant number NNX16AE33G, by NOAA through the Cooperative Institute for Climate and Satellites, North Carolina, under Cooperative Agreement NA14NES432003, and by NSF grant number AGS-146911.

Acknowledgments

IR-WS data were obtained from the Earth System Sciences and Remote Sensing Technologies Center at The City College of New York (https://www.noaacrest.org/rscg/Products/WS/tircluster.html). The NAVOEANO land-sea mask data were obtained from the Group of High Resolution Sea Surface Temperature (https://www.ghrsst.org/ghrsst-data-services/tools/). We are also grateful to the reviewers for their significant insights on this paper.

Conflicts of Interest

The authors declare no conflict of interest.

References

  1. Ramage, C.S. Role of a tropical “maritime continent” in the atmospheric circulation. Mon. Weather Rev. 1968, 96, 365–370. [Google Scholar] [CrossRef] [Green Version]
  2. Yang, G.-Y.; Slingo, J. The diurnal cycle in the Tropics. Mon. Weather Rev. 2001, 129, 784–801. [Google Scholar] [CrossRef]
  3. Lin, X.; Randall, D.A.; Fowler, L.D. Diurnal Variability of the Hydrologic Cycle and Radiative Fluxes: Comparisons between Observations and a GCM. J. Clim. 2000, 13, 4159–4179. [Google Scholar] [CrossRef] [Green Version]
  4. Houze, R.A.; Geotis, S.G.; Marks, F.D.; West, A.K. Winter Monsoon Convection in the Vicinity of North Borneo. Part I: Structure and Time Variation of the Clouds and Precipitation. Mon. Weather Rev. 1981, 109, 1595–1614. [Google Scholar] [CrossRef] [Green Version]
  5. Mori, S.; Jun-Ichi, H.; Tauhid, Y.I.; Yamanaka, M.D.; Okamoto, N.; Murata, F.; Sakurai, N.; Hashiguchi, H.; Sribimawati, T. Diurnal Land–Sea Rainfall Peak Migration over Sumatera Island, Indonesian Maritime Continent, Observed by TRMM Satellite and Intensive Rawinsonde Soundings. Mon. Weather Rev. 2004, 132, 2021–2039. [Google Scholar] [CrossRef]
  6. Worku, L.Y.; Mekonnen, A.; Schreck, C.J. Diurnal cycle of rainfall and convection over the Maritime Continent using TRMM and ISCCP. Int. J. Climatol. 2019, 39, 5191–5200. [Google Scholar] [CrossRef]
  7. Lu, J.; Li, T.; Wang, L. Precipitation diurnal cycle over the Maritime Continent modulated by the MJO. Clim. Dyn. 2019, 53, 6489–6501. [Google Scholar] [CrossRef]
  8. Hagos, S.M.; Zhang, C.; Feng, Z.; Burleyson, C.D.; Mott, C.D.; Kerns, B.; Benedict, J.J.; Martini, M.N. The impact of the diurnal cycle on the propagation of Madden-Julian Oscillation convection across the Maritime Continent. J. Adv. Model. Earth Syst. 2016, 8, 1552–1564. [Google Scholar] [CrossRef] [Green Version]
  9. Peatman, S.C.; Matthews, A.J.; Stevens, D.P. Propagation of the Madden–Julian Oscillation through the Maritime Continent and scale interaction with the diurnal cycle of precipitation. Q. J. R. Meteorol. Soc. 2014, 140, 814–825. [Google Scholar] [CrossRef]
  10. Wheeler, M.C.; Hendon, H.H. An all-season real-time multivariate MJO index: Development of an index for monitoring and prediction. Mon. Weather Rev. 2004, 132, 1917–1932. [Google Scholar] [CrossRef]
  11. Zhang, C. Madden-Julian Oscillation: Bridging Weather and Climate. Bull. Am. Meteorol. Soc. 2013, 94, 1849–1870. [Google Scholar] [CrossRef]
  12. Zhang, C. Madden-Julian oscillation. Rev. Geophys. 2005, 43, RG2003. [Google Scholar] [CrossRef] [Green Version]
  13. Inness, P.M.; Slingo, J.M. The interaction of the Madden–Julian Oscillation with the Maritime Continent in a GCM. Q. J. R. Meteorol. Soc. 2006, 132, 1645–1667. [Google Scholar] [CrossRef]
  14. Wu, C.-H.; Hsu, H.-H. Topographic Influence on the MJO in the Maritime Continent. J. Clim. 2009, 22, 5433–5448. [Google Scholar] [CrossRef]
  15. Wilson, E.A.; Gordon, A.L.; Kim, D. Observations of the Madden Julian Oscillation during Indian Ocean Dipole events. J. Geophys. Res. Atmos. 2013, 118, 2588–2599. [Google Scholar] [CrossRef]
  16. Neale, R.; Slingo, J. The Maritime Continent and Its Role in the Global Climate: A GCM Study. J. Clim. 2003, 16, 834–848. [Google Scholar] [CrossRef]
  17. Zhang, C.; Ling, J. Barrier Effect of the Indo-Pacific Maritime Continent on the MJO: Perspectives from Tracking MJO Precipitation. J. Clim. 2017, 30, 3439–3459. [Google Scholar] [CrossRef]
  18. Williams, M.; Houze, R.A. Satellite-Observed Characteristics of Winter Monsoon Cloud Clusters. Mon. Weather Rev. 1987, 115, 505–519. [Google Scholar] [CrossRef] [Green Version]
  19. Nesbitt, S.W.; Zipser, E.J. The Diurnal Cycle of Rainfall and Convective Intensity according to Three Years of TRMM Measurements. J. Clim. 2003, 16, 1456–1475. [Google Scholar] [CrossRef] [Green Version]
  20. Sobel, A.H.; Burleyson, C.D.; Yuter, S.E. Rain on small tropical islands. J. Geophys. Res. 2011, 116, D08102. [Google Scholar] [CrossRef] [Green Version]
  21. Weaver, S.J.; Wang, W.; Chen, M.; Kumar, A. Representation of MJO variability in the NCEP climate forecast system. J. Clim. 2011, 24, 4676–4694. [Google Scholar] [CrossRef]
  22. Janiga, M.A.; Schreck, C.J.; Ridout, J.A.; Flatau, M.; Barton, N.P.; Metzger, E.J.; Reynolds, C.A. Subseasonal Forecasts of Convectively Coupled Equatorial Waves and the MJO: Activity and Predictive Skill. Mon. Weather Rev. 2018, 146, 2337–2360. [Google Scholar] [CrossRef] [Green Version]
  23. Schreck, C.J.; Janiga, M.A.; Baxter, S. Sources of Tropical Subseasonal Skill in the CFSv2. Mon. Weather Rev. 2020, 148, 1553–1565. [Google Scholar] [CrossRef]
  24. Gottschalck, J.; Wheeler, M.; Weickmann, K.; Vitart, F.; Savage, N.; Lin, H.; Hendon, H.; Waliser, D.; Sperber, K.; Nakagawa, M.; et al. A framework for assessing operational Madden–Julian Oscillation forecasts: A CLIVAR MJO working group project. Bull. Am. Meteorol. Soc. 2010, 91, 1247–1258. [Google Scholar] [CrossRef] [Green Version]
  25. Gottschalck, J.; Roundy, P.E.; Schreck III, C.J.; Vintzileos, A.; Zhang, C. Large-scale atmospheric and oceanic conditions during the 2011–12 DYNAMO field campaign. Mon. Weather Rev. 2013, 141, 4173–4196. [Google Scholar] [CrossRef]
  26. Hamill, T.M.; Kiladis, G.N. Skill of the MJO and Northern Hemisphere Blocking in GEFS Medium-Range Reforecasts. Mon. Weather Rev. 2014, 142, 868–885. [Google Scholar] [CrossRef]
  27. Oliver, E.C.J.; Thompson, K.R. Predictability of the Madden–Julian Oscillation index: Seasonality and dependence on MJO phase. Clim. Dyn. 2015, 46, 159–176. [Google Scholar] [CrossRef]
  28. Birch, C.E.; Webster, S.; Peatman, S.C.; Parker, D.J.; Matthews, A.J.; Li, Y.; Hassim, M.E.E. Scale Interactions between the MJO and the Western Maritime Continent. J. Clim. 2016, 29, 2471–2492. [Google Scholar] [CrossRef] [Green Version]
  29. Inness, P.M.; Slingo, J.M. Simulation of the Madden–Julian Oscillation in a Coupled General Circulation Model. Part I: Comparison with Observations and an Atmosphere-Only GCM. J. Clim. 2003, 16, 345–364. [Google Scholar] [CrossRef]
  30. Kiladis, G.N.; Wheeler, M.C.; Haertel, P.T.; Straub, K.H.; Roundy, P.E. Convectively coupled equatorial waves. Rev. Geophys. 2009, 47, RG2003. [Google Scholar] [CrossRef]
  31. Nakazawa, T. Tropical super clusters within intraseasonal variations over the western Pacific. J. Meteorol. Soc. Jpn. 1988, 66, 823–839. [Google Scholar] [CrossRef] [Green Version]
  32. Straub, K.H.; Kiladis, G.N. Interactions between the boreal summer intraseasonal oscillation and higher-frequency tropical wave activity. Mon. Weather Rev. 2003, 131, 945–960. [Google Scholar] [CrossRef]
  33. Kikuchi, K.; Kiladis, G.N.; Dias, J.; Nasuno, T. Convectively coupled equatorial waves within the MJO during CINDY/DYNAMO: Slow Kelvin waves as building blocks. Clim. Dyn. 2018, 50, 4211–4230. [Google Scholar] [CrossRef]
  34. Guo, Y.; Waliser, D.E.; Jiang, X. A Systematic Relationship between the Representations of Convectively Coupled Equatorial Wave Activity and the Madden–Julian Oscillation in Climate Model Simulations. J. Clim. 2014, 28, 1881–1904. [Google Scholar] [CrossRef] [Green Version]
  35. Mekonnen, A.; Rossow, W.B. The Interaction Between Deep Convection and Easterly Waves over Tropical North Africa: A Weather State Perspective. J. Clim. 2011, 24, 4276–4294. [Google Scholar] [CrossRef]
  36. Rossow, W.B.; Mekonnen, A.; Pearl, C.; Goncalves, W. Tropical Precipitation Extremes. J. Clim. 2013, 26, 1457–1466. [Google Scholar] [CrossRef] [Green Version]
  37. Mekonnen, A.; Rossow, W.B. The Interaction between Deep Convection and Easterly Wave Activity over Africa: Convective Transitions and Mechanisms. Mon. Weather Rev. 2018, 146, 1945–1961. [Google Scholar] [CrossRef]
  38. Huffman, G.J.; Adler, R.F.; Bolvin, D.T.; Gu, G.; Nelkin, E.J.; Bowman, K.P.; Hong, Y.; Stocker, E.F.; Wolff, D.B. The TRMM multisatellite precipitation analysis (TMPA): Quasi-global, multiyear, combined-sensor precipitation estimates at fine scales. J. Hydrometeorol. 2007, 8, 38–55. [Google Scholar] [CrossRef]
  39. Anderberg, M.R. Cluster Analysis for Applications; Elsevier: Amsterdam, The Netherlands, 1973. [Google Scholar]
  40. Jakob, C.; Tselioudis, G. Objective identification of cloud regimes in the Tropical Western Pacific. Geophys. Res. Lett. 2003, 30, 2082. [Google Scholar] [CrossRef] [Green Version]
  41. Rossow, W.B.; Tselioudis, G.; Polak, A.; Jakob, C. Tropical climate described as a distribution of weather states indicated by distinct mesoscale cloud property mixtures. Geophys. Res. Lett. 2005, 32, L21812. [Google Scholar] [CrossRef] [Green Version]
  42. Rossow, W.B.; Schiffer, R.A. Advances in Understanding Clouds from ISCCP. Bull. Am. Meteorol. Soc. 1999, 80, 2261–2287. [Google Scholar] [CrossRef] [Green Version]
  43. Tan, J.; Jakob, C.; Lane, T.P. On the Identification of the Large-Scale Properties of Tropical Convection Using Cloud Regimes. J. Clim. 2013, 26, 6618–6632. [Google Scholar] [CrossRef]
  44. Tan, J.; Jakob, C. A three-hourly data set of the state of tropical convection based on cloud regimes. Geophys. Res. Lett. 2013, 40, 1415–1419. [Google Scholar] [CrossRef]
  45. Schreck, C.J.; Lee, H.-T.; Knapp, K.R. HIRS Outgoing Longwave Radiation—Daily Climate Data Record: Application toward Identifying Tropical Subseasonal Variability. Remote Sens. 2018, 10, 1325. [Google Scholar] [CrossRef] [Green Version]
  46. Kiladis, G.N.; Straub, K.H.; Haertel, P.T. Zonal and vertical structure of the Madden–Julian oscillation. J. Atmos. Sci. 2005, 62, 2790–2809. [Google Scholar] [CrossRef]
  47. Straub, K.H.; Kiladis, G.N. Observations of a convectively coupled Kelvin wave in the eastern Pacific ITCZ. J. Atmos. Sci. 2002, 59, 30–53. [Google Scholar] [CrossRef]
  48. Janiga, M.A.; Thorncroft, C.D. The Influence of African Easterly Waves on Convection over Tropical Africa and the East Atlantic. Mon. Weather Rev. 2016, 144, 171–192. [Google Scholar] [CrossRef]
  49. Barnes, H.C.; Houze, R.A. The precipitating cloud population of the Madden-Julian Oscillation over the Indian and west Pacific Oceans. J. Geophys. Res. Atmos. 2013, 118, 6996–7023. [Google Scholar] [CrossRef]
  50. Powell, S.W.; Houze, R.A. The cloud population and onset of the Madden-Julian Oscillation over the Indian Ocean during DYNAMO-AMIE. J. Geophys. Res. Atmos. 2013, 118, 979–995. [Google Scholar] [CrossRef]
  51. Tromeur, E.; Rossow, W.B. Interaction of Tropical Deep Convection with the Large-Scale Circulation in the MJO. J. Clim. 2010, 23, 1837–1853. [Google Scholar] [CrossRef]
  52. Roundy, P.E. Observed Structure of Convectively Coupled Waves as a Function of Equivalent Depth: Kelvin waves and the Madden Julian Oscillation. J. Atmos. Sci. 2012, 69, 2097–2106. [Google Scholar] [CrossRef]
  53. Roundy, P.E. The Spectrum of Convectively Coupled Kelvin Waves and the Madden–Julian Oscillation in Regions of Low-Level Easterly and Westerly Background Flow. J. Atmos. Sci. 2012, 69, 2107–2111. [Google Scholar] [CrossRef]
  54. Sobel, A.H.; Kim, D. The MJO-Kelvin wave transition. Geophys. Res. Lett. 2012, 39, L20808. [Google Scholar] [CrossRef]
Figure 1. Land-Sea mask for (a) Tropical Rainfall Measuring Mission (TRMM) and (b) International Satellite Cloud Climatology Project (ISCCP) (Orange = Land, Blue = Coast, and Gray = Ocean). Adapted from Worku et al. [6].
Atmosphere 11 00711 g001
Figure 2. Schematic illustrating the equatorial wave phase bins.
Atmosphere 11 00711 g002
Figure 3. Diurnal cycle of TMPA rainfall (top row), IR-WS12 (middle row), and IR-WS3 (bottom row) over the Maritime Continent. Blue and red lines denote the morning (09:00 LST) and afternoon (18:00 LST) times that will be used in subsequent figures. Boxes represent the median and quartiles. Whiskers represent the 10th percentile and 90th percentiles.
Atmosphere 11 00711 g003
Figure 4. Variation of TMPA rainfall (top row), IR-WS12 (middle row), and IR-WS3 (bottom row) at 09:00 (left column) and 18:00 LST (right column) over land with respect to Madden–Julian Oscillation (MJO) phase. Boxes represent the median and quartiles. Whiskers represent the 10th and 90th percentiles.
Atmosphere 11 00711 g004
Figure 5. Variation of TMPA rainfall (top row), IR-WS12 (middle row), and IR-WS3 (bottom row) at 09:00 (left column) and 18:00 LST (right column) over coasts with respect to Madden–Julian Oscillation (MJO) phase. Boxes represent the median and quartiles. Whiskers represent the 10th and 90th percentiles.
Atmosphere 11 00711 g005
Figure 6. Variation of TMPA rainfall (top row), IR-WS12 (middle row), and IR-WS3 (bottom row) at 09:00 (left column) and 18:00 LST (right column) over sea with respect to Madden–Julian Oscillation (MJO) phase. Boxes represent the median and quartiles. Whiskers represent the 10th and 90th percentiles.
Atmosphere 11 00711 g006aAtmosphere 11 00711 g006b
Figure 7. The influences of MJO (left column), Kelvin wave (center column), and Equatorial Rossby (ER) waves (right column) over land from 90° E–110° E at different phases at 18:00 LST for TMPA rainfall (top row), IR-WS12 (middle row), and IR-WS3 (bottom row).
Atmosphere 11 00711 g007
Figure 8. The influences of MJO (left column), Kelvin wave (center column), and Equatorial Rossby (ER) waves (right column) over coasts from 90° E–110° E at different phases at 18:00 LST for TMPA rainfall (top row), IR-WS12 (middle row), and IR-WS3 (bottom row).
Atmosphere 11 00711 g008
Figure 9. The influences of MJO (left column), Kelvin wave (center column), and Equatorial Rossby (ER) waves (right column) over sea from 90° E–110° E at different phases at 18:00 LST for TMPA rainfall (top row), IR-WS12 (middle row), and IR-WS3 (bottom row).
Atmosphere 11 00711 g009

