Article

Potential Respiratory Deposition and Species Composition of Airborne Culturable, Viable, and Non-Viable Fungi during Occupancy in a Pig Farm

by
John Kerr White
1,2,
Jeppe Lund Nielsen
2 and
Anne Mette Madsen
1,*
1
The National Research Centre for the Working Environment, Lersø Parkallé 105, 2100 Copenhagen Ø, Denmark
2
Department of Chemistry and Bioscience, Aalborg University, Fredrik Bajers Vej 7H, 9220 Aalborg Ø, Denmark
*
Author to whom correspondence should be addressed.
Atmosphere 2020, 11(6), 639; https://doi.org/10.3390/atmos11060639
Submission received: 20 May 2020 / Revised: 12 June 2020 / Accepted: 12 June 2020 / Published: 16 June 2020
(This article belongs to the Special Issue Bioaerosol Exposure and Risk Assessment)

Abstract

:
Fungal species composition and site of deposition within the airways affects whether diseases develop and where they may arise. The aim of this study is to obtain knowledge regarding the potential deposition of airborne culturable, viable, and non-viable fungi in the airways of pig farm workers, and how this composition changes over multiple sampling days. Airborne fungi were sampled using impactors and subsequently analyzed using amplicon sequencing and matrix assisted laser desorption ionization time of flight mass spectrometry (MALDI-TOF MS) fingerprinting. The geometric mean aerodynamic diameter (Dg) of airborne particles with culturable airborne fungi were not affected by sampling days and ranged in size between 3.7 and 4.6 µm. Amplicon sequencing of the internal transcribed spacer region of the rRNA gene operon, in combination with DNA interchelating agents, revealed a large presence of non-viable fungi, but several pathogenic and toxic fungal species were detected in the viable portion. The diversity was found to be significantly associated with the sampling day but did not change significantly over multiple sampling rounds during the same day. The non-viable fraction contained genera typically associated with the pig gastrointestinal tract, such as Kazachstania and Vishniacozyma. In conclusion, the Dg of culturable fungi was between 3.7 and 4.6 µm, and the Dg of the viable and total fungi was 1.5 and 2.1 µm, respectively. The species composition changed over the multiple sampling days.

Graphical Abstract

1. Introduction

Pig farmers are exposed to high concentrations of bioaerosols, ammonia, and other noxious compounds, all of which can contribute to the development or exacerbation of existing airway problems [1,2]. Exposure to airborne fungi by pig farm workers has not been as well characterized even though exposure to fungi is known to be linked to the development of asthma, allergic sensitization, or other hypersensitivity disorders [3]. In particular for airborne fungi, the place of deposition of different fungal species in the human airways has an impact on the health effects they may cause [4,5,6].
Size-fractioned aerosols, based on their aerodynamic diameter, are routinely used to understand where in the airways aerosols may deposit. One of the most commonly used samplers is the six-stage Andersen Cascade Impactor (ACI-6), which has been used in a variety of different occupational exposure studies [7,8]. The ACI-6 size fractionates particles into six health relevant sizes, allowing researchers to quickly detect the culturable microorganisms present. Although less used than the ACI-6, another ACI is the eight-stage non-viable cascade impactor (ACI-8), which has previously been used for the analysis of airborne fungi in a range of health-relevant size fractions [9,10]. Regarding the ACI-8, impaction can occur on glass fiber (GF) filters, from which DNA can be extracted and used for downstream molecular analyses [10].
In metagenomic analyses DNA from both living and non-viable microorganisms is amplified during the initial polymerase chain reaction (PCR). To obtain knowledge about both the non-viable and living microorganisms, steps have been taken to remove DNA from non-viable cells. This can be done through the use of different types of viability assays, applying DNA chelating agents such as propidium monoazide (PMA) and ethidium monoazide (EMA), which intercalate upon photolysis with free or exposed DNA from non-viable or degraded cells [11]. This allows for metagenomics analysis and discrimination between total and viable fractions from complex samples [12].
Knowledge regarding viability is important as some fungal species, such as Aspergillus fumigatus, are able to induce a higher immune response in test animals challenged with viable conidia compared with non-viable conidia [13,14]. In contrast, non-viable spores from some fungal genera such as those from the genera Alternaria and Cladosporium, cause a similar immune response to viable spores [15,16,17].
Analysis on the hetero- or homogeneity of airborne fungi is important in regard to sampling strategy for characterizing the viability of airborne fungi. In addition, it is important to know how representative a single sample is in regard to species composition. Previous research has shown a large overlap in the fungal microbial diversity in settling dust amongst pig farms [18]. However, those samples were taken over a period of several days and did not reveal whether the airborne microbial diversity changes over time. Therefore, we are interested if the diversity of airborne fungi from a pig farm stable is similar across multiple sampling days and between multiple sampling rounds in the same day.
This study aimed to obtain knowledge about the culturable, viable, and non-viable airborne fungi, which exhibit potential to deposit in lungs of workers exposed in a pig stable. In addition, we aimed to improve our knowledge on the stability of the airborne fungal microbiome within and between sampling days. To do this, a combination of different culture- and molecular-based methodologies has been applied. Sampling with ACI-6 was combined with matrix assisted laser desorption ionization time of flight mass spectrometry (MALDI-TOF MS) and sampling with the ACI-8 was combined with use of metagenomics analysis of airborne fungi and a viability assay to discriminate between living and non-viable/damaged cells.

2. Materials and Methods

2.1. Sampling Location

Airborne fungi were sampled from a newly built (2017) specific pathogen free (SPF) pig farm during the winter (21st of February) and summer (19th of June, and 3rd and 17th of July) of 2019. The farm itself is approximately 8300 m2. Sampling was performed at the same time of day (mid-morning), at the same location in the middle of the stable (stable length 40 m) in the center of the walkway, where pigs were kept in pens on either side (~7 pigs per pen). The pigs in this stable were all finishing pigs (defined as >30 kg, but <100 kg) between 4–5 months old.

2.2. Temperature and Humidity and Gravimetric Measurements

The temperature and relative humidity (RH) were measured inside the stable during sampling using a Tinytag Plus Data Logger (Gemini Data Loggers, United Kingdom). Measurements were taken once every minute during the sampling period. The data are presented as the mean temperature and RH with their standard deviation.
The concentration of airborne dust within the stable was determined by using gesamtstaubprobenahme (GSP) samplers mounted with 37 mm 1 µm pore Teflon filters (Merck Millipore, Ireland) pre-weighed in a climate-controlled weighroom (n = 16). Airborne dust was collected at a flow rate of 3.5 L/min during sampling setup, during sampling collection, and after sampling. Collected dust was allowed to acclimatize in the climate-controlled room and weighed the following day. Airborne dust measurements are presented as mg of dust per m3 air.

2.3. Sampling of Culturable Fungi

A 6-stage Andersen cascade impactor (ACI-6) (Thermo Fisher Scientific Inc, USA) with an air flow rate of 28.3 L/min was used to size fractionate and deposit air samples onto dichloran glycerol (DG18) agar plates supplemented with chloramphenicol (Oxoid, United Kingdom). Particles of the following sizes were sampled: Stage 1: 7.0–12 µm, Stage 2: 4.7–7.0 µm, Stage 3: 3.3–4.7 µm, Stage 4: 2.1–3.3 µm, Stage 5: 1.1–2.2 µm, and Stage 6: 0.65–1.1 µm. Stages 3 through 6 represent the respirable fraction of sampled aerosols while Stages 1 and 2 represent the aerosols which deposit in the upper airways [19]. The plates in the ACI-6 were replaced every 6 min, to prevent overloading of the DG18 plates. This was repeated five times for each visit. Samples taken from the same day are henceforth referred to as sampling rounds. In total, 120 DG18 plates were collected and analyzed, 30 from each sampling day, corresponding to five consecutive sampling rounds per day.

2.4. Species Identification by MALDI-TOF MS

The DG18 plates were incubated aerobically at 25 °C for 7 days. During this time, individual fungal colonies were transferred from DG18 media using a sterile toothpick to Sabouraud growth media (Oxoid), to obtain sufficient mycelium with few to no spores which could affect the MS spectra. The sample was washed twice with water to remove excess media before performing ethanol extraction [20].
MALDI-TOF MS analysis was performed on a Microflex LT mass spectrometer (Bruker Daltonics, Germany) using the Biotyper 3.1 software with the BDAL standard library. A bacterial test standard (BTS) was used to calibrate the instrument.

2.5. Sampling of Airborne Fungi with ACI-8 and Treatment of Filters

The 8-stage non-viable Andersen cascade impactor (ACI-8) (Thermo-Fisher, USA) loaded with glass fiber (GF) filters (Whatman, United Kingdom) sampled continuously for 30 min with an air flow rate of 28.3 L/min. Using the ACI-8, particles of the following aerodynamic sizes were sampled: Stage 1: >9.0 µm, Stage 2: 5.8–9.0 µm, Stage 3: 4.7–5.8 µm, Stage 4: 3.3–4.7 µm, Stage 5: 2.1–3.3 µm, Stage 6: 1.1–2.1 µm, Stage 7: 0.7–1.1 µm, and Stage 8: 0.4–0.7 µm. Upon returning to the lab, GF samples from the ACI-8 were aseptically divided into 8 pieces using a sterile scalpel, with 4 pieces being treated with 500 µL of 50 µM propidium monoazide (PMA) (Biotium, USA) in 1× phosphate buffer saline (PBS) (Sigma Aldrich, Germany) and the other 4 filter pieces, acting as controls, were treated with 500 µL of 1× PBS.
Samples were inoculated in the dark for 10 min at room temperature under gentle agitation, before being photolyzed using a PMA-lite photolysis device (Biotium) for 15 min [12,21]. All samples were frozen at −20 °C until DNA extraction.

2.6. DNA Extraction and Next Generation Sequencing

For each stage of the ACI-8, two filter pieces, one treated with PMA and the other without, were used for DNA extraction. DNA was extracted using the DNeasy PowerLyzer PowerSoil kit (Qiagen, Germany) according to the manufacturer’s protocol.
Extracted DNA was amplified in a two-step PCR targeting the internal transcribed spacer region (ITS). The primers used were ITS1F: CTTGGTCATTTAGAGGAAGTAA and ITS1R: GCTGCGTTCTTCATCGATGC [22]. Amplicon library PCR was performed using 5 µL of extracted DNA as template per 25 µL PCR reaction (400 nM of each dNTP, 1.5 mM MgSO4, 2 mU Platinum Taq DNA polymerase High Fidelity, and 1× Platinum High Fidelity buffer (Thermo Fisher, USA) and 400 nM of bar-coded library adapter pair (Illumina, USA).
Thermocycler settings for the first amplicon PCR initial denaturation at 95 °C for 2 min followed by 35 cycles of 95 °C for 20 s, 56 °C for 30 s, 72 °C for 60 s, and final elongation at 72 °C for 5 min. PCR reactions were performed in duplicate and pooled. Amplicon libraries obtained were cleaned using AMPure XP bead protocol (Beckman Coulter, USA) with the following modifications: the sample/bead ratio was 5/4 and the purified DNA was eluted in 20 µL nuclease free water. The second library PCR was run with 2 µL of cleaned amplicon PCR product as template with X5 PCRBIO reaction buffer (1×) and PCRBIO HiFi polymerase (1 U). Thermocycler settings for the library PCR included initial denaturation at 95 °C for 2 min, 8 cycles of 95 °C for 20 s, 55 °C for 30 s, 72 °C for 60 s, and final elongation at 72 °C for 5 min. Library concentrations were measured with Quant-iT HS DNA Assay (Thermo Fisher, USA) and quality was checked using D1000 ScreenTapes (Agilent, USA). Samples were pooled in equimolar concentrations and the library pool was sequenced on the MiSeq platform (Illumina, USA) according to previous published procedure [23].

2.7. Bioinformatics

The ITS amplicon data sequenced on the MiSeq platform was quality controlled and processed from raw data to operational taxonomic units (OTUs) using AmpProc version 5.1.beta2.1 (https://github.com/eyashiro/AmpProc) with USEARCH (version 11) [24]. UNITE (version 8.0) was used as the reference database [25]. The obtained raw sequence data is available at the European Nucleotide Archive under accession number PRJEB38776.

2.8. Statistical Analyses
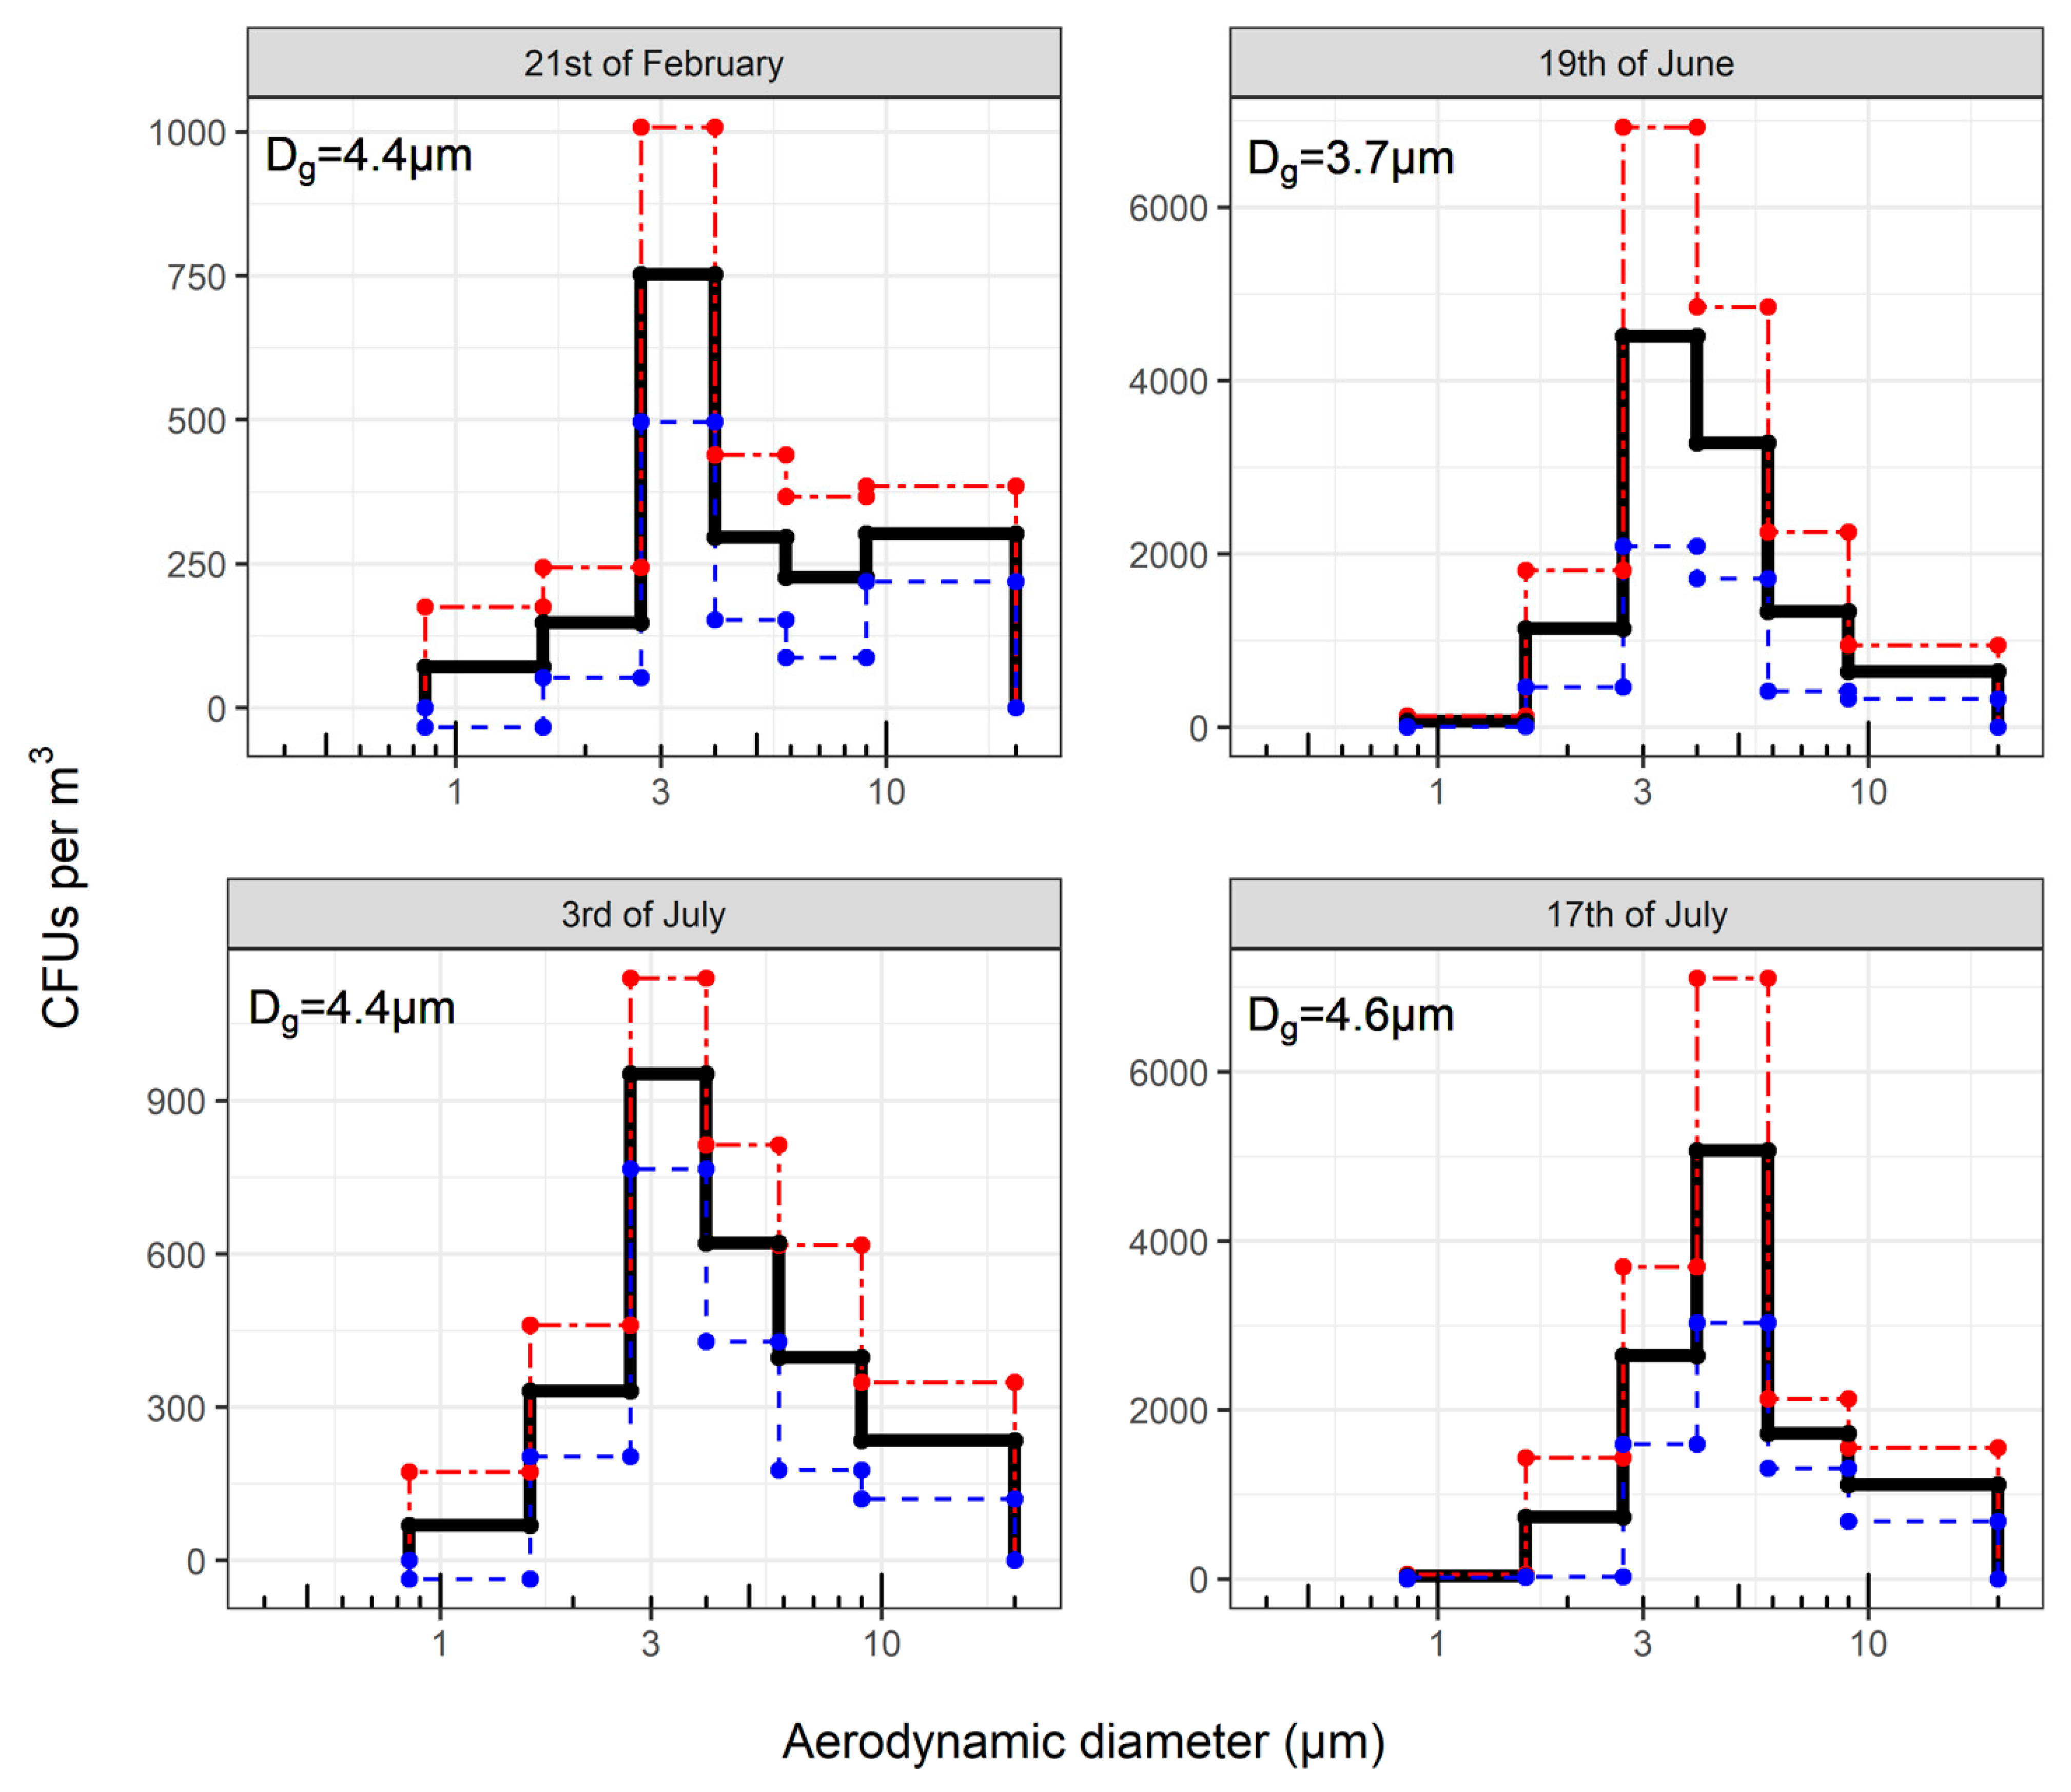
All statistical analyses and visualizations were performed in RStudio version 1.1.463 [26], with R version 3.5.3 [27], using the following R CRAN packages: ggplot2 [28], lme4 [29], car [30], and vegan [31]. Microbial community composition and structure on presence/absence data for culturing and sequencing based methods were explored using bubble plots. Isolates that could not be identified by MALDI-TOF MS were included in the calculation of the distribution of fungal species over the six stages of the ACI-6 but were not included in the construction of bubble plots.
For culturing and sequencing data, comparisons were run between clusters (Day or Size Fraction) using the analysis of similarity (ANOSIM) function, part of the vegan package, according to Jaccard index values. For each cluster in the ANOSIM model a test statistic R value is given. A test statistic R value close to 1.0 suggest high dissimilarity between groups, while a test statistic R value close to 0.0 suggests no systematic differences between groups.
To compare the particle data between the different sampling days and rounds, the geometrical mean diameter (Dg) of the airborne fungal aerosols was calculated using the following formula:
Dg = (D1n1 ⋅ D2n2 ⋅ … ⋅ Dnnn)1/N
Where
Dg
is the geometrical mean diameter of fungal aerosols,
D1
is the geometrical midpoint of the first interval,
n1
is the measured number of particles in the interval, and
N
is the total number of particles summed over each interval.

3. Results

3.1. Humidity, Temperature, and Concentration of Airborne Dust

The temperature and humidity within the pig stable was observed to vary from 12.3 °C to 24.2 °C and 38.3% to 69.5% relative humidity (RH), respectively, with the coolest temperatures recorded during the winter and the hottest during the summer (Table 1). On the 19th of June and 17th of July, the stables and pigs were misted several times during the study, which resulted in the relative humidity being highest on those days.
The concentration of airborne dust within the pig stable had a geometric mean average of 1.16 mg dust/m3 ± 0.18.

3.2. Concentration of Culturable Fungi and Aerodynamic Diameter

The concentration of culturable airborne fungi over the four sampling days ranged from 377 CFU/m3 to 2172 CFU/m3, with an overall average of 1281 CFU/m3. Within each sampling day, the concentration of airborne fungal CFUs varied from each sampling round to the next but the differences were not significant (p = 0.18). However, the concentration of airborne fungi observed between the different sampling days was significantly different (p < 0.0001), with samples taken on the 19th of June and 17th of July having the highest concentrations of fungi (Figure 1). No significant differences in the concentration of airborne fungal CFUs were observed between samples taken on the 19th of June and 17th of July (p = 0.38).
Sampling on different days did not affect the measured Dg of fungal aerosols as sampled with the ACI-6. On the 21st of February, 19th of June, and 3rd of the July, the airborne fungal size distributions had Dg‘s corresponding to a size range between 2.7 µm and 4.0 µm. On the 17th of July, the maximum shifted to a larger particle size bin ranging 4.0 µm and 5.85 µm (Figure 1). However, the differences in Dg were not significantly different between the sampling days (p = 0.31). Overall, the mean percentage of fungal CFUs classifiable as respirable was 69% ± 7.
During the different sampling rounds, the calculated Dg of particles with fungi was observed to significantly increase with the number of sampling rounds (p < 0.001). No significant differences in the Dg of particles with fungi were found between days when the pigs were and were not sprinkled (p = 0.37), and the Dg of particles with fungi did not significantly change between rounds where the pigs and stables were sprinkled (p = 0.37).

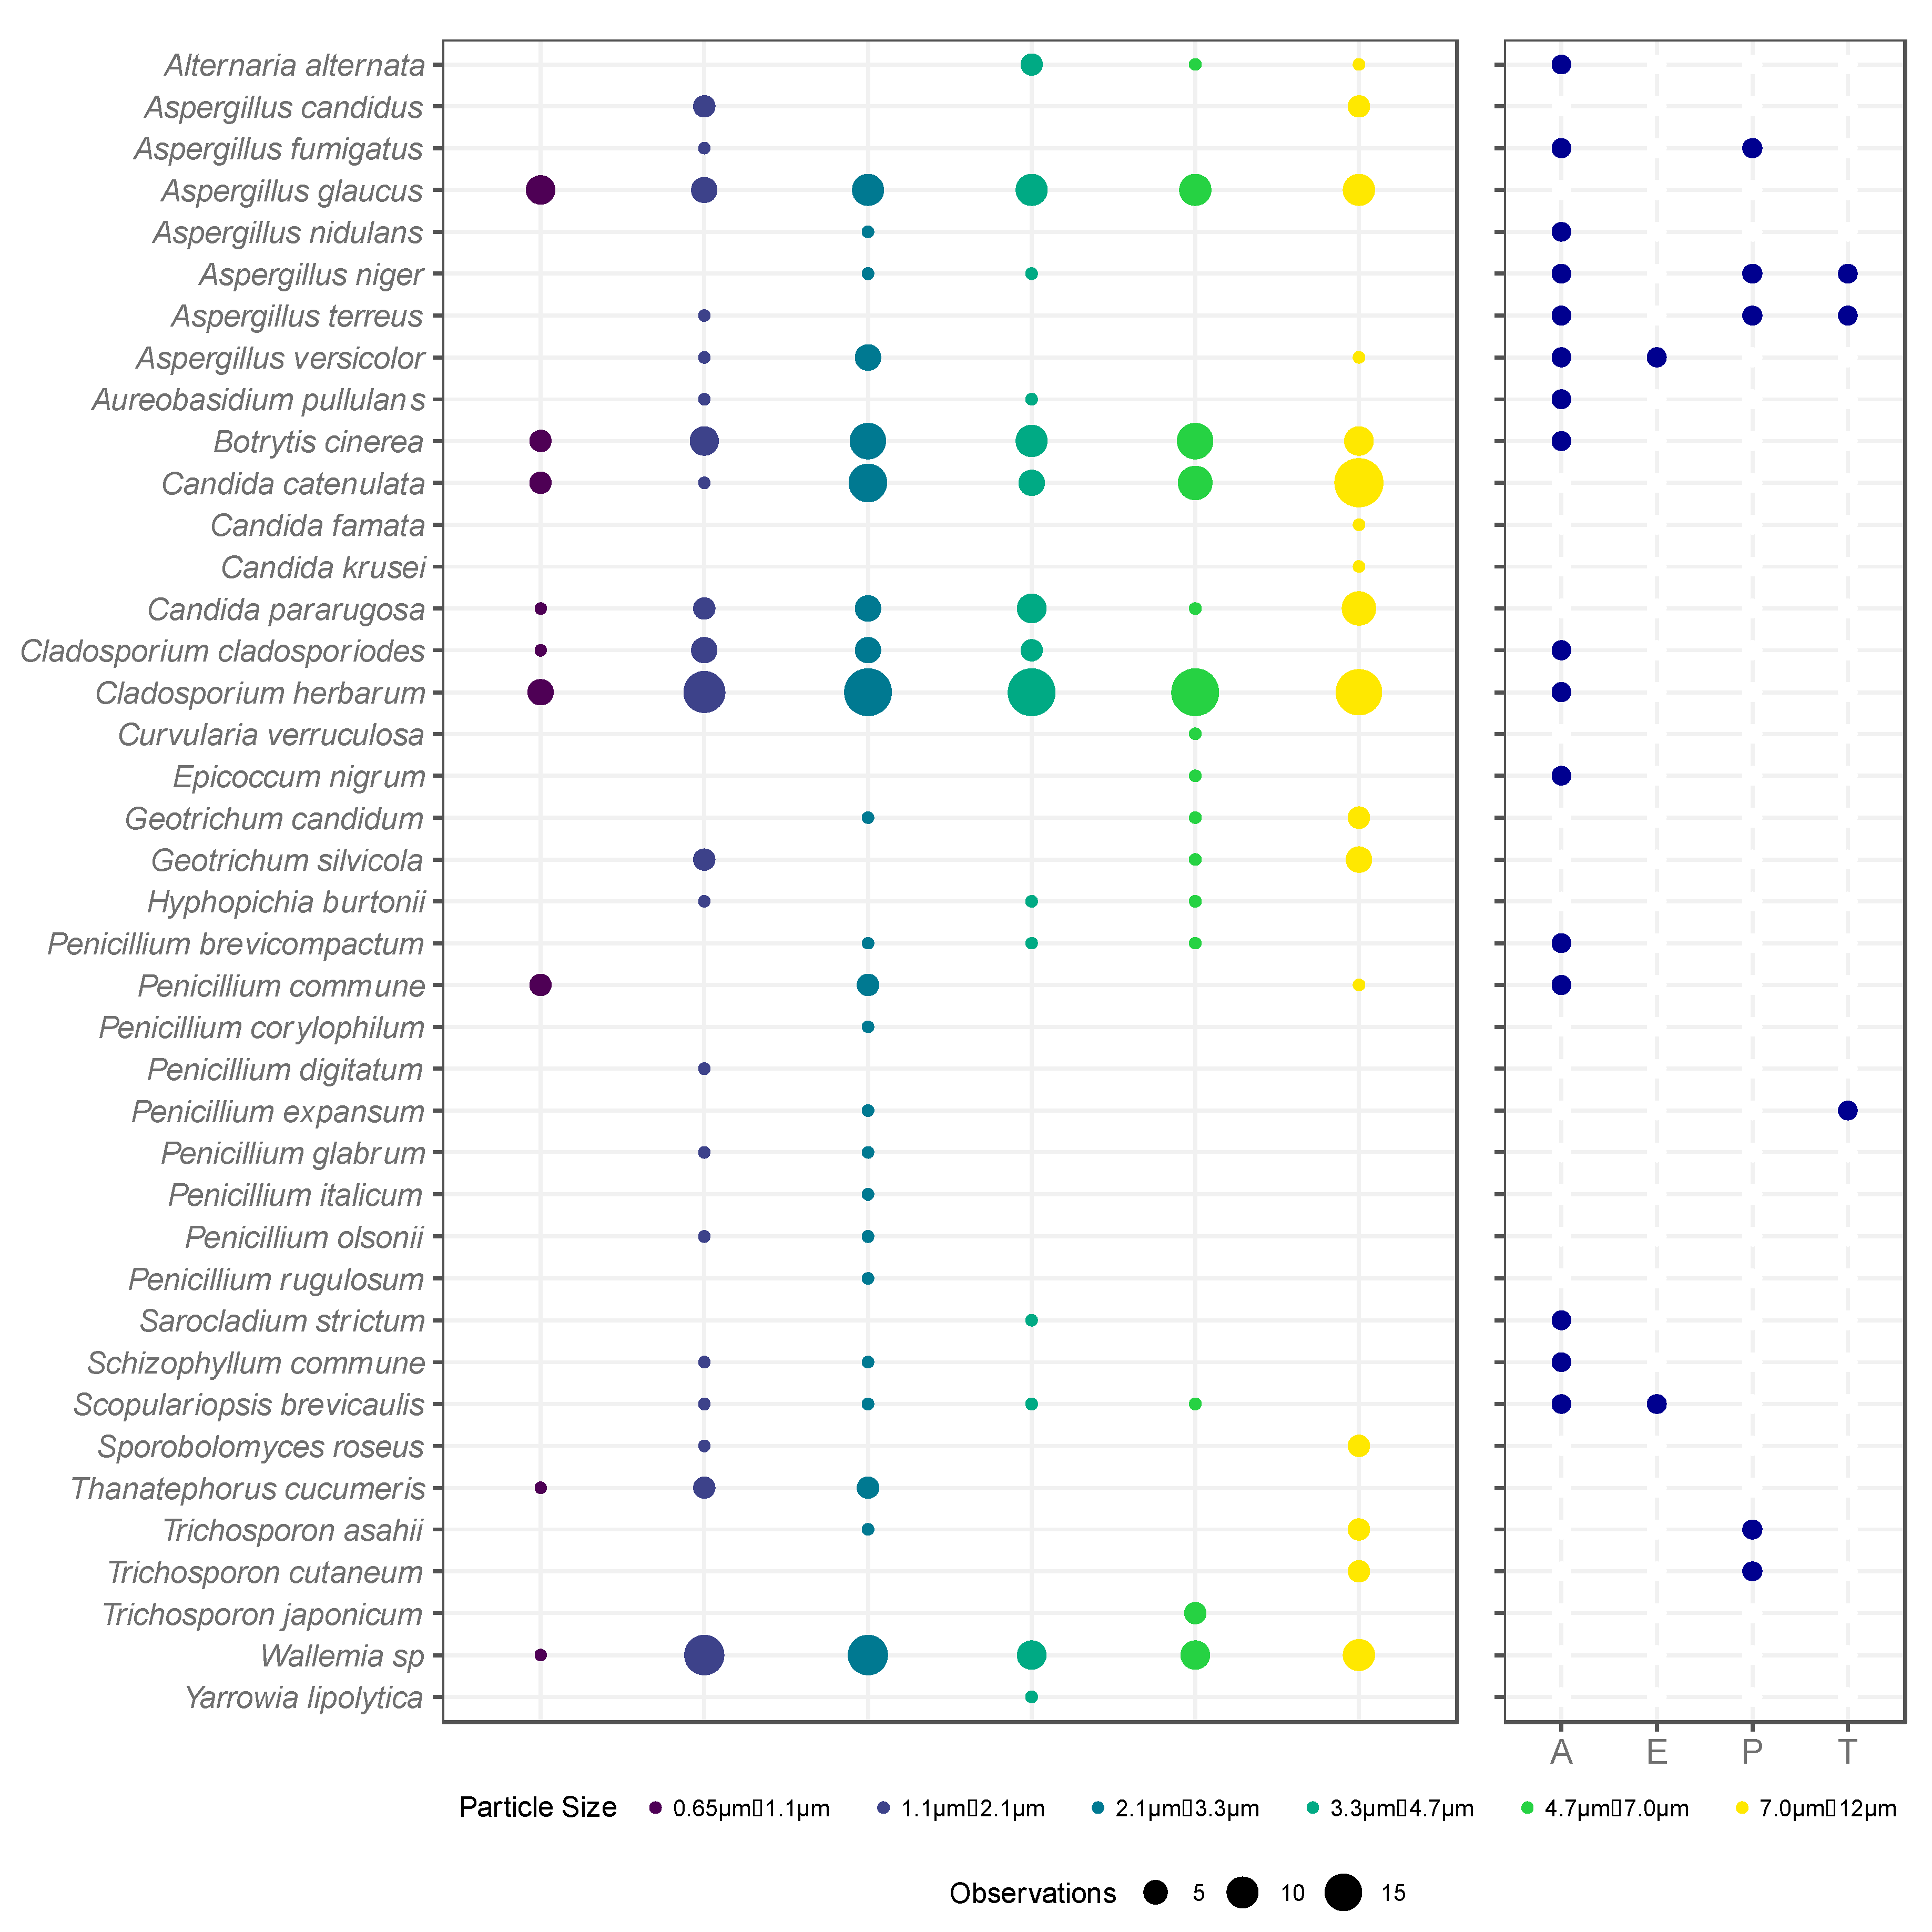
3.3. Species Identified in Samples Taken with ACI-6

The microbial diversity was low in all sampling points, with only 40 different fungal species identified using MALDI-TOF MS amongst the six ACI-6 stages (Figure 2).
Species observed on all sampling days, included Botrytis cinerea, Candida paraguosa, Candida catenulata, Cladosporium herbarum, and Wallemia sp. Some species were observed to be unique to each sampling day, such as Aspergillus glaucus, which was found in every stage of the ACI-6 on the 17th of July (Figure 2).
In accordance with the German Technical Rules for Biological Agents (TRBA) 460, five species were categorized as being biological risk group 2 microorganisms. These included: Aspergillus fumigatus, Aspergillus niger, Aspergillus terreus, Trichosporon asahii, and Trichosporon cutaneum. A further 16 species were noted to be allergenic, including Alternaria alternata, Aureobasidium pullulans, Cladosporium cladosporoides, Cladosporium herbarum, and Schizophyllum commune, two were emerging pathogens, and three were mycotoxin producers [32] as seen in Figure 2.

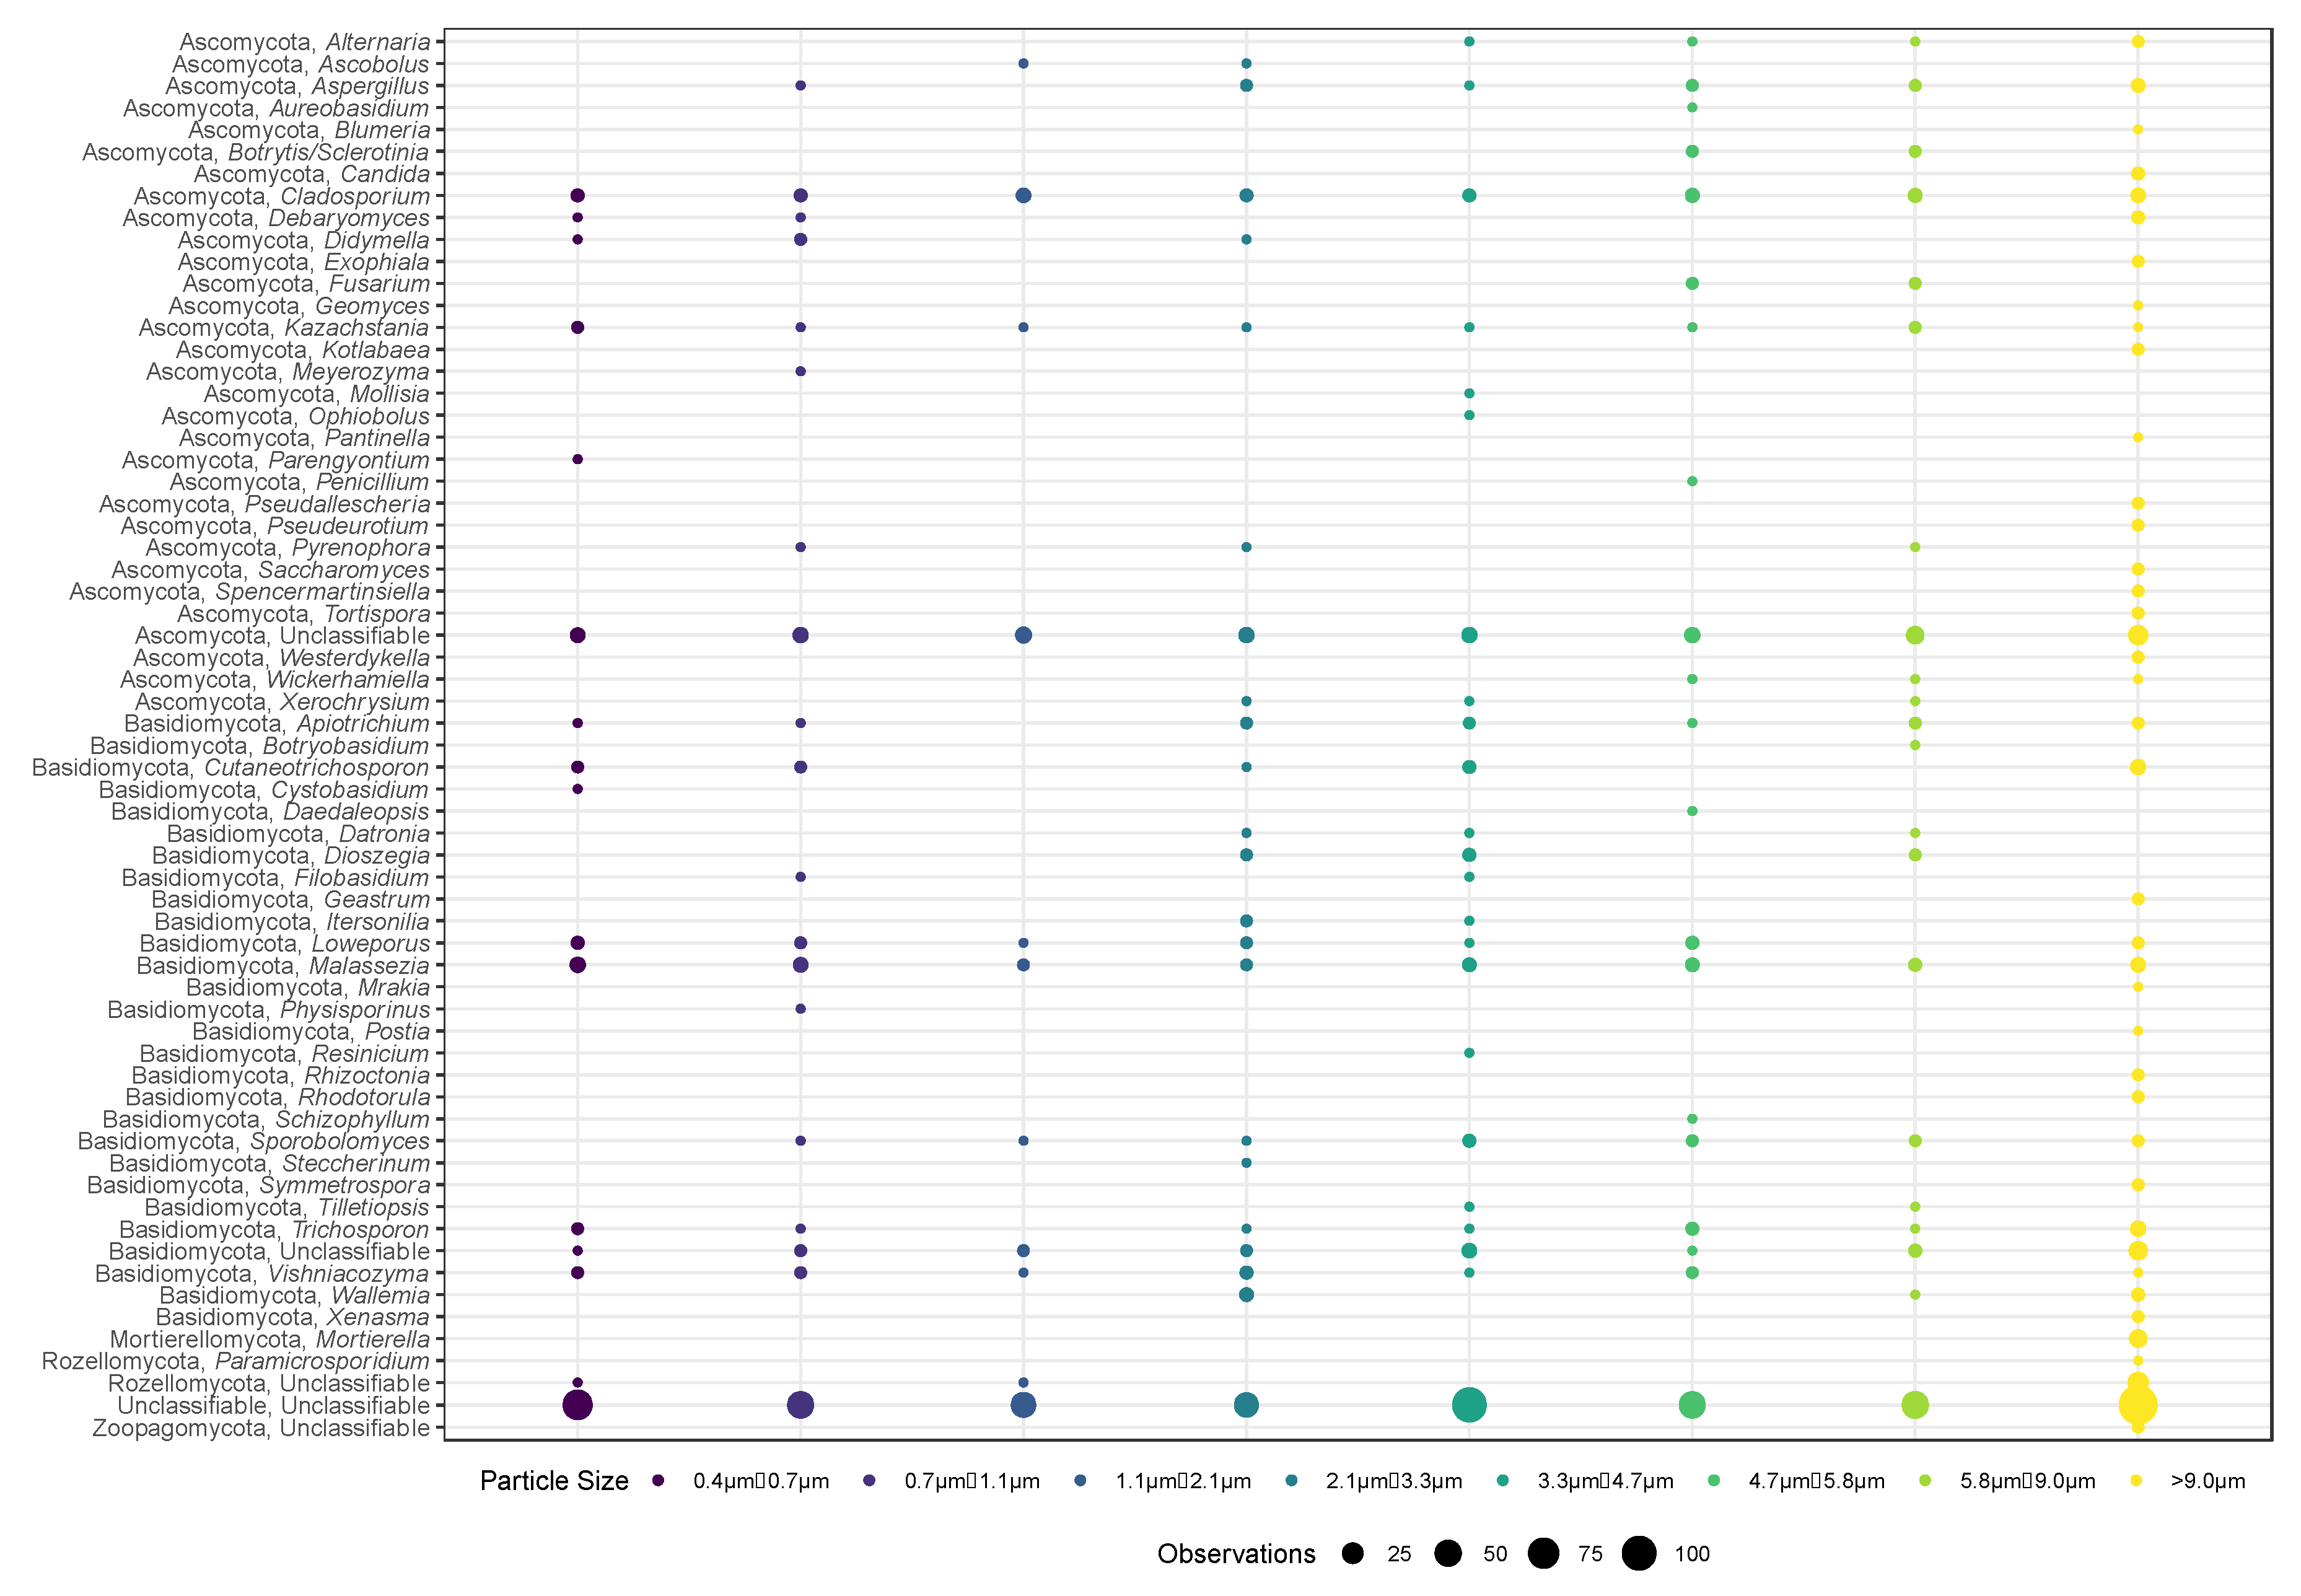
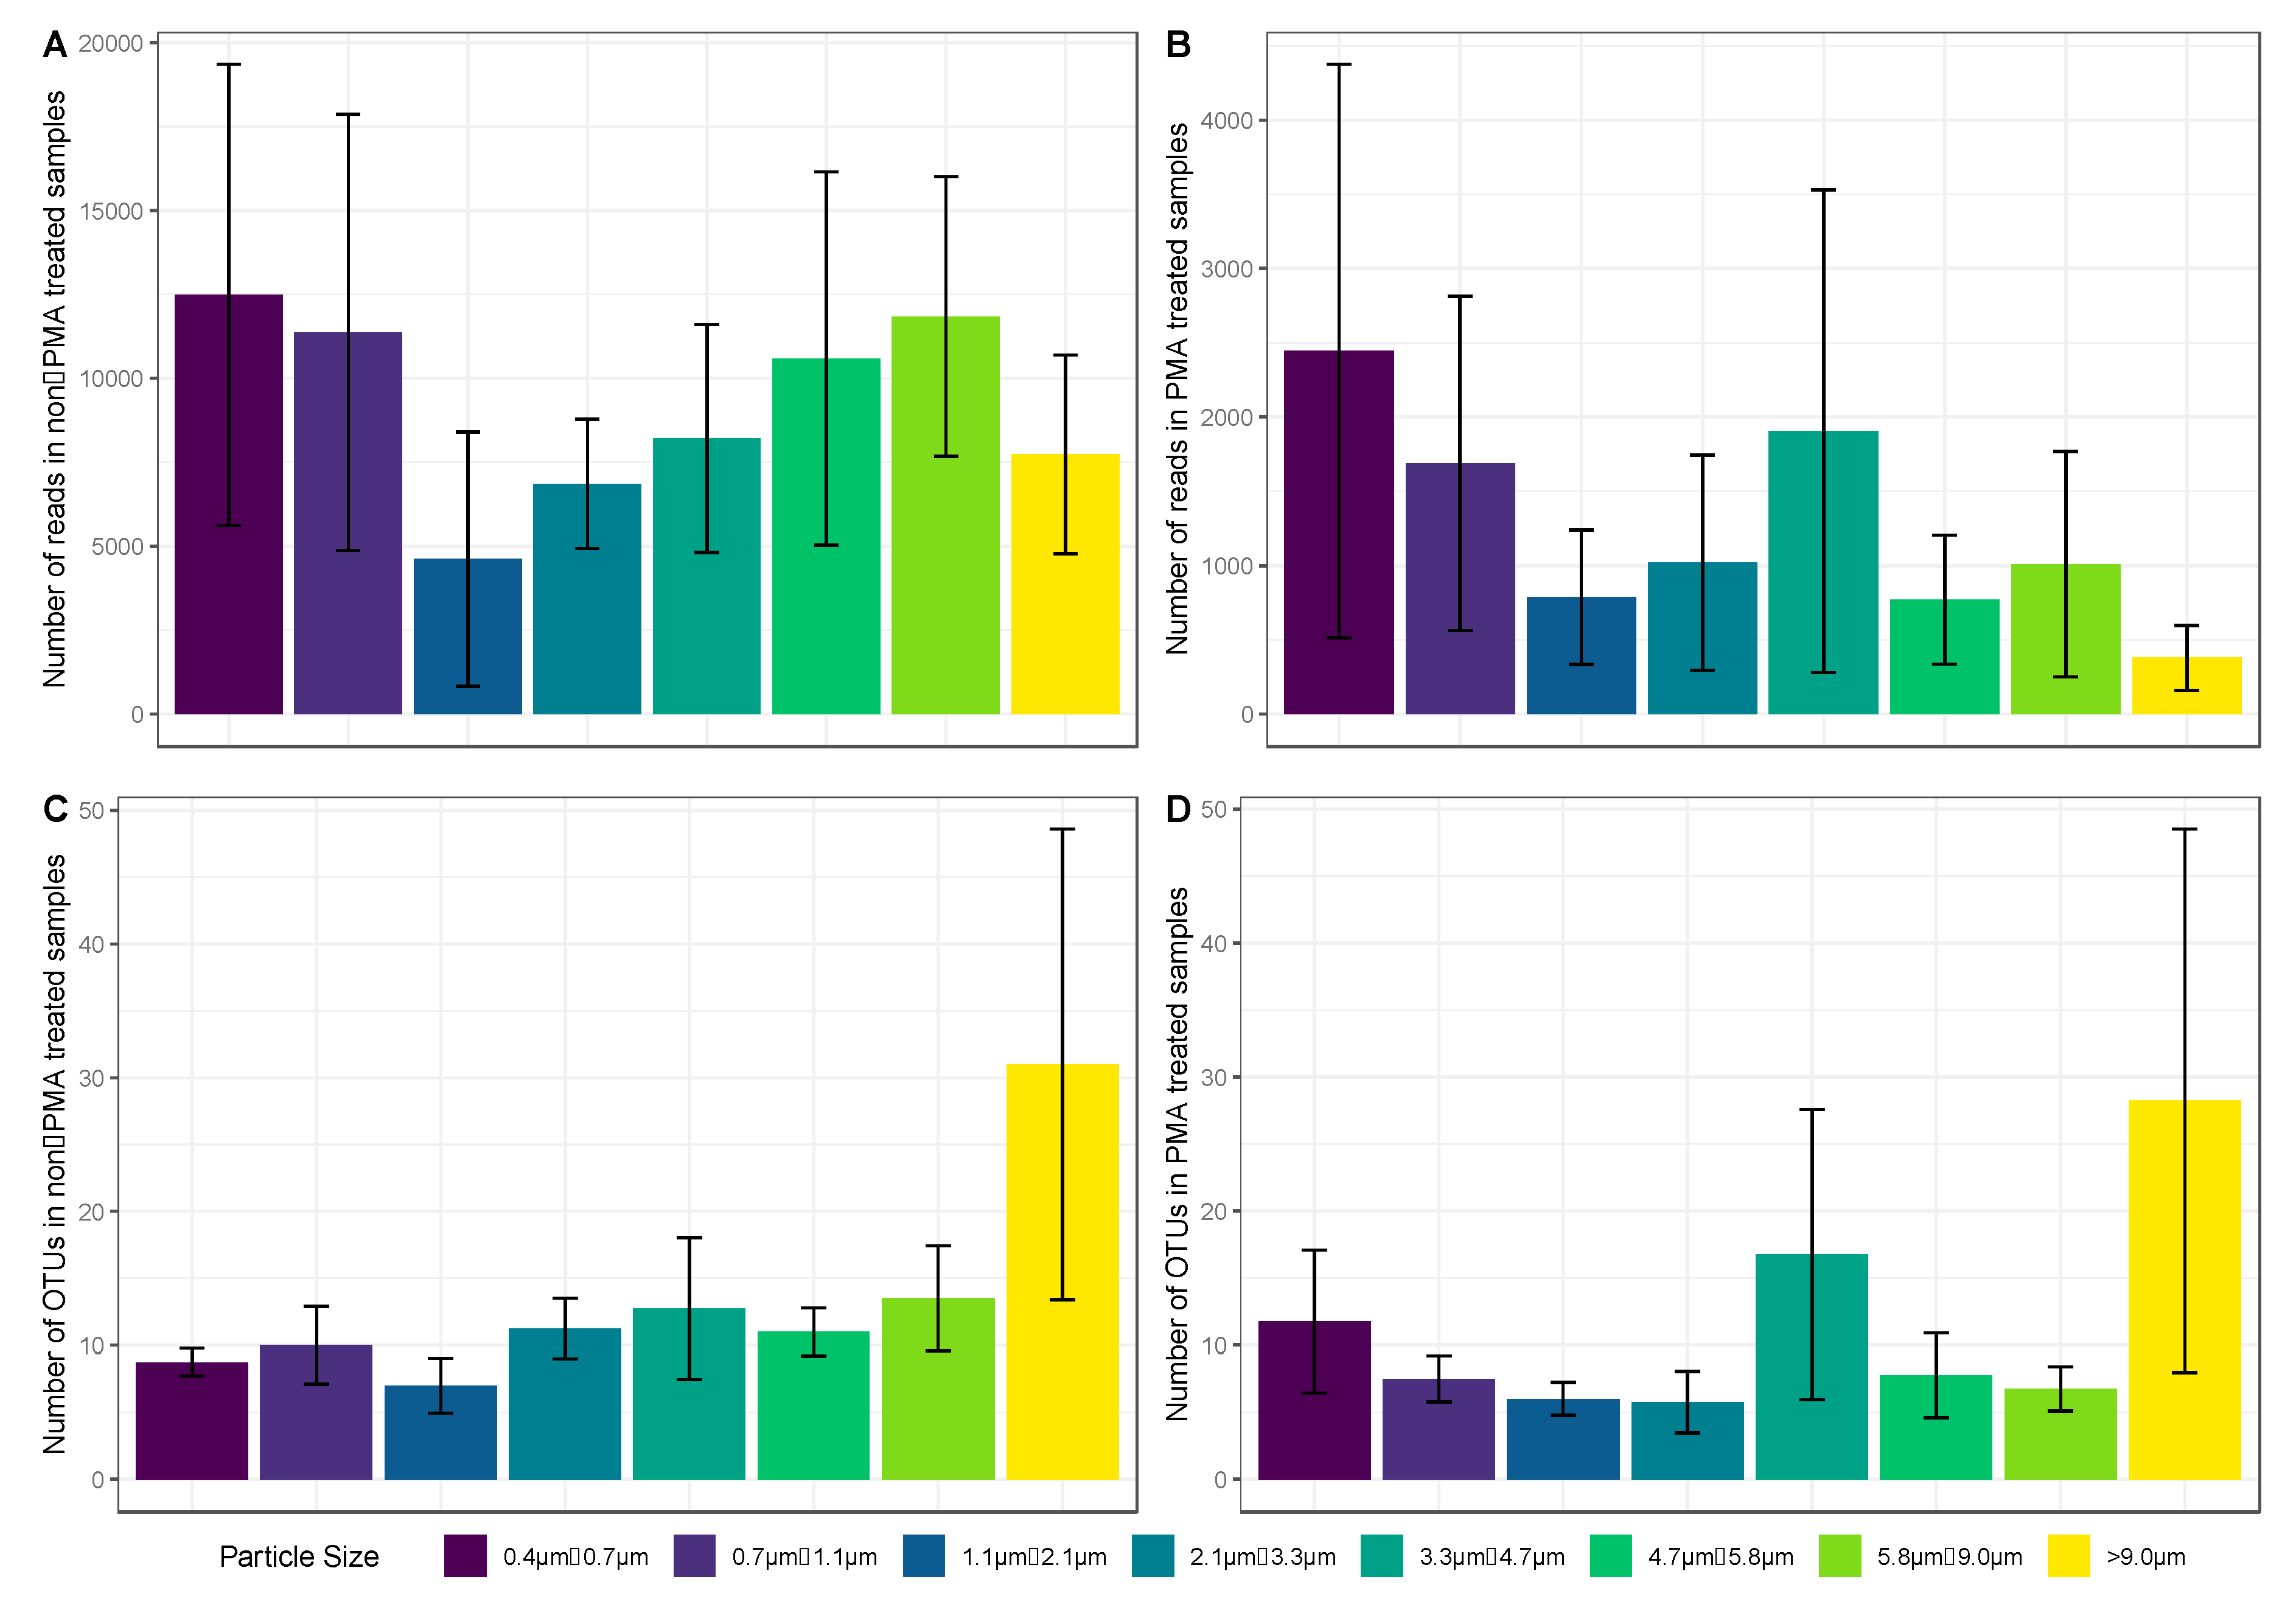
3.4. Sequencing after Sampling with ACI-8

A total of 334,862 high quality fungal reads were generated with an average number of 5232 ± 7357 reads per sample. Rarefaction curves of the fungal sequencing reads revealed that the near full microbial diversity was captured (Supplementary Figure S2). Fungal genera identified across the eight stages of the ACI included Cladosporium, Malassezia, and Kazachstania (Figure 3).

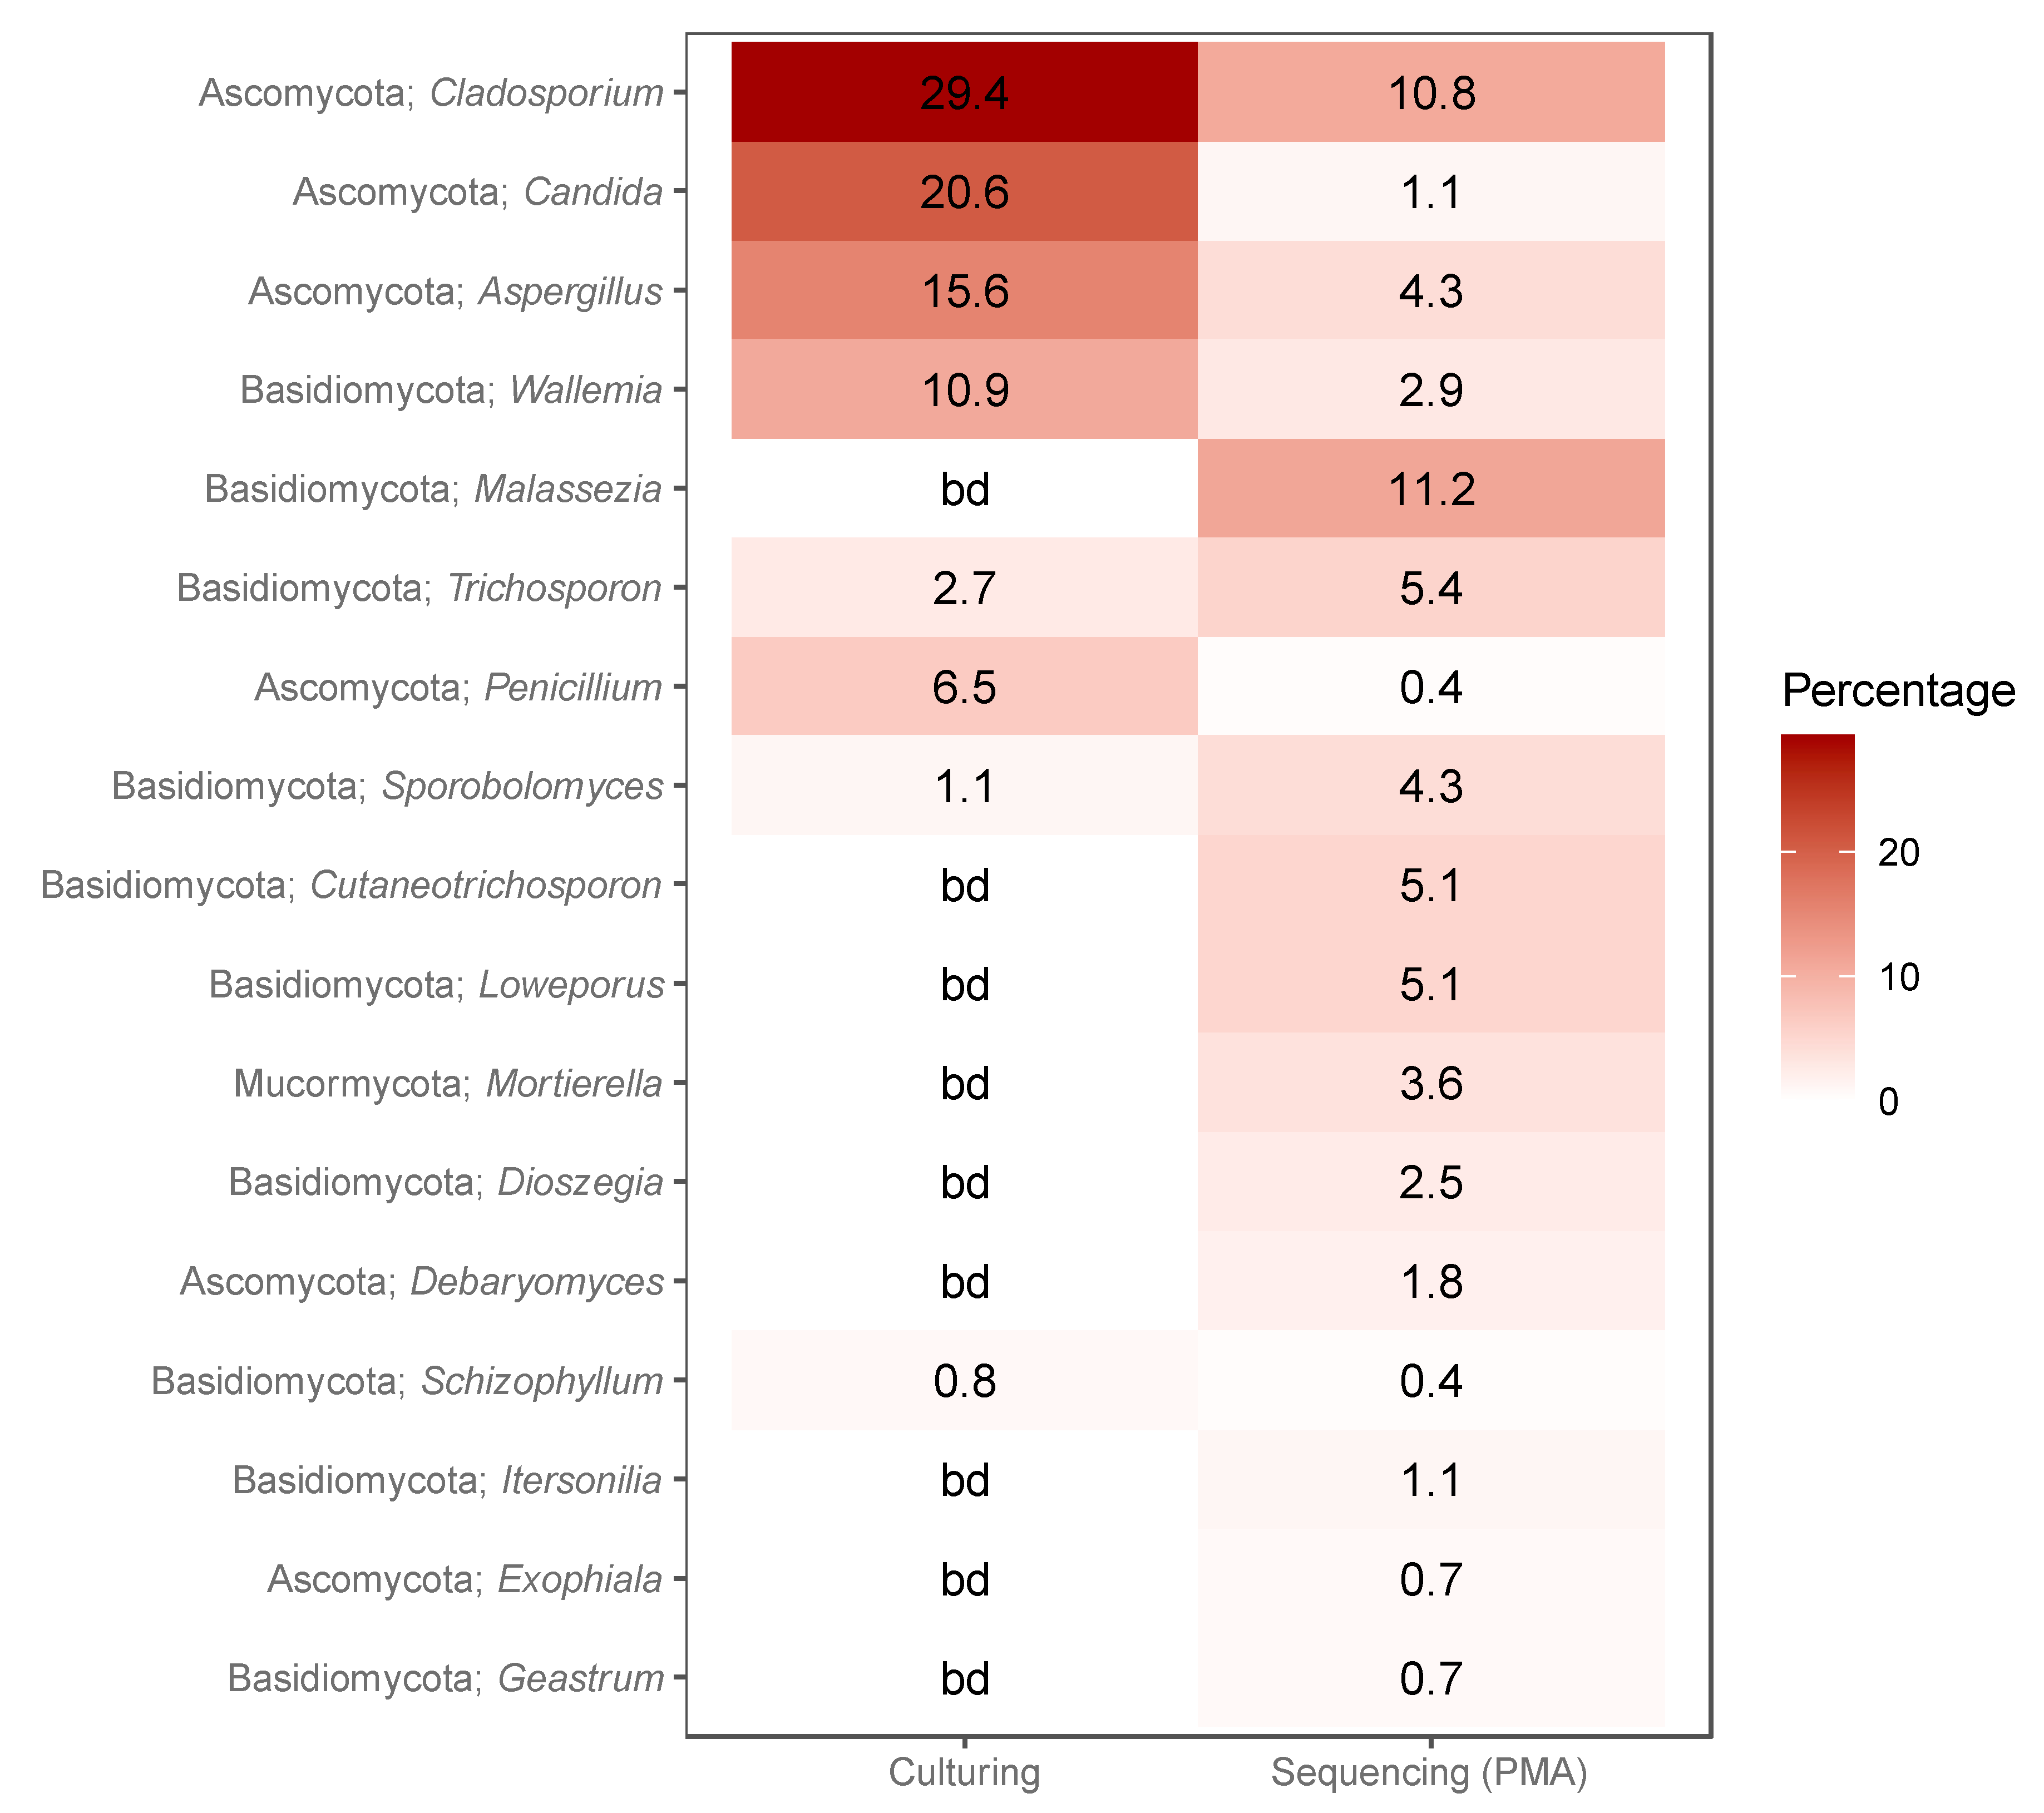
3.5. Concordance between Cultured and Sequenced Fungi

Due to limitations in sequencing taxonomic identification, comparisons between the fungi identified with sequencing and culturing were done at the genus level. Fungal genera found during both sequencing and culturing are listed in Figure 4. These fungal genera were observed in 87.6% and 29.6% of the cultured and sequenced samples, respectively. Other common genera observed during sequencing, but not culturing represented an extra 31.8% of the identifiable diversity.

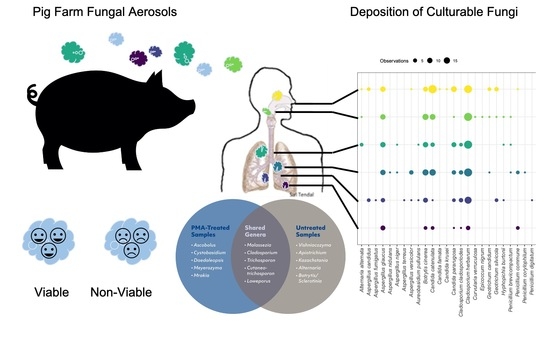
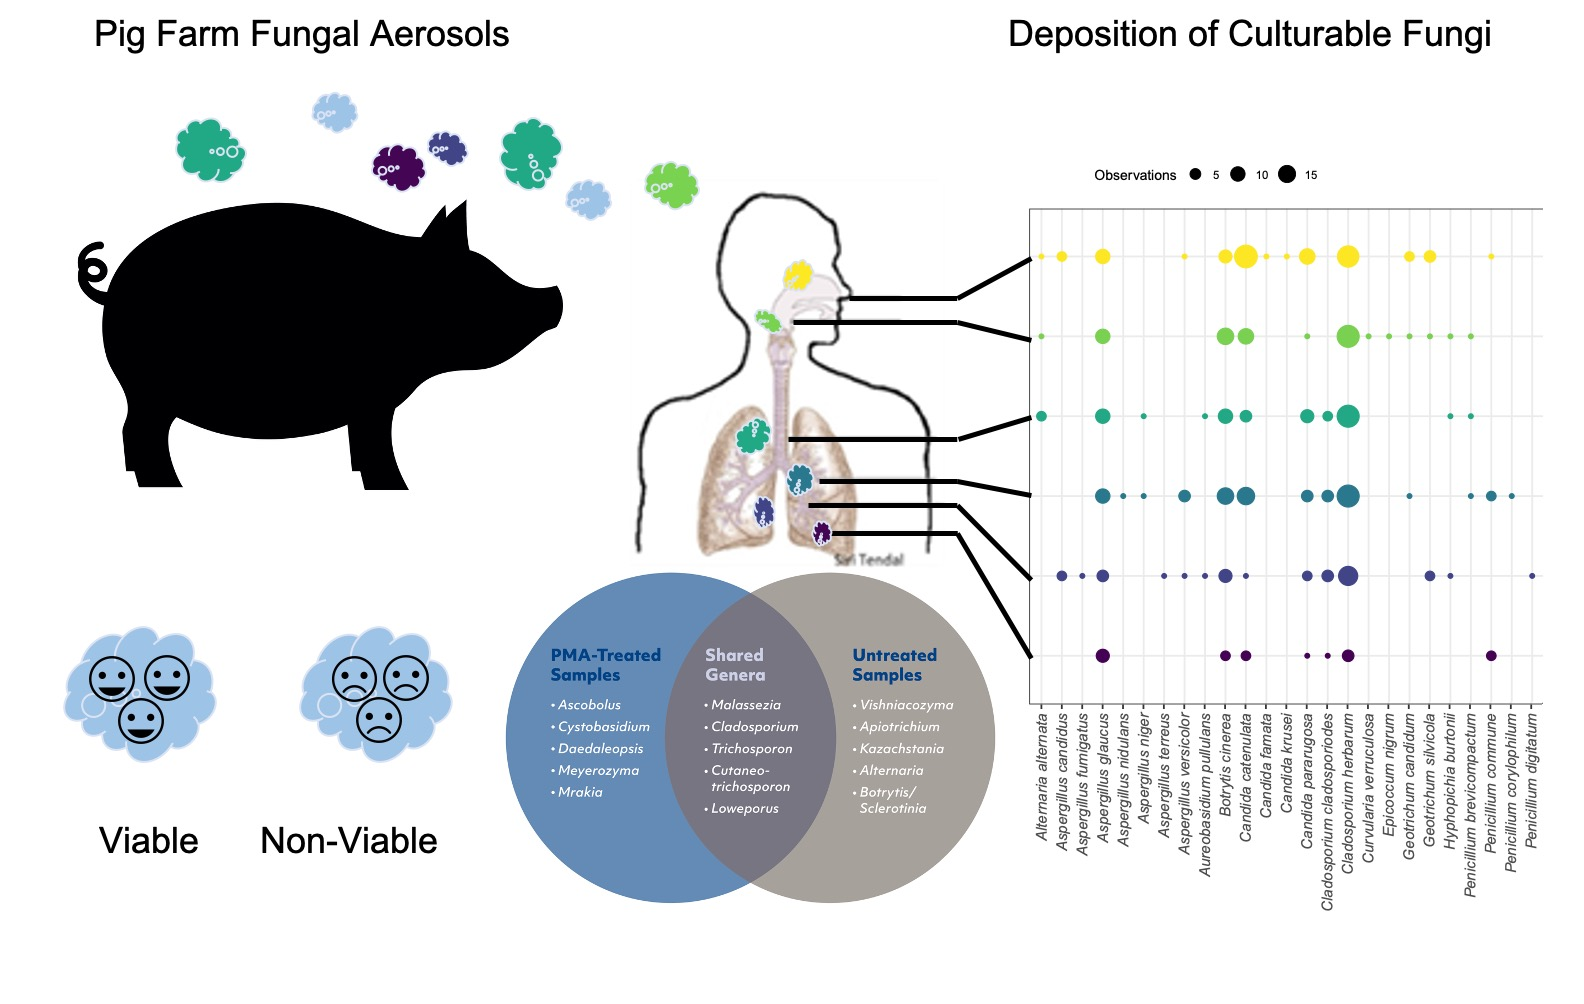
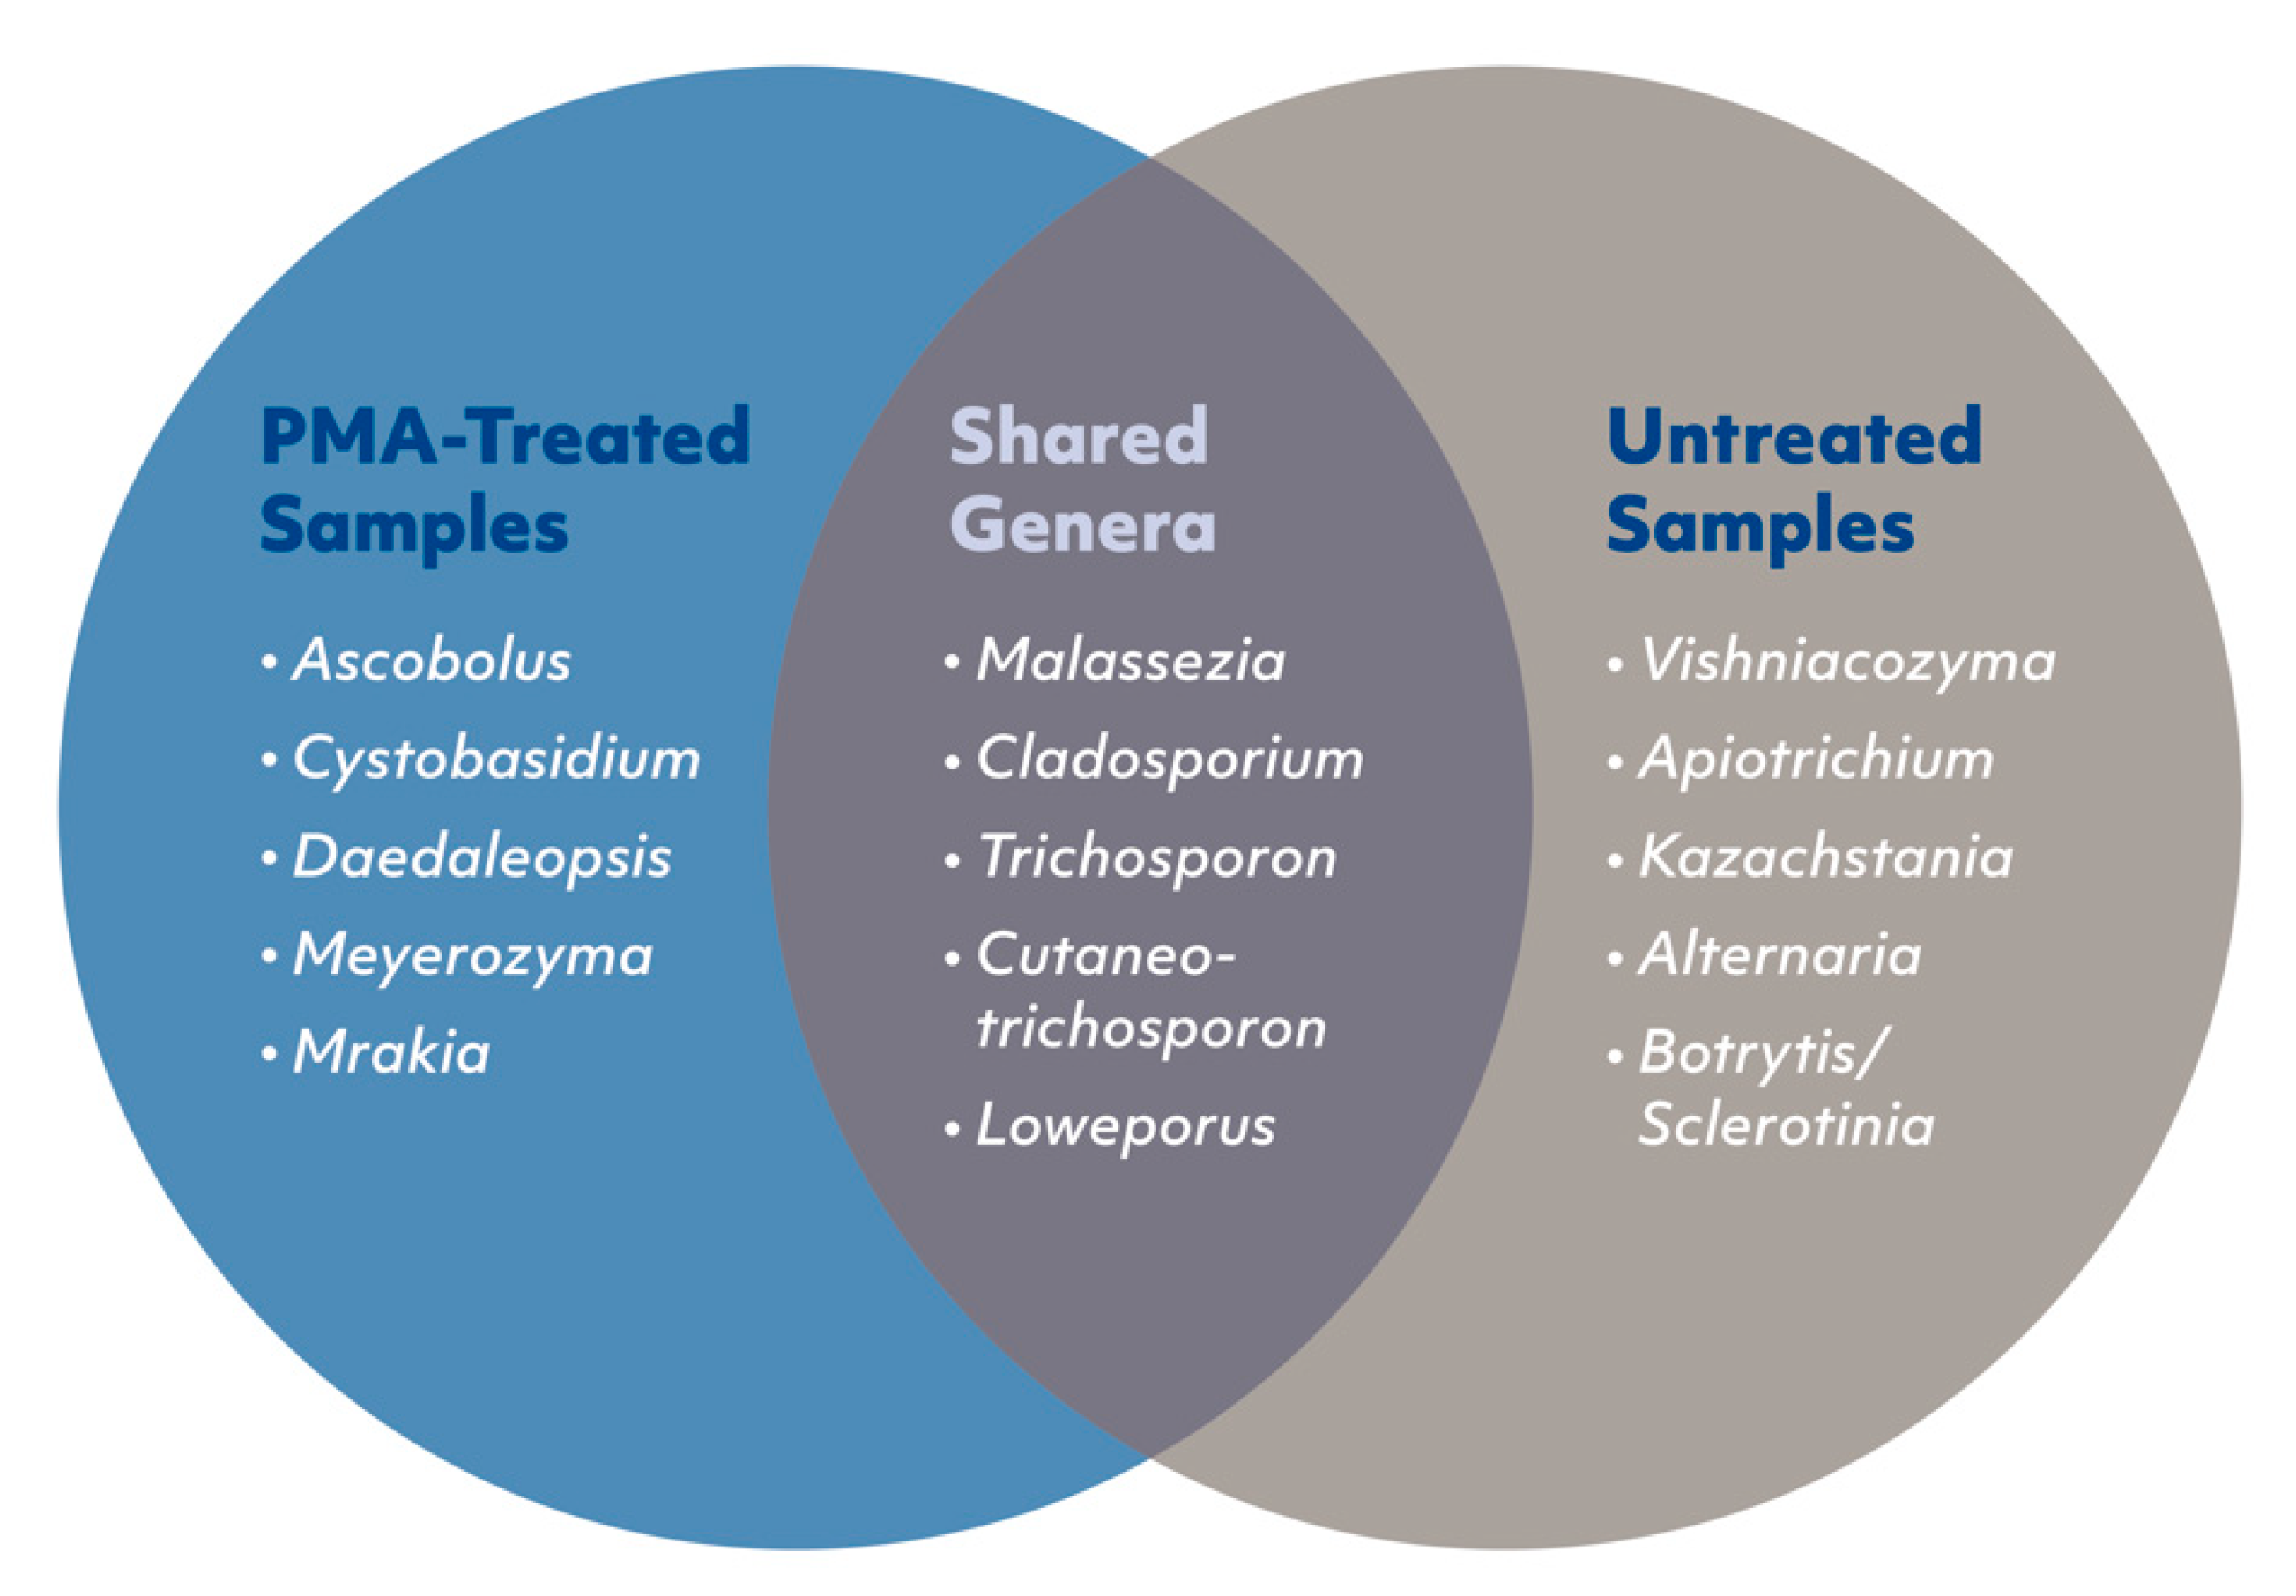
3.6. Viable and Non-Viable Fungi

The airborne fungal biodiversity, based on presence/absence data, was characterized for each filter piece treated with or without PMA. Comparisons between the fungal genera identified from filter pieces treated with PMA or untreated revealed that 69% of the genera were observed in both groups, 27% were unique to untreated samples, and 4% were unique to the PMA-treated samples (Figure 5). A full list of the shared and unique genera is shown in Supplementary Table S1.
The diversity of the airborne fungi (richness) extracted from the glass fiber filters after sampling using the ACI-8 was highest in the first stage (corresponding to particles with an aerodynamic diameter of >9 µm) and lowest in stage six (corresponding to particles with an aerodynamic diameter between 1.1 and 2.1 µm). Samples treated with PMA were observed to have a much lower microbial diversity compared with samples not treated with PMA (Figure 6A,C).
The Dg for the viable and total fungal reads over the four sampling days was found to be 1.5 and 2.1 µm, respectively, but on the 3rd and 17th of July, the Dg for these two days was 4.5 and 2.2 µm for the viable and total fungal reads, respectively.

3.7. Statistical Comparisons between Diversity Observed on Different Sampling Days and Amongst Stages

Statistical comparison regarding the microbial communities observed between different size fractions and days was performed on Jaccard index values. Significant differences in microbial communities after culturing were observed amongst the different size fractions and samples taken across different days (Table 2). While differences between samples taken across different days in the microbial communities were also found for sequenced fungi, no differences were observed amongst the different size fractions after sequencing. It should be noted that the R statistics for the differences in fungal communities observed in the different size fractions and days are low (R < 0.40), indicating that these models do not fit the data very well.

4. Discussion

In this study, airborne fungi were analyzed based on their abundance, species composition, and the aerodynamic diameter of the particle they were present as or associated with. Knowledge regarding the aerodynamic diameter of a particle is vital to understanding where in the respiratory tract it may deposit. Particles with smaller aerodynamic diameters can deposit deeper in the airways, and for fungal aerosols, this may have an effect on the allergic or infectious disease(s) caused [4]. The Dg expresses the diameter of an idealized sphere, and several of the genera which we observed, including Cladosporium herbarum and Botrytis cinerea, have mostly spherical or cylindrical spores. From the results of this study, it was observed that over 60% of the airborne fungi are classifiable as being respirable (aerodynamic diameter <4.7 µm) similar to what has been observed in Polish pig farms [33]. From our samples we identified a variety of different mold and yeast species which exhibit potential in entering the lungs.
In this study, the concentration of airborne fungi was lower than what has been previous found in pig farms in Poland by a factor of 10 [33] and lower than what was found in Korea by a factor of 2 [34]. Additionally, the concentration of airborne dust was noted to be 1.16 ± 0.18 mg dust/m3, which was lower than what was found in another Danish pig farm in the winter of 2015 (average of 1.99 mg dust/m3) [35], and considerably lower in what has been found in older studies (e.g., a geometric mean 4.01 ± 1.73 mg dust/m3) [36]. This could be attributed to the fact that the present study was conducted in a newly built pig farm, which has updated ventilation equipment to reduce the amount of airborne dust.
Interestingly, higher concentrations of fungi were observed during sampling on the 19th of June and 17th of July when the pigs and stables were sprinkled, as is required for finishing pigs in Denmark [37], than during the two other days. This was seen in spite of a higher temperature during the two days with high exposure—and warmer days are usually associated with high air change rate. Sprinkling is required for animal production as a form of direct cooling, and sprinkling of water with or without oil mixed in has been observed to reduce the amount of inhalable dust in a variety of different work environments, including pig farms [38,39,40]. The nozzle heads of the sprinklers were located above the center of each pen and no nozzles were located above the walkway of the stable, where the air samples were taken. A reduction in the concentration of inhalable airborne fungi was expected, but the fungal concentrations were even higher than the days where sprinkling did not occur. It is therefore possible that the sprinkling, and the subsequent droplets created, caused the deposition of fungal particles from the air column above the sampling position; thereby, increasing the concentration of CFUs when sampling using the ACI-6. No changes in fungal species or OTU richness were observed on days where the pigs and pens were sprinkled (Figure 6C,D, and Supplementary Figure S1). It could also be that the culturability of the airborne fungi was enhanced by the increase in humidity caused by the sprinkling. In addition, the increase could have also been caused by the change in physical activity by the pigs moving while being sprinkled, as the concentration of dust within pig farms is known to be dependent on the activity level of the pigs [40].
Despite significant differences in the concentration of culturable airborne fungi found over the sampling days, the Dg of the airborne particles with culturable fungi remained similar. These particles were associated with a geometric mean diameter of 2.1–4.7 µm and can deposit in the mid-lungs, such as the bronchi. In contrast, the Dg of the airborne viable, and total fungi as sampled with the ACI-8 were much smaller, associated with particle sizes of 1.5 and 2.1 µm, respectively. The smaller particle sizes measured were attributed to the higher number of fungal reads in the GF filters from lower stages of the ACI-8 on the first two sampling days. For ACI-8 samples from the 3rd and 17th of July, the Dg was associated with larger particle sizes, of 4.5 and 2.2 µm for the viable and total airborne fungi. These results from sequencing support the results obtained from culturing in regard to the geometric mean aerodynamic diameter of fungal particles, within this pig farm. Species, which exhibit allergenic potential, were observed in all size ranges (0.65–12.0 µm). Additionally, human pathogens, such as Aspergillus fumigatus and A. terreus, were associated with or were present as smaller particles (1.1–3.3 µm). Although normally cleared by the immune system, aspergilli depositing so deeply in the airways can cause invasive disease in susceptible population groups [41]. Supporting the culturing results, sequencing revealed multiple genera containing species known to be human pathogens, allergenic, and toxin producers, such as Aspergillus, Alternaria, Trichosporon, and Malassezia. Some of the pathogens were associated with both small and large particle sizes, such as Aspergillus, which were found in particle size fractions larger than 2.1 µm, while other genera, such as Alternaria were only associated with larger particles.
In this study, both culturing and sequencing revealed a variety of different genera including plant pathogens, such as Thanatephorus and Dioszegia, not known to be associated with human disease. After sequencing however, in addition to the plant pathogens identified, a variety of gastrointestinal associated fungal genera were observed in all stages of the ACI-8, including Saccharomyces, Kazachstania, and Vishniacozyma [42]. Previous research regarding the fungal biodiversity in settling dust from five pig farms has found these gastrointestinal associated fungal genera [18]. Therefore, it is possible that a proportion of the airborne fungi may have originated from the fecal matter of the pigs, and that these fungi exhibit potential to deposit in all regions of workers’ airways.
In addition, it should be noted that while the ACI-6 is commonly used due the ease and standardization of sampling, its biggest disadvantage is the requirement to predetermine the sampling time to prevent under- and oversampling. As the concentration of fungal bioaerosols can vary by a factor of 106, having a sampler not limited by sampling time, such as the ACI-8, can prove useful. Nonetheless, the ACI-6 still proves invaluable for studying bioaerosol exposure, as researchers can go down to the species level for identification using microscopy- or proteometric-approaches, such as MALDI-TOF MS. This is in contrast to amplicon sequencing of marker regions such as ITS of the rRNA operon, which are unable to obtain an identification down the species level [9], necessitating the need for multiple sampling strategies for airborne fungal exposure studies that involve culturing and sequencing based methods.
Culturing is well known to have limitations in regard to the growth and subsequent identification of fastidious microorganisms (the great plate count anomaly). Despite this, we observed several genera, including Epicoccum and Scopulariopsis, identified after culturing, which were not identified by sequencing. This could be due to the type of DNA extraction kit and primer choice, and choice of reference database [43]. On the other hand, although members of the genus Malassezia are generally culturable, they were not detected by culturing in the present study, and this may be because they require a much more complex medium than DG18 to grow [44]. Therefore, it is an advantage to use sequencing-based methods to supplement culturing-based methods, to capture a better coverage of the diversity of airborne fungi. However, one of the main disadvantages of sequencing is due to sequencing data being based off relative abundances of sequencing reads and not based on the number of cells or spores. Some fungal species can exhibit large ploidy variation [45] with multiple, or single copies of their genome present. In addition, not all species fungi have the same number of rRNA operons in their genome [46]. For these reasons, all comparisons between the fungal species identified using culture-based methods and fungal genera identified after sequencing, as shown in Figure 5, were done using presence–absence data.
Overall, a low diversity was observed for the samples taken using the ACI-8. Other studies which have been done analyzing the airborne fungal diversity have found a greater diversity (>1000 OTUs) of airborne fungi in outdoor air samples [47,48]. The cause for this lower diversity could have been due to sampling location, number of samples taken, and sampling method. Previous research on using the ACI-8 for sampling fungal diversity showed a difference in the genera observed in regards to their potential deposition in the airways, but those samples were taken outdoors in a metropolitan area for a substantially longer period of time (ca. four weeks) [9,10]. Sampling for longer periods of time will help with obtaining higher amounts of biomass which can be used for sequencing. However, with our study design, we found it more important to compare the airborne fungal diversity observed in samples taken using the ACI-6 with the ACI-8. Such long-term sampling in a commercial pig farm using the ACI-6 is simply not feasible, as it would require frequent exchange of the agar. In addition, longer sampling times run the risk of drying the sampled material, a well-known issue when sampling bioaerosols, as not only do the microorganisms dry out, but also the area under impaction, such as agar or a filter, will desiccate. For the ACI-6, desiccation of agar can result in microorganisms “bouncing” off the sampled area, resulting in loss of biomass [49,50,51]. Although suggestions for reducing bioaerosol particle bounce for the ACI-6 have been made [7], none have thus far been made for improving sampling of bioaerosols using the ACI-8. Despite these technical issues, we were still able to obtain relatively similar results to those observed when sampling using the ACI-6. For example, Cladosporium was observed in every stage of both the ACI-6, and -8, and Aspergillus was the dominant genera on the fourth sampling day when using the ACI-6 and -8.
A large overlap (69%) of fungal genera were observed in the samples treated with, and without PMA. Some of these fungal genera included Cladosporium and Trichosporon, which contain allergenic and pathogenic species, respectively. Due to these genera being observed in both samples treated with and without PMA, we therefore assume that they were generally viable, as PMA did not interfere with the amplification of DNA from these genera. An extra 27% of identified fungal genera were only observed in the non-PMA treated samples. These included the enteric yeasts Kazachstania and Vishniacozyma, which as previously mentioned, are associated with the gastrointestinal tracts of pigs [52,53]. As DNA from these fungal genera were only amplified in the non-PMA treated samples, we therefore assume that they were non-viable or membrane damaged at the time of sampling, as PMA treated DNA is not amplifiable [54].
Overall, samples treated with PMA were observed to have a lower microbial diversity compared with untreated samples. In addition, GF filters from the lower stages of the ACI-8 were noted to have a higher proportion of non-viable genera, including Cladosporium and Trichosporon. This is likely due to small fungal fragments being collected in the final stages, as the aerodynamic diameter cut-off ranges of the final two stages (0.4–1.1 µm) are smaller than most fungal spores. Unexpectedly, we detected ten genera in low abundance (<4%) (Penicillium, Daedaleopsis, Mrakia, Schizophyllum, and six others) in the samples treated with PMA, but they were not observed in the untreated samples. The cause of this could be heterogeneous deposition of airborne fungi on the GFs, which could have caused other fungal genera to deposit on one section of the filter, but not another.
However, two of the genera identified in the non-PMA treated samples, Alternaria and Botrytis, were cultured in samples that were taken using the ACI-6. It is possible that if viable hyphal fragments with a damaged cell wall were exposed to PMA, the dye could pass through the septa and bind to the DNA in connected fungal cells. In addition, it is also possible that the filter pieces used for sequencing did not contain cells from these genera due to heterogeneous deposition. At the time of writing, no established protocol for the analysis of viable fungi using PMA has been made, with researchers using a variation of different incubation and exposure times, and different light sources for exposure [12,21], all of which are known to affect the effect of PMA based on the sample matrix [55]. For these reasons, it is also possible that the effect of PMA treatment on the GF filter pieces could have affected the observed viable and “total” airborne fungi.
Fungal diversity in samples taken using the ACI-6 was explored using Jaccard dissimilarity index values and revealed significant differences in the microbial communities observed amongst the different stages of the ACI-6 and across sampling days. However, although the p-values obtained were significant (p < 0.001), the corresponding R test statistic value for the microbial communities amongst the different stages was extremely low (R < 0.01). Thus, the differences between the airborne fungal microbial communities associated with different particle sizes in this particular pig farm may be minimal.

5. Conclusions

We found a range of airborne fungal particles in pig stables between 377 and 2172 CFUs/m3, which varied between sampling days and the diversity of airborne fungi was different between sampling days. Thus, indicating that an air sample taken on a single day will not be representative of a workers’ potential exposure. The culturable airborne fungal particles were of a size known to exhibit potential to deposit in the bronchi/bronchioles of humans (aerodynamic Dg between 3.7 and 4.6 µm), and 69% of the culturable airborne fungi were considered respirable. Supporting the culturing results, the Dg of sequenced fungal reads from the 3rd and 4th sampling days revealed that the Dg of the airborne viable and total fungi was 4.5 and 2.2 µm, respectively.
Furthermore, culturing of aerosol samples revealed several species of allergenic fungi, such as Cladosporium herbarum, Aureobasidium pullulans, and Botrytis cinerea, and pathogens such as Aspergillus fumigatus, Aspergillus nidulans, and Trichosporon cutaneum. All of which can cause short and long-term respiratory illness. Not all detected airborne fungi were viable, including several gastrointestinal associated fungal genera such as Kazachstania, Saccharomyces, and Vishniacozyma. On days where the pigs and stables were sprinkled during sampling, a higher concentration of culturable fungal particles was detected. In contrast, the aerodynamic diameter, number of fungal species, and OTU level richness were not affected by the sprinkling.

Supplementary Materials

The following are available online at https://www.mdpi.com/2073-4433/11/6/639/s1. Figure S1. Species level richness for each of the six stages of the ACI-6 over the four sampling days. Figure S2. Rarefaction curve of the fungal reads per sample after sequencing of the glass fiber filter samples. Table S1. Genera which are shared and specific to samples which have or have not been treated with PMA. Samples which fall under the category “Untreated Samples” are those which are considered non-viable as their DNA was not amplified and detected after sequencing.

Author Contributions

J.K.W.: conceptualization, investigation, data curation, methodology, software, writing—original draft, study design, formal analysis, and visualization. J.L.N.: supervision, writing—editing and reviewing, resources, and funding acquisition. A.M.M.: supervision, project administration, writing—editing and reviewing, and funding acquisition. All authors have read and agreed to the published version of the manuscript.

Funding

This study was supported by the National Research Centre for the Working Environment, the Danish Working Authority, and Aalborg University.

Acknowledgments

We would like to give our deepest thanks to the farmers who helped open their doors to allow us to perform this study. We would also like to thank Margit Wagtberg Frederiksen for her excellent technical assistance in the laboratory.

Conflicts of Interest

The authors declare no conflict of interest.

References

  1. Vogelzang, P.F.J.; Van Der Gulden, J.W.J.; Schayck, C.P.; va Folgering, H.; Heederik, D.; Tielen, M.J.M. Longitudinal changes in bronchial responsiveness associated with swine confinement dust exposure. Chest 2000, 117, 1488–1495. [Google Scholar] [CrossRef] [PubMed] [Green Version]
  2. Cambra-López, M.; Aarnink, A.J.A.; Zhao, Y.; Calvet, S.; Torres, A.G. Airborne particulate matter from livestock production systems: A review of an air pollution problem. Environ. Pollut. 2010, 158, 1–17. [Google Scholar] [CrossRef] [PubMed]
  3. Baxi, S.N.; Portnoy, J.M.; Larenas-Linnemann, D.; Phipatanakul, W.; Barnes, C.; Grimes, C.; Horner, W.E.; Kennedy, K.; Levetin, E.; Miller, J.D.; et al. Exposure and Health Effects of Fungi on Humans. J. Allergy Clin. Immunol. Pract. 2016, 4, 396–404. [Google Scholar] [CrossRef] [PubMed] [Green Version]
  4. Barac, A.; Ong, D.S.Y.; Jovancevic, L.; Peric, A.; Surda, P.; Spiric, V.T.; Rubino, S. Fungi-induced upper and lower respiratory tract allergic diseases: One entity. Front. Microbiol. 2018, 9, 1–10. [Google Scholar] [CrossRef] [PubMed]
  5. Shah, A.; Panjabi, C. Allergic bronchopulmonary aspergillosis: A perplexing clinical entity. Allergy Asthma Immunol. Res. 2016, 8, 282–297. [Google Scholar] [CrossRef] [Green Version]
  6. Stevens, D.A.; Kan, V.L.; Judson, M.A.; Morrison, V.A.; Dummer, S.; Denning, D.W.; Bennett, J.E.; Walsh, T.J.; Patterson, T.F.; Pankey, G.A. Practice Guidelines for Diseases Caused by Aspergillus. Clin. Infect. Dis. 2000, 30, 696–709. [Google Scholar] [CrossRef]
  7. Xu, Z.; Wei, K.; Wu, Y.; Shen, F.; Chen, Q.; Li, M.; Yao, M. Enhancing Bioaerosol Sampling by Andersen Impactors Using Mineral-Oil-Spread Agar Plate. PLoS ONE 2013, 8, e56896. [Google Scholar] [CrossRef] [Green Version]
  8. Uhrbrand, K.; Schultz, A.C.; Koivisto, A.J.; Nielsen, U.; Madsen, A.M. Assessment of airborne bacteria and noroviruses in air emission from a new highly-advanced hospital wastewater treatment plant. Water Res. 2017, 112, 110–119. [Google Scholar] [CrossRef]
  9. Yamamoto, N.; Nazaroff, W.W.; Peccia, J. Assessing the aerodynamic diameters of taxon-specific fungal bioaerosols by quantitative PCR and next-generation DNA sequencing. J. Aerosol Sci. 2014, 78, 1–10. [Google Scholar] [CrossRef] [Green Version]
  10. Yamamoto, N.; Bibby, K.; Qian, J.; Hospodsky, D.; Rismani-Yazdi, H.; Nazaroff, W.W.; Peccia, J. Particle-size distributions and seasonal diversity of allergenic and pathogenic fungi in outdoor air. ISME J. 2012, 6, 1801–1811. [Google Scholar] [CrossRef] [Green Version]
  11. Emerson, J.B.; Adams, R.I.; Román, C.M.B.; Brooks, B.; Coil, D.A.; Dahlhausen, K.; Ganz, H.H.; Hartmann, E.M.; Hsu, T.; Justice, N.B.; et al. Schrödinger’s microbes: Tools for distinguishing the living from the dead in microbial ecosystems. Microbiome 2017, 5, 86. [Google Scholar] [CrossRef]
  12. Nguyen, L.D.N.; Deschaght, P.; Merlin, S.; Loywick, A.; Audebert, C.; Van Daele, S.; Viscogliosi, E.; Vaneechoutte, M.; Delhaes, L. Effects of propidium monoazide (PMA) treatment on mycobiome and bacteriome analysis of cystic fibrosis airways during exacerbation. PLoS ONE 2016, 11, e0168860. [Google Scholar] [CrossRef] [Green Version]
  13. Templeton, S.P.; Buskirk, A.D.; Law, B.; Green, B.J.; Beezhold, D.H. Role of germination in Murine airway CD8+ T-cell responses to Aspergillus conidia. PLoS ONE 2011, 6, e18777. [Google Scholar] [CrossRef] [PubMed] [Green Version]
  14. Croston, T.L.; Nayak, A.P.; Lemons, A.R.; Goldsmith, W.T.; Gu, J.K.; Germolec, D.R.; Beezhold, D.H.; Green, B.J. Influence of Aspergillus fumigatus conidia viability on murine pulmonary microRNA and mRNA expression following subchronic inhalation exposure. Clin. Exp. Allergy 2016, 46, 1315–1327. [Google Scholar] [CrossRef] [PubMed] [Green Version]
  15. Simon-Nobbe, B.; Denk, U.; Pöll, V.; Rid, R.; Breitenbach, M. The Spectrum of Fungal Allergy. Int. Arch. Allergy Immunol. 2008, 145, 58–86. [Google Scholar] [CrossRef]
  16. Horner, W.E.; Helbling, A.; Salvaggio, J.E.; Lehrer, S.B. Fungal allergens. Clin. Microbiol. Rev. 1995, 8, 161–179. [Google Scholar] [CrossRef] [PubMed]
  17. Mitakakis, T.Z.; O’Meara, T.J.; Tovey, E.R. The effect of sunlight on allergen release from spores of the fungus Alternaria. Grana 2003, 42, 43–46. [Google Scholar] [CrossRef]
  18. White, J.K.; Nielsen, J.L.; Madsen, A.M. Microbial species and biodiversity in settling dust within and between pig farms. Environ. Res. 2019, 171, 558–567. [Google Scholar] [CrossRef] [PubMed]
  19. Madsen, A.M.; Kurdi, I.; Feld, L.; Tendal, K. Airborne MRSA and Total Staphylococcus aureus as Associated With Particles of Different Sizes on Pig Farms. Ann. Work Exp. Health 2018, 1–12. [Google Scholar] [CrossRef] [PubMed] [Green Version]
  20. Madsen, A.M.; Zervas, A.; Tendal, K.; Nielsen, J.L. Microbial diversity in bioaerosol samples causing ODTS compared to reference bioaerosol samples as measured using Illumina sequencing and MALDI-TOF. Environ. Res. 2015, 140, 255–267. [Google Scholar] [CrossRef] [Green Version]
  21. Checinska Sielaff, A.; Urbaniak, C.; Mohan, G.B.M.; Stepanov, V.G.; Tran, Q.; Wood, J.M.; Minich, J.; McDonald, D.; Mayer, T.; Knight, R.; et al. Characterization of the total and viable bacterial and fungal communities associated with the International Space Station surfaces. Microbiome 2019, 7, 50. [Google Scholar] [CrossRef] [PubMed] [Green Version]
  22. Ghannoum, M.A.; Jurevic, R.J.; Mukherjee, P.K.; Cui, F.; Sikaroodi, M.; Naqvi, A.; Gillevet, P.M. Characterization of the oral fungal microbiome (mycobiome) in healthy individuals. PLoS Pathog. 2010, 6. [Google Scholar] [CrossRef] [PubMed] [Green Version]
  23. Caporaso, J.G.; Lauber, C.L.; Walters, W.A.; Berg-Lyons, D.; Huntley, J.; Fierer, N.; Owens, S.M.; Betley, J.; Fraser, L.; Bauer, M.; et al. Ultra-high-throughput microbial community analysis on the Illumina HiSeq and MiSeq platforms. ISME J. 2012, 6, 1621–1624. [Google Scholar] [CrossRef] [PubMed] [Green Version]
  24. Edgar, R.C. Search and clustering orders of magnitude faster than BLAST. Bioinformatics 2010, 26, 2460–2461. [Google Scholar] [CrossRef] [Green Version]
  25. Kõljalg, U.; Nilsson, R.H.; Abarenkov, K.; Tedersoo, L.; Taylor, A.F.S.; Bahram, M.; Bates, S.T.; Bruns, T.D.; Bengtsson-Palme, J.; Callaghan, T.M.; et al. Towards a unified paradigm for sequence-based identification of fungi. Mol. Ecol. 2014, 22, 5271–5277. [Google Scholar] [CrossRef] [Green Version]
  26. RSudio Team. RStudio: Integrated Development Environment for R; RSudio Inc.: Boston, MA, USA, 2016. [Google Scholar]
  27. Team, R.C. R: A Language and Environment for Statistical Computing; R Foundation for Statistical Computing: Vienna, Austria, 2015. [Google Scholar]
  28. Wickham, H. ggplot2: Elegant Graphics for Data Analysis; Springer: Berlin/Heidelberg, Germany, 2009. [Google Scholar]
  29. Bates, D.; Mächler, M.; Bolker, B.; Walker, S. Fitting Linear Mixed-Effects Models Using lme4. J. Stat. Softw. 2015, 67. [Google Scholar] [CrossRef]
  30. Fox, J.; Weisberg, S. An R Companion to Applied Regression, 3rd ed.; Sage: Thousand Oaks, CA, USA, 2019. [Google Scholar]
  31. Okasanen, J.; Blanchet, F.G.; Friendly, M.; Kindt, R.; Legendre, P.; McGlinn, D.; Minchin, P.R.; O’Hara, R.B.; Simpson, G.L.; Solymos, P.; et al. Vegan: Community Ecology Packgge; R Package Version 2.0-10; R Foundation for Statistical Computing: Vienna, Austria, 2018. [Google Scholar]
  32. Ausschuss für Biologische Arbeitsstoffe. Technische Regeln für Biologische Arbeitsstoffe: Einstufung von Pilzen in Risikogruppen; BAuA: Dortmund, Germany, 2016. [Google Scholar]
  33. Sowiak, M.; Bródka, K.; Buczyńska, A.; Cyprowski, M.; Kozajda, A.; Sobala, W.; Szadkowska-Stańczyk, I. An assessment of potential exposure to bioaerosols among swine farm workers with particular reference to airborne microorganisms in the respirable fraction under various breeding conditions. Aerobiologia (Bologna) 2011, 28, 121–133. [Google Scholar] [CrossRef]
  34. Chang, C.W.; Chung, H.; Huang, C.F.; Su, H.J.J. Exposure of workers to airborne microorganisms in open-air swine houses. Appl. Environ. Microbiol. 2001, 67, 155–161. [Google Scholar] [CrossRef] [PubMed] [Green Version]
  35. Madsen, A.M.; Markouch, A.; Frederiksen, M.W.; Tendal, K. Measurement of dust-borne MRSA in pig farms using different approaches. J. Appl. Microbiol. 2019, 126, 1580–1593. [Google Scholar] [CrossRef] [PubMed]
  36. Heederik, D.; Brouwer, R.; Biersteker, K.; Boleij, J.S.M. Relationship of airborne endotoxin and bacteria levels in pig farms with the lung function and respiratory symptoms of farmers. Int. Arch. Occup. Environ. Health 1991, 62, 595–601. [Google Scholar] [CrossRef] [PubMed]
  37. Fødevarestyrelsen. Bekendtgørelse af Lov om Indendørs Hold af Smågrise, Avls-og Slagtesvin; Retsinformation: Copenhagen, Denmark, 2017. [Google Scholar]
  38. Prostański, D. Use of Air-and-Water Spraying Systems for Improving Dust Control in Mines. J. Sustain. Min. 2013, 12, 29–34. [Google Scholar] [CrossRef] [Green Version]
  39. Pedersen, S.; Nonnenmann, M.; Rautiainen, R.; Demmers, T.G.M.; Banhazi, T.; Lyngbye, M. Dust in pig buildings. J. Agric. Saf. Health 2000, 6, 261–274. [Google Scholar] [CrossRef] [Green Version]
  40. Gustafsson, G. Factors affecting the release and concentration of dust in pig houses. J. Agric. Eng. Res. 1999, 74, 379–390. [Google Scholar] [CrossRef] [Green Version]
  41. Kousha, M.; Tadi, R.; Soubani, A.O. Pulmonary aspergillosis: A clinical review. Eur. Respir. Rev. 2011, 20, 156–174. [Google Scholar] [CrossRef] [PubMed] [Green Version]
  42. Arfken, A.M.; Frey, J.F.; Ramsay, T.G.; Summers, K.L. Yeasts of Burden: Exploring the Mycobiome–Bacteriome of the Piglet GI Tract. Front. Microbiol. 2019, 10, 1–14. [Google Scholar] [CrossRef] [PubMed]
  43. Porter, T.M.; Golding, G.B. Factors that affect large subunit ribosomal DNA amplicon sequencing studies of fungal communities: Classification method, primer choice, and error. PLoS ONE 2012, 7, e35749. [Google Scholar] [CrossRef]
  44. Kaneko, T.; Makimura, K.; Abe, M.; Shiota, R.; Nakamura, Y.; Kano, R.; Hasegawa, A.; Sugita, T.; Shibuya, S.; Watanabe, S.; et al. Revised culture-based system for identification of Malassezia species. J. Clin. Microbiol. 2007, 45, 3737–3742. [Google Scholar] [CrossRef] [Green Version]
  45. Todd, R.T.; Forche, A.; Selmecki, A. Ploidy Variation in Fungi: Polyploidy, Aneuploidy, and Genome Evolution. Microbiol. Spectr. 2017, 5, 139–148. [Google Scholar] [CrossRef] [Green Version]
  46. Lofgren, L.A.; Uehling, J.K.; Branco, S.; Bruns, T.D.; Martin, F.; Kennedy, P.G. Genome-based estimates of fungal rDNA copy number variation across phylogenetic scales and ecological lifestyles. Mol. Ecol. 2019, 28, 721–730. [Google Scholar] [CrossRef]
  47. Yan, D.; Zhang, T.; Su, J.; Zhao, L.L.; Wang, H.; Fang, X.M.; Zhang, Y.Q.; Liu, H.Y.; Yu, L.Y. Diversity and composition of airborne fungal community associated with particulate matters in Beijing during haze and non-haze days. Front. Microbiol. 2016, 7, 1–12. [Google Scholar] [CrossRef] [Green Version]
  48. Karlsson, E.; Johansson, A.M.; Ahlinder, J.; Lundkvist, M.J.; Singh, N.J.; Brodin, T.; Forsman, M.; Stenberg, P. Airborne microbial biodiversity and seasonality in Northern and Southern Sweden. PeerJ 2020, 2020, 1–25. [Google Scholar] [CrossRef] [PubMed] [Green Version]
  49. Li, C.S.; Lin, Y.C. Sampling Performance of Impactors for Bacterial Bioaerosols. Aerosol Sci. Technol. 1999, 30, 280–287. [Google Scholar] [CrossRef] [Green Version]
  50. Grinshpun, S.A.; Willeke, K.; Ulevicius, V.; Juozaitis, A.; Terzieva, S.; Donnelly, J.; Stelma, G.N.; Brenner, K.P. Effect of impaction, bounce and reaerosolization on the collection efficiency of impingers. Aerosol Sci. Technol. 1997, 26, 326–342. [Google Scholar] [CrossRef]
  51. Mainelis, G.; Tabayoyong, M. The effect of sampling time on the overall performance of portable microbial impactors. Aerosol Sci. Technol. 2010, 44, 75–82. [Google Scholar] [CrossRef] [Green Version]
  52. Urubschurov, V.; Janczyk, P.; Souffrant, W.B.; Freyer, G.; Zeyner, A. Establishment of intestinal microbiota with focus on yeasts of unweaned and weaned piglets kept under different farm conditions. FEMS Microbiol. Ecol. 2011, 77, 493–502. [Google Scholar] [CrossRef] [PubMed] [Green Version]
  53. Ramayo-Caldas, Y.; Prenafeta, F.; Zingaretti, L.M.; Gonzales, O.; Dalmau, A.; Quintanilla, R.; Ballester, M. Gut eukaryotic communities in pigs: Diversity, composition and host genetics contribution. bioRxiv 2020, 2. [Google Scholar] [CrossRef] [Green Version]
  54. Nocker, A.; Richter-Heitmann, T.; Montijn, R.; Schuren, F.; Kort, R. Discrimination between live and dead cells in bacterial communities from environmental water samples analyzed by 454 pyrosequencing. Int. Microbiol. 2010, 13, 59–65. [Google Scholar] [CrossRef] [PubMed]
  55. Desneux, J.; Chemaly, M.; Pourcher, A.M. Experimental design for the optimization of propidium monoazide treatment to quantify viable and non-viable bacteria in piggery effluents. BMC Microbiol. 2015, 15, 164. [Google Scholar] [CrossRef] [PubMed] [Green Version]
Figure 1. Histograms of averaged CFU size distributions from each sampling day. Horizontal black lines represent the mean CFU concentration within the size bin with the standard error (σ) in red and blue for the +σ and −σ, respectively. The overall calculated the geometric mean aerodynamic diameter (Dg) of that sampling day is written at the top left corner of each plot.
Atmosphere 11 00639 g001
Figure 2. Bubble plots showing the total culturable microbial diversity amongst the four sampling days. On the left, each column represents the microbial diversity observed in the corresponding size fraction of the ACI-6 over the multiple sampling rounds, where the size of each circle represents the sum of the number of observations. The larger the circle, the more often that species was observed in that size fraction. On the right, attributes of the fungal species are given in regard to whether they are allergenic fungi (A), emerging pathogens (E), human pathogens from biological risk group 2 (P), or toxin producers (T). If not marked, then the species is not known to be allergenic, an emerging pathogen, a human pathogen, or a toxin producer.
Atmosphere 11 00639 g002
Figure 3. Bubble plot showing the total microbial diversity of presence/absence data amongst the eight stages of the ACI-8 (x-axis) during the four sampling days. The size of each circle represents the sum of the total number of observations of that genus/phylum amongst the four sampling days. The larger the circle, the more often that genus was observed in that size fraction. Samples that have and have not been treated with PMA are represented in this graph.
Atmosphere 11 00639 g003
Figure 4. Heatmap showing the percentage of positive samples with genera identified in both sequencing of samples treated with PMA and culture-based methods. For each sample type (culturing and sequencing) the percentage of positive identifications within that sample type is given. bd: below detection limit.
Atmosphere 11 00639 g004
Figure 5. Venn diagram presenting the top five shared and specific fungal genera between propidium monoazide (PMA)-treated and untreated samples. Fungal genera unique to the PMA-treated samples represented 4% of the identified fungal genera (left), fungal genera unique to the untreated samples represented 27% of the identified fungal genera (right), and 69% of the fungal genera were found in both PMA-treated and untreated samples (center).
Atmosphere 11 00639 g005
Figure 6. Bar charts showing on the y-axis, the mean number of fungal reads (A,B) and mean operational taxonomic units (OTU) richness (C,D) per stage of the ACI-8. Plots 6A and C are of the non-PMA samples (total fungal diversity), and plots 6B and D are of the PMA-treated (viable fungi). The lines within each histogram represent the standard error. The bar charts are colored based on their position within the ACI-8, representing different particle sizes.
Atmosphere 11 00639 g006
Table 1. Samples for this study were taken over four separate sampling days, one in the winter and three in the summer of 2019. The average and standard deviation of the relative humidity and temperature are shown for each sampling day.
DateSeasonRelative HumidityTemperature
21st of February 2019Winter38.3% ± 0.212.3 °C ± 0.7
19th of June 2019Summer62.9% ± 8.5 *24.2 °C ± 0.8
3rd of July 2019Summer53.9% ± 3.515.6 °C ± 0.5
17th of July 2019Summer69.5% ± 9.8 **19.9 °C ± 1.4
* The pigs and stables were sprinkled several times during sampling. ** Pigs and stables were sprinkled several times and near the end of sampling the pigs were fed and became very active.
Table 2. Analysis of similarity (ANOSIM) permutational analyses of the culturable airborne fungal communities observed over different sampling days and size fractions using Jaccard distance measurements. P-values which are significant (p < 0.05) are written in bold. R-statistic values close to 1.0 suggest high dissimilarity between groups, while an R-statistic value close to 0.0 suggests no systematic differences between groups.
Testp-ValueR Statistic
CulturingDayANOSIM0.0010.4005
Size FractionANOSIM0.0010.06021
Sampling RoundANOSIM0.546−0.003511
SequencingDayANOSIM0.0010.2449
Size FractionANOSIM0.953−0.03387

