Article

Effect of Model Resolution on Intense and Extreme Precipitationinthe Mediterranean Region

1
CMCC, Climate Simulation and Prediction Division, 73100 Lecce, Italy
2
CMCC, Climate Simulation and Prediction Division, 40127 Bologna, Italy
3
Department of Biological and Environmental Sciences and Technologies, University of Salento - DiSTeBA, 73100 Lecce, Italy
*
Author to whom correspondence should be addressed.
Atmosphere 2020, 11(7), 699; https://doi.org/10.3390/atmos11070699
Submission received: 15 May 2020 / Revised: 22 June 2020 / Accepted: 29 June 2020 / Published: 1 July 2020

Abstract

:
This study explores the role of model resolution on the simulation of precipitation and on the estimate of its future change in the Mediterranean region. It compares the results of two regional climate models (RCMs, with two different horizontal grid resolutions, 0.44 and 0.11 degs, covering the whole Mediterranean region) and of the global climate model (GCM, 0.75 degs) that has provided the boundary conditions for them. The regional climate models include an interactive oceanic component with a resolution of 1/16 degs. The period 1960–2100 and the representative concentration pathways RCP4.5 and RCP8.5 are considered. The results show that, in the present climate, increasing resolution increases total precipitation and its extremes over steep orography, while it has the opposite effect over flat areas and the sea. Considering climate change, in all simulations, total precipitation will decrease over most of the considered domain except at the northern boundary, where it will increase. Extreme precipitation will increase over most of the northern Mediterranean region and decrease over the sea and some southern areas. Further, the overall probability of precipitation (frequency of wet days) significantly decreases over most of the region, but wet days will be characterized with precipitation intensity higher than the present. Our analysis shows that: (1) these projected changes are robust with respect to the considered range of model resolution; (2) increasing the resolution (within the considered resolution range) decreases the magnitude of these climate change effects. However, it is likely that resolution plays a less important role than other factors, such as the different physics of regional and global climate models. It remains to be investigated whether further increasing the resolution (and reaching the scale explicitly permitting convection) would change this conclusion.

1. Introduction

Climate change in the Mediterranean region poses critical issues on the future evolution of total precipitation [1,2,3,4,5,6], and of its extremes, their intensification with different trends at the sub-regional scale [7,8,9,10,11,12].
Particularly for precipitation, dynamical downscaling through the coupled regional climate model plays an important role to improve climate information at the regional fine-scale, since it modulates information produced by the global climate model (GCM), combining planetary scale processes with regional scale processes. Further, several studies show that to explicitly resolve the two-way interactions at the atmosphere–ocean interface influences the short time evolution of the system [13] and, generally, enhances the quality of climate simulations in the region of interest [5,14,15]. Here, we used a regional coupled model where two-way interaction is fully represented.
The role of resolution is often addressed for precipitation extremes and the need for high resolution is often advocated [16]. Benefits from improving resolution are shown, particularly over complex orography, such as the Alps [17,18]. However, a very high resolution (capable to explicitly resolve convection) is needed and other model components (mainly microphysics) have to be considered [19,20,21]. Some aspects of precipitation changes with global warming (such as winter rainfall intensity) have been found to show robust features persistent across different models’ resolutions, but other seasons (summer) and extremes depend significantly on model resolution [22] (for the southern UK).
The main novelty of this work is to analyze the simulation of precipitation using two downscaling of the same GCM, both covering the whole Mediterranean region (Figure 1a) and carried out with the same model (COSMOMed) [23,24]. One downscaling, at a horizontal grid resolution of about 0.44 degs (~50 Km), is named LRRCM (low-resolution regional climate model) and the other, at about 0.11 degs (~12 Km), is named HRRCM (high-resolution RCM). Both downscaling consider the RCP4.5 and RCP8.5 scenarios, that is the highest emission (RCP8.5) and the rather moderate (RCP4.5) scenarios. Since horizontal resolution is the only difference between the two regional simulations, this set of experiments represents a very interesting opportunity to assess the effective role of model grid resolution in simulating climate change over areas characterized by complex topographical features. The RCM simulations include an interactive ocean component, so that the atmospheric circulation and the Mediterranean Sea circulation are fully coupled.
The paper consists of 6 sections. Section 2 “Data and Methods” describes the models used and the simulations that have been carried out (Section 2.1), the indices used for describing the characteristics of precipitation (Section 2.2), areas (Figure 1b) and boxes (Figure 1c) within the model domain used for analyzing the results (Section 2.3) and specifically the probability of precipitation as a function of its daily intensity (Section 2.3). Results are split in two sections. Section 3 describes the effect of resolution on the precipitation indices: total precipitation (Section 3.1), frequency of wet days and daily precipitation intensity (Section 3.2), precipitation extremes and intense events (Section 3.3). This analysis is carried out considering the spatial distribution of these indices across the Mediterranean region. The effect of resolution on the probability of precipitation (Section 4.1) and of its intensity (Section 4.2) is described in Section 4, aggregating data over six boxes, selected to represent land areas with complex orography and sea surface areas. Results are discussed in Section 5 and main conclusions are shortly presented in Section 6.

2. Data and Methods

2.1. Climate Model and Simulations

Two climate representative concentration pathways are considered in this work: the RCP4.5 and RCP8.5scenarios [25] for a 95-yeartime period (2006–2100). The simulations forced with these two emission scenarios are the continuation of the simulation of the historical period (1960–2005).
Three different grid resolutions (0.11, 0.44, 0.75 degs) and two climate models are considered. The low resolution (0.75 degs) simulation has been carried out with a GCM model named CMCC-CM, which is a global coupled atmosphere-ocean general circulation model [26]. The higher resolution simulations (0.11 and 0.44 degs resolutions) are dynamical downscaling of the CMCC-CM simulation, at regional scale. They have been carried out using COSMOMed [23,24], which is a regional coupled atmosphere-ocean system, consisting of the limited area, atmospheric climate model COSMO-CLM [27] and the ocean-sea model NEMO [28], implemented in the Mediterranean Sea [29].The two-way coupling between COSMO-CLM and NEMO is performed by the coupler OASIS3-MCT, which, in turn, is formed by the Ocean Atmosphere Sea Ice Soil coupler (OASIS), [30], interfaced with the Model Coupling Toolkit (MCT) from the Argonne National Laboratory [31].
COSMO-CLM is implemented on rotated pole grids. The spatial domain (Figure 1a) of the RCMs covers the Mediterranean region, including an Atlantic box, ranging from 51.30° W to 63.48° E and from 10.77° N to 62.25° N, excluding the relaxation zone used for managing the boundary conditions. The ocean model is implemented at very high resolution in the Mediterranean basin (1/16 degs) (Figure 1a: black rectangle).
Three time slices of 30-years each are considered in our analysis (following the WMO recommendation for computing climate normals): the historical reference period (1961–1990, the most recent and complete WMO normal), the periods 2021–2050 (near-term) and 2071–2100 (long-term), representing the future climate for the emission scenarios RCP4.5 and RCP8.5. The statistical significance of differences among periods and simulations is based on the commonly used Mann–Whitney test [32,33] at the 5% significance level everywhere in the text.

2.2. Precipitation Indices

Depending on the impacts of precipitation regime changes, different characteristics are important. Here we consider seven indices describing different aspects, such as the total amount, the intensity of extreme events, changes in the probability distribution and thresholds charactering intensity. These seven indices area subset of the indices recommended by the CCl/CLIVAR/JCOMM Expert Team on Climate Change Detection and Indices [34] and are commonly adopted in climate analyses [35]:
  • TOT_PREC: annual total precipitation.
  • SDII: Simple daily precipitation intensity index, that is the average precipitation during wet days (defined as days with RR ≥ 1 mm, RR daily precipitation rate)
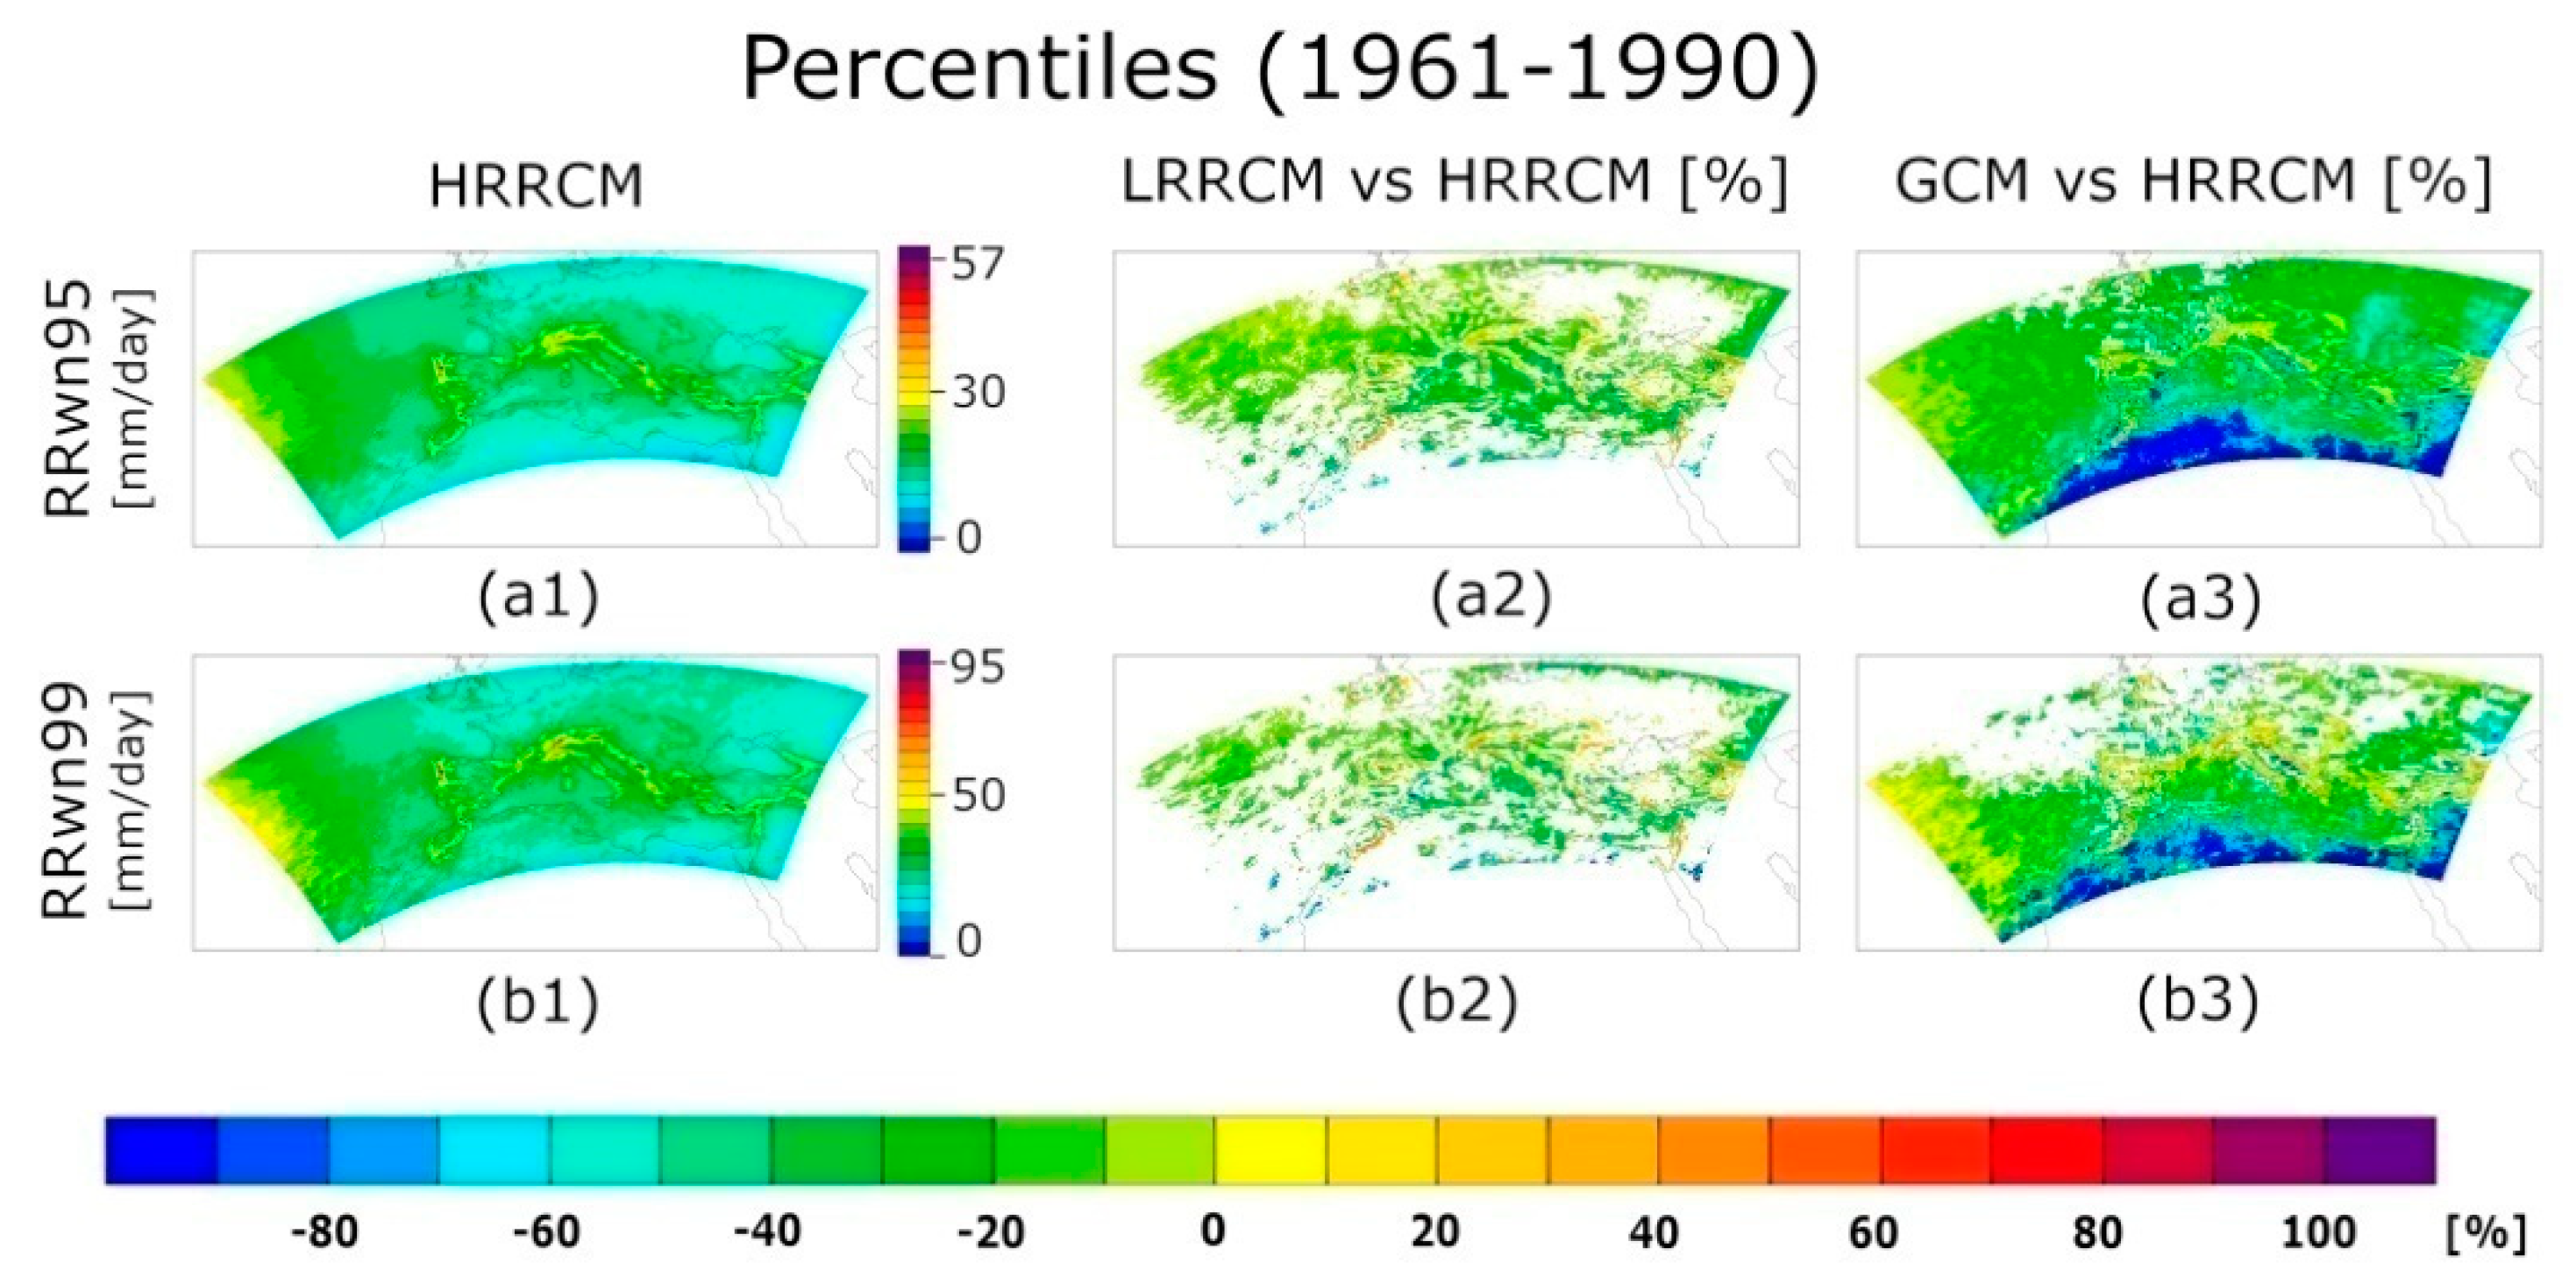
  • RRwn95: 95th percentile of precipitation considering only wet days. It is used as the threshold for N95 (see below) and calculated for the historical time slice period (1961–1990).
  • RRwn99 is defined as RRwn95 except it refers to the 99th percentile.
  • R95pTOT is the annual total precipitation amount when daily precipitation is greater than RRwn95.
  • Wet_days is the annual number of wet days.
  • N95 is the annual amount of wet days, that is number of days when RR ≥ RRwn95, using the 95th percentile computed during the reference period.
These indices are computed for all model simulations. The results of the coarser resolutions (0.44 degs and 0.75 degs) are interpolated on the grid of the finer one (0.11 degs). In other words, a common sub-grid covering the Mediterranean region at 0.11 × 0.11 degs horizontal resolution is adopted, with a lat/lon dimension 252 × 556, which corresponds to a total number of 140112 grid cells.
For all these indices the effect of grid resolution for the reference period (Figure 2) and on the climate change signal is computed. Further, the amount of grid cells with positive, negative and statistically no significant variations are computed. The results are expressed in percentage respect to the total horizontal amount of grid cells.

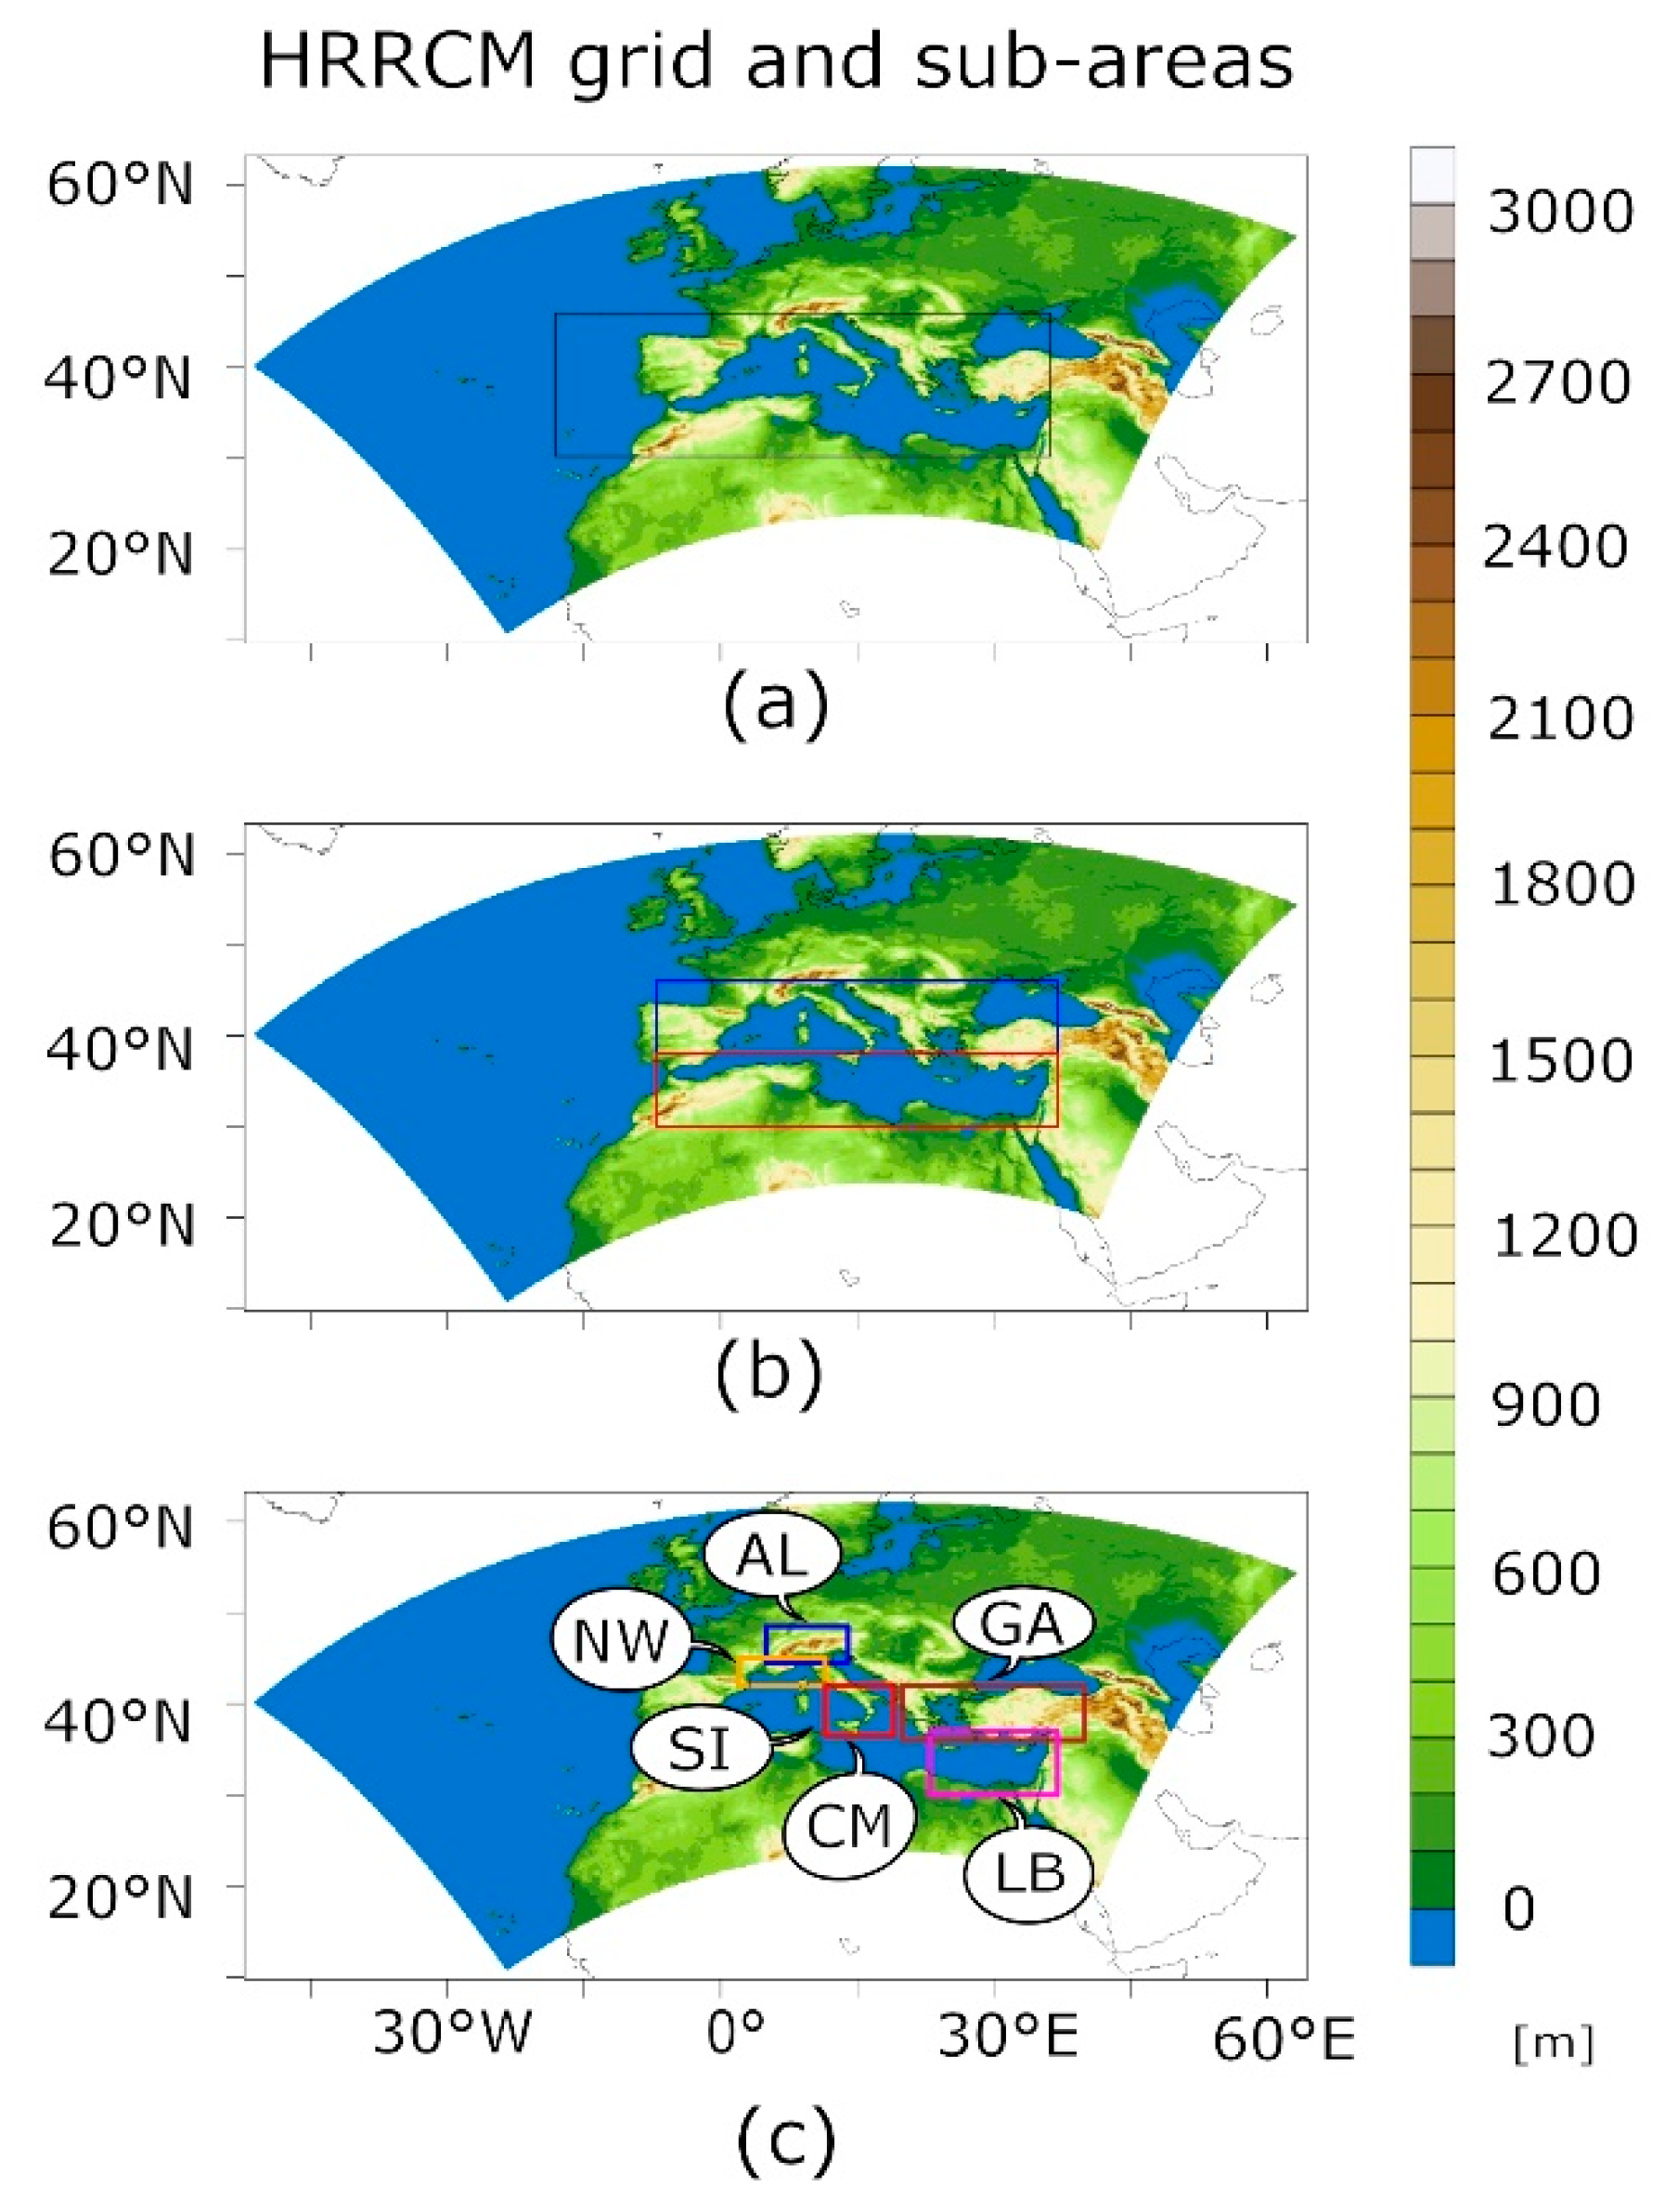
2.3. Areas, Boxes and Variables

In order to characterize the sub-regional characteristics of climate change, several areas are considered within the RCM domain.
Total precipitation, sea surface temperature and 2 m air temperature are averaged in the two areas shown in Figure 1b:
  • Northern Mediterranean (a rectangular area delimited from the corners 7° W–37° E and 38–46° N),
  • Southern Mediterranean (delimited form the corners 7° W–37° E and 30–38° N.
The period 1961–1990 is used as reference for the computation of the anomalies and long-term trends have been computed, considering the whole simulation period (1960–2100).
The probability of wet days and of daily precipitation intensity (see Section 2.3) is computed for six boxes, which have been selected for their different morphological characteristics. They are shown in Figure 1c.
  • Alpine region (AL), a rectangular longitude–latitude domain from 5 to 14° E and from 44.5 to 48.5° N, consisting only of land points. The domain extends over approximately 700 km from eastern France to mid Austria and over about 450 km from northern Italy to southern Germany.
  • North-West Mediterranean coast (NW), consisting of the land points inside the rectangular longitude–latitude domain from 2 to 11.5° E and from 42 to 45° N.
  • Southern Italy (SI) consisting of the land points inside the rectangular longitude–latitude domain from 11.5 to 19° E and from 36.5 to 42° N.
  • Central Mediterranean Sea (CM), consisting of the sea points inside the same rectangular grid used for Southern Italy.
  • Greece and Anatolia (GA), consisting of the land points inside a rectangular longitude-latitude domain from 20 to 40° E and from 36 to 42° N.
  • Levantine Basin (LB), consisting of the sea points inside the rectangular longitude -latitude domain from 23 to 37° E and from 30 to 37° N.

Wet Day Probability and Its Dependence on Intensity

Let Wi be the number of wet days (RR ≥ 1 mm) for the considered period and for the ith grid points. Let Np be the total number of points in the selected area and Nd the length of the time slice considered expressed in days. The probability of wet days (P), over one of the four areas, is estimated as:
P = i = 1 N p W i N p × N d
Four classes of daily precipitation intensity (c = 1,4) have been subjectively considered, which have a daily rain intensity in the intervals: 0–20 mm (1, weak), 20–40 mm (2, medium), 40–60 mm (3, strong) and larger than 60 (4, extreme). For each class c, the probability Pc of a wet day (conditional to a day being a wet day) in the class c has been computed as:
P c = i = 1 N p W c i i = 1 N p W i
where Wci is the number of wet days in the class c, for the considered period and for the ith grid points.
In other words, P is the probability that a wet day occurs in a point within an area. Pc is the probability that, if a day is wet, its precipitation has intensity in the class c.

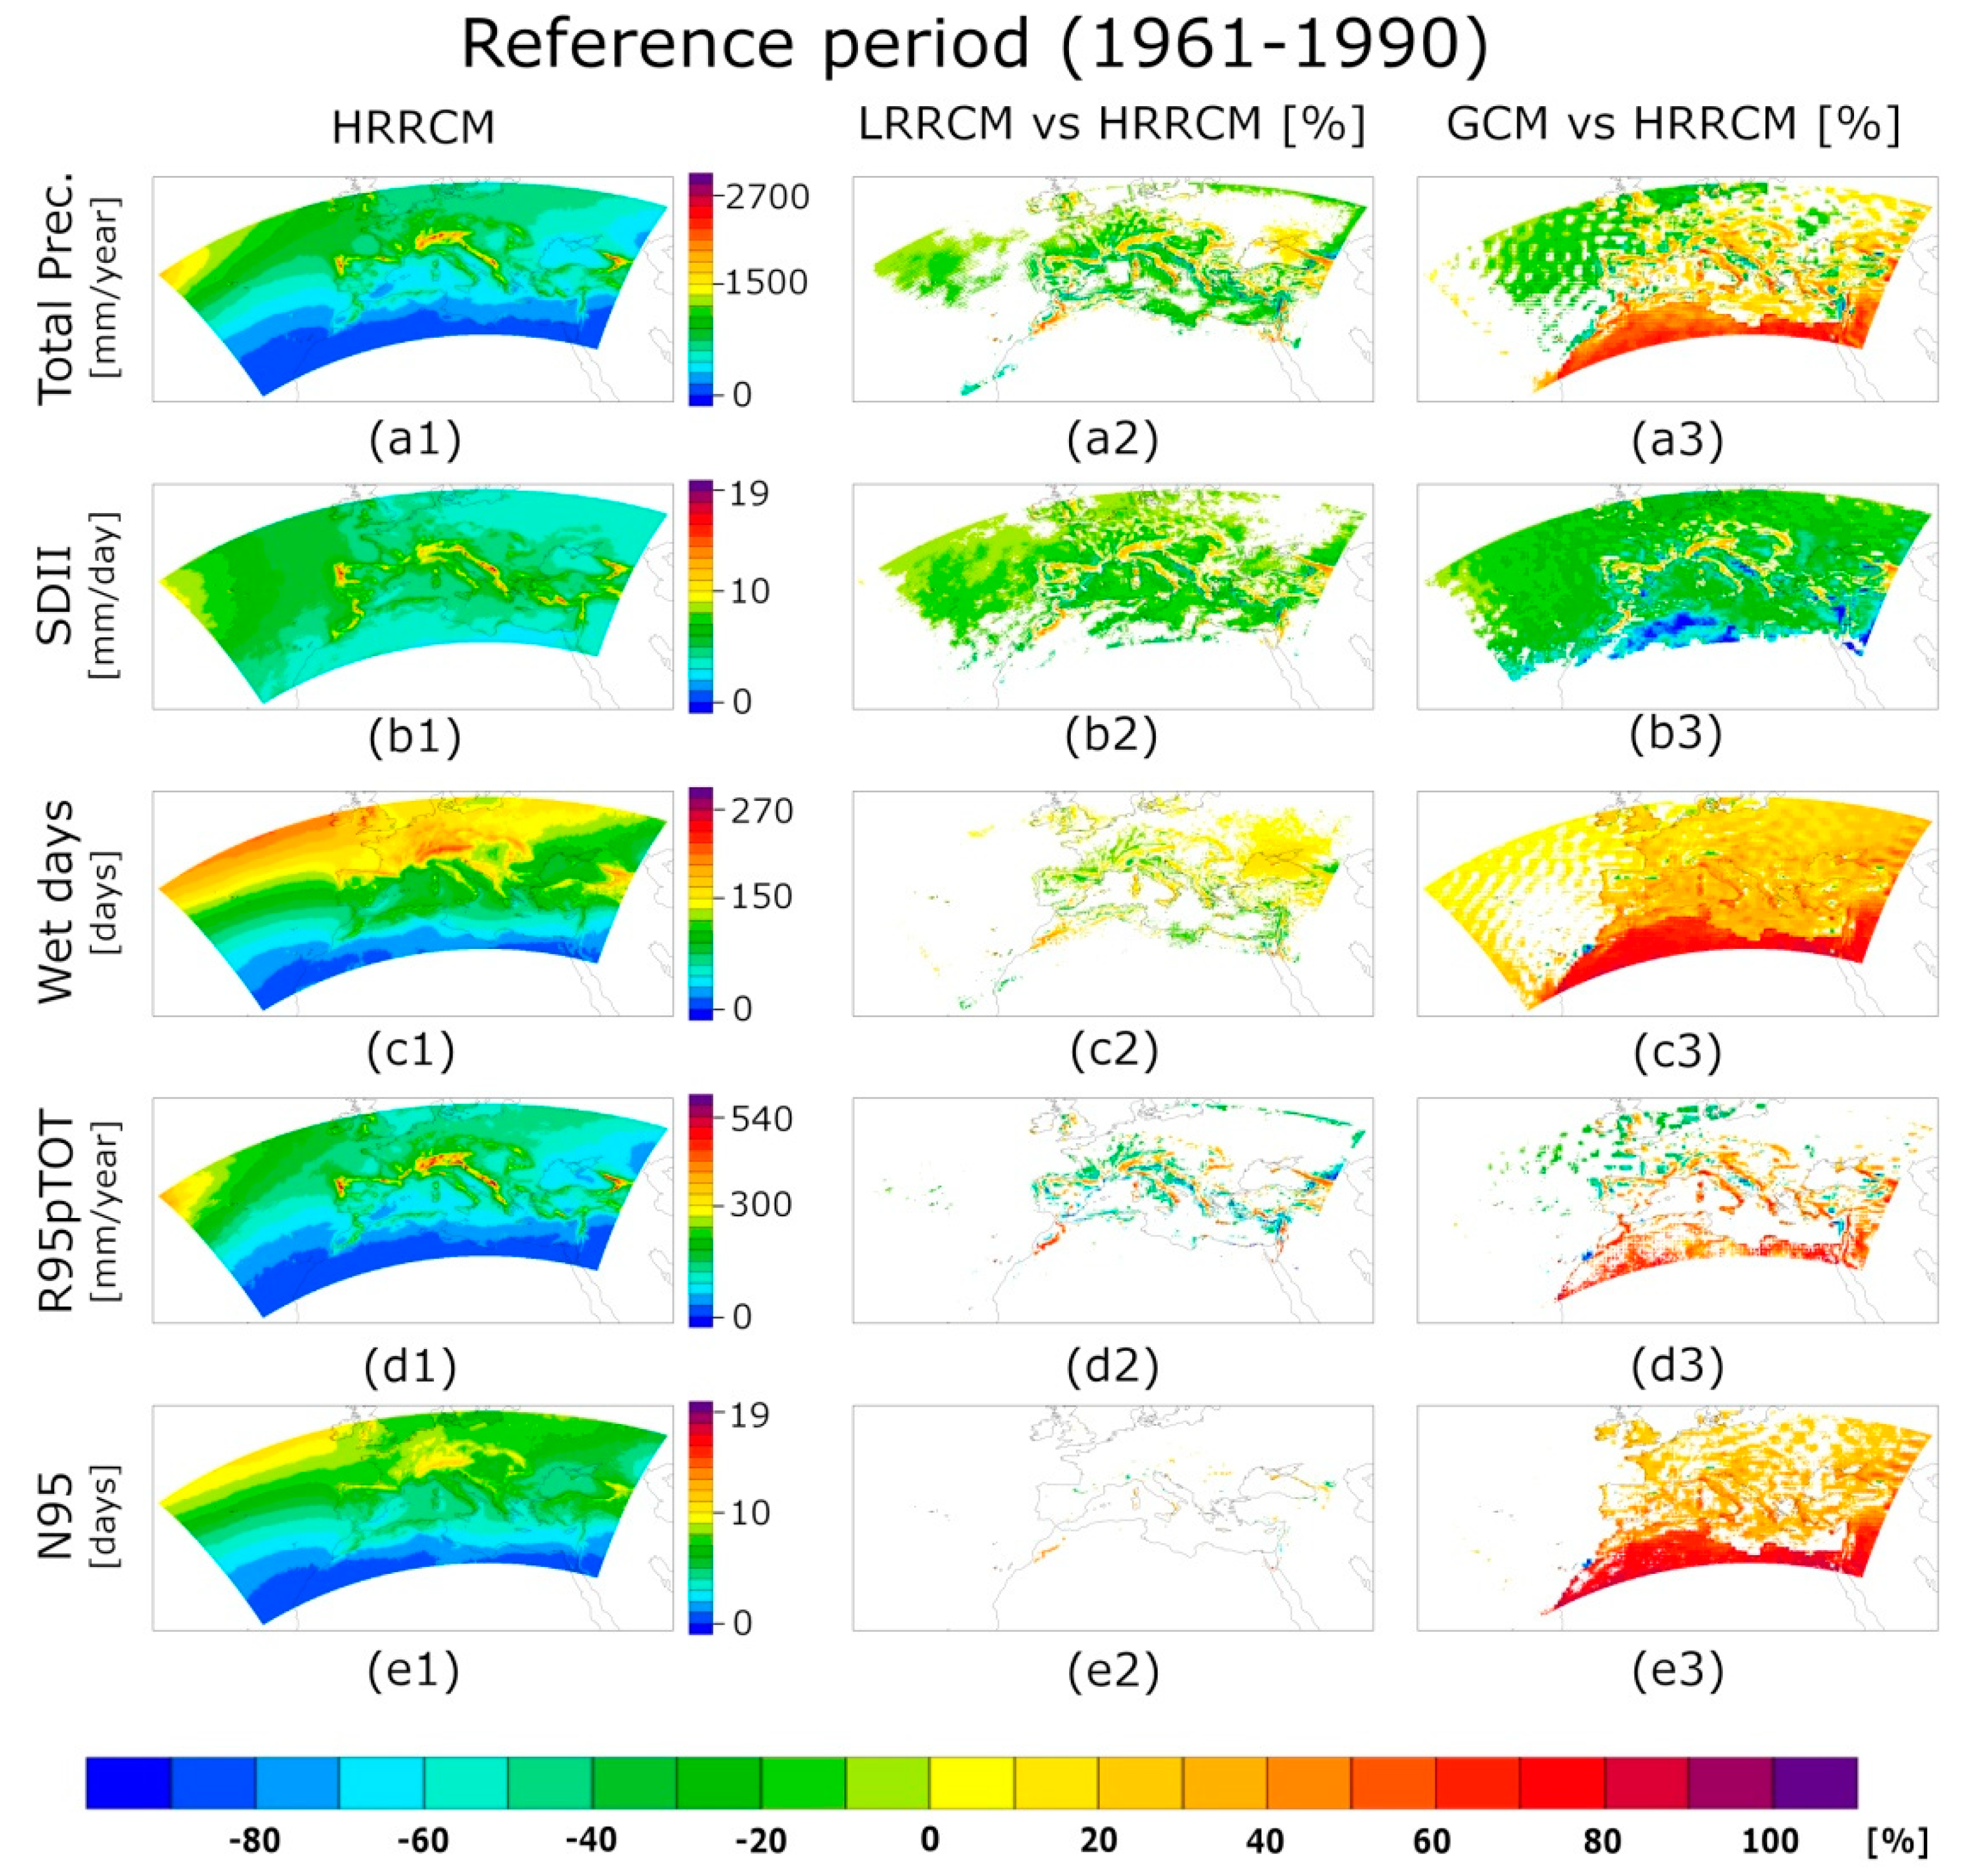
3. Results: Role of Resolution on Precipitation Patterns and Indices

All simulations in this study show a large regional warming. Table 1 shows the changes of 2 m air temperature (2 m T) and sea surface temperature (SST) in the period 2071–2100 with respect to 1961–1990. The HRRCM and LRRCM simulations show very similar warming levels, which are lower than for the GCM simulation. The sea surface warming rate is lower than the average air warming of the region. Grid resolution of the RCM is irrelevant for data aggregated at regional scale and their difference with respect to the GCM is more important. However, Table 1 is only meant to show that all these simulations produce warming levels within the range of CMIP5 models, while the focus of this analysis is on the effect of resolution on precipitation, discussed in detail in the following subsections.

3.1. Total Precipitation (TOT_PREC)

Details of the effect of resolution on the total annual precipitation during the reference period can be seen in the top row of Figure 2. Maxima of total annual precipitation are largest for the HRRCM (actual maxima are 2817, 2392 and 1972 mm/year for HRRCM, GCM and LRRCM, in this order). All simulations produce similar patterns, with the cumulated precipitation decreasing southwards and the highest values over mountains. An enhancement in the representation of the orographic spatial details as the horizontal resolution of the RCM increases is evident. The total precipitation in HRRCM is higher than in LRRCM (up to 68%) over mountain reliefs and nearest surrounding area (8% of domain), but lower over a fraction (28%) of the domain (generally in the range about −30 to −40%, with peaks of −100%). The comparison with the GCM is quite different as the increase of total precipitation occurs over 37% of the domain, including the whole North Africa, large fraction of the Mediterranean Sea and Eastern Europe (Table 2).
Despite these different spatial patterns, when precipitation is averaged over the North Med and the South Med areas, the time series of the three simulations are similar for both RCP4.5 and RCP8.5 scenarios (Figure 3). Though the rate of decrease is in magnitude slightly smaller for GCM (Table 3, top row), percent changes are very similar among the three simulations (Table 3, mid and bottom row). The precipitation decrease is larger for the high emission scenario RCP8.5 than RCP4.5, and at the end of the 21st century (2071–2100) than at midcentury (2021–2050).
The spatial pattern of future precipitation change for the RCP8.5 scenario and the long-term (2071–2100) is shown in Figure 4. With global warming, in all simulations there is an overall decrease of annual precipitation over most of southern continental Europe, Mediterranean Sea and North Africa, with values of about −30%/−40% over most of the Mediterranean basin and −77% in the southernmost areas (North Africa, southern Mediterranean Sea). Future increase of precipitation occurs in the northernmost part of the considered region. Patterns of change are rather similar among all simulations (see also Table 5 for the fraction of points with statistically significant changes). Changes are negative and statistically significant in most points for the RCP8.5 scenario. The lower emission scenario (RCP4.5) and the near-term (2021–2050) show the smallest changes (Table 4 and Table 5). However, the spatial patterns of change remain similar in all scenarios, though actual values increase with time and emission scenario (see supplementary material).

3.2. Wet Days Frequency (Wet_Days) and Daily Precipitationintensity (SDII)

The annual mean fraction of wet days is shown in Figure 2 (panels c1–c3). It decreases southwards, with highest values over mountains (panel c1) close to the northern border of the domain. Wet_days is higher in HRRCM than in LRRCM (generally, around 20%, with peaks of 66%), mostly over mountain reliefs, nearest surrounding area and eastwards (13% of domain), and lower only over a little fraction (7%) of the domain. Differences between HRRCMs and the GCM are large. In HRRCM Wet_days is larger than in the GCM over most of the domain (77%), with a maximum equal to 93% over North Africa. Only in very small fraction of point (1%) HRRCM shows values (Table 2) lower than the GCM.
Figure 2 panels b1–b3 (second row) shows the differences among the different simulations of average daily precipitation (SDII) in the months October–March. The three resolutions show similar spatial patterns but over mountains, where HRRCM exhibits SDII values up to 60% and 93% higher than LRRCM and GCM, respectively. In contrast, over flat areas and sea, HRRCM produces values lower (in the range −20 to−30%) than LRRCM and GCM. The fraction of areas with higher values in LRRCM and GCM (5% and 3%) is much smaller than that of areas with lower values (51% and 81%) (see Table 2).
The effect of climate change is a substantial decrease of wet days over the whole area, but with larger magnitude in the southernmost parts of the region. Over the northern areas of the considered domain, in the scenario simulations the increase of total precipitation (Figure 4, first row, Section 3.1) occurs in concomitance with a decrease of raining days (Figure 4, third row) and therefore to an increase of the average precipitation during wet days (SDII). This is coherent with the increase (about 30%) in Figure 4, second row.
For all three simulations, significant decrease of SDII occurs along the southern Mediterranean coast and North Africa. This climate change signal is very similar among simulations. In the long-term, rcp8.5 scenario about 50% of grid cells have a positive statistically significant variation of SDII while only about8% show negative values (Table 5). The detected changes are weaker and less significant for the less intense emission scenario (RCP4.5) and for the near-term time slice (2021–2050). In fact, the percentage of grid cells with significant positive and negative variation of SDII decreases to 20% and 1% (or less), respectively, in this case (Table 4 and supplementary material for plots).

3.3. Daily Precipitation Extremes and Intense Events R95pTOT

Figure 5 shows the 95th (RRwn95, panel a1) and 99th (RRwn99, panel b1) percentile of precipitation in wet days for the high-resolution model (0.11 × 0.11 degs) during the reference period. Columns two and three show differences of the HRRCM with respect to the LRRCM and the GCM, respectively. Only statistically significant differences are plotted.
Overall, the spatial pattern of extreme events is similar in all simulations, but HRRCM produces higher values in correspondence with the main orographic features. The increment in the HRRCM over the Alps, Apennines, Pyrenees, Atlas Mountains and Iberia, Greece, Balkans and Anatolia mountain reliefs is up to 65% with respect to the LRRCM and the GCM. Conversely, with a few exceptions, namely over the sea and flat areas the HRRCM produces values up to 40% lower than LRRCM and GCM.
The fraction of grid points where the HRRCM produces higher values (approximately 5%) is much smaller with respect to the large areas where it produces lower values than LRRCM and GCM (Table 2). Particularly, the comparison with GCM shows large areas (92% and 65% for RRwn95 and RRwn99, respectively) where HRRCM produces lower values. Such areas are smaller (43% and 28%) when LRRCM is compared.
Figure 2 (panels d1–d3) shows the annual total precipitation during intense events (R95pTOT) and how it differs (in percent %) among the three simulations, in the reference period. The largest values occur over the northern areas of Europe and, over the mountain reliefs, where maxima reach 760, 474, 450 mm/year for HRRCM, LRRCM and GCM, respectively. Values decrease southwards.
Differences of R95pTOT between LRRCM and HRRCM are significant over a small fraction of grid points (less than 10%, Table 2) with large positive values over mountains (actual values are about 80% in Figure 2 panel d2) and negative in the surrounding areas (Figure 2). HRRCM versus GCM shows larger differences, with positive variations (significant in approximately 16% of grid points) much more common than negative variations (~4%). Differences of HRRCM with respect to GCM are larger than those found with respect to LRRCM (actual values are about 92% in Figure 2 panel d3) and large areas with positive values are present over eastern Europe and most of North Africa.
For scenario RCP8.5 and for the future period 2071–2100, climate change signal (Figure 4, panels d, fourth row) exhibits an overall increment along the northern areas of the domain and a decrement in the southern side, with large central Mediterranean areas with no significant values. Spatial pattern among the three resolutions are quite similar, but the decrease in southern Mediterranean is larger in the RCMs. Climate change signal is weaker and less significant for the less intense emission scenario (RCP4.5) and the near time slice (2021–2050). Spatial details can be found in the supplementary material. The number of intense events (N95) shows a dependence on climate change very similar to the total amount of precipitation during intense events. The dependence of N95 on resolution during the reference period is shown in Figure 2 in order to facilitate the comparison with Figure 4. However, its dependence on resolution during the reference period is obviously proportional to that of Wet_days. The effect of model resolution on the behavior of these indices with climate change is negligible, both on their change of magnitude (Figure 4) and spatial distribution (see also Table 4 and Table 5).

4. Results: Role of Resolution on the Probability of Daily Precipitation in Wet Days

The probability of precipitationis computedseparately for the six boxesdepicted in Figure 1c (see Section 2.3). Theyhave been selected to include areas with large orographic features, rainy coastlines, and the sea surface.

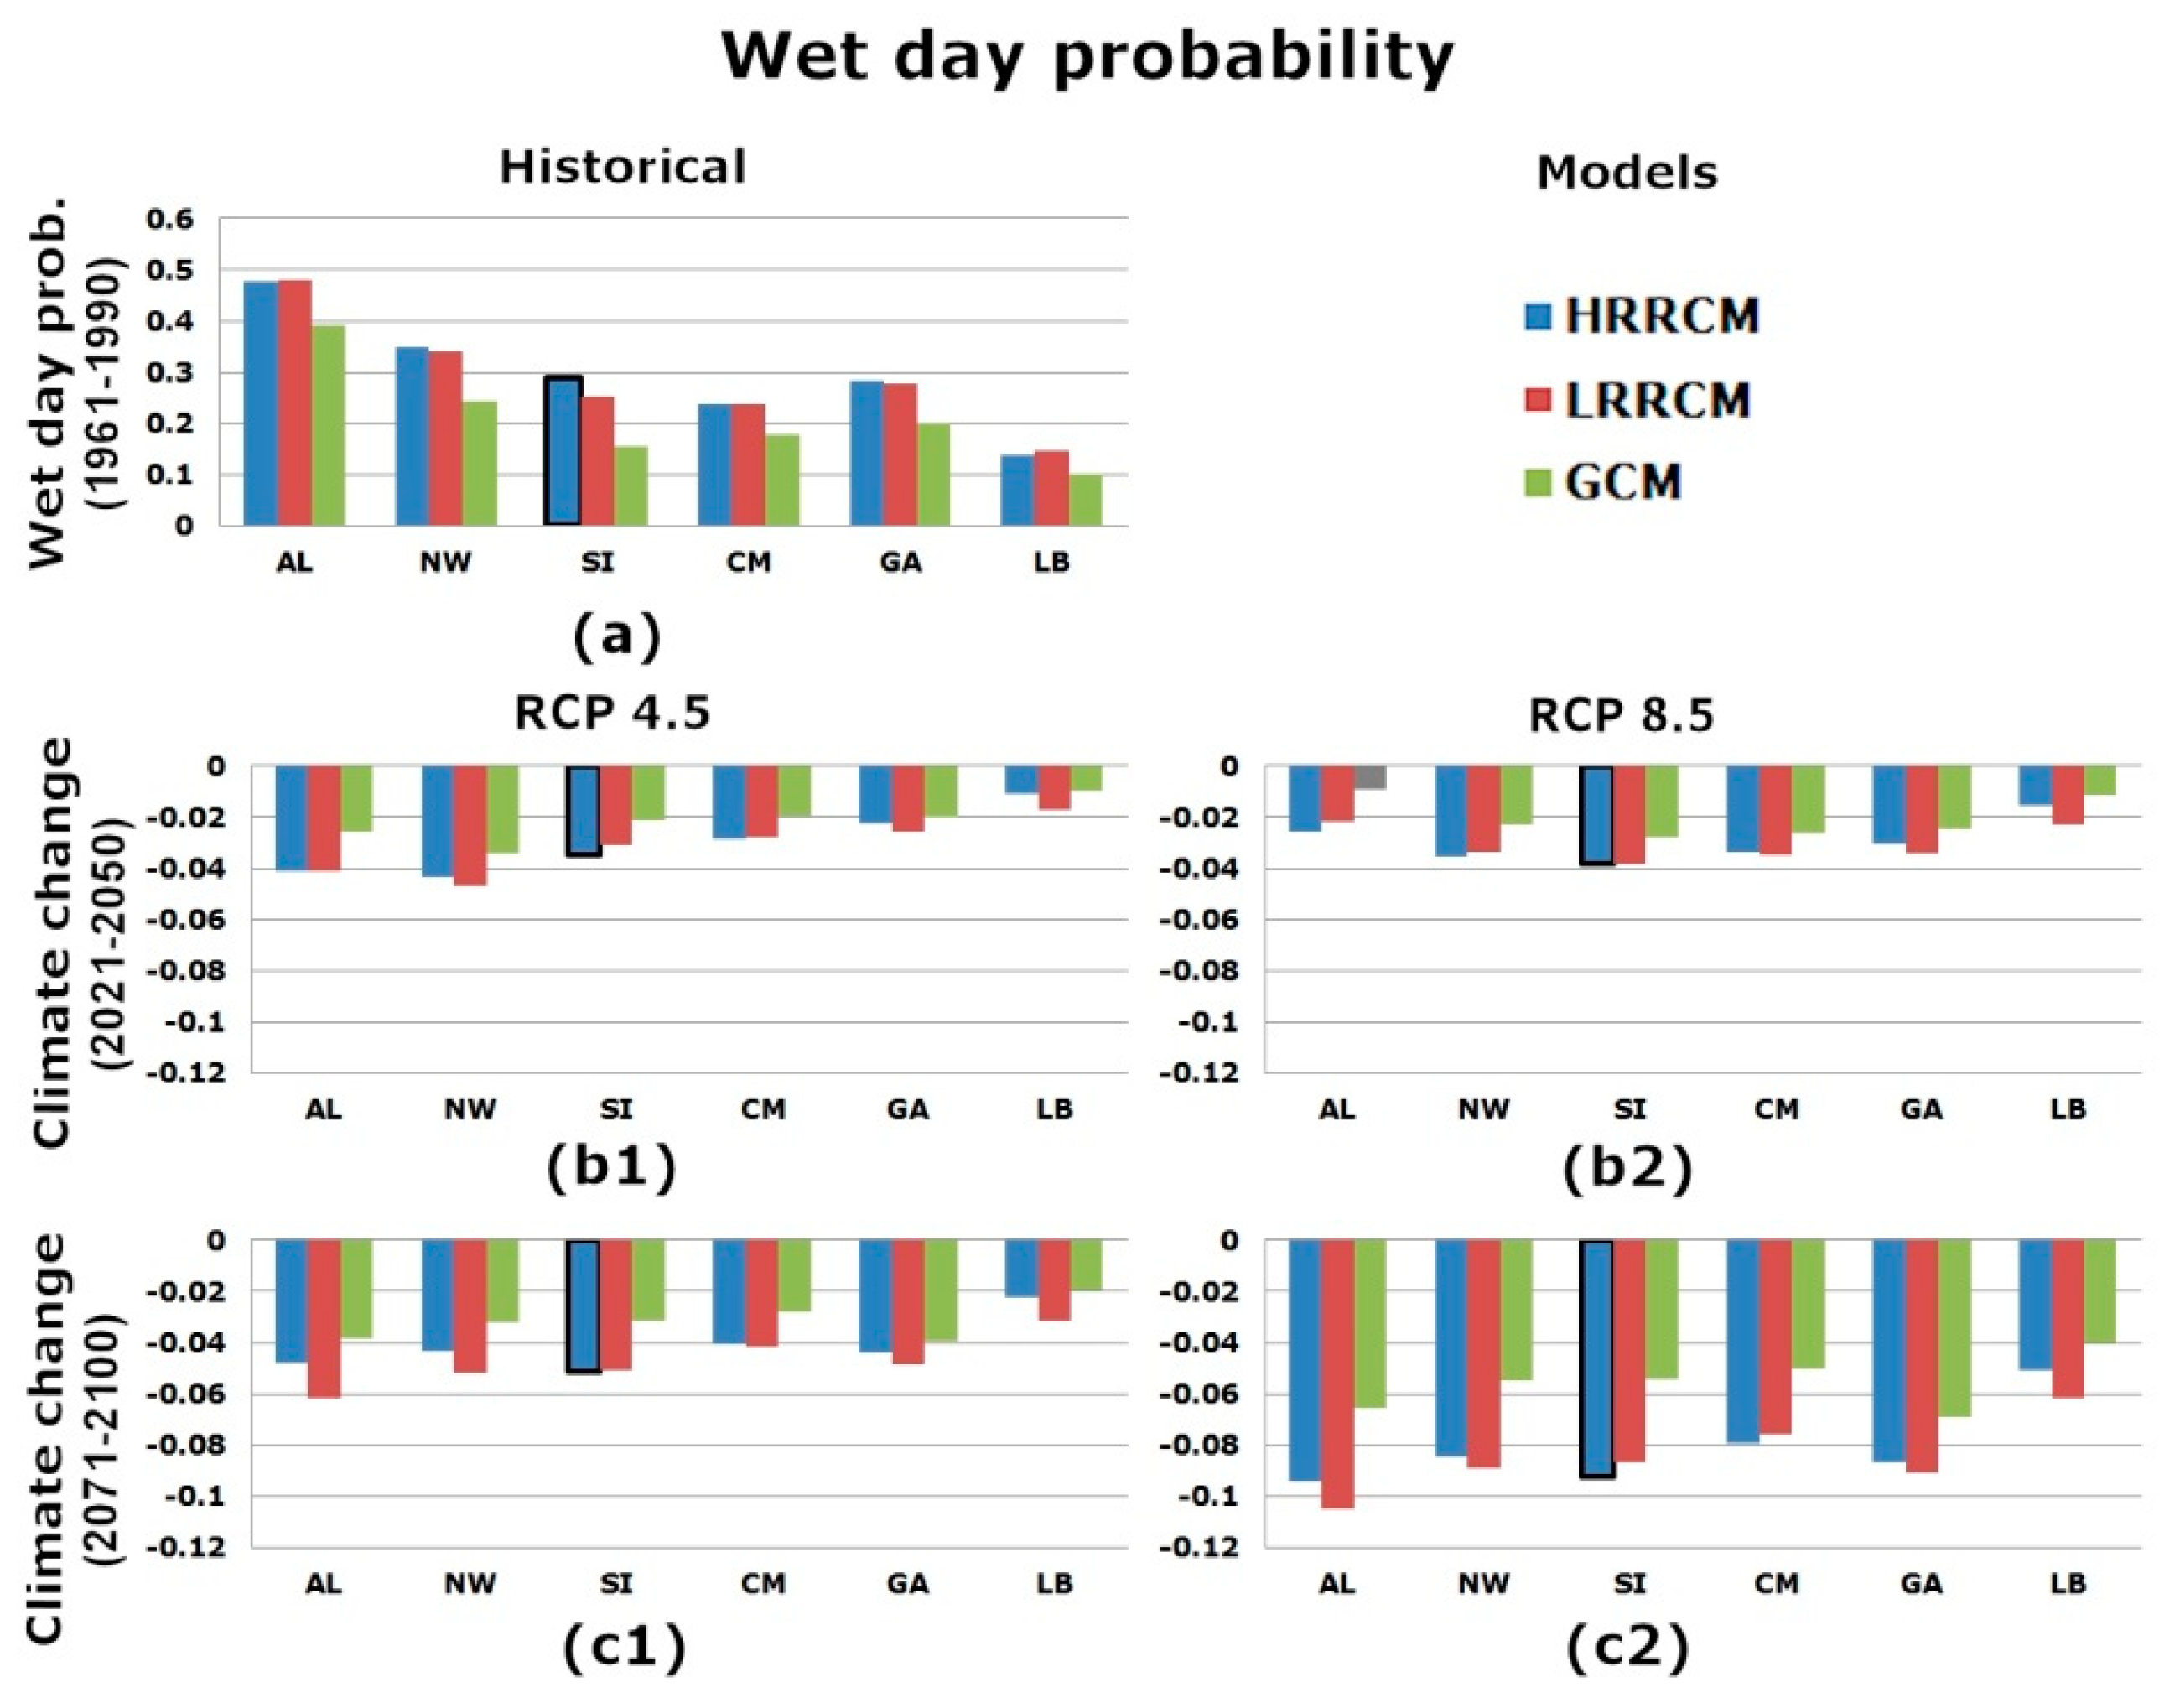
4.1. Wet Day Probability

Total probability of raining days (RR >= 1 mm) has been computed over the six selected boxes, for the reference period (1961–1990) and for the three simulations (HRRCM, LRRCM, GCM) represented with blue, red and green bars, respectively in Figure 6. A bold border of the HRRCM bar denotes a value that is statistically significantly different from LRRCM. Clearly, the probability of wet days is highest for the Alps box and, in general, higher in the areas with a complex topography (AL, NW, SI, GA) than over sea (CM,LB). Differences between HRRCM and LRRCM are not statistically significant, except for SI, where probability of wetdays in HRRCM is 3.5% higher than LRRCM. Probabilities in the two RCMs are always higher than in GCM, with percentage difference values in the range of 4−13%.
The probability of wet days decreases with the intensity of the considered emission scenarios and with time, being smallest for the RCP4.5 and the 2021–2050 period and largest for the RCP8.5 and the 2071–2100 period. The decrease is statistically significant in all considered cases, except for the GCM case, over AL, in the period 2021–2050 of the RCP8.5 scenario. The value of the decrease of wet day probability is not significantly different between HRRCM and LRRCM, except for SI, where HRRCM systematically presents the largest decrease in all scenario and time periods.

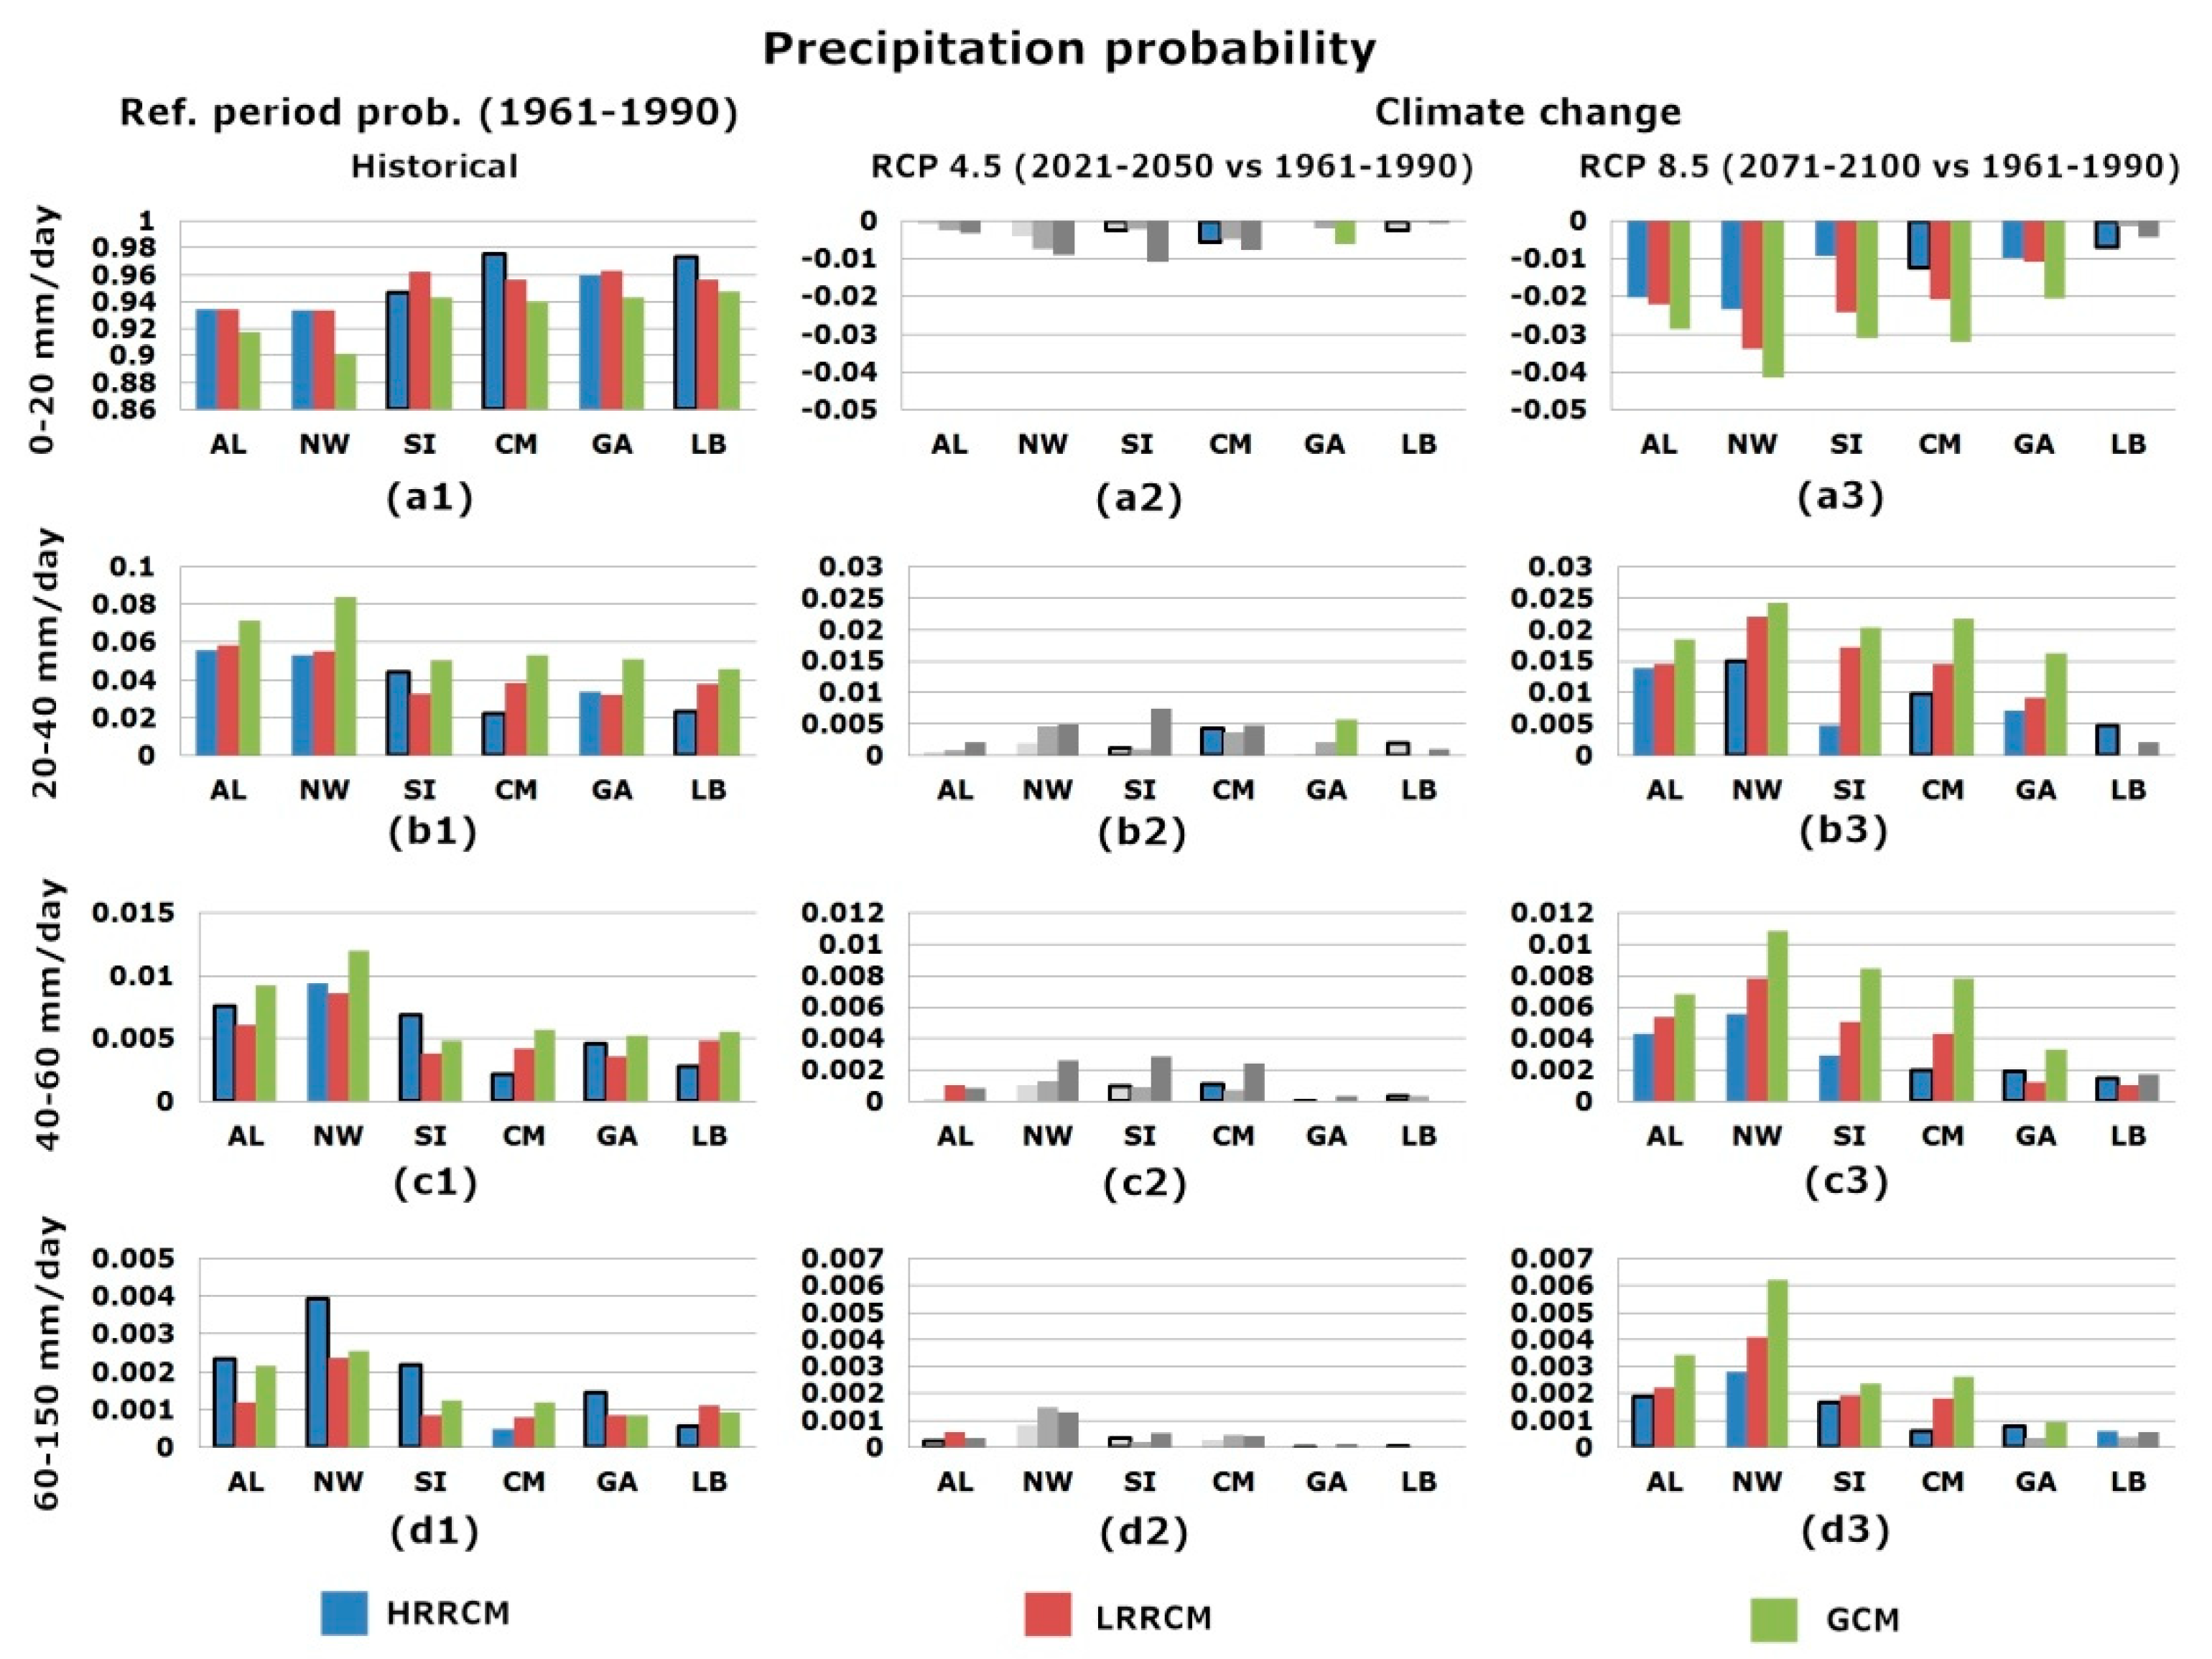
4.2. Probability of Daily Precipitation as Function of Intensity

Figure 7 shows the probability of four different intensity ranges of daily precipitation: weak (panel a1, up to 20 mm/day), medium (panel b1, from 20 to 40 mm/day), strong (panel c1, from 40 to 60 mm/day) and extreme (panel d1, above 60 mm/day) precipitation. All probabilities are computed under the condition of wet days (conditional to day being wet, see Section 2.3). In all considered boxes, probabilities of occurrence are largest for weak precipitation (Figure 7, panel a1) with values in the range 90–97% and they decrease progressively as the intensity of daily precipitation increases, with values of 2–8%, 0.2–1.2%, and 0.04–0.4% for the medium, strong and extreme precipitations, respectively.
Differences of probabilities between HRRCM and LRRCM are statistically significant. Importantly, considering strong and extreme events (Figure 7, panels c1 and d1), land and sea boxes tend to have opposite behavior. HRRCM produces higher probability values for land boxes and lower values for sea boxes (namely, the CM and LB). This is consistent with the results presented in Section 3, where it is shown that the higher resolution produces more intense rain events compared to the lower resolution over areas characterized by complex topographical features.
The second and third columns of Figure 7 show the changes of the RCP4.5 RCP8.5 scenarios with respect to the reference period, for the near-term and long-term, respectively, considering the four different precipitation intensity ranges and the six different boxes. In all panels grey bars denote that the change signal is not statistically significant, and the bold border that HRRCM is significantly different from LRRCM. All simulations agree that probability of weak precipitation will decrease in future climate projections (up to 4%, for the RCP8.5 scenario), whereas it will increase for all other precipitation classes. Changes are larger in the GCM case than in the RCM ones and often significantly smaller in the HRRCM than in the LRRCM. There are two exceptions: for the GA and LB boxes, HRRCM suggests an increase of extreme and moderate precipitation, respectively, significantly larger than LRRCM. Similar conclusions apply to the period 2021–2050 and the RCP4.5 scenario, but changes are smaller and often not statistically significant.

5. Summary and Discussion

In this paper, we analyzed the impact of climate change on intense and extreme rain events over the Mediterranean region, including the Mediterranean Sea and the surrounding areas, which has been identified as one of the main climate change hotspots [1]. This study adopted two different horizontal grid resolutions, named HRRCM (0.11 degs) and LRRCM (0.44 degs), in dynamical downscaling of the same GCM (0.75 degs) to which the two RCMs are also compared.
Increasing resolution (HRRCM against LRRCM) increases total precipitation(TOT_PREC) above orography and along coastlines, where precipitation has maxima, while it decreases it above flat areas and sea surface (Figure 2, top row). Increases (decreases) of total precipitation with resolution are due to the increase(decrease) of both the frequency of wet days (Wet_days) and the average daily precipitation intensity (SDII, Figure 2, second and third row). Correspondingly, also extremes of precipitation (95th and 99th percentile, RRwn95 and RRwn99, respectively) increase above orography and along coastlines, while they decrease above flat areas and sea surface (Figure 5) with increasing resolution. Similarly, the amount of total precipitation during extreme events increase with resolution above orography, and decreases in the narrow surrounding areas. The areas where increasing resolution decreases total precipitation, its average daily intensity and extremes are much larger than those where resolution has the opposite effect. However, over most of points the difference are not significant (Table 2).
In comparison with GCM, HRRCM produces higher precipitation also over North Africa, parts of the sea surface and of flat areas (Figure 2) so that differences are positive over most points (Table 2). Further, the RCMs produce a larger number of wet days than GCM, over most of the model domain and larger precipitation during extreme events.
The spatial patterns of future total precipitation change are similar in the three simulations, with GCM producing slightly weaker patterns than the two RCMs. In fact (Table 4 and Table 5), the fraction of points with non significant change is largest for the GCM. Changes are characterized as a bimodal pattern, with decrease over the central and southern areas and an increase in some northern areas.
In the future total precipitation will decrease over most the Mediterranean region (except at its northern boundary) with changes that are largest in the high emission scenario RCP8.5 and at the end of this century (2071–2100). Magnitude and spatial distribution of total precipitation change do not appreciably depend on resolution. Differences among the two scenarios are not large at mid of the century (2021–2050), but they are substantially different at the end of the century (2071–2100), when RCP8.5 produces a 40% reduction, which is approximately twice as the RCP4.5 scenario. The future decrease of total precipitation is slightly weaker in the GCM.
In the northern areas the future increase of total precipitation is associated with a decrease of wet days and an increase of average daily mean precipitation. In the southern areas the daily precipitation does not change in the future, but the number of wet days decreases. Therefore, the future increase of total precipitation in the northern areas is associated with an increase of the average intensity of precipitation. The future decrease of precipitation in the southern areas (and most of the domain) is associated with a decrease of the number of wet days. All these climate change signals weakly depend on the resolution.
The spatial patterns of future changes in the number of wet days and of average daily precipitation intensity are very similar for all simulation, being slightly larger for the GCM than for the two RCMs, suggesting that other model features are more important than the considered increase of resolution. Additionally, the bimodal pattern of strong future increase (weak future decrease) in the number of intense precipitation events and of the corresponding total amount of precipitation in the northern areas (southern) is similar in all simulations (Figure 4, rows 4 and 5). This suggests that the future changes in the amount of precipitation during intense events is mainly associated to a change in the number of events.
Six boxes, four corresponding to land areas with complex orography (Alps, North-West Mediterranean coast, South Italy, Greece and Anatolia) and two sea areas (Central Med Sea and Levantine basin), have been considered for analyzing the effect of resolution on probability of wet days, weak, medium, strong and extreme daily precipitation intensity.
The probability of wet days (Figure 6) does not exhibit differences statistically significant between the two RCMs (HRRCM and LRRCM), except for south Italy area, where HRRCM shows a rain probability significantly larger than LRRCM (Figure 6a). Increasing resolution increases the probability of strong and extreme precipitation over land areas with complex orography and reduces it over sea.
When precipitation occurs, all simulations agree that the probability of weak precipitation will decrease and of medium, strong and extreme precipitation will increase (Figure 7). Increasing resolution tends to reduce these future changes, with the exception of the Greece and Anatolia box, where HRRCM produces a significantly larger increase of strong and extreme precipitation probability. These changes are conditional to considering only wet days.

6. Conclusions

The effect of model resolution on precipitation changes over the Mediterranean Region is an important issue addressed in the current scientific literature. Our study contributes to this debate using exactly the same model at two different resolutions with a domain that covers the whole Mediterranean region. This model implementation allows us to understand the role of the model resolution, considering the whole Mediterranean region and the differences among its various parts. Specifically, the comparison among HRRCM and LRRCM offers this opportunity, because the differences between HRRCM and LRRCM depend only on resolution.
Our study confirms previous results on the effect of resolution on precipitation characteristics. Over areas with large orographic features, increasing resolution in the RCM increases total precipitation, intensity of daily precipitation, precipitation extremes, and the fraction of total precipitation during intense events. Increasing the resolution over the large flat areas and over the sea has the opposite effect. These conclusions are valid considering the comparison between the two RCMS at different resolutions and also comparing them to the GCM. In fact, high resolution increases the vertical speed long the upwind slope of mountains and flow convergence along coastlines. In several areas of the Mediterranean region, these two effects may occur simultaneously. This is compensated by a decrease of precipitation further upwind over flat areas and the sea. However, when comparing RCM to GCM, differences are caused also by different models of physics. This latter factor is, unfortunately, a source of confusion that is not possible to avoid. In fact, it is currently not possible to use the same model for global and regional simulations and to push the resolution of a global model to 0.11degs. Completing centennial simulations for multiple scenarios would require huge computational resources (in practice not available).
Climate change projections suggest significant future precipitation changes, whose magnitude increases with the emission scenario and in time. Our analysis shows that the following projected changes are robust with respect to the considered range of model resolution. In fact, they depend weakly on resolution and on the used RCM or GCM:
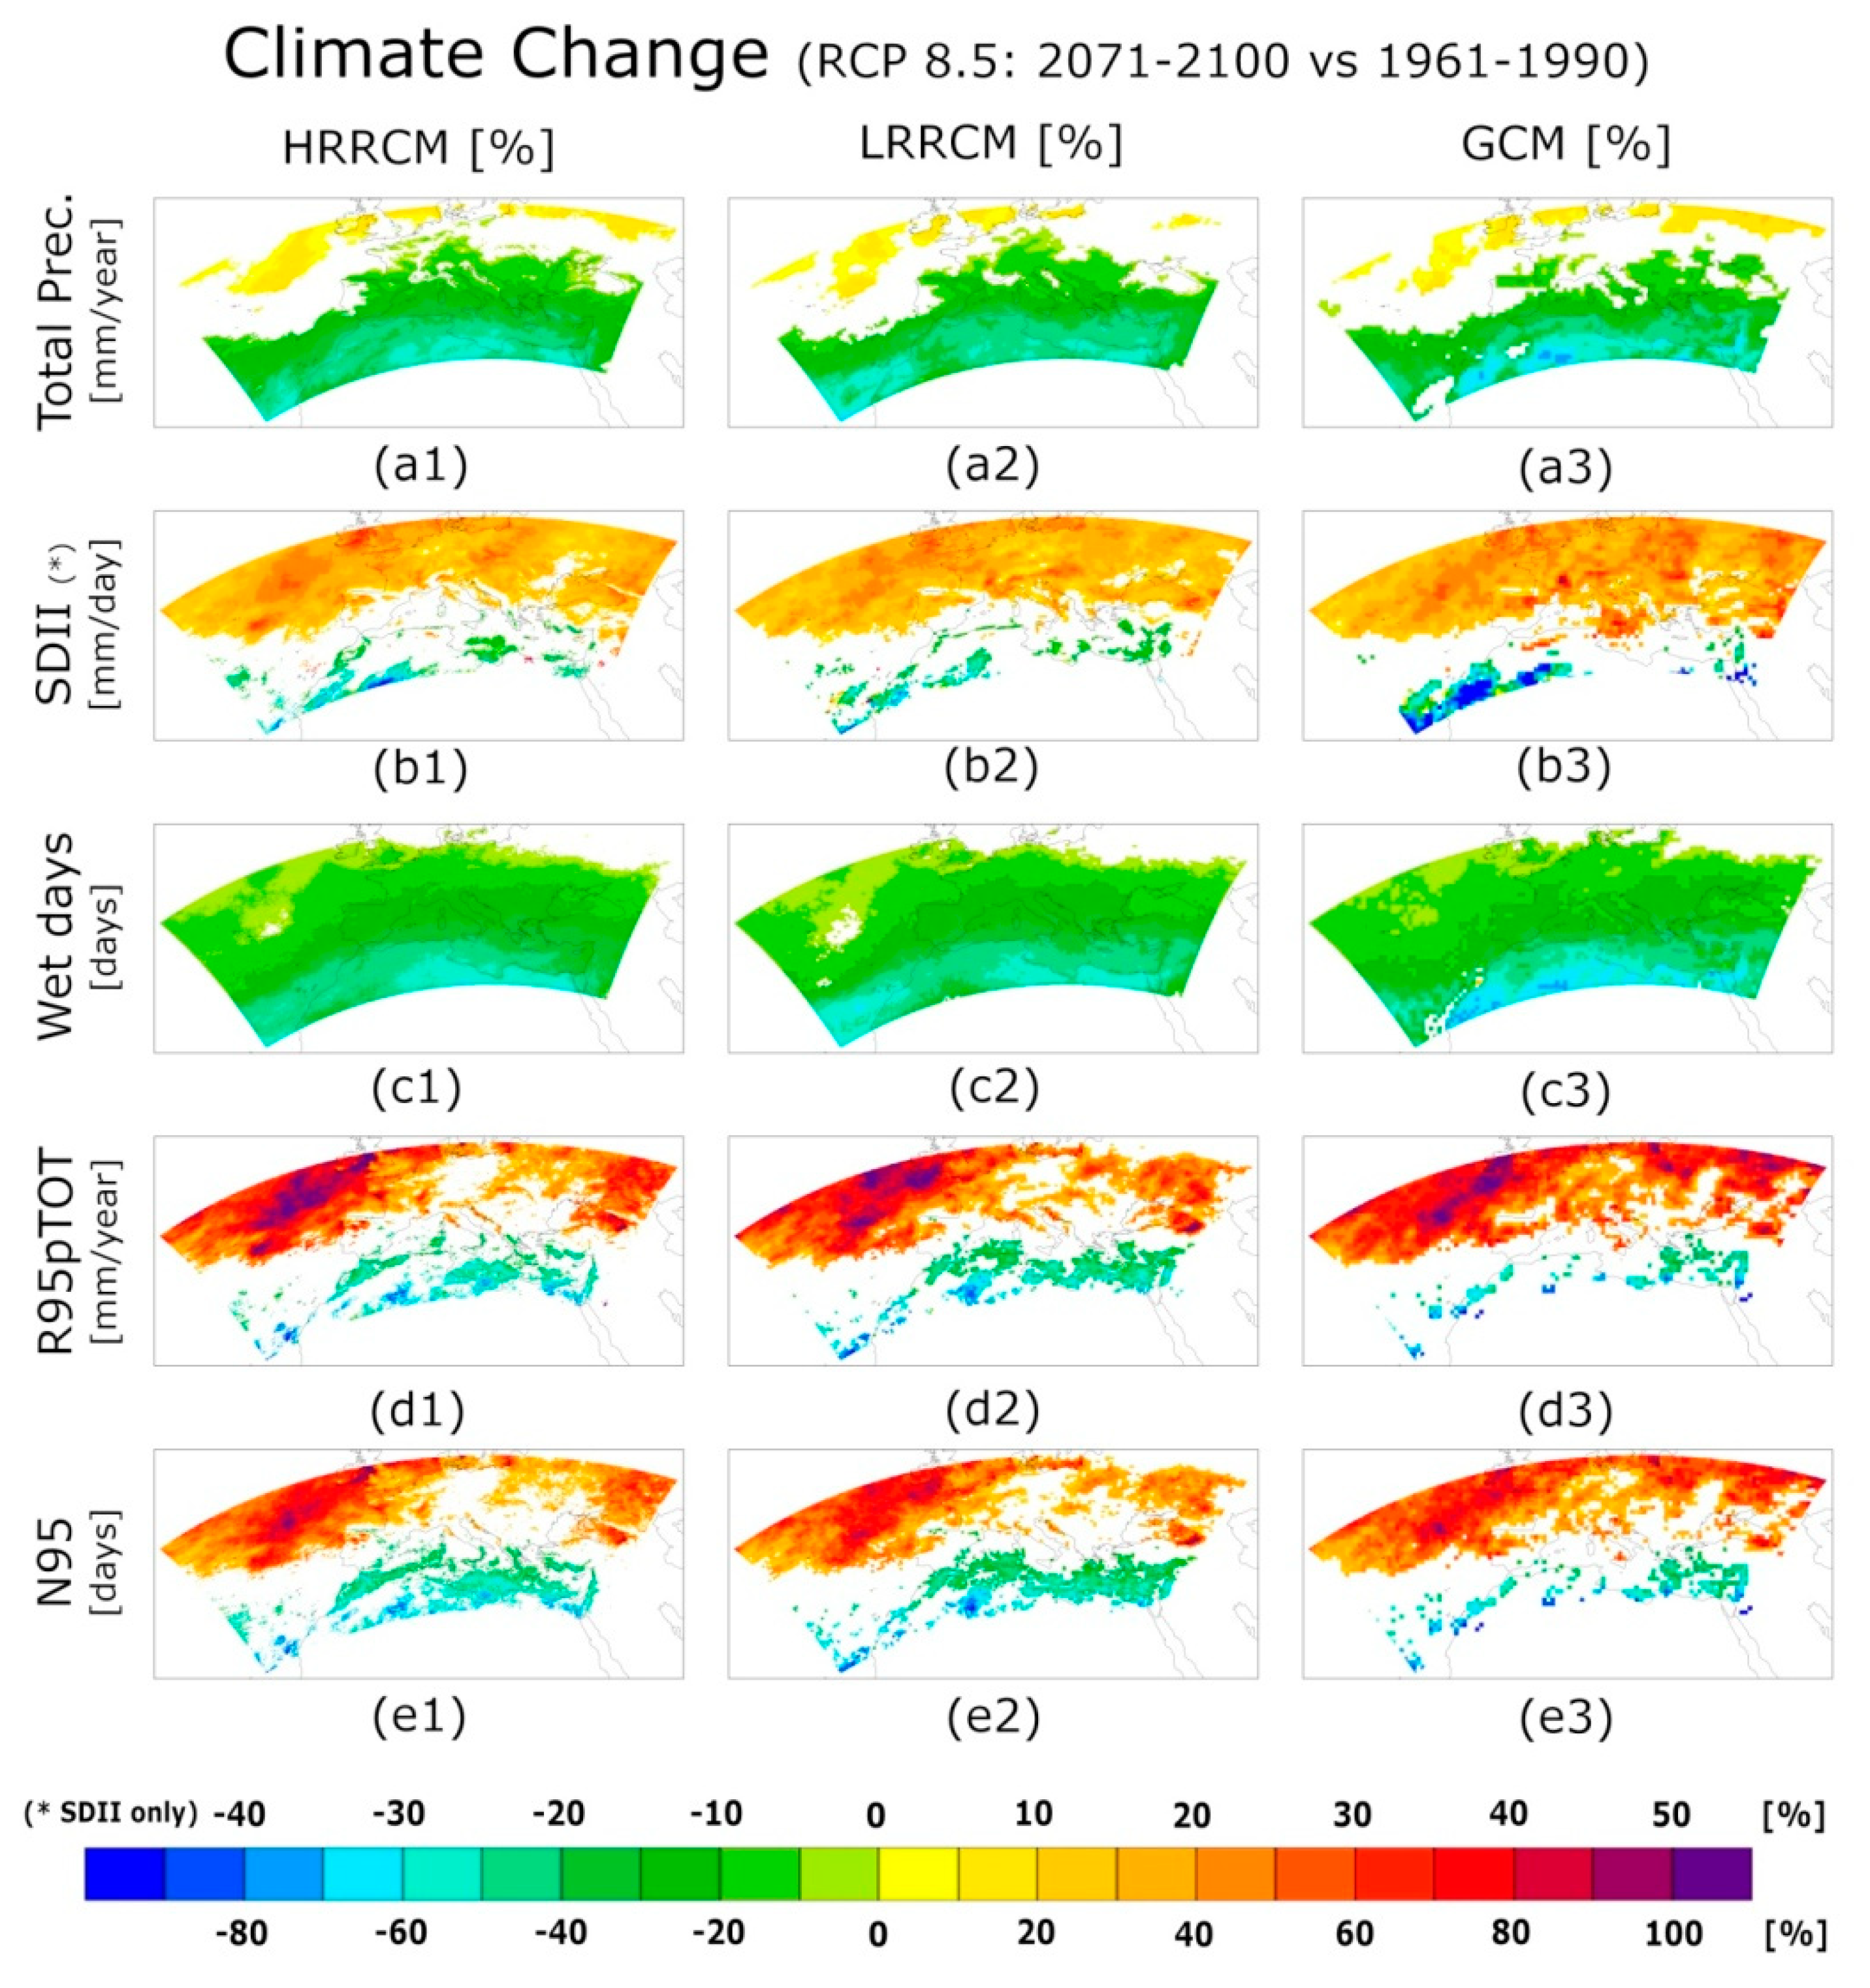
  • Over most of the Mediterranean, total precipitation will decrease in association with the decrease of the wet day frequency;
  • Only in some areas at the northern border of the Mediterranean, total precipitation will increase in association with the increase of intensity of daily precipitation;
  • The average intensity of precipitation events, the fraction of precipitation during intense events and frequency of intense events will increase over the northern Mediterranean. The same indices will decrease over sparse areas in the south Mediterranean;
  • During wet days, the probability of weak precipitation will decrease, whereas the probability of medium, strong and extreme precipitation will increase. In other terms, the frequency of rainy days will decrease, but they will be characterized with events more intense than in the present climate.
Our results show that the effect of increasing resolution of the RCM has a strong geographical connotation. Increasing resolution from LRRCM to HRRCM produces significant changes on:
  • The present and future probability of wet days in southern Italy, which is significantly higher in HRRCM than in LRRCM and will decrease significantly more in the future in the former than in the latter;
  • Considering only wet days, the future changes of probability is in most areas significantly smaller in HRRCM (with the exception of strong and intense precipitation in Greece and Levantine Basin where increasing resolution has the opposite effect).
Changes are larger in the GCM than in both the RCMs. This is consistent with the reduction of the effect of climate change on precipitation with increasing resolution. However, the differences between GCM and RCMs are not due only to resolution, because many of the models’ parameterizations are different. Indeed, the resolution of LRRCM and GCM are comparable and their differences are, to large extent, likely the effects of the different parameterizations.
Our results show that high resolution (11 km) simulations may not be needed if only changes of precipitation totals at the large scale are investigated. However, actual precipitation values in areas with steep orography features depend strongly on resolution. Further, high resolution is advised when computing probability of daily events, especially for strong and intense precipitations. In conclusion, this study shows that resolution is relevant, though its effects are not always significant. However, it should be noted that the resolution range explored in this study (up to 11 km) is still not sufficiently high to show strong effects of non-hydrostatic processes and local scale convection. Advantages from even higher resolutions are plausible, but their assessment is outside of the scope of this study, and is left for future investigations. Further, these results, obtained with the COSMOMed model, should be compared with studies based on other RCMs to reach robust conclusions, excluding that they are linked to this specific model.

Supplementary Materials

The following are available online at https://www.mdpi.com/2073-4433/11/7/699/s1, Figure S1: Climate Change (rcp 4.5: 2021–2050 vs. 1961–1990), Figure S2: Climate Change (rcp 4.5: 2071–2100 vs. 1961–1990), Figure S3: Climate Change (rcp 8.5: 2021–2050 vs. 1961–1990), Figure S4: Precipitation probability.

Author Contributions

Conceptualization, D.C. and P.L.; methodology, P.L.; software, D.C.; validation, D.C., P.L. and S.G.; formal analysis, D.C. and P.L.; investigation, D.C., P.L. and S.G.; resources, S.G.; data curation, D.C.; writing—original draft preparation, D.C., P.L. and S.G.; writing—review and editing, D.C., P.L. and S.G.; visualization, D.C.; supervision, S.G.; project administration, S.G. and P.L.; funding acquisition, S.G. and P.L. All authors have read and agreed to the published version of the manuscript.

Funding

This research received no external funding.

Acknowledgments

The work of Dario Conte was supported by the SOCLIMPACT project of European Union’s Horizon 2020 research and innovation programme under grant agreement no. 776661. The full name of the project is “DownScalingCLImateImPACTs and decarbonisation pathways in EU islands, and enhancing socioeconomic and non-market evaluation of Climate Change for Europe, for 2050 and Beyond”. The authors also acknowledge the project WINDSURFER, which is part of ERA4CS, an ERA-NET initiated by JPI Climate. This study is a contribution to the Med-CORDEX project.

Conflicts of Interest

The authors declare no conflict of interest.

References

  1. Giorgi, F. Climate change Hot-Spots. Geophys. Res. Lett. 2006, 33. [Google Scholar] [CrossRef]
  2. Giorgi, F.; Lionello, P. Climate Change Projections for the Mediterranean Region. Glob. Planet.Chang. 2008, 63, 90–104. [Google Scholar] [CrossRef]
  3. Planton, S.; Lionello, P.; Artale, V.; Aznar, R.; Carrillo, A.; Colin, J.; Congedi, L.; Dubois, C.; Elizalde, A.; Gualdi, S.; et al. The Climate of the Mediterranean Region in Future Climate Projections. In The Climate of the Mediterranean Region-From the Past to the Future; Lionello, P., Ed.; Elsevier: Amsterdam, The Netherlands, 2012; pp. 449–502. [Google Scholar] [CrossRef] [Green Version]
  4. Ulbrich, U.; Lionello, P.; Belušic’, D.; Jacobeit, J.; Knippertz, P.; Kuglitsch, F.G.; Leckebusch, G.C.; Luterbacher, J.; Maugeri, M.; Maheras, P.; et al. Climate of the Mediterranean: Synoptic Patterns, Temperature, Precipitation, Winds, and Their Extremes. In The Climate of the Mediterranean Region-From the Past to the Future; Lionello, P., Ed.; Elsevier: Amsterdam, The Netherlands, 2012; pp. 301–346. ISBN 9780124160422. [Google Scholar] [CrossRef]
  5. Gualdi, S.; Somot, S.; Li, L.; Artale, V.; Adani, M.; Bellucci, A.; Braun, A.; Calmanti, S.; Carillo, A.; Dell’Aquila, A.; et al. The CIRCE simulations: A new set of regional climate change projections performed with a realistic representation of the Mediterranean Sea. Bull. Am. Meteorol. Soc. 2013, 94, 65–81. [Google Scholar] [CrossRef]
  6. Lionello, P.; Scarascia, L. The relation between climate change in the Mediterranean region and global warming. Reg. Environ. Chang. 2018, 18, 1481–1493. [Google Scholar] [CrossRef]
  7. Fowler, H.J.; Ekström, M.; Blenkinsop, S.; Smith, A.P. Estimating change in extreme European precipitation using a multimodel ensemble. J. Geophys. Res. 2007, 112. [Google Scholar] [CrossRef] [Green Version]
  8. Jacob, D.; Petersen, J.; Eggert, B.; Alias, A.; Christensen, O.B.; Bouwer, L.M.; Braun, A.; Colette, A.; Déqué, M.; Georgievski, G.; et al. EURO-CORDEX: New high-resolution climate change projections for European impact research. Reg. Environ. Chang. 2014, 14, 563–578. [Google Scholar] [CrossRef]
  9. Scoccimarro, E.; Gualdi, S.; Bellucci, A.; Zampieri, M.; Navarra, A. Heavy precipitation events over the Euro-Mediterranean region in a warmer climate: Results from CMIP5 models. Reg. Environ. Chang. 2016, 16, 595–602. [Google Scholar] [CrossRef]
  10. Tramblay, Y.; Somot, S. Future evolution of extreme precipitation in the Mediterranean. Clim. Chang. 2018, 151, 289–302. [Google Scholar] [CrossRef]
  11. Drobinski, P.; Da Silva, N.; Panthou, G.; Bastin, S.; Müller, C.; Ahrens, B.; Borga, M.; Conte, D.; Fosser, G.; Giorgi, F.; et al. Scaling precipitation extremes with temperature in the Mediterranean: Past climate assessment and projection in anthropogenic scenarios. Clim. Dyn. 2018, 51, 1237–1257. [Google Scholar] [CrossRef] [Green Version]
  12. Lionello, P.; Scarascia, L. The relation of climate extremes with global warming in the Mediterranean region and its north versus south contrast. Reg. Environ. Chang. 2020, 20, 31. [Google Scholar] [CrossRef]
  13. Lionello, P.; Martucci, G.; Zampieri, M. Implementation of a Coupled Atmosphere-Wave-Ocean Model in the Mediterranean Sea: Sensitivity of the Short Time Scale Evolution to the Air-Sea Coupling Mechanisms. J. Atmos. Ocean Sci. 2003, 9, 65–95. [Google Scholar] [CrossRef]
  14. Ruti, P.; Somot, S.; Giorgi, F.; Dubois, C.; Flaounas, E.; Obermann, A.; Dell’Aquila, A.; Pisacane, G.; Harzallah, A.; Lombardi, E.; et al. Med-CORDEX initiative for Mediterranean climate studies. Bull. Am. Meteorol. Soc. 2016, 97, 1187–1208. [Google Scholar] [CrossRef] [Green Version]
  15. Somot, S.; Sevault, F.; Déqué, M.; Crépon, M. 21st century climate change scenario for the Mediterranean using a coupled atmosphere-ocean regional climate model. Glob. Planet. Chang. 2008, 63, 112–126. [Google Scholar] [CrossRef] [Green Version]
  16. Bucchignani, E.; Mercogliano, P.; Panitz, H.J.; Montesarchio, M. Climate change projections for the Middle East–North Africa domain with COSMO-CLM at different spatial resolutions. Adv. Clim. Chang. Res. 2018, 66–80. [Google Scholar] [CrossRef]
  17. Torma, C.; Giorgi, F.; Coppola, E. Added value of regional climate modeling over areas characterized by complex terrain—Precipitation over the Alps. J. Geophys. Res. Atmos. 2015, 120, 3957–3972. [Google Scholar] [CrossRef]
  18. Bucchignani, E.; Montesarchio, M.; Zollo, A.L.; Mercogliano, P. High-resolution climate simulations with COSMO-CLM over Italy: Performance evaluation and climate projections for the 21st century. Int. J. Climatol. 2016, 36, 735–756. [Google Scholar] [CrossRef]
  19. Pieri, A.B.; Von Hardenberg, J.; Parodi, A.; Provenzale, A. Sensitivity of Precipitation Statistics to Resolution, Microphysics, and Convective Parameterization: A Case Study with the High-Resolution WRF Climate Model over Europe. J. Hydrometeorol. 2015, 16, 1857–1872. [Google Scholar] [CrossRef]
  20. Pontoppidan, M.; Reuder, J.; Mayer, S.; Kolstad, E.W. Downscaling an intense precipitation event in complex terrain: The importance of high grid resolution. Tellus A Dyn. Meteorol. Oceanogr. 2017, 69, 1271561. [Google Scholar] [CrossRef] [Green Version]
  21. Cavicchia, L.; Scoccimarro, E.; Gualdi, S.; Marson, P.; Ahrens, B.; Berthou, S.; Conte, D.; Dell’Aquila, A.; Drobinski, P.; Djurdjevic, V.; et al. Mediterranean extremeprecipitation: A multi-model assessment. Clim. Dyn. 2018, 51, 901–913. [Google Scholar] [CrossRef]
  22. Kendon, E.J.; Ban, N.; Roberts, N.M.; Fowler, H.J.; Roberts, M.J.; Chan, S.C.; Evans, J.P.; Fosser, G.; Wilkinson, J.M. Do Convection-Permitting Regional Climate Models Improve Projections of Future Precipitation Change? Bull. Am. Meteorol. Soc. 2017, 98, 79–93. [Google Scholar] [CrossRef]
  23. Cavicchia, L.; Gualdi, S.; Sanna, A.; Oddo, P. The Regional Ocean Atmosphere Coupled Model COSMONEMO_MFS. In CMCC, Bologna, Italy. Issue RP0254/ Research Papers; CMCC: April 2015. Available online: https://www.cmcc.it/wp-content/uploads/2015/04/rp0254-csp-04-2015.pdf (accessed on 5 May 2020).
  24. Sanna, A.; Lionello, P.; Gualdi, S. Coupled atmosphere ocean climate model simulations in the Mediterranean region: Effect of a high-resolution marine model on cyclones and precipitation. Nat. Hazards Earth Syst. Sci. 2013, 13, 1567–1577. [Google Scholar] [CrossRef] [Green Version]
  25. Moss, R.H.; Edmonds, J.; Hibbard, K.; Manning, M.R.; Rose, S.K.; Van Vuuren, D.P.; Carter, T.R.; Emori, S.; Kainuma, M.; Kram, T.; et al. The next generation of scenarios for climate change research and assessment. Nature 2010, 463, 747–756. [Google Scholar] [CrossRef] [PubMed]
  26. Scoccimarro, E.; Gualdi, S.; Bellucci, A.; Sanna, A.; Fogli, P.G.; Manzini, E.; Vichi, M.; Oddo, P.; Navarra, A. Effects of Tropical Cyclones on Ocean Heat Transport in a High Resolution Coupled General Circulation Model. J. Clim. 2011, 24, 4368–4384. [Google Scholar] [CrossRef] [Green Version]
  27. Lange, S.; Rockel, B.; Volkholz, J.; Bookhagen, B. Regional climate model sensitivities to parametrizations of convection and non-precipitating subgrid-scale clouds over South America. Clim. Dyn. 2015, 44, 2839–2857. [Google Scholar] [CrossRef] [Green Version]
  28. Madec, G. Nemo Ocean Engine. ISSN No 1288-1619, NEMO Community Ocean Model. 2016. Available online: https://www.nemo-ocean.eu/wp-content/uploads/NEMO_book.pdf (accessed on 5 May 2020).
  29. Oddo, P.; Adani, M.; Pinardi, N.; Fratianni, C.; Tonani, M.; Pettenuzzo, D. A nested Atlantic–Mediterranean sea general circulation model for operational forecasting. Ocean Sci. 2009, 5, 461–473. [Google Scholar] [CrossRef] [Green Version]
  30. Valcke, S. The oasis3 coupler: A european climate modelling community software. Geosci. Model Dev. 2013, 6, 373–388. [Google Scholar] [CrossRef] [Green Version]
  31. Larson, J.; Jacob, R.; Ong, E. The Model Coupling Toolkit: A New Fortran90 Toolkit for Building Multiphysics Parallel Coupled Models. Int. J. High Perform. Comput. Appl. 2005, 19, 277–292. [Google Scholar] [CrossRef]
  32. Bauer, D.F. Constructing confidence sets using rank statistics. J. Am. Stat. Assoc. 1972, 67, 687–690. [Google Scholar] [CrossRef]
  33. Hollander, M.; Wolfe, D.A.; Chicken, E. Nonparametric Statistical Methods; John Wiley & Sons: New York, NY, USA, 1973. [Google Scholar]
  34. CCl/WCRP/JCOMM Expert Team on Climate Change Detection and Indices (ETCCDI). Available online: https://www.wcrp-climate.org/etccdi (accessed on 5 May 2020).
  35. Bürger, G.; Sobie, R.; Cannon, A.; Werner, A.; Murdock, T. Downscaling Extremes: An Intercomparison of Multiple Methods for Future Climate. J. Clim. 2013, 26, 3429–3449. [Google Scholar] [CrossRef]
Figure 1. Regional climate models (RCM) domain with: the NEMO ocean model domain (panel (a), thin black rectangle); sub-regions used for computing temperature and precipitation trends (North Mediterranean and Southern Mediterranean, blue and red rectangles, respectively, panel (b)), the six boxes for computing the precipitation probability(panel (c)): Alps region (AL, blue rectangle); North-West Mediterranean coast (NW, orange rectangle); South Italy and Central Mediterranean Sea (SI and CM, red rectangle); Greece and Anatolian Peninsula (GA, brown rectangle); Levantine Basin (LB, magenta rectangle).
Atmosphere 11 00699 g001
Figure 2. Precipitation indices: comparison among model simulations for the reference period. Left column shows the pattern values of 5 precipitation indexes defined in Section 2.2, as obtained in the high-resolution regional simulation (HRRCM). Middle and right columns show the differences of HRRCM with respect to the low-resolution regional simulation (LRRCM) and the global simulation (GCM). Positive values denote areas where the HRRCM produces higher values. White areas denote points where differences are not significant (a1a3), annual total precipitation; (b1b3), SDII index; (c1c3), annual number of wet dayss; (d1d3), annual total precipitation amount when daily precipitation is greater than 95th percentile; (e1e3), number of days when RR ≥ RRwn95;
Atmosphere 11 00699 g002
Figure 3. Time series of annual cumulative precipitation anomaly (mm/year) for the period 1960–2100, for RCP4.5 (panels (a1,b1)) and RCP8.5 (panels (a2,b2)) scenarios, for the three considered horizontal grid resolutions (HRRCM, LRRCM and GCM) distinguished by blue, red and green colors. Values represent spatially averages over the two analyzed sub-areas (North and South Mediterranean) and are anomalies with respect to the 1961–1990 mean). (a1,a2), North Med. sub-area; (b1,b2), South Med. Sub-area.
Atmosphere 11 00699 g003
Figure 4. Change (percent, %) of the indexes defined in Section 2.2 in the RCP8.5 scenario simulation. All panels show the difference between the 1961–1990 and 2071–2100 periods according the HRRCM (first column), the LRRCM (second column), the GCM (third column). White areas denote points where differences are not statistically significant. Positive values denote higher index values in the future (2071–2100) period. Along the color bar, upper labels refer to SDII, the bottom ones refer to all the other indexes (a1a3), annual total precipitation; (b1b3), SDII index; (c1c3), annual number of wet days; (d1d3),), annual total precipitation amount when daily precipitation is greater than 95th percentile; (e1e3), number of days when RR ≥ RRwn95.
Atmosphere 11 00699 g004
Figure 5. The 95th (top row) and 99th percentiles of precipitation during wed days for the reference period (1961–1990). Panels a1 and b1 show the values of the high-resolution regional simulation (HRRCM). The second and third columns show the difference with respect to the low-resolution regional simulations (LRRCM) and the global model simulations (GCM), respectively. Only significantly different values are shown. Positive values denote points where the values are higher in the HRRCM simulation (a1a3), 95th percentiles; (b1b3), 99th percentiles;
Atmosphere 11 00699 g005
Figure 6. Wet day probability values (from 0 to 1) and their changes with global warming for the six boxes shown in Figure 1c and for the three simulations HRRCM (blue), LRRCM(red), GCM (green). Panel (a) shows the probability of wet days in the reference period (1961–1990). The panels in the second and third row (b1c2) show the probability differences for the near-term (2021–2050) and the long-term (2071–2100) with respect to the reference period (1961–1990) for the scenario RCP4.5 (first 1) and RCP8.5 (column 2). Grey bars indicate that the climate change signal is not statistically significant (Alps, panel b2). Bold borders of the HRRCM bars for the South Italy box denote that its results are statistically different with respect to the LRRCM.
Atmosphere 11 00699 g006
Figure 7. Probability of daily precipitation (from 0 to 1) as function of intensity range and its variation with climate change. All values are computed under the condition of day being a wet day. Four ranges of intensity are considered in the different rows: weak (0–20 mm/day), medium (20–40 mm/day), strong (40–60 mm/day) and intense (above 60 mm/day). Panels (a1d1) (first column) show the probability of rain for the reference period (1961–1990). (a2d2) Second and (a3d3) third columns show the probability change for the RCP4.5 (near-term, 2021–2050) and RCP8.5 (long-term 2071–2100) scenarios with respect to the reference period (1961–1990). Grey bars denote differences that are not statistically significant. A bold border of blue bars denotes differences between HRRCM and LRRCM that are statistically significant.
Atmosphere 11 00699 g007
Table 1. Rate of change of the annual mean 2 m temperature and of the sea surface temperature in one century (°C/century). Values represent averages over the north and south Mediterranean areas for the two emission scenarios (RCP4.5 and RCP8.5) and for each horizontal grid resolution HRRCM, LRRCM and GCM. The whole period 1960–2100 is considered for computing the trend.
Annual Temperatures Change in One Century
ScenarioRCP4.5RCP8.5
AreaNorth MedSouth MedNorth MedSouth Med
SimulationHRRCMLRRCMGCMHRRCMLRRCMGCMHRRCMLRRCMGCMHRRCMLRRCMGCM
Annual mean 2 m T change (°C/century)2.82.83.02.62.62.84.74.65.04.54.54.8
Annual mean SST change (°C/century)2.22.12.42.01.92.23.53.53.93.43.23.7
Table 2. Fraction (percent, %) of points with positive, negative and non-significant differences of the low-resolution simulation (LRRCM) and the global simulation (GCM)with respect to the high-resolution simulations (HRRCM). Each line refers to a different indicator (see Section 2.2). Values refer to the reference period 1961–1990. The columns positive/negative denote points where the HRRCM is significantly higher/lower than the other simulations.
Differences among Simulations
Fraction of Points—Reference Period (1961–1990)
HRRCM versus LRRCMHRRCM versus GCM
ParameterPositive (%)Negative(%)No signif. (%)Positive (%)Negative(%)No signif. (%)
TOT_PREC82864372341
SDII5514438116
RRwn95543525923
RRwn995286796526
R95pTOT359116480
Wet_days1378077122
N95109941059
Table 3. First row: rate of change of the annual total precipitation (mm/century) for the North and South Mediterranean, for each emission scenario (RCP4.5 and RCP8.5) and simulation (HRRCM, LRRCM and GCM). Second and third row show the percent change of total annual precipitation for the near-term and long-term (2021–2050 and 2071–2100, respectively) with respect to reference period (1961–1990).
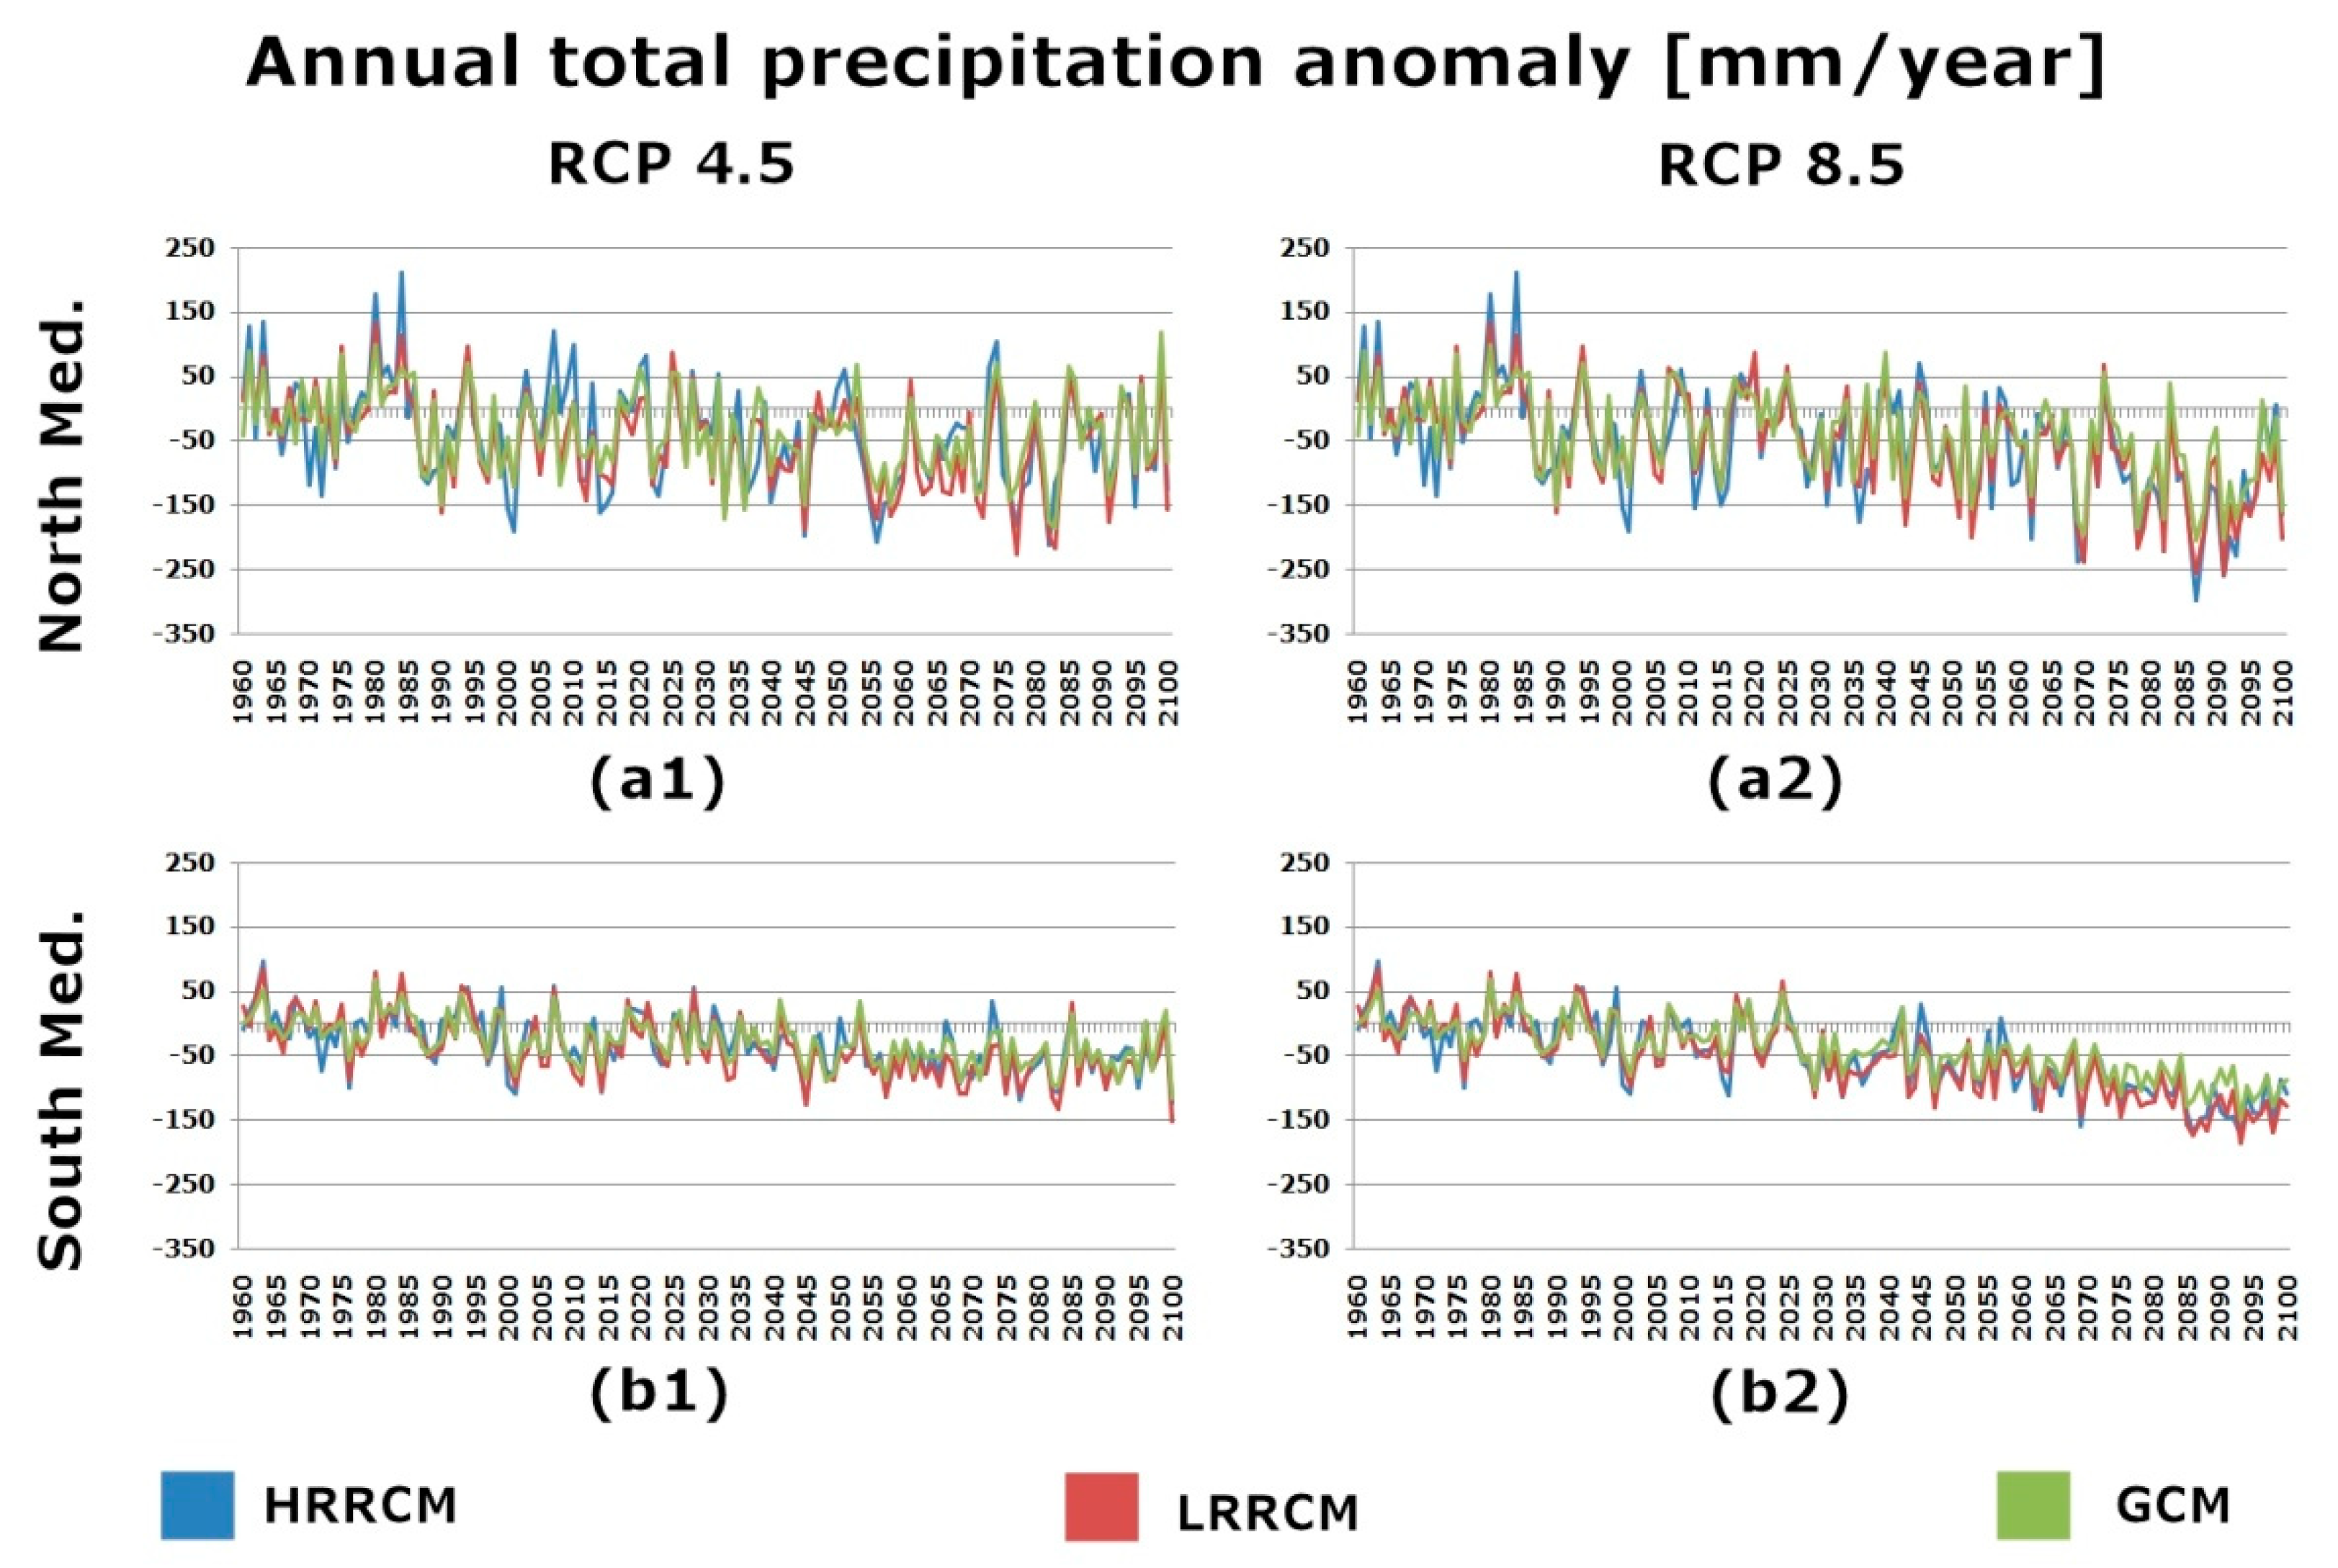
Annual Precipitation Change
ScenarioRCP4.5RCP8.5
AreaNorth MedSouth MedNorth MedSouth Med
SimulationHRRCMLRRCMGCMHRRCMLRRCMGCMHRRCMLRRCMGCMHRRCMLRRCMGCM
Total annual precipitation rate of change (mm/century)−57−60−38−54−64−47−104−107−75−103−114−83
Annual precipitation change in 2021–2050 vs. 1960–1990(%)−7−8−7−10−12−12−7−8−6−17−18−18
Annual precipitation change in 2071–2100 vs. 1960–1990(%)−9−9−7−20−21−22−18−18−14−39−41−39
Table 4. Fraction (percent, %) of points with positive, negative and no statistically significant climate change signal for the high-resolution regional simulation (HRRCM), the low-resolution simulation (LRRCM) and the global simulation (GCM). Each line refers to a different indicator (see Section 2.2). Values refer to the 2021–2050 period with respect to the reference period 1961–1990. The column positive/negative denote points where the difference between the near-term (2021–2050) and the reference (1961–1990) time periods in the RCP4.5and RCP8.5 are statistically significant. Positive values denote high indicators in the future (2021–2050) period.
Statistically Significant Percentage of Climate Change Signal (2021–2050 vs. 1961–1990):
Amount of Positive and Negative Grid Cells.
HRRCMLRRCMGCM
ParameterScenarioPositiveNegativeNo signif.PositiveNegativeNo signif.PositiveNegativeNo signif.
TOT_PRECrcp 4.58108211147591081
rcp 8.5102169132463111773
SDIIrcp 4.5211781918024075
rcp 8.5322662727131168
R95pTOTrcp 4.5201792017922177
rcp 8.5242742327527172
Wet_daysrcp 4.5429667375643461
rcp 8.5542536474743660
N95rcp 4.5171821718219180
rcp 8.5223762137724274
Table 5. Same as Table 4, except that it refers to the period 2071–2100.
Statistically Significant Percentage of Climate Change Signal (2071–2100 vs. 1961–1990):
Amount of Positive and Negative Grid Cells.
HRRCMLRRCMGCM
ParameterScenarioPositiveNegativeNo signif.PositiveNegativeNo signif.PositiveNegativeNo signif.
TOT_PRECrcp 4.5735586365772568
rcp 8.5959327583595437
SDIIrcp 4.5412574235548449
rcp 8.5477464974455936
R95pTOTrcp 4.5303672936736461
rcp 8.536105437125141553
Wet_daysrcp 4.5269291683116534
rcp 8.5093709280955
N95rcp 4.5274702647032464
rcp 8.533135432145337756

