Abstract
The aims of the study were to assess the severity of temperature conditions in Europe, in June 2019, using a newly developed extremes index, as well as to evaluate circulation conditions that favored the occurrence of extremely hot days in June 2019, as seen over the long term. The main focus of this work was on two European regions particularly affected by high temperatures in June 2019, namely Central Europe and Iberia. To comprehensively characterize heat events in terms of their spatial extent and intensity, we proposed the extremity index (EI) and used it to compare hot days occurring in areas of different sizes and with different climatic conditions. The role of atmospheric circulation in the occurrence of hot days was evaluated using the Grosswetterlagen (GWL) circulation types catalog, as well as composite maps created with the bootstrap resampling technique. Our results reveal that June 2019 was unusually hot, and in terms of the magnitude of the anomaly, it has no analogue in the 70-year-long temperature record for Europe. However, the properties of heat events in the two considered regions were substantially different. The occurrence of hot days in June 2019, in Europe, was mainly associated with the GWL types forcing advection from the southern sector and co-occurrence of high-pressure systems which was significantly proven by the results of bootstrap resampling. In terms of the applicability of the new approach, the EI proved to be a useful tool for the analysis and evaluation of the severity of hot days based on their intensity and spatial range.
1. Introduction
June 2019 was the warmest of the reanalysis period, both for Europe and globally [1]. A large number of European regions were affected by extremely high temperatures, as reflected by numerous air temperature records that were set. Record-breaking values of the maximum air temperature in June were recorded on daily timescales in many places, including Spain (43.4 °C in Lleida), Germany (39.6 °C in Bernburg/Saale), Poland (38.2 °C in Radzyn), and the Czech Republic (38.9 °C in Doksany) [2,3,4]. Records were broken in Switzerland, especially at mountain weather stations, where temperatures exceeded 30.0 °C [5]. A record-breaking high temperature also occurred in France, where the country’s all-time record was set when temperature exceeded 45 °C for the first time in the history of temperature measurement. The temperature recorded in Gallargues-le-Montueux was 45.9 °C, which was a value that was 1.8 °C higher than the previous record high of August 2003 [6].
An increase in the frequency of occurrence of heat extremes on Earth has been observed since the middle of the 20th century [7,8]. Many areas in Europe have experienced high-impact heatwaves, especially after 2000 [9,10]. The record-breaking events of August 2003 in Western and Central Europe and July–August 2010 in Eastern Europe and Russia are among the most extensively described. These mega-heatwaves, as termed by Barrioperdo et al. [11] due to their extraordinary intensity, extent, and long duration, were associated with a high number of deaths, estimated to be 70,000 in the case of the 2003 event and 50,000 in the 2010 event, and with economic losses that reached $10 billion and $15 billion, respectively [11,12]. In June 2017, Europe witnessed the earliest summer mega-heatwave since at least the mid-twentieth century [13]. The early summer heat event, which occurred at the end of June and beginning of July of 2019, was also characterized by exceptional spatial extent, duration, and magnitude, which were comparable with typical mega-heatwaves [14].
Extreme heat events are most often defined as days or sequences of days (heatwaves) with air temperature exceeding a threshold determined based on the probability distribution of air temperature at a given place [15]. Most research on temperature extremes has been focused on the analysis of time series at isolated points [15], but in the most recent studies, attention has been paid more frequently to their spatial range, which together with their intensity and duration, affects the outcome of these extremes [11,13,16,17]. Severe heat events contribute to an increase in morbidity and mortality, and as research confirms, early-season heat events are even more hazardous than these occurring later in the season [16,17]. Extremely hot weather also causes losses in regional economies and natural ecosystems. Frequently, the losses are sharply exacerbated by droughts and fires associated with heat events [11].
In recent years, a number of research teams have produced indices that could be used to show temperature extremes in a comprehensive manner in terms of their intensity, duration, or spatial extent. Some of them help to evaluate temperature extremes from a purely climatologic point of view, while others help to investigate the influence of extreme temperatures on specific aspects of human activity. The focus of this work is on indices representing the first of these approaches. Most of the indices use percentile-based thresholds, and therefore they can be applied to various climate regions. The Expert Team on Climate Change Detection and Indices (ETCCDI) developed the warm spell duration index (WSDI), and used it to compare heat events, but only with respect to their duration [7]. In addition, the WSDI is calculated for seasons and years individually, therefore, a heat wave which occurs across two seasons is split in two. Russo et al. [18] overcame these limitations by applying percentile-based thresholds determined for each calendar day. The heat wave magnitude index (HWMI), developed by them, evaluated heat events with respect to duration, and also intensity (or magnitude). On the one hand, both the WSDI and HWMI represent a local approach, whereas the spatial range of heat extremes is not considered. On the other hand, the heat wave intensity index (Ihw) produced by Lhotka and Kyselý [19] helps to evaluate and compare heat waves in terms of their spatial range, magnitude, and duration. It is, however, applicable to a limited spatial domain only. Recently, Sánchez-Benitez et al. [13] proposed a refined algorithm, for the purpose of identifying large-scale heatwaves (“mega-heatwaves”) in Europe and describing them in terms of their spatial range, magnitude, and duration.
In this study, we propose an approach that combines information on the intensity and spatial extent of extreme temperature events, and at the same time makes it possible to examine the variability of these components separately. The new index is a modification of the extremity index proposed by Wypych et al. [20], which helped to investigate temporal and spatial variability of temperature extremes at the regional level. The newly developed index is universal, which means that the results obtained from geographic areas of different sizes and with different climate conditions and during different seasons are comparable.
Atmospheric circulation and synoptic conditions are considered to be major factors in the occurrence of extreme heat events [21,22]. Some extraordinary weather events, for example, hot days and heatwaves, have well-defined synoptic patterns that can be recognized. Summer hot days and heatwaves are most frequently associated with high-pressure systems, which generate favorable conditions for cloudless and windless weather, and consequently, for intense heating up of the surface [23,24]. In the case of heatwaves, a significant role is played by blocking situations created when a high-pressure system stays over a given area for a longer period of time and the zonal flow of air masses is limited [25,26]. Blocking situations lead to stable anticyclonic weather, which creates favorable conditions for the occurrence of severe heatwaves, examples of which are the aforementioned events of 2003 and 2010 [27,28]. The occurrence of heat events is also enhanced by the advection of warm air masses; in Europe, flowing especially from the southern sector and from the east [24,26]. There are several methods to study the influence of atmospheric circulation on the occurrence of temperature extremes including the use of classifications of circulation patterns [21], as well as more or less sophisticated statistical techniques [29].
Accordingly, the main objective of the present study was to assess the severity of temperature conditions, in Europe, in June 2019 using the extremity index proposed to comprehensively characterize extreme temperature events in terms of their spatial extent and intensity. Another goal of the study was to evaluate circulation conditions that favored the occurrence of extreme heat events, in June 2019, as seen over the long term.
2. Materials and Methods
The daily maximum temperature (TX) series for June for the period 1950–2019 were obtained from the E-OBS gridded dataset (v20.0e), in which data are given in the form of a regular latitude–longitude grid at a spatial resolution of 0.1° × 0.1°. The E-OBS is a European-wide, land-only observational dataset based on the European Climate Assessment and Dataset (ECA&D) daily station data [30]. Grid points with no missing data were used in the analyses. Almost all of Europe was considered in the introductory part of the research, whereas, in the main part, the focus was on two European regions, where TX records occurred in June 2019. They are as follows: (1) Central Europe (CE), defined as the area lying between 43–58° N and 3–20° E and (2) Iberia and the Western Mediterranean (IB), defined as the area lying between 31–48° N and 17° W–9° E (Figure 1A). The spatial dimensions of the domains were obtained from an international project called “COST733 Action: Harmonization and Applications of Weather Type Classifications for European Regions” [21,31]. The CE domain corresponds to domain 07 (Central Europe), whereas the IB domain is domain 09 (Western Mediterranean), with slightly modified western and southern borders. The domains were originally developed to study different aspects of atmospheric circulation and synoptic phenomena over Europe. Although they overlap, in this study, the CE and IB domains are considered and analyzed independently, thus, it does not affect the research results. In this research, only the land part of the domains was considered. From this perspective, the area of the CE domain is about twice the size of the IB domain.
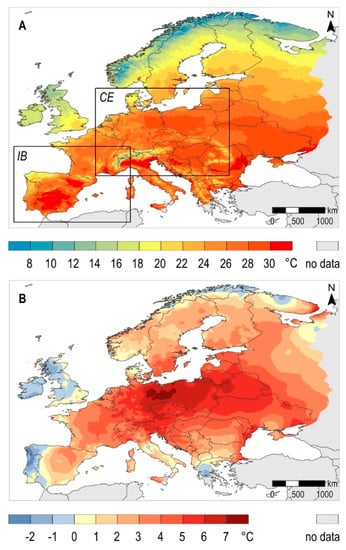
Figure 1.
Monthly maximum air temperature in Europe, in June 2019. (A) Average; (B) Anomaly with respect to the period 1981–2010. CE, Central Europe domain and IB, Iberia and the Western Mediterranean domain.
A hot day (HD) occurs when the daily TX exceeds the local daily 95th percentile of the 1981–2010 period (TX95p), computed using a 15-day-centered window [15,32]. Since seasonal variability of air temperature is taken into account in this method, a percentile-based threshold for detecting extremes is relevant for a given part of the year. As shown by Sulikowska and Wypych [32], the choice of the period within a year that the percentile is calculated is meaningful, especially when one is interested in a detailed view of some event, i.e., a case study. The normal period of 1981–2010 is used, as the World Meteorological Organization recommends using the most recent normal period in order to describe events that occurred in the recent past [33]. HDs were determined at each grid point separately. Since the main goal of the present study was a comprehensive description and evaluation of temperature conditions in two regions of Europe, in June 2019, the study’s analyses included events which occurred at different spatial scales, i.e., from local to regional.
The spatial range of an HD is described by the physical size of a geographic area affected by extreme temperatures. Since temperature data in the E-OBS dataset are placed in a regular latitude–longitude grid, the size of an area represented by a single grid point increases southwardly. The simplest way to estimate the spatial range of an HD is to consider the sum of the number of grid points affected by extreme temperature weighted by their respective areas. All spatial analyses were performed using the ”raster” R package (v3.0-7) [34].
The intensity of an HD is the cumulative temperature excess above the 95th percentile over an area affected by a temperature extreme. In other words, for all affected grid points, the TX excess above TX95p was weighted by their respective areas, and subsequently summed. The cumulative temperature excess is a good measure of heat event intensity, because it contains information on an additional heat load that appears in the environment [35,36]. This additional heat energy brings consequences to ecosystems, society, and the economy.
In order to describe the severity of individual HDs, in terms of their spatial range and intensity, the extremity index (EI) was proposed, which is a product of the total area (TA) and the total intensity (TI) of an HD scaled by 0.01, as follows:
The total area (TA) of an HD is the ratio of the spatial range of an HD (a, km2) to the area of an entire domain (A, km2), as follows:
The total intensity (TI) of an HD is the intensity of an HD (e, °C ∙ km2), expressed in relation to the 99th percentile of an HD’s intensity in the reference period 1981–2010 (E, °C ∙ km2), as follows:
EI is a daily index, as it is computed using daily values of the TA and the TI. The TA and the TI are dimensionless indices, as is the EI. The TA can be, at a maximum, equal to 1, which means that an HD affects the entire study area. It is impossible to determine the upper limit of the intensity of an HD, and therefore the TI was normalized using data describing past events. A TI higher than 1 means that an HD is more intense than 99% of the HDs, which occurred in the considered area in the normal period 1981–2010. A constant value of 0.01 was introduced to make the EI values more manageable.
The present study involved an analysis of daily and monthly values of the EI, where the monthly values are expressed as the sum of EI for an entire month. We proceed analogously in the case of the EI components, namely the TA and TI.
The EI, in a simple way, combines the spatial range and intensity information, to simultaneously perform an analysis of the variability of the components separately. The magnitude of the EI increases along with an increase in the spatial range or intensity of HD. Mostly, the EI takes on values in the range from 0 to 100, although higher values are associated with the occurrence of severe events, of presumably serious consequences to ecosystems, society, and the economy. The EI can be used to compare and evaluate the severity of extreme heat events within one geographic area, and also, thanks to the use of the relative components TA and TI, to compare events occurring in different spatial domains.
The role of atmospheric circulation in the occurrence of HDs was evaluated using two separate methods. To properly evaluate the atmospheric conditions accompanying HDs in both domains, very local events (EI < 1) were not considered in these analyses. First, the subjective Grosswetterlagen (GWL) circulation types catalog was used [37,38]. The GWL circulation types were determined based on the location of key pressure systems, the direction of air mass advection, and type of rotation over Central Europe, i.e., cyclonic or anticyclonic (see [37] or [39] for typical maps of all individual types). A total of 29 circulation types were categorized into three circulation groups (zonal, meridional, and mixed), and an unclassified type [37] (Table 1). Additionally, the GWL circulation types were grouped into eight Grosswettertypen (GWT) types regarding the airflow direction (Table 1) [37]. Originally developed for Central Europe (i.e., Germany), the GWL concept is applicable over a substantially wider area, extending to all of Europe [40,41]. The GWL catalog has already been successfully used in studies concerning relationships between atmospheric circulation and extreme temperature events [22,26,42].

Table 1.
Circulation types according to the Grosswetterlagen (GWL) catalog grouped into Grosswettertypen (GWT) advection types. Types 1–4 belong to the zonal group, Types 5–11 belong to the mixed group, and Types 12–29 belong to the meridional group. CE, Central Europe and U., unclassified.
In this paper, in order to evaluate the circulation conditions of HDs, in June 2019, and compare them to the long term, we determined for each grid point a dominant type of circulation accompanying the highest number of HDs in the period 1950–2018 and separately in 2019. To identify circulation types which brought about the highest probability of HDs, the analysis of conditional probability of their occurrence within the Grosswettertypen (GWT) types was conducted. The GWT advection types were used to make the results better marked, as the frequency of some GWL circulation types in June was low.
Finally, to identify circulation patterns accompanying the occurrence of HDs, composite maps of sea level pressure (SLP) and 500 hPa geopotential heights were drawn using the bootstrap resampling method [43,44]. Data for this analysis were obtained from the ERA5 dataset [45] and included values of SLP and 500 hPa geopotential heights at 12:00 UTC for each day of June, in the period 1979–2019. These data are on a 0.25° latitude–longitude grid. The spatial domain is “COST733 Action” domain 00 covering entire Europe and northeastern Atlantic [31].
To account for the general circulation background of HDs occurrence in the CE and IB domains, composite maps of 500 hPa geopotential heights were drawn for all days with EI > 1 in the period 1979–2018 for each domain separately (“target group”). Then, 1000 “artificial” composites using the same number of days were generated from the randomly selected dates from the whole dataset. Bootstrap resampling with replacement was used, which made the selection of each date theoretically equally likely [43]. Next, the statistical test was performed to identify grid points, where 500 hPa geopotential height for a “target group” was significantly different from the null distribution based on the “artificial” data. The significance was assessed at the 1% level.
To estimate the variety or similarity of synoptic conditions accompanying HDs in June 2019 with those accompanying HDs over the long-term, the procedure was performed using HDs with EI > 1 in June 2019 as a “target group” and all HDs with EI > 1 in the period 1979–2018 as the basis for random sampling. Again, bootstrap resampling with replacement was used and the significance was assessed at the 1% level.
The SLP data were used to construct composite maps for GWL types which were particularly relevant to the occurrence of HDs.
3. Results
The description of temperature conditions for June 2019 begins with an analysis of the anomaly of the average monthly TX and record-breaking daily TX values. In June 2019, 93% of Europe experienced a positive anomaly of the average monthly TX with respect to the period 1981–2010 (Figure 1B). Similar cases had already occurred in the past, examining trends from the perspective of the last 70 years. However, it was not just the area covered by the anomaly, but its magnitude, that were exceptional in June 2019, reaching a European mean of 3.1 °C as compared with the mean of the period 1981–2010. The greatest positive anomaly occurred in Central Europe, where, locally, the average TX was nearly 8.0 °C higher than the norm (Figure 1B). Over the long term, starting in 1950, the average TX in June 2019 was the highest over 21% of Europe, primarily in the Central Europe (CE) domain (Figure 2A). Previously established temperature records were exceeded by as much as 4.0 °C in Germany and Poland. The average monthly TX in these areas exceeded 28.0 °C, and in a small borderland zone even 30.0 °C (Figure 1A). These values were close to the mean TX, under normal conditions in June, found in southern Spain. Daily TX records for June were broken over an area comprising 25% of the whole studied area, stretching from Spain to the Kola Peninsula in Russia, an area that was strongly fragmented (Figure 2B). The greatest exceedances of old records of daily TX in June occurred primarily in the Iberia and the Western Mediterranean domain (IB). These reached, at a maximum, 6.5 °C, in the region where the French all-time air temperature record was noted (Figure 2B).
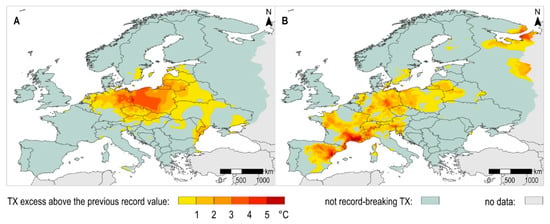
Figure 2.
Magnitude of the exceedance of the previous record of (A) the average monthly maximum air temperature, in June 2019, and (B) the maximum daily air temperature, in June 2019, with respect to the period 1950–2018.
The following section of the paper contains an evaluation of June 2019 in terms of occurrence of hot days (HDs) using the extremity index (EI), with a particular focus on the CE and IB spatial domains. A total of 29 HDs occurred in the CE domain, which means that some part of the domain was affected by extreme temperatures every single day of the month, except one. There were 25 HDs in the IB domain. Figure 3A presents the total area (TA) and total intensity (TI) along with the corresponding EI values for individual HDs in June 2019 (large symbols) and in the period 1950–2018 (small symbols). The EI values increase rapidly along with a simultaneous increase in the TA and TI of an HD. The highest values, exceeding EI = 100, correspond to very severe HDs, associated with very large TA and TI. However, in cases when only one of the EI components (TA or TI) is exceptionally high, and the other component has a relatively small value, the EI values are much lower (Figure 3A).
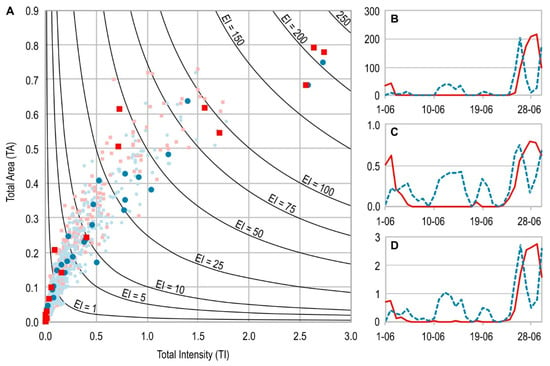
Figure 3.
(A) Total area (TA) and total intensity (TI) of individual hot days in the Central Europe domain (blue circles) and the Iberia and the Western Mediterranean domain (red squares) in June 2019 (large symbols) and in the period 1950–2018 (small symbols) along with corresponding extremity index (EI) values (black curves); (B) Variability of daily EI values in June 2019; (C) TA and (D) TI of individual hot days in June 2019. Blue dotted line, Central Europe domain and red solid line, Iberia and the Western Mediterranean domain.
Figure 3A shows HDs of extraordinary TA and TI with the EI reaching unprecedented values between 175 and 214 in both domains, in June 2019. Although the ranking of the most severe HDs, based on the EI, lists many different years, for example, 2000 and 2013 in CE and 2003 and 2017 in IB, it was the HDs in 2019 that were unsurpassed in terms of TI, and consequently, EI (Table 2 and Figure 3A). The most severe events always occurred in the second part of the month (Table 2).

Table 2.
Top ten hot days, in June, in terms of the extremity index (EI) along with total area (TA) and total intensity (TI) (1950–2019).
The monthly sum of the EI in June 2019 was 795 for the CE domain and 885 for the IB domain, but the time series of HDs and their properties were different. The HDs in the CE domain were mostly characterized by an EI between 1 and 50 (Figure 3A), and occurred over the course of the whole month, with three-day or shorter breaks in between (Figure 3B–D). Two distinct heat episodes occurred in the IB domain, one at the beginning and another at the end of the month; for most of the time, however, HDs either did not occur or if they occurred, they were HDs with a very small TA and TI, and consequently a very small EI < 1 (Figure 3). Differences between the domains also emerged in the frequency of HDs at individual grid points (Figure 4). At the scale of Europe as a whole, the area experiencing HDs in June 2019 most frequently included the middle part of the continent, the major part of which was found in the CE domain, and the west coast of the Black Sea (up to 18 HDs per grid point).
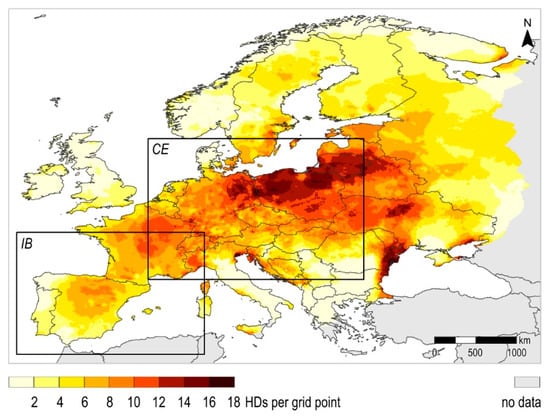
Figure 4.
Frequency of occurrence of hot days (HDs) at individual grid points, in June 2019, in Europe. CE, Central Europe domain and IB, Iberia and the Western Mediterranean domain.
HDs of highest severity occurred in the last days of June 2019 in both considered spatial domains (Figure 3B and Table 2). The total EI in the period from 25 to 30 June equaled 565 for CE and 798 for IB. On particular HDs, extreme temperatures affected up to 70–80% of the area of each domain, and the TX excess above the 95th percentile (TX95p) reached 9.0 °C (Figure 5 and Figure 6). On those days, the TX in CE locally exceeded 38.0 °C, and in IB 40.0 °C, which resulted in the setting of new records of the maximum air temperature in June in many countries (Figure 5 and Figure 6) [2,3,4,5,6]. These unusually severe HDs, which occurred at the end of the month of June, were the deciding factor that placed 2019 at the top in the ranking of the most extreme years in terms of the monthly sum of the EI, in June, since 1950 (Table 3).
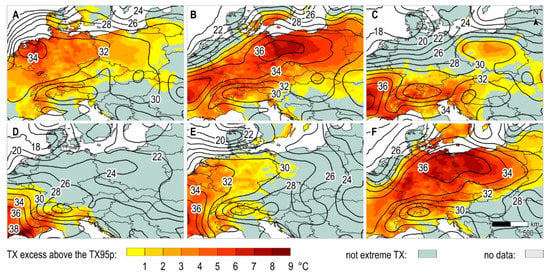
Figure 5.
(A–F) Excess of daily maximum temperature above the 95th percentile threshold noted in the Central Europe domain on subsequent days from 25 to 30 June 2019. Isolines show daily maximum temperature values.
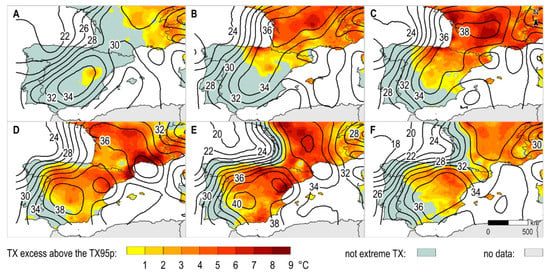
Figure 6.
(A–F) Excess of daily maximum temperature above the 95th percentile threshold in the Iberia and the Western Mediterranean domain on subsequent days from 25 to 30 June 2019. Isolines show daily maximum temperature values.

Table 3.
Top ten years in terms of monthly totals of the extremity index (EI) for June along with monthly sums of the total area affected (TA) and sums of the total intensity (TI) and total number of HDs (1950–2019).
Ultimately, considering the joint effect of the intensity and spatial range of HDs, temperature conditions in June 2019 were more extreme in IB than in CE (Table 3). However, it is worth noting that, in terms of TA and TI which are considered to be separate characteristics of HDs, June 2019 was more severe in CE than in IB. This discrepancy comes from the properties of the EI, which combines TA and TI information for each individual HD. In other words, the monthly sum of EI indirectly passes information on the nature of HDs, which occurred in a given domain. Relatively many HDs occurred in the CE domain, but they were characterized by rather average TA and TI, which, consequently, added up to high monthly sums of these EI components. The situation was different in IB, where the number of HDs was smaller, but several of the hot days were characterized by exceptional TA and TI. These very severe HDs contributed to the high monthly sum of the EI (Table 3).
The list of 10 years with the highest monthly EI in June is clearly dominated by years from the last 20-year period (Table 3). In the CE domain, June 2019 was unmatched in terms of TA, TI, as well as EI monthly totals, whereas the second position was occupied by June 2000 with its sum of EI that was slightly higher than 50% of the top-ranked month’s EI. In the IB domain, June 2019 had the highest EI, but the EI for June 2017 was almost as high. Moreover, in terms of TA and TI, considered as separate characteristics, June 2017 was more extreme than June 2019 (Table 3). In other words, in June 2017, the sum of the TA and TI of HDs was greater, but individual HDs were less severe than those noted in June 2019 (Table 3).
In the last part of this paper, the focus is on the evaluation of circulation conditions favoring the occurrence of HDs in June 2019 and a comparison of them to long-term conditions in Europe, with a special emphasis on the CE and IB domains. Over most of the area of Europe, the occurrence of HDs in June is associated with one of the following four circulation types: high over Central Europe (HM), trough over Western Europe (TrW), trough over Central Europe (TrM), or Sea-Fennoscandian high, cyclonic (HNFz) (Figure 7A). An analysis of model synoptic maps for each one of the types (see [37]) indicates that they are associated with advection of air masses from the southern sector into the area of the occurrence of HDs, and in the case of HM, TrM, and HNFz are also associated with a high-pressure system hovering over the area. The distribution of pressure systems in the case of the TrW type, i.e., low pressure in the western part and high pressure in the eastern part of the continent, is tied to the meridional arrangement of isobars forcing an inflow of air masses from the south (typical patterns of SLP and 500 hPa geopotential heights for HM and TrW circulation types are shown in Figure 8).
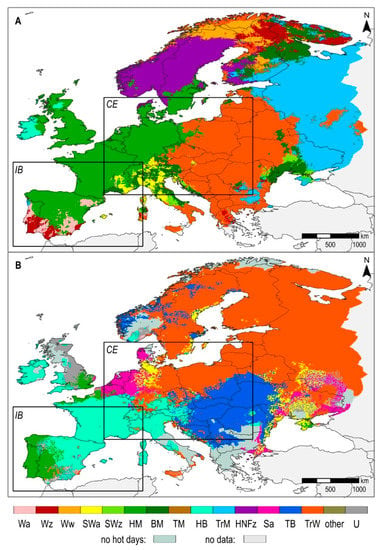
Figure 7.
Grosswetterlagen (GWL) circulation types accompanying the highest number of hot days with EI > 1 in June. (A) 1950–2018; (B) 2019. Symbols are explained in Table 1.
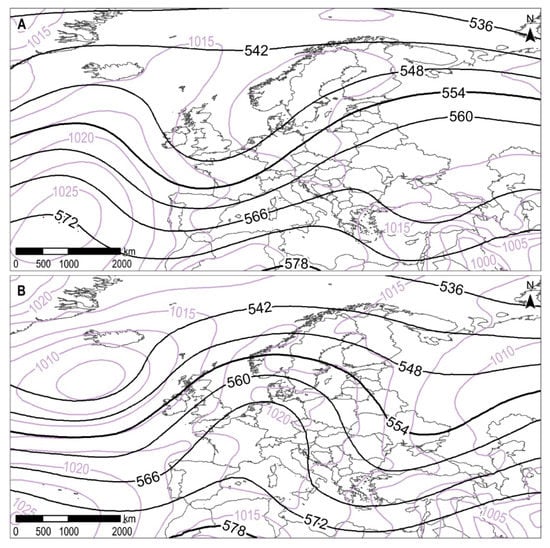
Figure 8.
Composite pattern of sea level pressure (SLP) and 500 hPa geopotential height typical for the Groswetterlagen circulation types. (A) Through over Western Europe (TrW); (B) High over Central Europe (HM). SLP is shown in violet (light grey) and isobars use 2.5 hPa intervals. Geopotential height is shown in black and contours use 6 dam (decameters) intervals.
HDs in the western part of the CE domain occur most frequently with the HM circulation type, whereas in the eastern part of the domain they are most common with the TrW circulation type (Figure 7A). In the southwestern part of the CE domain, HDs occur most frequently with the anticyclonic southwesterly (SWa) circulation type, associated with the center of a high-pressure system hovering over the area; and in the zonal ridge across Central Europe (BM), associated with advection of air masses from the southern sector into the area. HM is the dominant circulation type associated with HDs in the IB domain. In southern Iberia, the anticyclonic westerly (Wa) and Cyclonic westerly (Wz) circulation types also play a role and are associated with high-pressure systems hovering over the area and create favorable conditions for advection from the south (Figure 7A). These results are in agreement with the analysis of composite maps of 500 hPa geopotential height constructed for each domain for all days when EI > 1 in 1979–2018 (Figure 9). In both domains, HDs are associated with a high-pressure ridge centered over the area. This statistically significant increase in geopotential height in both regions is accompanied by significant negative anomalies of 500 hPa level height over the Atlantic, eastern part of the continent, and eastern Mediterranean Sea (Figure 9). These pressure lows are easy to identify on model maps of 500 hPa geopotential height for circulation types most frequently occurring with HDs, for example, HM, TrW, SWa, and BM (Figure 8 and [37]).
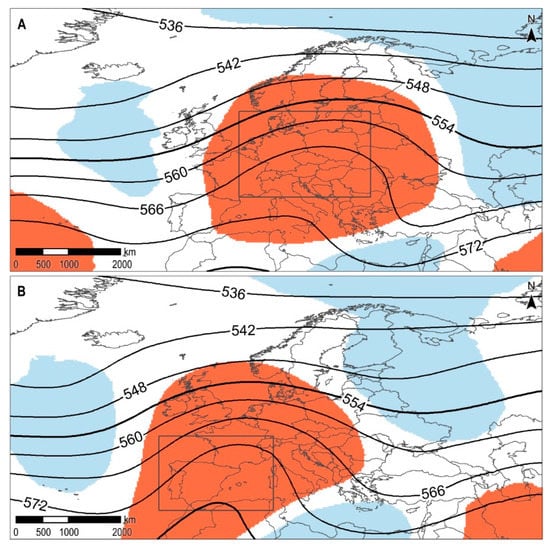
Figure 9.
Composite pattern of 500 hPa geopotential height typical for the hot days with EI > 1 occurring, in June, in 1979–2018 in (A) Central Europe and (B) Iberia and the Western Mediterranean. Contours use 6 dam (decameters) intervals. Shading indicates areas passing 1% significance test. Red (dark) shading denotes positive significant anomalies (unusually high heights) and blue (light) shading denotes significantly low heights. A rectangle marks the boundaries of the respective domain.
The frequent occurrence of HDs with particular circulation types does not necessarily imply that these are the types that bring about the highest probability of HDs. In Table 4, conditional probability of the occurrence of HDs within particular GWT advection types is shown. In the CE domain, the probability of HDs is the largest with the circulation types provoking airflow from the southwest and the south into the area (Table 4). However, these two GWT advection types occur in June rather rarely (Table 5 and Figure 10). The model synoptic maps [37] for most of the circulation types forming these GWT advection types include a high-pressure system over the CE domain. Not surprisingly, the Central European High GWT itself also plays a role in the occurrence of HD in this region (Table 4). Interestingly, it brings about a relatively high probability of HDs also in the IB domain (Table 4), which is caused by the extending of the high-pressure system towards western Europe. In the IB domain, the probability of HDs is also high with the northwest and the southwest GWT advection types, associated with high-pressure systems of varying strength over the area and advection of air masses from the southern sector into the area.

Table 4.
Conditional probability (%) of occurrence of hot days with EI > 1 within Grosswettertypen (GWT) advection types (1950–2019).

Table 5.
Frequency of occurrence (%) of Grosswettertypen (GWT) advection types in June over the long term (1950–2018) and frequency of occurrence (%) of Grosswettertypen (GWT) advection types in June 2019.

Typically, weather in Europe, in June, is under the influence of variable GWT advection types, with those associated with advection of air masses from the west and north playing the most important role (Table 5). June 2019 was quite unusual in terms of atmospheric circulation conditions, as weather types with advection of air masses from the south largely predominated; the south and southwest GWT advection types persisted for almost 75% of the days (Table 5). June 2019 was also not “normal” in terms of circulation types associated with HDs. Although HDs occurred during TrW over a significant part of Europe, a significant role was played by other, less common circulation types (Figure 7B and Figure 10). The low over British Islands (TB) circulation type played a significant role in the southeastern part of CE. The HB type, which favors advection from the south, prompted the occurrence of HDs in the southwestern part of CE and over most of IB. Hot days, in the western part of CE, were associated with the rarely occurring anticyclonic southerly (Sa) circulation type, in June (1% of days in the period 1950–2018) (Figure 7B and Figure 10). Hot days characterized by the highest EI in June 2019 were associated with the aforementioned circulation types, i.e., HB and Sa types in CE, and the HM and HB types in IB. It was only on the 30th of June that a very severe HD was accompanied by the Wa circulation type, associated with an extensive high-pressure system with a center located over the Atlantic, to the north of Iberia (for model maps of particular circulation types see [37]).
Composite maps of 500 hPa geopotential height for the HDs with EI > 1 in June 2019 synthesizes the results obtained with the use of GWL circulation types and GWT advection types (Figure 11). In both domains, HDs occurred under the ridge of high pressure over the area and advection of warm air masses from the south. A comparison of the composite maps of geopotential height constructed for the long-time period, in June 2019, shows the significant shifts of warm air towards the north over the continent apparent as a warm high-pressure ridge, whereas over the Atlantic and the Arctic Ocean a southward shift of colder air can be seen (Figure 9 and Figure 11). Such a pattern confirms an intensive expansion of very warm air masses from the south further to the north over Europe. The unusual character of the June 2019 circulation conditions is additionally emphasized by significant positive anomalies of geopotential height, implying that the 500 hPa level was significantly higher than during HDs in the long-time period over much of Europe, and even beyond it (Figure 11). Significant negative anomalies of geopotential height are present over the Atlantic and in the far northeast, but only in the pattern accompanying HDs in the CE domain. Given that many of the HDs in the CE domain, in June 2019, occurred during the TrW circulation type, and in the IB domain HDs were accompanied by the HB and HM circulation types, the patterns of geopotential height during HDs refer to the typical geopotential patterns for particular circulation types. However, the above-mentioned shifts in 500 hPa level height are clearly noticeable (Figure 8 and Figure 11).
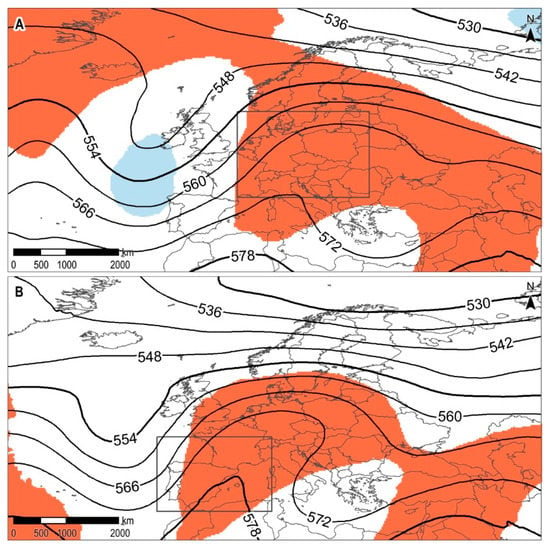
Figure 11.
Composite pattern of 500 hPa geopotential height for the hot days with EI > 1 occurring in June 2019 in (A) Central Europe, and (B) Iberia and the Western Mediterranean. Contours use 6 dam (decameters) intervals. Shading indicates areas passing 1% significance test. Red (dark) shading denotes positive significant anomalies (unusually high heights) and blue (light) shading denotes significantly low heights. A rectangle marks the boundaries of the respective domain.
4. Discussion and Conclusions
In this paper we have shown that June 2019 was unusually hot, and in terms of the magnitude of the anomaly, it has no analogue in the temperature records for Europe, chronicled over the last 70 years. We focused on two distinct European regions, which were particularly affected by extremely hot days, namely Central Europe (CE domain) and Iberia and the Western Mediterranean (IB domain). In order to better characterize the severity of hot days, we designed an approach to comprehensively evaluate hot days in terms of their spatial extent and intensity. The newly developed extremity index (EI) was used to perform a comparison of temperature conditions in June 2019 with the period 1950–2018 and to make a comparison of temperature conditions of the two regions.
The most extreme years in both studied domains in the considered extended period in terms of temperature conditions in June occurred mostly after 2000. In Central Europe, June 2019 was absolutely exceptional as compared with long-term conditions. It was a different story in Iberia and the Western Mediterranean, where June 2017 was comparable to June 2019 in terms of temperature severity. According to Sánchez-Benítez et al. [13], in June 2017, we witnessed the earliest mega-heatwave in the entire reanalysis period, which primarily affected Iberia. The occurrence of such intense and spatially extensive heat events in June in recent years could be an indication of an increasingly warmer, earlier, and consequently, increasingly longer summer across Europe [46,47,48]. June 2019 could be a subsequent manifestation of these changes, which are in agreement with existing climate projections [49].
A detailed analysis of the EI throughout June 2019 revealed that, on the one hand, Central Europe was exceptionally warm for the month as a whole, experiencing hot days almost every day, although their severity was mostly moderate. On the other hand, Iberia and the Western Mediterranean experienced two quite short, but very intense heat episodes at the beginning and end of the month. Most of the time, however, air temperature there was close to normal.
The EI proved to be a useful tool for the analysis and evaluation of the severity of hot days based on their intensity and spatial range. Its special advantage is its capability to compare results obtained in areas of different sizes and different climates, and implicitly, also in different seasons of the year. We plan to focus in further research on advancing its use and testing its usefulness in more interdisciplinary studies.
In terms of circulation conditions of hot days, in June, in Europe, the results of our research indicate that, in Central Europe, hot days occur mostly in association with a low-pressure trough over Western Europe and co-occurring high-pressure system over Eastern Europe, which force advection from the south, or under the conditions of a high-pressure system hovering directly over Central Europe. In the IB domain, hot days are associated with a high-pressure system hovering over Central Europe or directly over the Iberian Peninsula, which produces favorable conditions for advection from the south and the east. These results are consistent with conditions reported previously on the issue of summer heat events in Europe [23,24], in the studied geographic regions [50,51,52] and at the country level [53,54].
The greatest number of hot days in June over most of Europe occur in association with one of the four Grosswetterlagen circulation types, part of the mixed group (HM) or meridional group (TrM, HNFz, TrW). Kyselý [26] identified circulation types significantly conducive to summer heatwaves and these were similar types, although not exactly the same types, which we found, namely HM, BM, Fennoscandian high, anticyclonic (HFa), and cyclonic southwesterly (SWz). Ustrnul et al. [22] analyzed circulation types associated with summer hot days in Poland and found that BM, TrW, and SWz types played a significant role. This indicates that the circulation conditions triggering heat events are different in each given summer month, and also that they are different depending on whether we consider individual hot days or long-lasting events (heatwaves).
Exceptionally high temperatures in June 2019 were a direct outcome of distinctly unusual circulation conditions for this month. For almost three-quarters of the days, an advection of warm air masses from the southern sector into Central Europe occurred, which, together with the prevalence of anticyclonic conditions, prompted hot weather during practically the entire month in this region. In the IB domain, HDs were accompanied by favorable high-pressure systems over the area and strong advection of air masses from the south. The end of the month saw HDs which were unprecedented in terms of intensity and spatial range in both domains. Thermodynamic factors contributing to this specific event were studied by Sousa et al. [14], who identified intrusions of the very warm, stable, and dry Saharan air as the basic cause of unusually warm and long-lasting conditions over most of Europe which persisted until 3 July. As shown by Sousa et al. [14] and also in this paper, the unusually high pressure over the continent, and also the southward shift and deepening of the Atlantic low, played a crucial role.
Author Contributions
Conceptualization, A.S. and A.W.; Formal analysis, A.S.; Methodology, A.S. and A.W.; Visualization, A.S.; Writing—original draft, A.S.; Writing—review and editing, A.W. All authors have read and agreed to the published version of the manuscript.
Funding
This research was funded by the Jagiellonian University in Kraków, grant number N23/MNS/000023 and by the Polish Ministry of Science and Higher Education, subsidy for the University of Agriculture in Kraków for 2020.
Conflicts of Interest
The authors declare no conflict of interest.
References
- Climate Change Service: Surface Air Temperature for June 2019. Available online: https://climate.copernicus.eu/surface-air-temperature-june-2019 (accessed on 11 May 2020).
- Agencia Estatal de Meteorología. Informe Mensual Climatológico Junio de 2019. Available online: http://www.aemet.es/documentos/es/serviciosclimaticos/vigilancia_clima/resumenes_climat/mensuales/2019/res_mens_clim_2019_06.pdf (accessed on 11 May 2020).
- Deutscher Wetterdienst. Deutschlandwetter Im Jahr 2019. Available online: https://www.dwd.de/DE/presse/pressemitteilungen/DE/2019/20191230_deutschlandwetter_jahr2019_news.html?nn=16210 (accessed on 11 May 2020).
- Meteo France. Canicule: Des Records Nationaux de Températures Battus en Europe. Available online: Http://www.meteofrance.fr/actualites/73752343-canicule-des-records-nationaux-de-temperatures-battus-en-europ (accessed on 11 May 2020).
- MeteoShweiz. Rekordhitze. Available online: https://www.meteoschweiz.admin.ch/home/aktuell/meteoschweiz-blog/meteoschweiz-blog.subpage.html/de/data/blogs/2019/6/rekordhitze.html (accessed on 11 May 2020).
- Meteo France. 45,9 °C: Un Record en Questions. Available online: http://www.meteofrance.fr/actualites/73995274-45-9c-un-record-en-questions (accessed on 11 May 2020).
- Alexander, L.V.; Zhang, X.; Peterson, T.C.; Caesar, J.; Gleason, B.; Klein Tank, A.M.G.; Haylock, M.; Collins, D.; Trewin, B.; Rahimzadeh, F.; et al. Global observed changes in daily climate extremes of temperature and precipitation. J. Geophys. Res. Atmos. 2006, 111, 1–22. [Google Scholar] [CrossRef]
- Perkins, S.E.; Alexander, L.V.; Nairn, J.R. Increasing frequency, intensity and duration of observed global heatwaves and warm spells. Geophys. Res. Lett. 2012, 39, L20714. [Google Scholar] [CrossRef]
- Twardosz, R.; Kossowska-Cezak, U. Exceptionally hot summers in Central and Eastern Europe (1951–2010). Theor. Appl. Climatol. 2013, 112, 617–628. [Google Scholar] [CrossRef]
- Russo, S.; Sillmann, J.; Fischer, E.M. Top ten European heatwaves since 1950 and their occurrence in the coming decades. Environ. Res. Lett. 2015, 10, 124003. [Google Scholar] [CrossRef]
- Barriopedro, D.; Fischer, E.M.; Luterbacher, J.; Trigo, R.M.; García-Herrera, R. The hot summer of 2010: Redrawing the temperature record map of Europe. Science 2011, 332, 220–224. [Google Scholar] [CrossRef] [PubMed]
- Garcia-Herrera, R.; Díaz, J.; Trigo, R.M.; Luterbacher, J.; Fischer, E.M. A review of the european summer heat wave of 2003. Crit. Rev. Environ. Sci. Technol. 2010, 40, 267–306. [Google Scholar] [CrossRef]
- Sánchez-Benítez, A.; García-Herrera, R.; Barriopedro, D.; Sousa, P.M.; Trigo, R.M. June 2017: The Earliest European Summer Mega-heatwave of Reanalysis Period. Geophys. Res. Lett. 2018, 45, 1955–1962. [Google Scholar] [CrossRef]
- Sousa, P.M.; Barriopedro, D.; Ramos, A.M.; García-Herrera, R.; Espírito-Santo, F.; Trigo, R.M. Saharan air intrusions as a relevant mechanism for Iberian heatwaves: The record breaking events of August 2018 and June 2019. Weather Clim. Extrem. 2019, 26, 100224. [Google Scholar] [CrossRef]
- Perkins, S.E. A review on the scientific understanding of heatwaves—Their measurement, driving mechanisms, and changes at the global scale. Atmos. Res. 2015, 164–165, 242–267. [Google Scholar] [CrossRef]
- Anderson, G.B.; Bell, M.L. Heat waves in the United States: Mortality risk during heat waves and effect modification by heat wave characteristics in 43 U.S. communities. Environ. Health Perspect. 2011, 119, 210–218. [Google Scholar] [CrossRef]
- Ng, C.F.S.; Ueda, K.; Ono, M.; Nitta, H.; Takami, A. Characterizing the effect of summer temperature on heatstroke-related emergency ambulance dispatches in the Kanto area of Japan. Int. J. Biometeorol. 2014, 58, 941–948. [Google Scholar] [CrossRef]
- Russo, S.; Dosio, A.; Graversen, R.G.; Sillmann, J.; Carrao, H.; Dunbar, M.B.; Singleton, A.; Montagna, P.; Barbola, P.; Vogt, J.V. Magnitude of extreme heat waves in present climate and their projection in a warming world. J. Geophys. Res. Atmos. 2014, 119, 12500–12512. [Google Scholar] [CrossRef]
- Lhotka, O.; Kyselý, J. Characterizing joint effects of spatial extent, temperature magnitude and duration of heat waves and cold spells over Central Europe. Int. J. Climatol. 2015, 35, 1232–1244. [Google Scholar] [CrossRef]
- Wypych, A.; Sulikowska, A.; Ustrnul, Z.; Czekierda, D. Temporal variability of summer temperature extremes in Poland. Atmosphere 2017, 8, 51. [Google Scholar] [CrossRef]
- Huth, R.; Beck, C.; Philipp, A.; Demuzere, M.; Ustrnul, Z.; Cahynová, M.; Kyselý, J.; Tveito, O.E. Classifications of atmospheric circulation patterns: Recent advances and applications. Ann. N. Y. Acad. Sci. 2008, 1146, 105–152. [Google Scholar] [CrossRef]
- Ustrnul, Z.; Czekierda, D.; Wypych, A. Extreme values of air temperature in Poland according to different atmospheric circulation classifications. Phys. Chem. Earth 2010, 35, 429–436. [Google Scholar] [CrossRef]
- Della-Marta, P.M.; Luterbacher, J.; von Weissenfluh, H.; Xoplaki, E.; Brunet, M.; Wanner, H. Summer heat waves over western Europe 1880-2003, their relationship to large-scale forcings and predictability. Clim. Dyn. 2007, 29, 251–275. [Google Scholar] [CrossRef]
- Stefanon, M.; Dandrea, F.; Drobinski, P. Heatwave classification over Europe and the Mediterranean region. Environ. Res. Lett. 2012, 7, 014023. [Google Scholar] [CrossRef]
- Porebska, M.; Zdunek, M. Analysis of extreme temperature events in central europe related to high pressure blocking situations in 2001–2011. Meteorol. Z. 2013, 22, 533–540. [Google Scholar] [CrossRef]
- Kyselý, J. Influence of the persistence of circulation patterns on warm and cold temperature anomalies in Europe: Analysis over the 20th century. Glob. Planet. Chang. 2008, 62, 147–163. [Google Scholar] [CrossRef]
- Black, E.; Blackburn, M.; Harrison, G.; Hoskins, B.; Methven, J. Factors contributing to the summer 2003 European heatwave. Weather 2004, 59, 217–223. [Google Scholar] [CrossRef]
- Schneidereit, A.; Schubert, S.; Vargin, P.; Lunkeit, F.; Zhu, X.; Peters, D.H.W.; Fraedrich, K. Large-Scale Flow and the Long-Lasting Blocking High over Russia: Summer 2010. Mon. Weather Rev. 2012, 140, 2967–2981. [Google Scholar] [CrossRef]
- Grotjahn, R.; Black, R.; Leung, R.; Wehner, M.F.; Barlow, M.; Bosilovich, M.; Gershunov, A.; Gutkowski, W.J., Jr.; Gyakum, J.R.; Katz, R.W.; et al. North American extreme temperature events and related large scale meteorological patterns: A review of statistical methods, dynamics, modeling, and trends. Clim. Dyn. 2010, 46, 1151–1184. [Google Scholar] [CrossRef]
- Cornes, R.C.; van der Schrier, G.; van den Besselaar, E.J.M.; Jones, P.D. An Ensemble Version of the E-OBS Temperature and Precipitation Data Sets. J. Geophys. Res. Atmos. 2018, 123, 9391–9409. [Google Scholar] [CrossRef]
- Philipp, A.; Bartholy, J.; Beck, C.; Erpicum, M.; Esteban, P.; Fettweis, X.; Huth, R.; James, P.; Jourdain, S.; Kreienkamp, F.; et al. Cost733cat—A database of weather and circulation type classifications. Phys. Chem. Earth 2010, 35, 360–373. [Google Scholar] [CrossRef]
- Sulikowska, A.; Wypych, A. Summer temperature extremes in Europe: How does the definition affect the results? Theor. Appl. Climatol. 2020, 1–12. [Google Scholar] [CrossRef]
- World Meteorological Organization. WMO Guidelines on the Calculation of Climate Normals; WMO/TD-No. 1203; World Meteorological Organization: Geneva, Switzerland, 2017; p. 30. [Google Scholar]
- Hijmans, R.J.; van Etten, J.; Sumner, M.; Cheng, J.; Bevan, A.; Bivand, R.; Busetto, L.; Canty, M.; Forrest, D.; Ghosh, A.; et al. Raster: Geographic Data Analysis and Modeling. R Package Version 3.0-7. Available online: https://CRAN.R-project.org/package=raster (accessed on 20 October 2019).
- Kyselý, J. Temporal fluctuations in heat waves at Prague-Klementinum, The Czech Republic, from 1901-97, and their relationships to atmospheric circulation. Int. J. Climatol. 2002, 22, 33–50. [Google Scholar] [CrossRef]
- Nairn, J.; Fawcett, R. Defining Heatwaves: Heatwave Defined as a Heat-Impact Event Servicing All Communiy and Business Sectors in Australia; CAWCR Technical Report No. 060; The Centre for Australian Weather and Climate Research—A partnership between CSIRO and the Bureau of Meteorology: Melbourne, Australia, 2013; p. 96. ISBN 9781922173126. Available online: https://www.cawcr.gov.au/static/technical-reports/CTR_060.pdf (accessed on 12 May 2020).
- Werner, P.C.; Gerstengarbe, F.W. Katalog der Großwetterlagen Europas (1881–2009) nach Paul Hess und Helmut Brezowsky; Verbesserte und Ergänzte Auflage; Postdam Institute for Climate Impact Research (PIK): Potsdam, Germany, 2010; ISBN 4933128820. [Google Scholar]
- Deutscher Wetterdienst. Großwetterlage. Available online: https://www.dwd.de/DE/leistungen/grosswetterlage/grosswetterlage.html (accessed on 12 May 2020).
- Cawley, G.C. Mean daily surface level pressure anomaly charts by Grosswetterlagen Index. Available online: http://theoval.cmp.uea.ac.uk/~gcc/projects/accord/experiments/experiment1a/node1.html (accessed on 12 May 2020).
- Hoy, A.; Jaagus, J.; Sepp, M.; Matschullat, J. Spatial response of two European atmospheric circulation classifications (data 1901–2010). Theor. Appl. Climatol. 2013, 112, 73–88. [Google Scholar] [CrossRef]
- Huth, R. Synoptic-climatological applicability of circulation classifications from the COST733 collection: First results. Phys. Chem. Earth 2010, 35, 388–394. [Google Scholar] [CrossRef]
- Wypych, A.; Ustrnul, Z.; Sulikowska, A.; Chmielewski, F.M.; Bochenek, B. Spatial and temporal variability of the frost-free season in Central Europe and its circulation background. Int. J. Climatol. 2017, 37, 3340–3352. [Google Scholar] [CrossRef]
- Grotjahn, R.; Faure, G. Composite predictor maps of extraordinary weather events in the Sacramento, California, Region. Weather Forecast. 2008, 23, 313–335. [Google Scholar] [CrossRef]
- Kuswanto, H.; Hidayati, S.; Salamah, M.; Ulama, B.S. Bootstrap resampling to detect active zone for extreme rainfall in Indonesia. J. Phys. Conf. Ser. 2017, 893, 012031. [Google Scholar] [CrossRef]
- Copernicus Climate Change Service (C3S). ERA5: Fifth generation of ECMWF atmospheric reanalyses of the global climate. Copernicus Climate Change Service Climate Data Store (CDS), 2017. Available online: https://cds.climate.copernicus.eu/cdsapp#!/home (accessed on 10 June 2020).
- Peña-Ortiz, C.; Barriopedro, D.; García-Herrera, R. Multidecadal variability of the summer length in Europe. J. Clim. 2015, 28, 5375–5388. [Google Scholar] [CrossRef]
- García, M.J.L. Recent warming in the balearic sea and Spanish Mediterranean coast. Towards an earlier and longer summer. Atmosfera 2015, 28, 149–160. [Google Scholar] [CrossRef]
- Dong, B.; Sutton, R.T.; Shaffrey, L. Understanding the rapid summer warming and changes in temperature extremes since the mid-1990s over Western Europe. Clim. Dyn. 2017, 48, 1537–1554. [Google Scholar] [CrossRef]
- Cassou, C.; Cattiaux, J. Disruption of the European climate seasonal clock in a warming world. Nat. Clim. Chang. 2016, 6, 589–594. [Google Scholar] [CrossRef]
- Tomczyk, A.M.; Bednorz, E. Heat waves in Central Europe and their circulation conditions. Int. J. Climatol. 2016, 36, 770–782. [Google Scholar] [CrossRef]
- Tomczyk, A.M.; Pólrołniczak, M.; Bednorz, E. Circulation conditions’ effect on the occurrence of heatwaves in Western and Southwestern Europe. Atmosphere 2017, 8, 31. [Google Scholar] [CrossRef]
- García-Herrera, R.; Díaz, J.; Trigo, R.M.; Hernández, E. Extreme summer temperatures in Iberia: Health impacts and associated synoptic conditions. Ann. Geophys. 2005, 23, 239–251. [Google Scholar] [CrossRef]
- Tomczyk, A.M.; Sulikowska, A. Heat waves in lowland Germany and their circulation-related conditions. Meteorol. Atmos. Phys. 2018, 130, 499–515. [Google Scholar] [CrossRef]
- Pereira, M.G.; Trigo, R.M.; Da Camara, C.C.; Pereira, J.M.C.; Leite, S.M. Synoptic patterns associated with large summer forest fires in Portugal. Agric. For. Meteorol. 2005, 129, 11–25. [Google Scholar] [CrossRef]
© 2020 by the authors. Licensee MDPI, Basel, Switzerland. This article is an open access article distributed under the terms and conditions of the Creative Commons Attribution (CC BY) license (http://creativecommons.org/licenses/by/4.0/).