Article

Tornadoes in Portugal: An Overview

IPMA―Instituto Português do Mar e da Atmosfera, 1749-077 Lisboa, Portugal
*
Author to whom correspondence should be addressed.
Atmosphere 2020, 11(7), 679; https://doi.org/10.3390/atmos11070679
Submission received: 21 April 2020 / Revised: 23 June 2020 / Accepted: 25 June 2020 / Published: 28 June 2020
(This article belongs to the Special Issue Tornadoes in Europe: Climatology, Forecasting, and Impact)

Abstract

:
From 2000 onwards, a systematic documentation of tornado reports was maintained at the Portuguese Meteorological Service (IPMA). The characteristics of 195 tornado events over land and at sea off the coast of mainland Portugal, Azores, and Madeira Islands, reported until 2020, were compiled into a new tornado database for Portugal. Each event was identified through the direct observation of the vortex, photography or video footage, or eyewitness descriptions, as well as by site surveys, including the interpretation of traces of the tornado found on the ground. For events after 2006, each data record was complemented with Doppler radar observations and derived products, which allowed a tornado type (TT) classification. The synoptic regimes and atmospheric environments favoring each type were identified using observations and numerical weather prediction model data. Results showed that tornadoes over Portugal were more frequent during autumn, winter, and spring. It was found that the occurrence of more than one tornado on the same day was frequent. The most intense tornadoes, classified as F3 intensity, were spawned by supercells, but a large proportion of weaker, shorter-lived, but still damaging tornadoes were found to be spawned in association with quasi linear convective systems (QLCS).

1. Introduction

Unlike other meteorological phenomena for which instrumental observations are sufficient, the study of tornadoes requires the presence of an observer and a specific system for collecting the observations. There is a long history of tornado observations in Europe, back since the Greek and Roman natural philosophers. However, there are many inconsistencies both in the observational networks and in reporting practices across the different European countries. Organized and centralized tornado records have been kept in the United States of America (US) since the 1950s [1], and they have shown that the reported frequency and intensity of tornadoes is lower in Europe when compared to the U.S. Thus, tornadoes did not become a priority for the European meteorological services, although the true magnitude of their risk in Europe is unknown, due to the lack of assembled datasets [2].
A tornado climatology is important for better quantifying the threat posed by tornadoes, but also for understanding the genesis and characteristics of severe convective storms, as well as to assess possible trends due to climate change [3]. In recent years, efforts have been made to collect reports at the European level for a more consistent tornado climatology. These efforts were based on historical collections of tornado reports, case studies, and local climatology reports [2,4,5].
Since tornadoes are microscale phenomena, the probability of these events being observed from meteorological stations is low. Therefore, tornado records in the synoptic meteorological database are rare. By the end of the 20th century, most meteorologists considered that tornadoes did not occur in Portugal, classifying any damaging wind event as a “high-wind event”. After photographic evidence of a tornado in 1999, which occurred in Vila do Conde (northwestern coast of Portugal), and the posterior study of this event [6], other previous events were unveiled, suggesting that a new approach to these phenomena was needed. This included the study and the registration of each report [7,8,9,10]. Until 2020, there were 195 reports classified as tornado events over land or at sea off the coast of mainland Portugal, Azores, and Madeira Islands; 63 of which were documented with photo or video records, and 4 events were captured by weather stations. Evidence of tornadoes was found in 42 reports prior to the year 2000.
The distinctive characteristics of tornadoes and their effects, the increasing use of digital cameras, mobile phones, as well as the growing role of social media, have contributed to an increasing number of known events. Consequently, in the past couple of decades, awareness about the impact of tornadoes and their consequences to the people, territorial planning, and to the action of civil protection authorities has also increased.
A weather radar network was deployed over mainland Portugal, consisting of 3 C-band Doppler radars, which have been operational since 1998, 2005, and 2015 (respectively). The combined use of their observations with conceptual models has been allowing better insight on the identification of specific radar patterns related to organized convective systems [11,12,
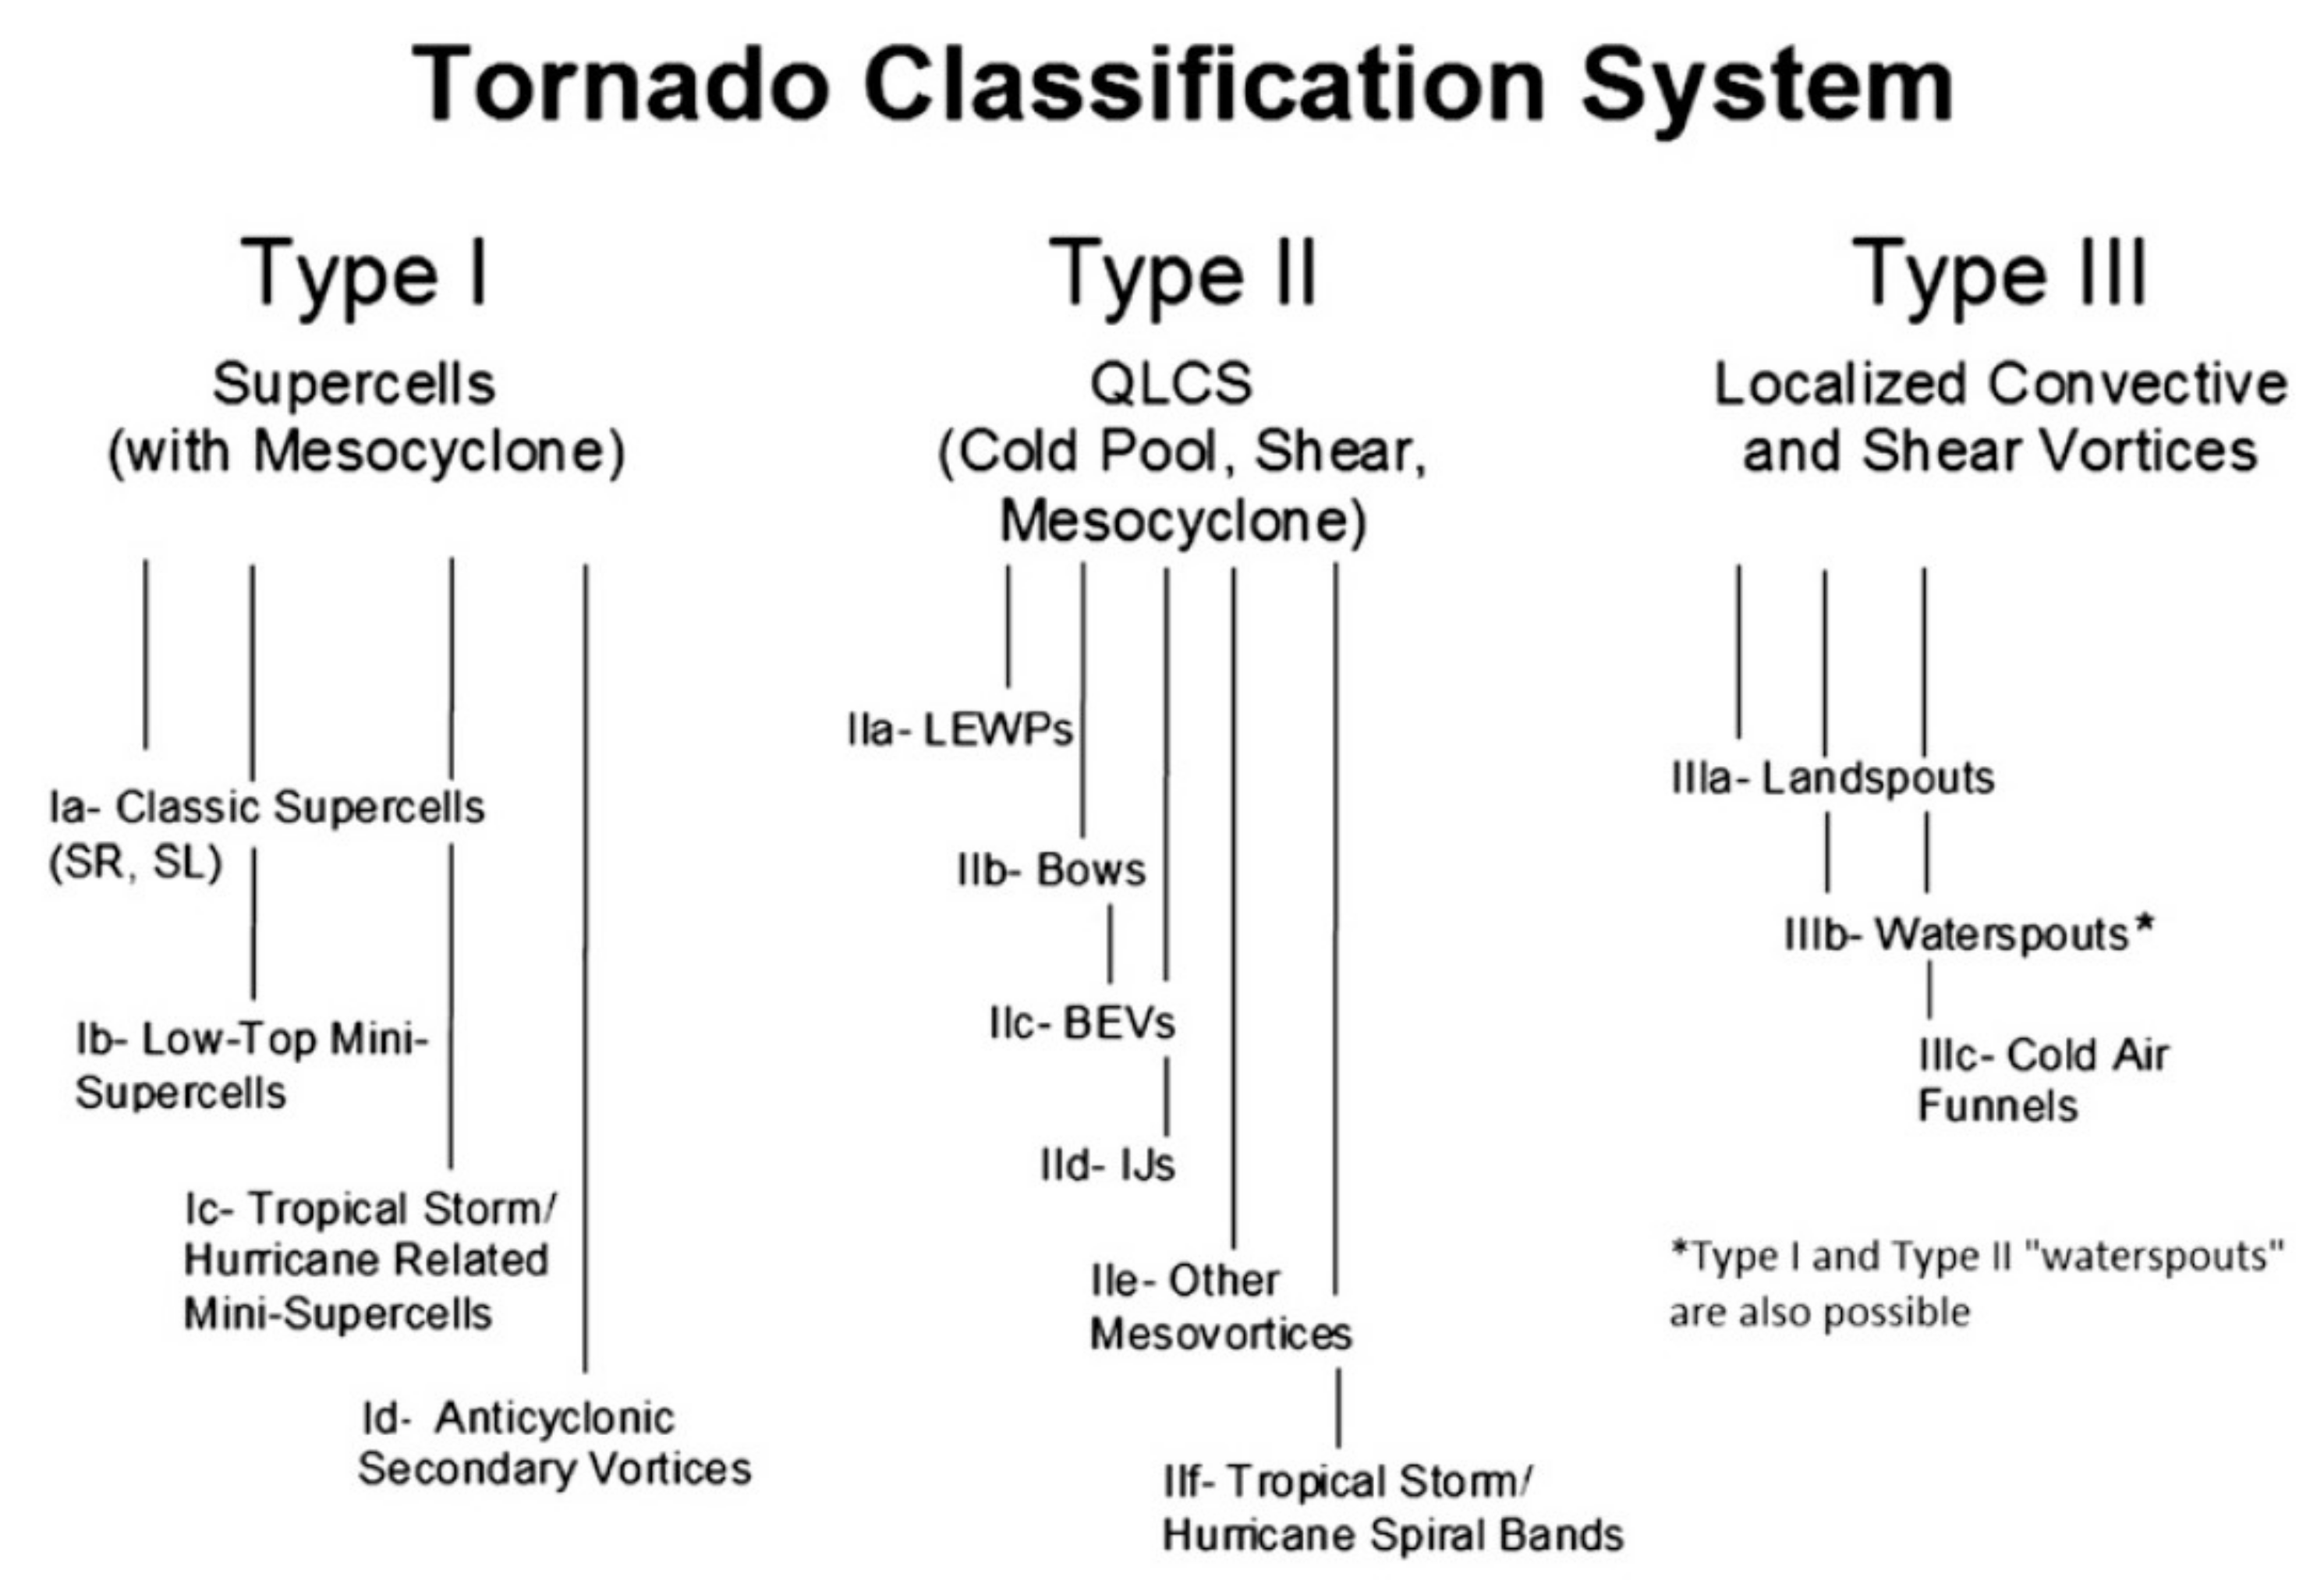
13]. The collection of tornado events has motivated a systematic classification of the series according to the proposed and recently reviewed tornado taxonomy [14,15] (see Appendix A for details on the taxonomy). The most damaging tornadoes were classified as supercell tornadoes [15]. This result is not surprising and it agrees with a recently detailed case study [16]. The most interesting finding was that a relatively large proportion of weaker and shorter-lived, but still damaging, tornadoes was associated with line echo wave patterns (LEWPs) [15]. Radar observations over Portugal suggest that most of these tornadoes were spawned by mesovortices embedded in squall line-type formations, such as observed over other geographical areas [17].
The aim of this paper is twofold. On one hand, it intends to contribute to the general climatology of tornadoes in Europe by presenting a tornado climatology for Portugal. On the other hand, it presents a sorting of tornado types (TT) following the taxonomy proposed by [15], together with an assessment of the different synoptic regimes and atmospheric environments that favored their occurrence in Portugal. The definition of a tornado and the methods that were used to collect tornado reports, as well as the methods to apply the tornado taxonomy and to characterize the typical atmospheric environments of each type, are described in Section 2. A climatological characterization of tornadoes in Portugal is presented in Section 3. The results of the tornado taxonomy classification for Portugal are presented in Section 4. Section 5 includes two well-documented case studies. Discussion and conclusions are provided in Section 6.

2. Research Method

2.1. Tornado Characterization

According to the Glossary of Meteorology of the American Meteorological Society, revised in October 2013 [18], a tornado is defined as “a rotating column of air, in contact with the surface, pendant from a cumuliform cloud, and often visible as a funnel cloud and/or circulating debris/dust at the ground.” The fact that the vortex in contact with the ground “must be pendant from a cumuliform cloud” implies the presence of convective buoyancy, which will lead to the vortex formation. Thus, purely shear-driven vortices such as gustnados (although indirectly associated with cumuliform convective clouds) must be eliminated, but tornadoes falling in the type III class of tornado taxonomy [15], namely landspouts, waterspouts, and even a few cold-air funnels when in contact with the ground, should be considered. Following the rule in use in other European countries, this tornado definition was adopted and extended by considering all the waterspouts, some of which made landfall.
Since the year 2000, for each reported occurrence, a new data record was created, including elements provided by local authorities, witness reports, press articles, and social media posts, often documented with detailed descriptions, photographs, and video footage of the phenomena and their effects. When that site survey was not possible for a given event, technical inquiries were conducted, which were made by telephone with the local authorities (such as civil protection service, firefighters, the local council) and with the event witnesses. These inquiries provided detailed information on the damage traces found on the surface (ground, trees, buildings, and other manmade structures, etc.). Documents such as video footage and photographs enabled the determination of the trajectory and intensity for some of the events. In recent years, close cooperation with educated civil protection service agents improved the surveyed data. Site inspection conducted by meteorologists of the Portuguese Meteorological Service (IPMA) was done on some occasions [19,20,21,22,23,24,25], using the method proposed by Bunting and Smith [26]. Data on tornadoes that occurred before the year 2000 were also collected, some reports were found at the weather service archives [27] and private data collections.
Tornado identification relied on eyewitness descriptions, photos, or video footage of the vortex in contact with the surface and on the interpretation of reported damage and other traces found on the ground [28,29]. Systematic data search for each event provided detailed descriptions, including characteristics of buildings along the path, such as their construction type, the amount of damage, and location (as street or company name). Moreover, site survey conducted by IPMA meteorologists for some of the recorded events allowed a better understanding of tornado effects and how they were perceived and reported by the public and the media. However, several factors make tornado identification a challenging task: (i) sometimes the tornado vortex exhibited a misleading shape, or it was not visible at all; (ii) the tornado damage resulted from different effects acting together (such as tornado intensity and land cover elements within the tornado path), which made identification difficult in cases where ground damage was small or non-existent; (iii) tornadoes were often spawned during large scale severe storm events, and a tornado path could be embedded in a broader area of damage by heavy rain, thunderstorms, and strong non-tornadic winds; (iv) witnesses at the scene had a limited perspective of the occurrence. Contradictory and/or incomplete data resulting from reports of inaccurate testimonies or misleading newspaper information was often found. For instance, it was common that witnesses did not know the time of the occurrence (sometimes not even the day); or that they indicated the time at which the rescue agents were notified instead of the occurrence time itself; or even that reports provided only an approximate occurrence location based on the name of the council or nearest town.
A tornado event was considered as confirmed if at least one of the following criteria applied: (i) a photo or a video of the tornado; (ii) a credible eyewitness description of the vortex touching the surface; (iii) a typical tornado damage documented based on credible eyewitness reports and/or footage. The tornado intensity was estimated based on the most intense reported damage. The tornado path was assessed based on all reported effects. For some events, path length and/or intensity were underestimated because minor damage was not always reported or the terrain characteristics were less prone to damage (e.g., over water or grassland) even if the observation of the vortex allowed the identification of its trajectory and duration.
The study of each event was complemented by the analysis of synoptic surface meteorological observations, relevant fields from state-of-the-art numerical weather models, and radar observations, whenever they were available. Radar data were used for the diagnosis of the mesoscale parent storm and confirmation of the tornado time and duration. Reported damage events, where the tornado vortex was not seen, and a convective storm was not identified, were discarded.
For each tornado reported on land and off the coast, the confirmed data on the location and time, the estimated intensity after Fujita [30], the duration, the path length, width, and direction, were recorded. Multiple vortex tornadoes were considered as a single event. Other 18 funnel cloud events with no evidence of a vortex touching the surface, 2 events classified as gustnado, 10 dust devil events, 5 downburst events, as well as every event where the available data of wind damage did not allow an unambiguous classification, were excluded.

2.2. Tornado Types Classification

For a set of tornado events that occurred between 1 January 2006 and 1 January 2020, the observations from the mainland Portuguese weather radar network were used to classify the TT after the conceptual taxonomy reviewed by Agee [15].
As input to the TT classification method, several radar products and observed radar fields were used. The former included: plane position indicators (PPI; horizontal projection of a single tilt scan), vertical sections over 3D products, rainfall products, maximum returns of reflectivity (also known as composite reflectivity), echo tops (altitude of a certain reflectivity threshold correlated with cloud tops), VIL (vertically integrated liquid), and VVP (volume velocity processing)—which corresponds to the vertical profile of horizontal wind [31]. Furthermore, the following radar fields were inspected: reflectivity, Doppler velocity (V), and storm relative velocity (SRV, Doppler velocity components relative to the storm reference frame). Whenever required, radar data information was complemented by trusted videos and photos as well as other reports.
The taxonomy proposed by Agee [15] considered the following tornado parent storm types: supercells (SC), which are associated to type I and are generally stronger; quasi linear convective systems (QLCS), which are associated to type II; and localized convective and shear vortices, which are associated to type III and are generally “benign” in terms of impact. Each type is then classified according to its sub-type, depending on the characteristics of each storm (see Figure A1, in Appendix A).
Type I includes discrete supercells, associated with TT Ia [14,15] and discrete mini-supercells (or low topped supercells), associated with TT Ib [14,15]. Types Ic (tropical storm/hurricane-related mini-supercells) and Id (anticyclonic secondary vortices) have not yet been identified in Portugal. Provided that the radar could observe the convective storms within a range of 100 km (Doppler range processing) and in a fine radar horizon sector, the identification of a supercell was made, considering its major defining characteristic: the existence of a deep and persistent rotating updraft, the mesocyclone [32,33]. The translation of this feature into radar signatures and the overall conceptual model currently accepted for a supercell, allowed the development of a simple working method to classify TT I: (1) to identify rotation associated with the mesocyclone (no quantitative criteria on vorticity [34] are considered in Portugal) by means of the identification of a coherent inbound–outbound couplet signature on Doppler velocity (frequently more defined on storm relative velocity); (2) the rotation signature (frequently identified first at higher levels of the storm, in the earlier stages) should be identified for at least, two consecutive radar scans (20 min) or identified twice during three consecutive scans; (3) identification of rotation at least in two successive radar tilts; (4) check for spatial correlation between velocity signatures and reflectivity signatures such as hook echo [35], bounded weak echo region (BWER) [36], forward flank, and rear flank areas [37] in the convective storm. In a few occasions—e.g., poor Doppler observation or SC out of the Doppler range processing—the longevity was considered as an additional characteristic, since it is known that SC are the longest-lived forms of deep moist convection [38].
Once a supercell was identified, the next step is to classify the storm as a discrete supercell or low topped supercell [39]. This was done based on the observed spatial scale of the storms (especially the vertical). Quantitative criteria derived for other regions where larger amounts of instability are typically available up to higher levels, could not be applied. In the study area, a low-topped supercell is usually no taller than 6000 m and the mesocyclone is not observed above 4000 m. These low topped supercells also have smaller horizontal extents, with diameters rarely exceeding 6000 m. On some of the events, these characteristics have hampered the verification of step (3) of the classification method.
Quasi linear convective systems, QLCS [40] were associated with type II storms [14,15]. There is no universal definition of a QLCS. In this study, it was considered as a quasi-linear pattern of low-level reflectivity greater than 35 dBZ, with no gaps over a distance on the order of at least 40 km. This definition is similar to others proposed in the literature [41], although of smaller spatial scale. Under the classification criteria considered by Agee [15], it was clarified that supercells were not considered in any of the sub-type vortex events. Agee [14] considered that QLCS included several types of storms, all of them with mesovortex as the common element. These types were associated with different physical processes and materialized distinct patterns, especially on reflectivity, although sometimes in a subtle way. Unlike supercells, which were extensively studied during the past 30 years, QLCS mesovortices have received considerably less attention. These vortices usually develop along and to the north of the bowing parts of a QLCS; inflow notches as well as rear inflow jets can frequently be observed in the surroundings [42,43]. Storm relative velocity can be used to detect mesovortex rotation the same way that it is used to identify the rotation of a supercell mesocyclone. Several distinctive characteristics of mesovortices were used to apply the identification method for TT II: (1) to identify small-scale rotation using inbound–outbound couplet signatures at very low levels (typically below 2500–3000 m a.m.s.l.) in a QLCS; these signatures tended to build up in time although this was not always easy to confirm; (2) the identified rotation shall be collocated with bowing structures on reflectivity, along a QLCS. It could be found that the previous signatures were associated with a line echo wave pattern (TT IIa), with an isolated bow echo (TT IIb) [44], with a bookend vortex (TT IIc) [45], with inflow jets along sections of the QLCS (TT IId), or with mesovortices along QLCS not satisfying a, b, c, or d. TT IIf was not identified in Portugal. Moreover, unlike the rotation of mesocyclones (typical of supercells), mesovortex rotation tends to be first identified at lower levels, building up with time. Its magnitude is usually weaker, of smaller scale and shallower, when compared to mesocyclones.
Finally, the last storm types considered by Agee [15] were TT IIIa and IIIb, associated with cumuliform clouds (TT IIIc, cold air funnels, was not identified in Portugal). This term—“cumuliform clouds”—suggests the challenge that these types pose to any radar classification attempt. Thus, it was not possible to consider specific characteristics that could be used to conceive an identification method based on radar. At the time and location waterspouts or landspouts were reported, radar data were used to confirm the presence of the parent convection (usually shallow), typically observed under a weak forcing environment. The only noteworthy sign that was identified on landspout events, at close radar range, was a sudden echo tops increase in a moderate reflectivity and isolated convective cell.

2.3. Synoptic Regimes and Atmospheric Environments

An overall synthetic and qualitative description of the synoptic-scale patterns and of the atmospheric environments typically associated with each of the classified TT, was performed for the period between 1 January 2006 and 1 January 2020
According to Agee [15], tornadoes are dependent on convective storms, and so environments prone to tornadoes must always enable convective storms to form. As synthesized by ESTOFEX (European Storm Forecast Experiment) [46], conditional or convective instability, low-level tropospheric moisture, and lift are necessary, but not sufficient, ingredients [33] for severe convection to occur, given their relative magnitude and overlapping. The extra ingredient required to modulate specific convective storm types is the vertical wind shear [47]. Several sounding derived parameters may be used to characterize the atmospheric environments prone to convective storms. Instability is usually quantified by convective available potential energy (CAPE), total available moisture and low-level moisture, which may be estimated by total precipitable water (TPW) and lifted condensation level (LCL), respectively. The vertical wind shear may be quantified through the bulk shear [48] (magnitude of the vector difference between the horizontal winds at two altitudes), using a low-level layer (e.g., 0–1 Km AGL) and a deep layer (e.g., 0–6 km AGL). Vorticity advection and the relative position of upper level jet streaks, for instance, may also be of importance to identify the set of ingredients in the environment.
To sample the atmospheric environment in which a certain convective storm was formed, the concept of sounding “proximity” is introduced [49]. This is a matter of particular importance for the studied region (western Iberia) because most of the parent tornado storms affecting the area form over the ocean. There are 3 upper air observation stations in western Iberia. Gibraltar (WMO 08495) and La Coruña (Spain, WMO 08001) are more than 250 km away from the territory and Lisbon (WMO, 08579) is the only upper air station in mainland Portugal. Even applying constraints in time and space [50] to the nearest sounding available or interpolating upper-air data to the required time and space would render poor results. Given this limitation, short range forecasts (6 h from analysis) by the CFS (Climate Forecast System, NOAA) and GFS (Global Forecast System, NOAA), as well as analysis by the GFS (all of them available every 6 h), with an horizontal resolution of 1° × 1°, were used. These were further complemented with analysis fields and short-range forecasts from the ECMWF (European Centre for Medium Range Weather Forecasts) model, when available, as well as surface analysis from the DWD (Deutscher Wetterdienst). Model data versus observations were verified when events occurred (a) close to the Lisbon upper air station (<200 km and <3 h) or (b) close to a surface weather station (<100 km and <1 h of available analysis). For 8 tornado events that occurred less than 200 km from the Lisbon upper air station and within 3 h from 12 UTC (nominal time of sounding), a comparison was made between GFS analysis and rawinsonde wind data, at 850 and 500 hPa. At the lowest level, the r.m.s.e. (root-mean-squared error) for the wind magnitude was 2.7 ms−1 (average observation 15.0 ms−1, bias −1.5 ms−1), while for 500 hPa, the r.m.s.e. was 2.9 ms−1 (average observation 24.7 ms−1, bias −1.2 ms−1). For 30 tornado events that occurred less than 100 km from a surface weather station and within 1 h of the available DWD and GFS analysis, a comparison was established between DWD analysis and surface observations (for m.s.l.p.), as well as between GFS analysis and surface observations (for 2 m air temperature). The r.m.s.e. for m.s.l.p. was 1.1 hPa (average observation 1005.6 hPa, bias −0.2 hPa) and for temperature was 1.8 °C (average observation 14.8 °C, bias −0.1 °C).
Considering the available data, this study presents an overall description of synoptic-scale patterns and a qualitative evaluation of the ingredients that were found in the synoptic-scale environments prone to each TT. Description of specific synoptic-scale situations as well as quantitative analysis of the ingredients will be made for selected cases of the most typical events.

3. A Portuguese Tornado Database

All data collected until 1 January 2020 were studied, revealing 195 reports validated as tornado events near the coast or in mainland Portugal, Azores, and Madeira Islands. There were 4 events captured from weather stations. As Table 1 shows, the validation of 63 events was based on trusted videos or photos (34 of tornadoes over sea, near the coast, and 29 of tornadoes with reported effects over land) and 50 events based on trusted eyewitness description of the phenomena (5 tornadoes over sea and 45 with reported effects over land). The vortex was not seen for the remaining 82 events (radar data enabled the diagnostic of a tornadogenic structure for 49 of these events). However, they were validated with the available data, including reports of local authorities and witnesses, and through site survey in 16 events.
All the 39 events over the sea were seen from the coast, usually from high places with a wide landscape. Five of these events were documented with precise description, and 34 with photos or videos of the vortex touching the sea surface. There was also footage of 11 more events over the sea that later made landfall. The footage of 18 tornado vortices over land and the witness description of 45 more events showed they had many different shapes; sometimes the vortex was clearly visible, and other times it was difficult to perceive. There was also footage of multi-vortex tornados.
On-site damage survey was conducted by meteorologists of IPMA for 19 events, and also by local civil protection services or trusted witnesses for another 16. For some events, available data was not enough to determine all characteristics that should be recorded, thus the final database is incomplete. The registered cases clearly underestimated the number of tornadoes that were known to have occurred, being likely that some tornado events were excluded due to lack of suitable data.

3.1. Historical Tornado Reports

Evidence of a tornado was found in 42 reports of events that occurred until 30 December 2000. Although a systematic data survey on historical tornado reports was not conducted, the available data on possible tornadoes was collected and investigated using newspaper reports and, whenever possible for more recent events, visiting the sites and contacting eyewitness and local authorities [7].
Weather station archives have recorded evidence of 2 tornadoes: (i) On 6 November 1954 at 12:50 a.m., a tornado destroyed the Castelo Branco Weather Station, causing a sudden drop from 1013 to 986 hPa and subsequent recovery in less than 15 min time lapse on the barograph record. Newspapers reported F3 damage for a path longer than 9 km, crossing the entire town. (ii) The “Annual Climate Report of Serra do Pilar Weather Station” referred that a tornado over water moved inland for several km, causing devastating effects in January 1941. A weather service site survey [27] reported F2 damage in houses and trees along a 4 km path, from SW to NE, on 13 December 1996 at 8:15 am, at Santiago do Cacém. The vortex was not seen, so this event was classified as a “devastatingly strong wind event” because it was commonly believed that tornadoes would not happen in Portugal. Moreover, photos of 4 different tornadoes were found in private collections of data.
During the 19th and the 20th centuries, newspapers often referred to the weather and weather damage; and the words “ciclone”, “furacão”, or “tufão” (in Portuguese), nowadays used in atmospheric science to refer to a “cyclone”, a “hurricane”, and a “typhoon”, respectively, were at that time popularly used to refer to any damaging wind storm. Recent studies of tornadoes and other classes of wind storms have shown how some deep lows or cold fronts may cause similar damage. However, when the more spectacular effects of tornadoes were described, the event could be classified as tornado. The first tornado event occurred on 24 February 1370 in Lisbon. The report was found in a 19th century newspaper list of weather events, referring that day “a furious furacão” caused heavy damage in the town. It blew open and carried halfway into the church the heavy iron doors of Lisbon Cathedral, which were locked.” The church archives confirmed there were important rebuilding works, including the bell tower, just after that date. On the evening of 21 June 1849, a strong thunderstorm caused a path of heavy damage of about 100 km in the Alentejo region (southern Portugal). Using current state-of-the-art knowledge, it is more likely that some of the damage path was actually caused by rain and hail, and that an F3 intensity tornado caused the reported heavy damage in houses and forest, the killing of cattle, and the debarking of strong and flexible bushes. A precise description of a tornado over the sea near Espinho (northwestern coast of Portugal), on 11 October 1863 at 9 am, was referred in the newspaper as a “beautiful phenomenon”, well known by the sailors as a sign of stormy weather. There are several reports of the 13 December 1864 events, when 4 tornadoes occurred. Precise description of serious damage in buildings at 10:30 a.m., along a 11 km path crossing the city of Lisbon from SW to NE, allowed its classification as F2 tornado. On 16 December 1989 at 8:20 p.m., an F3 tornado caused heavy damage in the forest and on 300 homes (4 of them collapsed), for a path longer than 11 km, from SW to NE, at Mangualde (central region of Portugal).
Although it was not possible to collect important data on most of the events, it is known that there were tornadoes of strong intensity with important losses of property, a substantial number of injuries and occasional casualties, but most events had a very local impact and soon were forgotten. Before the middle of the 20th century, the public and the weather services knew that tornadoes were unusual events, but they could happen near the coast of Portugal and they could make landfall. There was little knowledge about “devastating twist winds” events inland, since tornadoes—which usually affect small areas—were sometimes difficult to identify.

3.2. Tornadoes over Mainland Portugal and near the Coast

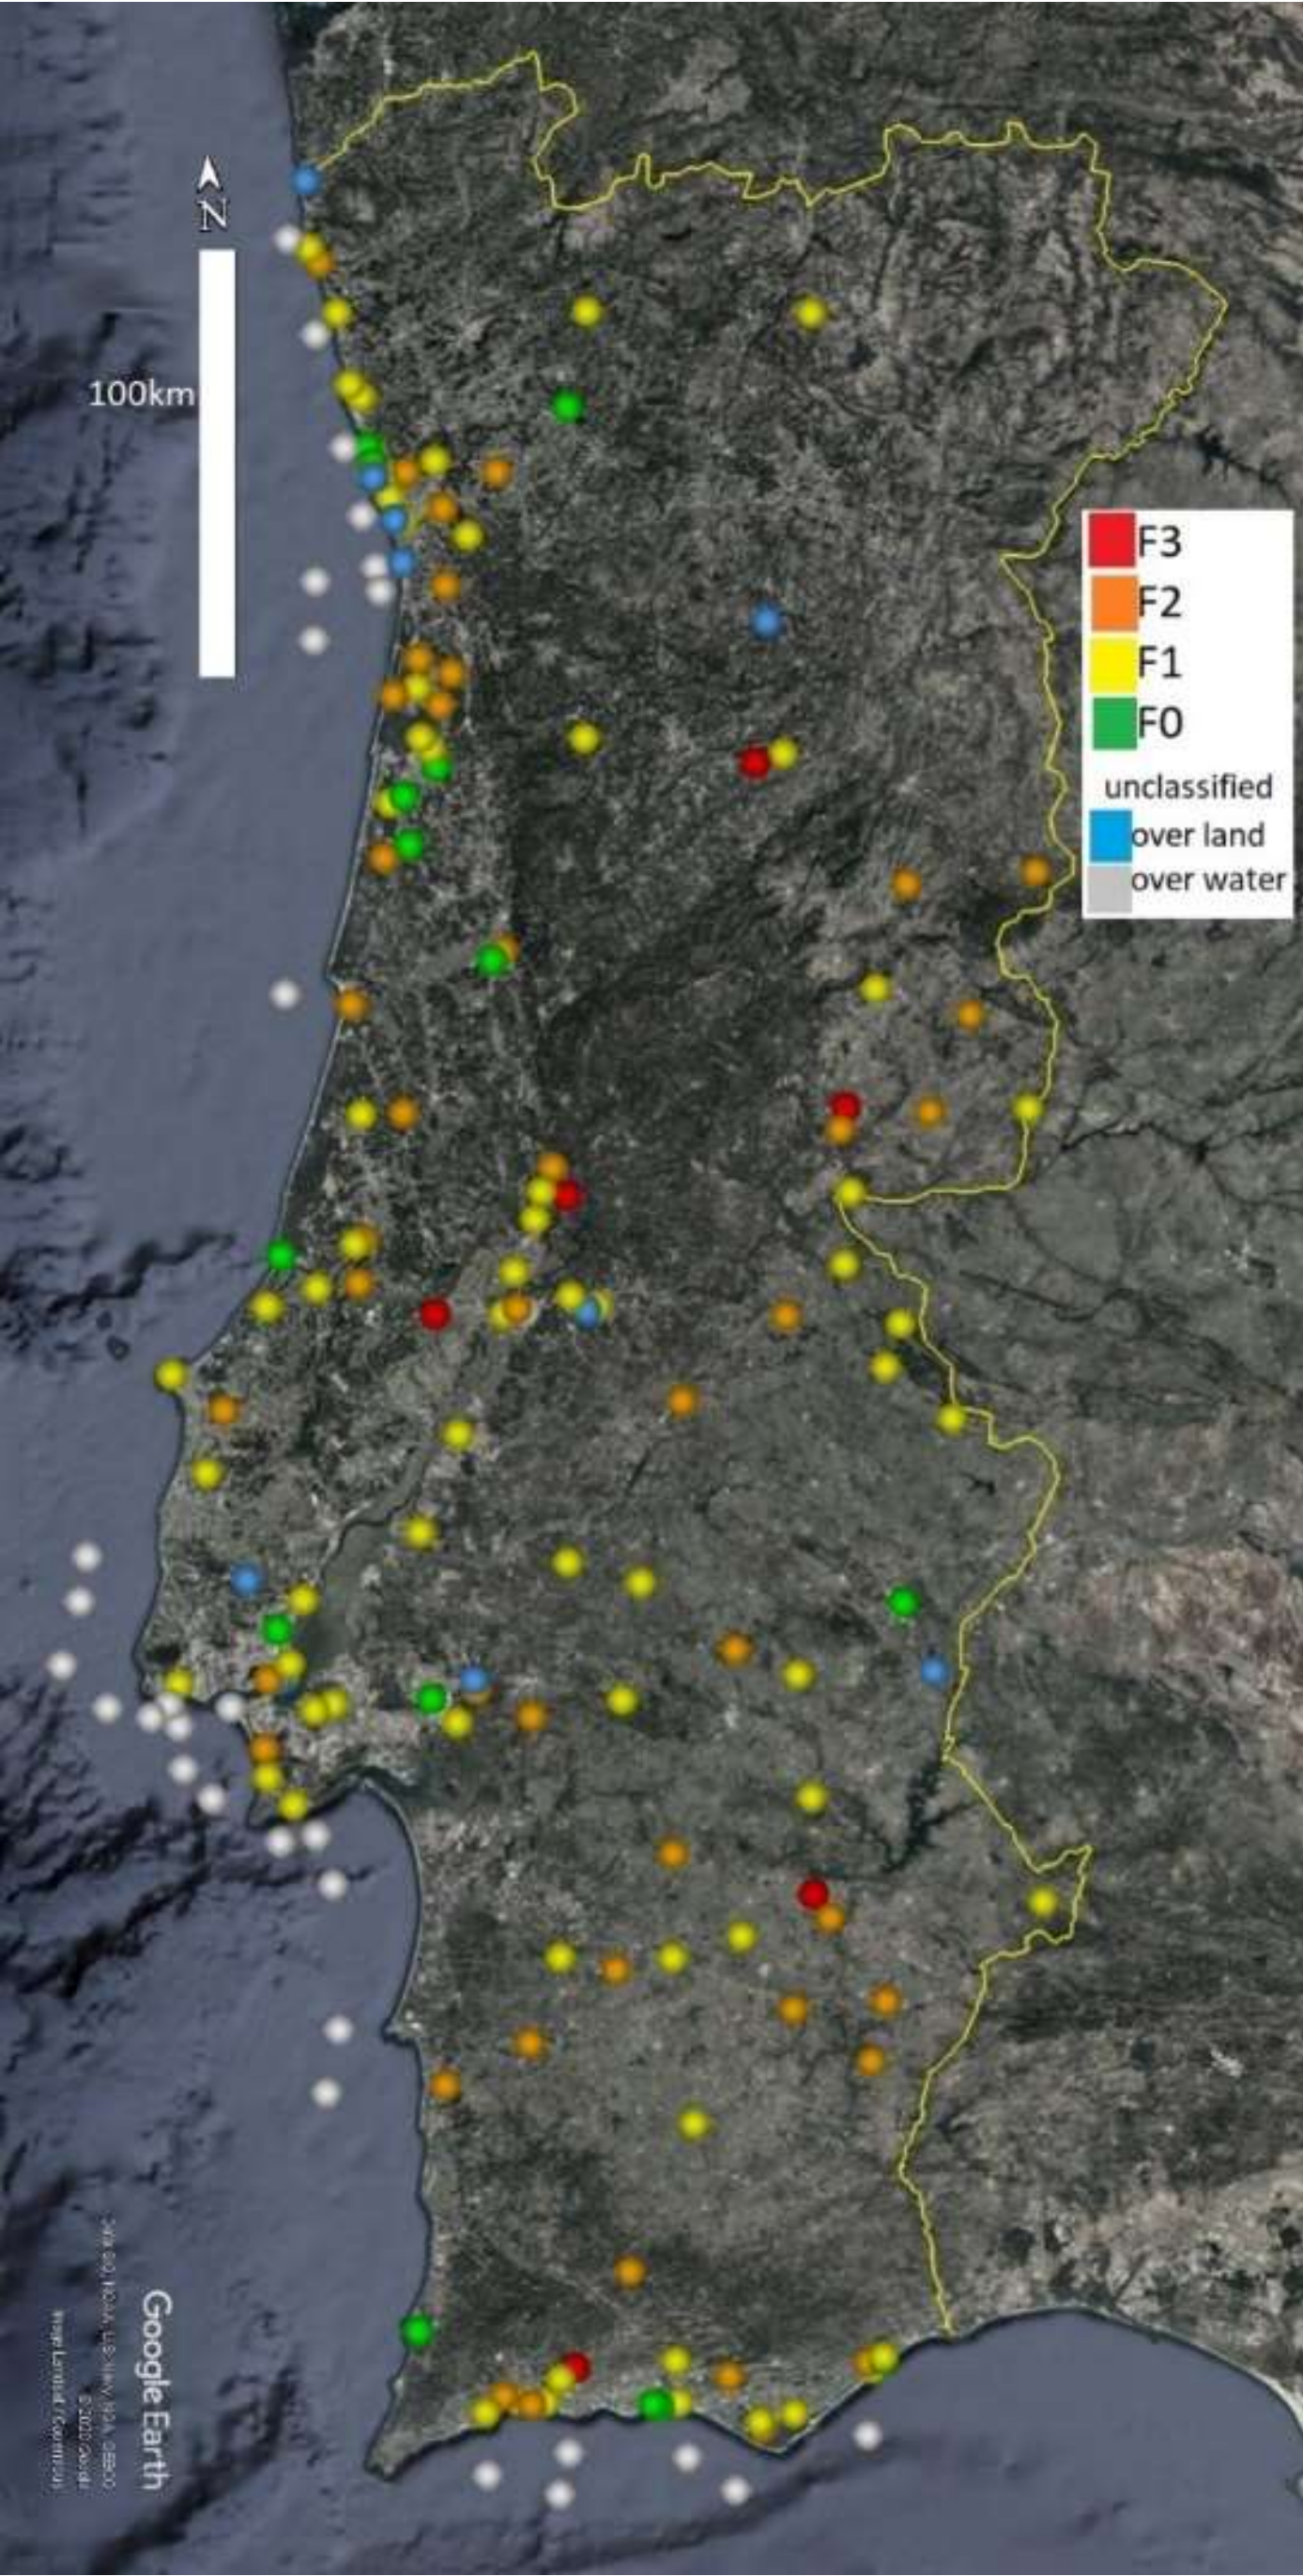
The geographical distribution of 182 tornado events in mainland Portugal and over the sea near the coast until 1 January 2020 is shown in Figure 1. The tornado frequency was higher near the coast (more than 25% formed over the sea), with 24 tornadoes occurring over the sea along the west coast, and 6 over the sea along the south coast. From the 154 tornadoes observed over mainland, there was documented evidence that 21 of them formed over the sea and made landfall afterwards. From the northeastern mountainous region of Portugal, there were very few reports. There were 2 tornadoes over Tagus River: one was over water with no damage reported; the other formed over water and moved inland, affecting Lisbon, with F1 damage along a 4 km path in town, on 14 April 2010.
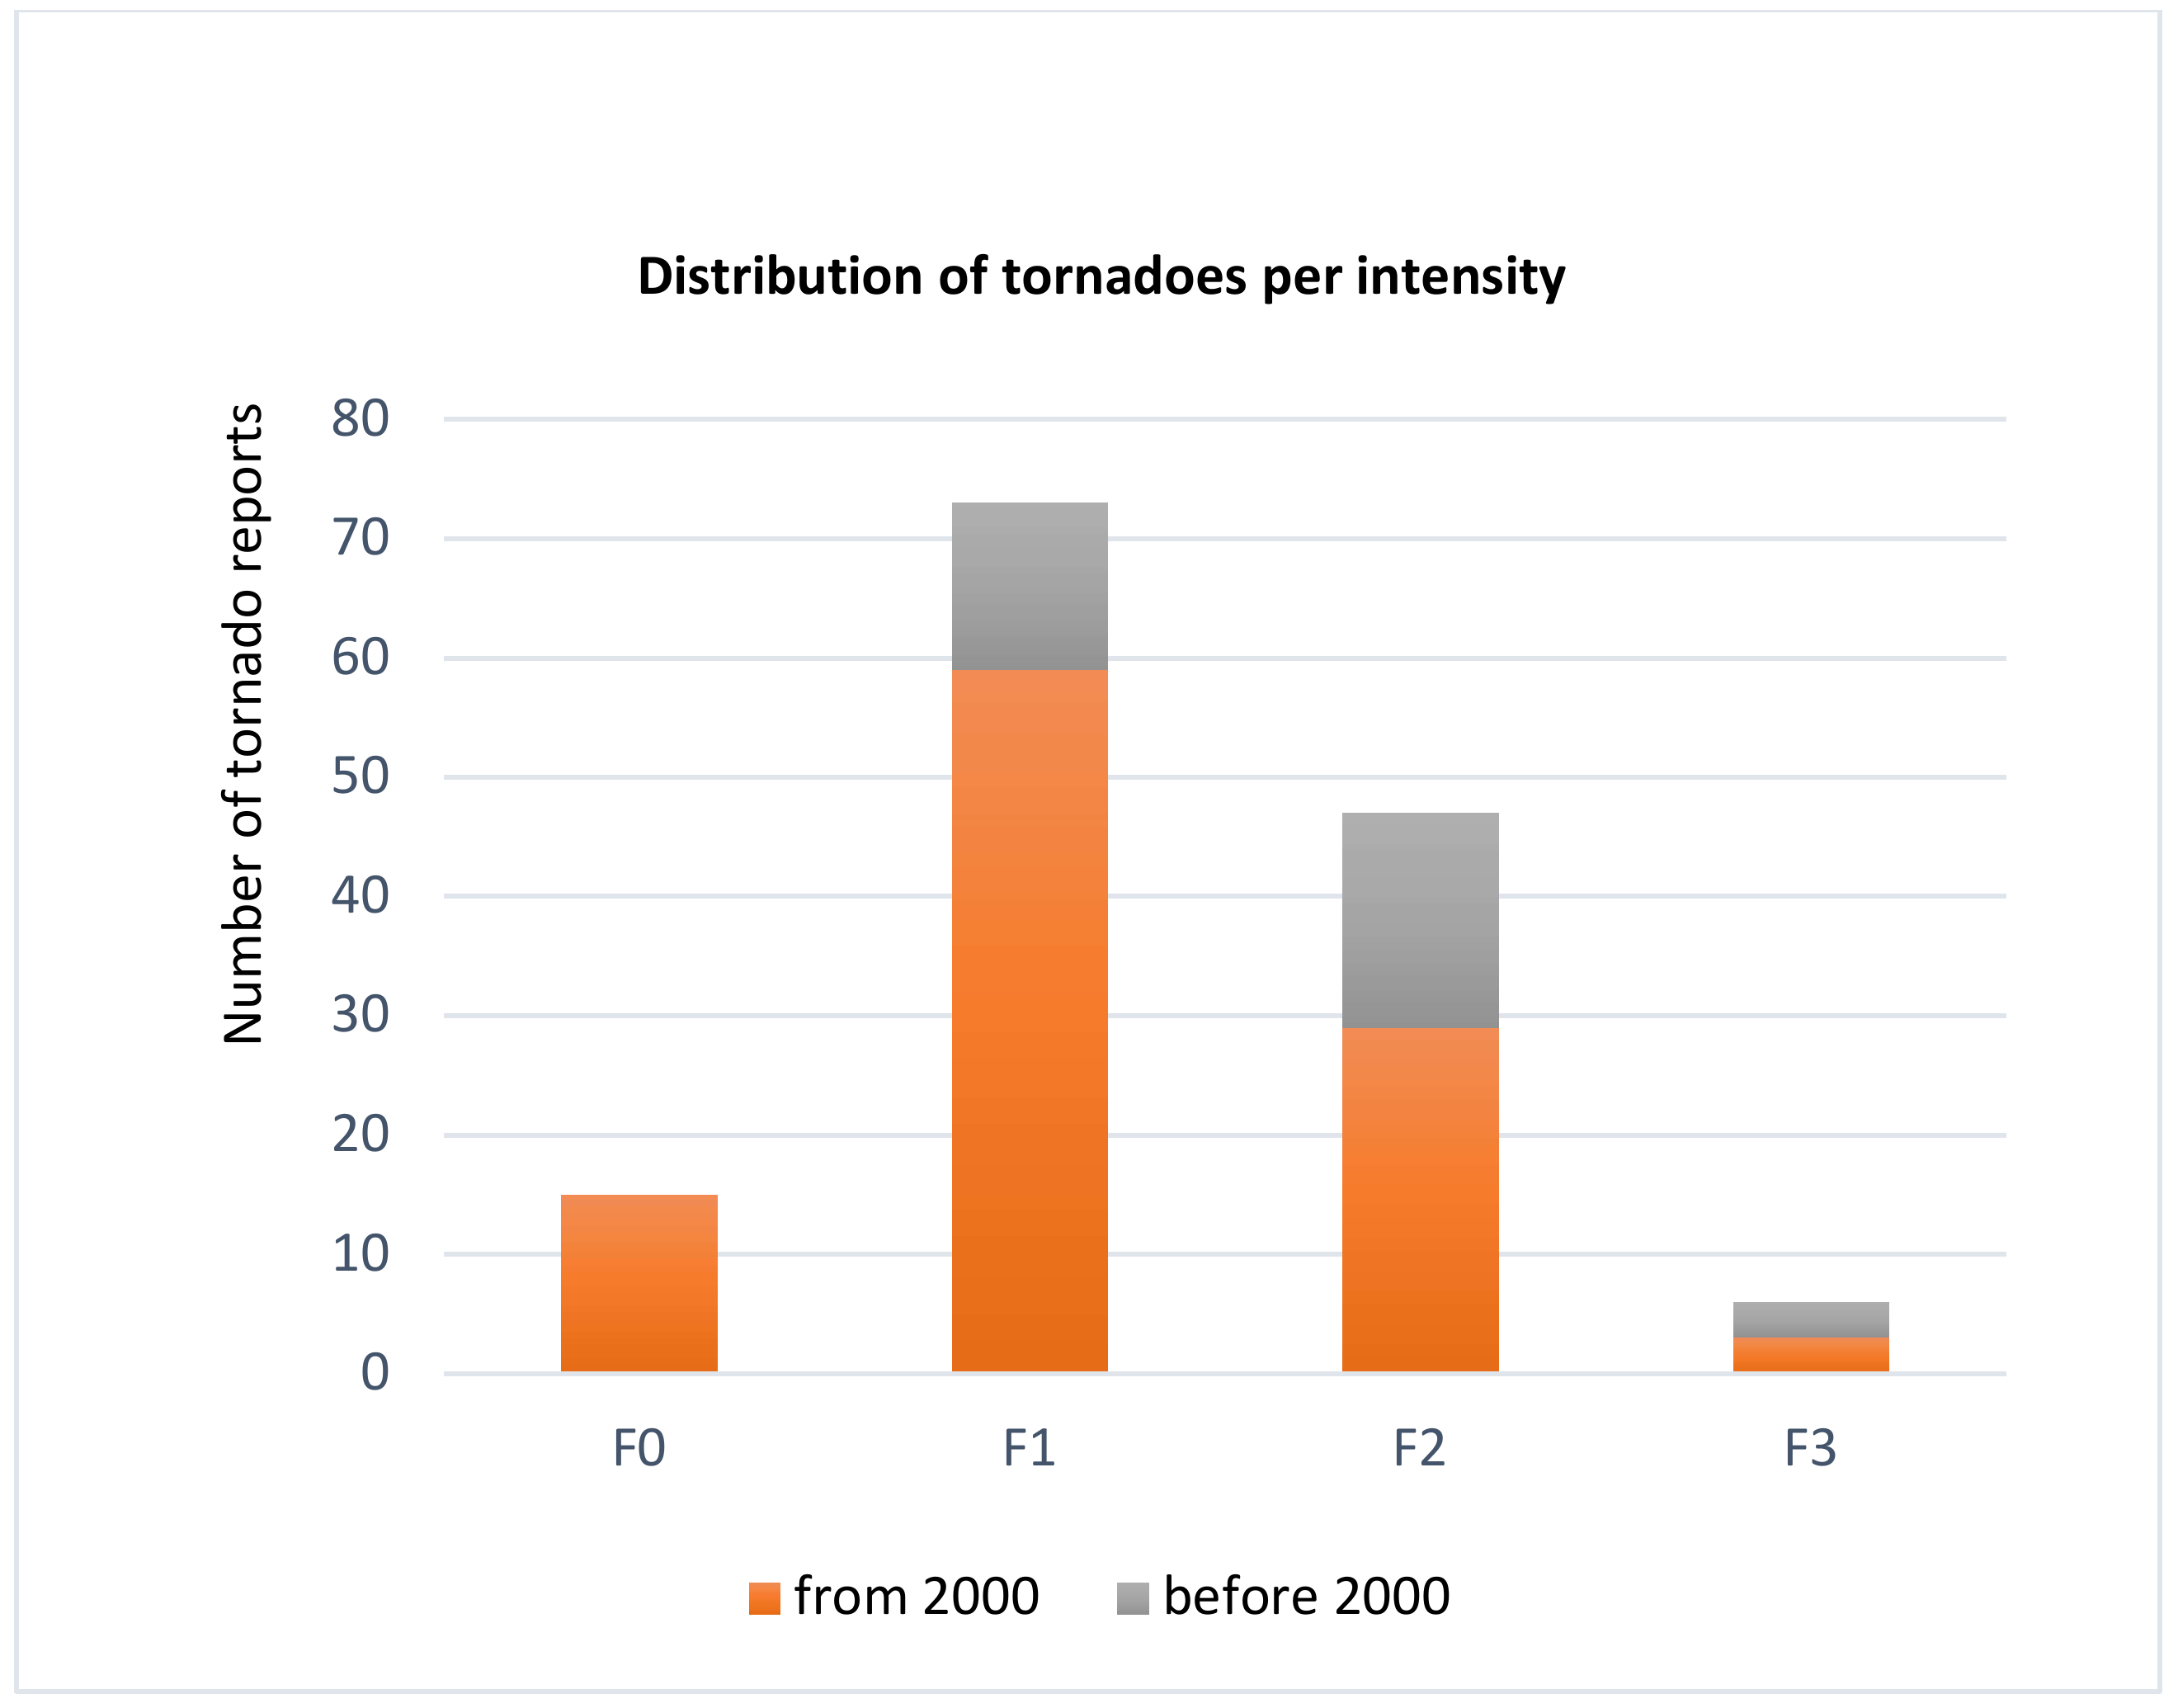
Relevant effects were documented in detail, even for some events that happened a long time ago. Reported damage allowed the intensity estimate for 141 events, as shown in Figure 2, with most tornadoes classified as F1 and F2 intensity using Fujita scale. The impact that strong tornadoes have on society is more likely to be remembered and referred. That is why half of the strongest tornadoes (classified as F3) were reported before the year 2000. Although these phenomena are so impressive that even the damage caused by weak events was described in detail on newspapers, F0 and F1 tornadoes affecting very small areas may probably remain under-reported.
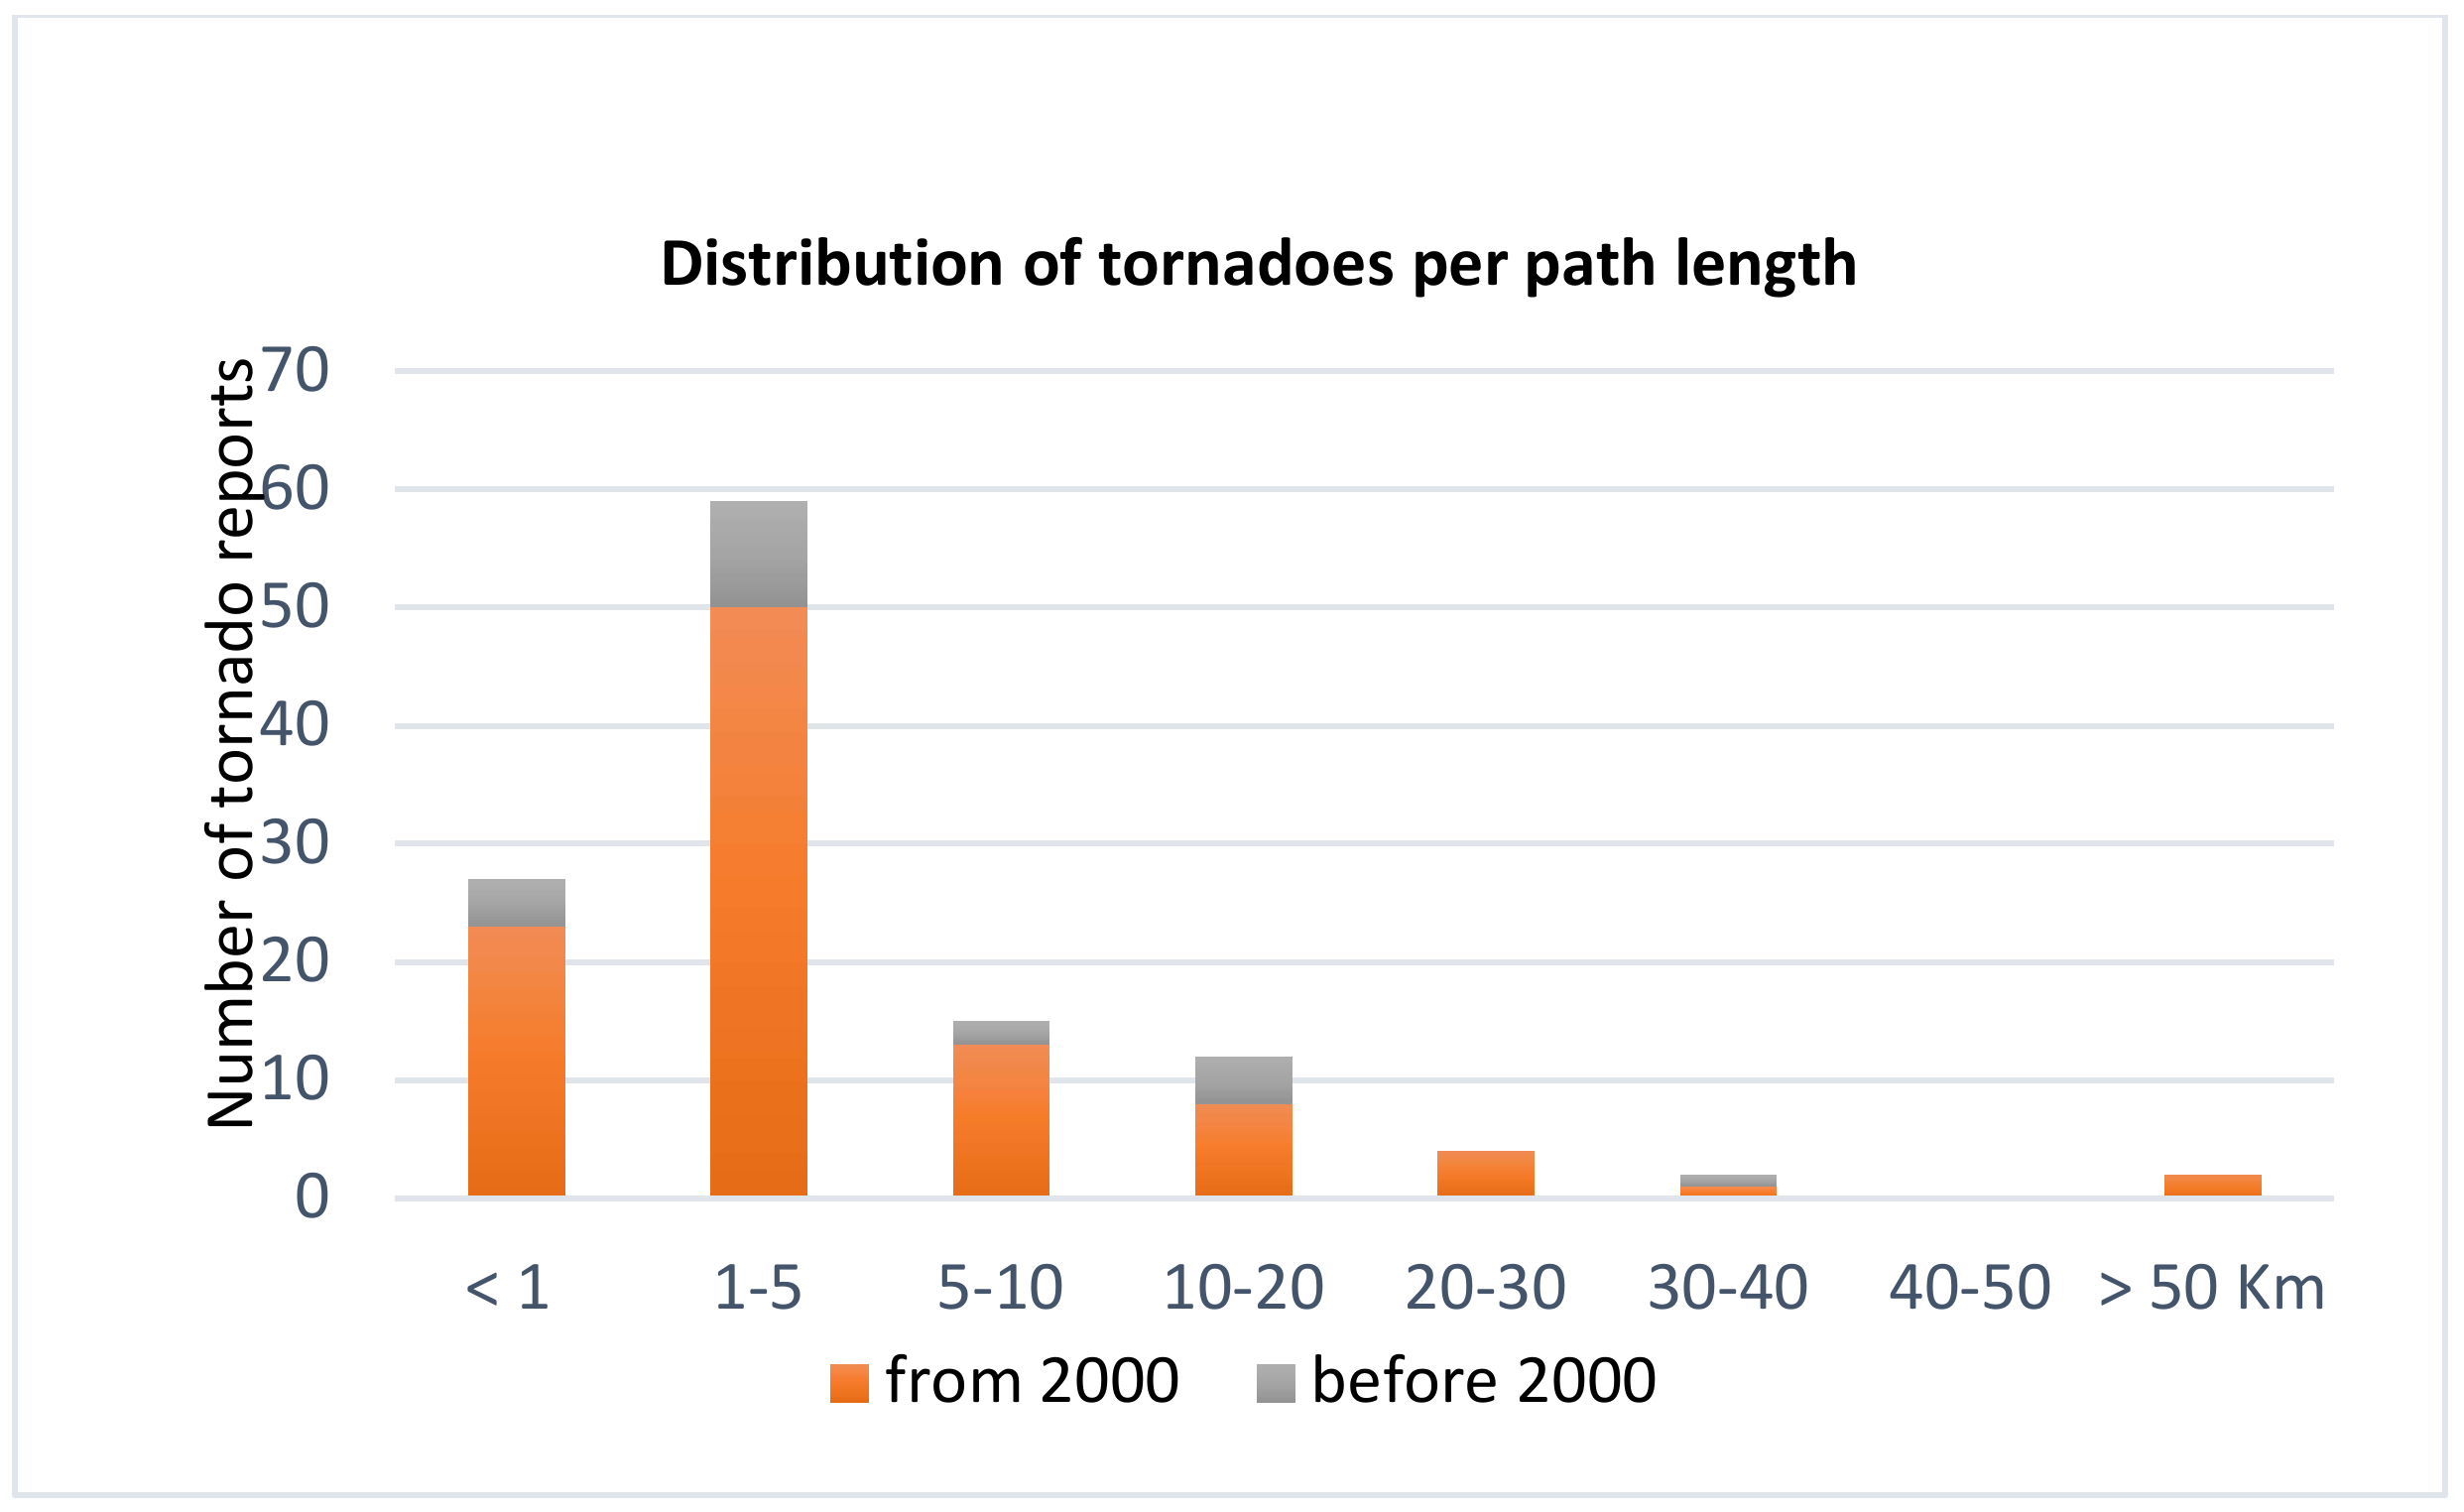
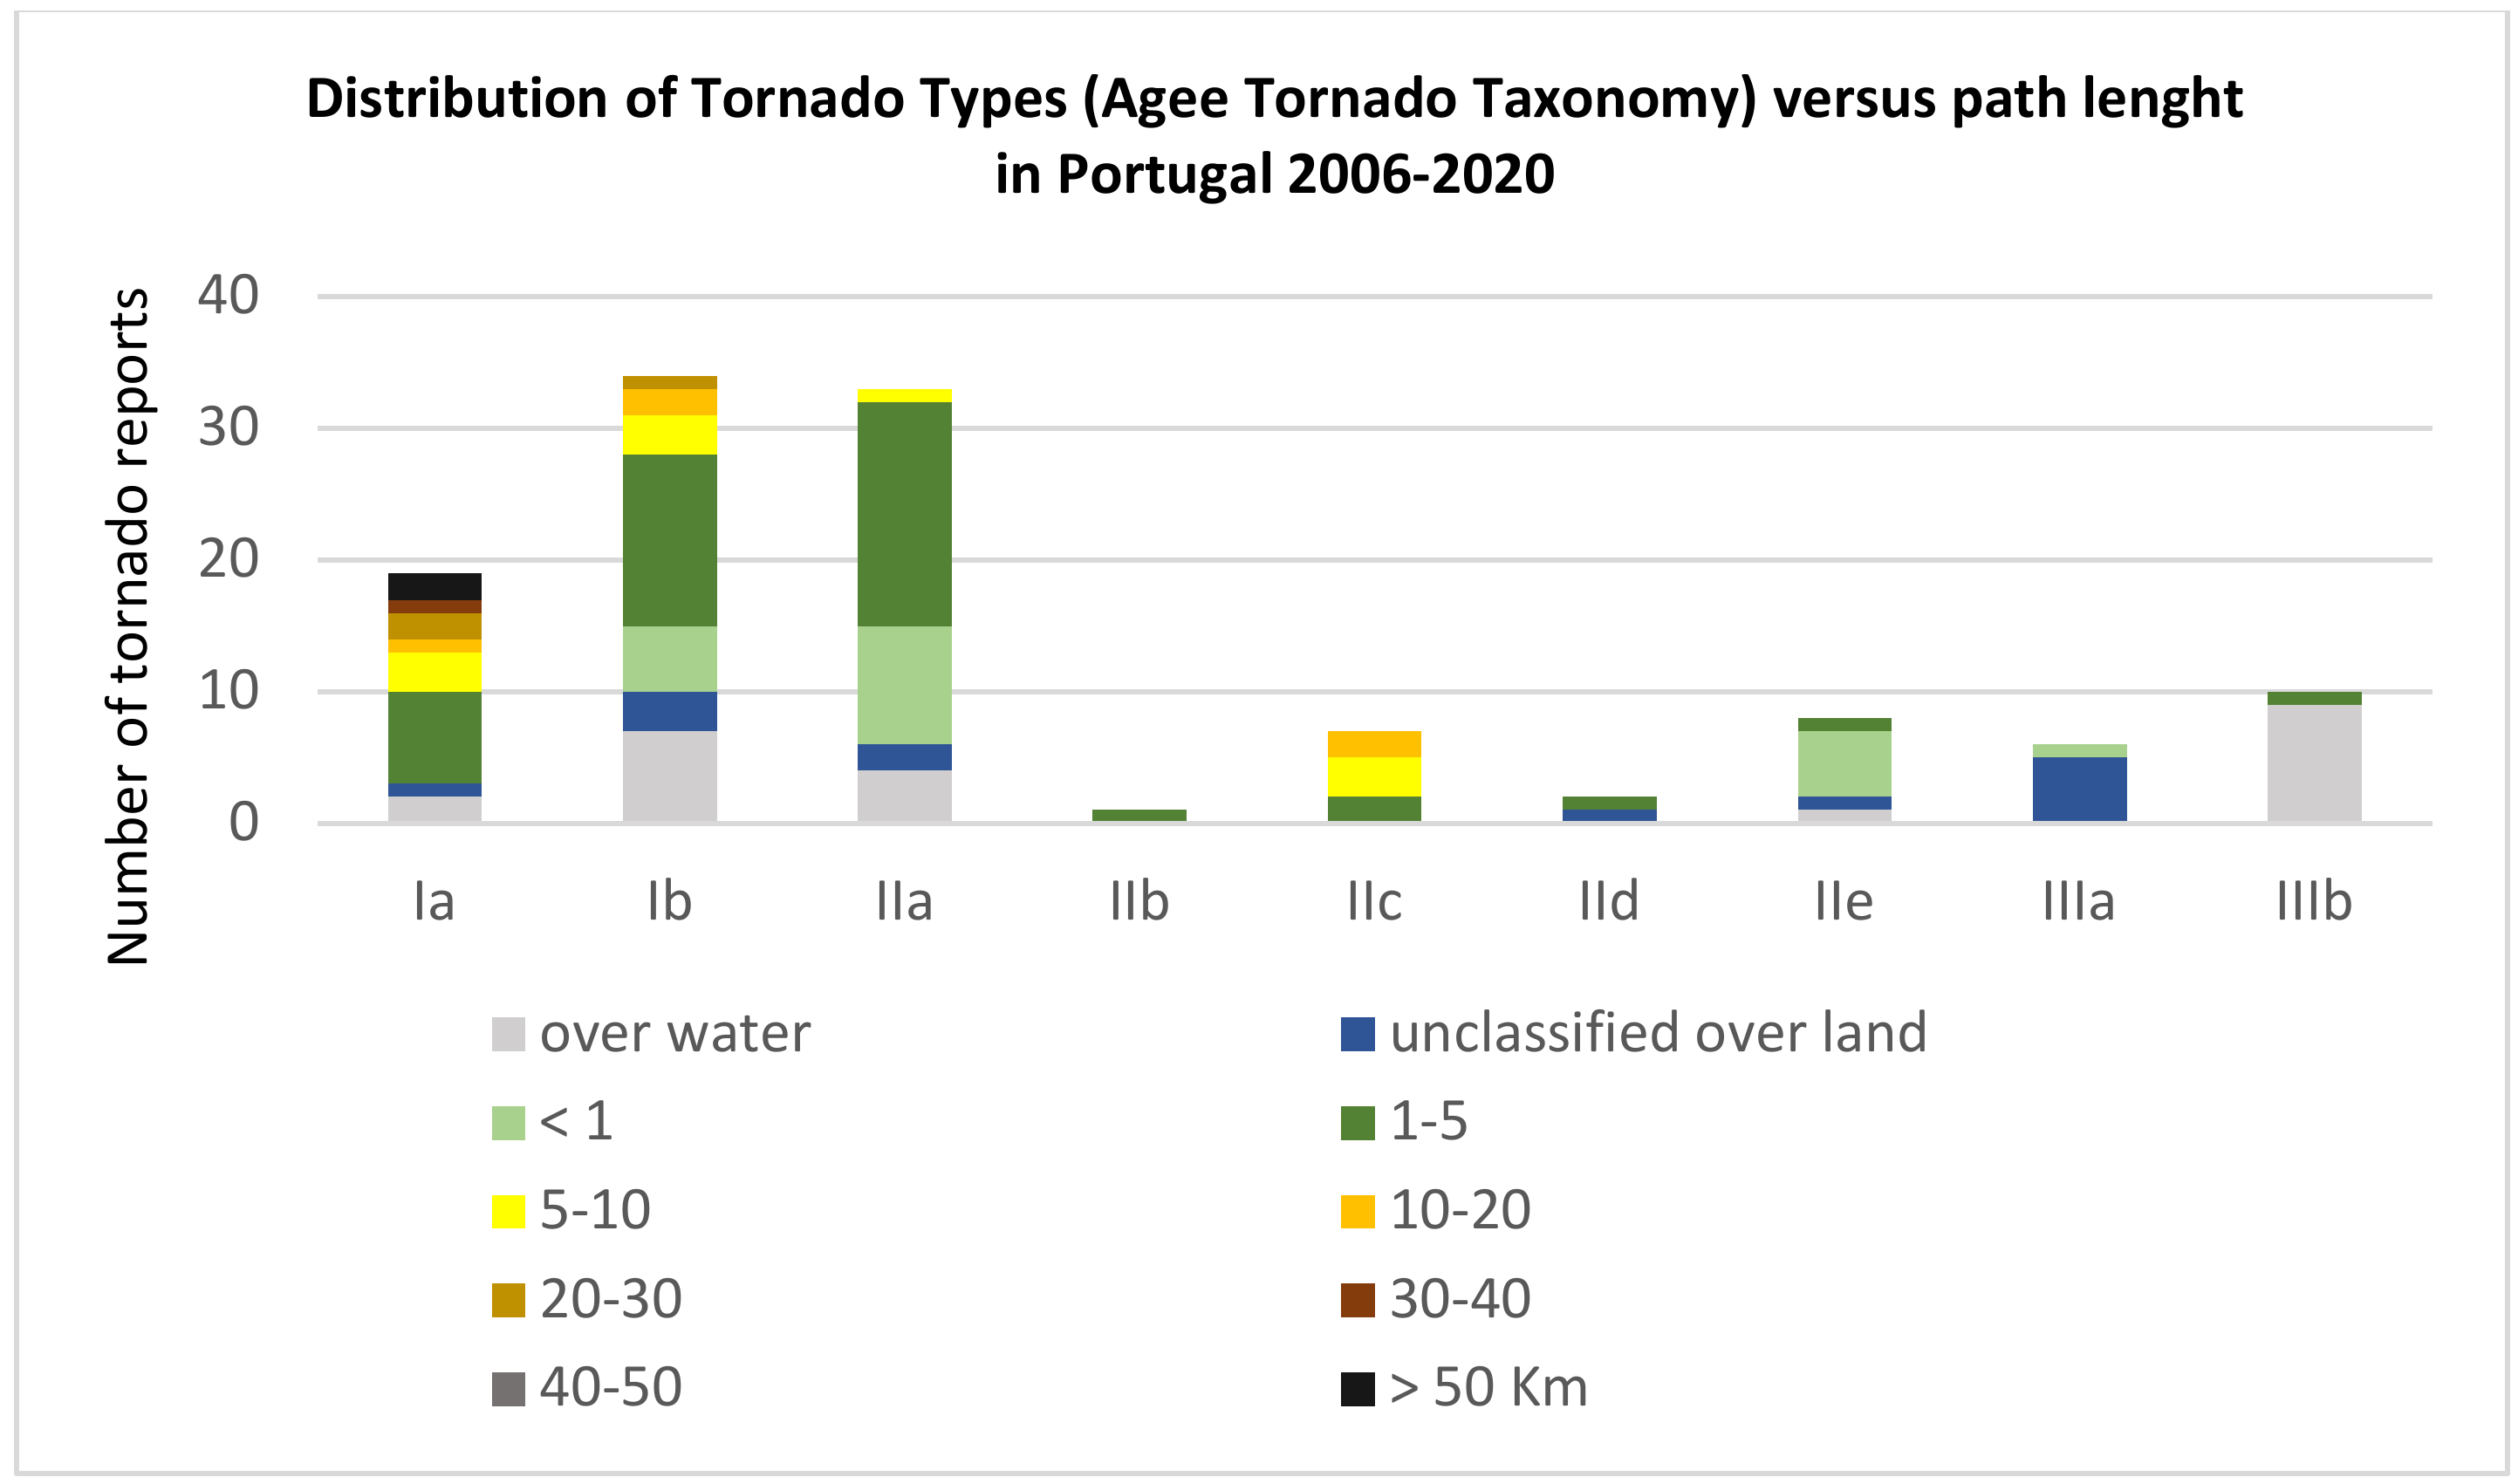
Collected data allowed an estimate of the path of 121 tornadoes. Some reports provided accurate information of where the tornado was formed and where it dissipated, but often, over some sections of the path, it could not be accurately tracked because there was not any ground damage. For this reason, and because it was hard to collect enough data, the total lengths were usually underestimated. Interpreting the effects on the ground in order to track the trajectory described by each tornado was even more complex in the case of multi-vortex tornadoes, since their trajectories did not follow a straight line. There were also reported cases where the tornado temporarily lost contact with the ground. Path characteristics were not evaluated for events over water and the total length was underestimated when the tornado formed over the sea and later made landfall, or crossed grassland or coastal marshland. Path length ranged from a few hundred meters to more than 50 km, with two thirds of the tornadoes presenting a trajectory up to 5 km, as shown in Figure 3. Paths were longer than 50 km for two well documented F3 events. Radar observation allowed the follow up of a convective cell for a more than 80 km path from W to E, on 4 March 2018, producing 2 tornadoes in southern Portugal and one other in Spain. These were classified F1 intensity after the report of effects on the ground.
It is uncommon to gather data enough to estimate path width, but it is possible to state that it did not exceed a few hundred meters during the most intense events. Path direction usually followed the synoptic flow, thus most of the events were moving from the south or from the west.
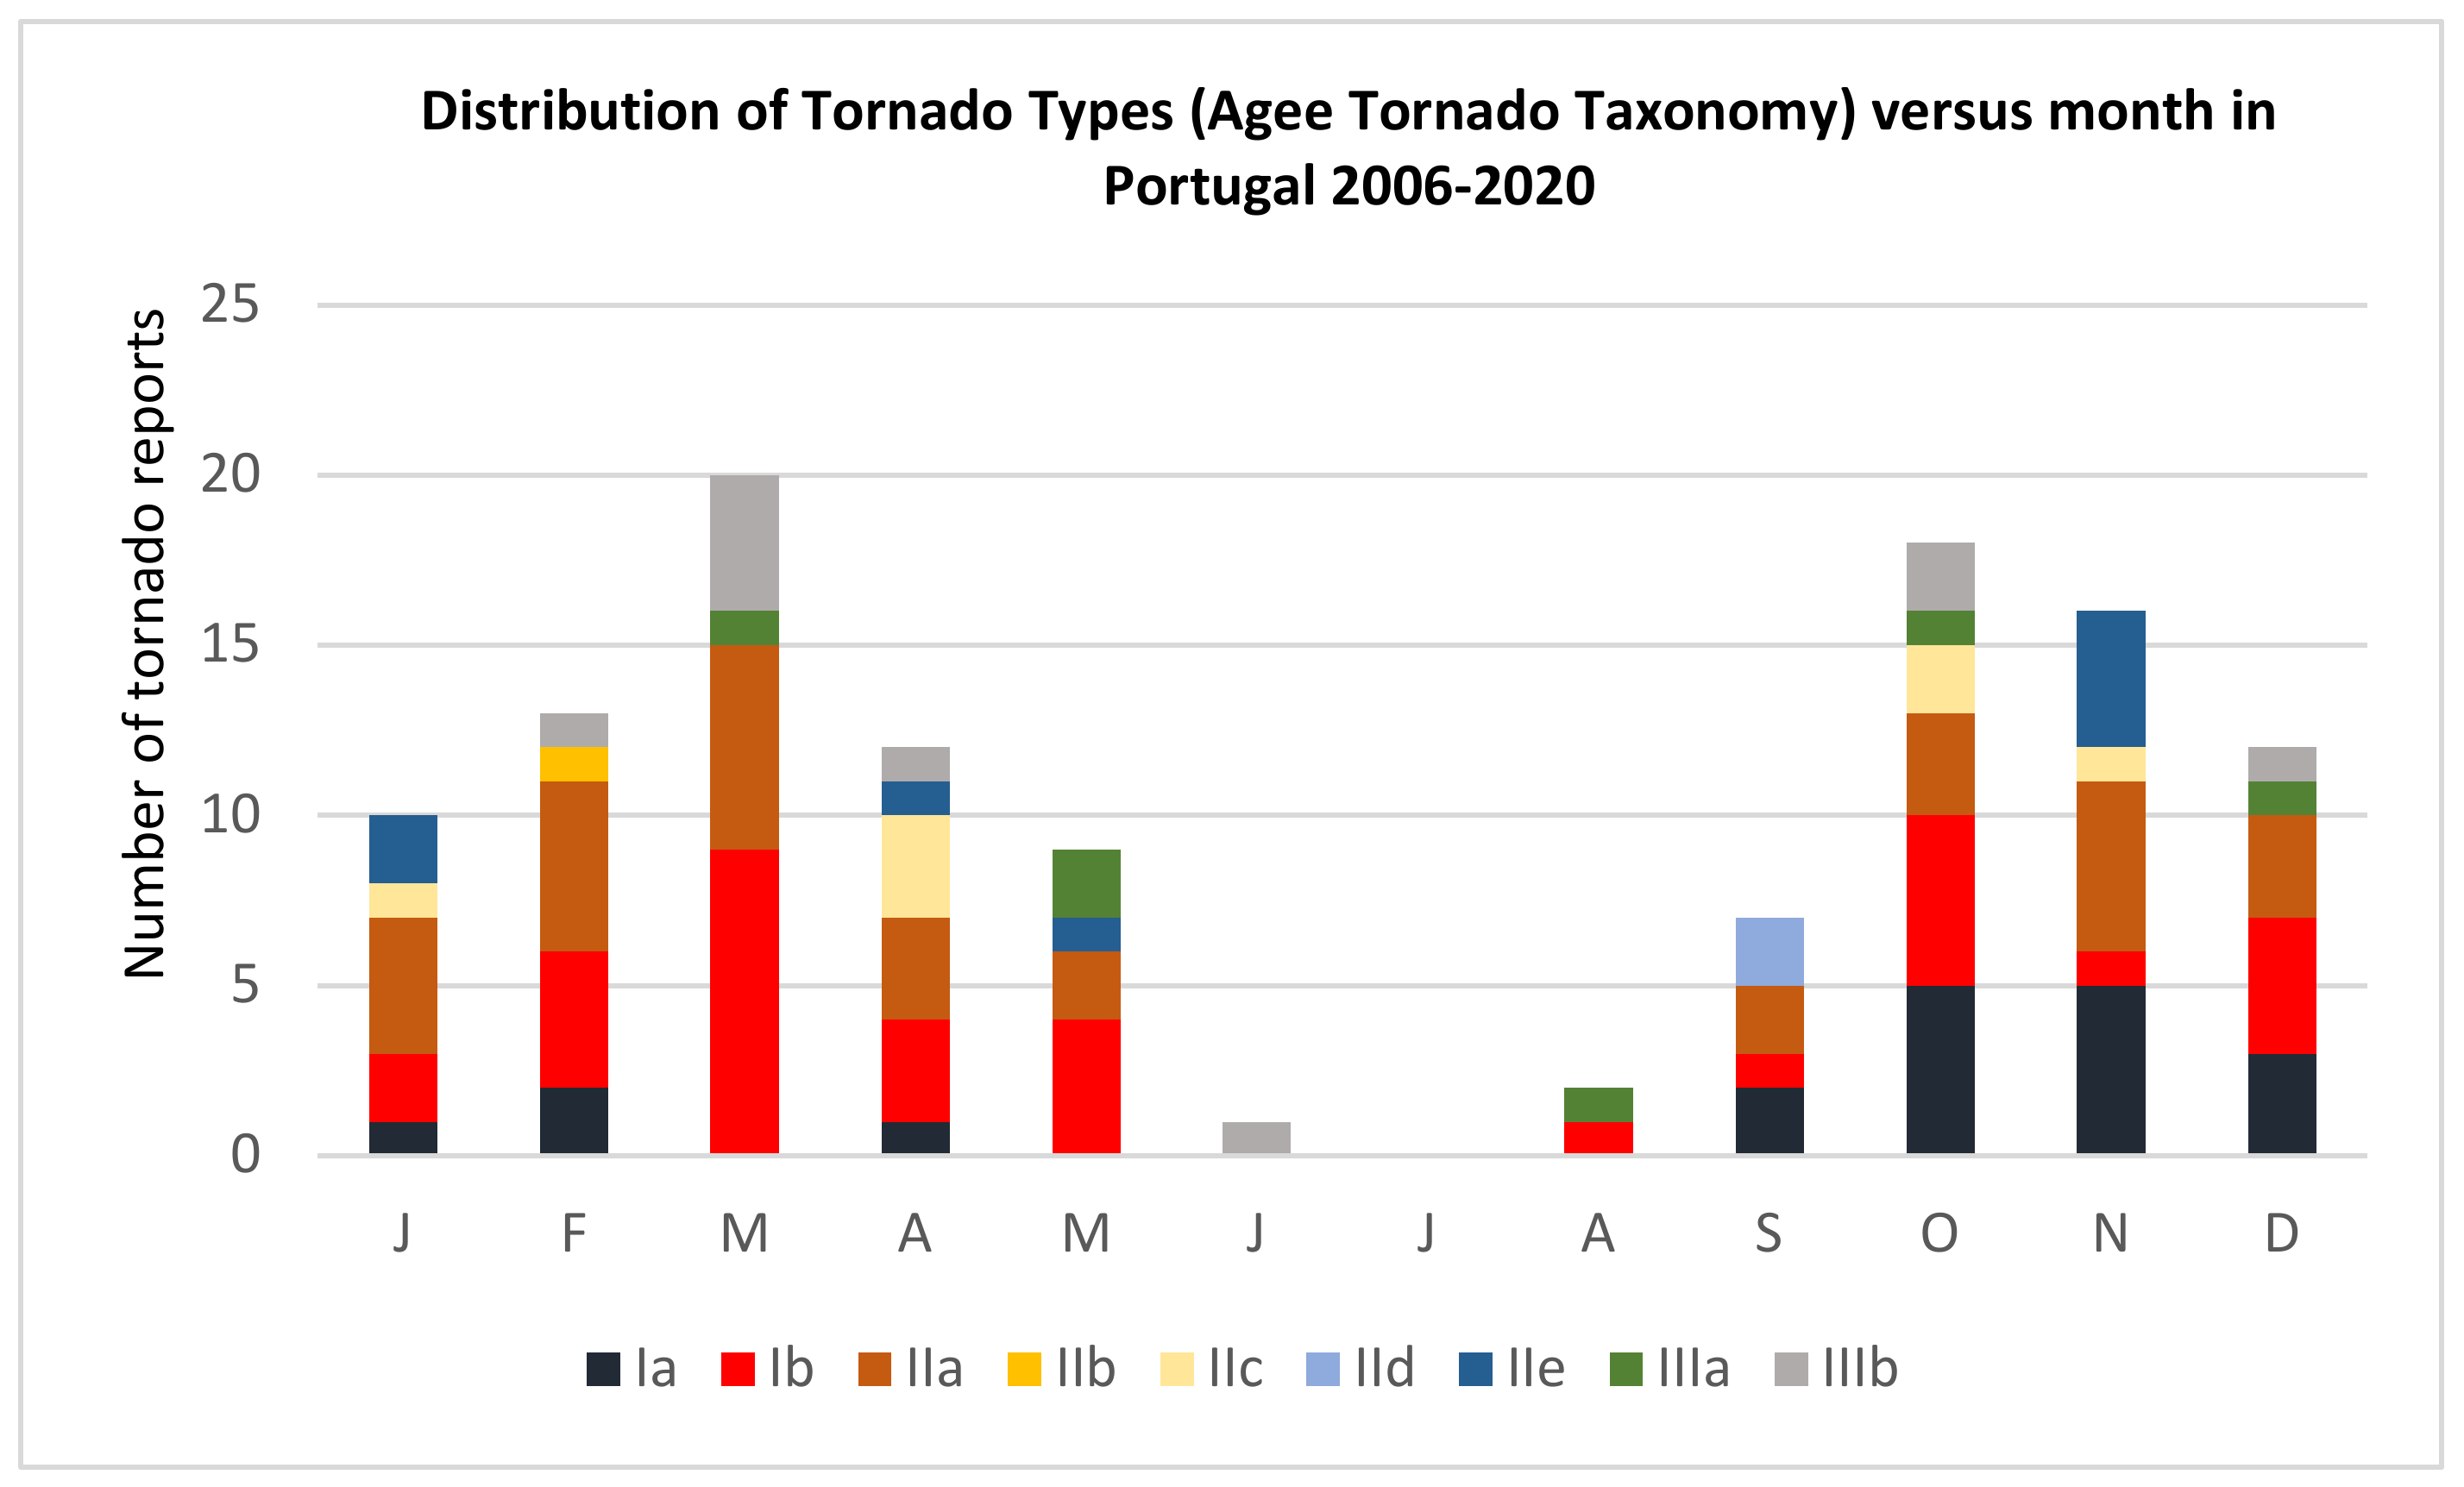
Distribution of tornadoes per month, considering 179 reports, can be seen in Figure 4. Summer events are unusual, with only 10 events being reported for June, July, and August. The larger number of tornadoes in December before the year 2000 is associated to the 4 reported events on 13 December 1864.
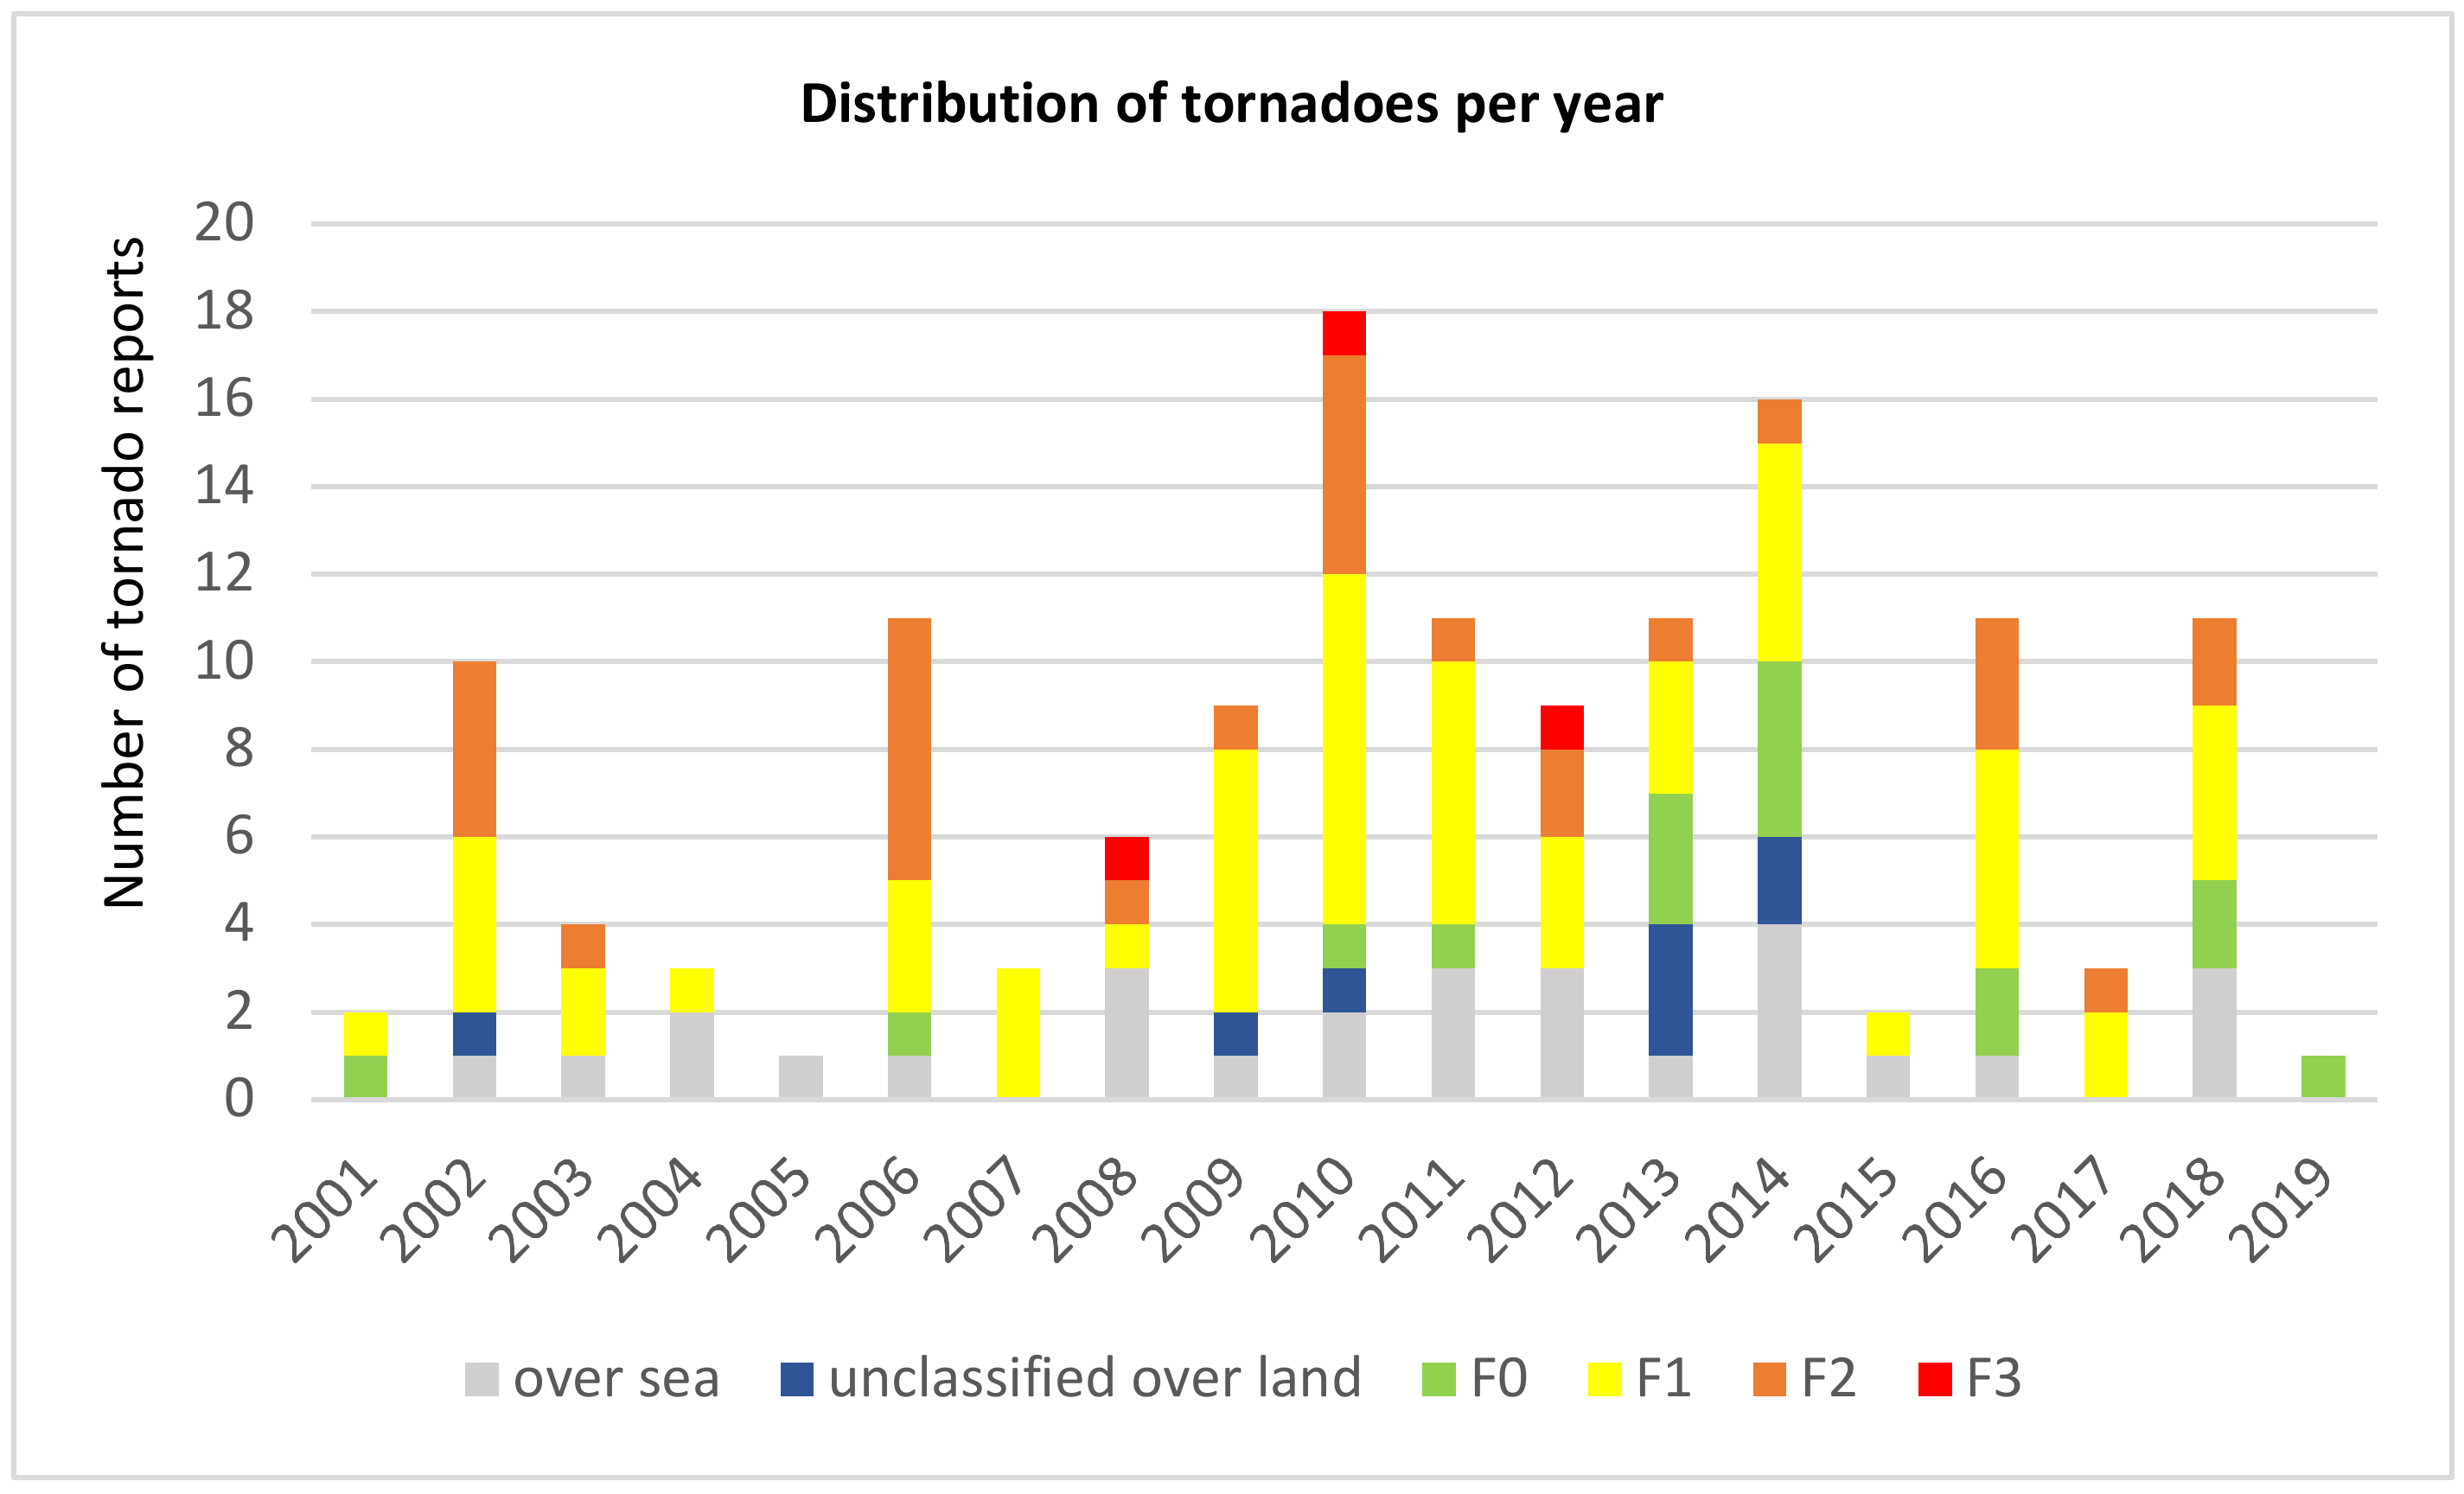
Considering only the 142 reported events after the year 2000 for a more consistent analysis, the months with a greater number of events were March, October, and November (with almost half or the total events, i.e., with 22 reports for each month), although the most intense tornadoes occurred during April, November, and December. This result suggests more suitable atmospheric environments for tornado to occur from autumn to early spring. Given the climate characteristics of the region, the inter-annual variability is high, with the number of reports per year varying from 1 (in 2005 and 2019) to 18 (in 2010), as shown in Figure 5. On average, 6 tornadoes per year with effects over land were registered during the considered 19-year period. The under-reporting of weak events may have contributed to this result, especially over the earlier years of the dataset. In recent years, with the increasing use of portable video cameras, better understanding of the phenomena and an increased awareness of the public and weather services, under-reporting has decreased. Nevertheless, some events were still of difficult interpretation and may have been excluded when tornado damage happened during a heavy rain and strong wind event.
No pattern was found for the distribution of tornadoes along the day. The study of the synoptic regime for each event (see Section 4 below), showed that the contribution of large-scale forcing is more significant than the diurnal forcing, justifying tornado occurrence at any time of the day/night.
In most cases, available data were not enough to assess the duration of the tornado, but some tornadoes over the sea were observed, or even filmed, from the beginning to the dissipation stage, usually lasting for about 5 min. On some occasions, the duration of the tornado was estimated with the help from successive radar observations of the parent convective storm, from the beginning to the end of the path of known effects. It was often observed that the parent storm was already formed some time before the effects on the ground were felt. The longest-lived event lasted for 45 min, causing F3 damage for a 54 km path, on December 2010 [16].
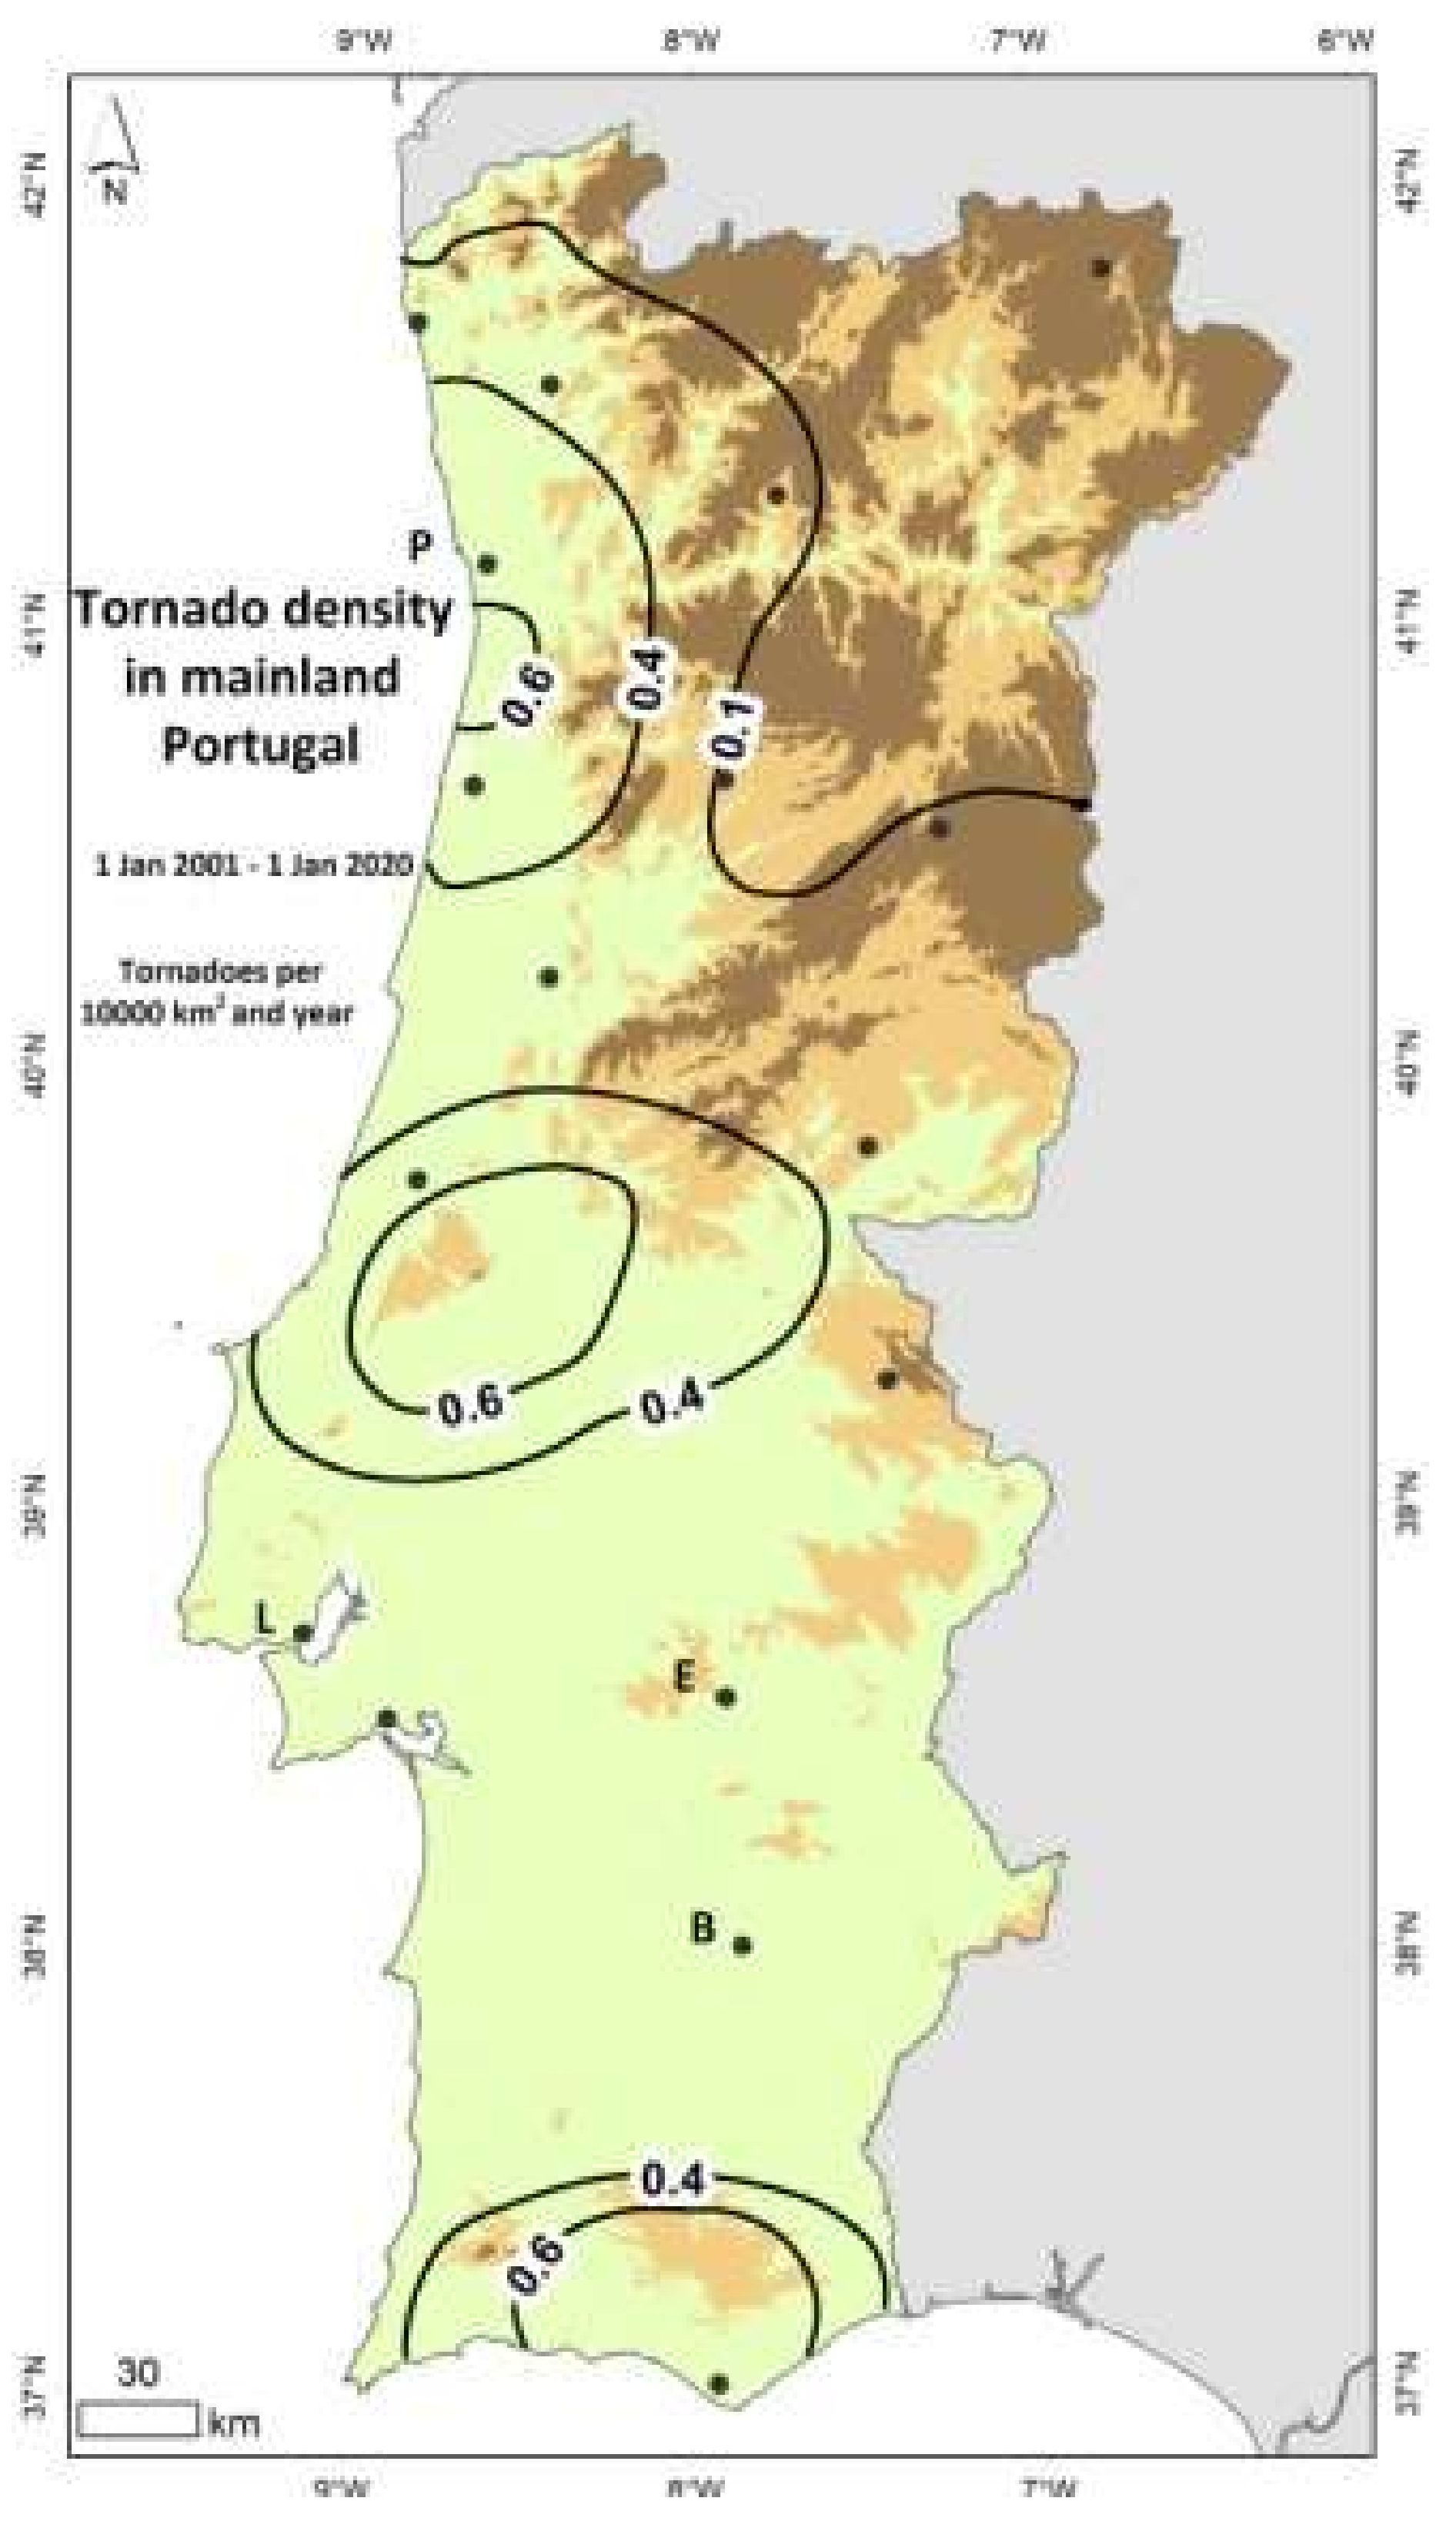
Tornado density was computed for each point by dividing the number of events within a 50 km radius, by the corresponding surface area. Figure 6 shows the spatial distribution of events per 10,000 km2 and per year, estimated considering 114 reports of tornado over land (an area of 89,015 km2), for the period between 1 January 2006 and 1 January 2020. The map revealed that there are more than 0.6 tornadoes per 10,000 km2 and per year in the areas with higher tornado activity. The region in the center of the map is known as the Portuguese “tornado alley”, and corresponds to the southern part of a mountain range that extends north of Lisbon, to the northeast. Observations suggest that this mountain range may play a role in the activation of tornadic storms. A smaller region, at the northern part of the west coastal area, around Porto (second largest urban area in Portugal) also received more than 0.6 tornadoes per 10,000 km2 and per year. The southern coastal area, also densely populated, ranked second in the national tornado average. The northeast mountainous area of the country, revealing less than 0.1 tornadoes per 10,000 km2 and per year, showed the lowest tornado activity. Underreporting seems likely in the southern region of Alentejo (main towns Évora and Beja), given its lowest population density, and because the landscape is characterized by large grassland areas with scattered trees, where tornado damages are hard to trace.

3.3. Impact of Tornadoes in Mainland Portugal

The tornadoes that occurred in Portugal had an impact on the territory, the population, and the local economy. However, most of the damage affected families and private companies, so an estimate of the total losses is hard to assess. The most frequent damages were on roofs, chimneys, trees, and electricity and telecommunications poles. The cover plates of industrial buildings, with a large surface exposed to the wind, were often lifted, and sometimes completely removed. Cars were often damaged, due to the falling of trees, or because they are hit by projected debris, or even because they are sometimes dragged and turned upside-down.
Some events have resulted in extremely high losses. Many business facilities and dozens of industrial pavilions were affected, some were totally destroyed. Severe damage to the forest, to farms, including the loss of animals and the destruction of warehouses and greenhouses was reported. A solar energy production facility was completely destroyed. Profound damage to housing has occurred, forcing many families to relocate, as was the case on 18 October 2006 when a tornado affected about 200 homes at Vila Nova da Barquinha.
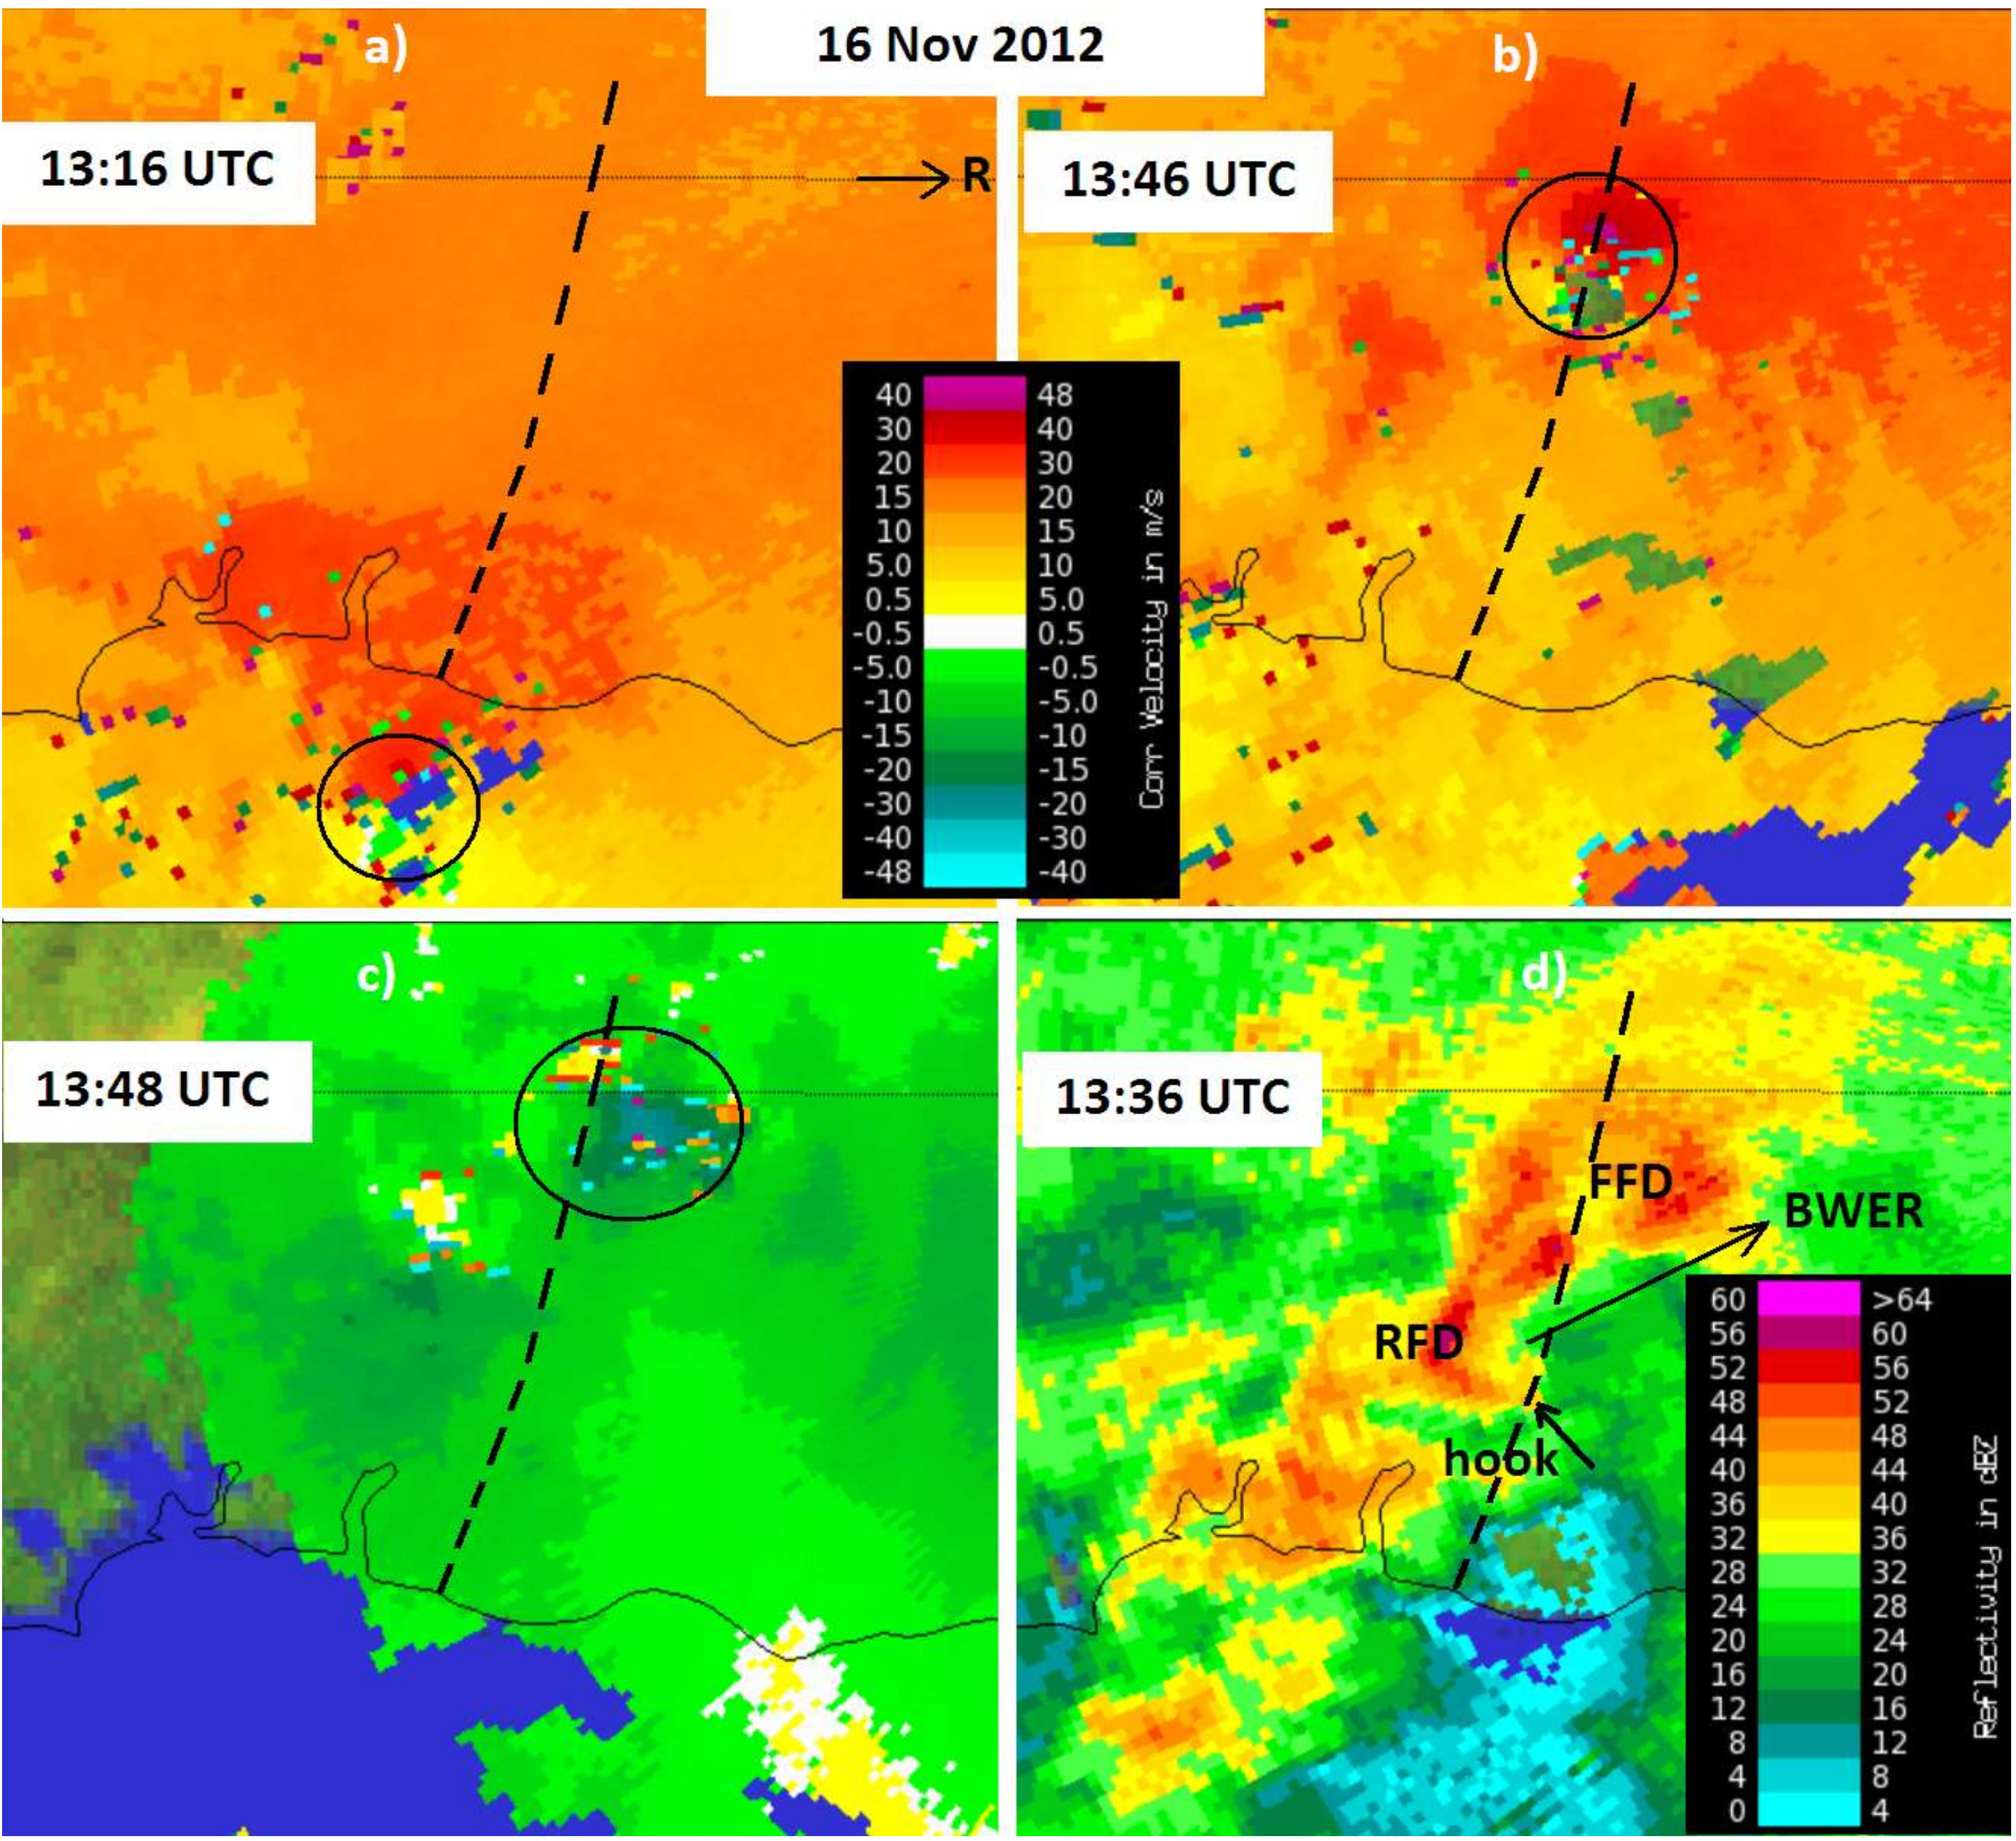
Usually, tornadoes do not cause victims, but sometimes people are hit by airborne debris or dragged by the tornado, and there is one record of a heart attack. A total of 344 people were injured as result of 28 events. Several casualties were reported for the events of 13 December 1864. On 6 November 1954, the Castelo Branco tornado caused 5 deaths, and one more person died due to the Portalegre tornado on 10 September 1985, and one more after a mobile-home was overturned, during the Silves tornado on 16 November 2012.
Long-term damage is rarely reported. One example was the case of a company with 29 workers gone bankrupt one year after being hit by an F2 tornado on 7 December 2010. On the same day, an F3 tornado hit a kindergarten class, causing emotional trauma to the children, which justified a mental health intervention during the following year. Feelings of sadness and hopelessness were also reported for several years after tornado damage.

3.4. Tornadoes at Azores and Madeira Islands

Tornadoes over the ocean are known since the 16th century. Collecting reports for Madeira and Azores islands in the Atlantic Ocean begun after the year 2000.
For Madeira Island, located at 33°N 17°W, with a total area of 800 km2, there is footage of 5 tornadoes over the sea near the coast, reported on 30 October 2006 (this one near Funchal harbor), \ 21 November 2008, 29 April 2011, 26 October 2016, and 25 October 2018. Footage of this last event shows the tornado lasted for more than 5 min over the sea. There are no reports of tornado damage in land, perhaps because this is a very small mountainous island and all the coast is a cliff.
For the Azores, a group of 9 small and mountainous islands, at a region around 38°N 28°W, with a total area of 2346 km2, there is footage of 4 tornadoes over the sea near the coast, observed during a period from 2 to 5 min on 18 December 2006, 27 September 2011, 6 August 2012, and 17 April 2016. A tornado in S. Miguel Island on 26 September 2011 was confirmed by several eyewitnesses and a photo. The local survey conducted by the weather service confirmed it was formed in a flat area, causing F1 damage on 20 houses (2 families became homeless) and trees, along an S to N 0.7 km damage path. On 23 January 2016, a tornado caused F1 intensity damage on houses and vegetation along a 3.7 km path from SW to NE, on Santa Maria Island, according to the local survey [51]. The grassland near the sea did not show visible effects to confirm if this tornado was formed over the sea and later made landfall.

4. Tornado Taxonomy, Synoptic Regimes, and Atmospheric Environments (1 January 2006–1 January 2020)

For the period between 1 January 2006 and 1 January 2020, a total of 120 events were classified after the proposed classification methodology (described in Section 2.2), resulting in the identification of cases belonging to 9 out of the 13 proposed TT [15], namely Type Ia (discrete supercell; 19 events), Type Ib (discrete low-top minisupercell; 34 events), Type IIa (LEWPs; 33 events), Type IIb (bow echo; 1 event), Type IIc (bookend vortex; 7 events), Type IId (inflow jets along QLCS; 2 events), Type IIe (mesovortices not associated with LEWPs, bows, or inflow jets; 8 events), Type IIIa (landspouts; 6 events), and Type IIIb (waterspouts; 10 events). Each of the identified TTs occurred during the onset of typical synoptic regimes over Portugal, hereby synthetically described using the datasets described in Section 2.3.
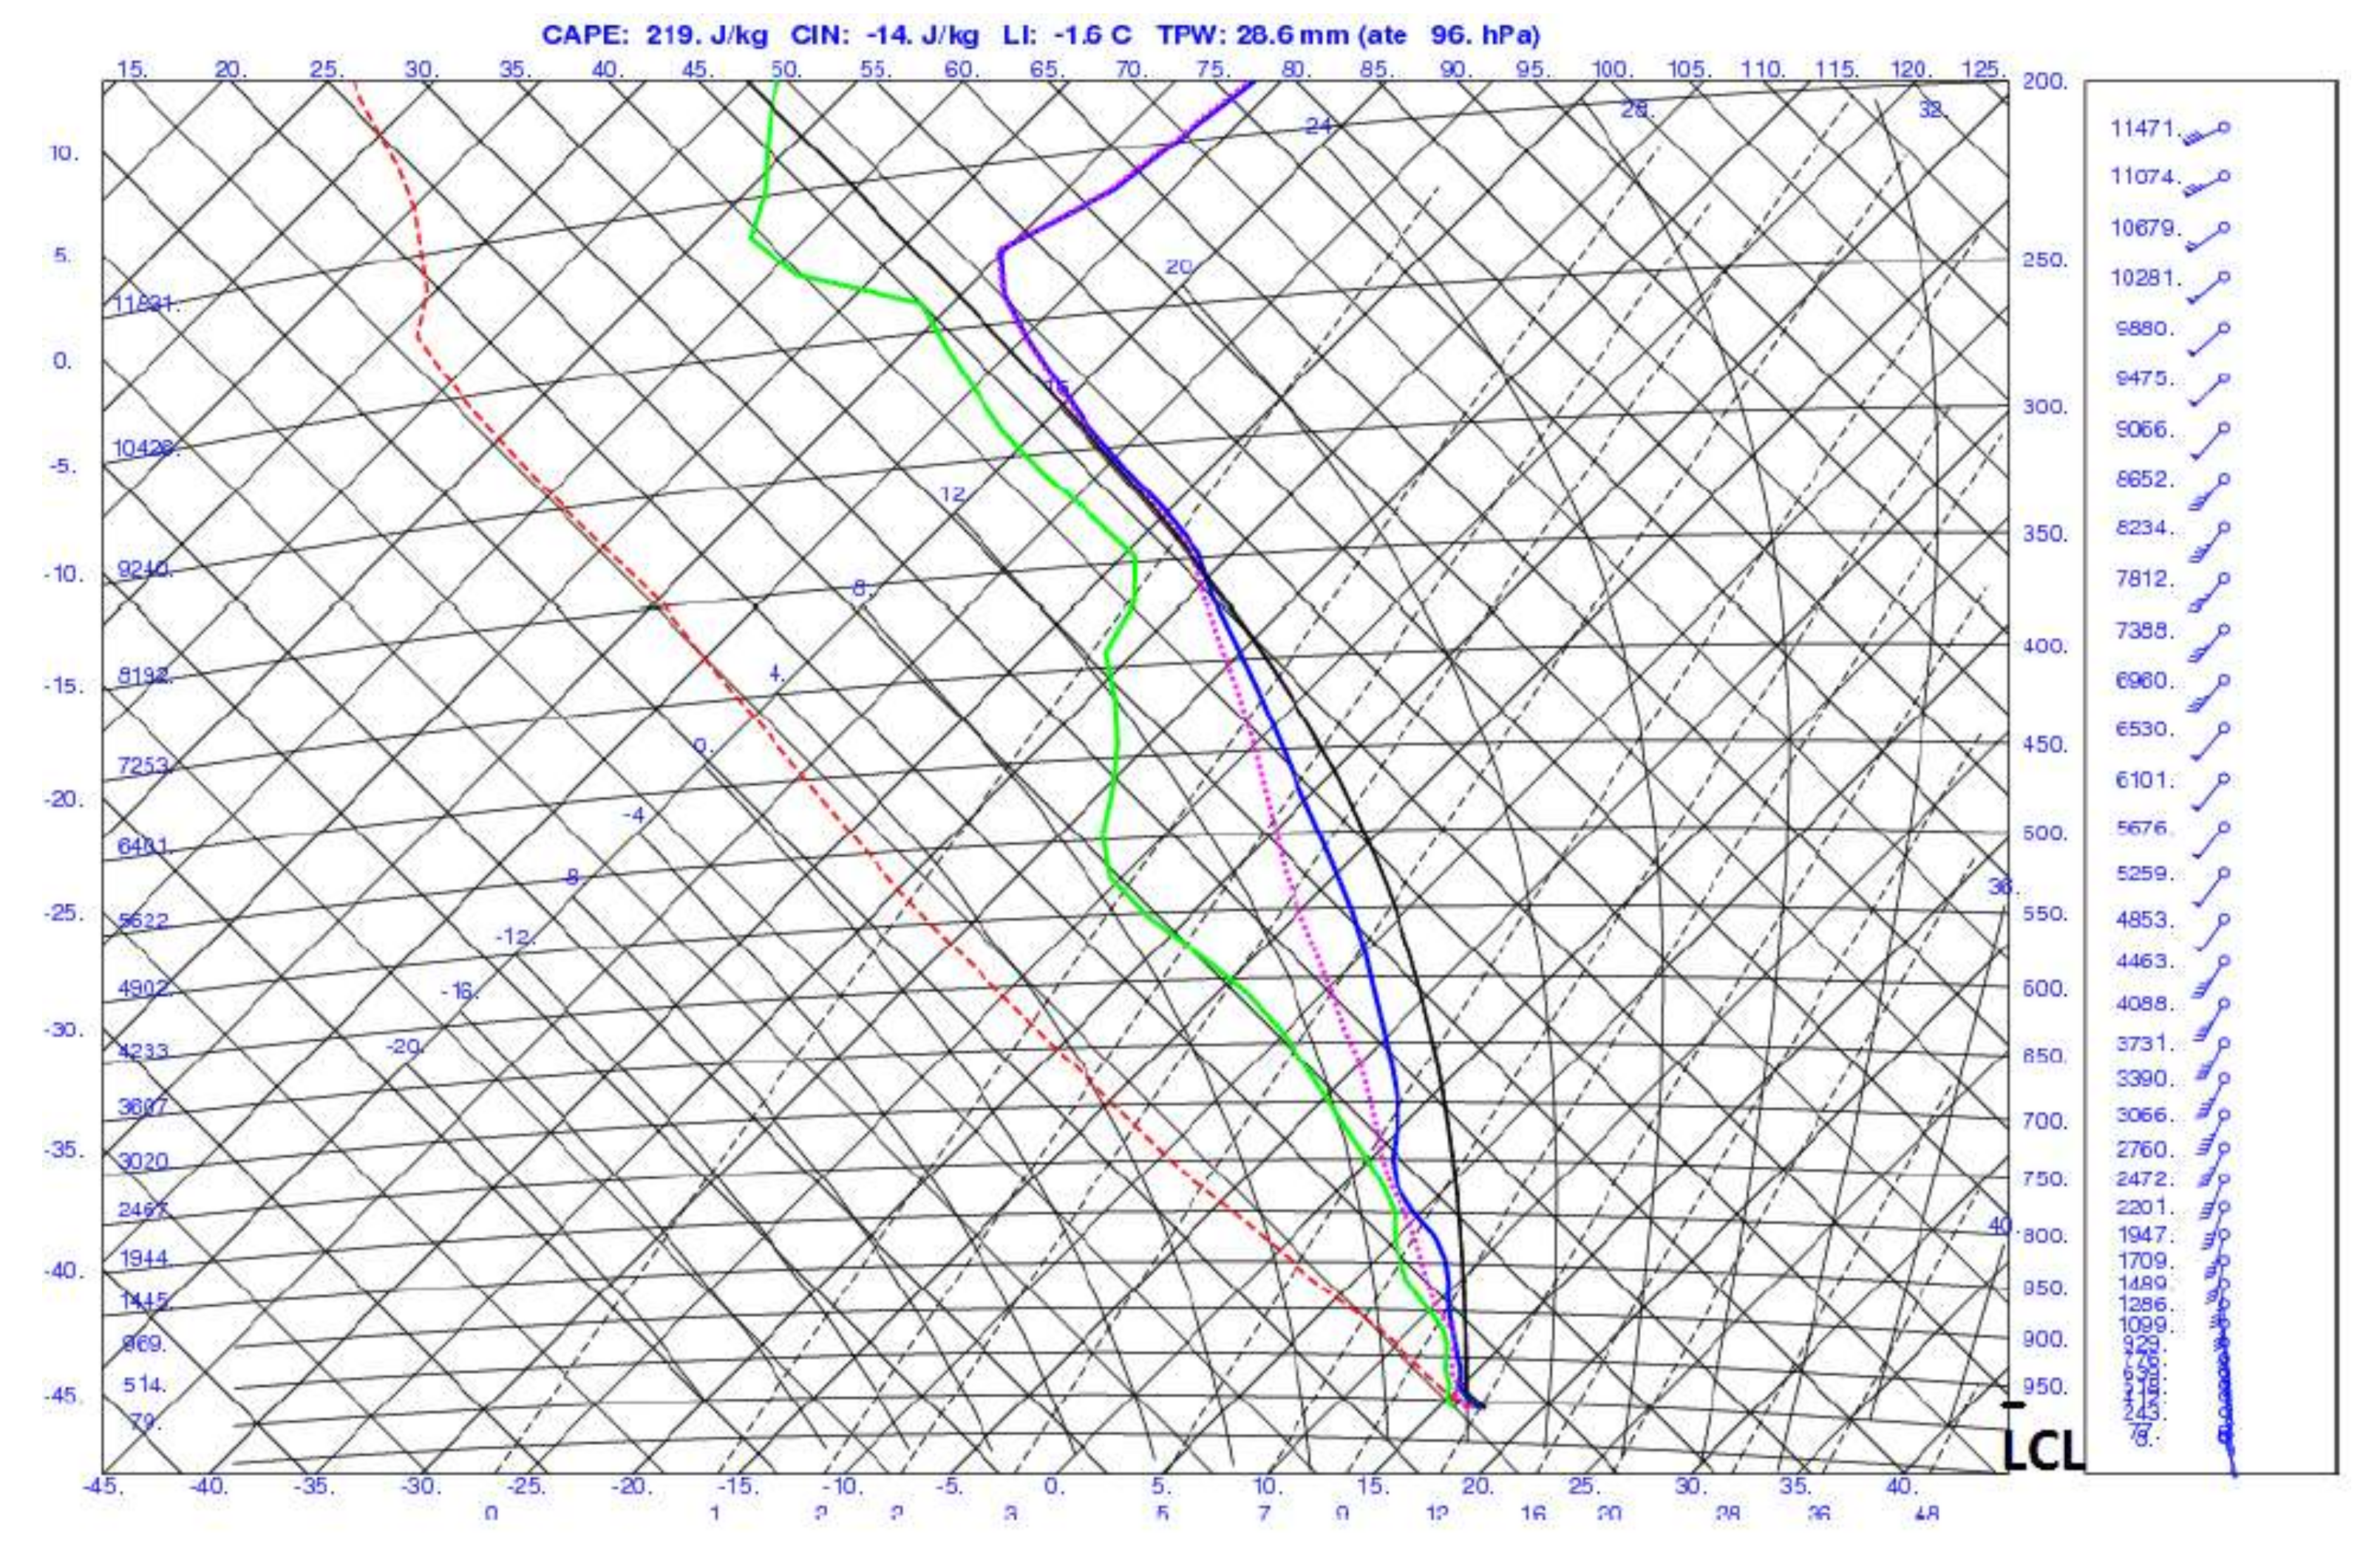
Type Ia tornadoes were usually identified very close to frontal boundaries that, in turn, were associated with extra-tropical depressions located to the west of Iberia. These were settled on warm, moist, unstable airmasses. The lows were nearly stationary or slow moving to the NE, thus promoting south-southwesterly flows over the territory, which were usually strong. The atmospheric environments were frequently characterized by the presence of an upper level jet streak that, along with positive vorticity advection in place at mid-levels, promoted the right setting for supercells to develop. These were found to organize both in the pre-frontal warm sector as well as in the postfrontal area. Typically, frontal boundaries (including instability lines) became stationary for some time. The strongly sheared environment in a deep layer was frequently in phase with low level veering. This environment was sometimes supportive of long-lived supercells (lasting in excess of 2.5 h), whose relevance has been discussed in the literature [
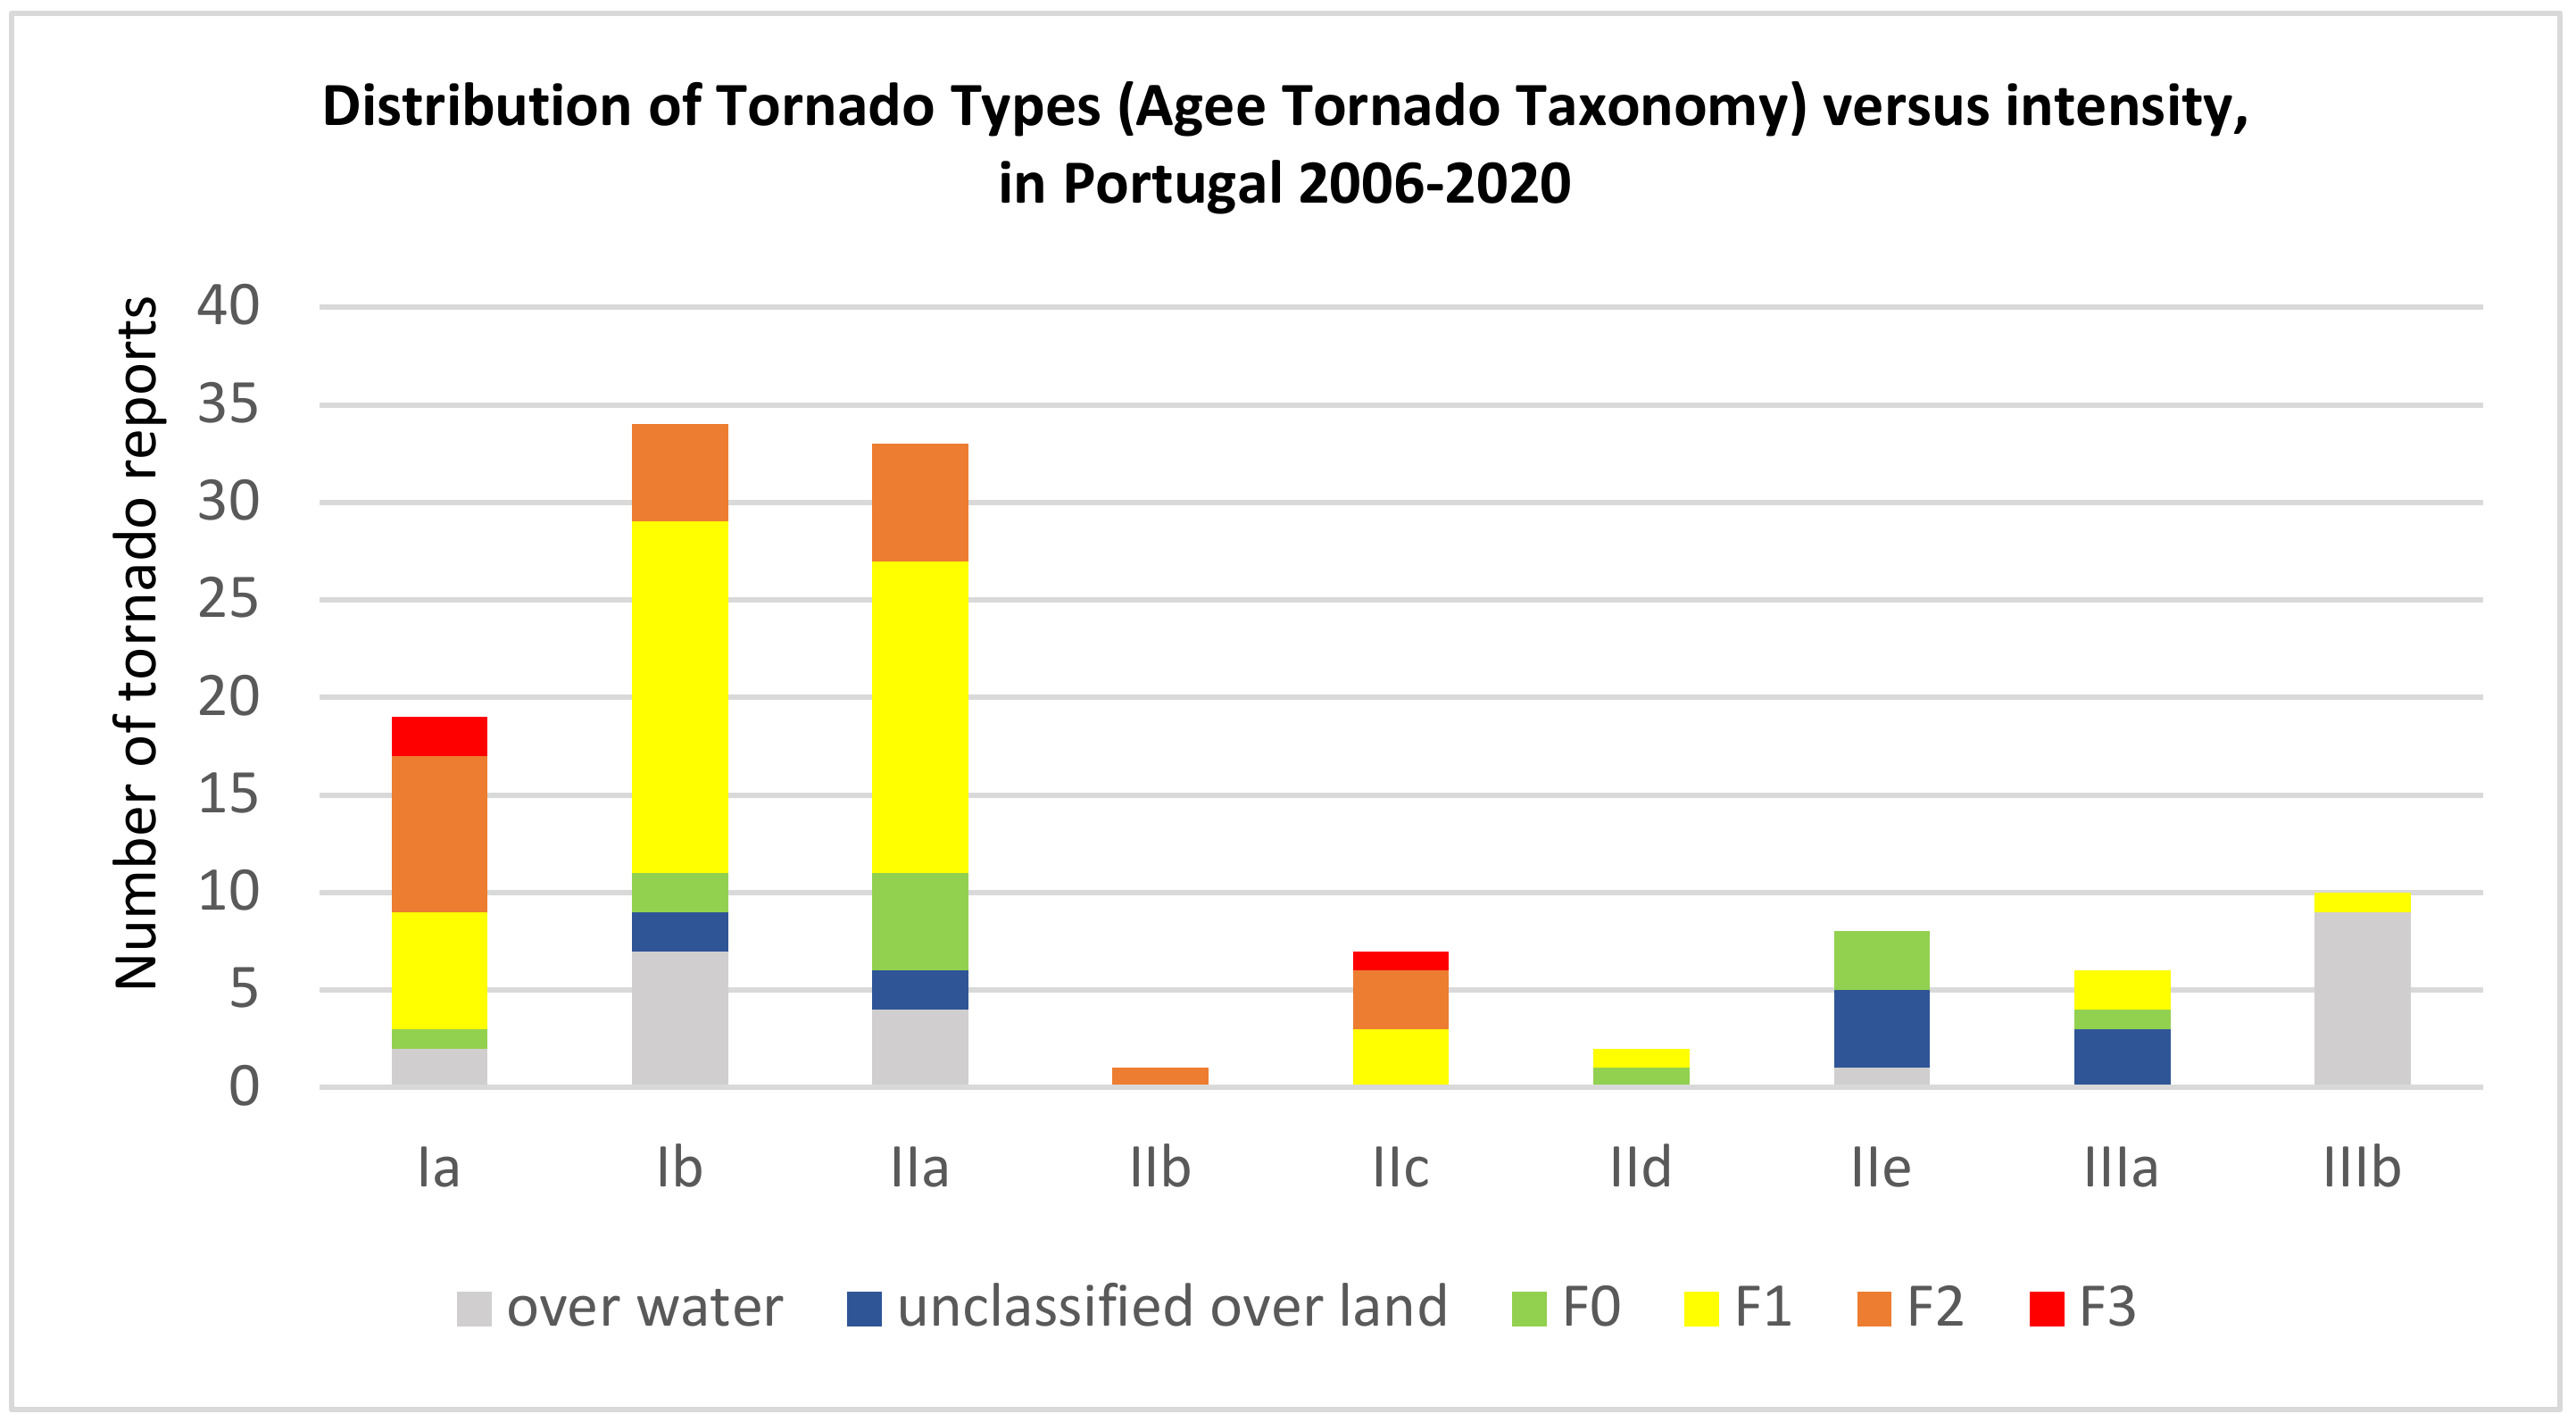
38]. From the most intense and longest damage path tornadoes that occurred in Portugal, a large fraction has occurred under this regime, spawned by supercells, as can be seen in Figure 7 and Figure 8. A detailed discussion mainly supported by radar observations of one event of this TT will be done below in the following section.
Type Ib tornadoes were typically observed under synoptic regimes that did not substantially differ from the ones associated with Type Ia. The main differences were the smaller amounts of available instability during Type Ib regimes, as well as a not so strongly sheared environment both in the low and deep layer. Although the distinction between Type Ia and Ib environments was not striking, it seems that there was less supercell organization during Type Ib events due to less vertical shear in the deep layer, which in turn generated shorter-lived tornadoes. Moreover, in those cases, it was more unlikely that supercells could bring vorticity closer to the ground, due to less low-level layer shear, thus not sustaining as strong tornadoes. This lower proportion of stronger tornados of Type Ib can be verified in Figure 7. The TT classification for Portugal showed that low top supercell tornadoes were the most frequently observed, along with the Type IIa tornadoes.
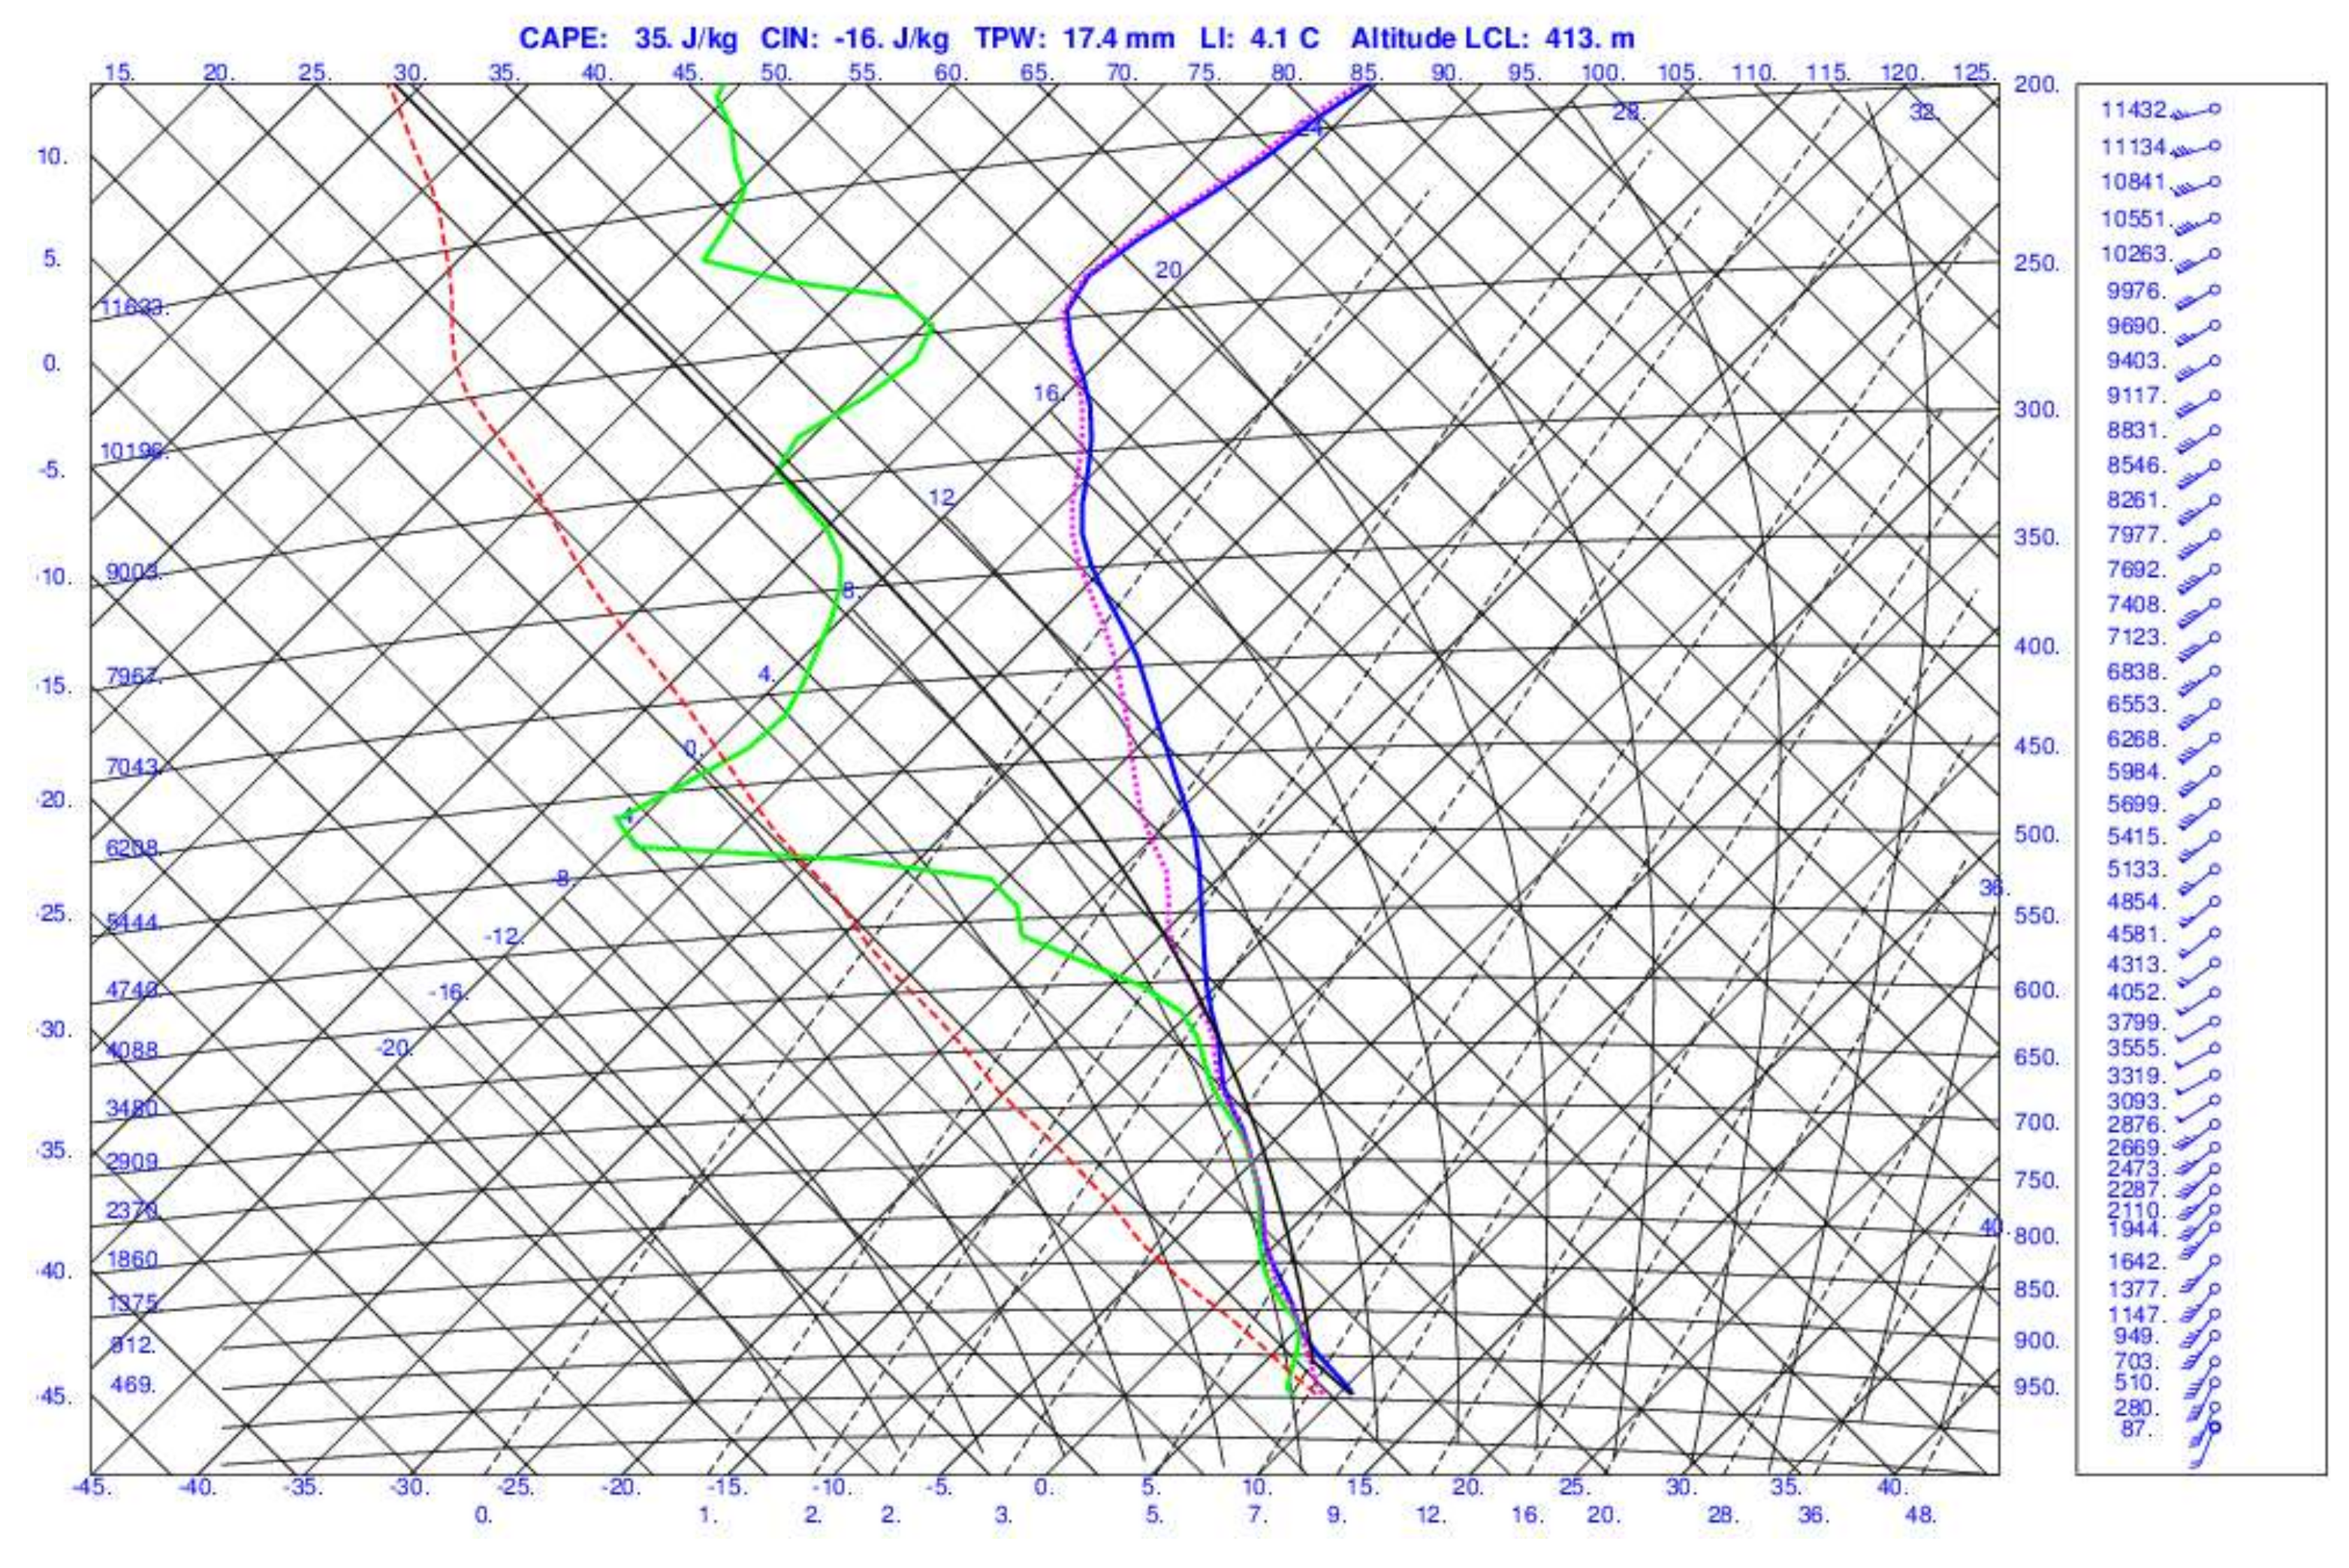
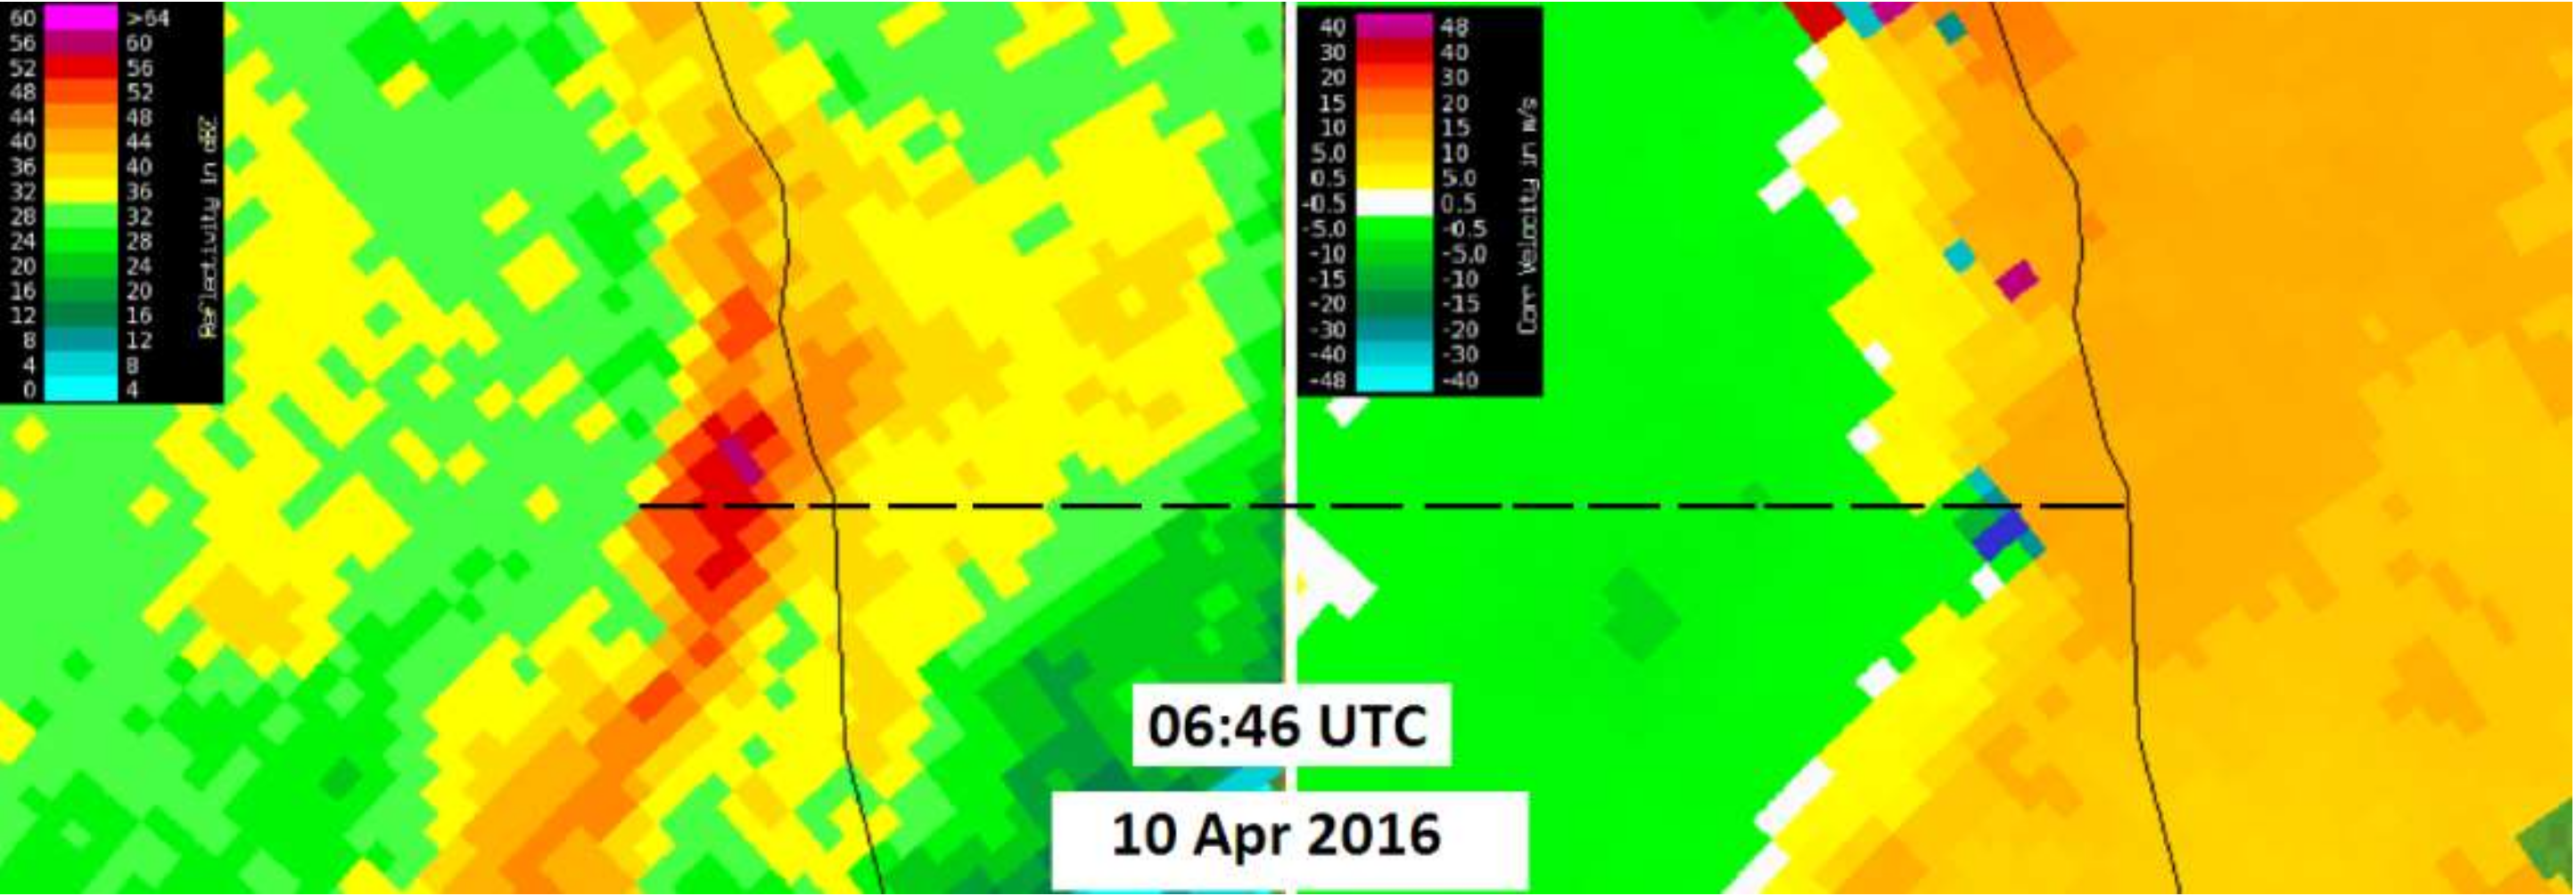
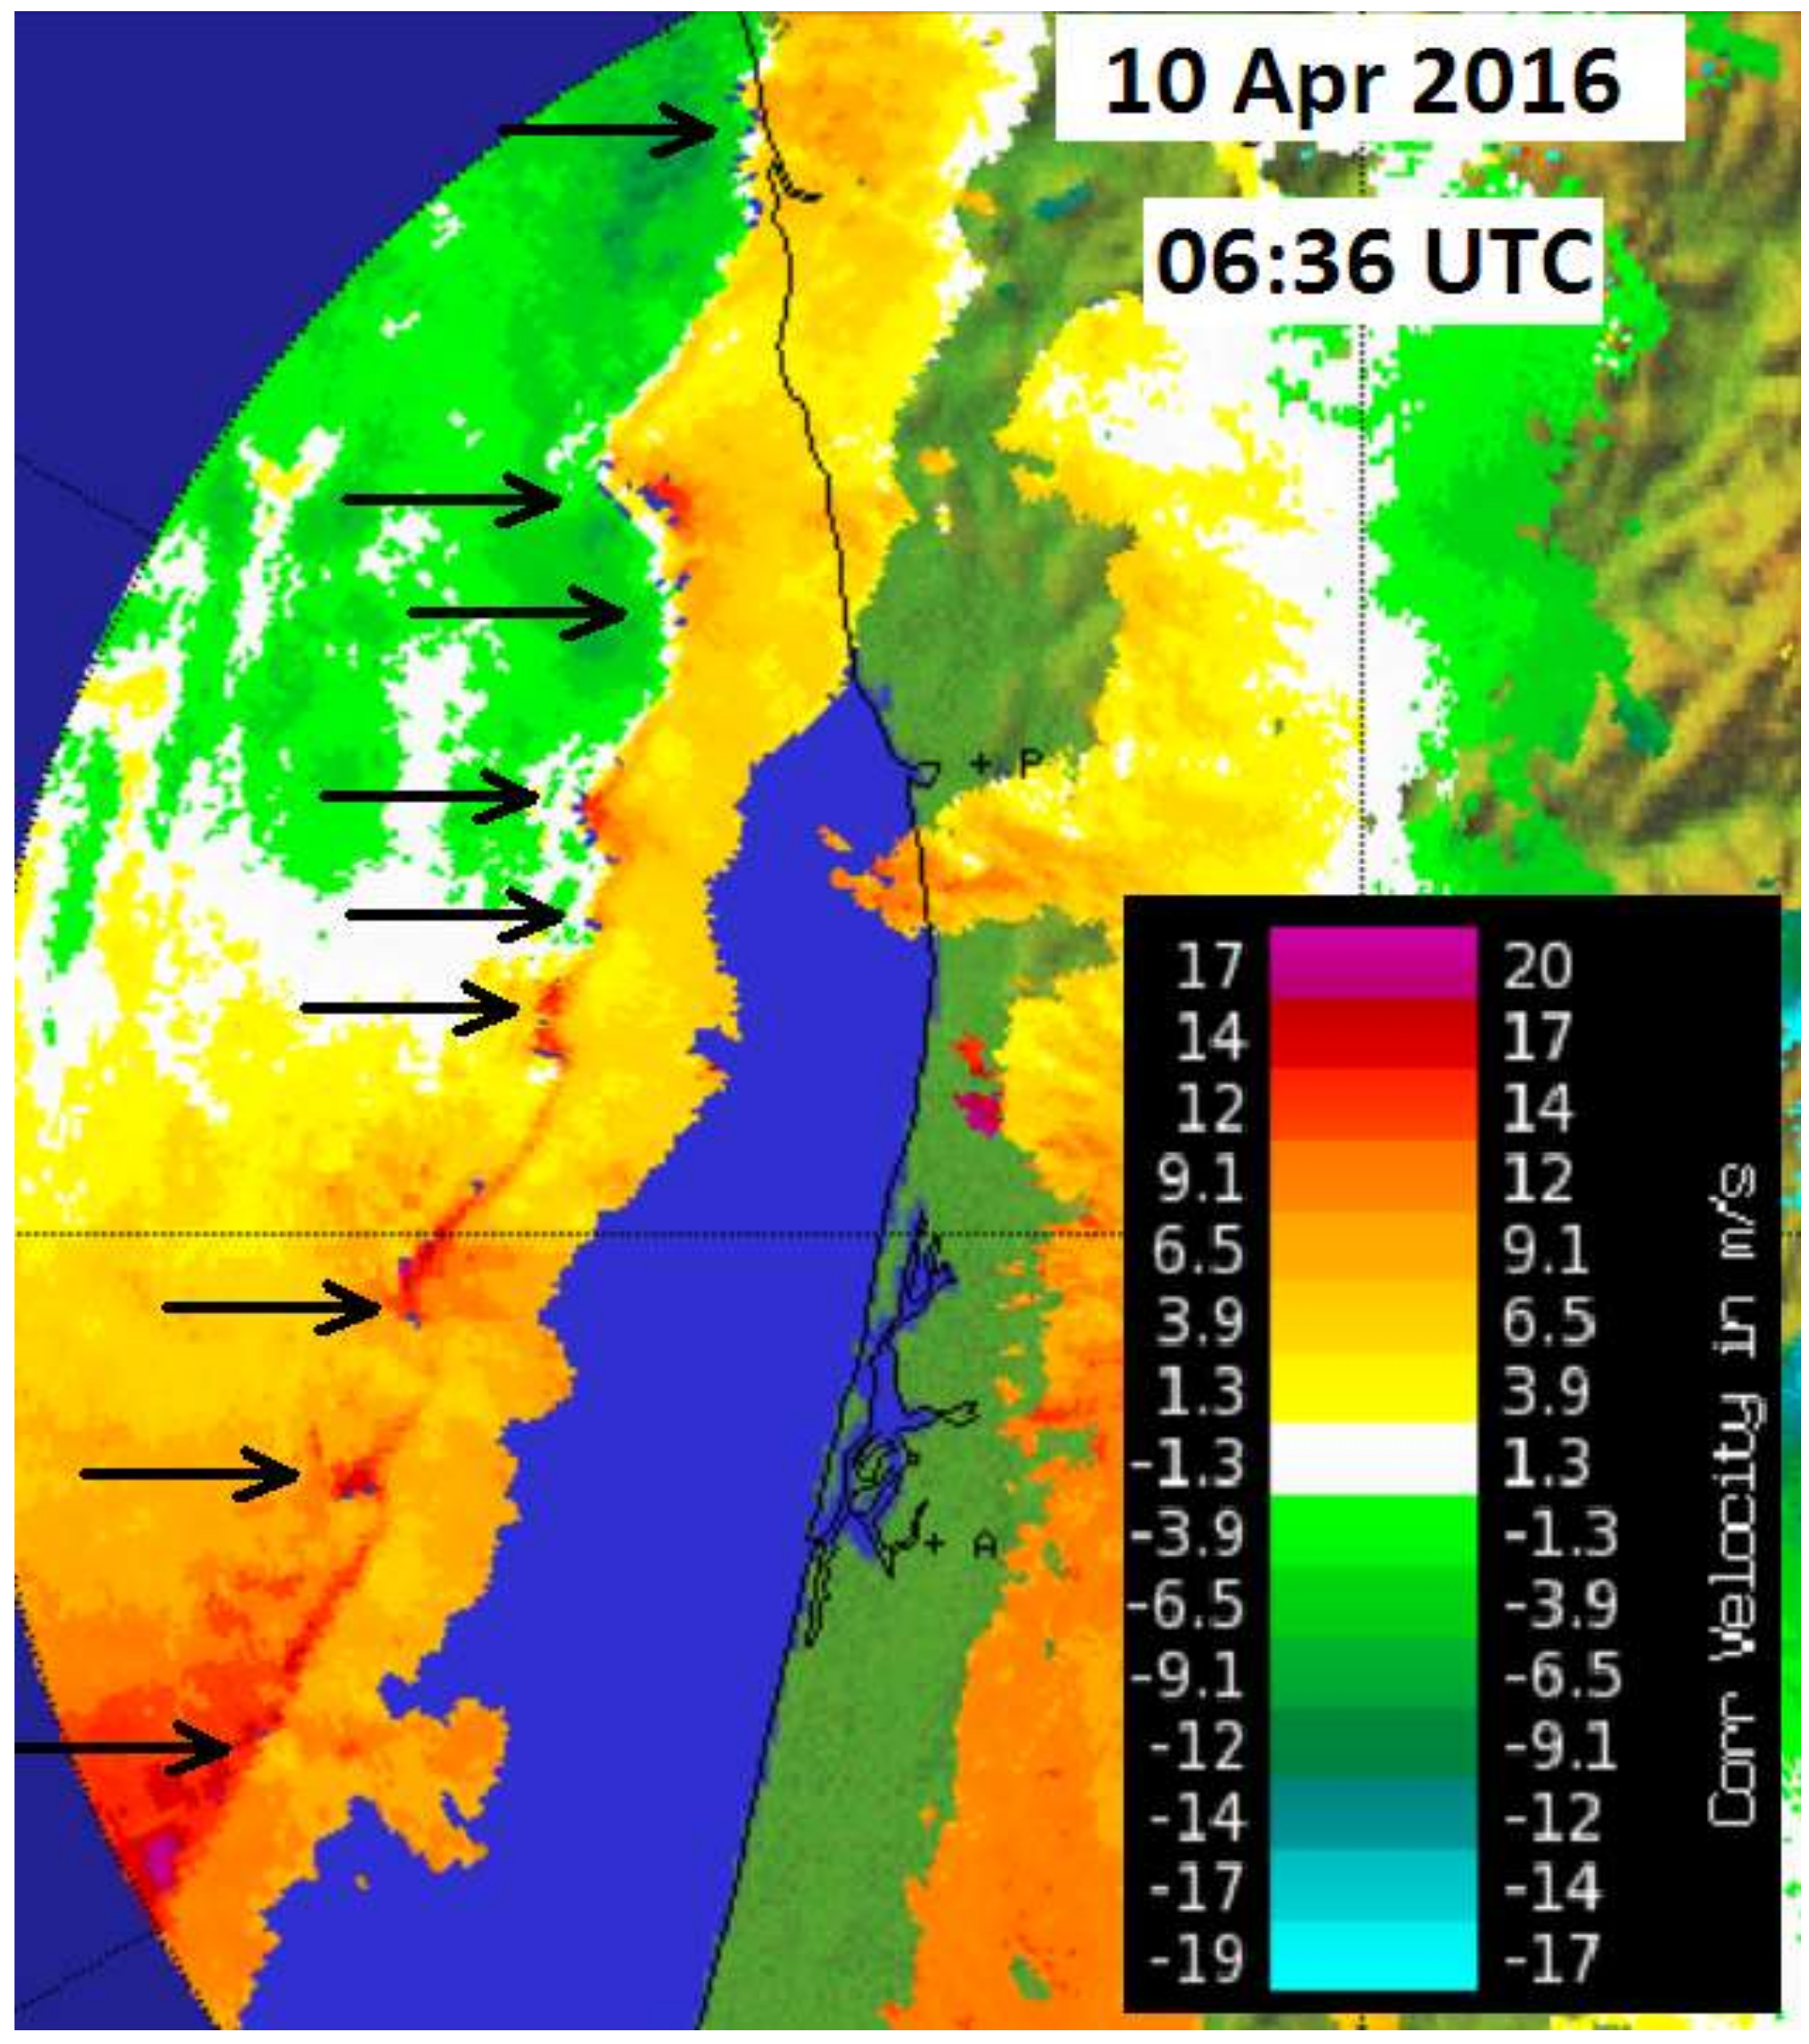
Type IIa tornadoes (LEWPs) were typically observed either along the cold frontal boundary itself or along instability lines (or squalls), developing upwind or downwind of the main boundary. An event of this type over the UK has been discussed by Clark [17]. All these boundaries were mainly associated with low pressure systems located over the NW of Iberia, or even further N, to the NW of the British Isles. Usually, the location of these lows promoted the advection of relatively moist, moderately unstable, and cold air masses over western Iberia, driving westerly or northwesterly flows over the Portuguese territory. An upper level jet streak was sometimes present but frequently not overlapping with substantial instability areas. It was also verified that, in general, the events with the largest values of deep layer shear for this type, were in phase with lower instability areas and conversely. During those events, short-lived mesovortices embedded in the LEWP were supported and very abundant along the instability lines. Usually, the boundaries were propagating progressively over the territory and not stalling. The strongly sheared environment in a deep layer was frequently in phase with low-level shear. However, this low-level shear was commonly of the shearing type, with modest veering if any. LEWP corresponds to “a special configuration in a line of convective storms that indicates the presence of a low-pressure area and the possibility of damaging winds and tornadoes. In response to very strong outflow winds behind it, a portion of the line may bulge outward, forming a bow echo” [52]. It was found that while the most damaging tornadoes were classified as Type I (namely, Ia and Ib), a relatively large proportion of weaker and shorter lived but still damaging tornadoes were classified as Type IIa, as shown in Figure 7. A recently published pan-European climatology of tornadoes [2] shows that tornadoes over southern Europe include a reasonable amount of non-supercellular tornadoes. In Portugal, the more abundant non-supercellular tornadoes are thought to be generated by these mesovortices and were typically cool-season events. In fact, from the 33 events of this type, only 4 did not occur in the period from mid-October to mid-April (Figure 9). One event of this TT will also be discussed ahead in more detail, with the support of radar observation.
Tornado Types IIb (Bow echoes) and IId (Rear Inflow jets along sections of the QLCS) were seldom observed in our study, and a “typical” synoptic regime could not be defined. The only case of Type IIb was observed in a strong westerly flow over Iberia that promoted the advection of a relatively warm, moist, and unstable air mass. The ingredients were similar to those of events leading to Type Ib tornadoes, although in this case, there was a slightly drier environment. Type IId was identified twice, during late summer (Figure 9) and on both occasions, under the influence of a slow-moving synoptic boundary over the territory. In events of this type, an extremely moist, unstable, and warm air mass was in place, along with a strongly sheared environment, both in the deep and low level layers. However, low-level shear was of the shearing type, as in the case of Type IIa.
Tornado Types IIc (Bookend vortex) and IIe (non-specific mesovortices) were observed under synoptic regimes which sometimes were similar to the ones associated with Types Ia and Ib and in other cases, were similar to the ones more typically associated to Type IIa. The small-scale phenomena described as bookend vortices and other non-specific mesovortices have some similarities both with mesocyclonic structures—typical from supercell types—and with structures embedded in QLCS, such as mesovortices. Those similarities may be related to the fact that their parent synoptic regimes are also similar.
As to TT IIIa (landspouts), they were mainly observed in regimes dominated by the Iberian thermal low, typical from the warmer months (Figure 9), and occurred far away from synoptic frontal boundaries. The air masses used to have only low to moderate instability, being the less unstable at a synoptic scale, among the ones under analysis. The environments were not only relatively dry, but also characterized by elevated based convection. Both deep layer and low-level vertical shear were small.
The TT IIIb (waterspouts) was observed close to slow moving frontal boundaries and, at least in one case, close to a convective outflow. The main differences of their environment to their land counterparts were slightly less available instability and higher low-level vertical shear.
The distribution of TT along the year was similar to the one already presented for the overall set of tornado events, clearly showing the dependence with synoptic climatology. The dry season in Portugal runs from June to September, where rainfall is scarce, the only exception being the rain from convective storms that may develop mostly inland. Nevertheless, the frequency and severity of this summer convection is much lower than over central Europe.
This qualitative analysis showed that atmospheric instability was larger in environments that favored Types Ia and Ib tornadoes, as compared to that of environments that supported the other types. The Type IIIa (landspout tornadoes) and IIIb (waterspout tornadoes) were the ones associated with the least unstable environments, especially in the case of the latter.
The environments prone to Types Ia, Ib (supercell and minisupercell tornadoes), and IIa (LEWPs tornadoes), tended to be moister than the ones more supportive of Types IIIa and IIIb.
Vertical wind shear of the horizontal winds for the low layer (namely for the 0–1 km AGL) was evaluated and it revealed much lower values in environments prone to Types IIIa and IIIb (non-mesocyclonic tornadoes). As to the deep layer shear (0–6 km AGL), it was verified that the larger values were associated with environments that favored supercells, both classical and mini or low topped (Types Ia, Ib). Types IIa were also characterized by large amounts of the observed deep layer shear, whereas the ones of the other types were considerably lower.
At last, distribution of the LCL (lifted condensation level), frequently used as a proxy for cloud base, was considered. It was found that significantly lower values of LCL, characteristic of environments with high low-level moisture, were associated with TT Ia, Ib, and IIa. Types IIIa and IIIb were observed in environments favorable to higher based convection.
On those environments that were more supportive of supercells in Portugal, there was an overlap of larger instability and larger deep-layer shear. This result is in line with the literature on this subject [37]. Moreover, these environments were usually characterized by lower LCL values. This highlights the importance of evaluate LCL distribution on those environments, since low LCL values in supercells supportive areas are a sign that tornadogenesis may also be more likely, as the release of instability will probably occur closer to ground level.

5. Case Studies of Tornado Events

5.1. Type Ia Tornado—16 November 2012

On 16 November 2012, at 12 UTC, the ECMWF mean sea level pressure short term forecast (H+12) showed an extra-tropical low, centered to the west of Lisbon (Figure 10, left), extending up to the high levels of the troposphere (Figure 10, right). An instability line developed from a warm and moist airmass of 14–16 °C pseudo wet-bulb potential temperature (Figure 11, left), was being advected in a strong south-southeasterly flow over southwestern Iberia. An upper-level jet streak was located to the south of the low core (Figure 11, right), thus acting as a source of lift over southern Portugal. The region was under its left exit area. Furthermore, the jet with northeasterly winds of more than 90 kt at 300 hPa (Figure 11, right), was sustaining a strong deep-layer shear over southern Portugal.
A vertical profile derived from ECMWF data over the Faro area, at 12 UTC (H+12) is shown in Figure 12. The profile revealed instability from very low levels (LCL very close to the surface) up to 350 hPa, a nearly saturated troposphere up to 750 hPa, and with a total precipitable water amount of 28.6 mm (Figure 12). Large wind veering was visible at the lower levels, while in the upper levels, only unidirectional shear was observed (Figure 12). This wind profile compared well with the observations of the nearby radar (VVP algorithm profile, [31]). A deep-layer bulk shear (0–6 km AGL) of 4 ms−1km−1 and a low-level bulk shear (0–1 km AGL) of 13 ms−1km−1 were estimated from the model profile. These values are comparable with the ones that overlapped during the event of a long-lived supercell tornado (Type I) in Portugal, whose physical details were already analyzed in depth [16]. The radar is slightly northeast of the generation area but the follow up of later observations showed that the wind profile was essentially representative of the atmospheric volume of the instability line.
The ECMWF derived profile showed a MUCAPE (Most Unstable Convective Available Potential Energy) only slightly above 200 J/Kg (Figure 12). This profile was obtained for a location that was only 50 km to the east of the area where the most active sector of the instability line was being observed on radar. Nevertheless, since the line was propagating to the north-northwest, this was not representative of the instability line environment. Indeed, both ECMWF and GFS analysis (not shown) represented higher instability values to the west, on the order of 450 J/kg, by 12 UTC.
Therefore, in the western area of southern Portugal, the main ingredients for the tornado development were instability, abundant low-level moisture, and substantial vertical wind shear both in the low and deep layers, which overlapped at 12 UTC of 16 November 2012. An important lift source was in place, as well. This environment proved to be extremely favorable to the organization of supercells. More than 40 of these were identified during the period 7–19 UTC, within the 100 km range of the radar. Over the sea south of the Algarve coast (far south region of Portugal), rotation was discernible between 1200 m and 6800 m a.m.s.l., in a storm with a core with 52.5 dBZ at 3800 m a.m.s.l. (not shown), by 12:36 UTC. This storm propagated at 15 m/s, slightly to the right of the mean deep-layer wind, in the vicinity of other convective storms, including supercells. At 13:16 UTC (Figure 13, panel a), the storm was very close to the coastline, with a mesocyclone already defined at low levels (radar observation at 900 m a.m.s.l.). The diameter of the mesocyclone circulation (defined by the distance between maximum magnitudes of inbound and outbound SRV) was 3.6 km and the azimuthal shear (difference between outbound and inbound SRV components normalized by the mesocyclone diameter) was 9.2 × 10⁻³ s−1. Footage confirmed that the tornado spawned by this supercell was already over the ocean by this time. This storm continued its track over land and at 13:46 UTC, when the tornado was still touching the ground, the mesocyclonic rotation was observed between 800 m a.m.s.l. (Figure 13, panel b) and 7700 m a.m.s.l, along with some signs of divergence at this altitude, coherent with a range displacement of the inbound and outbound couplet (Figure 13, panel c). At 800 m a.m.s.l., the diameter of the mesocyclone was now 3.5 km and the azimuthal shear was of 13.6× 10⁻³ s−1. The azimuthal shear values are indicated as a reference to another case study discussed below. By this time, the vertical size of the mesocyclone was very large and this qualified the storm as a discrete supercell (thus distinguishing this case from other cases classified as low topped supercells, which are more frequent in the country). It is interesting to note several reflectivity signatures typical of a supercell that were very well defined at 800 m a.m.s.l. by 13:36 UTC (Figure 13, panel d). By 13:30 UTC, the supercell towered at nearly 12000 m. According to the vertical profile extracted from the model (Figure 12), this supercell may have exceeded the equilibrium level, which was slightly over 8000 m. The mesocyclone of this supercell was observed on radar during more than 1 h, maintaining a depth of at least 6000 m during that period.
This storm spawned a tornado over the sea. Moving to north, it made landfall at 13:20 UTC and covered a path 31 km long, with a width up to 300 m, during about 30 min. When crossing Lagoa and Silves towns, F3 damage was reported, as well as 13 injuries and one dead. Several other wind damages and 3 other tornadoes of the same TT were reported the same day, in this region.

5.2. Type IIa Tornado—10 April 2016

According to the ECMWF mean sea level pressure short term forecast, a deep barotropic extra tropical cyclone (982 hPa) was centered north-northwest of Iberia, at 06 UTC (H+06) (Figure 14, left). This system was advecting a cool and relatively moist airmass over Portugal, characterized by a 06–08 °C pseudo wet-bulb potential temperature, according to the same short-term forecast (Figure 14, left). The 06 UTC DWD analysis (not shown) showed a cold front over the northwest tip of Iberia, in association with this extratropical low. The frontal boundary could be identified by a relative maximum in the total precipitable water (Figure 15, left) and positive vorticity advection with high vertical wind velocities at 850 hPa (Figure 15, right), just to the west of the tornado location (Figure 15). The jet streak with its right entry over Portuguese coast was reinforcing lift conditions there and creating a strong deep-layer shear (Figure 14, right).
An ECMWF derived profile at 06 UTC (H + 06), was obtained for a location 25 km upwind of the tornado area (Figure 16). This region of the atmosphere was considered as the genesis environment, taking into account that the tornado occurred at 06:50 UTC. This profile showed a negligible MUCAPE (35 J/Kg) but saturated atmosphere from very low levels (450 m) up to 3500 m, as well as a moderate (17.4 mm) total precipitable water (Figure 16). The wind profile was similar to those that have been frequently observed in Portugal under these synoptic regimes: a strongly sheared environment in a deep layer that was in phase with considerable low-level shear but with negligible veering (Figure 16). From this wind profile, a deep-layer bulk shear (0–6 km AGL) and a low-level bulk shear (0–1 km AGL) were estimated to be 5 and 6 ms−1 km−1, respectively. The first value is even larger than the one obtained for the TT Ia case study (see Section 5.1), but the low-level shear is considerably lower. This is coherent with a weaker tornado for this Type IIa case.
According to these elements, the ingredients of low instability, moderate low-level moisture, substantial vertical wind shear in the deep layer, and moderate in the low level layer, coincided by 06 UTC in a region slightly upwind of the area where the tornado occurred. Lift was also in place.
In this environment, the cold front was observed by radar as a QLCS (Figure 17, left). The system was detected as a quasi linear reflectivity pattern formed by low-level bowing segments (between 1300 and 1500 m a.m.s.l., hardly visible above 3000 m a.m.s.l.) with reflectivity values above 35 dBZ showing no gaps for more than 150 km (Figure 17, left). The inbound–outbound SRV couplet associated with the tornadic mesosvortex, was referenced as it was making landfall (Figure 17, right). The velocity couplet was not observed below 1300 m a.m.s.l. due to the radar beam overshooting (radar location at 1100 m a.m.s.l.) that prevented lower level observations. The signature was better defined in the zoomed image (Figure 17, right). The rotation was also barely noticed at the next radar tilt, when it was observed at 2900 m a.m.s.l. (not shown), and this rotation confined to low levels is coherent with observational studies of similar situations described in the literature [17]. The diameter of the mesovortex circulation (distance between maximum magnitudes of inbound and outbound SRV) was 1.8 km and the azimuthal shear (difference between outbound and inbound SRV components normalized by diameter of the mesocyclone) was of 9.4 × 10⁻³ s−1. This value was lower than the one computed for the mesocyclone associated with the Type Ia tornado event presented before (see Section 5.1).
The rotation center of the tornadic mesovortices was coincident with the apex of the bowing segment on reflectivity (Figure 18), which is a feature already described in studies performed over similar situations [42]. Inflow notches and rear-inflow jet (RIJ) signatures were difficult to identify during this event.
During this case, anticyclonic vortices were not observed, while cyclonic vortices were very abundant. For instance, by 06:46 UTC (Figure 19), nine cyclonic rotation centers were clearly discernible, while other less prominent features that could be cyclone candidates were also observed. The fact that no cyclonic–anticyclonic pairs were observed, even in the early stages of some observed mesovortices, suggests that tilting of environmental horizontal vorticity was probably not the vortex generation mechanism involved. Instead, there was a sharp wind gradient along the entire observed gust front of the QLCS, more visible closer to the radar, where resolution sampling is higher. This suggests that perhaps during this event, shearing instability [53] may have played some role in the cyclonic vortices’ formation. Other events of this type observed over the northwest of the country seem to point out for the same mechanism. Although important, this discussion is out of the scope of this study.
The QLCS produced a tornado that caused F1 damage at Vila Chã and surrounding farms. The path was 1.3 km long, as estimated from damaged houses near the sea-side to a grassland region, tracking southwest to the northeast and probably formed still over the sea.
Figure 17. Left: PPI of reflectivity (Z, dBZ), 0° tilt. Right: PPI of SRV (m/s), 0° tilt. 06:46 UTC, 10 April 2016. Tornado affected area (F1) marked by a circle on both panels. Zoomed insertion highlights the mesovortex inbound outbound couplet, as well as the 1.3 km tornado damage path (T, identified by ground survey; SRV scale is the same as in Figure 19).
Atmosphere 11 00679 g017
Figure 18. Left: PPI of reflectivity (Z, dBZ), 0° tilt. Right: PPI of SRV (m/s), 0° tilt. 06:46 UTC, 10 April 2016. Radar is to the right. Dashed line shows the collocation of the apex of Bow echo pattern on Z (left) and the mesovortex rotation center on SRV (right).
Atmosphere 11 00679 g018
Figure 19. PPI of SRV (m/s), 0° tilt. 06:46 UTC, 10 April 2016. Arrows point to several rotation centers that were identified by that time (SRV scale was tailored to enhance rotation center identification).
Atmosphere 11 00679 g019

6. Discussion and Conclusions

A systematic data collection and study of the tornadoes has been conducted since the year 2000, revealing 195 tornado events. Over land, there are records on tornadoes since the middle of the 19th century, and references back to the 14th century. Over the sea, there are references to tornadoes since the 16th century. Tornadoes over the Atlantic Ocean were sometimes observed from Madeira and Azores Islands and from mainland Portugal. When making landfall, those tornadoes often caused significant damage. In mainland Portugal, 154 tornados were reported, 21 of them were formed over the sea and moved inland. For Azores Islands, 2 events of F1 tornado damage were reported.
The tornadoes that occur over mainland Portugal have an impact on the territory, the population, and the local economy, but most of the damage affects families and private companies, so the estimate of the total losses is hard to assess. Most of the events had a local impact and soon were forgotten, but some caused important losses of property and occasionally, several injuries, or even deaths, resulted in long term consequences that are rarely reported.
Interpreting the effects of the tornado on the ground to order to delineate its trajectory and access its intensity is a complex task, because it depends on the characteristics of each tornado, on the type of structures lying along its path, as well as on the accuracy of the available data. This may have resulted in a path length and intensity underestimation for some events. There is also limited consistency on the available data due to the use of different methods in damage survey. Although underreporting has been reduced in recent years, earlier tornado records were mostly based on newspaper reports, and even for recent events, it was not always possible to collect all the relevant data. Evidence of well documented events shows that most tornadoes lasted less than 10 min, causing F1 or F2 intensity damage, and their paths were usually smaller than 5 km. The strongest 6 reported tornadoes were classified as F3. Half of them occurred before the year 2000, but two recent events were confirmed to have lasted up to 45 min with paths longer than 50 km.
A classification on tornado types revealed that the strongest and longest damage path tornadoes in Portugal were associated with supercells (Type I tornadoes). Supercell tornadoes accounted for about 44% of the total occurrences and were commonly identified close to frontal boundaries. The corresponding low-pressure systems were located west of Iberia, usually slow moving to the NE, therefore promoting south-southwesterly flows. Their environments were warm, moist, and very unstable, and they were characterized by strong deep-layer shear and low-level veering, which were in phase with each other. Tornadoes that occurred in the Portuguese “tornado alley” and in the southern coastal area, were mostly of this type, exceeding 0.6 tornadoes per 10000 km2 and year. However, nearly the same fraction of tornadoes (43%), originated in QLCS (Type II tornadoes). The large majority of these, almost one third of the total tornado occurrences, 28%, originated specifically from line echo wave patterns. These patterns developed close to, or along synoptic boundaries. The lows were typically located NW of Iberia or even further N, promoting west-northwesterly flows in relatively moist, moderately unstable, and cold air masses. These environments were characterized by strong deep-layer shear and low-level shearing. However, instability and shear were not frequently overlapping. These weaker and shorter-lived, but still impacting tornadoes, were found to be the more frequent non-supercellular tornadoes in Portugal, and were observed to be typically cool-season events. Tornadoes that occurred in the northern part of the west coastal area were mostly of this type, also exceeding 0.6 tornadoes per 10,000 km2 and year. Both Type I and Type II tornadoes were found to follow a bi-modal distribution, with one frequency maximum during late winter/early spring and a second during autumn. Another kind of non-supercell tornadoes, the so called fair weather land and water spouts, accounted for only 13% of the total amount of tornadoes during the 14 year classification period. These were weak and short-lived tornadoes (Type III). Landspouts have occurred far from synoptic boundaries and waterspouts were generally close to slow-moving frontal boundaries.
A qualitative comparison of the annual tornado density with the adjacent Spanish areas shows that the relative maxima in northwestern and southwestern Spain [54] merge with the corresponding areas of maximum density over Portugal. Most tornado path directions were from south and southwest, as well as in Spain [54].
Unlike documented for other regions of southern Europe [4], there was no clear frequency increase during summer months. Tornadoes usually occurred from October to April with very few summer reports. There was a high inter-annual variability on the number of tornadoes in Portugal in line with the variability of the regional synoptic climatology. This variability was mostly related to the cooler months, since during the warmer period, there were almost no tornado reports. The yearly distribution of tornadoes in mainland Portugal was found to follow a bi-modal distribution, with a peak in late winter–early spring and another one during autumn. This distribution differs from the one observed over other southern European areas, where there is a peak starting in late summer [54], and also from the distribution observed over the westernmost European areas, where the peak is during summer [4]. During summer, mainland Portugal is mainly under the influence of dry and stable air-masses, in the joint circulation of the Azores high and the thermal Iberian low. By fall, as the polar front starts to influence the area, the arrival of moist but still warm air-masses explains the autumn tornado peak. During late winter/early spring, as the polar front migrates further north, the area is again more exposed to westerly flows, also creating environments which favor tornado formation. The distribution of tornadoes per month of the year of the classified tornado types also reflected the synoptic climatology of mainland Portugal territory. The registered cases likely underestimated the number of tornadoes that have indeed occurred, since there were tornadoes that were not observed and/or reported. Some of these cases could have had minor effects, which were not appealing to the media; other cases could have had reduced spatial and temporal scales, which made their identification difficult.
In the future, there will be a continued effort regarding the systematic collection of tornado data, including the classification of types and assessment of their typical environments. The ERA5 reanalysis data will certainly provide a sound base to more reliably assess the environmental conditions of convective storms, since it provides analysis fields at a much better spatial (horizontal resolution of 31 km and 137 vertical levels) and temporal (hourly) resolution than those of the datasets used in this work. This tool will allow the development of statistical metrics based on several atmospheric parameters that will increase the insight on the balance between atmospheric ingredients that characterize tornado prone environments.

Author Contributions

Conceptualization, P.L. and P.P.; methodology, P.L. and P.P.; formal analysis, P.L. and P.P.; investigation, P.L. and P.P.; writing—original draft preparation, P.L. and P.P.; writing—review and editing, P.L. and P.P.; All authors have read and agreed to the published version of the manuscript.

Funding

This research received no external funding.

Acknowledgments

Special thanks to all the people who sent information on tornadoes, sometimes including site survey elements, and posted on the Web; to Costa Alves, senior meteorologist that collected the first set of data; to Joaquim Fernandes for the data collected in 19th century newspapers; to the colleague Álvaro Silva for his help on GIS software; to João Paulo Martins for a valuable manuscript review; and to many other colleagues at IPMA for the support and discussions on these subjects along the years. The authors are thankful to the anonymous reviewers, whose comments greatly improved this manuscript. Also acknowledge the valuable use of data from CFS (Climate Forecast System, NOAA), GFS (Global Forecast System, NOAA), DWD (Deutscher Wetterdienst), ECMWF (European Centre for Medium range Weather Forecasts) and IPMA (Instituto Português do Mar e da Atmosfera).

Conflicts of Interest

The authors declare no conflict of interest.

Acronym List

AGL—above ground level
a.m.s.l.—above mean sea level
BWER—Bounded Weak Echo Region
CFS—Climate Forecast System, NOAAD WD - Deutsche Wetterdienst
E—east
ECMWF—European Centre for Medium-Range Weather Forecasts
ESTOFEX—European Storm Forecast Experiment
ET—echo tops (maximum altitude of the 18 dBZ threshold)
FFD—forward flank downdraft
GFS—Global Forecast System, NOAA
IPMA—Instituto Português do Mar e da Atmosfera (Portuguese Meteorological Service)
LCL—Lifted Condensation Level
LEWP—Line Echo Wave Patterns
MAXZ—maximum returns of reflectivity (horizontal projection of the maximum reflectivty values observed in the vertical depth of the radar observed volume)
MUCAPE—Most Unstable Convective Available Potential Energy
m.s.l.p.—mean sea level pressure
N—north
NE—northeast
NOAA—National Oceanic and Atmospheric Administration
NW—northwest
PPI—Plane Position Indicator,
QLCS—Quasi Linear Convective Systems
RDF—rear flank downdraft
RIJ—Rear-Inflow Jet
r.m.s.e.—root-mean-square error
S—south
SC—Supercells
SE—southeast
SRV—Storm Relative Velocity
SW—southwest
TPW—Total Precipitable Water
TT—Tornado Types
VIL—Vertically Integrated Liquid
VVP—Volume Velocity Processing
W—west

Appendix A

Figure A1. Tornado taxonomy (extracted from Agee, 2014). QCLS, quasi-linear convective systems; SR, severe right moving; SL, severe left moving; LEWP, Line Echo Wave Pattern; BEV, bookend vortex; IJ, inflow jet.
Atmosphere 11 00679 g0a1

References

  1. Verbout, S.M.; Brooks, H.E.; Leslie, L.M.; Schultz, D. Evolution of the U.S. tornado database: 1954–2003. Weather Forecast. 2006, 21, 86–93. [Google Scholar] [CrossRef]
  2. Antonescu, B.; Schultz, D.M.; Lomas, F.; Kühne, T. Review Tornadoes in Europe: Synthesis of the observational datasets. Mon. Weather Rev. 2016, 144, 2445–2480. [Google Scholar] [CrossRef]
  3. Brooks, H.E. Severe thunderstorm and climate change. Atmos. Res. 2013, 123, 129–138. [Google Scholar] [CrossRef]
  4. Groenemeijer, P.; Kühne, T. A climatology of tornadoes in Europe: Results from the European Severe Weather Database. Mon. Weather Rev. 2014, 142, 4775–4790. [Google Scholar] [CrossRef]
  5. Dotzek, N.; Groenemeijer, P.; Feuerstein, B.; Holzer, A. Overview of ESSL’s severe convective storms research using the European Severe Weather Database (ESWD). Atmos. Res. 2009, 93, 575–586. [Google Scholar] [CrossRef] [Green Version]
  6. Coelho, L.P.; Leitão, P. Apontamento Sobre o Tornado Ocorrido em Vila do Conde no dia 21 de Abril de 1999 (Notes on the Tornado that Occurred in Vila do Conde on 21 April 1999); Technical Report; Departamento de Vigilância Meteorológica, Instituto de Meteorologia: Lisbon, Portugal, 2000; p. 12. (In Portuguese)
  7. Leitão, P. Tornadoes in Portugal. Atmos. Res. 2003, 67, 381–390. [Google Scholar] [CrossRef]
  8. Leitão, P. Episódio de tornados no Barlavento Algarvio 16 Novembro 2012-I (Tornado episodes in western Algarve on 16 November 2012-I). In Proceedings of the 8° Simpósio de Meteorologia e Geofísica da APMG/14° Encontro Luso-Espanhol de Meteorologia, Ericeira, Portugal, 18–20 March 2013. (In Portuguese). [Google Scholar]
  9. Leitão, P. Tornados Reportados em Portugal 2001 a 2010—Compilação de Dados (Tornado Reported in Portugal 2001 to 2010—Data Collection); Technical Report DivMV 05/2017; Instituto Português do Mar e da Atmosfera: Lisbon, Portugal, 2017. (In Portuguese)
  10. Leitão, P. Characteristics of tornadoes occurring in Portugal. In Proceedings of the 10° Simpósio de Meteorologia e Geofísica da APMG 18° Encontro Luso-Espanhol de Meteorologia, Lisboa, Portugal, 20–22 March 2017. [Google Scholar]
  11. Pinto, P. Avaliação de Modelo Conceptual de linha de borrasca com recurso ao campo da reflectividade-radar: Um estudo diagnóstico (Evaluation of the squall conceptual model using radar reflectivity: A case-study). In Proceedings of the 2° Simpósio de Meteorologia e Geofísica da APMG, 3° Encontro Luso Espanhol de Meteorologia, Évora, Portugal, 12–15 February 2001. (In Portuguese). [Google Scholar]
  12. Pinto, P. Episódios de vento forte sub sinóptico em Portugal continental: Caracterização com observações radar (Sub-synoptic scale strong wind events in mainland Portugal: Characterization with radar observation). In Proceedings of the 4° Simpósio de Meteorologia e Geofísica da APMG, 6° Encontro Luso-Espanhol de Meteorologia, Sesimbra, Portugal, 14–17 February 2005. (In Portuguese). [Google Scholar]
  13. Pinto, P. Episódio de tornadoes no Barlavento Algarvio 16 Novembro 2012-II (Tornado episodes in western Algarve on 16 November 2012-II). In Proceedings of the 8° Simpósio de Meteorologia e Geofísica da APMG/14° Encontro Luso-Espanhol de Meteorologia, Ericeira, Portugal, 18–20 March 2013. (In Portuguese). [Google Scholar]
  14. Agee, E.; Jones, E. Proposed conceptual taxonomy for proper identification and classification of Tornado Events. Weather Forecast. 2009, 24, 609–617. [Google Scholar] [CrossRef]
  15. Agee, E.M. A revised tornado definition and changes in tornado taxonomy. Weather Forecast. 2014, 29, 1256–1258. [Google Scholar] [CrossRef]
  16. Belo-Pereira, M.; Andrade, C.; Pinto, P. A long-lived tornado on 7 December 2010 in mainland Portugal. Atmos. Res. 2017, 185, 202–215. [Google Scholar] [CrossRef]
  17. Clark, M.R. Doppler radar observations of mesovortices within a cool-season tornadic squall line over the UK. Atmos. Res. 2011, 100, 749–764. [Google Scholar] [CrossRef]
  18. Meteorology Glossary. Available online: http://glossary.ametsoc.org/wiki/Tornado (accessed on 15 April 2020).
  19. Leitão, P.; Duarte, J.E. Recolha de Dados de Campo do Tornado Ocorrido a 20 de Outubro de 2002 em Ferreira do Alentejo (Field Survey on the Tornado of 20 October 2002, in Ferreira do Alentejo); Relatório VAP 06/2003; Instituto de Meteorologia: Lisbon, Portugal, 2003. (In Portuguese) [Google Scholar]
  20. Pinto, P.; Leitão, P. Tornado de Porto Covo, Cercal 25 de Fevereiro (Porto Covo Tornado, Cercal, 25 February); Relatório da Missão DVM/DOR; Instituto de Meteorologia: Lisbon, Portugal, 2006. (In Portuguese) [Google Scholar]
  21. Pinto, P.; Viegas, T. Tornado de Alcanena, Santarém, 9 de Abril de 2008 (Alcanena Tornado, Santarém); Relatório da Missão DOR; Instituto de Meteorologia: Lisbon, Portugal, 2008. (In Portuguese) [Google Scholar]
  22. Leitão, P.; Pinto, P. Tornado de Póvoa e Meadas, Portalegre 9 Abril de 2008 (Póvoa e Meadas Tornado, Portalegre, 9 April 2008); Relatório da Missão DVM/DOR; Instituto de Meteorologia: Lisbon, Portugal, 2008. (In Portuguese) [Google Scholar]
  23. Pinto, P.; Leitão, P. Tornado de Tomar, 7 Dezembro 2010 (Tomar Tornado, 7 December 2010); Relatório Técnico DORE/DVIP; Instituto de Meteorologia: Lisbon, Portugal, 2010. (In Portuguese) [Google Scholar]
  24. Pinto, P.; Leitão, P. Tornado de Silves—16 novembro 2012 (Silves Tornado—16 November 2012); Relatório Técnico DORE/DVIP, nov/2012; Instituto Português do Mar e da Atmosfera: Lisbon, Portugal, 2012. (In Portuguese)
  25. Leitão, P. Tornados Ocorridos no Algarve no Dia 16 Novembro 2012 (Tornadoes Occurred in the Algarve 16 November 2012); Relatório DivMV 02/2013; Instituto Português do Mar e da Atmosfera: Lisbon, Portugal, 2013. (In Portuguese)
  26. Bunting, W.F.; Smith, B.E. A Guide for Conducting Convective Windstorms Surveys NOAA; Technical Memorandum NWS SR146; Scientific Services Division: Fort Worth, TX, USA, 1993; p. 44. [Google Scholar]
  27. Nunes, L.F. Relatório da Missão Oficial a S. Domingos da Serra (Santiago do Cacém) (Official report to S. Domingos da Serra (Santiago do Cacém)); Technical Report; Departamento de Observação e Redes, Instituto de Meteorologia: Lisbon, Portugal, 1996. (In Portuguese) [Google Scholar]
  28. Elsom, D.M. Tornadoes in Britain: Where, When, and how often. J. Meteorol. 1985, 10, 203–211. [Google Scholar]
  29. Larry, J.; Tanner, P.E. Tornado damage in Tuscaloosa, Alabama December 16, 2000. Wind Science and Engineering Research Center; Texas Tech University: Lubbock, TX, USA, 2001. [Google Scholar]
  30. Fujita, T.T. Tornadoes and downbursts in the context of generalized planetary scales. J. Atmos. Sci. 1981, 38, 1511–1534. [Google Scholar] [CrossRef] [Green Version]
  31. Waldteufel, P.H. Corbin on the analysis of single Doppler radar data. J. Appl. Meteor. 1979, 18, 532–542. [Google Scholar] [CrossRef]
  32. Browning, K.A. The structure and mechanisms of hailstorms. In Hail: A Review of Hail Science and Hail Suppression; Meteorological Monographs; Springer: New York, NY, USA, 1977; pp. 1–43. [Google Scholar]
  33. Doswell, C.A.; Brooks, H.E.; Maddox, R.A. Flash flood forecasting: An ingredients-based methodology. Weather Forecast. 1996, 11, 560–581. [Google Scholar] [CrossRef]
  34. Doswell, C.A., III. What is a supercell? In Proceedings of the 18th AMS Conference Severe Local Storms, San Francisco, CA, USA, 19–23 February 1996; p. 641. [Google Scholar]
  35. Glickman, T.S. Hook Echo. In Glossary of Meteorology, 2nd ed.; American Meteorological Society: Boston, MA, USA, 2000; ISBN 978-1-878220-34-9. [Google Scholar]
  36. Meteorology Glossary. Available online: http://glossary.ametsoc.org/wiki/Bounded_weak_echo_region (accessed on 15 April 2020).
  37. Wallace, J.M.; Hobbs, P.V. Atmospheric Science an Introductory Survey, 2nd ed.; Academic Press: Cambridge, MA, USA, 2006; p. 483. [Google Scholar]
  38. Bunkers, M.J.; Hjelmfelt, M.R.; Smith, P. An Observational Examination of Long-Lived Supercells. Part I: Characteristics, Evolution, and Demise. Weather Forecast. 2006, 21, 673–688. [Google Scholar] [CrossRef]
  39. Davies, J.M. Small Tornadic Supercells in the Central Plains. In Proceedings of the 17th Conference Severe Local Storms, St. Louis, MO, USA, 4–8 October 1993; pp. 305–309. [Google Scholar]
  40. Weisman, M.L.; Davis, C.A. Mechanisms for the generation of mesoscale vortices within quasi-linear convective systems. J. Atmos. Sci. 1998, 55, 2603–2622. [Google Scholar] [CrossRef] [Green Version]
  41. Smith, B.T.; Thompson, R.L.; Grams, J.S.; Broyles, C. Convective modes for significant severe thunderstorms in the contiguous United States. Weather Forecast. 2012, 27, 1114–1135. [Google Scholar] [CrossRef] [Green Version]
  42. Atkins, N.T.; Laurent, M.S. Bow Echo Mesovortices. Part I: Processes That Influence Their Damaging Potential. Mon. Weather Rev. 2009, 137, 1497–1513. [Google Scholar] [CrossRef]
  43. Atkins, N.T.; Laurent, M.S. Bow Echo Mesovortices. Part II: Their Genesis. Mon. Weather Rev. 2009, 37, 1514–1532. [Google Scholar] [CrossRef] [Green Version]
  44. Fujita, T.T. Manual of Downburst Identification for Project NIMROD; Satellite and Mesometeorology Research Paper 156; Department of Geophysical Sciences, University of Chicago: Chicago, IL, USA, 1978; p. 104. [Google Scholar]
  45. Russell, L.P.; Gerard, A.E. “Bookend Vortex” Induced Tornadoes along the Natchez Trace. Weather Forecast. 1997, 12, 572–580. [Google Scholar]
  46. Estofex: European Storm Forecast Experiment. Available online: http://www.estofex.org/guide/ (accessed on 19 April 2020).
  47. Thompson, R.L.; Edwards, R.; Hart, J.A.; Elmore, K.L.; Markowski, P. Close proximity soundings within supercell environments obtained from the rapid update cycle. Weather Forecast. 2003, 18, 1243–1261. [Google Scholar] [CrossRef] [Green Version]
  48. Dupilka, M.L.; Reuter, G.W. Composite soundings associated with severe and tornadic thunderstorms in Central Alberta. Atmos. Ocean 2011, 49, 269–278. [Google Scholar] [CrossRef]
  49. Brooks, H.E.; Doswell, C.A.; Cooper, J. On the environments of tornadic and nontornadic mesocyclones. Weather Forecast. 1994, 9, 606–618. [Google Scholar] [CrossRef] [Green Version]
  50. Monteverdi, J.P.; Doswell, C.A.; Lipari, G.S. Shear Parameter Thresholds for Forecasting Tornadic Thunderstorms in Northern and Central California. Weather Forecast. 2003, 18, 357–370. [Google Scholar] [CrossRef] [Green Version]
  51. Pinto, P.; Henriques, D.; Oliveira, B.; Vargas, L.; Rego, B. Tornado de Santa Maria, Açores, 23 Janeiro 2016 (Santa Maria tornado, Azores, 23 January 2016); Technical Report DivMV-DRA 01/2016; Instituto Português do Mar e da Atmosfera: Lisbon, Portugal, 2016. (In Portuguese)
  52. Nolan, R.H. A radar pattern associated with tornadoes. Bull. Am. Meteor. Soc. 1959, 40, 277–279. [Google Scholar] [CrossRef] [Green Version]
  53. Wakimoto, R.M.; Bosart, B.L. Airborne radar observations of a cold front during FASTEX. Mon. Weather Rev. 2000, 128, 2447–2470. [Google Scholar] [CrossRef]
  54. Gayà, M. Tornadoes and severe storms in Spain. Atmos. Res. 2011, 100, 334–343. [Google Scholar] [CrossRef]
Figure 1. Geographical distribution and intensity of 184 reported tornadoes in mainland Portugal and over the sea near the coast (until 1 January 2020).
Atmosphere 11 00679 g001
Figure 2. Fujita scale intensity distribution of 141 reported tornadoes (until 1 January 2020).
Atmosphere 11 00679 g002
Figure 3. Path length distribution of 121 reported tornadoes (until 1 January 2020).
Atmosphere 11 00679 g003
Figure 4. Distribution of 179 reported tornadoes per month (until 1 January 2020).
Atmosphere 11 00679 g004
Figure 5. Distribution of 142 tornadoes per year (1 January 2001–1 January 2020). Includes 106 events with classified intensity (Fujita scale), 8 unclassified events over land, and 28 events over the sea.
Atmosphere 11 00679 g005
Figure 6. Annual spatial distribution of tornado events per 10,000 km2 in mainland Portugal (1 January 2001–1 January 2020) includes 114 events over land. Density was computed by dividing the number of events within 50 km-radius of a point, by the corresponding surface area. Contours of 0.1, 0.4, and 0.6 tornadoes per 10,000 km2 and per year are represented, as well as main towns (black dots; highlighted B-Beja, E-Évora, L-Lisbon, P-Porto). Orography in the background (shades for elevations 0–300 in light green, 300–600 in light brown, and above 800 m in dark brown).
Atmosphere 11 00679 g006
Figure 7. Distribution of TT (Tornado Types) versus intensity in Portugal (1 January 2006–1 January 2020) following the tornado taxonomy [15] includes 86 events with classified intensity (Fujita scale) and 34 unclassified events (both over water and over land).
Atmosphere 11 00679 g007
Figure 8. Distribution of TT versus path length in Portugal (1 January 2006–1 January 2020) following the tornado taxonomy [15] includes 86 events with classified intensity (Fujita scale) and 34 unclassified events (both over water and over land).
Atmosphere 11 00679 g008
Figure 9. Distribution of TT versus month in Portugal (1 January 2006–1 January 2020) following the tornado taxonomy [15] includes 86 events with classified intensity (Fujita scale) and 34 unclassified events (both over water and over land).
Atmosphere 11 00679 g009
Figure 10. Left: Mean sea level pressure (solid contours, 4 hPa intervals) and 10 m wind (barbs) of ECMWF (European Centre for Medium Range Weather Forecasts) model short term forecast (H + 12) at 12 UTC. Right: Geopotential height (solid contours, 4 dam intervals), temperature (color code, ⁰C), and wind (barbs) at 500 hPa of ECMWF model short term forecast (H + 12) at 12 UTC. 16 November 2012. Red spot over the southern coast of Portugal indicates where the tornado occurred.
Atmosphere 11 00679 g010
Figure 11. Left: Pseudo wet-bulb potential temperature (at 850 hPa) (color shade, 2 °C intervals) of ECMWF model short term forecast (H+12) at 12 UTC. Right: Isotachs of wind (color code above 60 kt, 15 kt intervals) and wind (barbs) at 300 hPa of ECMWF model short term forecast (H + 12), at 12 UTC. 16 November 2012. Red spot over the southern coast of Portugal indicates where the tornado occurred.
Atmosphere 11 00679 g011
Figure 12. Tephigram chart profile extracted from the ECMWF model levels, short term forecast (H + 12), to the coordinates 37.0189° N, 7.8955° W (Faro, 8 m a.m.s.l.), for 16 November 2012, at 12 UTC. MUCAPE (Most Unstable Convective Available Potential Energy) and TPW (Total Precipitable Water) are indicated on top. Dry bulb air temperature (blue curve), dew point temperature (green curve), parcel trajectory (black curve), pseudo wet-bulb potential temperature (dashed red), and wet-bulb temperature (dashed purple) are represented. Horizontal wind barbs are also represented in the vertical. LCL (Lifted Condensation Level) indicated.
Atmosphere 11 00679 g012
Figure 13. PPI (Plane Position Indicator) of SRV (storm relative velocity, m/s), 0.1° tilt for 13:16 UTC (a) and 13:46 UTC (b). PPI of SRV, 10.0° tilt for 13:48 UTC (c) and PPI of reflectivity (Z, dBZ), 0.1° tilt for 13:36 UTC (d). 16 November 2012. Mesocyclone signature depicted by circles, tornado damage path marked with dashed line (30 km extension). Hook signature, rear flank downdraft area (RDF), forward flank downdraft area (FFD), and bounded weak echo region (BWER) are marked. Radar is 20 km to the east (a).
Atmosphere 11 00679 g013
Figure 14. Left: Mean sea level pressure (solid contours, 4 hPa intervals) and pseudo wet-bulb potential temperature (at 850 hPa) (color shade, 2 °C intervals) of ECMWF model short term forecast (H + 06), at 06 UTC. Right: Isotachs of wind (color code above 60 kt, 15 kt intervals) and wind (barbs) at 300 hPa of ECMWF model short term forecast (H + 06), at 06 UTC. 10 April 2016. Red spot over northwestern coast of Portugal indicates tornado area.
Atmosphere 11 00679 g014
Figure 15. Left: Total precipitable water content (color code, 2.5 mm intervals) of ECMWF model short term forecast (H + 06), at 06 UTC. Right: Vertical wind speed at 850 hPa (color code, Pa s−1) of ECMWF model short term forecast (H + 06), at 06 UTC. 10 April 2016. Red (left) or white (right) spot over northwestern coast of Portugal indicates tornado area.
Atmosphere 11 00679 g015
Figure 16. Tephigram chart profile extracted from the ECMWF model levels, short term forecast (H + 06), to the coordinates 41.12° N, 9.20° W (25 km off the Portuguese coast), for 10 April 2016, at 06 UTC. MUCAPE, TPW, and the LCL altitude are indicated on top. Dry bulb air temperature (blue curve), dew point temperature (green curve), parcel trajectory (black curve), pseudo wet-bulb potential temperature (dashed red), and wet-bulb temperature (dashed purple) are represented. Horizontal wind barbs are also represented in the vertical.
Atmosphere 11 00679 g016
Table 1. Number of events validated after the phenomena footage or description or documented damage, and the number of events with effects data collected in site survey or reports, by period of time, for each region (mainland, Madeira, and Azores islands).
TornadoOver SeaOver Land
identification afterfootagedescriptionfootagedescriptiondamage
event data based onreportreportsurveyreportsurveyreportsurveyreport
mainland until 2000021419223
mainland 2001–20109328814419
mainland 2011–201916021149924
Madeira 2001–201020000000
Madeira 2011–201930000000
Azores 2001–201010000000
Azores 2011–201930100010
Total (195 events)34562313321666

