1. Introduction
The non-sphericity of raindrops and the periodic change in their shape during gravitational fall in the atmosphere have been known for a very long time. These phenomena have a significant effect on the scattering of optical and microwave radiation; therefore, they are very important for interpreting remote sensing data and in calculating the processes of scattering and propagation of radio waves in precipitation [
1]. However, the shape of the falling drops and the amplitude of their oscillations are still the subject of research. A detailed review of studies of the average shape of falling raindrops and oscillations arising at the droplets was carried out in [
2,
3]. Despite dozens of studies in this direction, questions about the mode structure of oscillations and the amplitudes of oscillations at various modes are still open. There is no ambiguity in understanding the mechanisms of excitation of oscillations. It is known that fluctuations can be caused by wind gusts, turbulence, collisions, and coagulation with other drops. In addition, falling droplets are blown around by the air flow, which leads to intense internal fluid movement inside the droplet itself and to the appearance of a turbulent wake, which also affects the droplet. But the relationship between the amplitude of the vibration of the droplets and the intensity of turbulence, the intensity of precipitation and the processes of coagulation and destruction of the droplets is still not well understood. The listed processes are nonlinear and complex. Given the high sensitivity of the droplet shape to any influences, it is not difficult to imagine the complexity of the described phenomena. The difficulty of studying the microphysics of raindrops has an explanation. To observe the raindrop, it is best to fly next to it and record everything that happens during its fall. In this case, one should not disturb the surrounding space. So far it has not been possible to do so. However, without detailed information on the shape of the rain drops, on the mode structure of oscillations, on the quality factor of oscillations, it is difficult to calculate the structure of the scattered electromagnetic signal and its polarization and spectral characteristics. Without solving these issues, it is difficult to increase the accuracy of determining precipitation parameters from remote sensing data, both in the microwave and in the optical wavelength ranges.
As a rule, studies of the shape of falling water droplets were carried out by photographing them using a flash lamp in vertical shafts [
4], or wind tunnels [
3,
5,
6]. This technique made it possible to obtain an instant photograph of a drop at one point in time or a series of photographs when using a high-speed video camera. In this case, measurements both in shafts and in wind tunnels were carried out with artificial drops of water. At the same time, there were no such possible sources of disturbances as turbulence, wind gusts, collisions of drops in the process of gravitational fall. A number of studies of the shape of artificial and raindrops were carried out using two-dimensional video disdrometers both on the ground [
3,
7,
8] and on board the aircraft [
9]. A common drawback of this method was the fact that it was not possible to track the drop over a long period of time. So, registration of an almost spherical drop in the image did not mean at all that the drop did not fluctuate, because at the time of flash or registration on the matrix, it could pass through the equilibrium phase. An interesting method for measuring raindrops under natural conditions was proposed in [
10]. It was possible to obtain a series of images of small drops using a high-frequency strobe.
This review describes a series of studies aimed at developing a new method for measuring the microphysics of raindrops under field conditions. As a result of the work carried out, it was possible to create methods for tracking natural rain drops over relatively long periods of time. In this case, it turned out to be possible to register the volume of each drop, the average shape of the drop, the oscillation frequency, mode and amplitude of the oscillations. To a certain extent, a method has an analogy with the Wilson camera, which records the trace and properties of each particle in the collider. All these possibilities turned out to be associated with the effect of an abnormally high modulation of light scattered by oscillating drops, which was discovered by the author in laboratory studies. This effect was first used as far back as 1913 [
11], however, a detailed study of it, an explanation was possible only after 1986 [
12,
13,
14]. Based on the effect of an anomalously high modulation, a cycle of field measurements was carried out, which made it possible to solve some of the problems associated with studying the microstructure of rains, studying the dependence of the average shape and amplitude of oscillations on the size of the droplets. Field studies have shown that all raindrops are vibrating. The registration of the “instantaneous” microstructure in the rain made it possible to detect the collective effects of droplet size grouping, and the processes of particle clustering in space. A theoretical explanation of the effects of clustering and grouping of raindrops by size is presented. The impact of these collective effects on the radar methods of sensing precipitation is estimated.
This review also presents the results of work on calculating the influence of non-sphericity and oscillations of raindrops on the polarization of scattered microwave radiation in the Rayleigh approximation. Polarization coefficients that determine the dependence of the parallel and orthogonal components of the radar signal on the angle of rotation δ of the plane of polarization of the sounding radiation were obtained. It turned out that the choice of δ can almost nullify the contribution of the deformation and oscillations of the droplets to the radar signal and receive the signal the same as from spherical drops of equal volume. The polarization angles at which the contribution of nonsphericity to the radar signal are maximized are substantiated.
2. The Laboratory Study of the Optical Properties of Non-Spherical and Oscillating Drops
It is possible to study the microphysics of rains and the shape of oscillating raindrops in different wavelength ranges. However, it is obvious that in the microwave range the effect of vibration must have a scale comparable to the change in the dipole moment upon deformation of the droplet. The dipole moment is proportional to the particle size along the corresponding axis. Consequently, the contribution of the oscillations to the scattered microwave radiation is a few percent. In the optical range, one could expect a greater sensitivity of scattered light to the deformation of water droplets. Therefore, it was decided to study the deformation of the droplets under laboratory conditions in the visible wavelength range. To measure the scattering indicatrix of water droplets, it was decided to form droplets on a hydrophilic ring of thin wire and measure their scattering indicatrix. This decision turned out to be very fruitful; the water droplets on the hydrophilic ring were very stable; in order to shake them off, they had to be blown off by a very strong stream of air or very sharply shaken. The next research step was the excitation of natural capillary oscillations in a drop suspended on a ringlet. For this, the base of the ring was attached to the acoustic speaker diffuser so that the ring with a drop could oscillate in the vertical direction with any given amplitude and frequency. When the vibration frequency of the ring coincided with the natural vibration frequencies of the free drop, it came into resonance: the drop began to oscillate with an increased amplitude at one of the natural frequencies [
15].
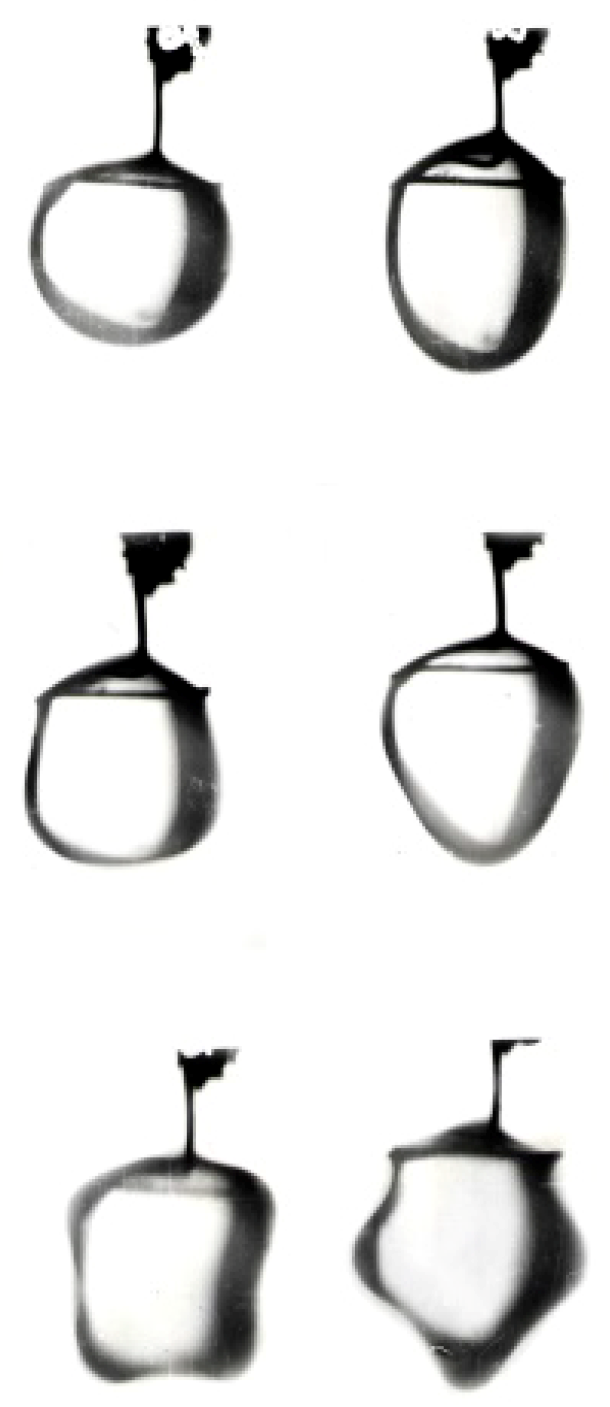
Figure 1 shows photographs of water droplets in the first three axisymmetric vibration modes. Photos on the left and right are taken in antiphase. To register the droplet shape in the photograph, it was highlighted with a strobe synchronized in frequency with the vibrations of the ringlet. It should be noted that no one has observed such drop shapes before our experiment (
Video S1, a video of the three modes of natural vibrations of a drop on a ringlet is presented at
http://www.sterlyadkin-v.ru/index13.html).
The upper row shows the droplet shape in the first fundamental mode of oscillation. In this case, the drop has either a flattened or elongated shape close to an ellipsoid of revolution. In the second mode, the drop in the cross section has the shape of a triangle, in the third mode, the quadrilateral, etc. This harmonic series is endless.
The resonant frequencies obtained in the laboratory experiment corresponded well with the theoretical value of the natural frequencies of the oscillations of a free drop. The theory of natural vibrations of a free drop was developed in the works of J. Rayleigh [
16] and Landau L.D. and Lifshits E.M. [
17]. For an almost spherical drop, the mode and shape of the oscillating drop is determined by Legendre polynomials, which depend on two numbers
n = 1,2,… and
l = 0, ± 1, ± 2,… ±
n. For an incompressible fluid, the first possible oscillation corresponds to n = 2, and for all axisymmetric modes,
l = 0. However, the oscillation frequencies are determined only by the number
n, are independent of the parameter
l (degenerate), and are described by the Rayleigh formula:
here n = 1,2,…; σ is the surface tension coefficient of the fluid, ρ is the fluid density, V = π × D
3 / 6 is the droplet volume, D is the equivalent drop diameter. The fundamental oscillation mode of an incompressible spherical drop has n = 2 and l = 0. With increasing droplet size, the frequency of the main mode decreases. For distilled water, the oscillation frequency of a droplet with a diameter of 1 mm in the fundamental mode is f = 340 Hz; for a droplet with a diameter of 6 mm, the oscillation frequency decreases to f = 23 Hz. Obviously, the dependence of the oscillation frequency on the diameter of the droplets can be used to remotely determine the microstructure of rains.
After we excited vibrations in a suspended drop with any given amplitude, it was quite natural to take a step in measuring the scattering indicatrix of the oscillating drop. Since the fundamental mode is predominantly excited in rains [
18], it was decided to study the scattering indicatrix on this mode. Given the axisymmetric shape of the droplets, it is customary to characterize its shape by the ratio of its vertical axis c to the horizontal axis a = b, this value γ = c / a is called the axes ratio.
When modulating the horizontal axis of the droplet by 1%, we expected that the modulation depth of the light scattered by the droplet would also be units of percent. But a surprise awaited us: at some scattering angles, the modulation depth was not percent, not tens of percent, but thousands of percent. An oscillating drop began to form bright flashes of scattered light, the amplitude of which was ten times higher than the scattering intensity of a stationary drop [
13].
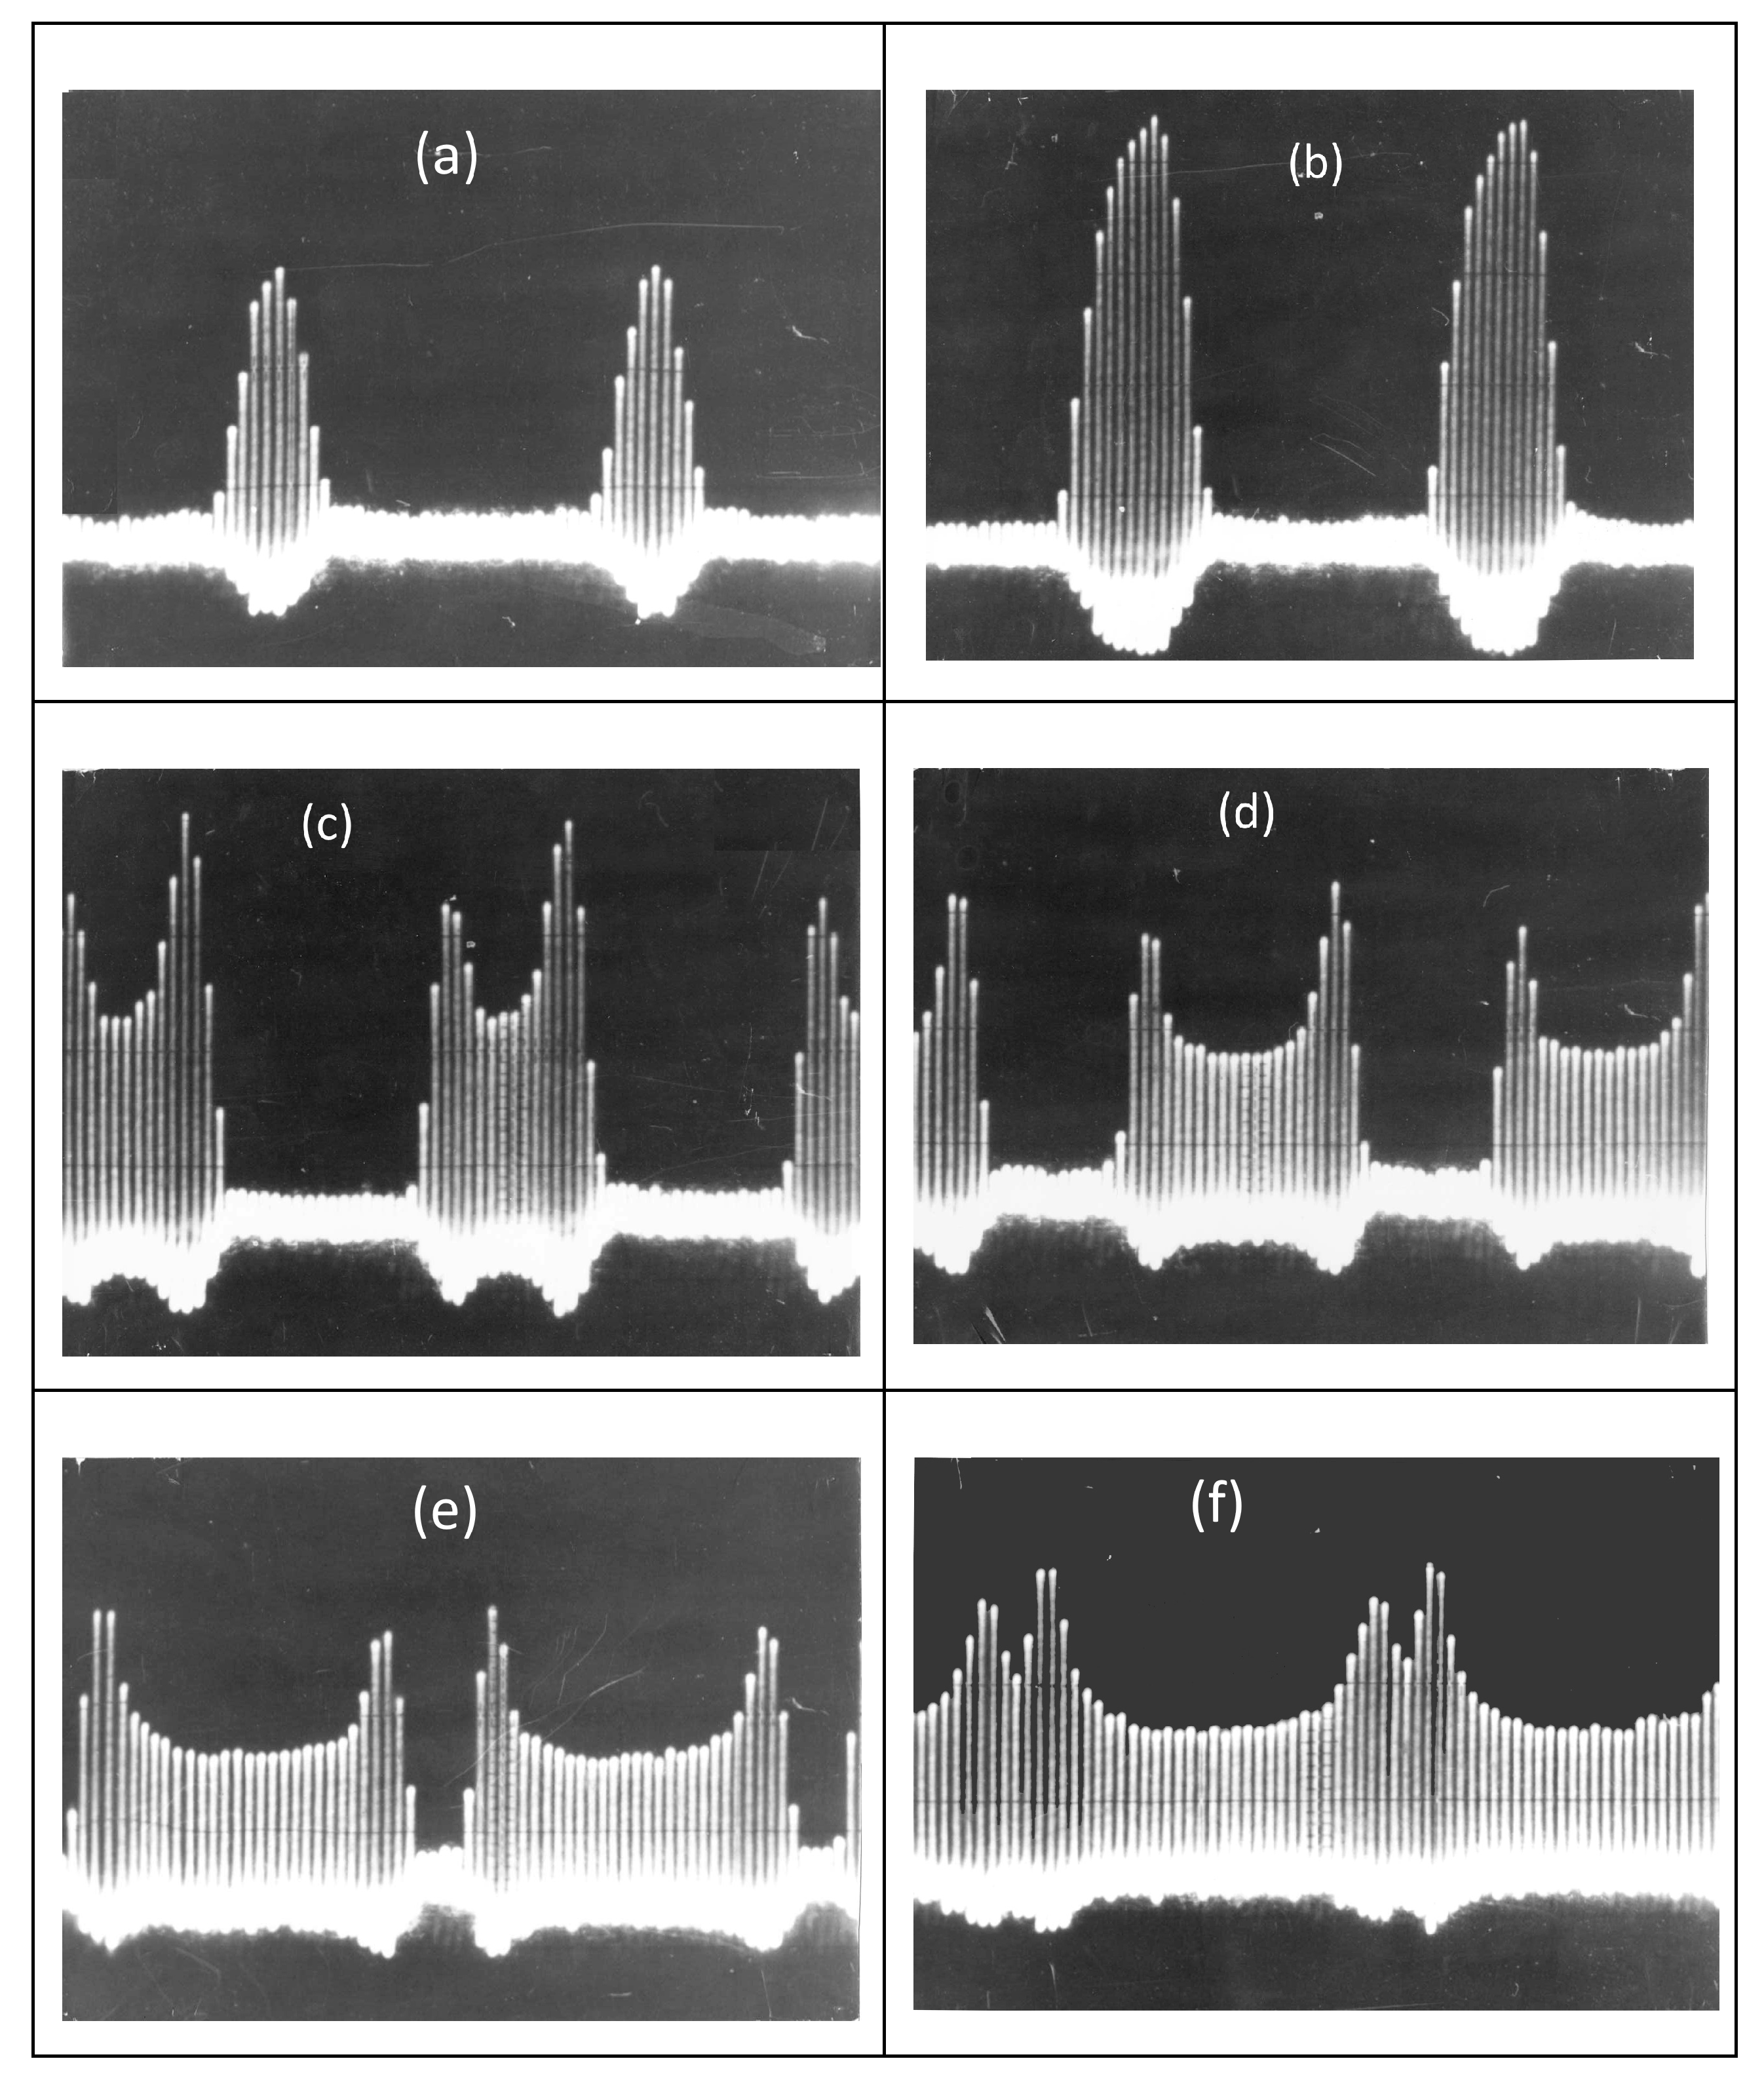
Figure 2 shows the oscillograms of pulses of scattered light at a strain amplitude Δγ = 0.045 and for different directions of the scattering angle θ. At an angle θ = 133°, powerful flashes of light began to appear against the background of weak scattered radiation from a stationary drop,
Figure 2a. With an increase in the scattering angle to θ = 134°, the amplitude of the flares increased,
Figure 2b, and exceeded the level of the constant signal by a factor of 10. A further increase in the scattering angle θ = 137° and θ = 138° led to the bifurcation of the shape of the flares and their broadening,
Figure 2c,d. Then the flashes began to merge,
Figure 2e,f. In a laboratory experiment, a drop was illuminated from bottom to top by modulated white light with a modulation frequency slightly different from the droplet oscillation frequency. The scattered radiation was recorded by a photo detector, which could rotate around the drop in a vertical plane, and the signal of the photo detector was fed to an oscilloscope. If the modulation frequency of the incident light coincided with the vibration frequency f, then the drop would be illuminated at the moment of passage of the same phase, and pulses of constant amplitude would be recorded on the oscillogram. When the frequencies were mismatched at Δf, the phase of the droplet oscillation at the moment of illumination by the next pulse slightly changed, and the amplitude of the pulse corresponded to scattering at the changed shape of the droplet. During N = f / Δf pulses, the phase of the droplet oscillation at the moment of illumination by pulses gradually rotated by 2π, prescribing a complete change in the scattered light during the period of vibration. This technique made it possible to simultaneously register both the constant and variable components of the signal scattered by a drop. Sometime after the experiments, it turned out that the discovered effect was intuitively used back in 1913 (Schmidt) when recording flashes of droplets in the sun’s rays as evidence of vibrations of raindrops. However, its detailed explanation and use for the analysis of microphysics was not carried out in that work. The effect was called an abnormally high modulation of light scattered by a vibrating drop. It was further shown that this effect allows measuring 5 micron oscillations of raindrops from a distance of 5–10 m. It is a powerful tool for remote sensing of rain microphysics.
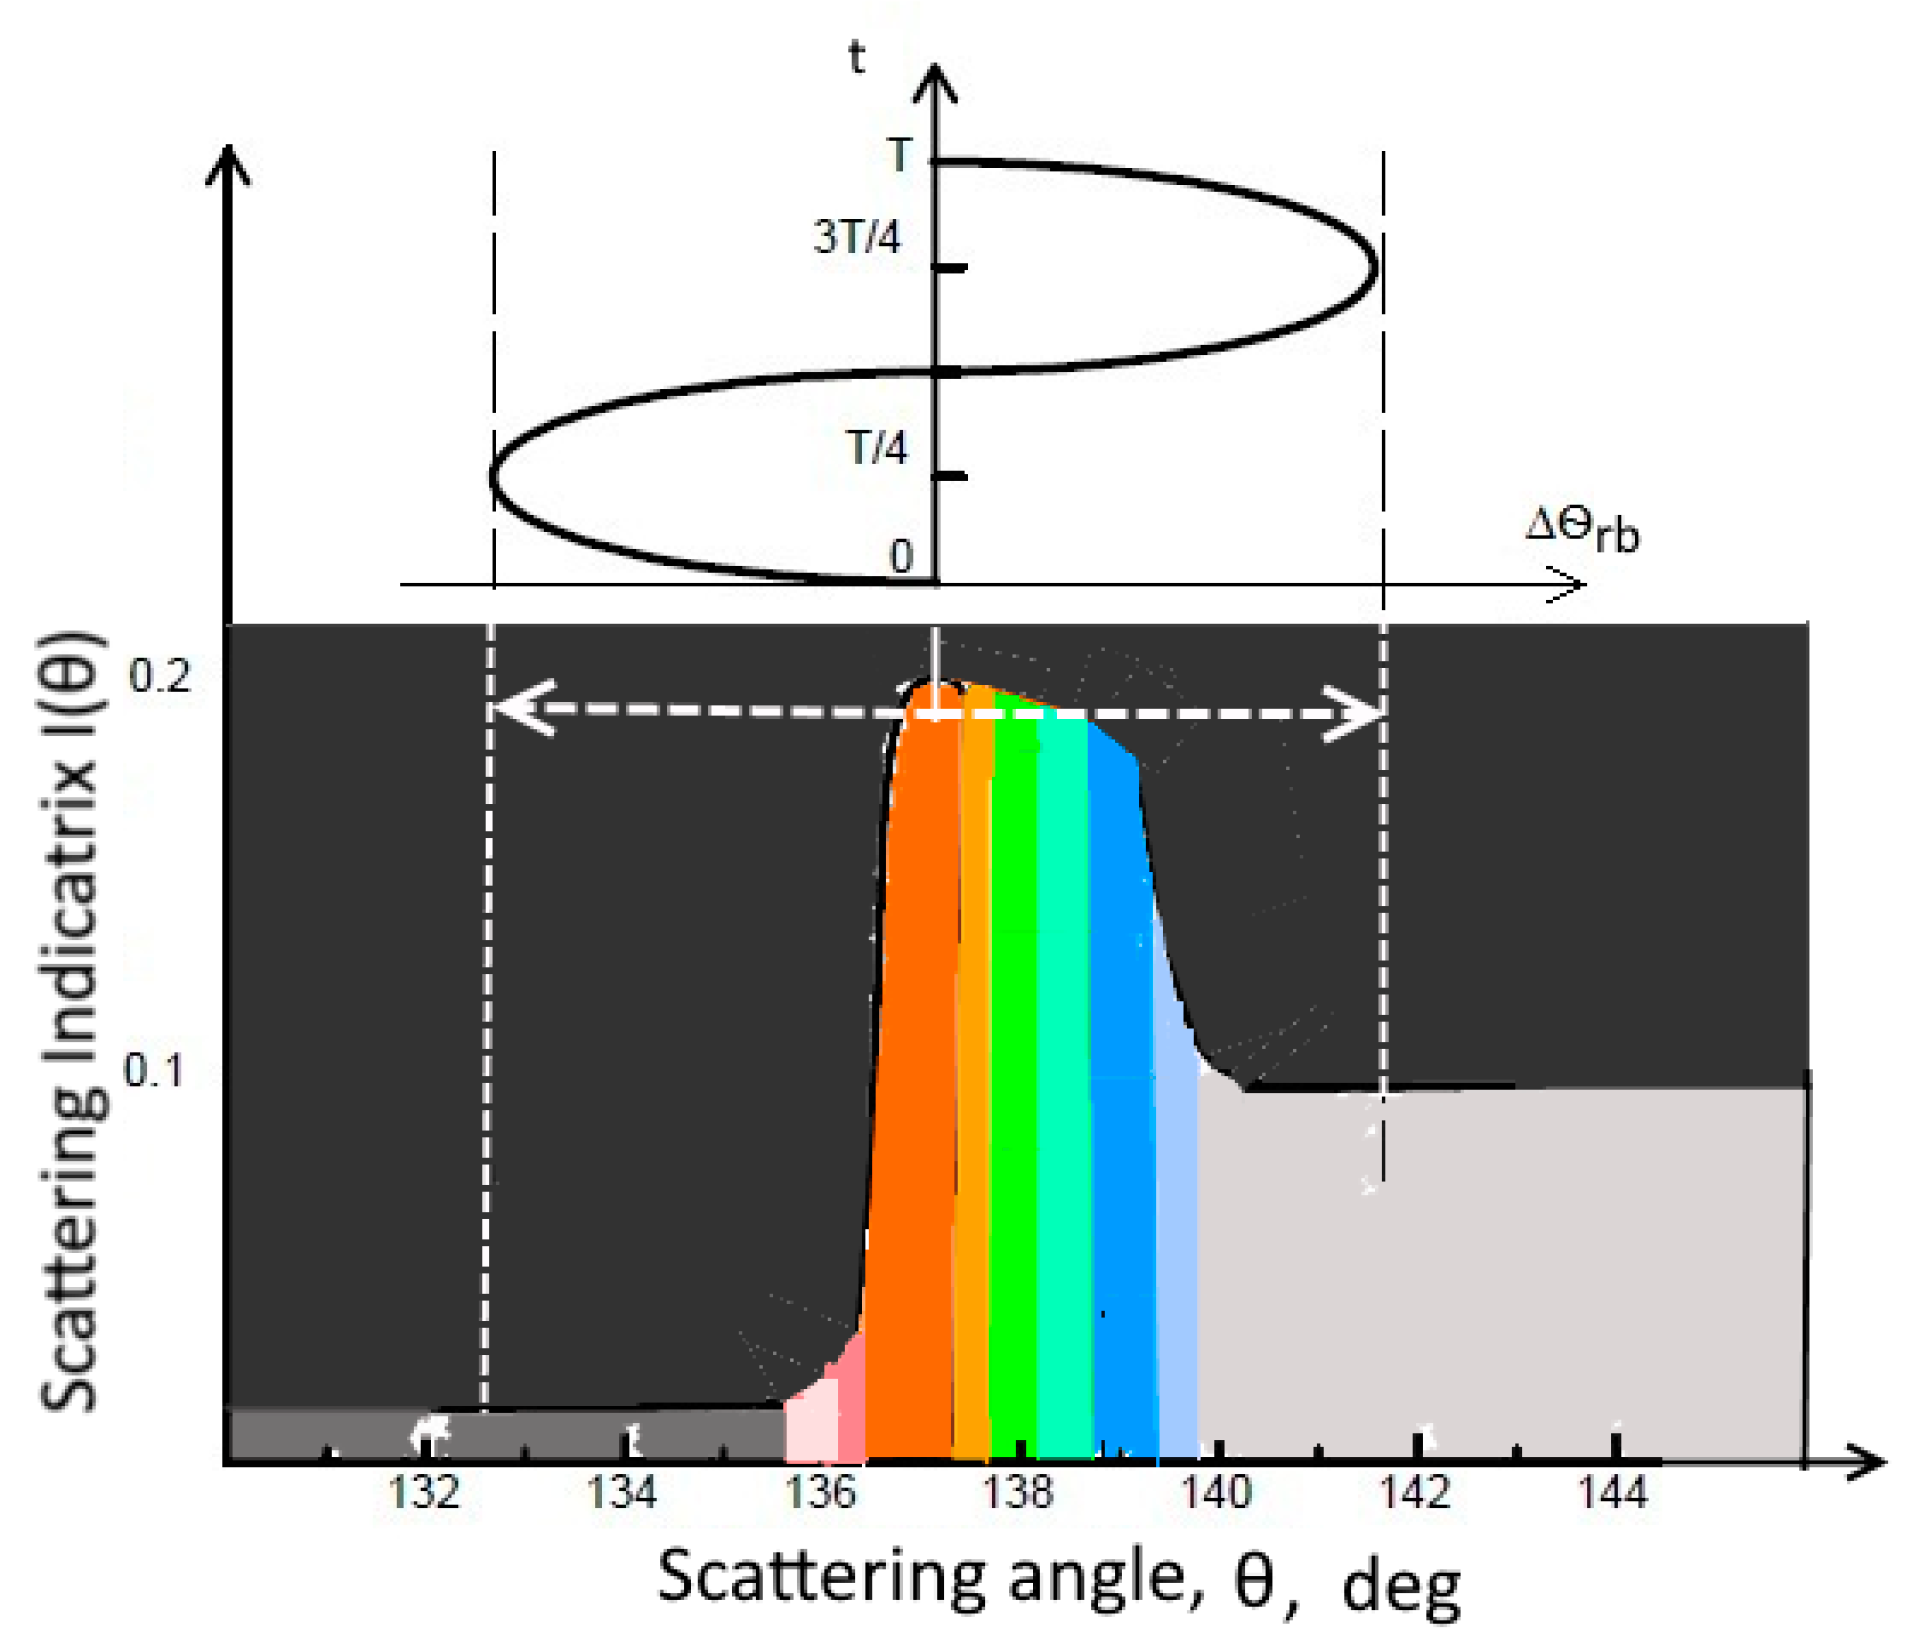
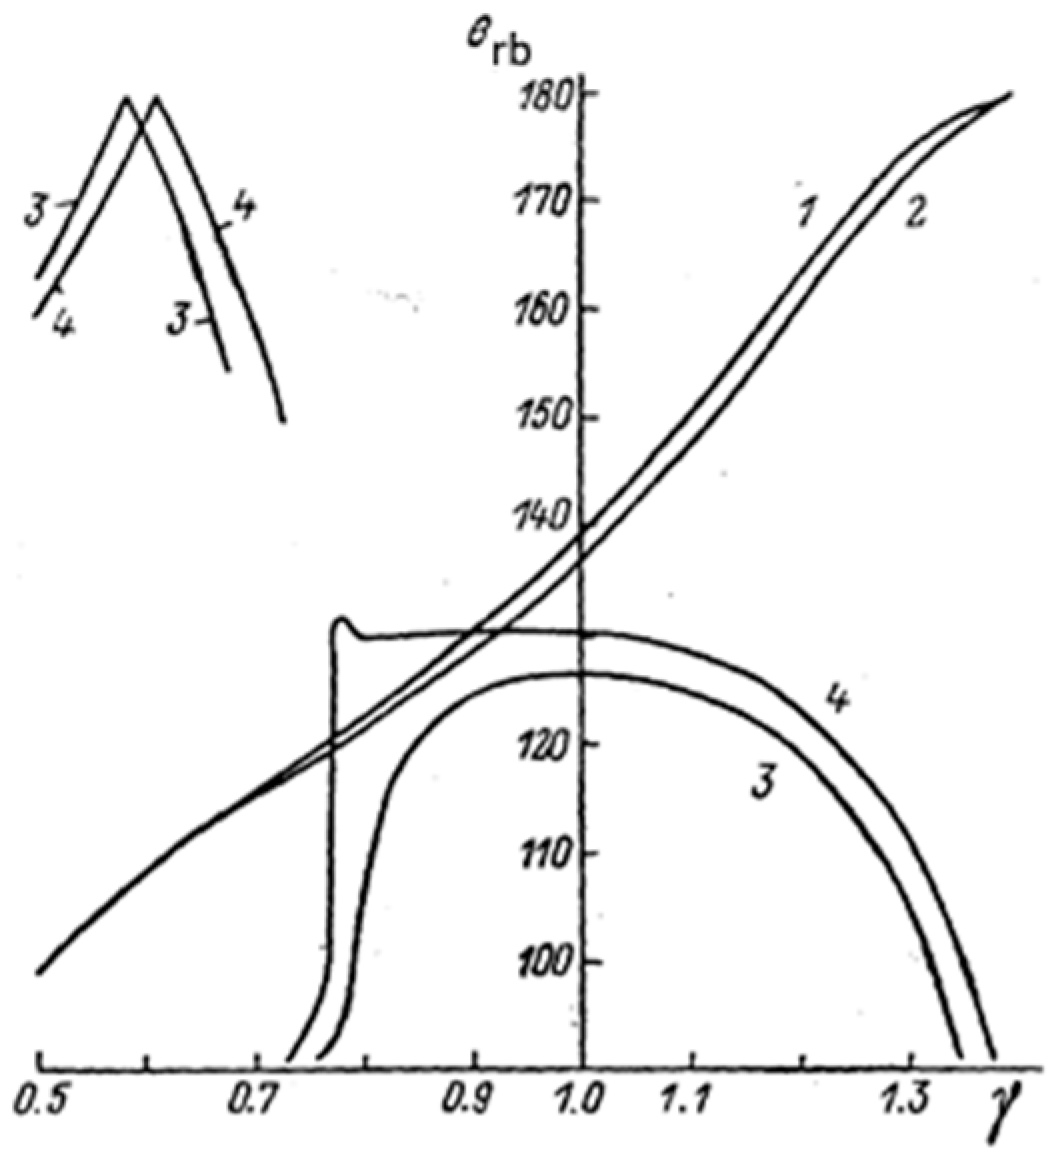
The explanation for the anomalously high modulation is that this effect occurs in the vicinity of the first-order rainbow in the range of angles 130–145° and is associated with a strong dependence of the angular position of the rainbow on the shape of the droplet [
3]. A rainbow is a local maximum on the scattering indicatrix, which, due to dispersion, is deployed into the spectrum,
Figure 3. In this case, one of the edges of the rainbow has a large slope of the scattering indicatrix dI (θ) /dθ. When the droplet oscillates even with a small amplitude Δγ = 0.045, (which corresponds to a change in the horizontal axis of the droplet Δa /a = 1.5%), the rainbow displacement amplitude is 4.5°. This is a very significant amount. The periodic shift of the rainbow during vibration of the droplet leads to the appearance of bright flashes of scattered light.
Indeed, it can be seen from
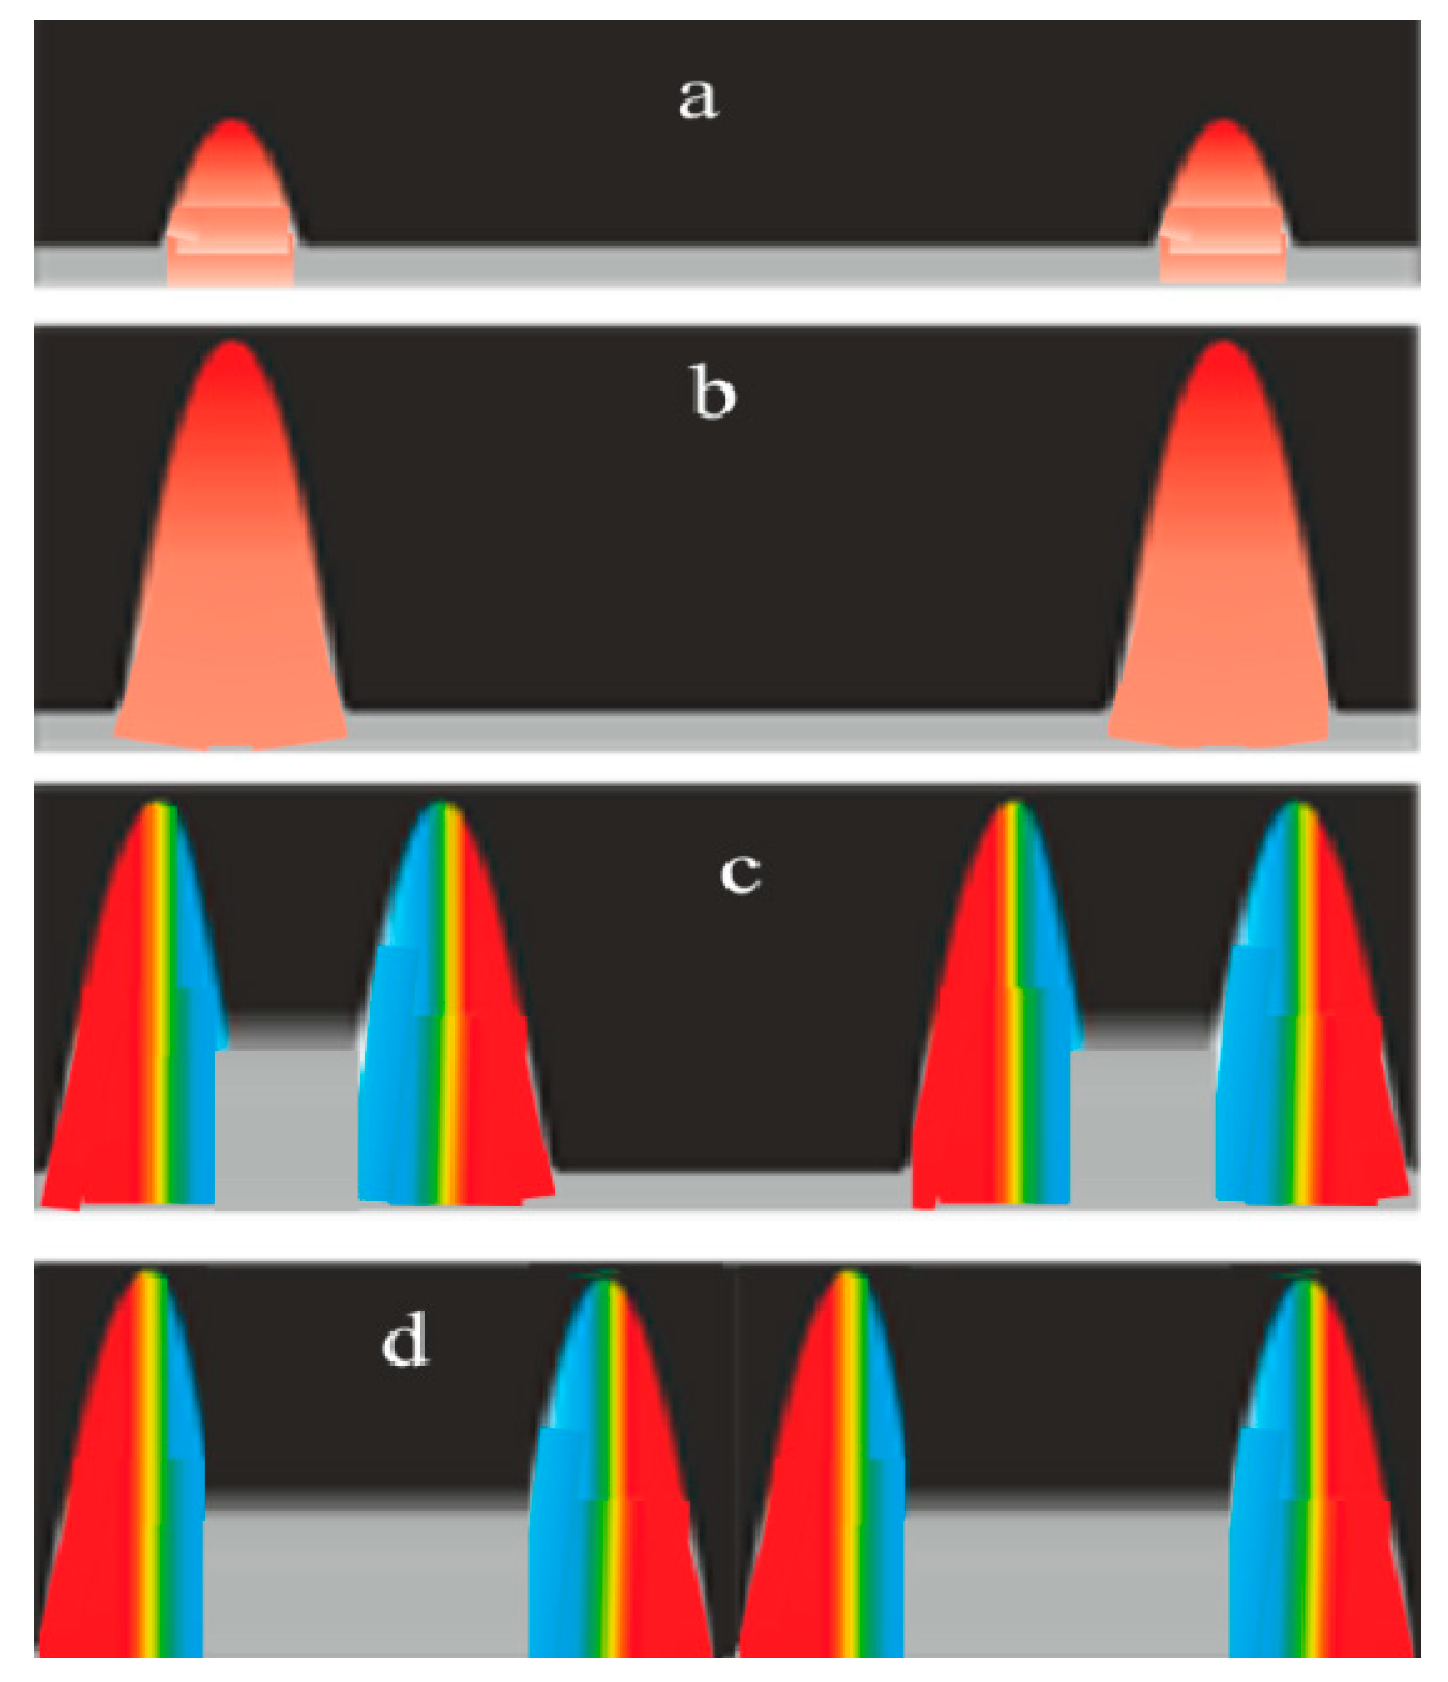
Figure 3 that if the observer is at a scattering angle θ = 132°, then the oscillating rainbow, the movement of which is shown by white arrows, will not reach him, and the drop will appear dark. At the angle of observation θ = 133°, the red edge of the rainbow will already partially come to the observer and a short red flash will appear,
Figure 4a. At an observation angle θ = 134°, the red part of the rainbow will be visible in full amplitude and the red flash will be longer in time,
Figure 4b. A further increase in the scattering angle leads to lengthening of the flares and their merging. This scheme of the formation of flares is fully consistent with the results of laboratory measurements, with the exception of the absence of color on the oscillograms.
3. Calculation of the Indicatrix of Scattering of Spheroidal Water Droplets
The scattering indicatrix of a spheroidal water droplet was calculated in the geometric optics approximation for the case when the wave vector of the incident light is directed along the axis of rotation of the ellipsoid [
14]. The results of calculating the angular position of the first and second order rainbows for the refractive indices n = 1.434 and 1.328 are shown in
Figure 5. At a water temperature of 20 °C, such n values correspond to radiation at wavelengths λ = 400 nm and 800 nm. First of all, we are interested in the behavior of a rainbow of the first order. It turned out that its angular position very much depends on the shape of a drop of water. Quadratic approximation of the angular position of the first order of rainbow deformation in the range 0.8 < γ < 1.2 gives the following relationship:
Here, the scattering angle is given in degrees, γ = c / a. The average rainbow displacement for white light can be approximated by the ratio:
Here, it is taken into account that for a small level of deformation of an incompressible spheroidal drop, in the first approximation, Δc = −2Δa, therefore, Δγ = −3Δa/a.
The obtained theoretical formulas are in good agreement with the results of laboratory measurements and demonstrate a very strong displacement of the first-order rainbow with even slight deformation of the drop. Obviously, with an average deformation of a flying drop, the angular position of the rainbow will shift in angle, and, in addition, the larger the amplitude of the oscillations, the larger the range of angles will be observed flashes of scattered light. This feature was used to study the average shape and amplitude of oscillations of raindrops in natural conditions.
4. Results of Field Measurements of the Average Shape and Oscillation Amplitude of Raindrops
The first field measurements fully confirmed both the existence of an anomalously high modulation of scattered optical radiation in rains and its high efficiency for studying the properties of liquid hydrometeors [
12]. The optical measurement scheme is shown in
Figure 6.
The droplets were illuminated from bottom to top by powerful collimated light of stable intensity, formed by two halogen incandescent lamps 1 and spherical mirrors with an aperture of 50 cm. Scattered radiation was recorded by camera 2 in the angle range 110° to 148°. Raindrops 5 were photographed at night using a camera with an exposure of 0.3 to 0.8 s, so that the paths of the drops crossed the entire photo. Initially, black-and-white camera roll was used, the base distance was about 3–5 m. In later studies, 10 megapixels camera and an additional strobe 3 were used, which made it possible to calibrate each trajectory in time. To conduct absolute angular calibration of the photograph, a calibration cable 4 with height marks was pulled next to the beam.
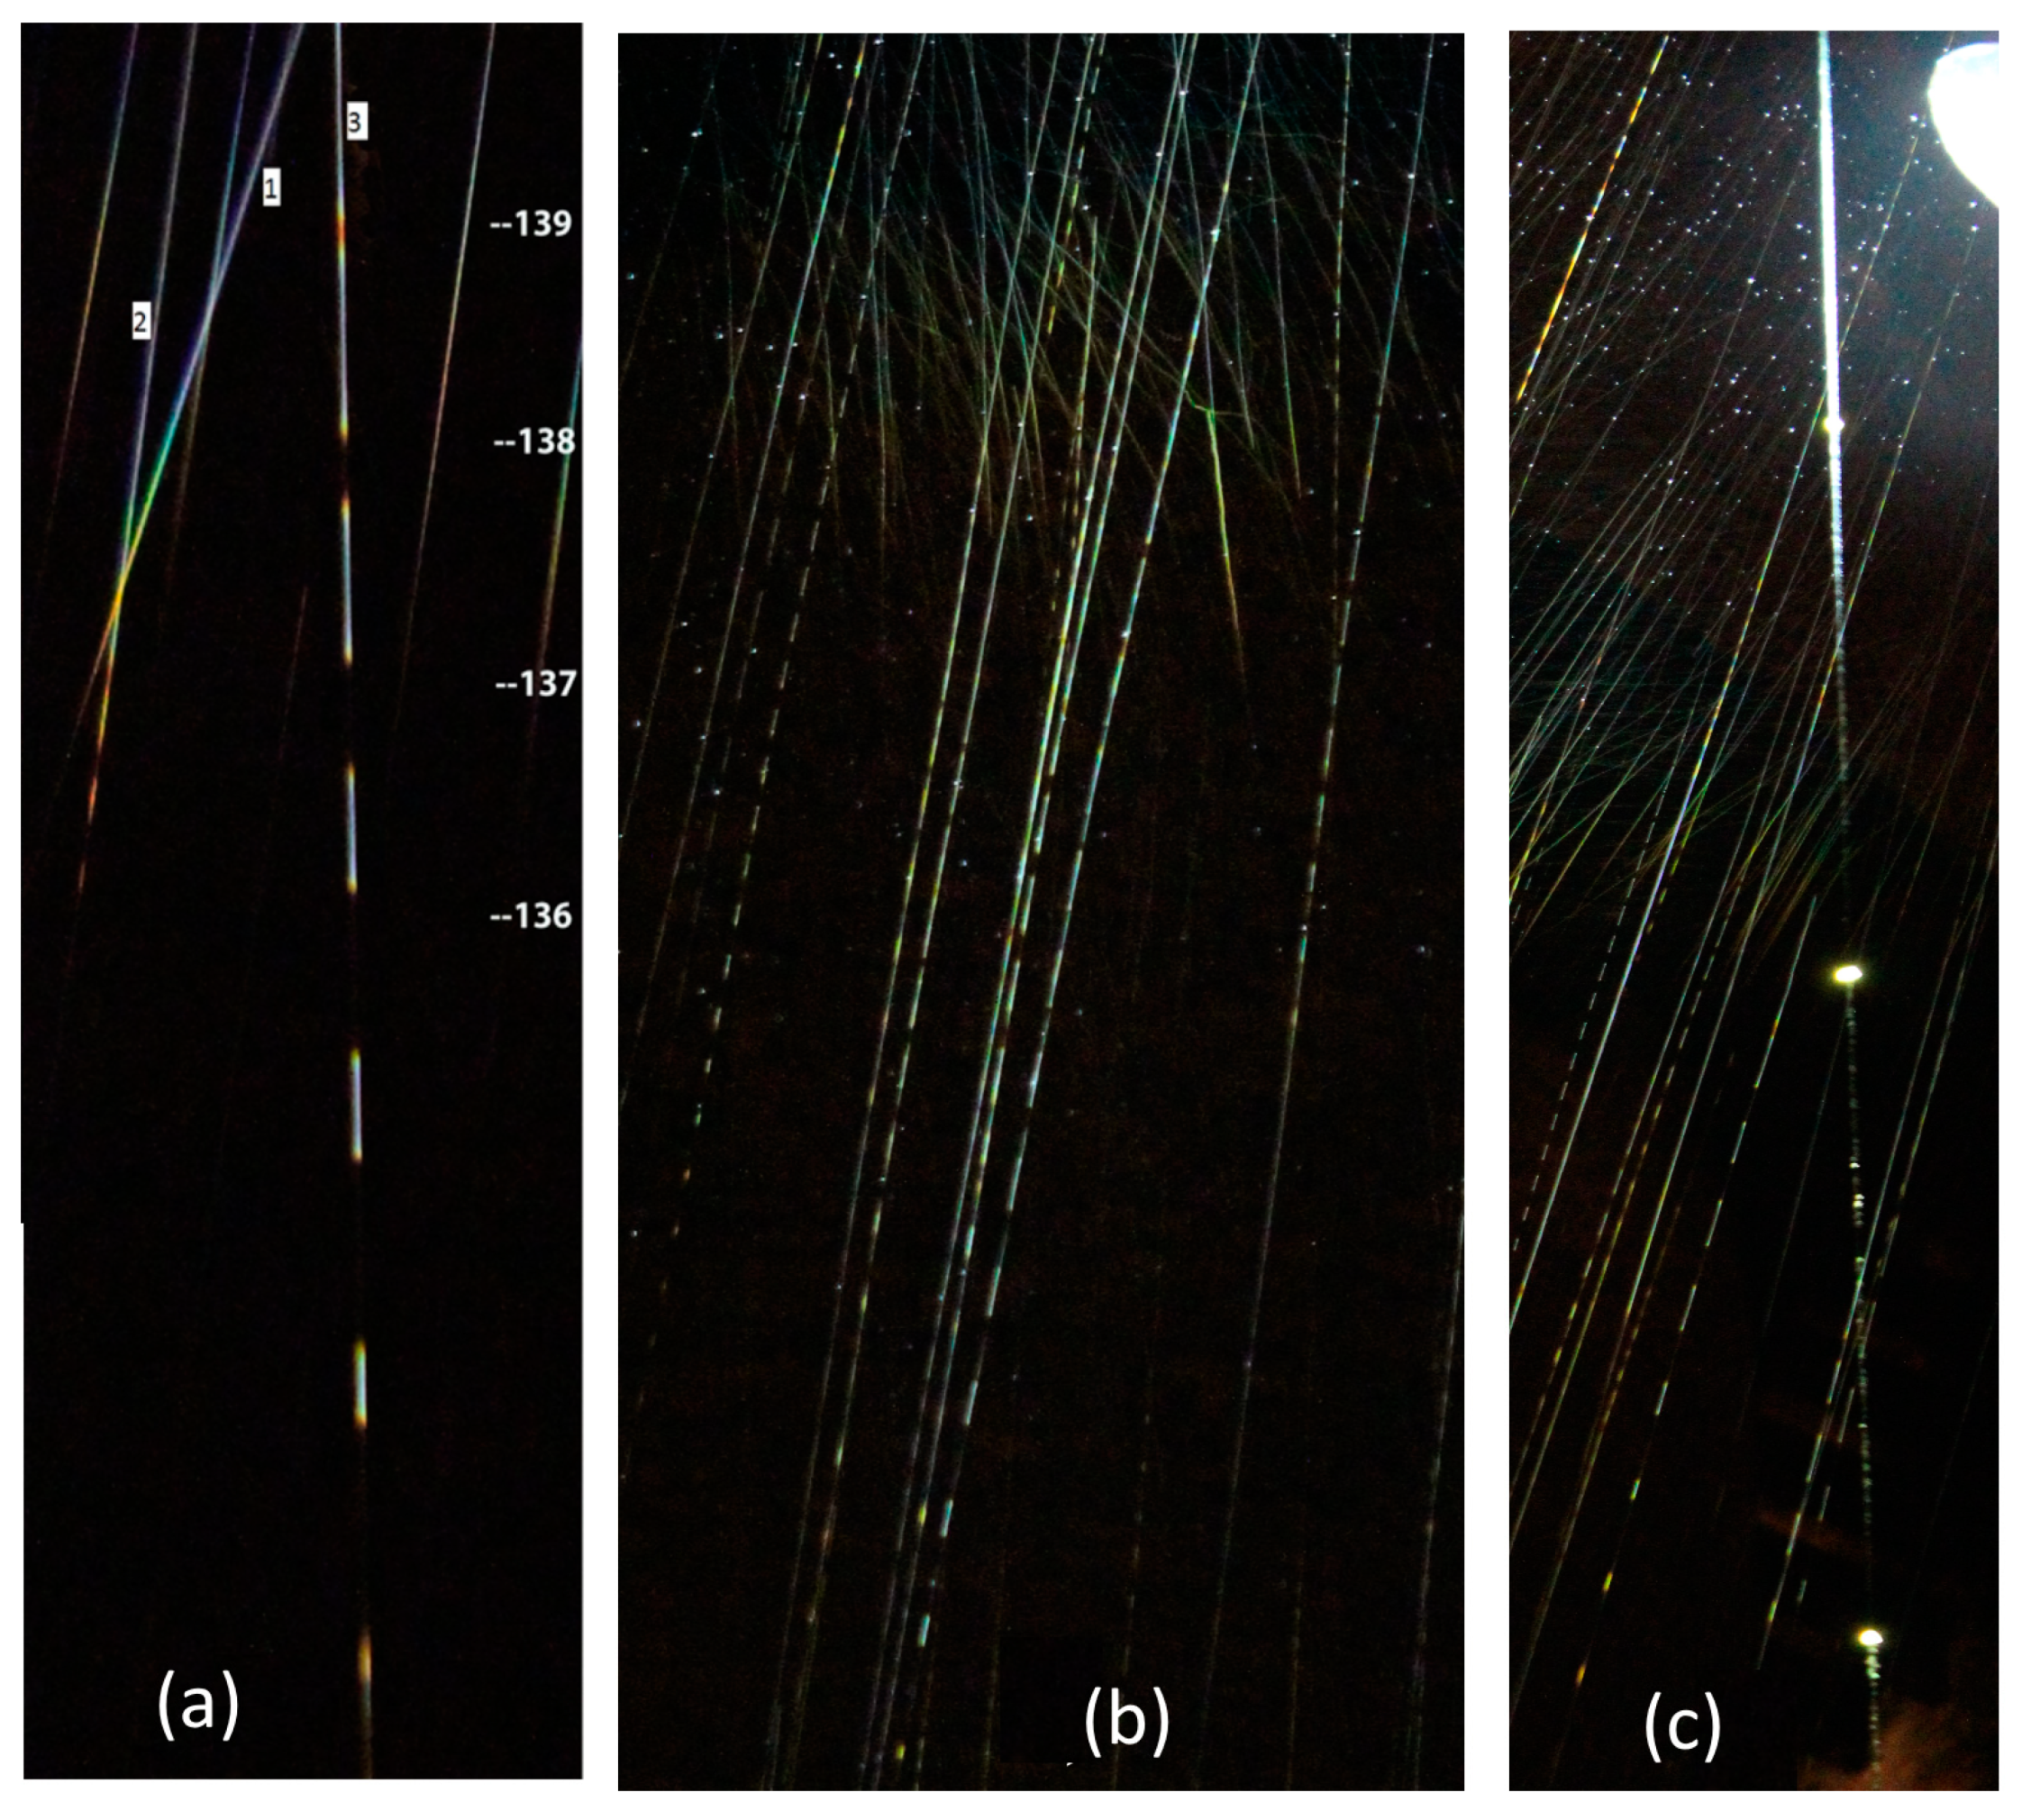
Photographs of anomalous scattering tracks are shown in
Figure 7. A small drop 1 in
Figure 7a, is not deformed and does not oscillate.
It forms a first-order rainbow. Number 2 marks the track of a small drop, which is slightly flattened, its rainbow moves slightly down and is additionally interrupted because of a small oscillation. On track 3, a drop with a diameter of 2.3 mm was recorded, which has an average shape γ
av = 0.87 and oscillates on the fundamental mode with an amplitude Δγ = 0.03. It can be seen that the edges of the pulses have a rainbow color, and the shape of the pulses changes in the same way as in laboratory measurements on
Figure 2, and the color of the edges of the flashes corresponds to
Figure 4. The lower the droplet in the photograph, the smaller the scattering angle and the shorter the anomalous scattering pulses become.
Figure 7b,c show the tracks that are additionally illuminated with a strobe light.
An analysis of photographs showed that almost all droplets whose size exceeds 0.9 mm experience oscillations during a gravitational fall [
12,
19]. Small droplets smaller than 0.9 mm are likely to oscillate with a very small amplitude, however, because of diffraction, incomplete collimation of the incident light, and insufficient camera resolution, these oscillations merge into a continuous track in photographs. Second, it turned out that from the position of the first discontinuity and from the position of the last flare on the anomalous scattering track, one can determine both the average droplet shape and the amplitude of its oscillation in the fundamental mode. Stroboscopic tags had a duration of 10
−6 s and a repetition rate that could be changed from 5 to 100 Hz. This made it possible to determine the droplet velocity, and by the number of periods that fit between strobe flashes, it was possible to calculate the droplet oscillation frequency with high accuracy, and therefore its volume.
In the paper [
19], 1177 tracks of anomalous scattering were processed. The rain intensity in these measurements varied from R = 1 mm/h to R = 20 mm/h.
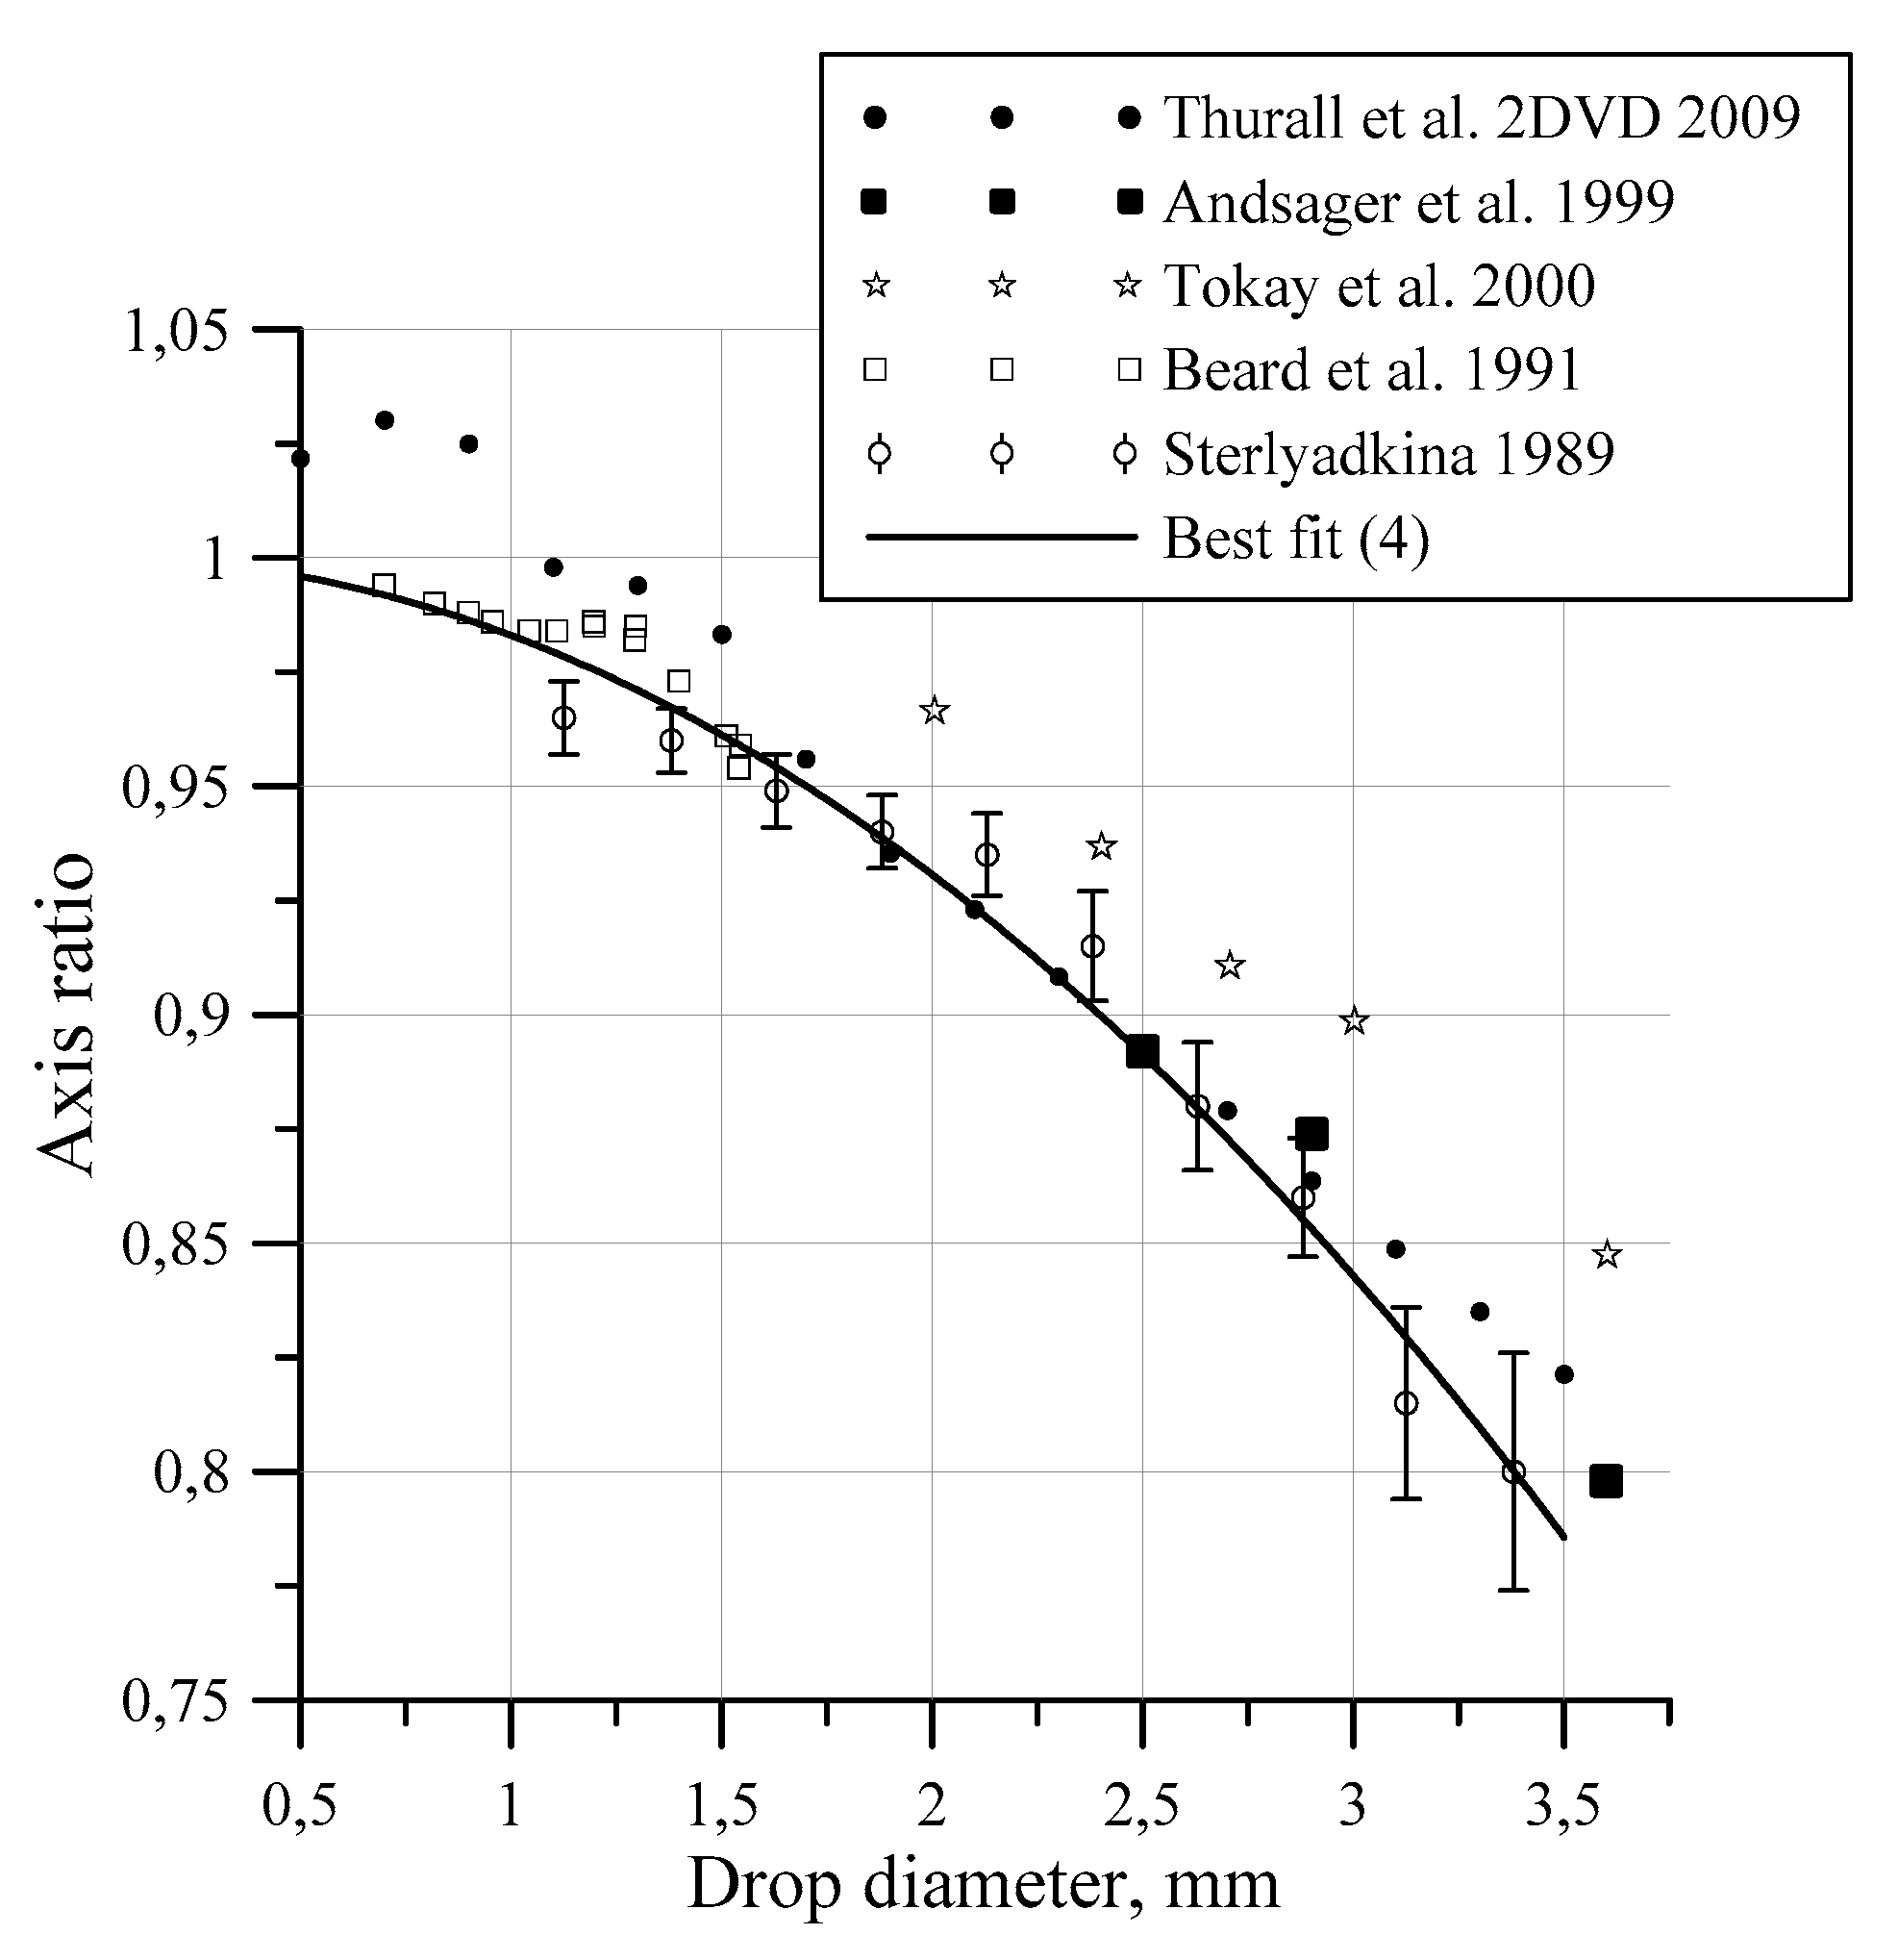
Figure 8 shows the dependences of the axis ratio γ(D), averaged over intervals of size 0.25 mm. The same graph shows data from other authors based on Figure 2 in [
2]; data point by courtesy of M. Szakall. In general, the data obtained in 1988–1989 are in good agreement with the later works of other authors [
20,
21,
22,].
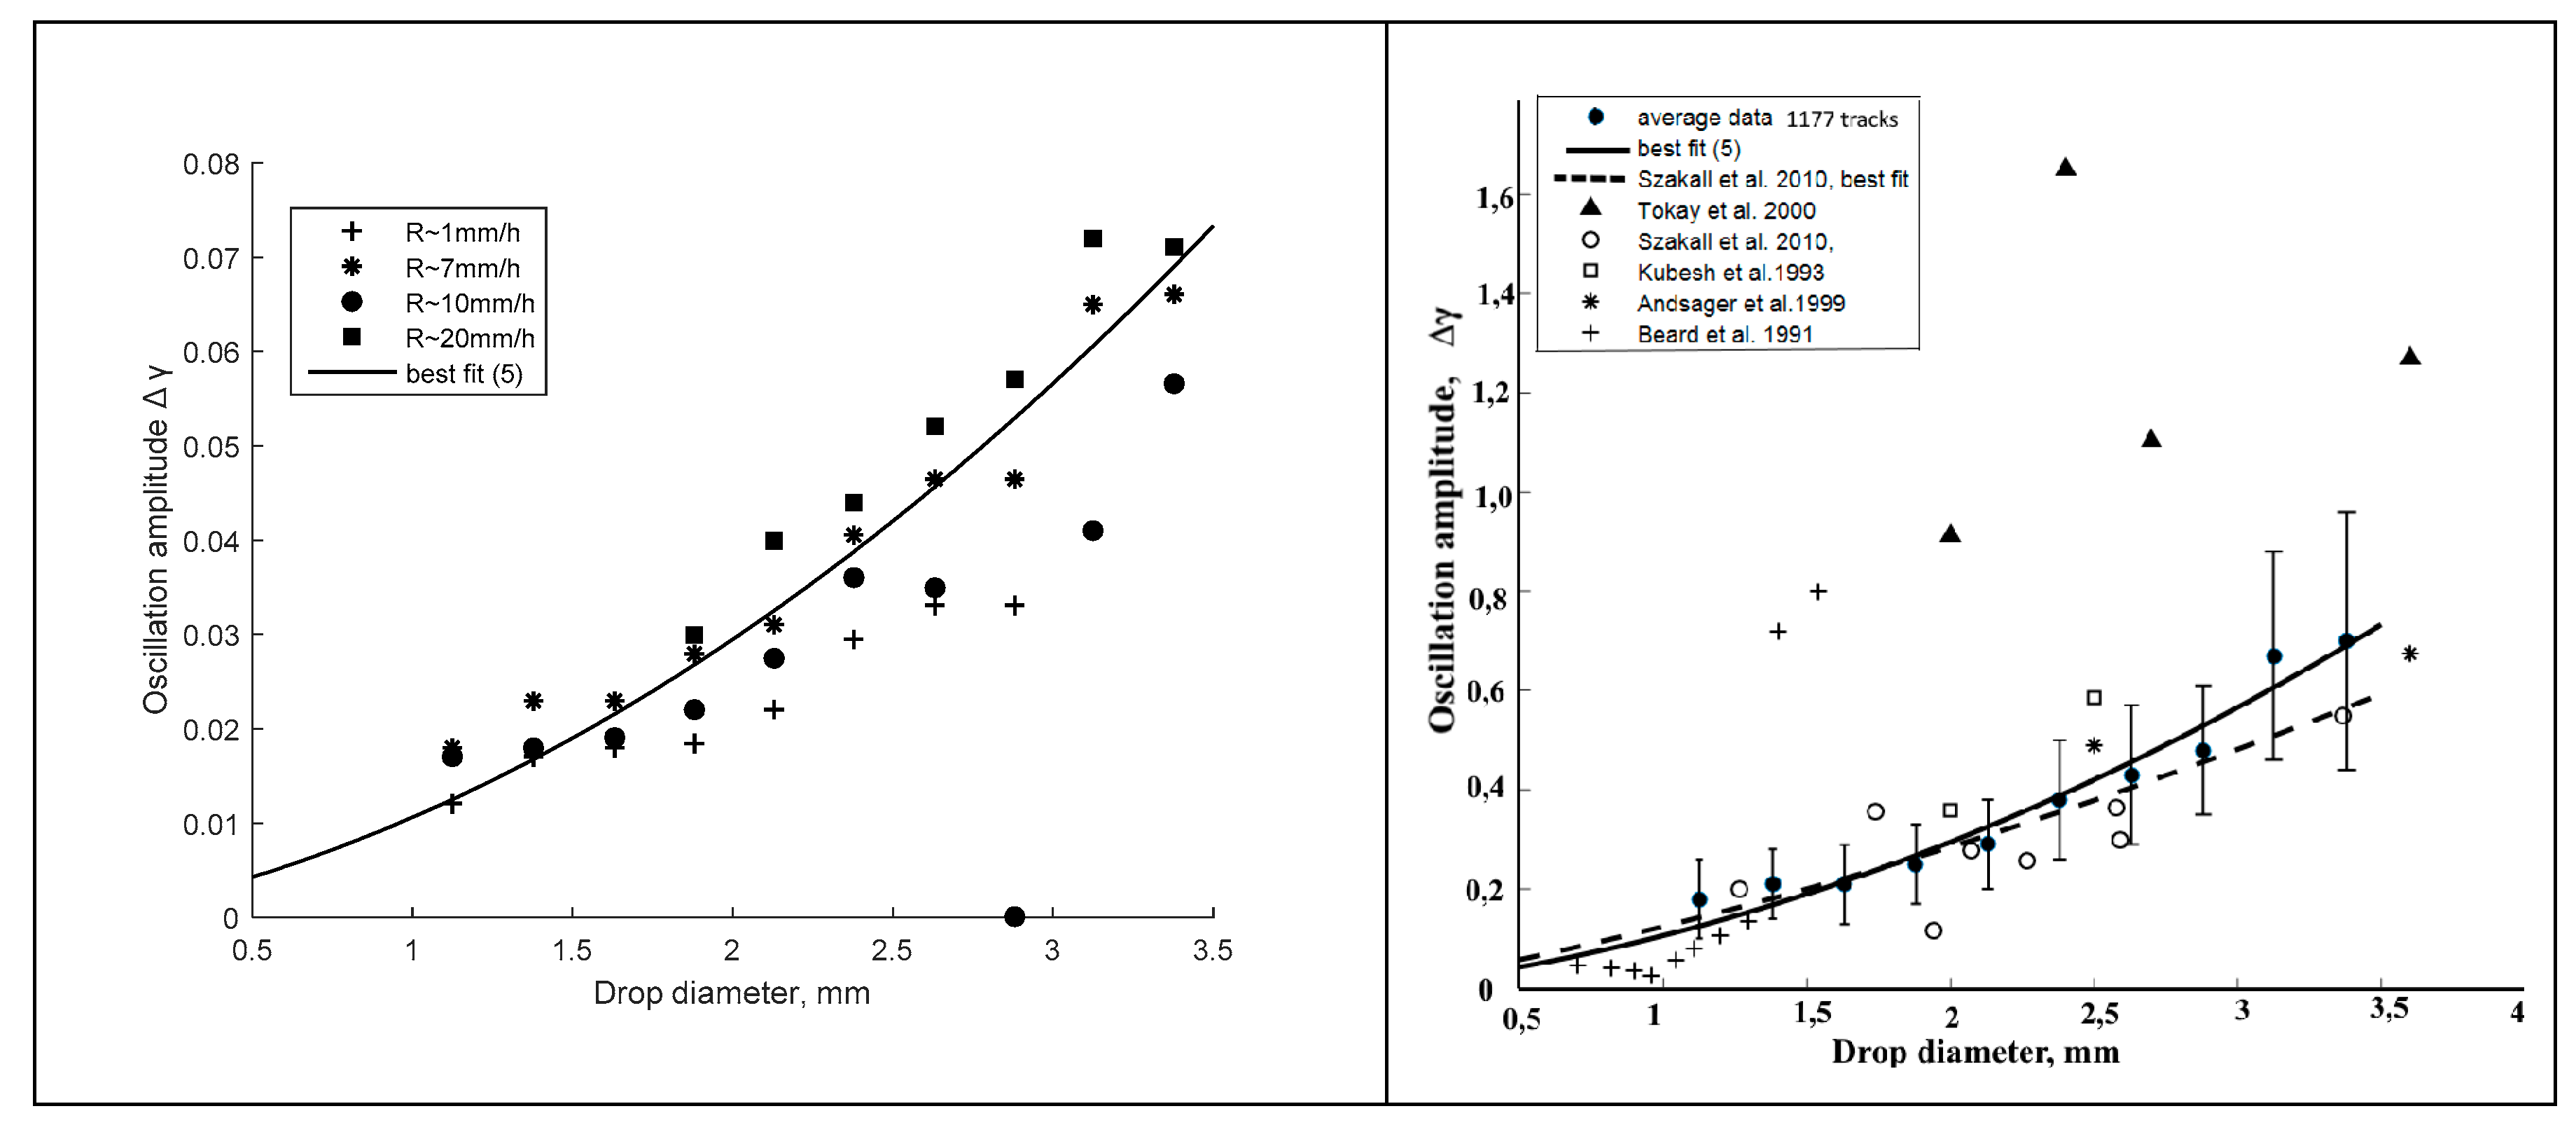
Figure 9 on the left shows the results of measurements of the amplitude of oscillations in rains of different intensities R = 1…20 mm/h. The solid line shows the best fit (5). It can be seen from the figure that there is a systematic increase in the amplitude of oscillations with increasing rain intensity. On the right in the same figure, the dependence ∆γ (D) is averaged over all 1177 tracks, and the rms data are noted. The solid line shows the best fit (5). Data from other authors are based on Figure 3 in [
2]; data point by courtesy of M. Szakall.
It should be noted that so far there have been practically no mass measurements of the amplitudes of oscillations of raindrops under natural conditions. For this reason, the method for recording anomalous scattering tracks proposed in [
12] and developed in [
19] seems to be relevant to date.
Statistical processing of 1177 tracks allowed us to obtain the following best approximation for the average droplet shape γ
av (D) and the oscillation amplitude ∆γ (D) on their equivalent spherical diameter D:
here D is expressed in mm. It should be noted that the registration of the small droplet fraction was limited by the sensitivity of photography, which made it possible to register oscillation of droplets with a diameter of D > 0.9 mm. The coarse droplet fraction was limited by the size D < 3.5 mm for the reason that in larger droplets the probability of excitation of higher vibration modes increases rapidly. The interpretation of track of a large drops was not carried out at this stage of the study, since this problem presents certain difficulties.
The shape of the anomalous scattering tracks allows one to obtain not only the size, average shape, and amplitude of oscillations, but also the mode of oscillations. However, the latter possibility has not yet been fully realized, since additional laboratory studies and theoretical calculations of the shape of the tracks at higher vibration modes are required. For droplets of a given size, it is possible to obtain a distribution over the oscillation amplitudes f (∆γ (D)), which allows us to study questions about the sources of oscillations and their statistical properties [
12].
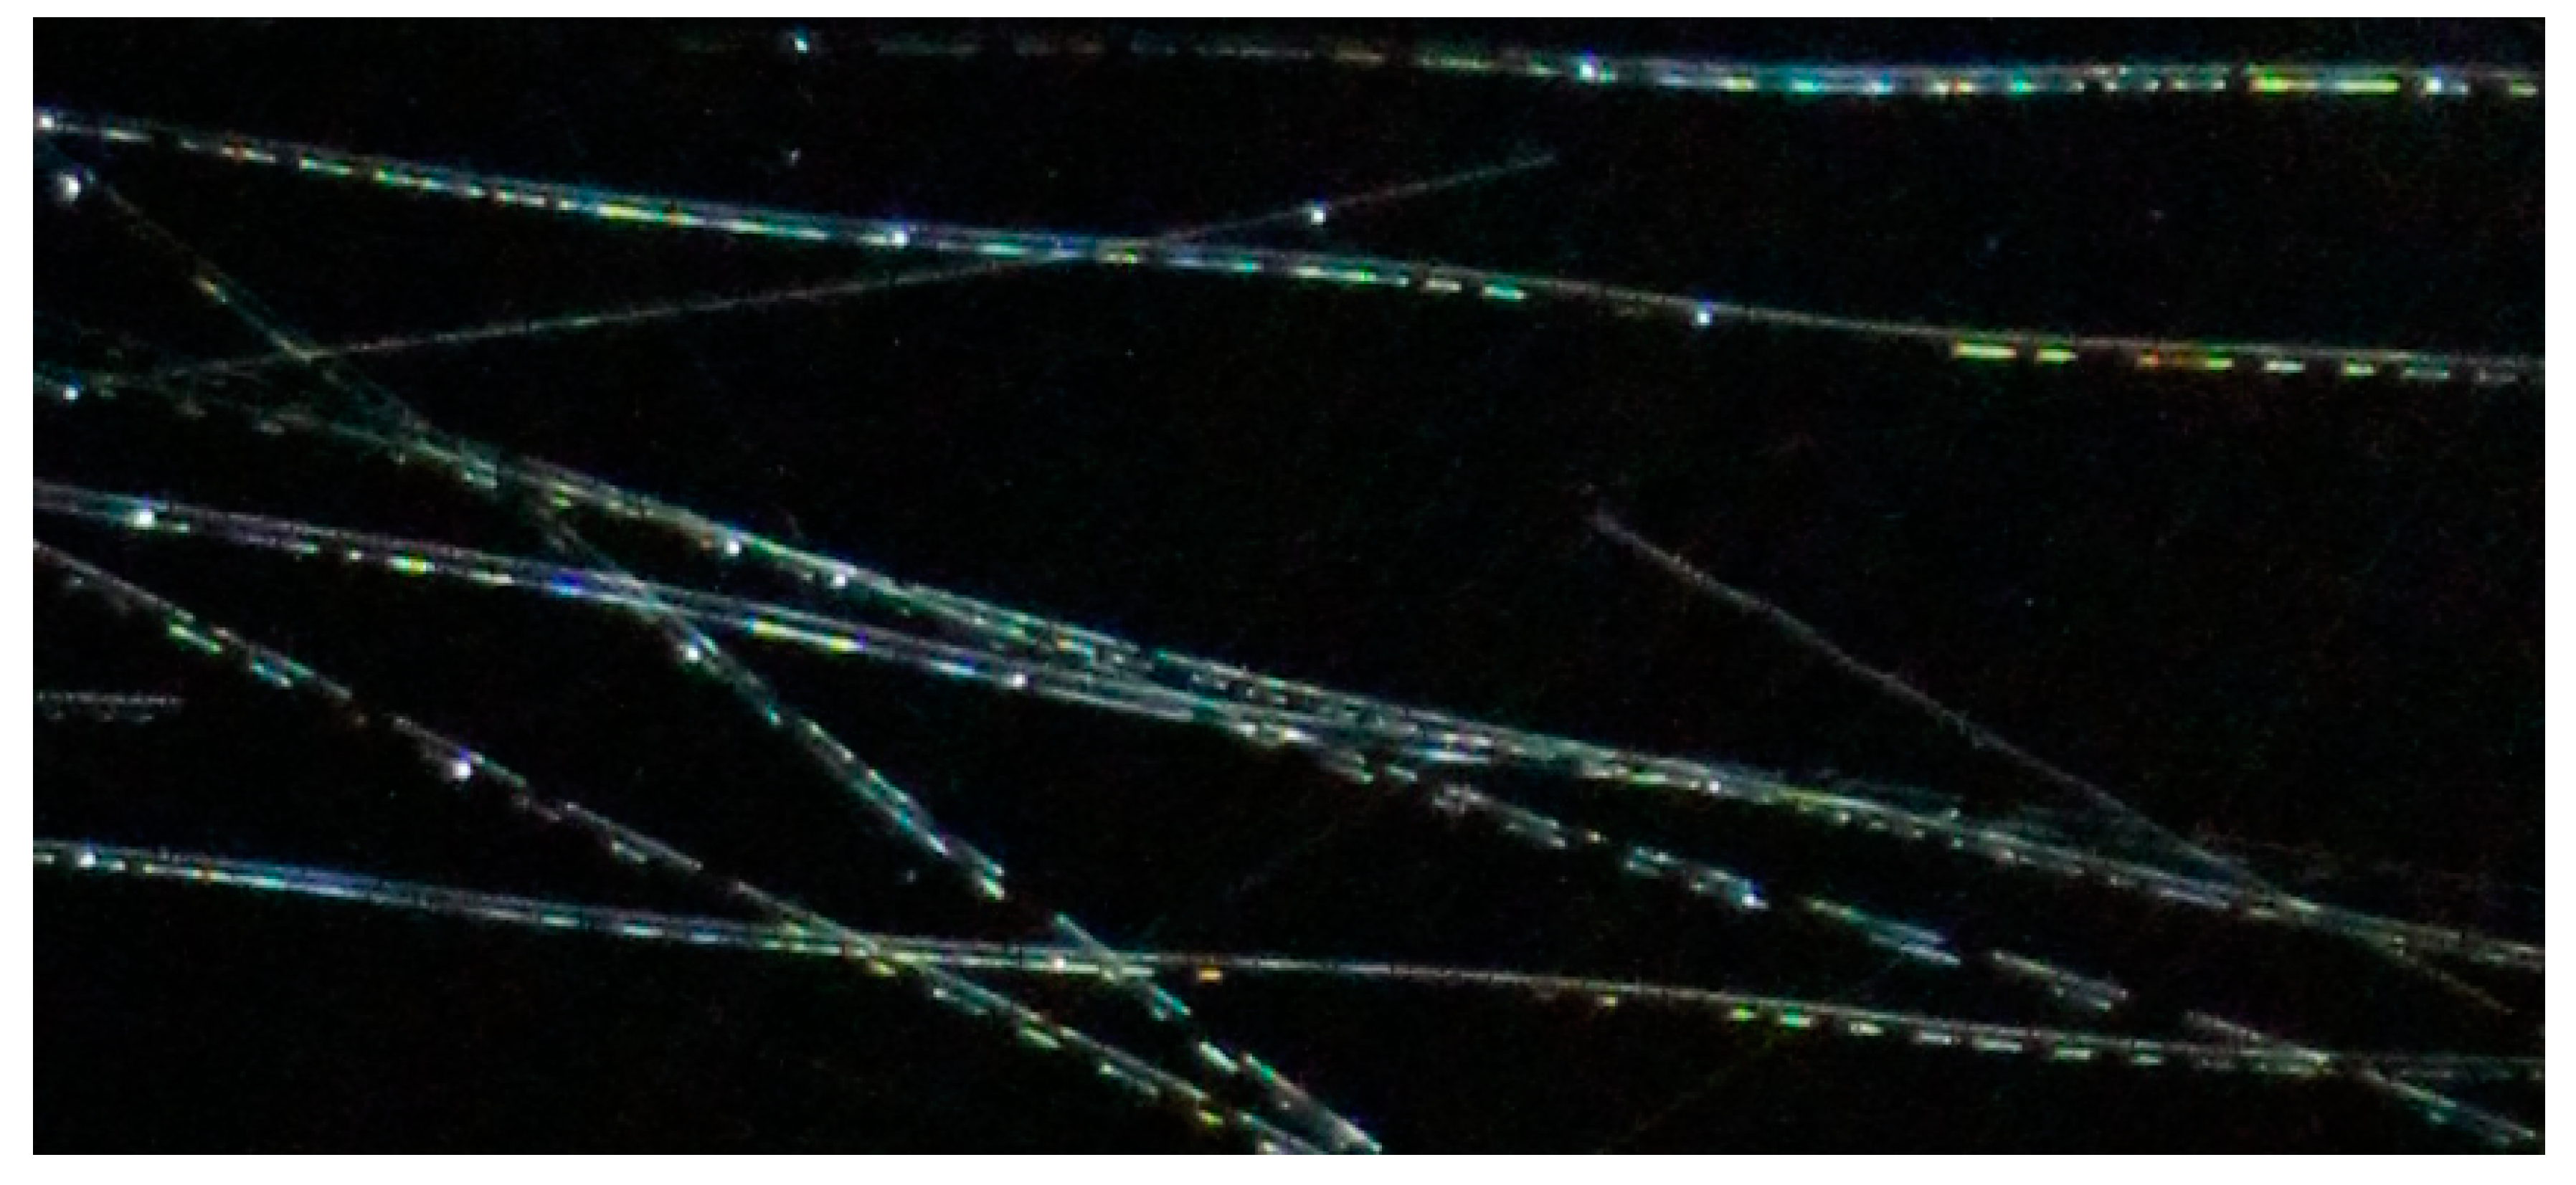
Figure 10 shows a fragment of tracks of anomalously high scattering with an almost horizontal movement of droplets under the influence of a strong wind gust. The lateral movement of the droplets leads to the fact that the rays emerging from the droplet after several reflections inside the droplet itself do not overlap each other, as happens with a vertical drop movement, but form tracks at different edges of the droplet. As a result, two or three tracks are recorded. With a lateral gust of wind, the resulting vibrations are not axisymmetric, in addition, vibrations in a single drop can occur on several modes simultaneously. At present, we are not able to decipher the mode spectrum of oscillations on each track. However, it is obvious that in the form of a track this information is and at a certain stage of research it can be obtained. It is important to note that the length of the tracks of anomalous scattering can be made more than 10 m, therefore, it will be possible to observe each drop for 1–2 s. For this, it is necessary to increase the distance between the camera and the location of the light source and use telephoto optics.
Analysis of photographs shows that turbulent movements and wind gusts, along with other factors, are the cause of oscillations. So with a strong wind impulse, the amplitude of the oscillations of the droplets often increases sharply on all tracks.
5. Spatial Selection and Grouping of Raindrops
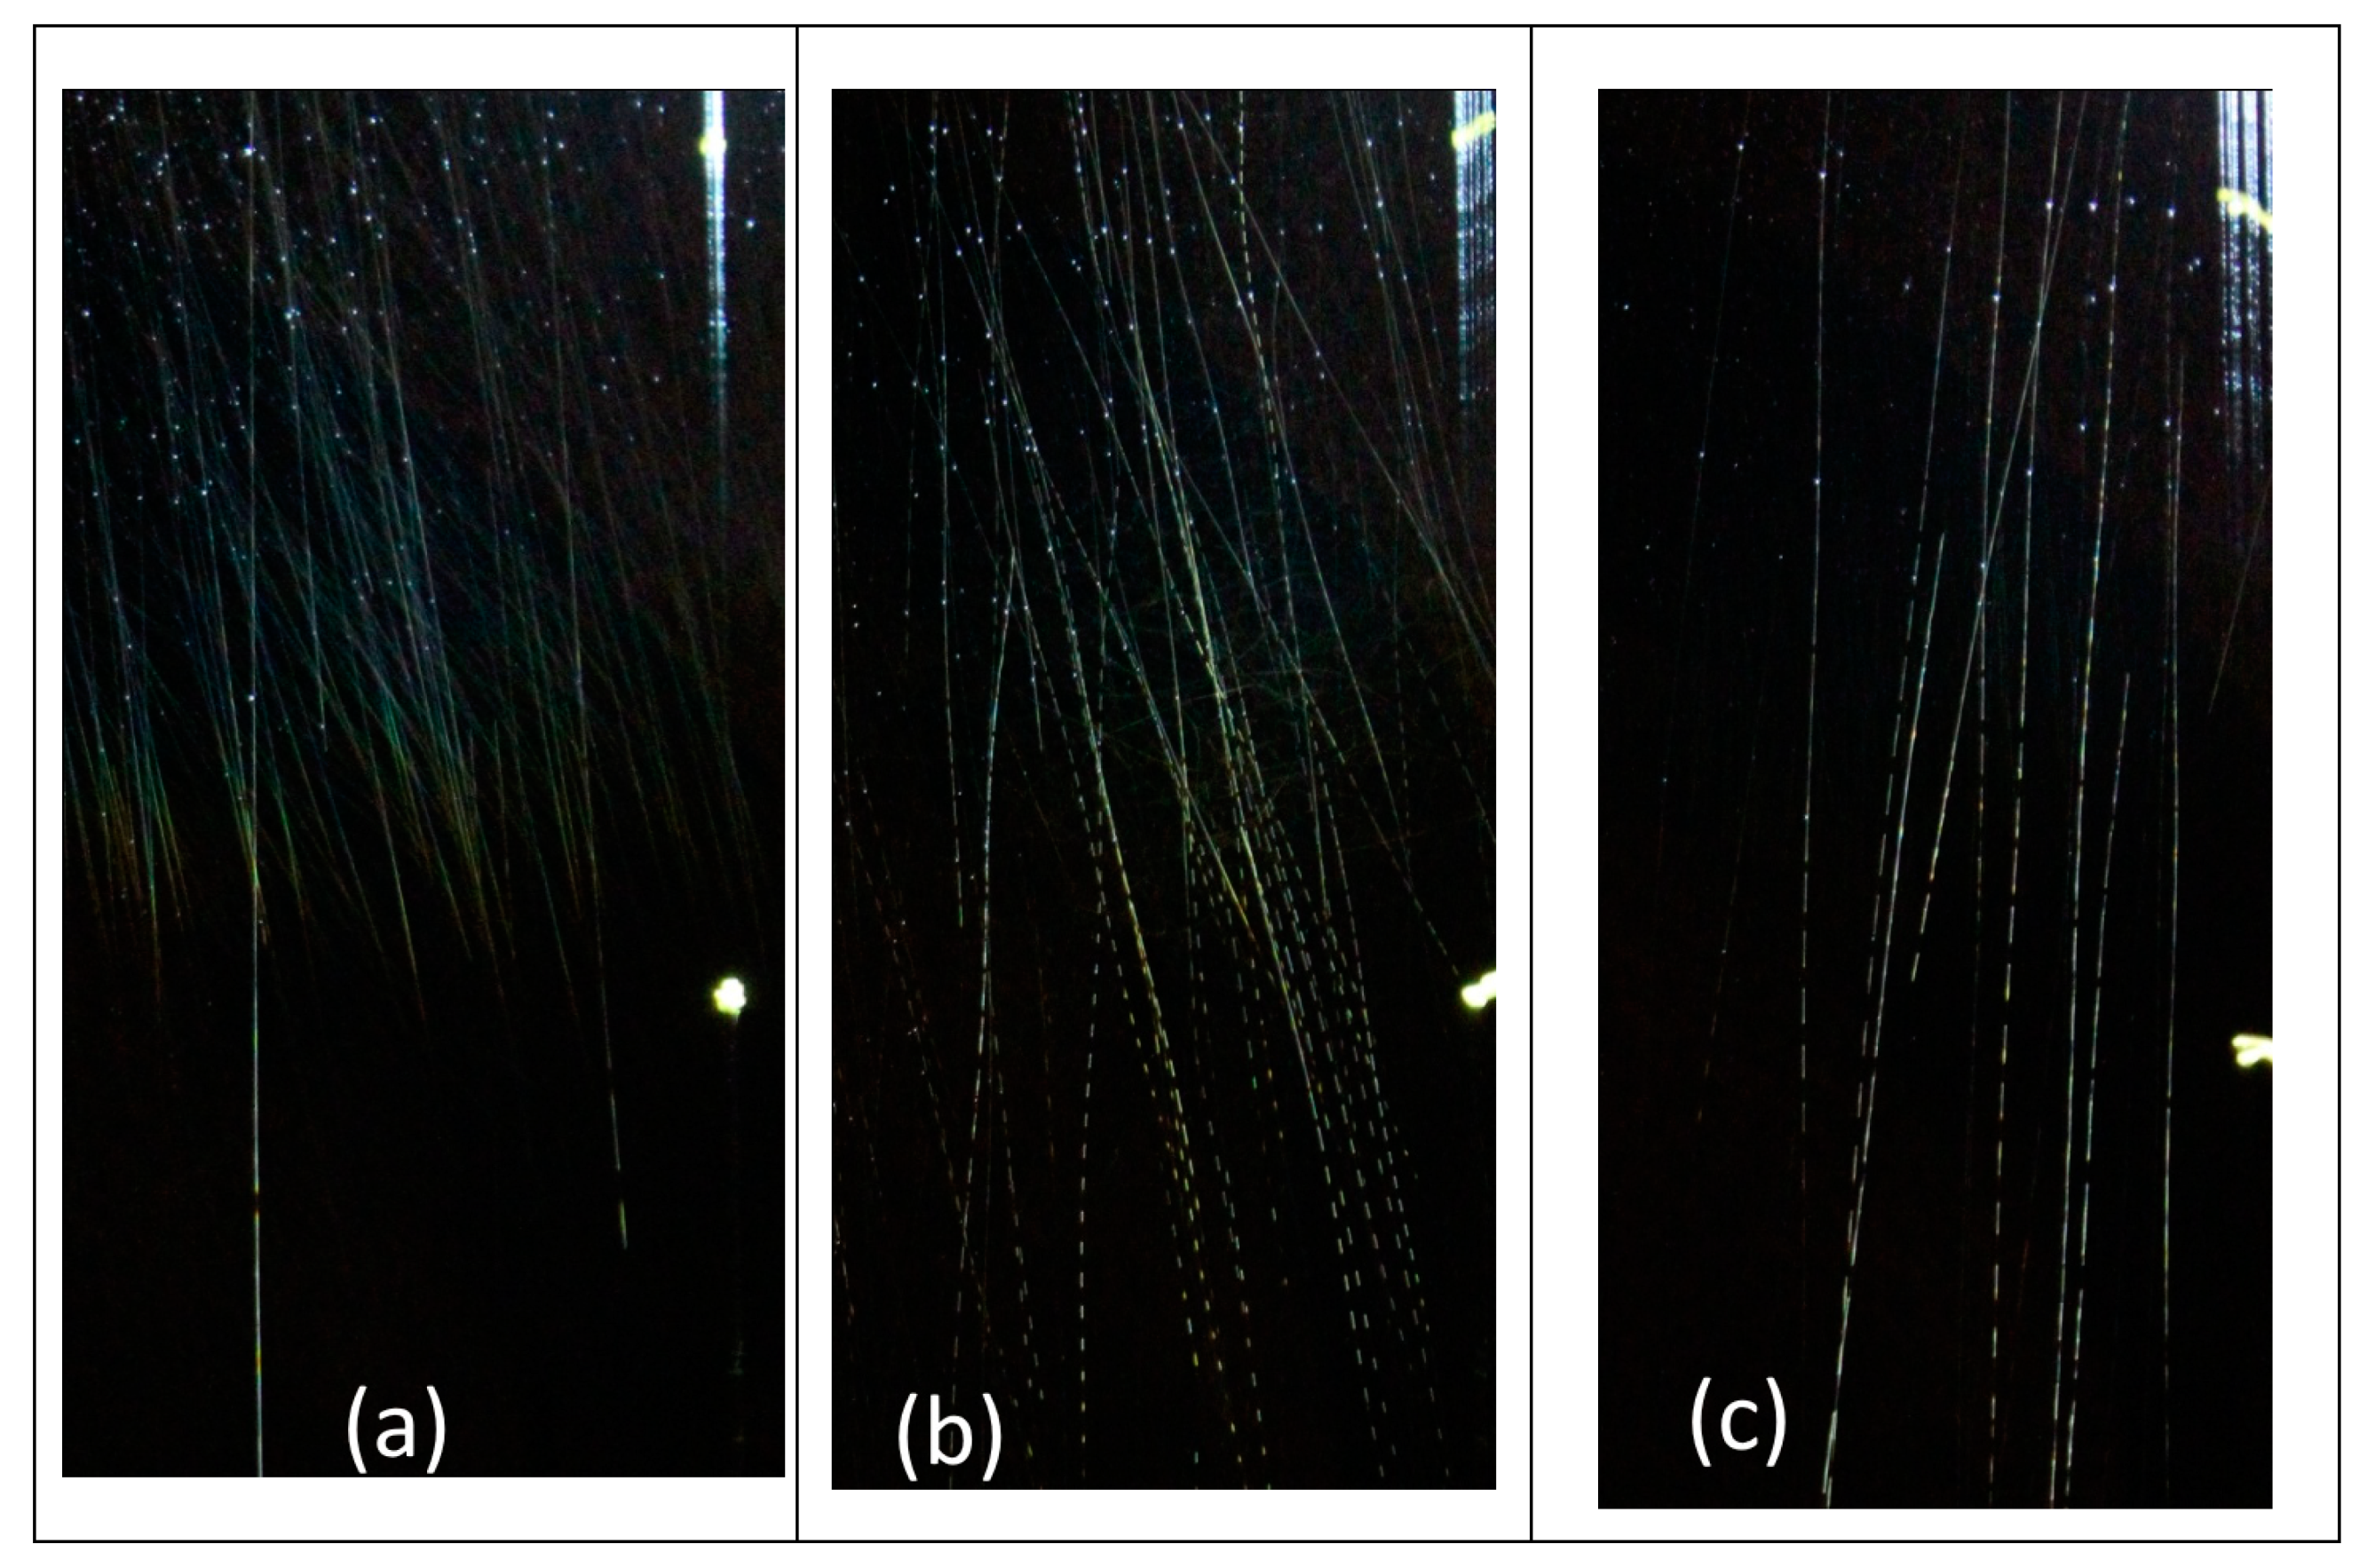
The effect of an abnormally high modulation of light scattered by raindrops and photo tracks proved to be a powerful tool for studying the microphysics of precipitation. In particular, in the process of analyzing a series of photographs, it was noticed that with intense wind gusts, redistribution of drops in space occurs [
23]. In neighboring frames (taken after 1.3 s), at first only small drops with a diameter of less than 0.9 mm were recorded,
Figure 11a, then the small drops disappeared and medium-sized drops with a diameter of about 1.2 mm appeared in the frame,
Figure 11b. Then they were replaced by a larger fraction of droplets with a diameter of 1.7 and 2.2 mm,
Figure 11c (note that the size of the droplets in the photographs can also be judged by the spatial period of oscillations). On some frames, droplets of different sizes were grouped in two adjacent projection beams at a distance of 50 cm.
In [
23], an analysis of the equation of motion of raindrops during a wind gust was made. Obviously, when falling into a gust, droplets begin to be captured by the wind flow. Consider how this happens. For drops with a diameter of less than 0.5 mm (with Reynolds number Re < 10), the dependence of the drag on the flow velocity has a linear form, and the motion of the drop obeys the equation:
Here m is the mass of the drop; Vrel is the air speed around the droplet, and the coefficient
depends on the diameter of the droplet. For clarity, it is convenient to consider a horizontal gust, the flat front of which with a speed Vg approaches the droplets evenly distributed in space. Moreover, we assume that the drops do not have a horizontal velocity component (they fall vertically). Let the rush front have a stepped form (it is easy to show that this does not matter). Then, at the moment when the front of the gust reaches the drop, the relative velocity of the flow around the drop (recall that we consider only horizontal motion) will jump from zero to the speed of the gust Vg. Under such boundary conditions, the solution of Equation (6) has the form:
here
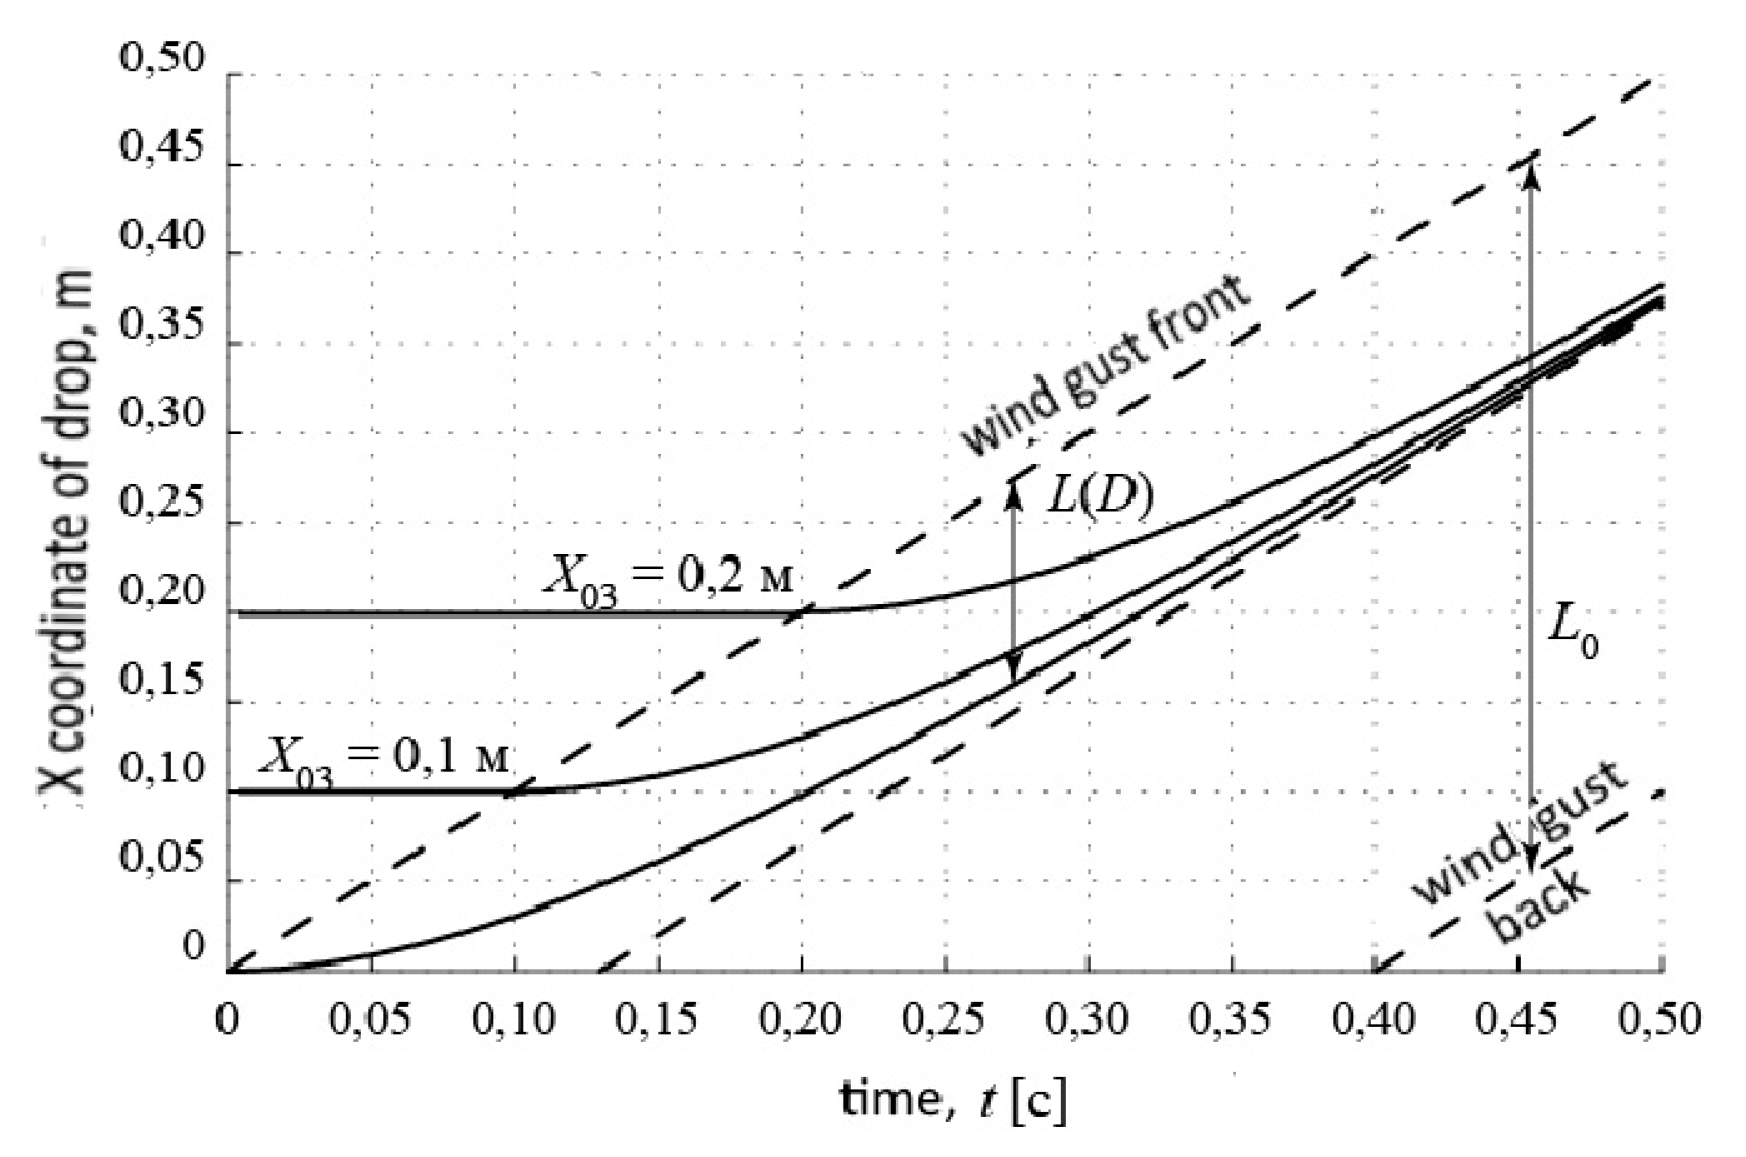
is the characteristic time of the droplet drag by the air flow. This constant non-linearly depends on the particle diameter: for 0.25 mm drops it is 0.13 s, and for 0.5 mm drops it is already 0.5 s. Equation (4) describes the entrainment of droplets by the flowing stream and the exponential increase in their horizontal velocity to a gust velocity Vg. The trajectory motion of the droplets is shown in
Figure 12 provided that the droplets of the same size D = 0.25 mm are initially uniformly distributed in space and are located at points X
01 = 0, X
02 = 0.1 m, X
03 = 0.2 m. Gust velocity Vg = 1m / s.
It follows from the graph that the gust captures drops from different points in space and groups all drops of a given size in one plane, which is located at a distance L (D) = V
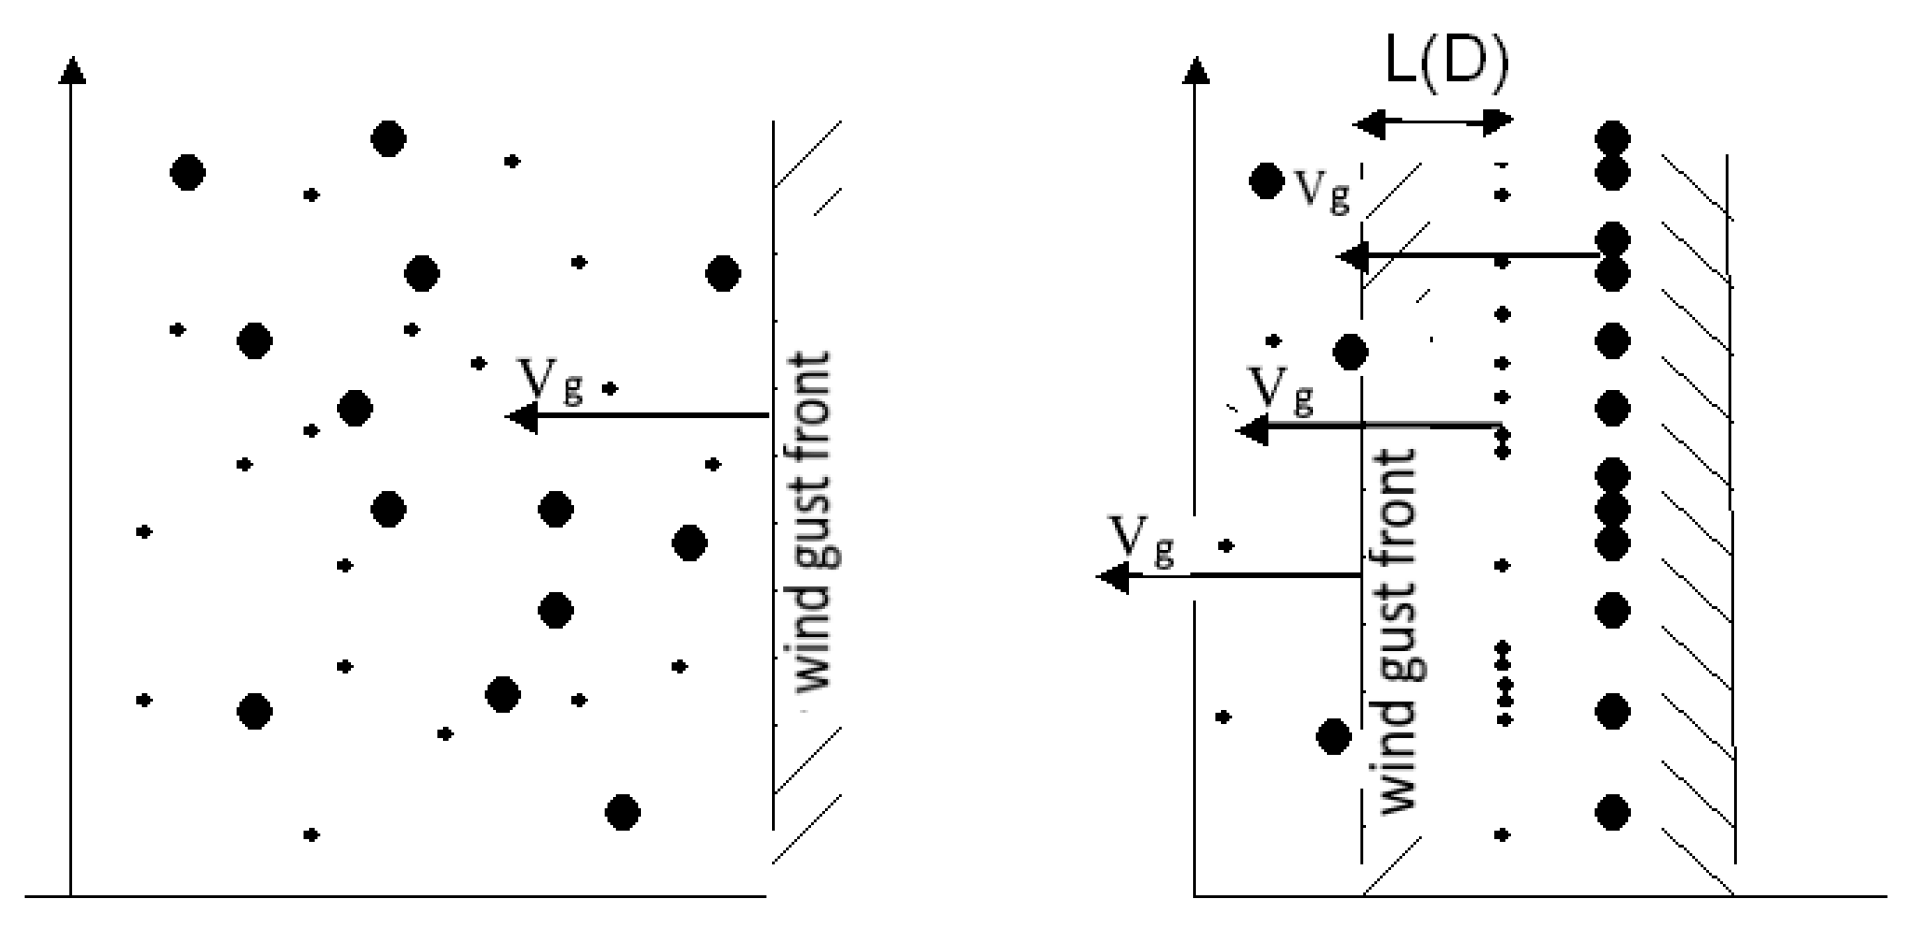
g × τ (D). Then all the droplets move in their layers with a gust rate. Drops of a different size will accumulate in another layer, creating a large concentration of particles of the same size. As a result of the movement of the gust in space, the space evenly filled with drops turns into a layered structure, in each of the layers of which there are drops of the same size,
Figure 13.
The longer the gust life, the greater the volume of space in which the grouping will take place and the greater the concentration of particles in the corresponding planes. Since drops of a given size do not go beyond the distance L (D) from the front, the wind gust can be compared with the wipers on the windshield of the car—there are no drops behind the wipers. The shape of the front of the gust does not have to be stepwise—the exact same process will occur with any shape of the front; only the stability of this front is necessary for some time longer than the time of particle entrainment. Obviously, the grouping process does not depend on the direction of the gust and will occur in any direction, including vertical gusts. Therefore, if another wind impulse occurs in a new direction, then the already accumulated layers will fold in a different plane, again increasing the concentration tens or hundreds of times. This mechanism leads to spatial selection of droplets of various sizes in various regions of space. It is these effects that were recorded on the photos of anomalous scattering. To date, many assumptions exist about the mechanism of the occurrence of raindrops in the clouds. The considered grouping process in wind and turbulent gusts may well explain the process of droplet formation from cloud particles. Obviously, the inhomogeneities of the front of the gust, its dissipation, separation into smaller eddies lead to the erosion of the processes. However, at this stage of the work, these factors are not considered.
With an increase in droplet size D > 0.5 mm and an increase in the Reynolds number (Re > 10), the flow regime changes and the drag force is well described by the equation:
. In this case, the spatial selection of various droplets in different planes occurs not according to the exponential law, but more slowly [
23]. For example, droplets with a diameter of 2 mm, initially located at a distance of 4 m from each other, for 5 s in a gust will be at a distance of 33 cm.
Obviously, turbulence in principle does not differ from wind gusts, and the processes of clustering and grouping of droplets will also occur with large-scale turbulence. However, such calculations are beyond the scope of this paper.
6. The Effect of Turbulence and Wind Pulsations on the Radar Z-R Ratio
Consider the question, how will the received radar signal change if clustering and grouping of particles occurs in space? We consider this mechanism qualitatively, under simple assumptions, assuming that all scatterers are of the same size, but the distribution of particles in space in the first case is random and uniform, and in the second case the particles are grouped into clusters whose size is significantly smaller than the wavelength,
Figure 14. It is known that with a uniform distribution of the scatterers throughout the volume, the resulting backscattering signal increases incoherently in proportion to the number of scatterers N. Moreover, the amplitude of the resulting field at the receiver is added to the vector diagram approximately as shown in
Figure 14a. The average statistical length of the resulting electric field vector
, where
is the length of the electric vector obtained from one scatterer.
In the case of clustering shown in
Figure 14b, the amplitude of the signal from the cluster is formed coherently, because for all particles of the cluster, the phase of the scattered signal will be almost the same. Therefore, the cluster gives a vector of length
, where M is the number of particles in the cluster. In this case, the resulting field strength at the receiver will be significantly higher than in the case without clustering,
Figure 14b. It is convenient to consider the limiting case when all N particles are distributed over clusters of M particles, i.e., N = M × L, where L is the number of clusters. Moreover, we assume that the clusters themselves are evenly distributed in space. In this case, the signal from each cluster
is formed coherently and a vector of length
is obtained. Further addition of the cluster signals is already added incoherently
. Compared with the non-clustering mode, the electric field at the antenna increases
times. The power of the received signal will increase by M times. A similar problem was considered in the work [
24] and the results were similar. With the number of particles in the cluster equal to M = 10
1… 10
3, the power of the received signal will increase by one to three orders of magnitude. This level of clustering seems quite possible for small raindrops, and for cloud particles clustering may be even greater.
The calculations show that the greater the intensity of gusts and turbulence, the higher the degree of grouping and clustering of rain or cloud particles. Therefore, with the same size distribution of droplets and the same intensity R of precipitation, the radar reflectivity Z will depend on the degree of clustering, which increases with the intensity of turbulent movements. Until recently, this factor has not been taken into account in radar meteorology. This is probably why various authors obtain different coefficients in the Z-R ratio, since different experiments could have different dynamics of atmospheric movements.
Obviously, a direct study of the clustering processes in rains is not an easy task. But one of the methods for solving it may be to measure the radar reflectivity of precipitation in a wide range of wavelengths. As the wavelength decreases to the size of the cluster, the coherent component of the signal will go into the incoherent component, which can be detected by the dependence Z (λ). The difficulties of such measurements associated with a change in the sounding volume with a change in the wavelength can be solved methodically by choosing a volume of space with uniform radar reflectivity.
7. The Effect of Non-Sphericity and Vibration of Raindrops on the Scattering of Microwaves
Let us consider the scattering properties of an non-spherical oscillating drop in the Rayleigh approximation, assuming that the drop has the shape of an ellipsoid of revolution, the axis of which is directed vertically. Strictly speaking, droplets weighing more than 10 mg differ from the ellipsoid, and oscillations are possible on non-axisymmetric modes, however, the fundamental axisymmetric mode is basic and has the highest Q factor. Therefore, in a first approximation, it is quite reasonable to consider the problem for an ellipsoidal average shape and for the first fundamental vibration mode. Following the calculation methods performed in [
25,
26] the components of the scattered field for a rotation ellipsoid are:
Here the horizontal axes a = b, and c—vertical axis; γ = c⁄a—axes ratio; Δγ = γ−1—deviation from sphericity; ε—dielectric constant of water;
—the components of the field scattered by the spherical a drop of equal volume:
—components of the field incident on the droplet, D is the diameter of the droplet of equal volume, f
0—frequency of the sounding radiation; k = 2π/λ—wave number; r (t)—projection of the radius vector of the scatterer on the sounding direction; −
deformation of the drop, which is the sum of the average deformation Δγ
0 and the vibration deformation Δγ
a; Ω and φ are the circular frequency and the initial droplet oscillation phase, respectively. Based on the obtained relations, it is possible to calculate the values of the parallel and orthogonal components of the scattered field at the receiving antenna [
24].
Here
—the field scattered by a spherical drop of equal volume;
and polarization coefficients are introduced:
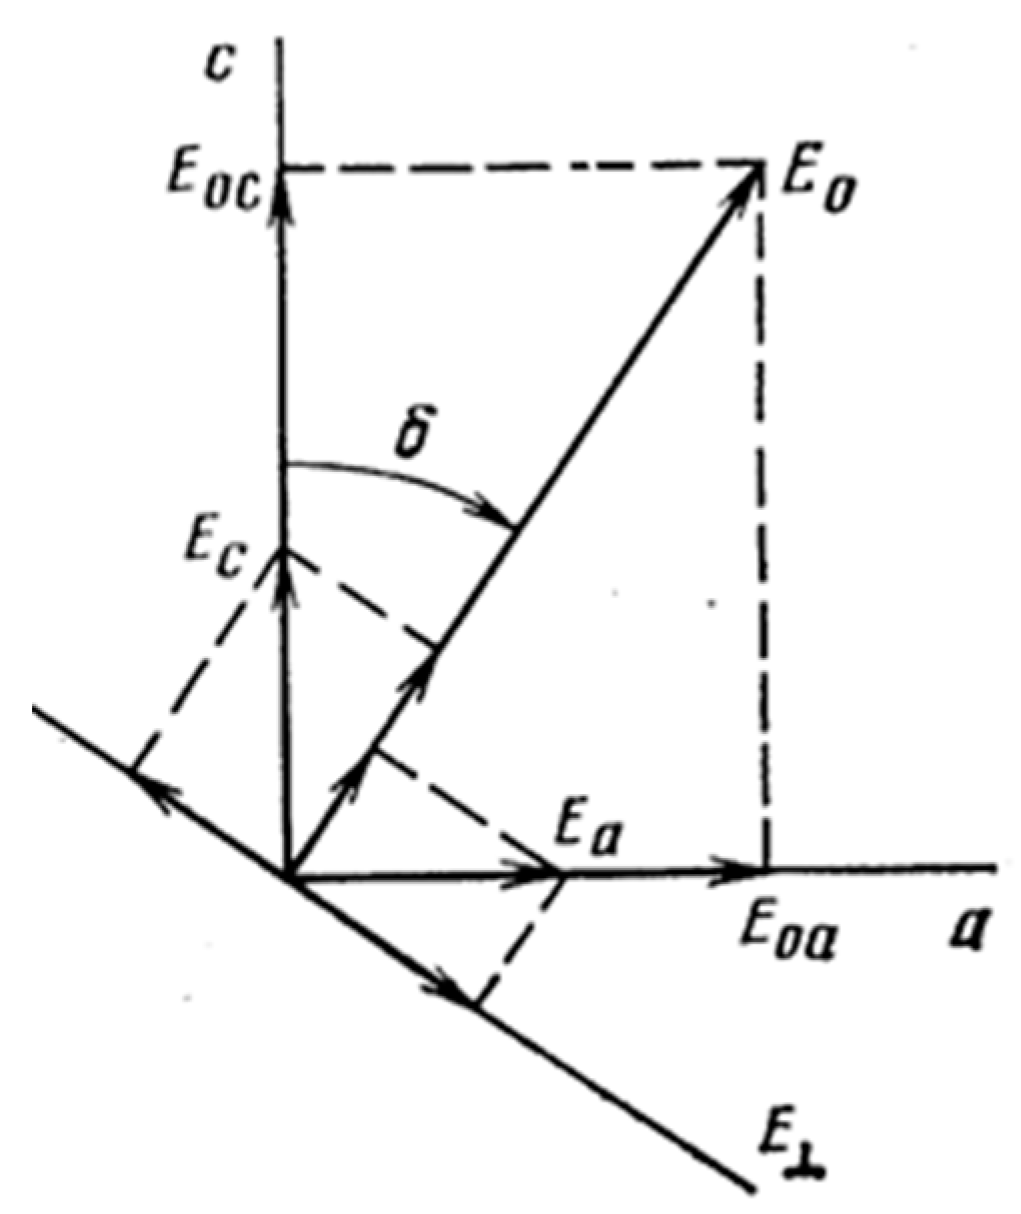
δ is the angle between the vertical and the plane of polarization of the radiation incident on the drop,
Figure 15; β is the elevation angle of the radar.
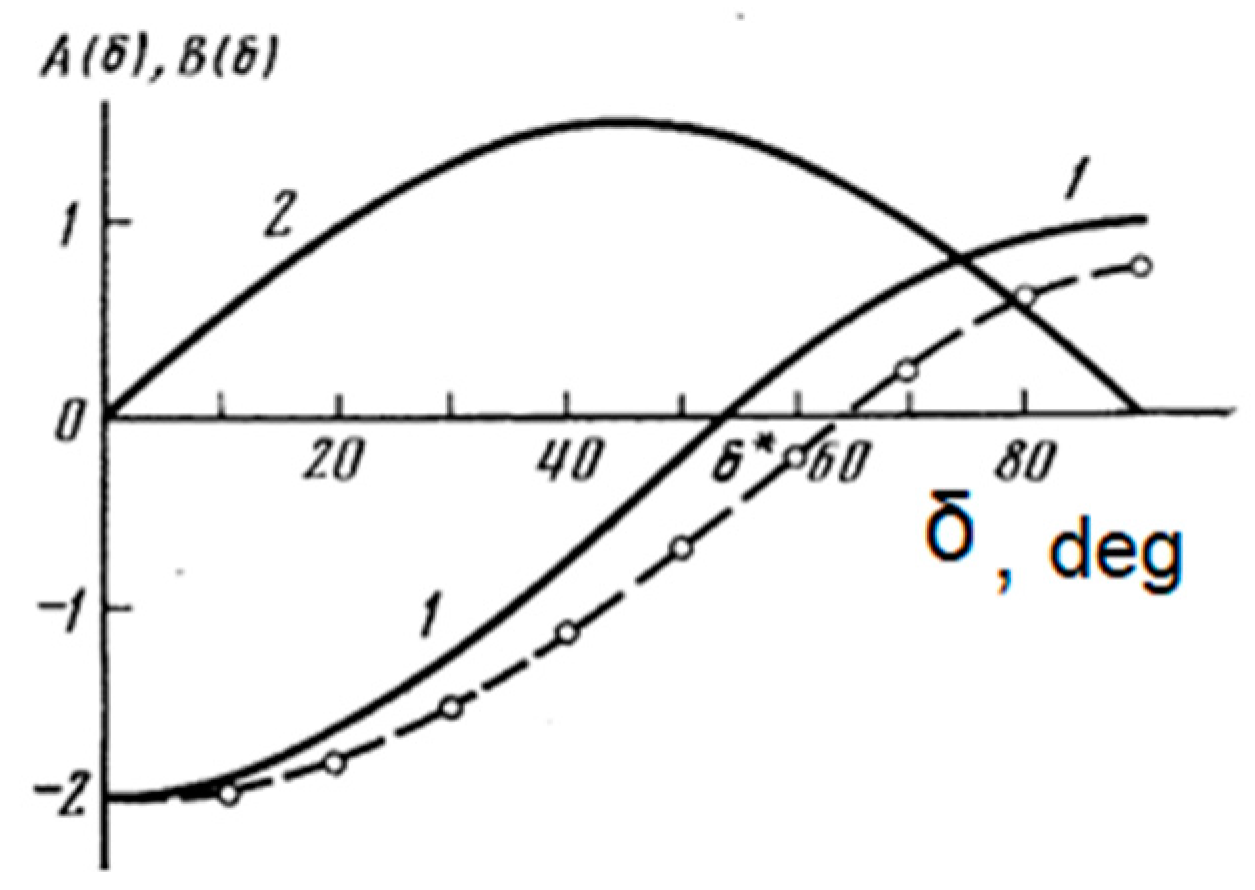
It follows from relations (6) and (7) that the difference between the signal received from a non-spherical drop and the ideal signal from a spherical particle is determined by the polarization coefficients A (δ) and B (δ). Moreover, from
Figure 16 it can be seen that A (δ) varies from −2 to +1, and is responsible for the parallel component of the scattered radiation, and the coefficient B (δ) changes from 0 to 1.5 and is responsible for the orthogonal component of the scattered signal. In
Figure 16, the plots correspond to sounding at elevation angle β = 0. Let us estimate the depth of modulation of the scattered field. When the oscillation amplitude ∆a⁄ a = 0.07 (or ∆γ
a = 0.2), the modulation amplitude of the scattered field exceeds 15%, which seems to be a very significant value.
We should especially dwell on the form of the dependence A (δ). On the vertical polarization at δ = 0, the contribution of non-sphericity in the reflected signal is maximum, the coefficient A (δ) = −2. This corresponds to the fact that the deformation of the ellipsoid along the vertical axis of rotation is twice as large as the deformation along the two horizontal axes Δc = −2Δa (Δa = Δb). On the horizontal polarization A (δ) = 1, the influence of non-sphericity is halved. The most interesting fact is that there is such an angle of rotation of the plane of polarization of the emitted signal δ*, at which the influence of non-sphericity A (δ) = 0, and the drop scatters the signal exactly equal to the signal from an ideally spherical drop of equal volume,
Figure 16. This angle is determined from the condition,
At large sensing ranges, at an elevation angle close to zero (β ≈ 0), the polarization angle at which the non-sphericity contribution is zeroed out is:
For tilt sounding β > 0, the dependence of the polarization coefficient A (δ) on the angle δ decreases by cos(β)2 times, and for vertical sounding, the dependence on δ degenerates: A (δ) = 1 for any rotation of the plane of polarization δ, which to be expected. The depolarization component of the signal is determined by the coefficient B (δ), which is reset to zero with strictly vertical or strictly horizontal polarization of the emitted signal (recall that the depolarization component in the reflected signal appears when the non-spherical scatterers are oriented asymmetrically with respect to the radar polarization plane). The maximum contribution to depolarization during sounding at small elevation angles occurs when the radar plane of polarization is rotated δ = 45° from the vertical.
The described properties of polarization coefficients can be effectively used for radar sensing of precipitation. If the purpose of the measurements is to minimize the effect of deformation and oscillation of the droplets and to obtain signals from particles that are “almost spherical,” then sounding should be performed at δ = δ*. To highlight the contribution of deformation and vibration, one should use the vertical polarization δ = 0, at which the polarization coefficient A (δ) = −2 and has a maximum modulus value. By modulating the plane of polarization between δ = 0 and δ = δ*, and subtracting the obtained spectra, we can distinguish the contribution of non-sphericity, for example, to obtain the spectrum of oscillations in the form of modulation bands. Based on the oscillation spectra, it is possible to obtain the quantity [A(δ)q ∆γ
a(D)]
2 N(D) for droplets of each size [
27,
28]. To recognize the type of precipitation, it is also advisable to use the depolarization component obtained at δ = 45°.
The calculations performed relate to a model of an ellipsoidal droplet shape. It is well-known that the average droplet shape with a diameter greater than 1 mm is not a spheroid. Moreover, with an increase in droplet size, the difference from a spheroid increases [
2,
12,
29]. This fact leads to some change in the dependence A (δ, D), which will additionally depend on the size of the droplets D. Moreover, the conclusion that there exists an angle δ* at which the droplet will have the reflectivity of a spherical droplet of equal volume remains valid. However, a more complete study of this issue is beyond the scope of this paper.
The polarization dependence A (δ) was tested experimentally in laboratory conditions. Drops of distilled water were placed on a hydrophilic dielectric fiberglass ring [
27]. The fundamental axisymmetric vibrational mode was excited either by mechanical vibrations, as described previously, or by using an electric field of high intensity. An oscillating drop was located in the wave zone of the horn antenna, which emitted a plane-polarized wave. The transceiver could be rotated along the axis of the radiation. The variable component of the reflected signal was recorded, which was due to droplet oscillations. The results of measurements of the received signal were normalized to the modulation level with vertical polarization of the incident wave and are shown in dashed lines in
Figure 14. In general, the experimental dependence is consistent with the theoretical curve. Some differences from theory may be associated with a decrease of oscillation amplitude in the horizontal plane due to the limiting effect of the ring.
In [
3,
5] it was shown that the average deformation of large droplets with a diameter of 4–5 mm is ∆γ
0 = 0.2–0.3, and the amplitude of the oscillations can reach ∆γ
a = 0.15… 0.2. For such deformations, it is possible to estimate the contributions of nonsphericity and vibration of droplets to radar signals. In [
28] it was shown that for Doppler radar, the power of the modulation bands due to vibration in the parallel signal component is 1–2%, while for orthogonal components, it can reach 12%. In the quadratic detection of the orthogonal component of the scattered signal, the power of the vibrational bands can reach 25%. At first glance, it might seem that such a significant modulation of scattered radar signals can be easily recorded and used to study the oscillations and microphysics of rains. But this is not an easy task. The difficulty lies in the modulation of the Doppler spectrum or the spectrum of relative velocities, which has a distribution width ΔV = 0.5… 1 m/s. As a result, the spectrum of the main signal is superimposed on the spectrum of oscillations, and their separation is a big problem. For example, at a wavelength of λ = 10 cm, the width of the spectrum of the main signal is Δf = 2ΔV⁄ λ = 100–200 Hz, while the oscillation frequencies of the droplets lie in the range of 35–200 Hz. This leads to the superposition of the Doppler spectrum (or intensity spectrum) and the spectrum of oscillations on each other. With increasing wavelength, the spectrum width of the main signal decreases, but the oscillation frequencies do not change. Therefore, the longer the wavelength, the smaller the overlap of the spectra and the easier their selection. An additional possibility of selecting the vibration spectrum is to use the polarization dependence of the polarization coefficient A (δ). By switching the plane of polarization of the sounding radiation between the inclined polarization at δ = δ* and the vertical polarization δ = 0, one can either nullify the contribution of nonsphericity and vibration, or register it with a maximum amplitude. Differential measurements will improve the reliability of the selection of the spectrum of oscillations, thereby determining their amplitudes and microstructure. However, this requires the ability to rotate the plane of polarization of the sounding signal, which is usually not provided for serial radars.
