1. Introduction
Urban green spaces, namely, city parks, are very often considered localities providing the best air quality in a city, and thus they become frequently targeted by citizens seeking relaxation and active recreation. However, there are very few studies supporting this generally accepted claim.
Xing et al. [
1,
2,
3] noticed improved air quality in small urban parks within a distance from surrounding streets due to the dispersion of air pollutants within park areas. Importantly in this context, trees can reduce wind speed and potentially trap pollutants. Most available studies point to a reduction of PM concentration levels inside city parks. Von Schneidemesser [
4] stated that suitably distributed greenery can decrease the concentration of PMs by 20%, down to relative ambient average concentrations. Ou et al. [
5] monitored PM
2.5 and PM
10 mass concentrations during the fall of 2018, identifying a significant drop in both PM
10 and PM
2.5 levels close to parks. A decrease of 23% in the total mass of PM
2.5 in a national park compared to an urban area is presented in paper [
6]. Zhu et al. [
7] analyzed the impact exerted by different types of plant communities on ambient PM
10 and PM
2.5 concentrations by using a spatial model. The results showed that differences in the levels of ambient PM concentrations among plant communities resulted from their composition and also other factors, including height (significantly lower ambient PM concentrations were recorded near small plants, namely, ones of less than 1 m), leaf area, or distance from the pollution source or edge of the park. Greenery increases the efficiency of reduction in ambient PM concentrations; however, this capability markedly depends on the season of the year. A significant decrease of PM
2.5 concentrations in La Carolina, a large city park in Ecuador, was described in [
8]. Otosen et al. [
9] measured differences in PM
1.0, PM
2.5, PM
10, NO
2, and CO concentrations in front of and behind vegetation barriers along roads (hedges during dormancy and the vegetative period). This type of greenery can mitigate the effects of air pollution generated by traffic, and, truly, a decrease in PM concentrations was measured. Contrariwise, no impact on the concentration of gasses was determined. In a relevant study by Abhijith and Kumar [
10], the concentrations of PM
10, PM
2.5, PM
1.0, and black carbon were established in close vicinity of the three types of green infrastructure. The influence of separate hedges or shrubs, separate trees, and a mixture of trees and hedges/shrubs was assessed when located at different distances from a road, namely, at very close (<1 m from the road) and more remote (>2 m from the road) spots. The most prominent reductions were recorded in a mixture of trees and hedges under close distance conditions and in separate hedges positioned more remotely. An assessment of various PM fractions showed that separate hedges and a combination of trees and hedges decrease fine particle concentrations behind the green barrier. Relevant analyses then indicated a reduction of vehicle-related particles (i.e., those containing iron and its oxides, Ba, Cr, Mn) in the background of the green infrastructure, as compared to the front area. A similar paper on green infrastructure barriers, Mori et al. [
11], characterized measurements of PMs sized between 0.2 µm and 100 µm. The authors described a reduction in PM particles at different distances from the road (measured by passive samplers), proposing that the actual results are influenced by different planting densities in two different green vegetation types of two heights.
Air pollution and human health, as well as green infrastructure and human health, are often studied together. Linking green infrastructure with air quality and human health is an aspect of interest for Kumar et al., who, in a corresponding review [
12], concluded that although urban vegetation can bring health benefits, the knowledge of its wider applicability in efforts to reduce air pollution remains overly insufficient and must be further refined. Almedia et al. [
13] discussed differences in pollutant concentrations (PM
10, NO
2, and O
3) between schools near roads in urban areas and schools adjacent to forests and roads in the same environment. The results correlate with respiratory problems exhibited by children within all areas of interest. The PM
10 and NO
2 concentrations proved to be higher at points closer to roads with intense traffic flows and lower at spots near parks with dense vegetation. Sheridan et al. [
14] focused on NO
x concentrations in the city of London, especially in parks and playgrounds, finding dangerously high levels of NO
2 at all places of interest (playgrounds, parks, and gardens), those open to the influx of the pollutant in particular. Lingberg et al. [
15] described a reduction of air pollution in parks within the city of Gothenburg, Sweden; they emphasized the “park effect”, namely, the assumption that parks embody a considerably cleaner local environment thanks to an interaction of two effects: dilution (the distance effect) and deposition. Trees and other vegetation can absorb and capture air pollutants, thus improving the air quality in cities. Due to a lack of local-scale information, the impact of urban parks and forest vegetation on the levels of nitrogen dioxide (NO
2) and ground-level ozone (O
3) were studied in Baltimore, USA. Yli-Pelkonen et al. [
16] concluded that O
3 concentrations were significantly lower in tree-covered habitats than in open ones. Conversely, NO
2 concentrations did not differ significantly between tree-covered and open habitats, meaning that it is again necessary to stress the choice and variability of greenery. Hewitt et al. [
17] discussed several options of how to improve air quality by using different types of green infrastructure, introducing a novel conceptual framework as policy guidance; the authors’ interpretation of the problem includes a flow chart to aid decision-making as regards the “green infrastructure to improve urban air quality”.
Air pollution poses a major risk to human health, causing premature deaths and potentially reducing the quality of life. Quantifying the role of vegetation in curbing air pollution concentrations is an important step. Most current methods to calculate pollution cutback procedures are static and thus represent neither atmospheric transport of pollutants nor pollutants and meteorology interaction. The focus on urban parks as a tool to facilitate air purification and climate regulation embodies the basis of articles by Vieira et al. [
18] and Mexia et al. [
19]. These authors concluded that ecosystem service strongly depends on the vegetation type; thus, for example, air purification is more pronounced in mixed forest, and carbon reduction is influenced by tree density. Further, Jones et al. [
20] developed a method to calculate health benefits directly from changes in pollutant (including PM
2.5, NO
2, SO
2, and O
3) concentrations, exploiting an atmospheric chemistry transport model.
In our paper, the concentrations of PM10 solids were determined continuously, by utilizing the nephelometric method followed by gravimetric method-based validation. To identify potential sources of air pollution in parks, we evaluated the air quality within the local environment via correlation with measurements of wind direction, wind speed, temperature, and relative humidity. The “openair” and “openairmaps” packages from the OpenSource software R were employed to analyze the effects of wind on air pollution. Local polar concentration maps found application in locating the directions of wind coming from the most serious air pollution sources. Sampling and analyses were performed to confirm the assumption that the main sources of the pollution at the measuring point are most likely the roads and/or crossroads near the sampled localities.
Due to the information gap concerning air quality in city parks, the goal of our study was to obtain data on air pollution in urban parks and associated details relevant to the relationship between this pollution and meteorological parameters, prominently including temperature, wind speed, and wind direction; in this context, our efforts also involved comparing these data with pollution around the parks. Based on the findings, we then aimed to estimate the sources of air pollution in the monitored parks.
2. Method
2.1. Sampling
The sampling was carried out in three pre-selected city parks in Brno, the Czech Republic; two of the parks are located in areas with a high traffic impact (near main roads), while one is found in a low traffic load environment (a small park inside a courtyard). The main city park of Lužánky exhibits the largest surface area of all the monitored parks, and it is located near the city center, surrounded by roads with heavy traffic. Two air quality monitoring spots were positioned in the park: one place in the middle of the area, and the other on the edge of the park, near a playground and the traffic-laden roads. This park is frequently visited and used for sports and leisure activities, including picnics.
The Koliště park is adjacent to a road with heavy traffic (33,000 cars/d). It occupies a large walking-friendly area, and there is a very popular restaurant in the middle of the park. However, due to the traffic-laden road, the location is not a popular target for sports, children’s activities, or picnics. The air quality was measured near a junction of two main roads.
Tyršův sad is a very small park in the city center, situated inside a courtyard. This park is mostly used only for short walks, especially with dogs. The air quality measurement was performed in the middle of the area.
The devices were installed together at the place of interest.
2.2. Instrumentation
The NO, NO2, O3, and PM10 concentrations were determined by using two Airpointer units (Recordum Messtechnik GmbH, Austria). These devices measure pollutant concentrations via separate modules utilizing type-approved reference methods (NO2/NOX, O3) classified as relevant by the EU, WHO, US-EPA, and other competent responsible organizations worldwide.
The measurement principle to define the levels of NO2/NOx is chemiluminescence (EN14211). The Airpointer NOX module was equipped with a delay loop to measure NO and NO2 from the same sample. An external calibration gas with a concentration of 425 ppb NO in N2 (SIAD, Italy) was employed to periodically check the span point.
The O3 measurement principally exploits UV absorption (EN 14625); for the given purpose, an internal ozone generator to allow regular span point checking was applied.
The parameters are calibrated annually by the Slovak Hydrometeorological Institute.
The Airpointer PM10 module utilizes nephelometry for measuring solid particles’ concentrations. Gravimetric measurements of PM10 concentrations executed within 24 h intervals were carried out to calibrate the nephelometric method. Sequential samplers SVEN LECKEL SEQ 47/50-CD (Sven Leckel Ingenieurbüro GmbH, Germany) were employed for the calibration. The particles were collected on cellulose nitrate filters with the porosity of 1.2 µm (Merck, Germany) and weighed on a Mettler Toledo MX/A microbalance.
The meteorological parameters (air temperature, relative humidity, air pressure, wind speed, and wind direction) were measured by using a compact meteorological station integrated with the Airpointer. These parameters are regularly calibrated by the Czech Metrology Institute.
The data from the Airpointer were downloaded as CSV files and saved in the form of Microsoft Excel files (XLSX). The concentrations measured in ppb were converted to concentrations in µg m
−3. The medians, upper and lower quartiles, and other percentiles for the monitored pollutants, temperature, relative humidity, and wind speed were calculated in MS Excel. The results were then processed by the Origin program (OriginLab, USA) to yield graphs. The dependencies of and relationships between the pollutant concentrations on the wind speed and direction were processed via the "openair" and "openairmaps" packages of OpenSource program R [
21,
22]. The package "openairmaps" supports “openair” for plotting on various maps. The maps include those available via the “ggmap” package, e.g., Google Maps, and leaflet ones to facilitate plotting bivariate polar plots. Our research utilized the "Esri.WorldImagery" map source and the "Non-parametric Wind Regression" (NWR) technique to display the concentration maps as bivariate polar plots.
2.3. Measurement Conditions and Positioning of Instruments
The concentrations of PM
10 and also those of the gaseous pollutants NO, NO
2, and O
3 in three parks within the city of Brno, the Czech Republic, were measured in one-minute intervals. The same scenario was applied to the meteorological conditions, namely, air temperature (T), relative humidity (RH), air pressure (p), wind speed (WS), and wind direction (WD). The NO
2 and PM
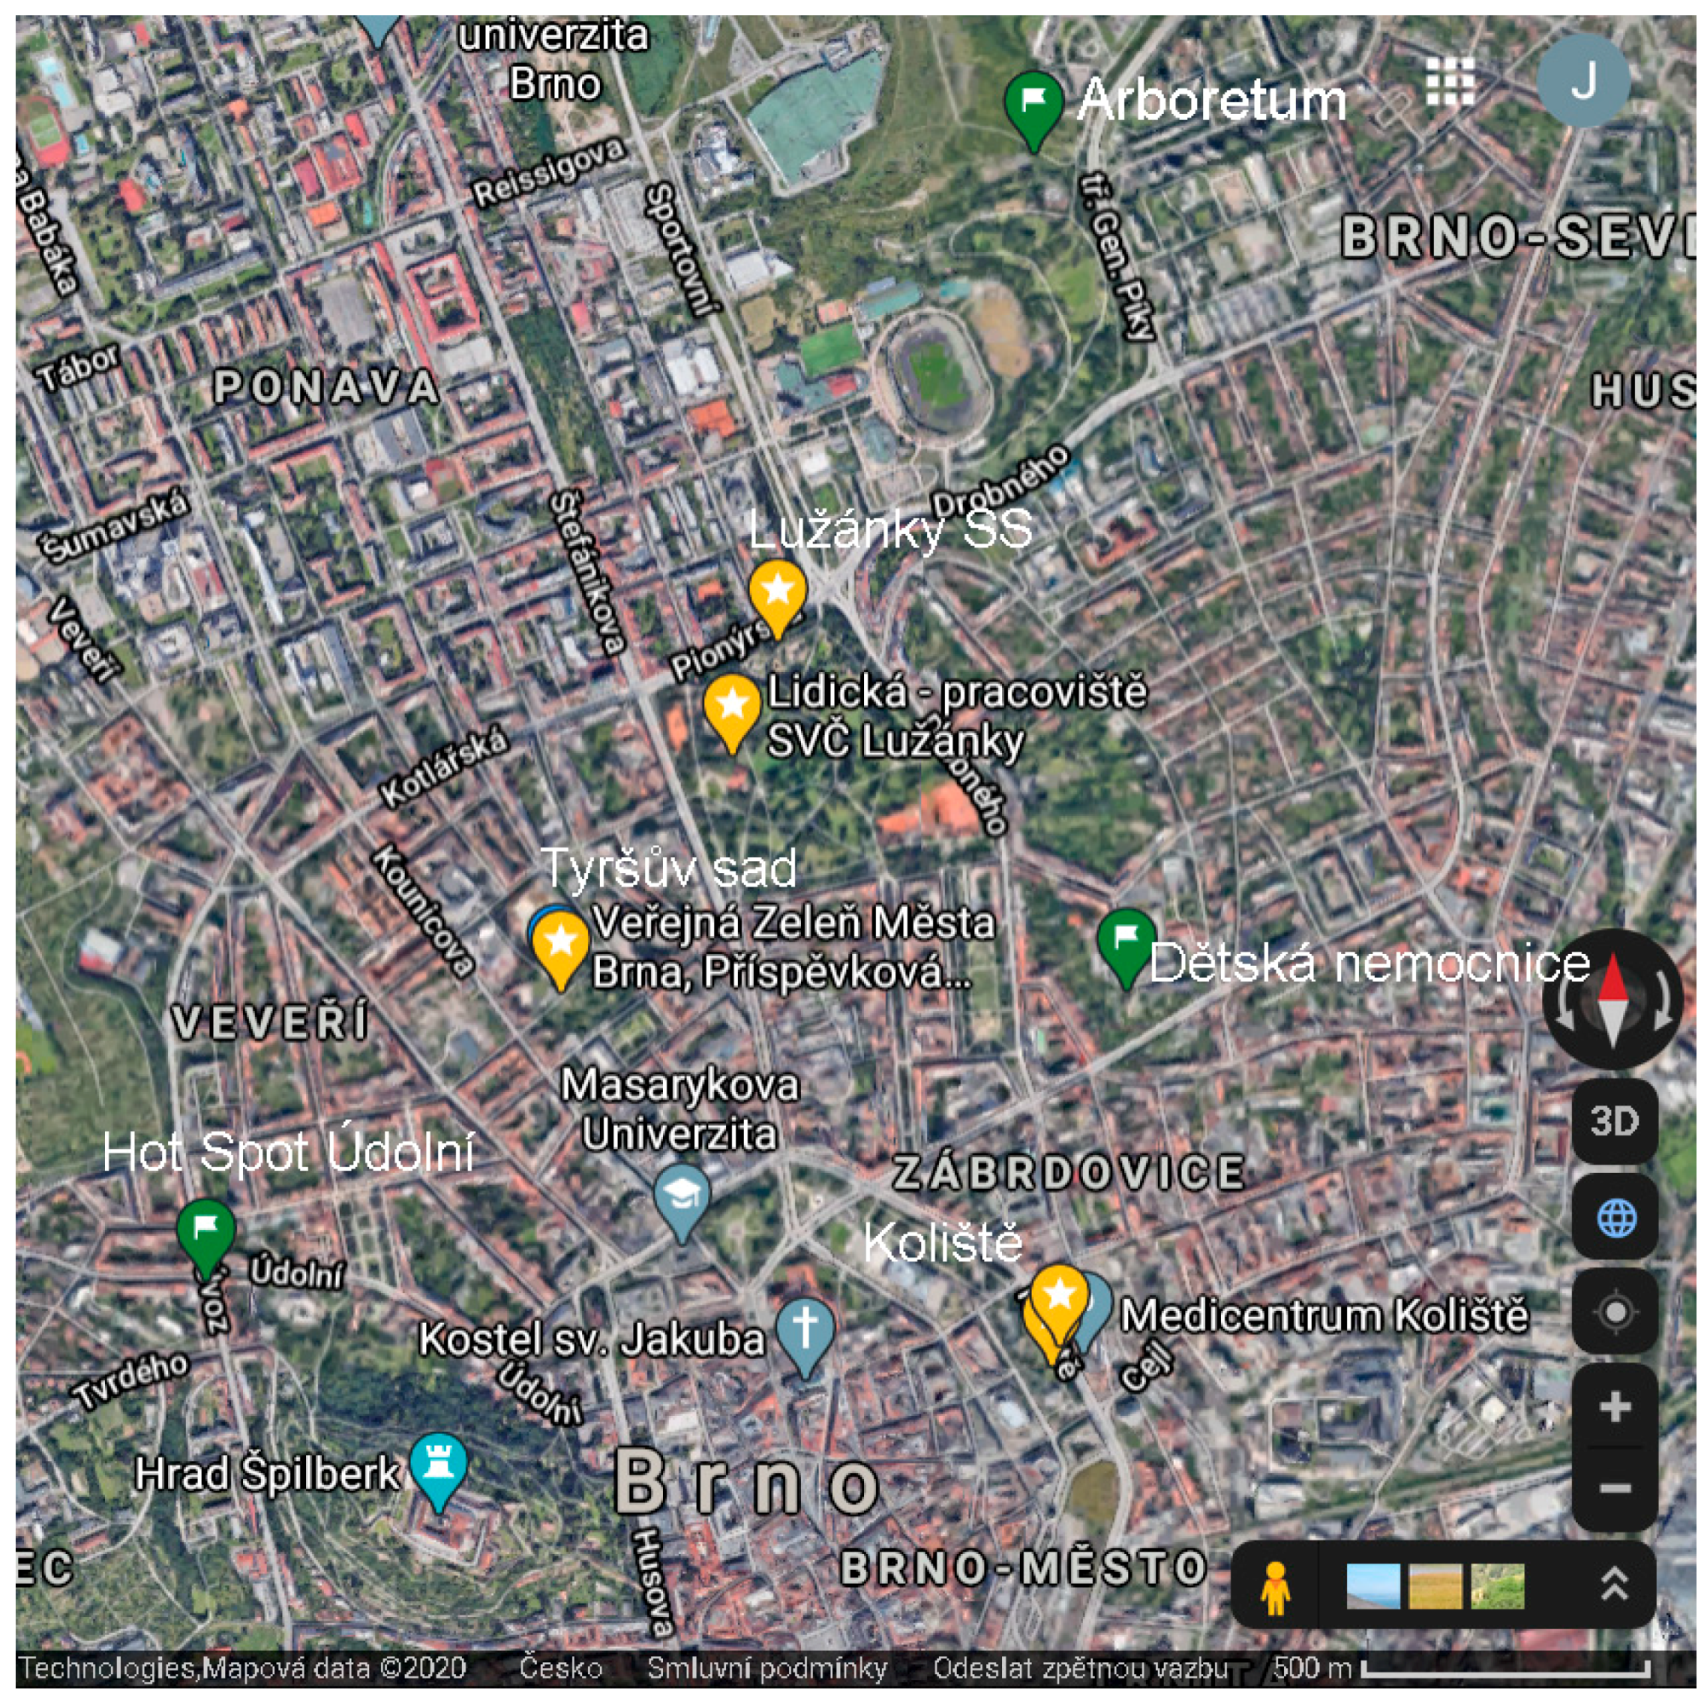
10 measurements at automated air pollution monitoring stations operated by the Czech Hydrometeorological Institute were employed for comparing the measurement results with those acquired at a heavy traffic locality (Údolní, the Hot Spot) and background localities (Arboretum—the natural city background station, and Dětská nemocnice—the commercial city background station).
Table 1 and
Table 2 show the geographic coordinates of the localities and display the time intervals of the measurement.
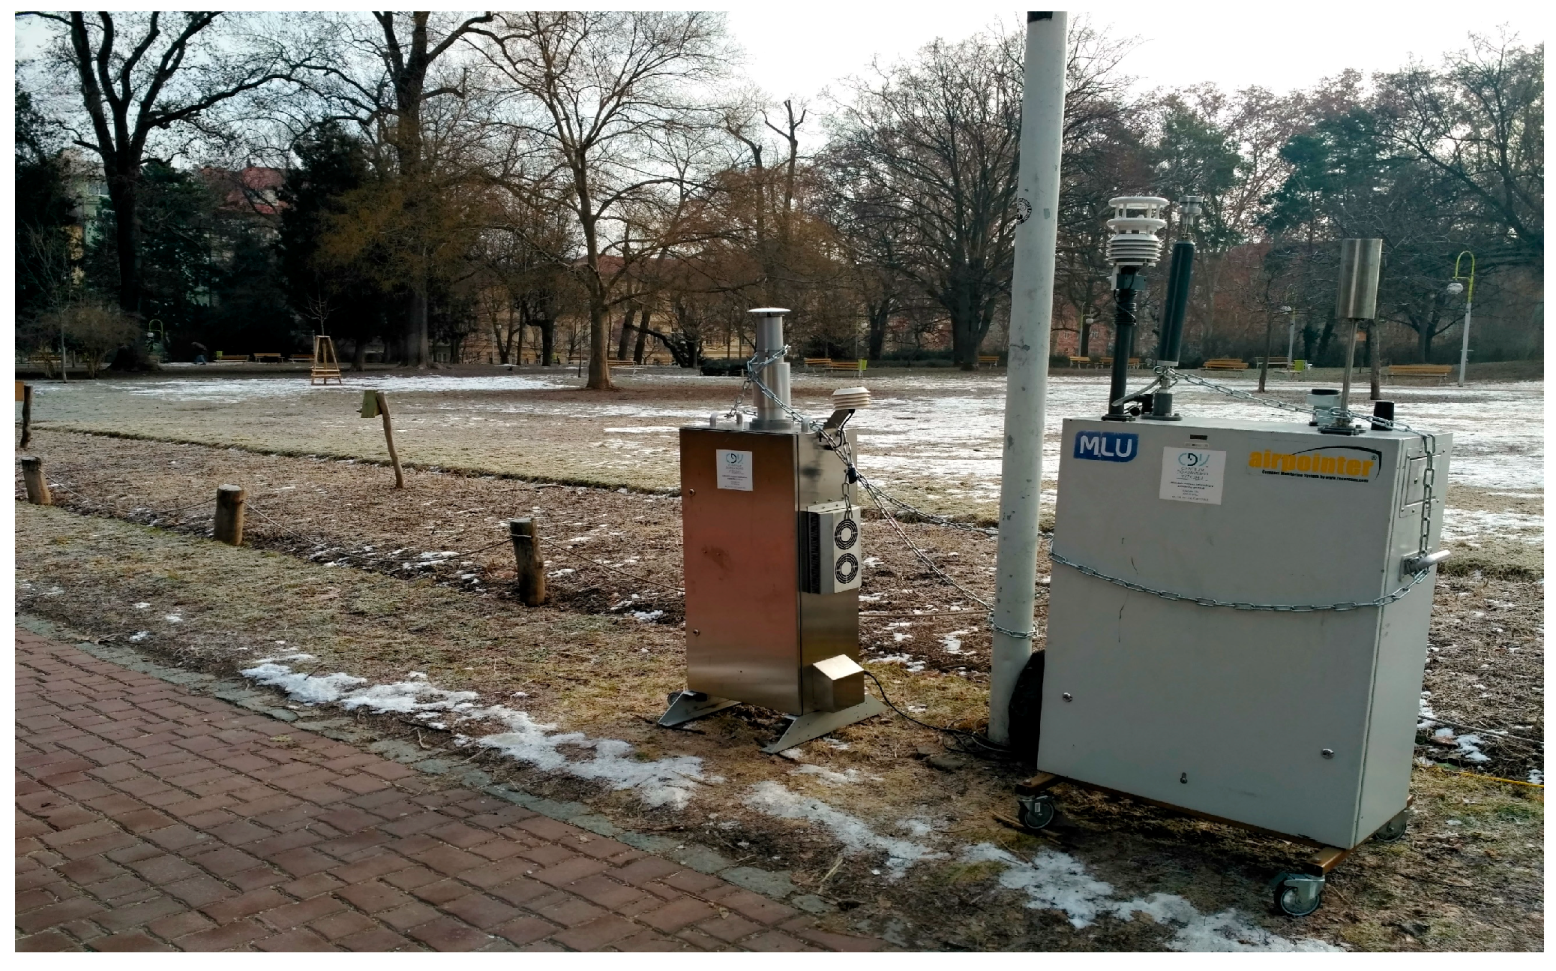
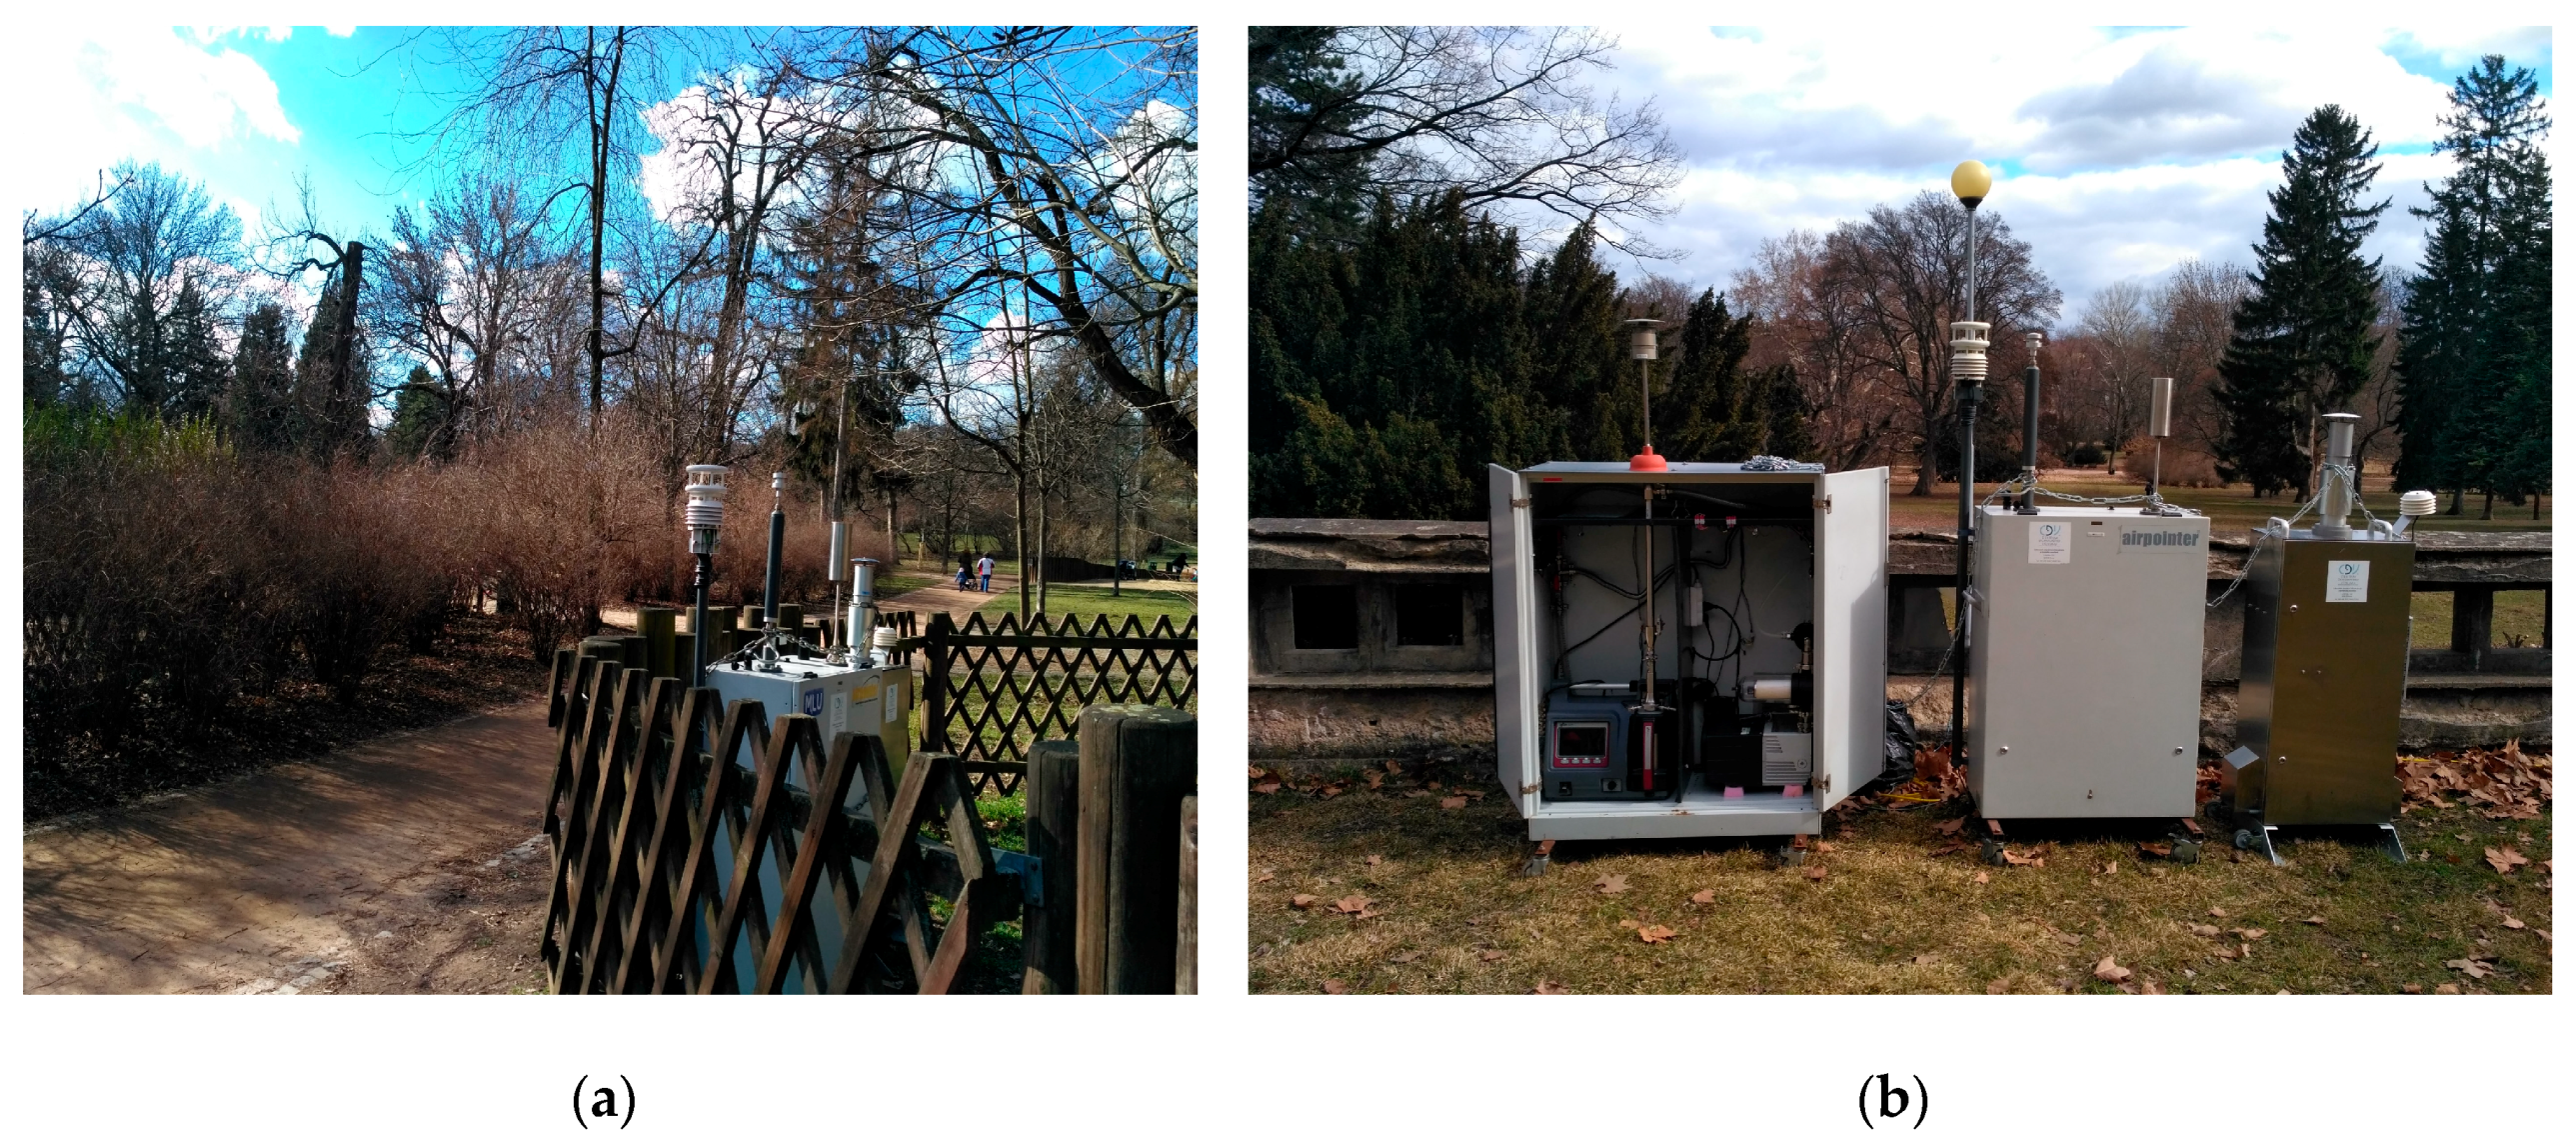
Figure 1,
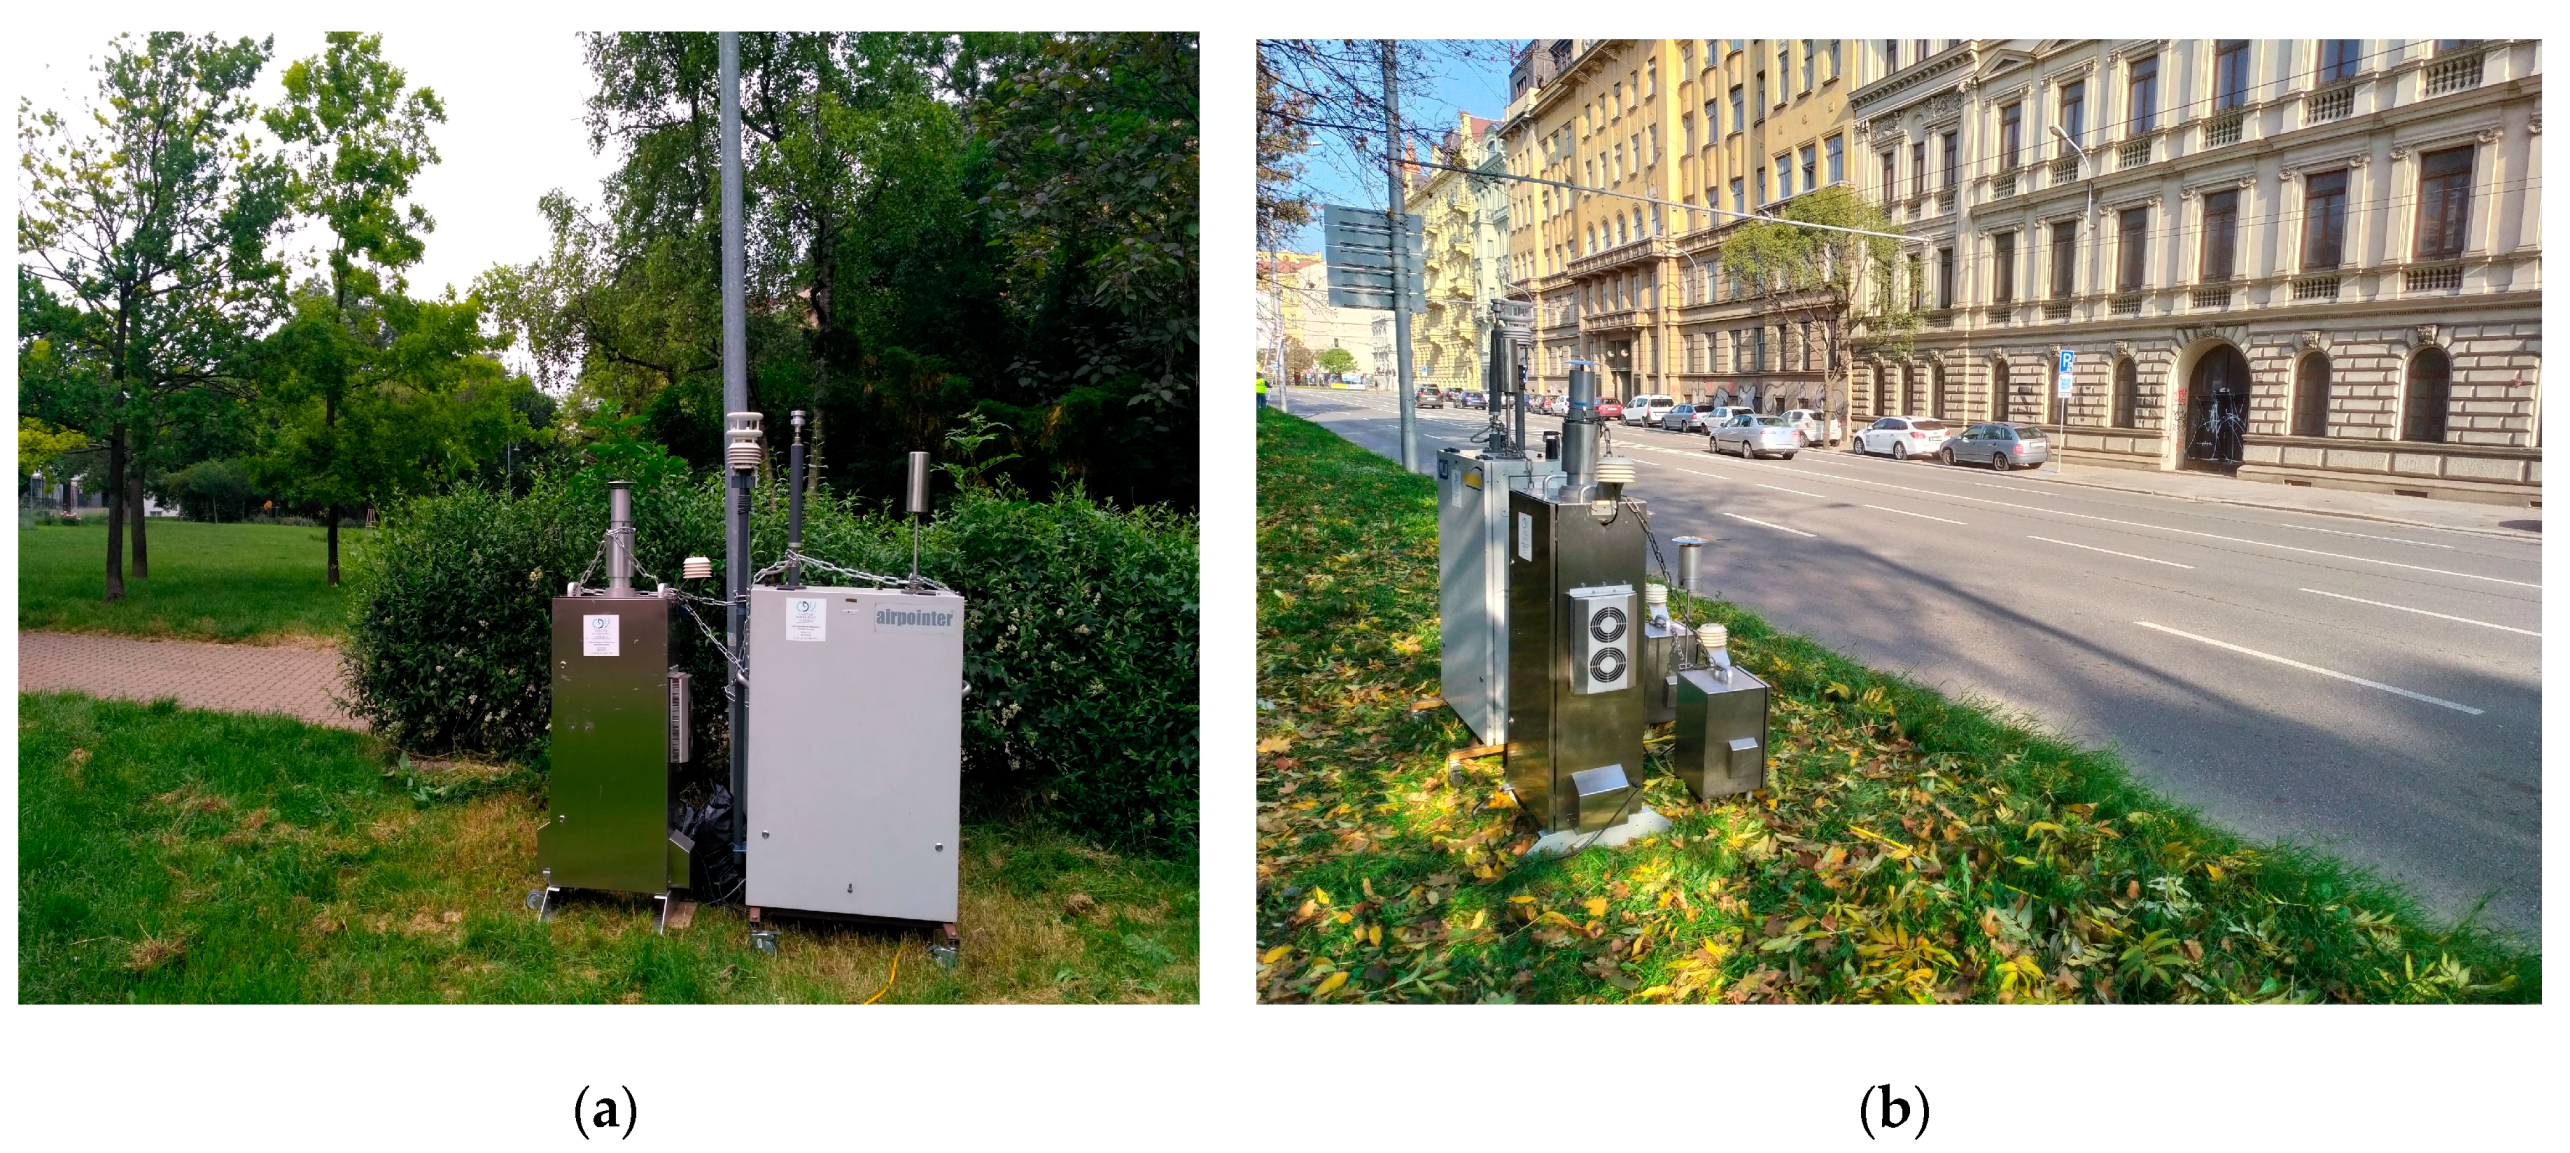
Figure 2 and
Figure 3 show the positions of the measurement devices at the sampling sites. The devices were secured against theft with chains and connected to a power supply with a cable. The progress of the measurement was checked via an Internet connection through a SIM card.
Figure 4 shows the location of the sampling sites on a map of Brno.
2.4. PM10 Calibration
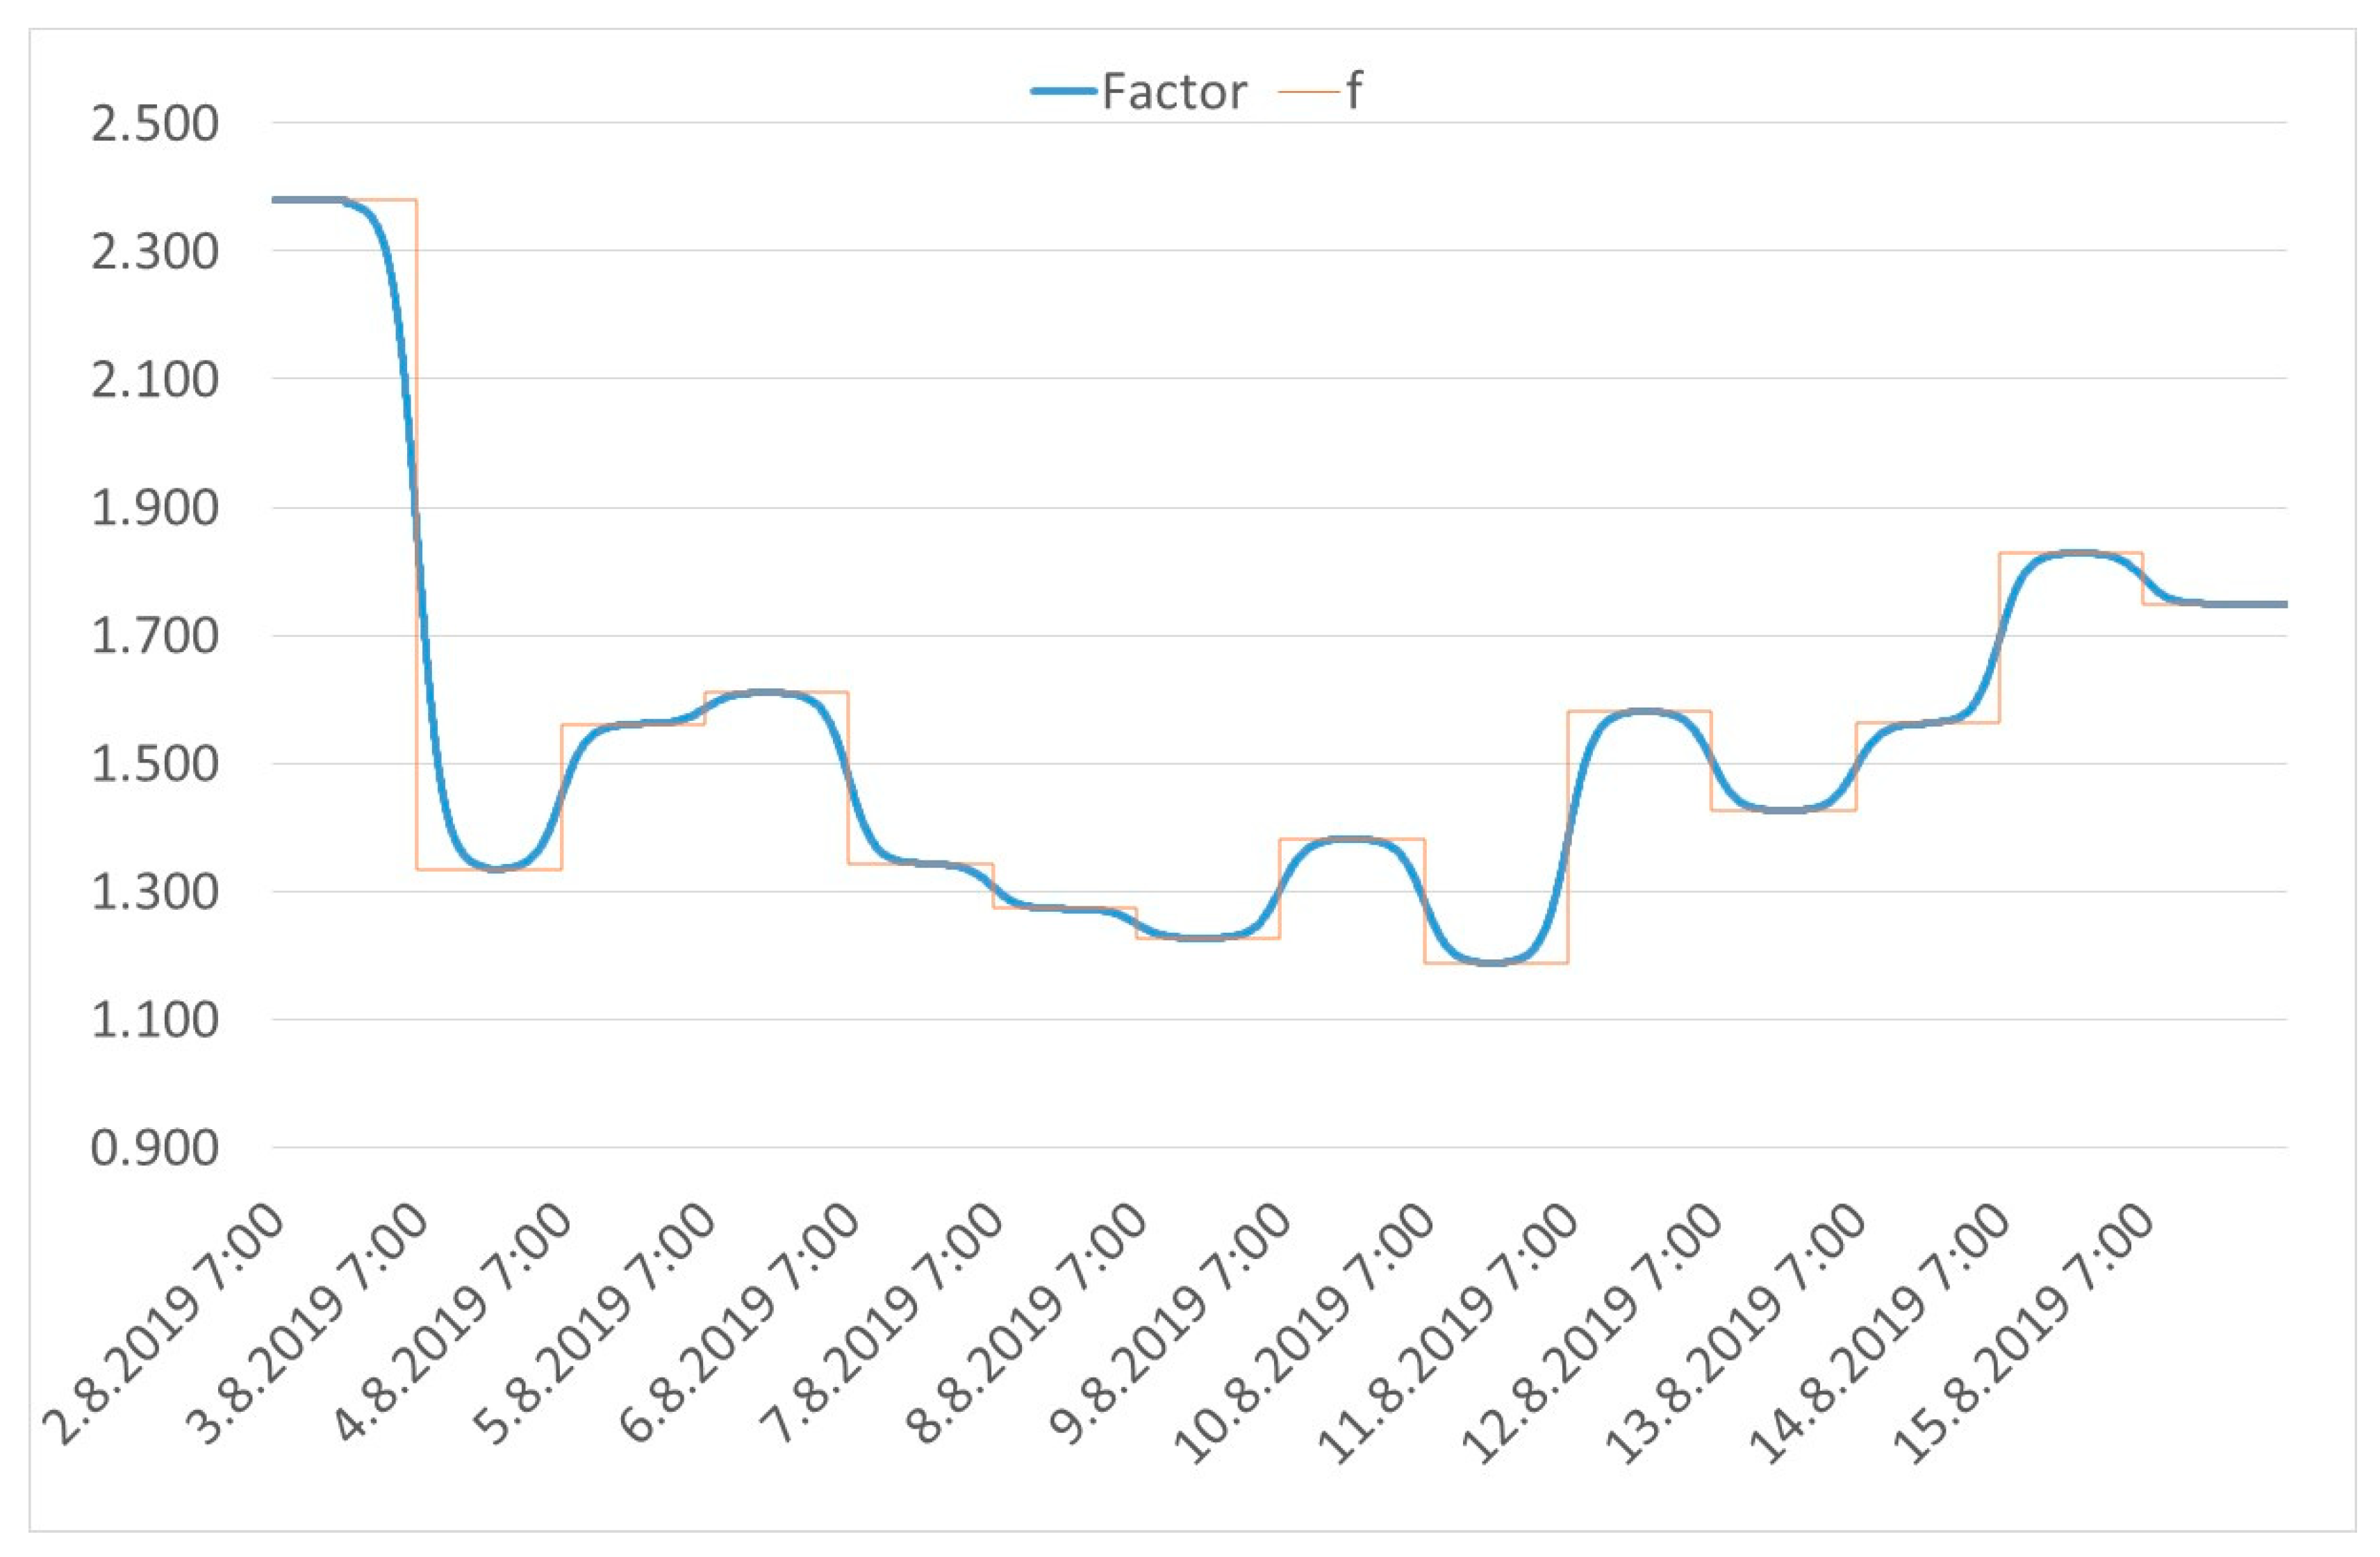
As nephelometric measurements are performed in one-minute intervals, the conversion factor was calculated for each 24 h measurement interval according to the formula
where
is the gravimetric PM10 concentration over 24 h (µg/m3), and
is the average nephelometric PM10 concentration over 24 h (µg/m3)
The calculated emission factor is discontinuous, and was thus smoothed by the function
where
Factor is the smoothed conversion factor in time t
fi is the conversion factor for the ith day
fi+1 is the conversion factor for the (i + 1)th day
p is the smoothing parameter (p = 0.004)
t is the time from the start of the measurement (minutes)
tday is the length of the day (minutes)
floor() is the rounding down function
tgh[] is the hyperbolic tangent function
The PM
10 concentration was calculated for every minute by the function
An example of the factors’ calculation for the site Tyršův sad is shown in
Figure 5.
3. Results and Discussion
Each measurement at a park is represented by a dataset with 20,160 observations, and the measurement at the Koliště road locality is represented by a dataset with 25,920 observations. Therefore, the results were summarized as percentiles and mean values to be calculated in MS Excel.
Table 3 shows the intervals in which 90% of the measured values are considered for each parameter.
The results of the measurements at the automatic air pollution monitoring stations were used to compare the air pollution concentrations in the parks and their vicinity. The hourly averages of the NO
2 and PM
10 concentrations were compared, as the data are measured in hourly intervals. The results are shown in
Table 4.
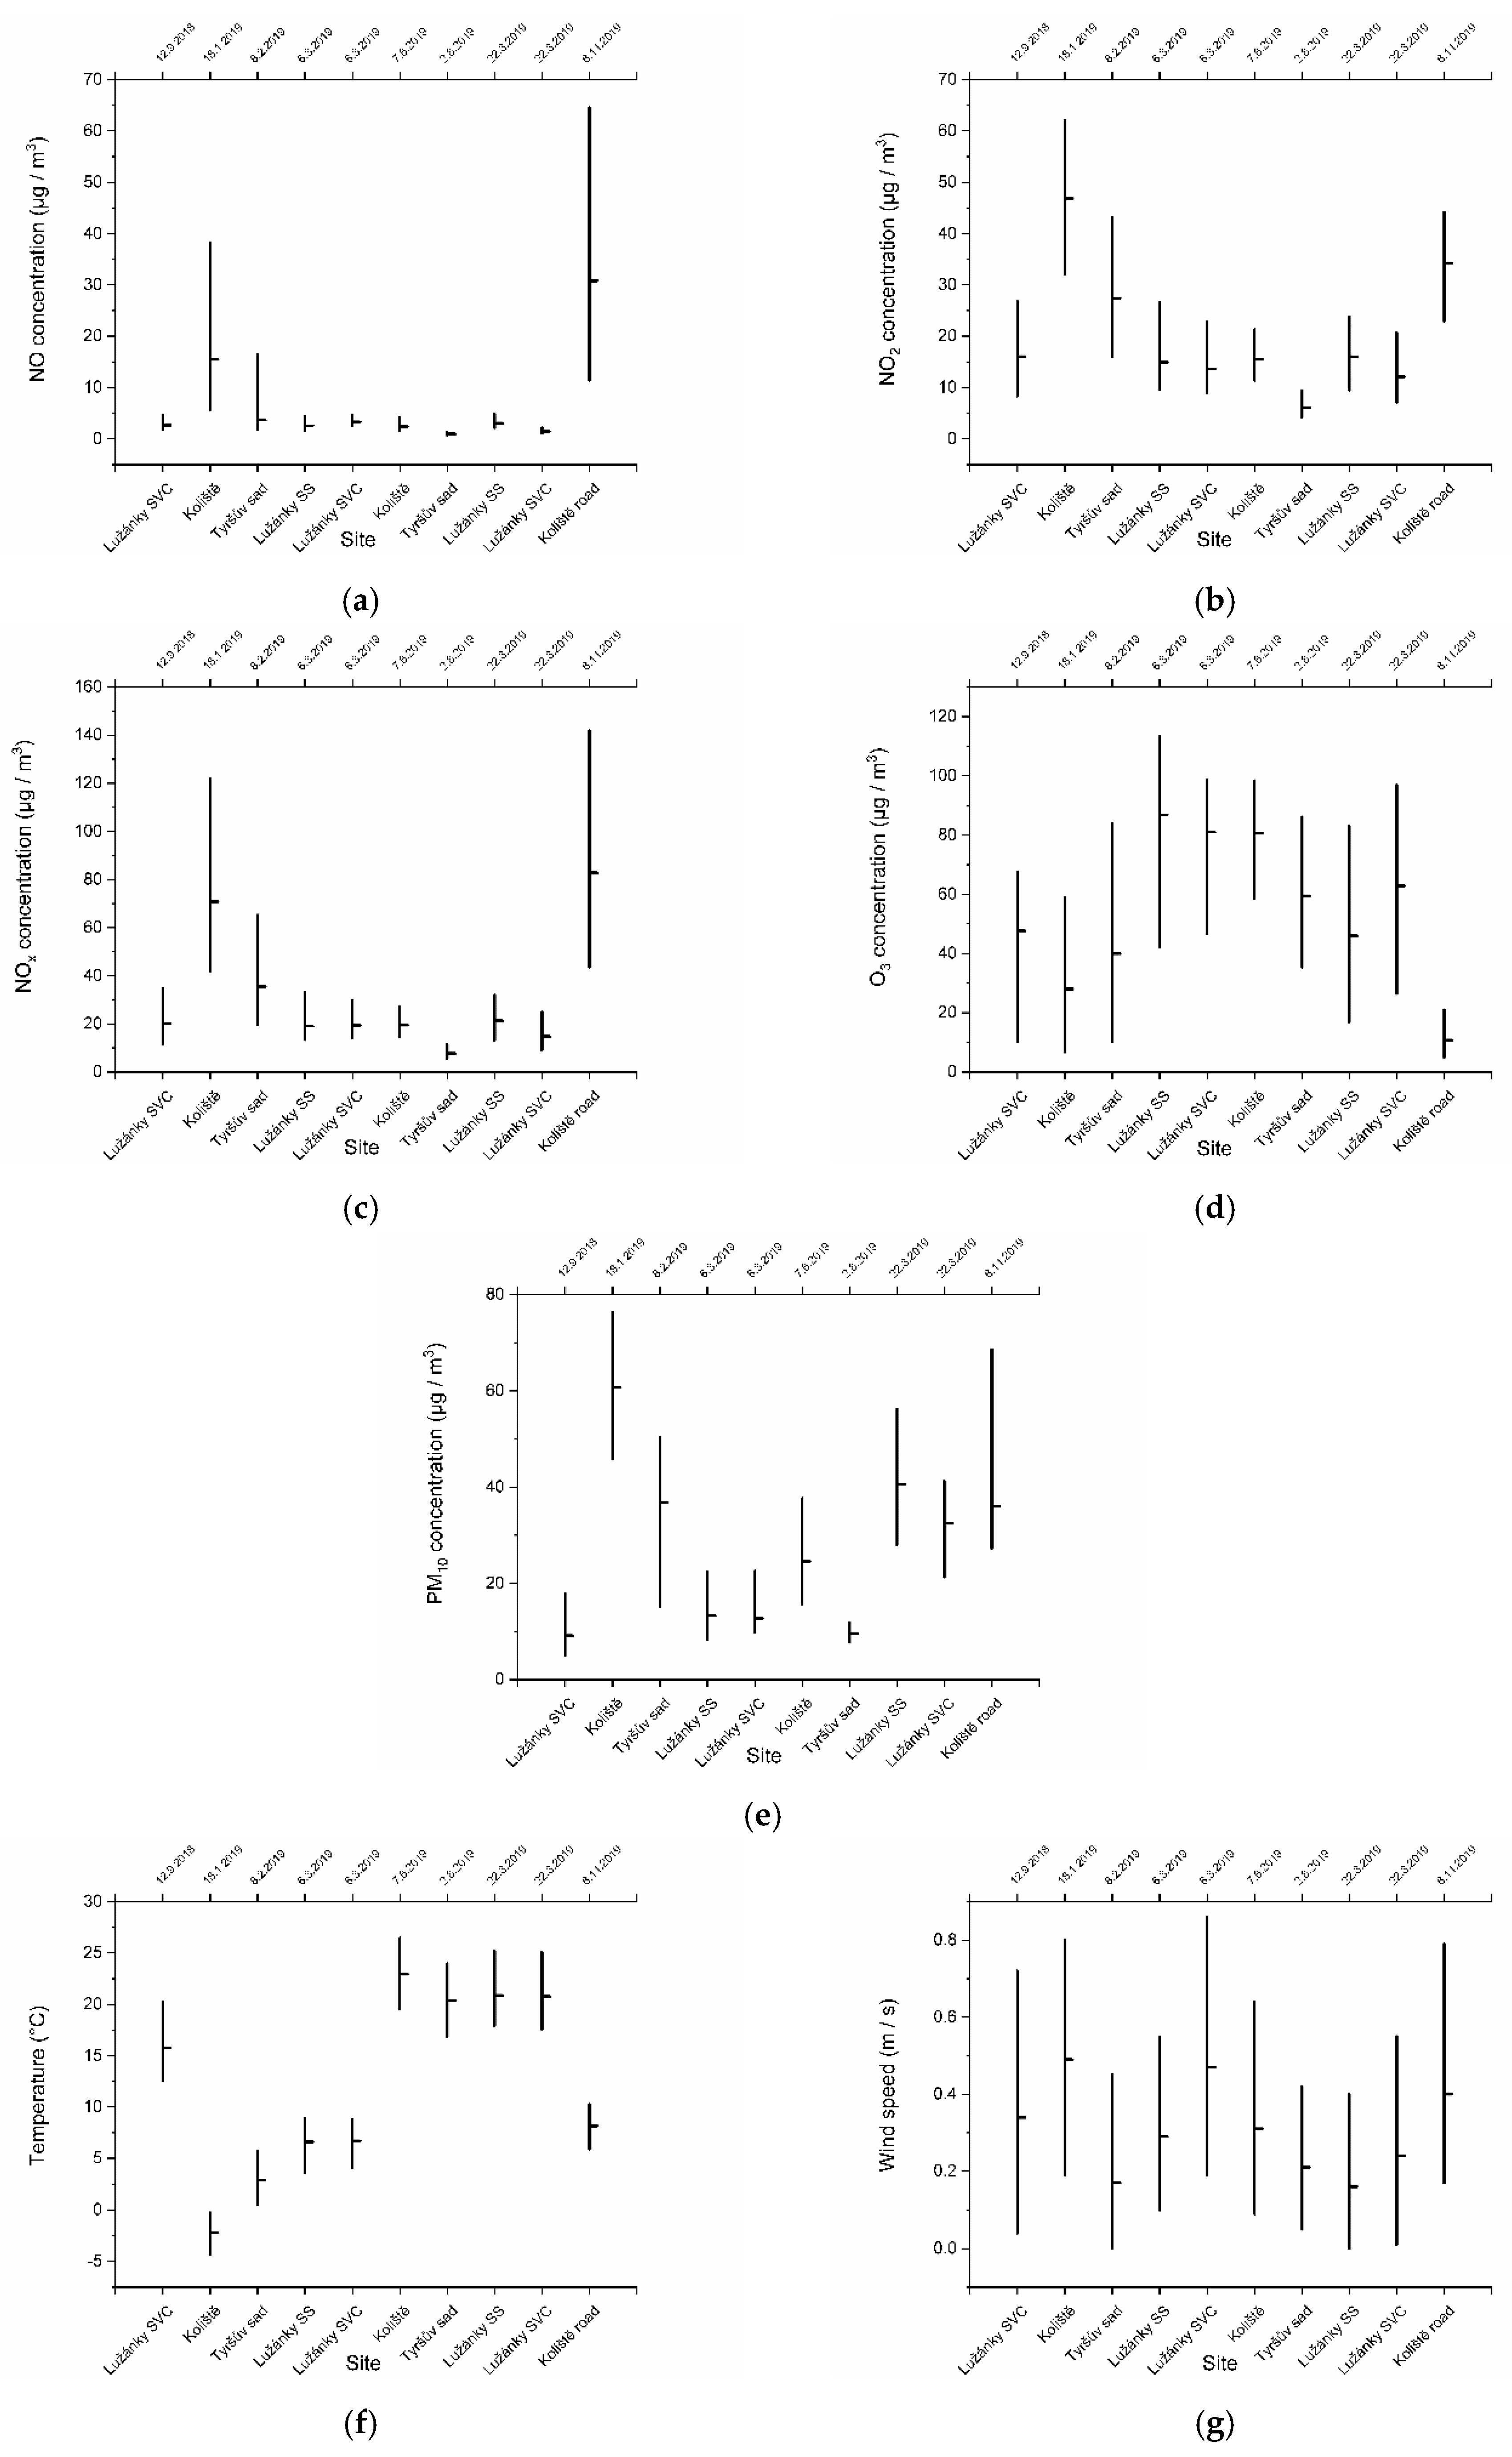
Figure 6 compares the individual mean values (medians) of the measured pollutant concentrations and meteorological parameters. The dispersions of these values are represented through the upper and lower quartiles, an interpretation that is more plausible than that rendered via the mean and standard deviations because the data have an asymmetric statistical distribution. This is also clearly seen in
Figure 6: the vertical lines, whose length represents the size of the first and the third quartiles, are not identically long.
The highest NO concentrations were measured in the immediate vicinity of the road adjacent to the Koliště park and then directly in the park; in both cases, the measurement was performed during a cold season (January, November). Similarly, the highest NO2 concentrations were determined next to the road adjacent to the Koliště park and directly in the park (but also in Tyršův sad); in all of the cases, the measurement was carried out during a cold season (January, November, February). The highest total concentrations of nitrogen oxides (NOx) were acquired, as in the NO, in the immediate vicinity of the road adjacent to the Koliště park and directly in the park, during a cold season (January, November). The highest O3 concentrations were measured in springtime, the lowest one in winter. The solid particles detected at Lužánky SVC and Lužánky SS exhibited a higher concentration in August than in the colder months (March, September), which is not a normal effect. This deviation arises from the fact that, in these localities, people often gather for barbecue parties and use the parks’ public cooking facilities during the summer months, whereas the other parks are not frequented for this purpose.
Figure 6f,g shows also the differences between the speeds and variations between the temperatures at the sampling sites, respectively. The March, February, and January temperatures reached significantly lower than the September, August, and June ones.
Figure 7a compares graphically the NO
2 air pollution in the parks, with the pollution measured at the reference stations, while
Figure 7b displays, in the same manner, the air pollution caused by PM
10. The individual measurement campaigns are separated by the red lines. As can be seen, the air pollution in the parks, with the exception of the Koliště park for PM
10, was lower than that at the traffic locality, and the pollution at the background localities approached the value. The exception concerning the Koliště park was probably due to the fact that this area is relatively narrow compared to Lužánky; thus, in wintertime, when the vegetation is leafless, it provides less from the dust generated on the nearby busy roads. Moreover, it is obvious from the representation that the parks ensure better air protection from nitrogen oxides than against dust.
The average concentrations of the measured pollutants were compared with the legal limits [
23,
24],
Table 5. The excess values are marked in pink.
It is possible to claim that in most localities the NOx limit for ecosystems and vegetation protection was exceeded, except for Lužánky SVC in March and August 2019, Tyršův sad in August 2019, and Koliště in June 2019. The NO2 concentration reached beyond the human health protection limit only in January 2019, when the lowest average temperature of all measurement campaigns was recorded. The PM10 concentrations exceeded the same limit only at Koliště in January 2019, Koliště road in November 2019, and Lužánky SS in August 2019.
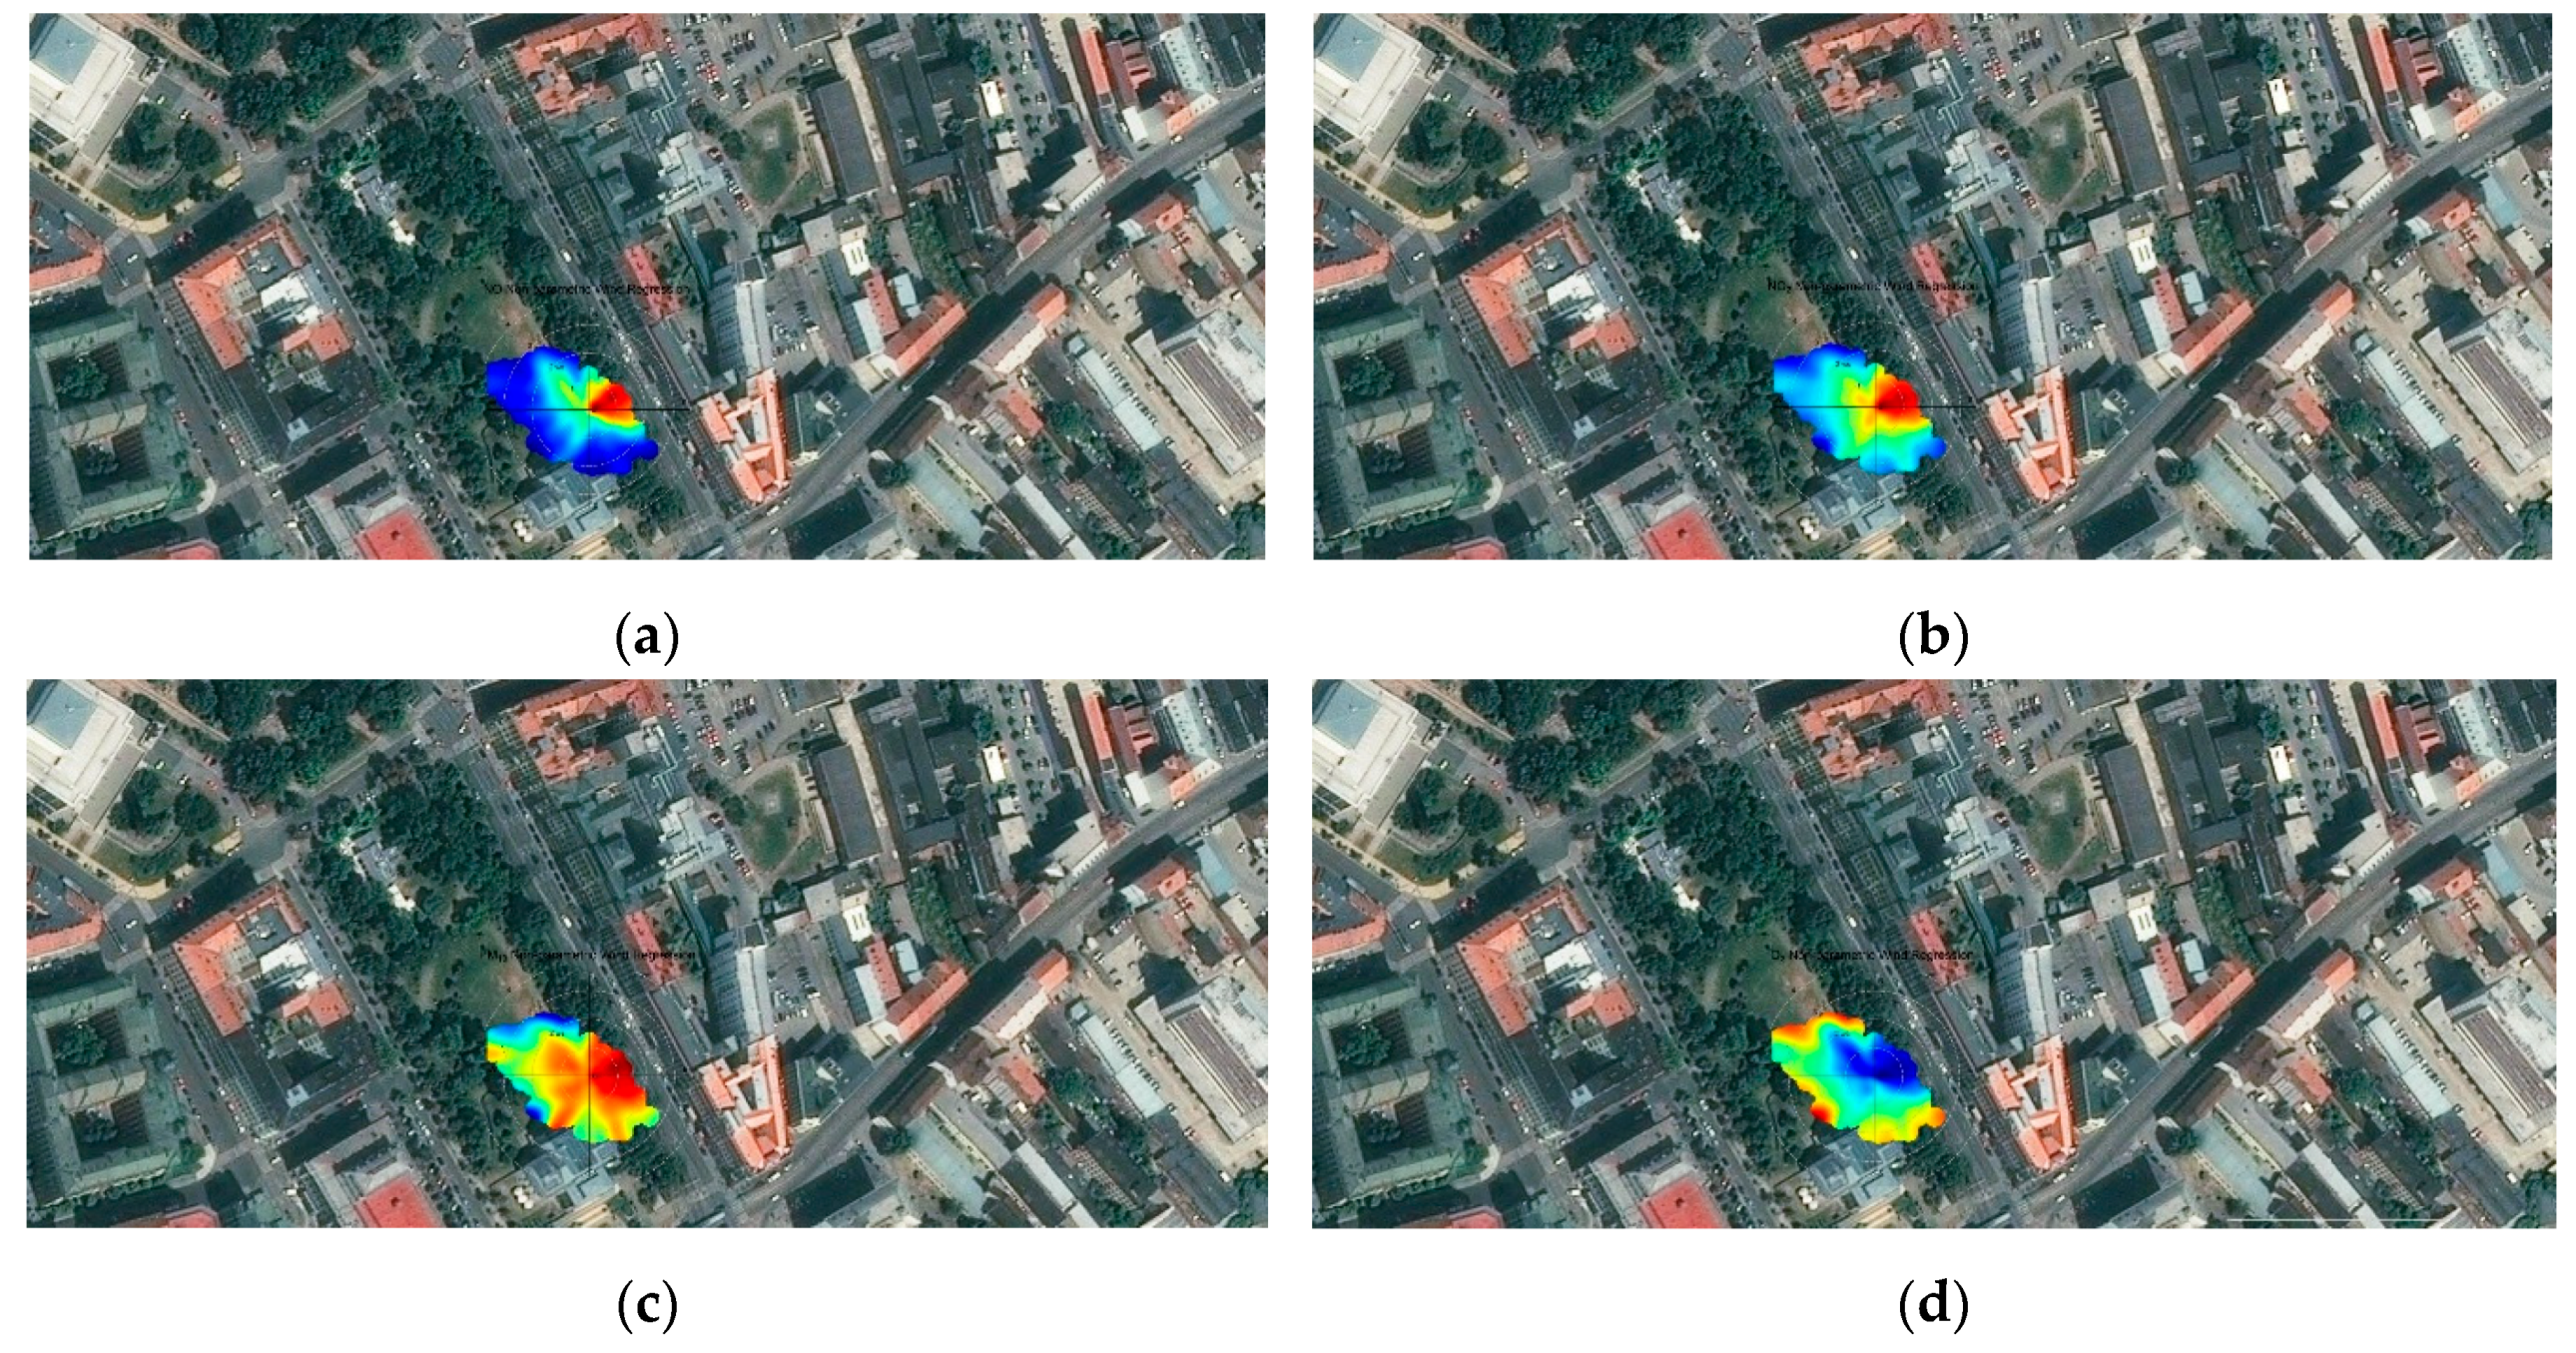
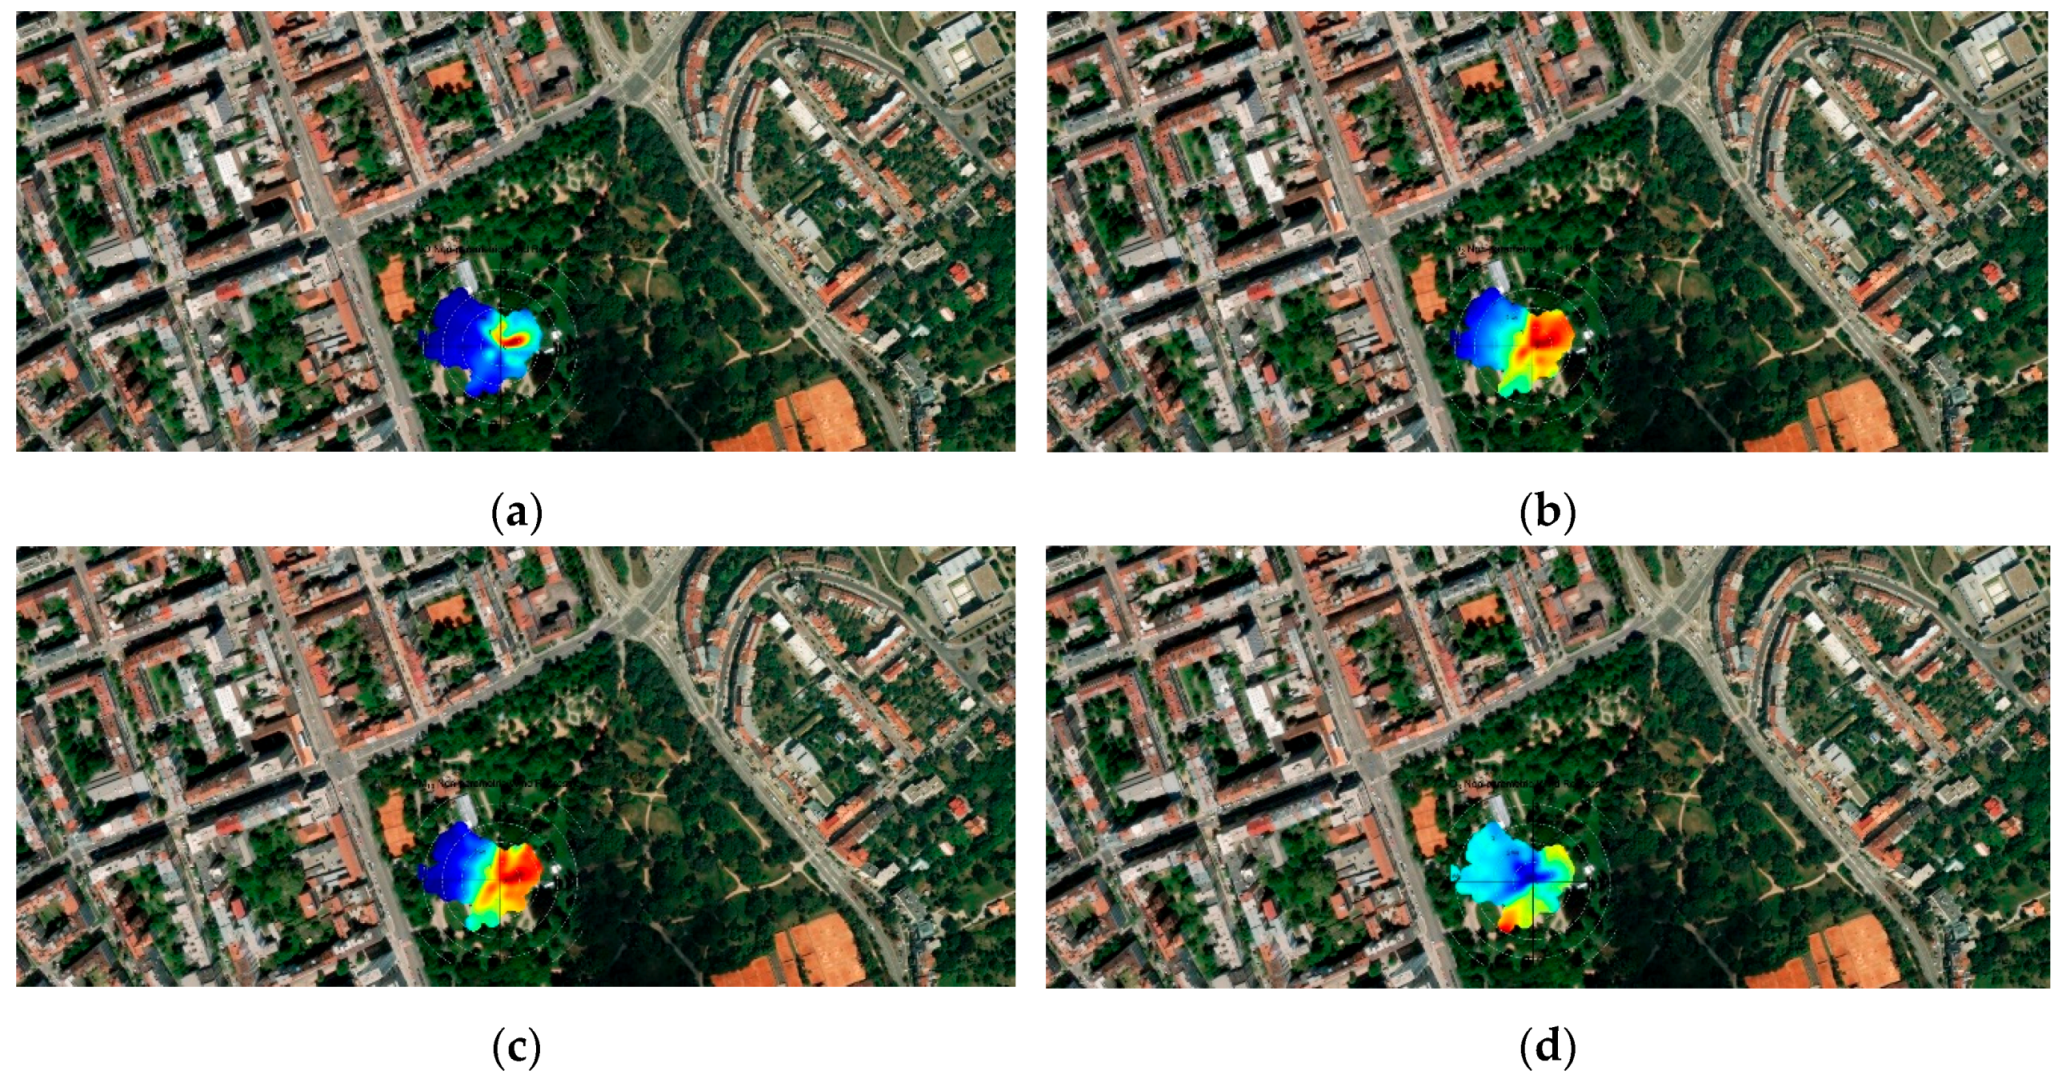
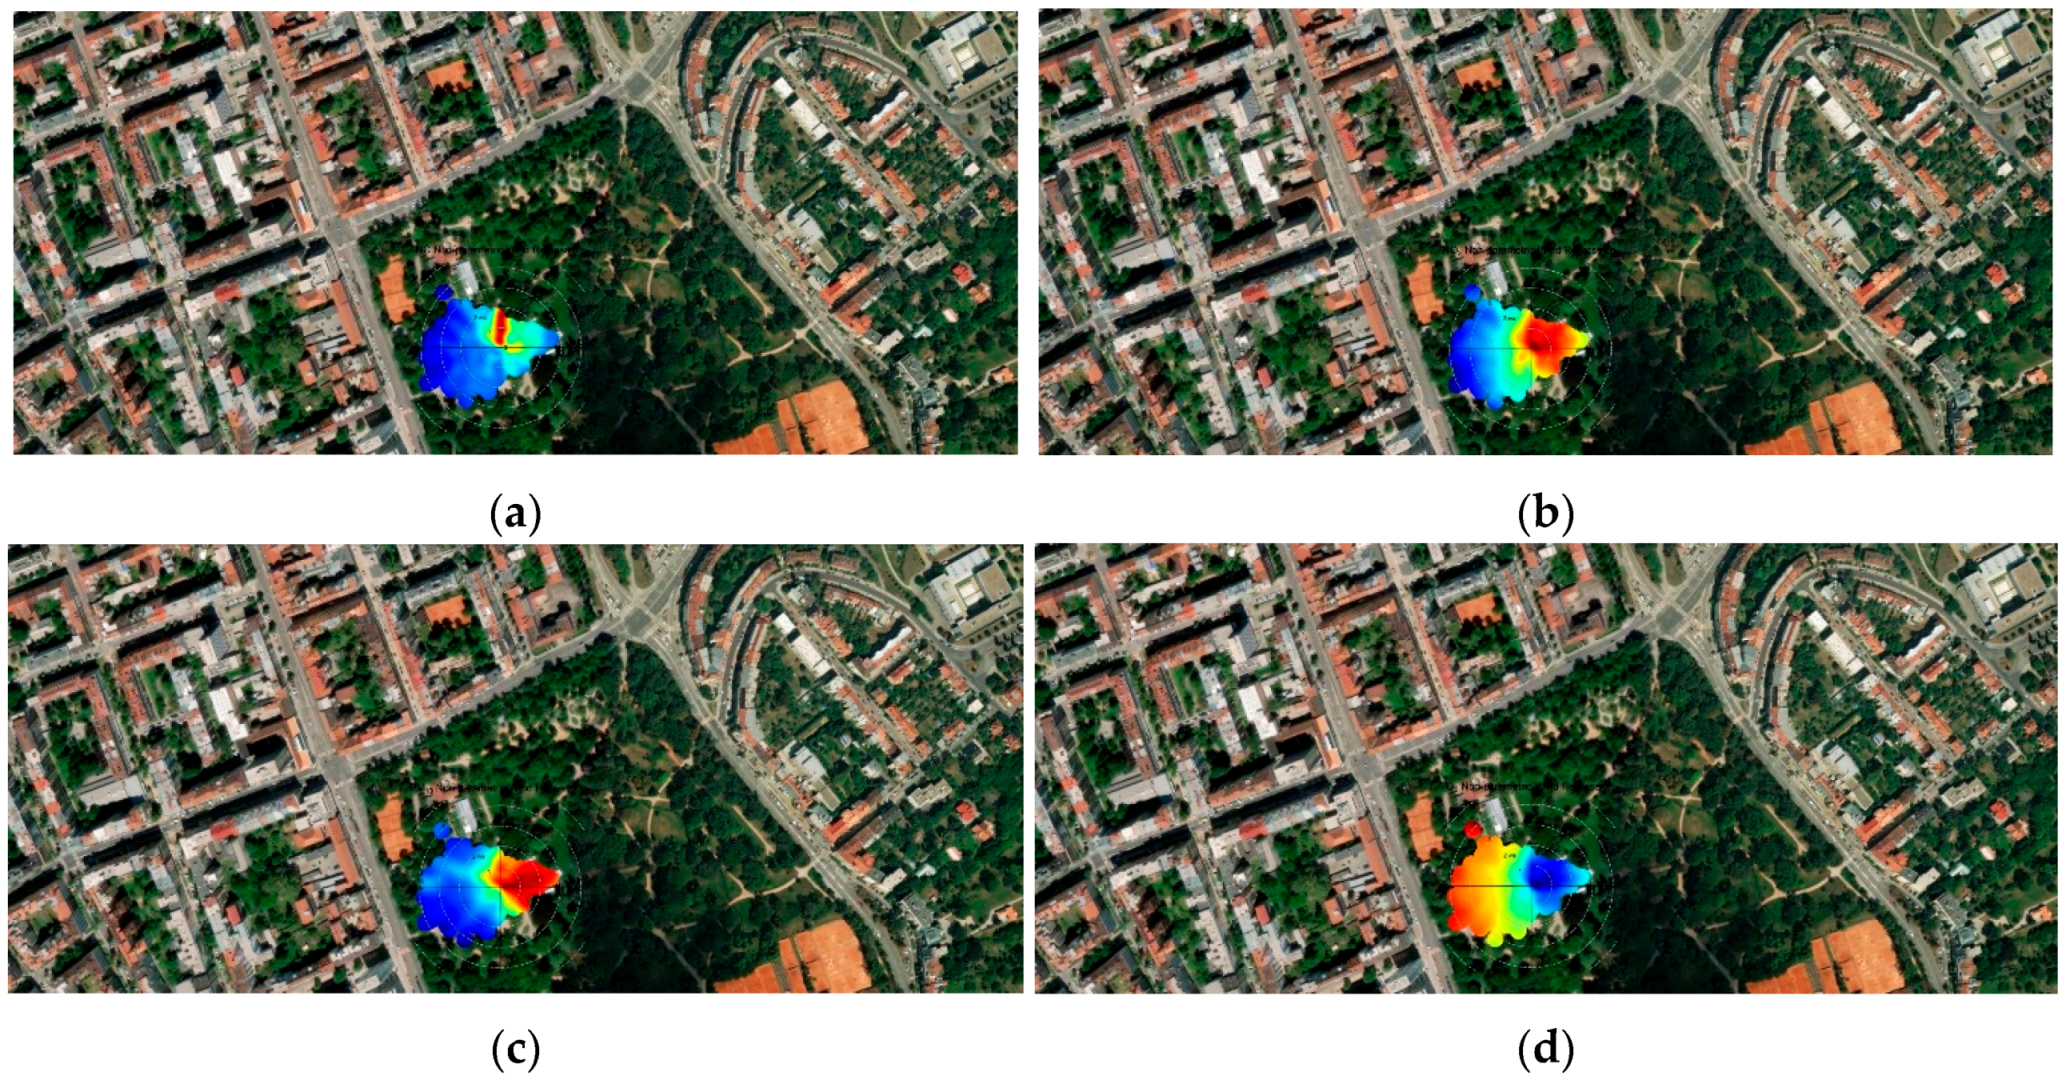
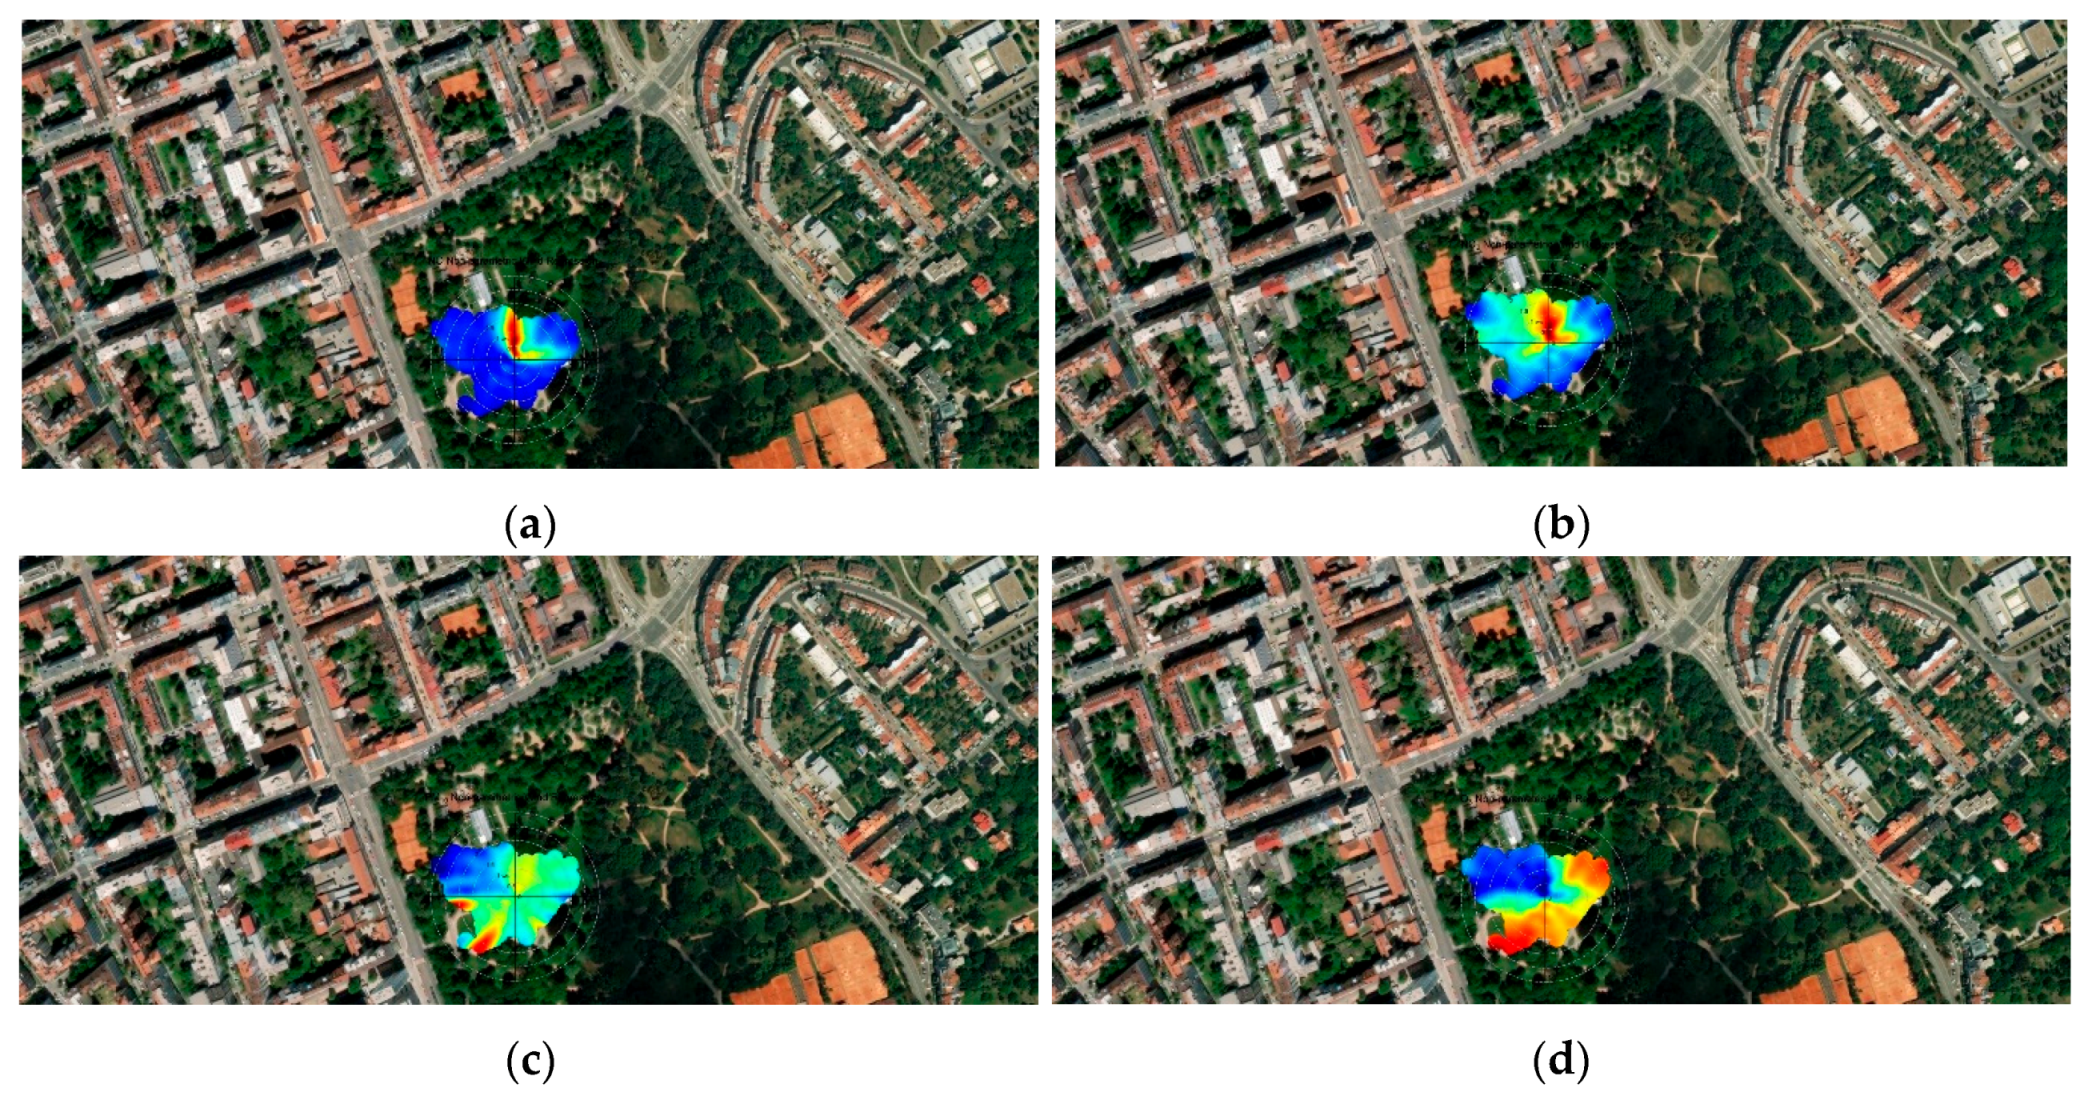
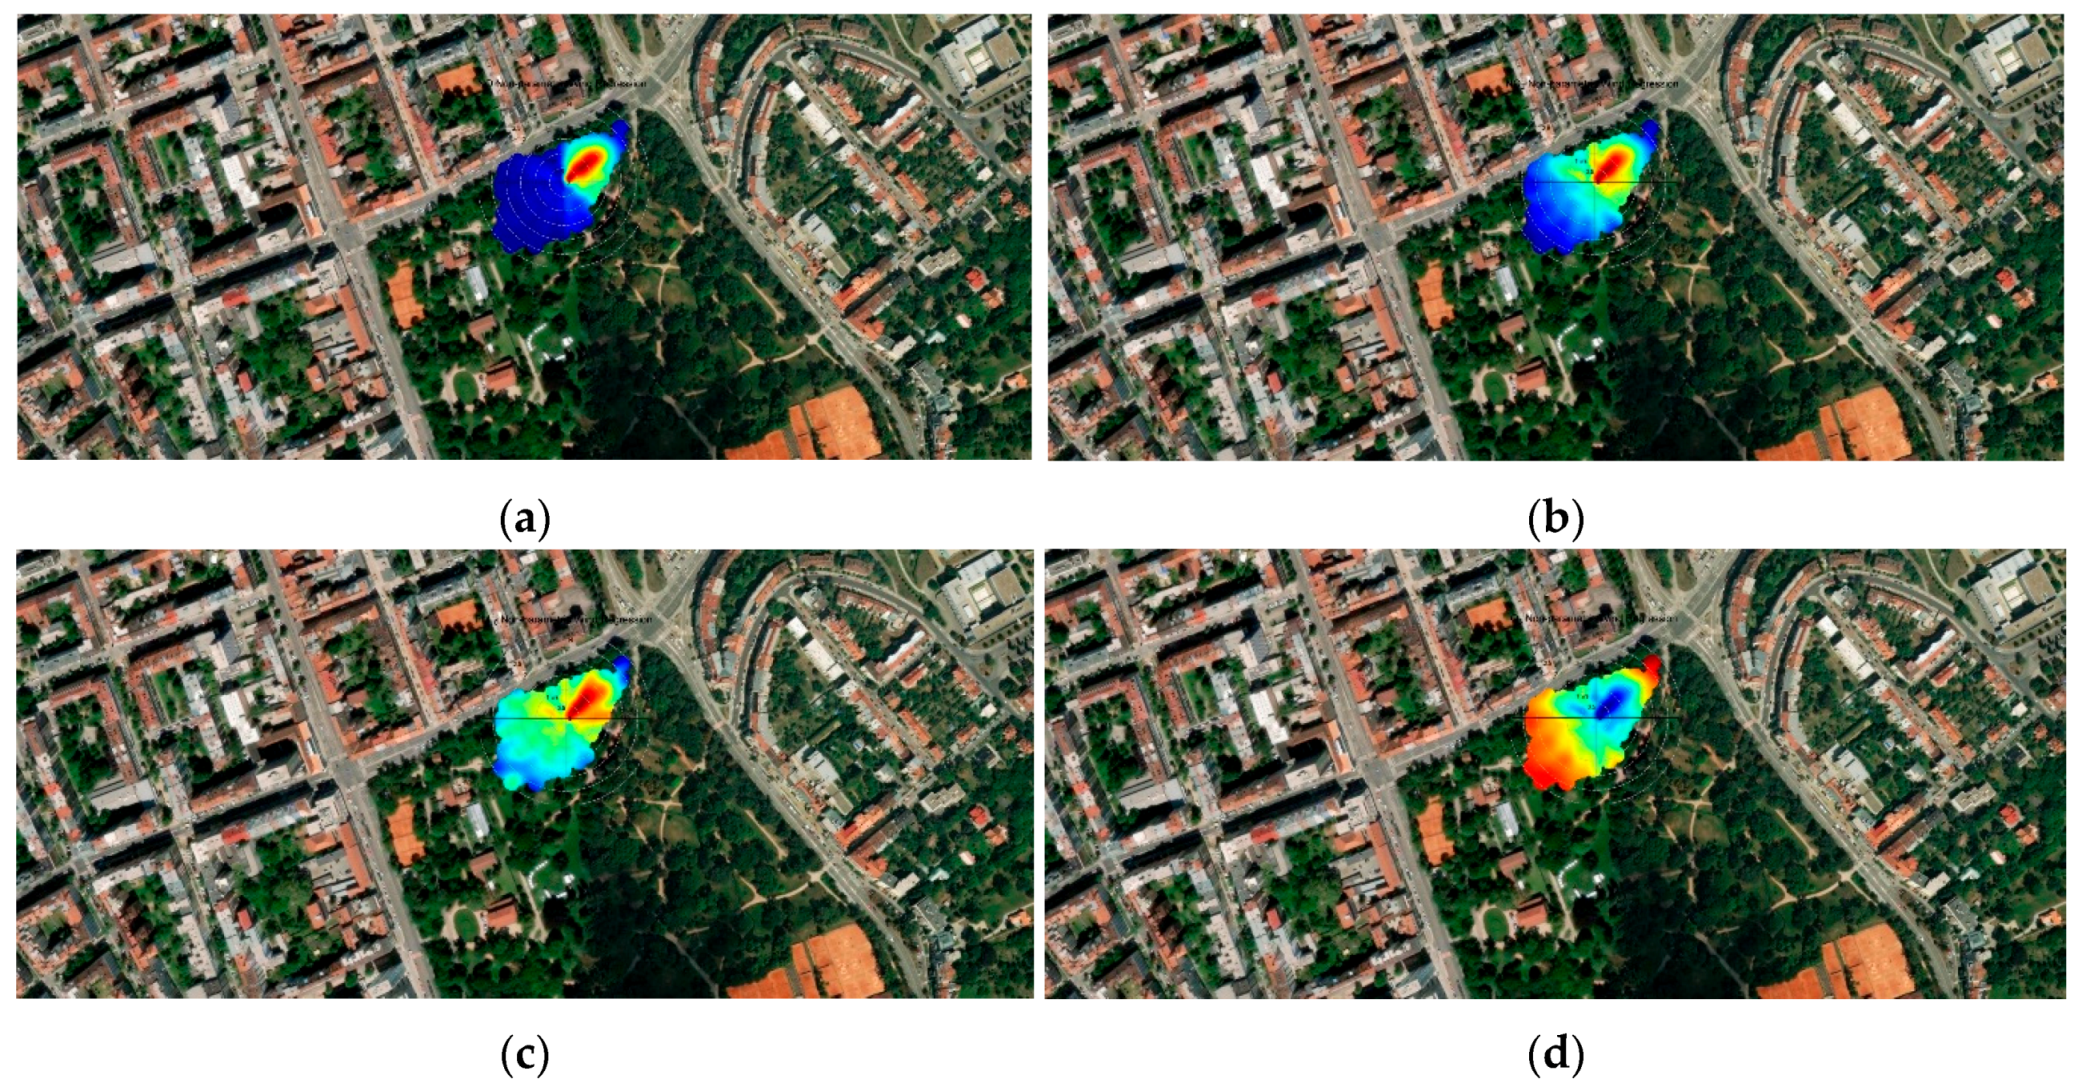
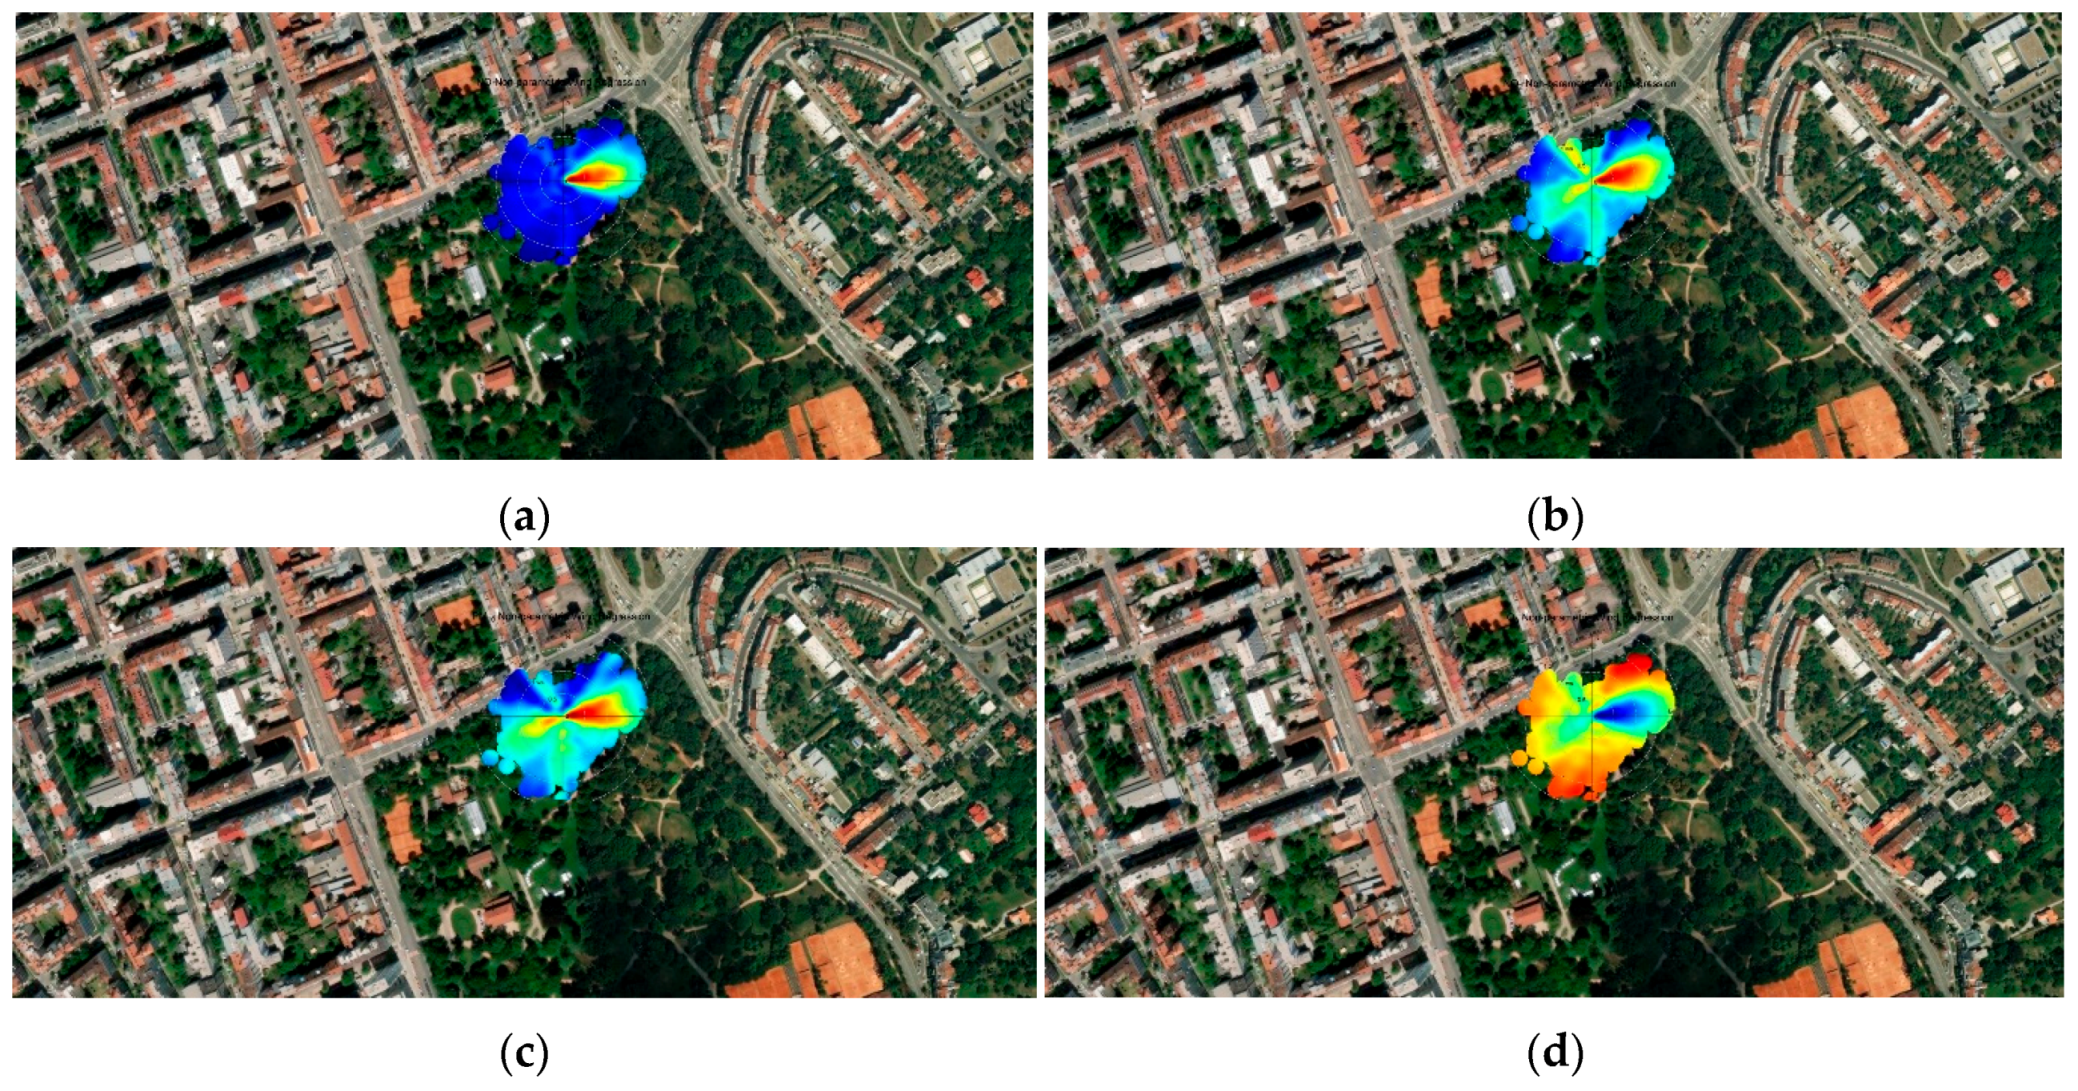
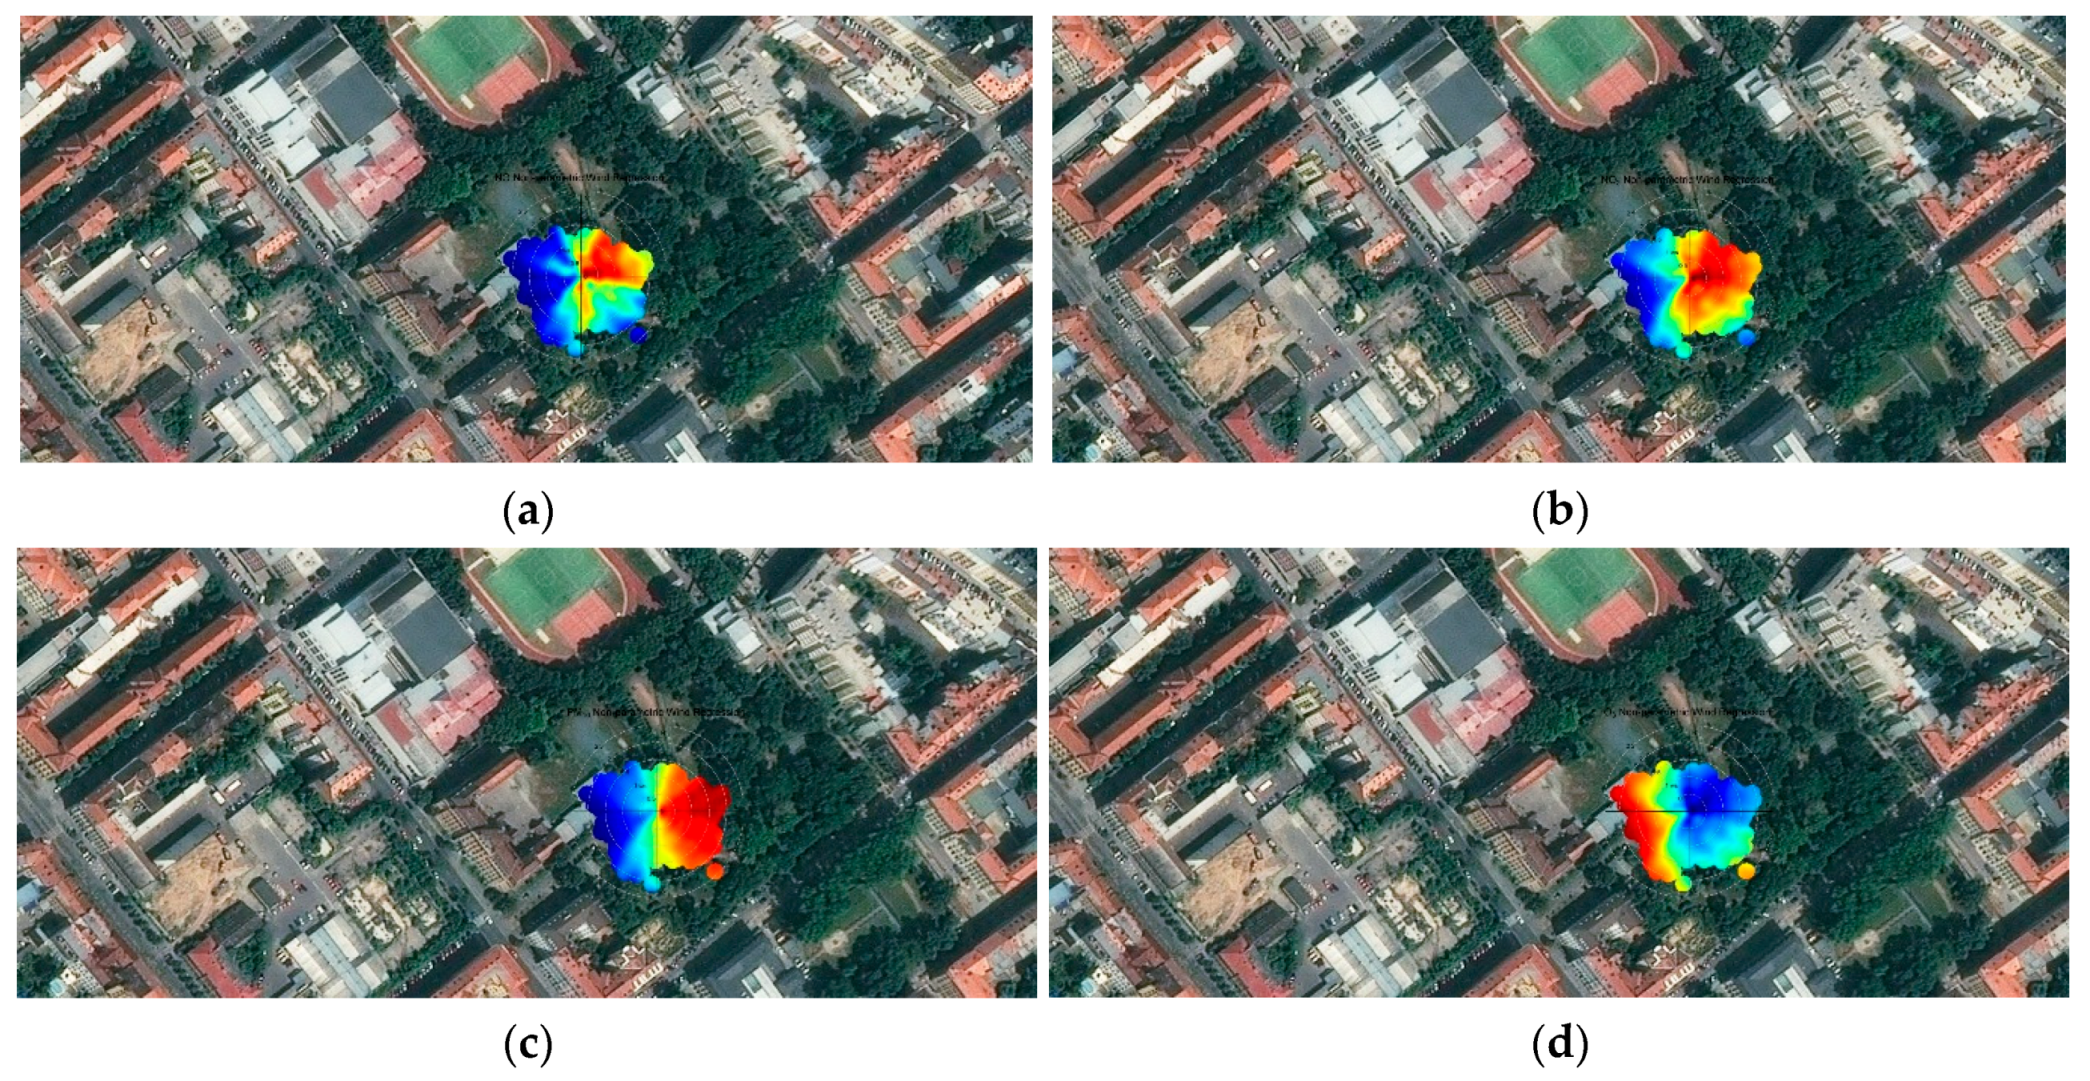
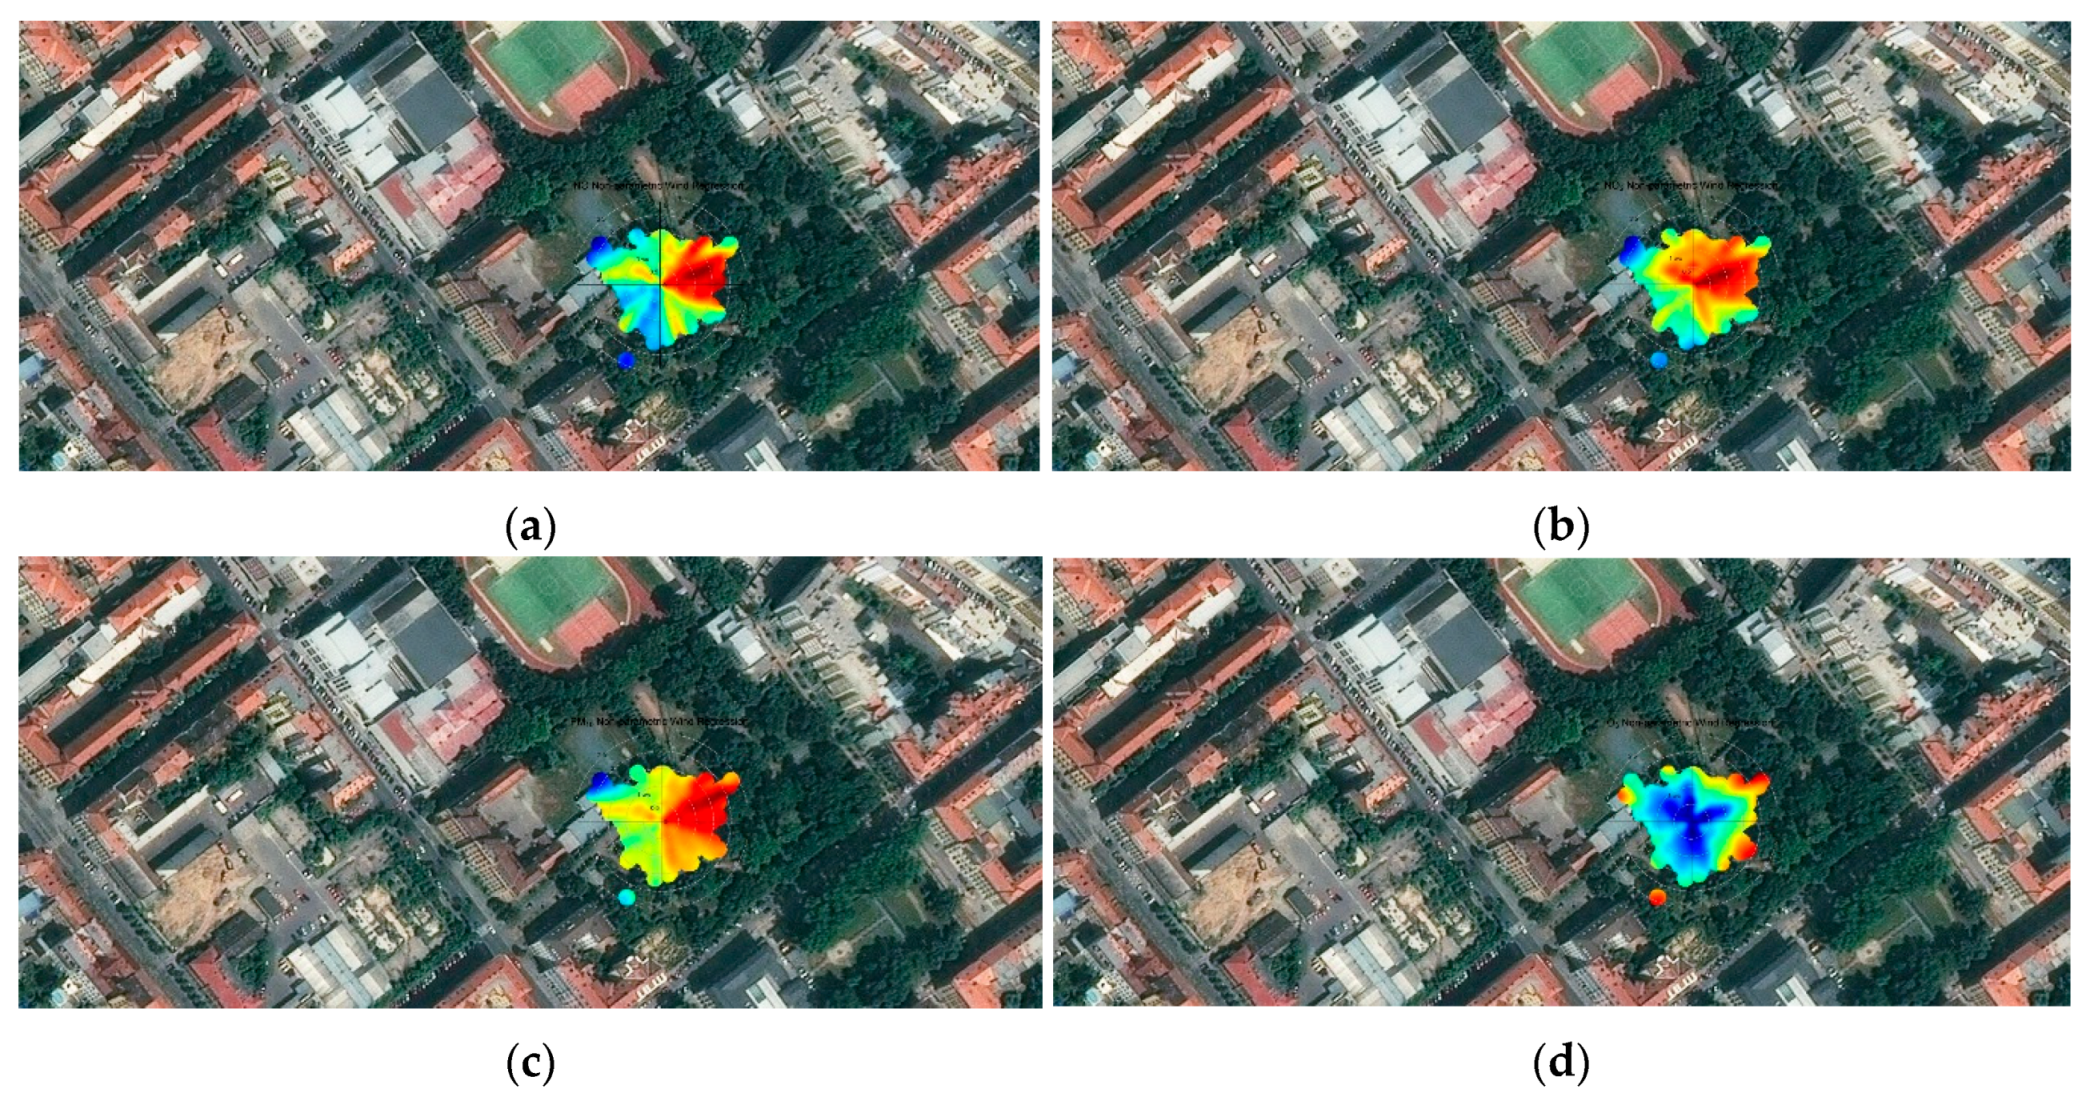
The analysis of the relationship between the individual pollutants’ concentrations, wind speed, and wind direction was utilized to identify the places from which the highest pollutant concentrations reached the sampling site. The concentration scale of the measured pollutants is shown in Figure 12.
Figure 9a,b shows that the highest concentrations of nitrogen oxides were measured with an east wind blowing from the adjacent road. Under the east to northwest wind direction, the lowest ozone concentrations were measured (
Figure 9d). The lowest PM
10 concentration was obtained in north and south winds, meaning that transport embodies the most likely source of the nitrogen oxides; there is a larger amount of PM
10 sources; and, probably, the activities pursued within the area contribute to the dust circulation in the park (
Figure 9c).
Figure 10a,b shows that the highest concentrations of nitrogen oxides were measured with east and west winds blowing from the adjacent road and the opposite side. The impact of traffic on the road west of the park, which had not manifested itself in January, probably shows here. From the south through the east to the northwest, the lowest ozone concentrations were measured (
Figure 10d). The highest PM
10 concentrations were acquired in calm weather.
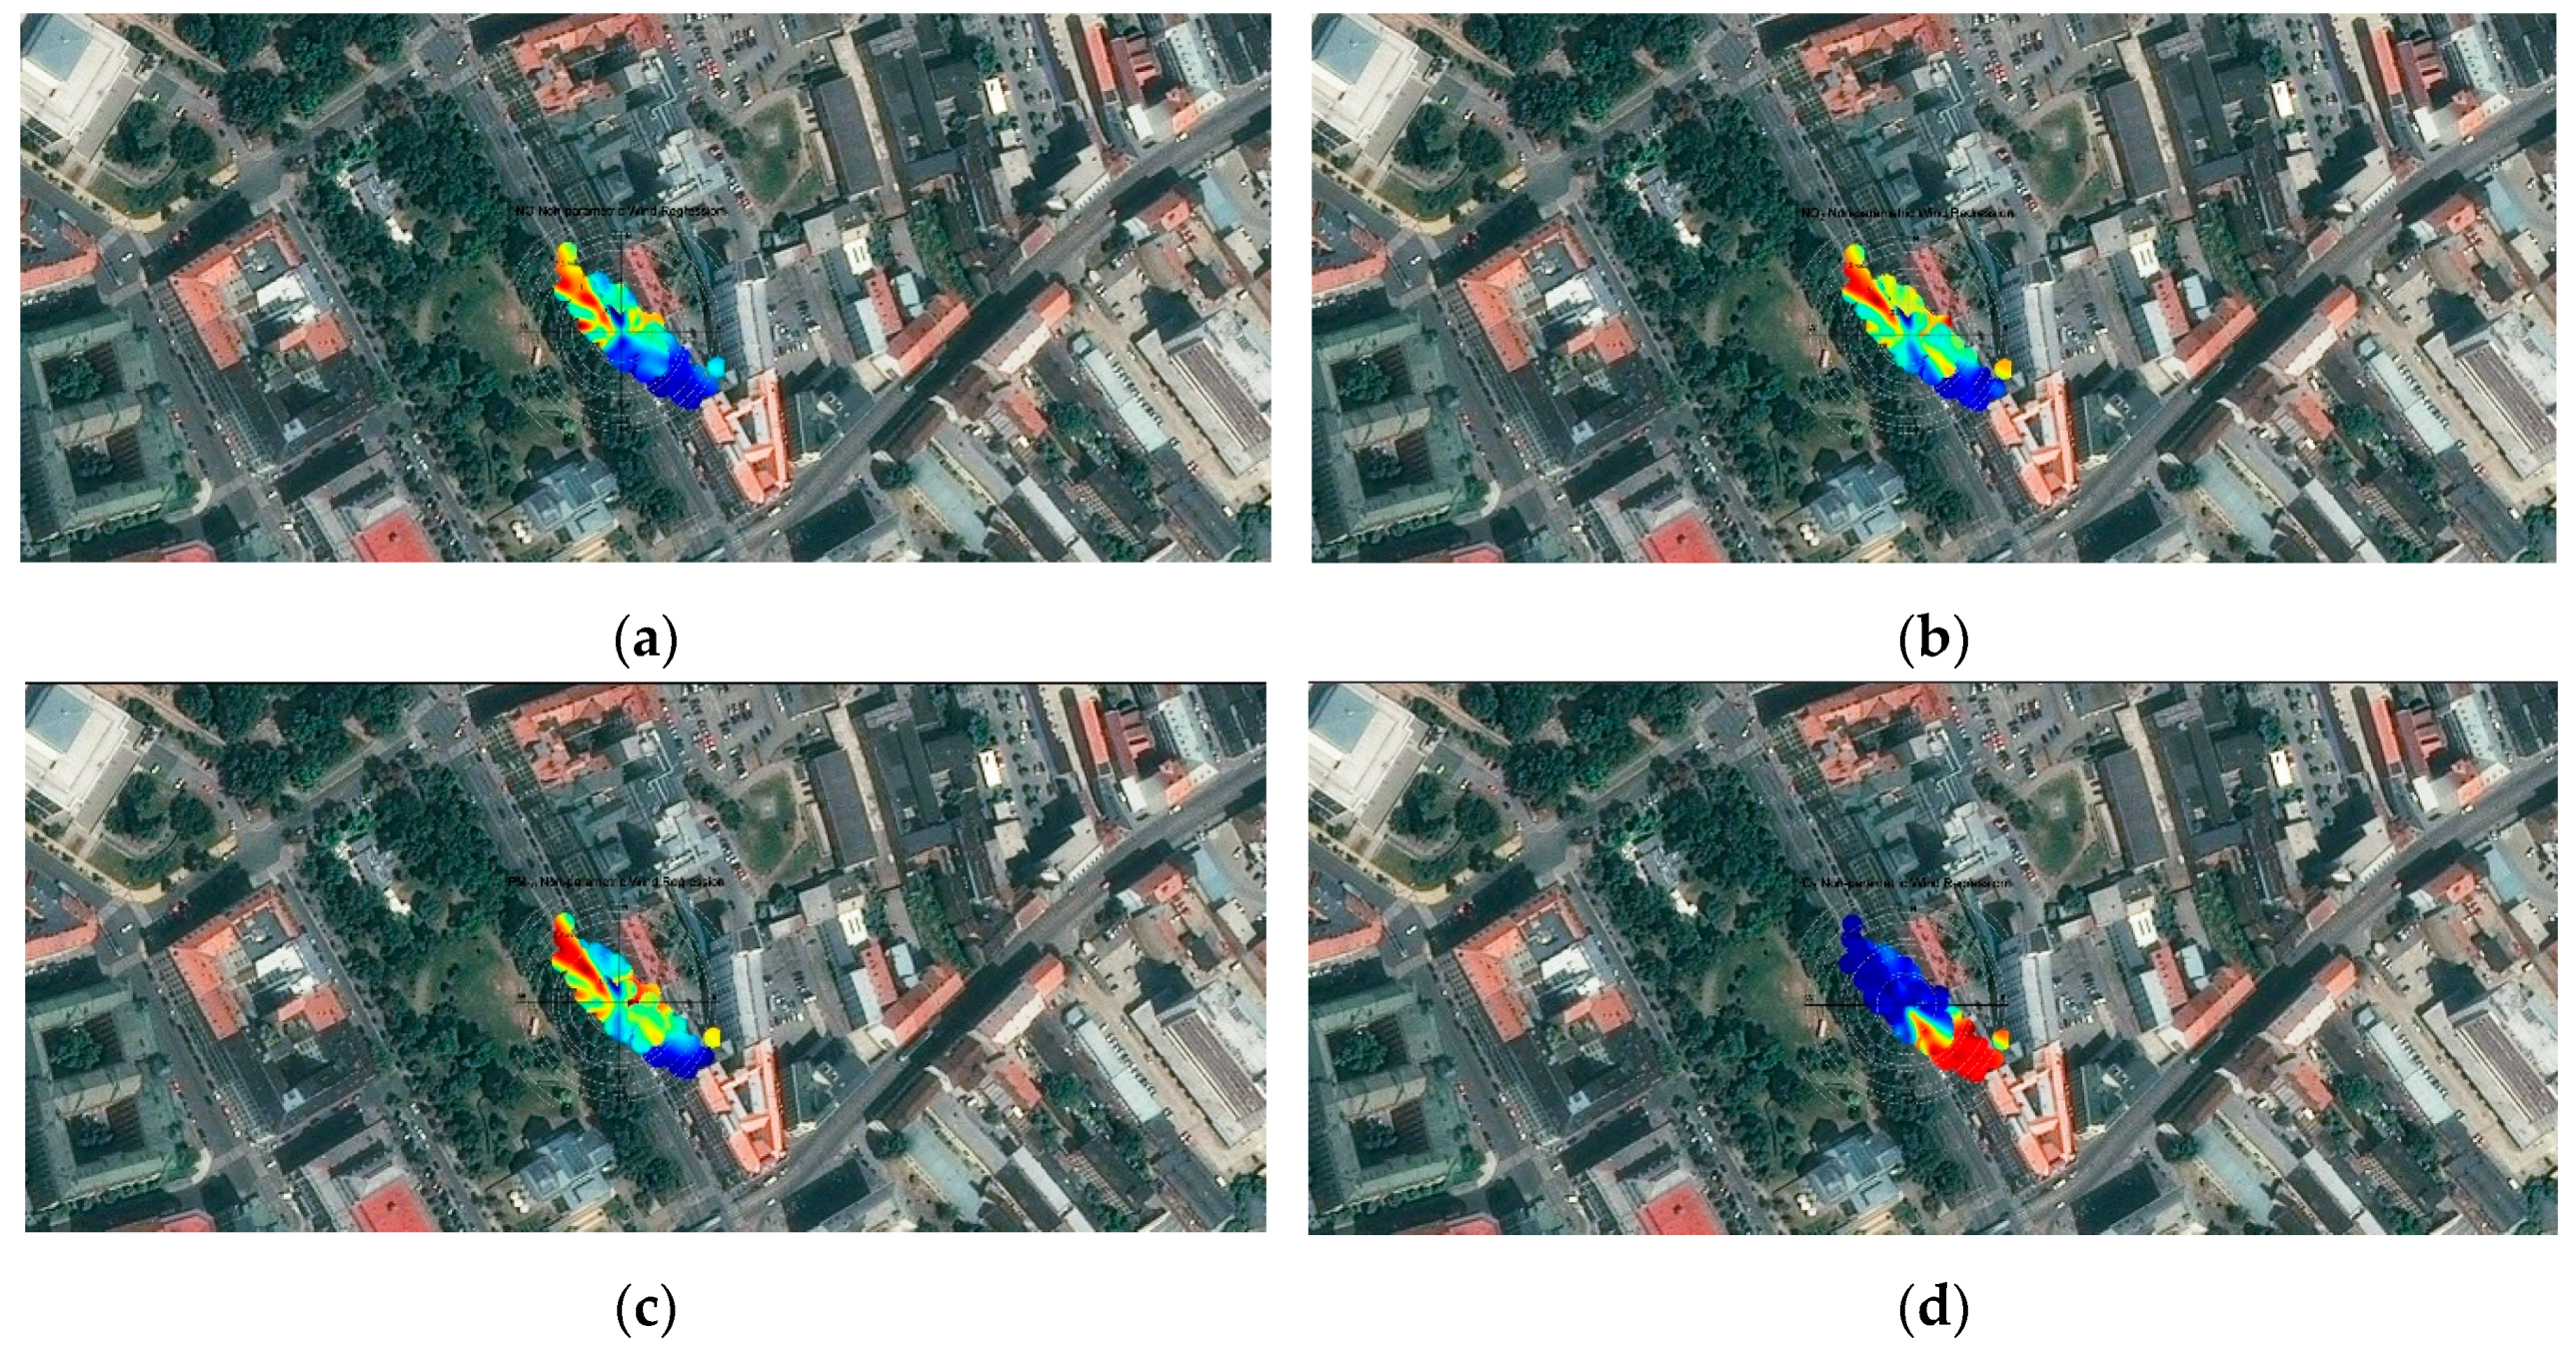
Figure 11a–c shows that the highest concentrations of nitrogen oxides and PM
10 were measured with northwest wind blowing in the direction of the vehicles traveling towards the Airpointer along the near lane of the road. At the same wind direction, we measured the lowest concentrations of O
3 (
Figure 11d), meaning that both the oxides of nitrogen and the PM
10 had most likely originated from traffic in this case.
Figure 12a indicates that the highest NO concentrations were measured with a east wind. The highest NO
2 concentrations were determined in eastern wind directions, namely, from the south to the north, similarly to PM
10 (
Figure 12b,c). At low wind speeds, we acquired the lowest O
3 concentrations of the (
Figure 12d), meaning that both the NO
2 and the PM
10 had probably been generated by similar sources. The NO had most likely originated from the traffic on the road east of the park.
Figure 13a indicates that the highest NO concentrations were measured with a north wind, similarly to the situation in
Figure 14. The highest NO
2 concentrations were acquired under eastern wind directions, namely, from the south to the north, similarly to PM
10 (
Figure 13b,c). This scenario resembles that represented in
Figure 16. In eastern wind directions, we measured the lowest O
3 concentrations (
Figure 13d). The NO had probably originated from the traffic on the road north of the park.
Figure 14b shows that the highest NO
2 concentrations were measured under northern wind directions (
Figure 14b). In western to northern wind directions, we established the lowest concentrations of O
3 (
Figure 14d). The nitrogen oxides had probably originated from the traffic on the road north of the park. The PM
10 concentrations did not exhibit any significant relationship to the wind direction in this case.
Figure 15a–c indicates that the highest NO, NO
2, and PM
10 concentrations were measured under a northeastern wind direction. In the same wind directions, we acquired the lowest concentrations of O
3 (
Figure 15d). Both the nitrogen oxides and the PM
10 had probably been generated by the traffic on the crossroads to the northeast of the park.
Figure 16 displays a situation similar to that shown in
Figure 15. It clearly follows from the images in both of the figures that, at the Lužánky SS locality, the traffic pollution (NO) is contained by the Svojsík srub building. At the Lužánky SVC site (
Figure 12,
Figure 13 and
Figure 14), conversely, the NO source is blocked by the Leisure Center from the west.
There are no significant transport-based air pollution sources near Tyršův sad; the air pollution at this location can be rather generated by long-distance transfer or, especially in wintertime, PM
10 from local heating.
Figure 17 shows the pollution from eastern directions, and
Figure 18 displays the ambiguous situation at the site.
As outlined above, the problem of reducing PM concentrations in urban parks has been discussed in diverse papers, e.g., [
4,
5,
6]. Other articles analyzed the impact of urban greenery on NO
x, NO
2 [
14], and O
3 [
16]. In this study, the outcomes presented within the referenced research reports are followed and developed through such procedural approaches as monitoring the influence of wind and air temperature on pollutant concentrations. The measurements have shown that, in addition to vegetation, seasonal changes of meteorological conditions and human activities in parks embody a substantial aspect modifying the local situation, as observed at Lužánky park in August 2019. The obtained results have confirmed the conclusions proposed by Kumar et al. [
12], namely, that progressive steps need to be taken to bring further knowledge in the field. The relationships between O
3, NO, and NO
2 were studied by Han et al. [
25]; interestingly, the outcomes of our research resemble Han et al.’s findings in suggesting that, as regards the study area(s), the daily NO cycle initiated by flue gas emissions from motor vehicles and continued by the related conversion of the pollutant into NO
2, had a major impact on the regular ozone process. The daily course of concentrations in these pollutants was similar, too.
