Article

Source Characteristics of Atmospheric CO2 and CH4 in a Northeastern Highland Area of South Korea

1
School of Urban and Environmental Engineering, Ulsan National Institute of Science and Technology, Ulsan 44919, Korea
2
Climate and Air Quality Research Department, National Institute of Environmental Research, Incheon 22689, Korea
3
Transportation Pollution Research Center, National Institute of Environmental Research, Incheon 22689, Korea
*
Authors to whom correspondence should be addressed.
Atmosphere 2020, 11(5), 509; https://doi.org/10.3390/atmos11050509
Submission received: 7 April 2020 / Revised: 9 May 2020 / Accepted: 12 May 2020 / Published: 15 May 2020
(This article belongs to the Special Issue Recent Advances of Air Pollution Studies in South Korea)

Abstract

:
This study aims to present the atmospheric CO2 and CH4 levels and analyze their source characteristics at an observation station in a northeastern highland area of Korea for the 2012–2014 period. We summarized the measured CO2 and CH4 concentrations for the 2012–2014 period. In addition, we characterized the major source of the rise of CO2 and CH4 in Ganseong (GS) by employing bivariate polar plots (BPP) and the concentration weighted trajectory (CWT) method together with currently available information on emission sources. For the three years, CO2 was generally high in the order of winter, spring, autumn and summer and CH4 high in the order of winter, autumn, spring and summer. The observed positive correlations between the hourly CO2 and CH4 in every season suggested the possibility of shared common emission sources, but there is a necessity for elucidation on this in the future. The BPP analysis indicated the local sources that are likely to be associated with the rise of greenhouse gases (GHGs) observed at GS (combustion in the village, plant respirations nearby GS, and mobile emissions on the nearby road for CO2 and leakages from the gas stations along the road and agricultural activities for CH4). Synthesizing the CWT results together with emission source information from national and global emission inventories, we identified likely major source areas and characterized major emission sources. For example, the identified major sources for the winter CO2 are coal combustion, coal washing and industrial activities in Inner Mongolia, northern and the northeastern China, fuel burning for the energy for the infrastructure of a northwestern city in South Korea, and the manufacturing industry and fuel combustion in the northern parts of North Korea. Hopefully, these kinds of results will aid environmental researchers and decision-makers in performing more in-depth studies for GHG sources in order to derive effective mitigation strategies.

1. Introduction

Emissions from the widespread anthropogenic sources affect atmospheric concentrations of greenhouse gases (GHGs) in the globe. CO2 and CH4 are the top two long-lived GHGs (LLGHGs) contributing ~83% to the total radiative forcing by LLGHGs (total 3.1 W/m2) [1]. As of 2018 (2014), the global average of CO2 and CH4 reached new highs with 407.8 ± 0.1 (397.7 ± 0.1) ppm and 1869 ± 2 (1833 ± 1) ppb, respectively [1,2]. An increasing consumption of energy (especially from fossil fuel burning) and food (especially from dietary and meat production) coupled with rapid growth of the economy is responsible for such increases [3,4]. In light of this, East Asia has recently become one of the largest GHG source regions, including the highest CO2 and CH4 emissions reported for China [5]. This, in turn, highlights the importance of mitigating these gases in East Asia.
Along with the mitigation, monitoring the time changes of atmospheric abundances of GHGs is important to check for the correct implementation of mitigation strategies at the national, regional, or global scale within the climate decision process, thereby supporting the establishment of effective mitigation policy. Based on this need, the National Institute of Environmental Research (NIER) of Korea installed an observatory in Ganseong (GS), a northeastern highland area of South Korea in July 2011, to continuously measure the atmospheric levels of GHGs such as CO2, CH4 and N2O. The long-term observations of GHG levels in GS will provide basic data for the analysis of regional air pollution patterns within East Asia. In addition, these base data, which are continually being accumulated, will allow us to recognize the effects of transnational mitigation efforts responding to the macroscale environmental issues (e.g., climate change) in terms of changes in GHG levels.
In addition to tracking the change in atmospheric GHG levels at the site of interest (i.e., receptor), identifying the local, regional, or trans-boundary sources affecting the GHG levels in the receptor can be an important procedure for establishing GHG management strategies, consequently contributing to the reduction of global GHG levels [6]. At any time period, however, the source and receptor areas of GHGs vary, due to changes in the direction of incoming air flows. In this regard, the hybrid-receptor modeling (HRM) approaches, which apply a Lagrangian particle dispersion concept driven by wind and turbulence statistics from the mesoscale model, can be useful tools to track the possible origins of pollution variables. Until recent years, many types of HRMs, such as potential source contribution functions (PSCF), gridded frequency distributions (GFD), concentration field analysis (CFA), residence time weighted concentration (RTWC), and concentration weighted trajectory (CWT), have been used to identify potential source areas. Detailed explanation of each method can be found at Cheng et al. [7]. Among the HRMs, PSCF and CWT have been frequently used for the source identification of GHGs. For example, Li et al. [8] used the PSCF to identify the source areas of halogenated compounds observed at Gosan on Jeju Island, Korea. Giemsa et al. [9] utilized CWT to identify the sources of the CO2 and CH4 concentrations at the four high-alpine observatories in the central European region for the period 2011–2015. In addition, Jeong et al. [10], using the CWT method, identified high pollution areas in East and Northeast China and the Beijing-Tianjin region as the major source of carbonaceous materials and particulate matter in Seoul, Korea from April 2007 to March 2008. More number of the source identification studies utilizing the HRM approach can be found elsewhere [11,12,13].
CWT computes the weighted concentration to identify the source area that has higher strengths of emissions arriving at the receptor site [7,14]. PSCF estimates the probability that a source area contributes to elevated pollutant concentrations, as defined by a concentration threshold, at the receptor site [7,15]. The biggest difference of the CWT approach compared with PSCF is that the air mass residence time in the source areas is weighted by the observed GHG concentrations at the receptor site (refer to the CWT equation in Section 2.2.4) [7,9]. Thus, the CWT approach is even able to distinguish between strong sources and moderate ones [9,16]. A common limitation of the PSCF and CWT approaches is that they are not ideal for investigating influences of potential local sources [7]. As an alternative to this, bivariate polar plots—a graphical method for showing the joint wind speed and wind direction dependence of air pollutant concentrations—has been frequently applied to detect the influence of potential local sources (e.g., [17,18]). Meanwhile, besides the methods previously mentioned, other methods employing an isotopic signature as the source signature also have been implemented for the emission source analysis of GHGs. For example, a source of CO2 at a local background site in China was characterized through the analysis of the correlation between the measured 13C/12C-ratios in CO2 concentrations (δ13C-CO2) and the CO2 concentrations at the receptor along with air mass trajectories [19]. In addition, the reconstructed δ13C-CH4 data for emission sources types were utilized to revise the recent global scale CH4 emissions inventories [20].
This study presents, for the first time, the atmospheric measurements of CO2 and CH4 concentrations in the GS station. Primarily, we summarize the measured atmospheric CO2 and CH4 levels in GS for the 2012–2014 period. Then, we identify the major paths of air inflows to GS through air mass trajectory cluster analysis. Finally, we characterize the potential sources affecting the rise of CO2 and CH4 at GS using the bivariate polar plots and the CWT method together with the current available information on emission sources.

2. Data and Methods

2.1. CO2 and CH4 Measurements

In July 2011, NIER established the GS observatory (38.29° N, 128.39° E, 670 m above sea level, asl) at Heul-li village (~150 inhabitants) in Ganseong-eup, which is ∼100 km northeast of the Seoul Metropolitan Area (SMA) (population of ∼21 million) (Figure 1). The monitoring shelter is situated on an open area over a hill, about 3 km away from the center area of Heul-li village. The national route No. 46 runs from the southwest to northeast, about 2 km away from the station. A ski resort is located at about 2 km south of the station. There are some agricultural land areas growing highland vegetables at about 0.4 km to the northwest, east and south.
CO2 concentrations have been continuously measured using an Ultramat-6 analyzer (Siemens, Germany) based on the non-dispersive infrared technique (NDIR) and CH4 using a GC-450 (Bruker, USA) with a flame ionization detector (FID). Air is drawn through the inlet 10 m above the ground at about 8 L/min of flow rate by a diaphragm pump and filters through the two serially connected particulate removal traps equipped SUS filter (10 μm and 50 meshes) and glass fiber thimbles to remove particle phases. The particle-free air is dried by passing it through the serially connected two-stage glass traps containing −10 °C and −70 °C ethanol as refrigerant to remove H2O. Then, the particle- and water-free air is delivered separately to the Ultramat-6 analyzer at about 1 L/min of flow rate and the GC-450 at about 30 mL/min of flow rate. The data with lower quality are flagged out based on criteria of the quality control and assurance (QA/QC) for several factors. The factors subject to QA/QC include the environmental condition (e.g., temperature, humidity, maintenance of instrument/sampling tube), status of base devices (pressure of carrying/sampling gases, detector contamination, condition of water and oxygen removal traps) and performance of the instrument (linearity, detection limit, accuracy, stability against ambient temperature change). Details of the instrumental analyses and QA/QC can be found in MoE [21]. Atmospheric CO2 concentrations are measured continuously at 30 s, and CH4 concentrations are measured at 1-hour intervals. In order to ensure the accuracy of the measurement data, instrumental calibrations are performed five times per week for CO2 and once a week for CH4 using zero air and gases with known CO2 and CH4 concentrations. The calibration standards were acquired from the Korea Research Institute of Standards and Science (KRISS), where the calibration have been conducted on the WMO scales (X2007 for CO2 and X2004A for CH4). The CO2 analyzer is calibrated when the stability of the instrumental signal value is ensured after injecting the working gas into the sample and reference cells concurrently for a certain amount of time. CO2 concentrations are determined based on a high-level standard (HLS: 428.00 ppm) and a low-level standard (LLS: 368.00 ppm) gases. The working gas is continuously injected into the reference cell and concurrently the LLS and HLS gases are injected into the sample cell as the reference to adjust the zero point and the span point of the instrument, respectively. The LLS and HLS gases are the standard gases in dry air and traceable to WMO standard and the national standard gas. After calibration, ambient air samples are injected via the sample-switching-valve continuously and measured every 30-second. The peak areas corresponding to the retention time of analytes are measured, and the atmospheric CO2 concentrations are calculated from the previously prepared calibration curve. The CH4 analyzer is also calibrated using two different levels of standard gases (i.e., LLS: 1880 ppb and HLS: 2250 ppb). If the instrumental responses to the injected two standard gases are continuously and consistently produced at least four times, a calibration curve is prepared with the concentrations and areas of the standard gases. Using the linear calibration curve fits (r2 ≥ 0.995), ambient CH4 concentrations are determined every 1-hour. The ±0.1% for CO2 and ±2.0% for CH4 are recommended by MoE as the measurement accuracy for standard gas concentrations. It determined as follows:
Accuracy (%) = ([B] − [A])/[A] × 100
where [A] and [B] represent the concentration of the standard gas and the measured concentration by instrument
The determined CO2 concentrations in 30-second and CH4 in 1-hour intervals are validated through the inspection of any artifacts in sampling or instrumentation. The validated CO2 data are averaged into hourly intervals while, it is discarded when the data count is less than 60.

2.2. Identification of Transport Pathways and Potential Source Areas

2.2.1. Data Selection

We used a statistical method in MoE [21] as the primary tool of data selection and partially referenced the methods described in Jin et al. [13] and O’Doherty et al. [22]. The basic idea of the data selection is that the GHG measurement data consist in the polluted- and clean (or background) cases. Like previous studies [13,22], we assumed a Gaussian distribution of the measurements of clean air and chose the 121-day as a time window (i.e., 60 days before the time of the measurement to 60 days after it) for the statistical analysis of the GHG concentrations. The initial step is the determination of a median and a standard deviation of the GHG measurements every hour along a time window of 121 days (i.e., moving median within a 121-day bandwidth ( M M d 121 d ) and moving standard deviation within a 121-day bandwidth ( M σ 121 d ) ). It should be noted that the moving statistics for the first 2 months and the last 2 months in the measured data (i.e., January–February 2012 and November–December 2014) were computed within the truncated time windows. According to a previous regional CO2 data selection study applying different size of time windows (e.g., 60, 90, 120 and 180 days), the size of time window does not considerably influence the retrieved averages and trends of the background CO2 concentrations [23]. Thus, we assumed that the statistics computed within the truncated time windows were not flawed. After the determination of moving statistics, the hourly GHG measurements are classified into the polluted and clean air events based on the comparison with the hourly criteria derived by using those moving statistics (i.e., M M d 121 d + n M σ 121 d , where n = 2–3σ). Namely, the GHG concentrations higher than the criteria are labelled into the pollution events while the residual data are into the intermediate clean events (CLNINTD). MoE suggested the 2–3σ plus median values as the criteria, similarly to the other studies. These procedures are iteratively performed until none of the residual data (i.e., CLNINTD) is labelled into the pollution events. Through this repetitive data selection process, we obtained the polluted cases (i.e., CO2_pol and CH4_pol) and the background cases (i.e., CO2_bg and CH4_bg) for GHGs. The concentration increments above the background values (i.e., dC = C_pol − C_bg) are used in the following analyses to investigate the pollution transport routes and source areas.

2.2.2. Bivariate Polar Plot Analysis

Bivariate polar plots were derived to identify local sources of the measured GHGs at the GS station. Bivariate polar plot analysis is a graphical method to show how a species’ concentration varies in relation to wind speed and direction in polar coordinates (e.g., [17,18,24]). This method has proved to be useful to distinguish the local emission sources by providing information on direction and dispersion. For example, Carslaw et al. [17] applied this method to characterize airport sources and dispersion characteristics of range canyons. To derive the bivariate polar plots for the investigation of local sources, the measured CO2 and CH4 concentration data were also filtered by wind speed. We defined the measurements as local events when wind speeds were less than 3 m/sec. We used the dC values for CO2 and CH4 (i.e., dCO2 = CO2_pol - CO2_bg and dCH4 = CH4_pol − CH4_bg) as the input to the concentration field when derive the bivariate polar plots.

2.2.3. Trajectory and Cluster Analyses

We examined the transport pathway of the GHGs (i.e., CO2 and CH4) by back trajectory and cluster analyses. The study domain covers a geographical area from 90° W to 150° E and from 20° N to 60° N. Given the study domain, the 72 h backward air trajectories reaching the GS station at 500 m above ground level (AGL) were created using the Hybrid Single-Particle Lagrangian Integrated Trajectory (HYSPLIT) model version 4 of the National Oceanic and Atmospheric Administration (NOAA) [25]. The reason for setting 500 m as the arrival heights of the backward trajectories was that it is known to facilitate the identification of the effects of long-range transport at this height of the air mass arriving site [8,12,26]. Each back trajectory consists of a number of segment endpoints (endpoints hereafter) that are separated by specific time increments and characterized by their respective positions (latitude, longitude and height) and time. Namely, each 72-h trajectory normally contains 72 endpoints. For every 3-h a day (i.e., 00:00, 03:00, 06:00 … 21:00 local KST (Korean Standard Time)), one back trajectory was created, for a total of 8765 back trajectories from 2012 to 2014. The wind fields were derived from the National Centers for Environmental Prediction reanalysis data with a grid resolution of 1° by 1°. All created trajectories were then clustered to distinct the air mass transport patterns by applying k-means cluster analysis base on the Euclidean distance. Since seasonal cycles in the measured CO2 and CH4 concentrations have been observed at the GS, trajectory clustering was performed for each season based on spatial dissimilarity of Euclidean distance between different trajectories. Based on the results of back-trajectory cluster analysis, we determined the likely transport pathways of seasonal CO2 and CH4 in GS (refer to Figure 1 and the description in Section 3.2).

2.2.4. Concentration-Weighted Trajectory Method

We conducted the concentration weighted trajectory (CWT) analysis to identify the regional sources of the measured GHGs at the GS station. The study domain covering a geographical area from 90° W to 150° E and from 20° N to 60° N includes 9600 grid cells with a spatial resolution of 0.5° × 0.5°. The CWT value on a resolution grid (Cij) was derived by weighting the probability of air mass landings in every grid cell with the measured greenhouse gas concentration for each hour in the GS station as follows [14]
C i j = 1 k = 1 N τ i j k k = 1 N C k τ i j k
where i and j are the indices of grid, k the index of trajectory, N denotes the total number of trajectories used in analysis, Ck the GHG concentration measured at the receptor (here, GS) upon arrival of trajectory k, and τijk is the time spent in the ijth grid cell by back trajectory k (i.e., the number of endpoints in the ijth grid cell (nij) for back trajectory k divided by the total number of endpoints (ntot) for back trajectory k). We used the dCO2 and dCH4 as input to the Ck field for the computation of Cij. A high value of Cij for a particular grid cell (i,j) implies that air masses passing over this cell would, on average, correlate with high concentrations at the receptor site.
As previously mentioned, 8765 back trajectories were created in our study, so that there are 63,1080 endpoints in the CWT domain (approximately 66 endpoints per grid cell). The number of endpoints used in our study is comparable to or larger than those used in other studies. The trajectory endpoints produced by the model can have uncertainties stemming from the interpolation of sparse meteorological data, assumptions for vertical transport, sub-grid-scale phenomenon, etc. [15]. For instance, estimated position errors in the trajectory model errors are 20% [27]. The CWT used in our study cannot distinguish the source areas that are influenced by emission sources at surface level and those at high altitude [11]. However, even though it is possible to examine the trajectory endpoints in the grid cells at different altitudes, vertical mixing and turbulence in the boundary layer can cause uncertainties when designating the pollution signals [11]. Meanwhile, it might be true that trajectories with a larger altitude of position above the model surface may have less possibility of being affected by surface emission sources in the boundary layer. A previous regional source allocation study at the high Alpine site of Jungfraujoch in Europe with CWT regarded air masses as being influenced by emissions at ground level if a pressure height above the model surface did not exceed 120 hPa (200 hPa) in winter (summer) [28]. Another previous study at Seoul in East Asia used an approach that removes the endpoints exceeding 2 km above the model surface in the CWT analysis [10]. In our analysis, we verified that over 82% of the seasonal trajectory endpoints are positioned within 2 km altitude (winter 81.5%, spring 86.7%, summer 99.7% and autumn 85.8%), indicating that most trajectory endpoints were distributed within an acceptable altitude for the pollution source detection. Despite these uncertainties, the trajectories represent the large-scale circulation and, as such, may be used to suggest potential source regions [15]. Grid cells with a very small number of trajectory endpoints (i.e., very small nij) can lead to highly uncertain extreme Cij values [15,29]. To reduce this uncertainty by rejecting grid cells with a very small nij, an arbitrary weight function W(nij) shown below is multiplied into the Cij values [10,15,29]
W n i j =   1.00   2 n a v e < n i j , 0.75   n a v e < n i j 2 n a v e , 0.50   0.5 n a v e < n i j n a v e , 0.20   n i j 0.5 n a v e .
in which nave is the average number of trajectory segments of all grid cells containing at least one trajectory segment and nij is the number of the included trajectory segments in the (i,j) grid cell. The CWT calculation with the arbitrary weight function was done by using the TrajStat software [30]. Based on the results of CWT analysis, we characterize the potential source areas of seasonal CO2 and CH4 in GS.

2.3. GHG Emission Inventory and Satellite Observations

To check the identified source areas, we used a set of the GHG emissions data from the Emission Database for Global Atmospheric Research version 4.3.2 (EDGAR4.3.2) [5]. EDGAR4.3.2 is a global anthropogenic emission inventory (EI) of air pollutants and GHGs by country and on a 0.1° × 0.1° grid for 1970–2012 developed by the Joint Research Centre and the PBL Netherlands Assessment Agency. CO2 and CH4 emission datasets of EDGARv4.3.2 were compiled in the study domain to indicate the high emission areas (Figure A3a,b).
In addition, CO2 and CH4 retrieval data from the Greenhouse Gases Observing Satellite (GOSAT) were used to examine the overall CO2 and CH4 trends in the study domain. The used GOSAT monitoring data are the Level 3 (2.5° × 2.5° grid) of the Short-Wavelength Infrared (SWIR) observations of the Thermal and Near-infrared Sensor for Carbon Observation and Fourier Transform Spectrometer (TANSO-FTS SWIR Level 3) in version 2.xx from January 2012 to December 2014, including the dry air mixing ratio for CO2 (XCO2) and CH4 (XCH4). TANSO-FTS SWIR L3 are produced from TANSO-FTS SWIR L2 in a month with the spatial statistical method to estimate the column averaged mixing ratio of CO2 and CH4 for the rectangular area with a 2.5 degree of latitude and longitude in a month [31]. These FTS SWIR data can be requested on the GOSAT Data Archive Service (GDAS, http://data2.gosat.nies.go.jp/index_en.html) with a user registration [31].

3. Results and Discussion

3.1. Summary of the Measured GHG Concentrations

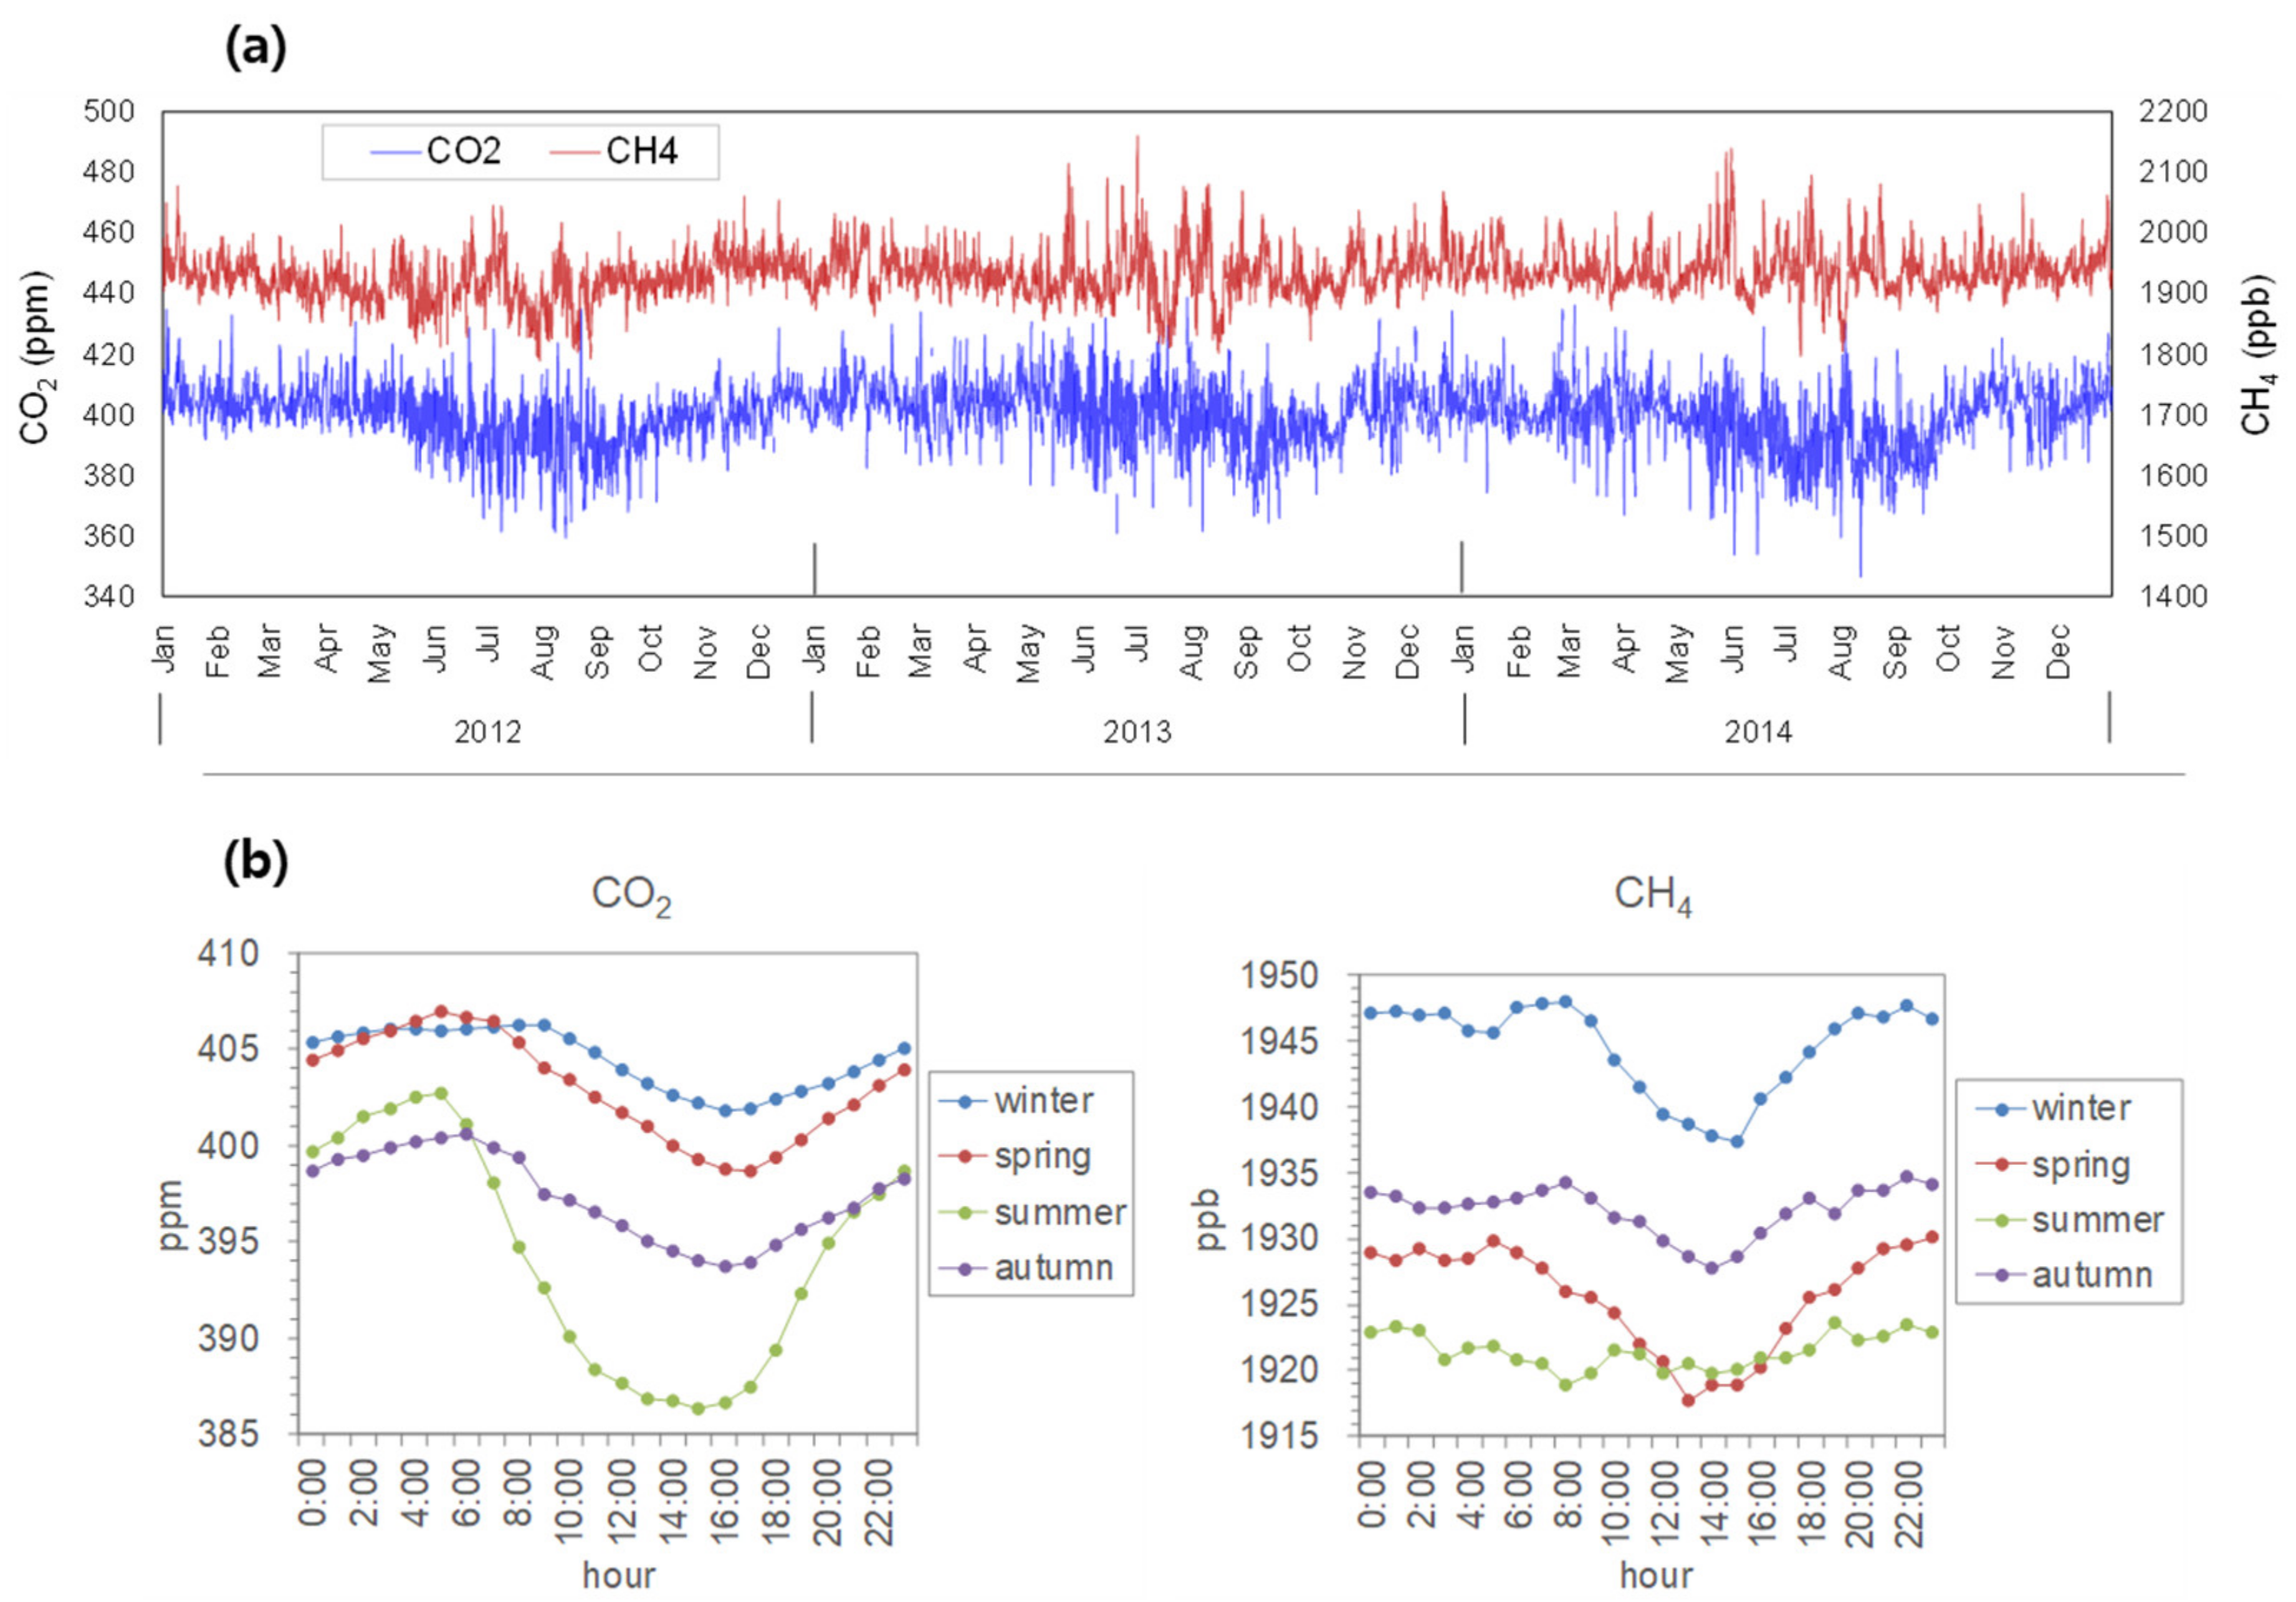
The three-year continuously measured concentrations for CO2 (CH4) ranged from 346.4 ppm (1788 ppb) to 438.8 ppm (2161 ppb), and the minimum and maximum concentrations for both CO2 and CH4 were all observed in summer (Figure 2a). According to the mean diurnal cycles (Figure 2b), the minimum values of CO2 were observed in the afternoon (15:00 (summer)–17:00 p.m. (spring) local time) and the maximum in the morning (05:00 (spring and summer)–09:00 a.m. (winter)), with a peak-to-peak amplitude of about 16.3 ppm in summer, 8.3 ppm in spring, 6.8 ppm in autumn and 4.4 ppm in winter. For CH4, the daily minima in winter, spring and autumn were observed commonly in the afternoon (13:00 (spring)–17:00 p.m. (winter)) while the daily minimum in summer was in the morning (08:00 a.m.). The daily CH4 maxima in winter and summer occurred in the morning (08:00 a.m.) and the evening (19:00 p.m.), while those in spring and autumn were in the night (22:00 p.m. (autumn) and 23:00 p.m. (spring)). The highest peak-to-peak change was observed in spring (12 ppb, followed by winter (11 ppb), autumn (7 ppb), and summer (5 ppb). We observed a strong positive correlation between the hourly CO2 and CH4 during winter (r = 0.66), spring (r = 0.70) and autumn (r = 0.62) and a moderate positive correlation during summer (r = 0.46), implying the possibility of shared common emission sources. Several previous studies found positive correlations and insisted that the anthropogenic emissions dominate the carbon cycle at the measurement sites (e.g., [23]). However, it is not clear whether such positive correlations in GS were mainly due to the effect of anthropogenic emissions on the carbon cycle or more affected by other factors. Future research should elucidate this by applying other practical tools such as the measured isotopic signatures (e.g., the 13C/12C-ratios in atmospheric CO2 and CH4). In addition, analyzing the ratios of CO2 versus CH4 measurements above the background levels (i.e., dCO2/dCH4) in the measurements and comparing these to the corresponding emission ratios derived from the bottom-up inventory in the identified potential source areas could be an interesting topic in future research.
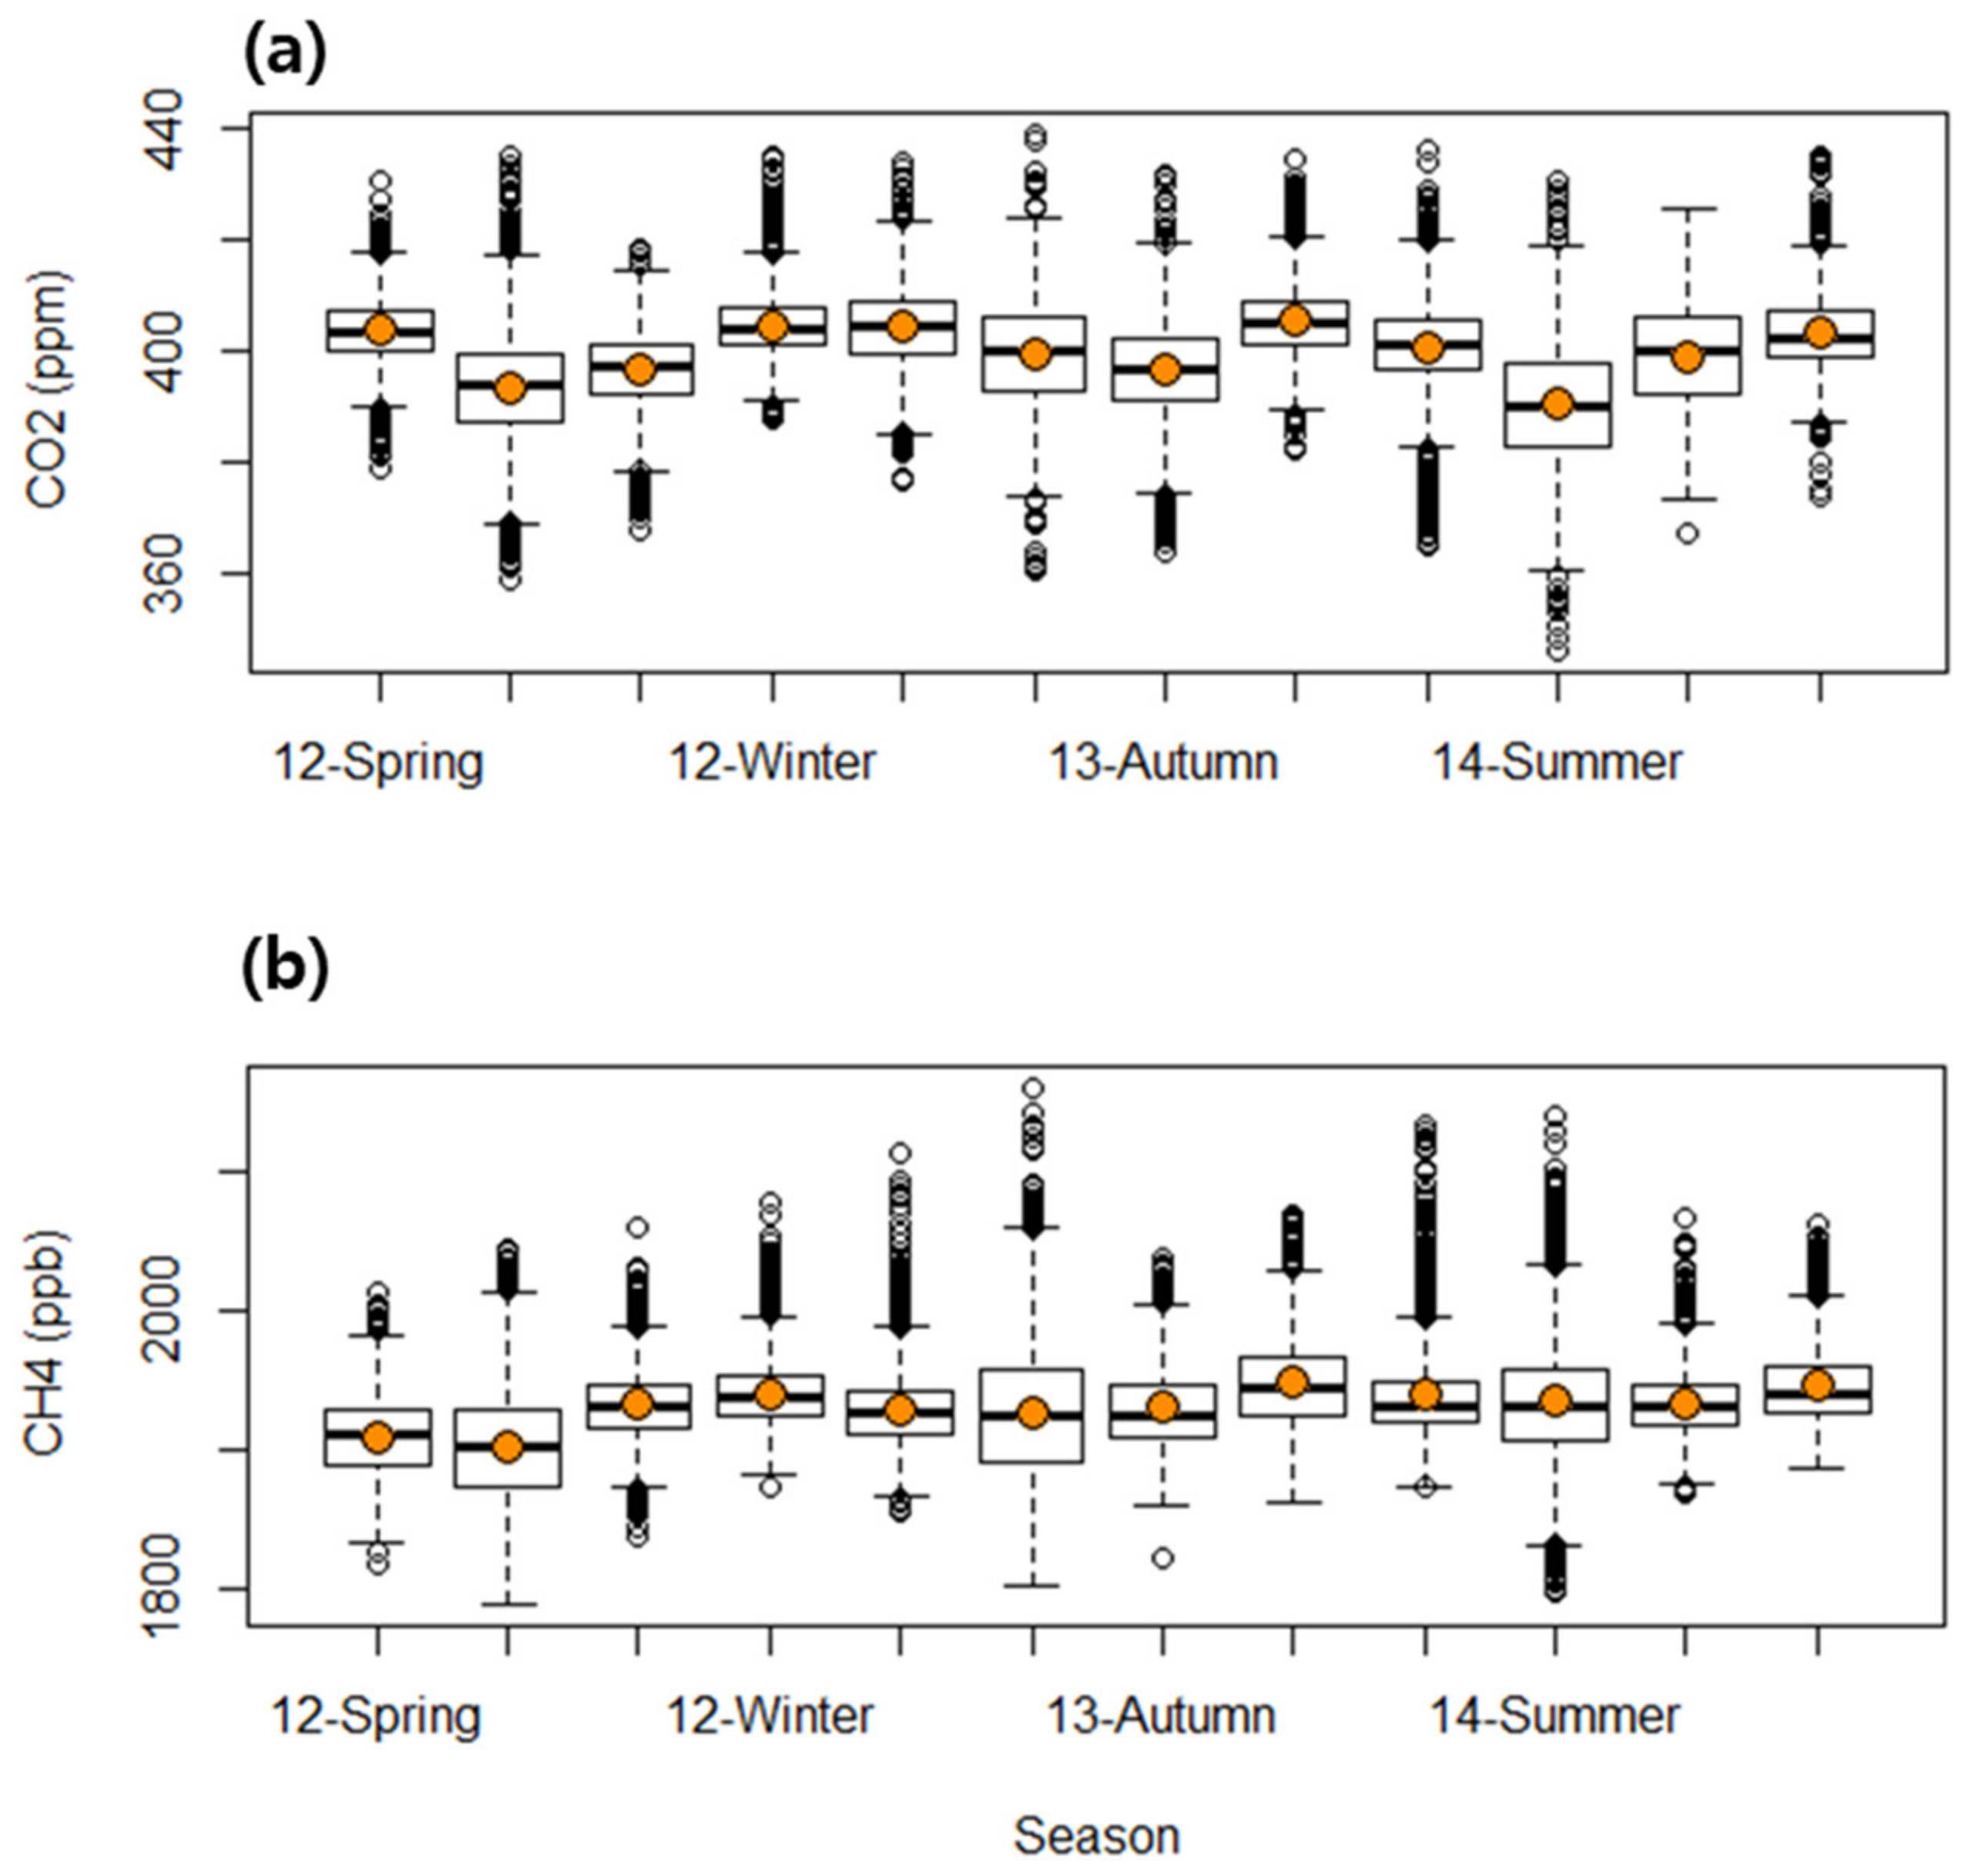
According to the seasonal average of the measured concentrations for the 2012–2014 period, CO2 was typically high in the order of winter, spring, autumn and summer while CH4 was high in the order of winter, autumn, spring and summer (Figure 3). For the three consecutive years, the seasonal arithmetic mean for CO2 in GS was 404.5 ppm (median mean (MM): 403.8) in winter, 403.0 ppm (MM: 403.2) in spring, 397.3 ppm (MM: 397.8) in autumn, and 394.4 ppm (MM: 394.6) in summer. The seasonal arithmetic mean for CH4 in GS was 1945 ppb (MM: 1940) in winter, 1932 ppb (MM: 1929) in autumn, 1926 ppb (MM: 1924) in spring, and 1921 ppb (MM: 1919) in summer.
One noticeable feature shown in the seasonal cycle of CO2 was the lowest summer CO2 concentration in 2014. This can be associated with the more frequent influence of the cold air intrusion (CAI) from the eastern part of the Russia Far East (RUFEE) (cluster 3 (C3) in Figure A1c) on the summer air and water cycle in GS in 2014 due to the Okhotsk High (OKH) (e.g., [32]) compared to 2013 (C4 in Figure A1b). Namely, frequent CAI during summer 2014 might have induced more precipitation events via more frequent collision with warm air masses originating from the Northwestern Pacific Ocean (NWPO) (C6 in Figure A1c). In reality, the precipitation period in summer 2014 (380 hours) was about 1.24 times longer than that in 2013 (305 hours) in GS. In this case, the photosynthetic drawdown of CO2 in the atmosphere by local vegetation could be greater [33]. Furthermore, more wet removal of CO2 molecules could occur, whereas less CO2 production in the photochemical cycle in the atmosphere could also occur (i.e., CO + OH → CO2 + H). Consequently, there was a larger decrease in CO2 levels in summer 2014, about a 9-ppm decrease of CO2 on average, compared to that of summer 2013.
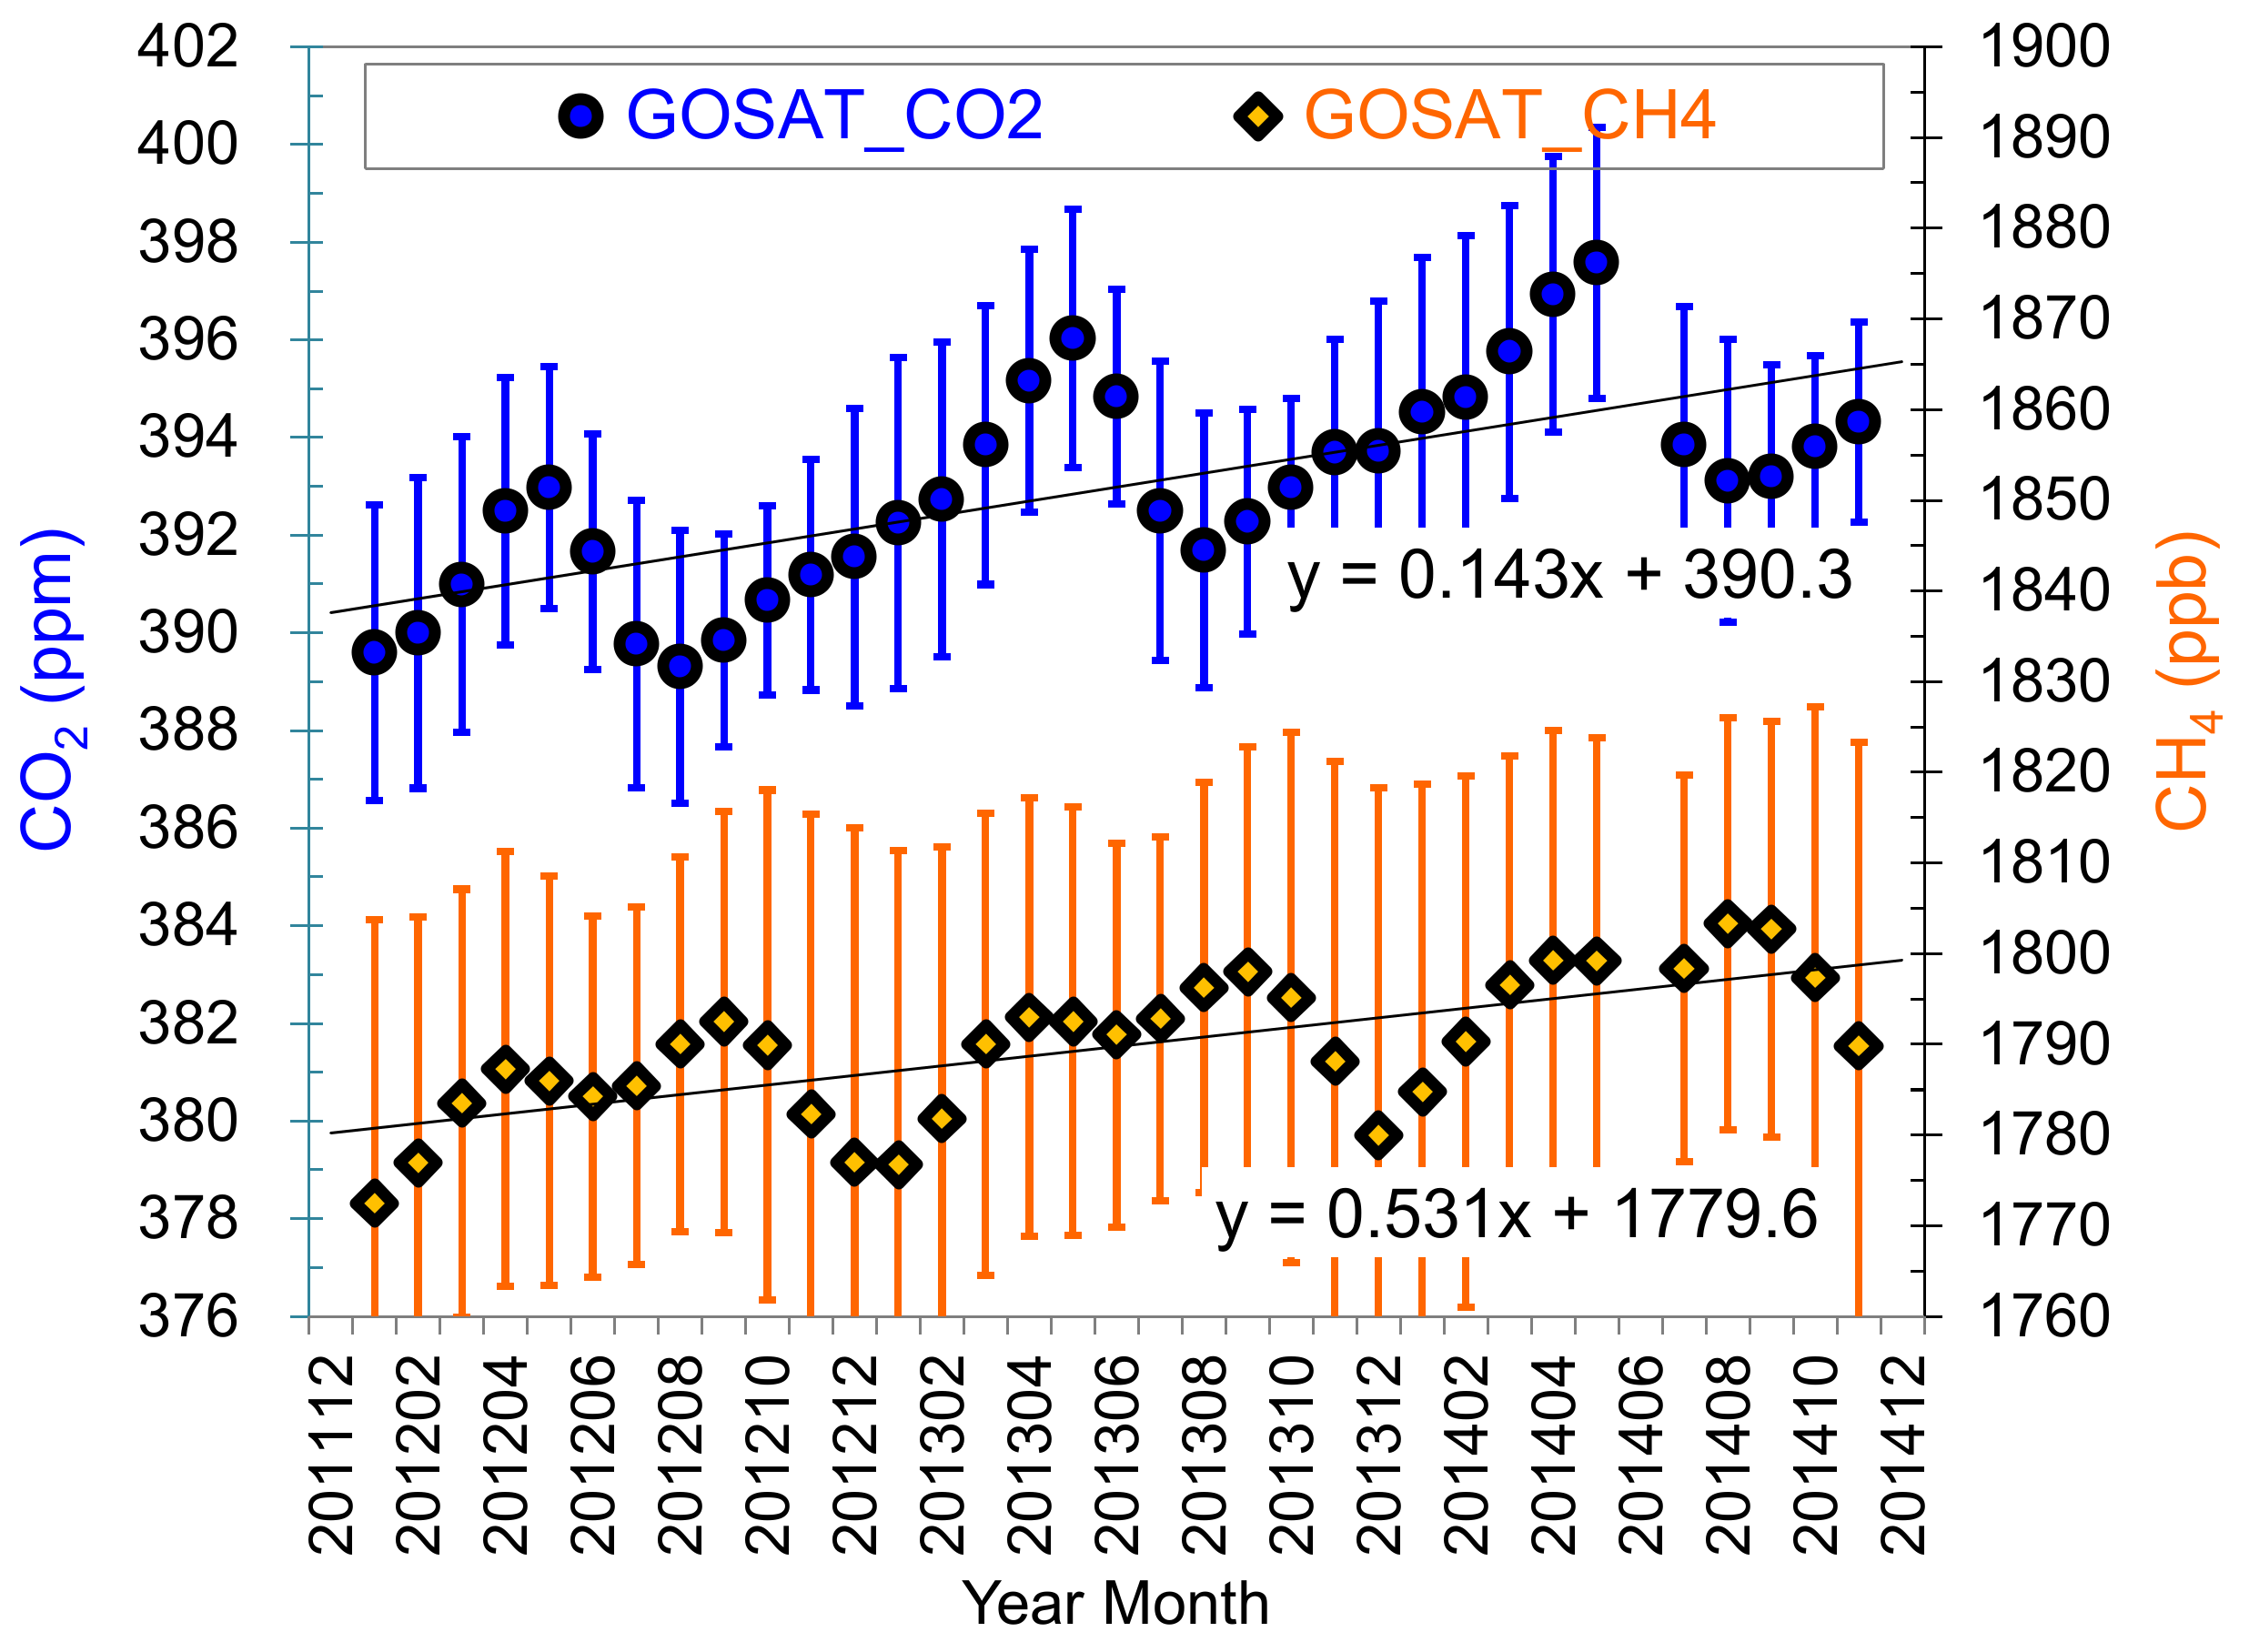
The annual average concentrations of CO2 and CH4 at GS for the 2012–2014 period were 399.8 ppm and 1930.9 ppb, 4.3 ppm and 105.9 ppb above the global average values for CO2 and CH4, respectively (Table 1). In accordance with the increasing global average of CO2 and CH4 levels in the past three years, the increased regional average of CO2 and CH4 levels were remotely sensed by GOSAT in East Asia (Figure 4). For example, the surface-observed global average concentrations of CO2 (CH4) raised by 0.7% (0.3%) in 2013 against 2012 and 0.5% (0.5%) in 2014 against 2013. The GOSAT-observed regional average concentrations of CO2 (CH4) grew by 0.3% (0.7%) in 2013 and 0.4% (0.3%) in 2014. Generally, the increasing trends of CO2 (CH4) can be attributed to the emission growths from the energy-related activities such as fossil fuel burning and coal mining (agricultural activities such as livestock management and rice cultivation) [34,35,36,37].
Similarly, the annual average of the observed CO2 and CH4 concentrations in GS have gradually increased since 2012 (CO2 concentration: 0.5% increase in 2013; CH4: 0.7% increase in 2013 and 0.3% increase in 2014) except for the case of CO2 in 2014 showing about 0.8% decrease (~3.1 ppm) (Table 1 and Figure 3). The possible causes of the observed CO2 decrease in GS in 2014 can be associated with the combined effects of the three factors: (i) declined domestic fuel burning emissions, (ii) reduced source impacts due to the altered air mass inflowing pattern, and (iii) drastically dropped summer CO2 levels. Firstly, in 2014, the coal-fired power generation in South Korea (KR) decreased by 6.9% while the nuclear power and other alternative energy generation increased by 13% and 38%, respectively [40,41]. Especially, the nuclear power generation capacity, which had been reduced due to facility inspections since 2012, recovered in 2014, thereby fallen fuel burning emissions during this period compared to the previous years. About 1.2% (~6.7 million tons) reductions from 2013 (635.5 million tons) to 2014 (628.8 million tons) for the total CO2 emissions by the energy generation sector were found to be associated with the reduced emissions from fuel burning during this period [40]. Secondly, the CO2 mole fractions in GS in 2014 were more frequently affected by relatively clean air masses from the remote areas compared to the case in 2013 but less by air masses from the major CO2 emission source areas. For example, the CO2 mole fractions in GS may have been affected by the newly introduced 316 warm clean air trajectories by NWPO (11.0% of the annual total inflows in 2014, see C6 in Figure A1c) and by 216 more cold clean air trajectories from RUFEE (7.4% of the annual total trajectories in 2014, see C3 in Figure A1c and clusters in Figure A1b). Furthermore, the number of air trajectories originating from the strong CO2 source areas in China such as the Northern China (CNN) and the Northeastern China (CNNE) (see Figure A3a) in 2014 (i.e., C1+C2+C5 in Figure A1c) were 380 and 336 less than these in 2012 (C1+C3 in Figure A1a) and 2013 (C1+C3 in Figure A1b), respectively. Thirdly, as previously explained, the CO2 levels in GS were lower in summer 2014 compared to these in 2013 due to the influence of more frequent CAI from the high-altitude region. Interestingly, the GOSAT satellite data also show a drop in CO2 over the GS site during summer 2014 compared to this during summer 2013 (Figure 5e). It could partly support the third factor. Another noticeable feature of the GOSAT derived CO2 changes (Figure 5e) consists of large decreases of CO2 over the areas crossing the CNE-CNN and CNNE (1–6 ppm decrease), where large sources of CO2 emissions are located. This may be associated with the effects of pollution control actions in China that had been continuously implemented since 2010. However, the investigation of specific reasons for this pattern is beyond the scope of this study due to the limited data.
Meanwhile, a gradual increasing trend of CH4 can simply be explained by the yearly increased CH4 source impacts. Namely, there was year-by-year increase of westerly air inflows coming from the high CH4 emission areas in the CNN in China, and also in SMA in KR (Figure A1 and Figure A3b). The westerly air mass clusters were identified as the most CH4 contaminated air mass groups in 2013 (C2 in Figure A1b) and 2014 (C4 in Figure A1c). These CH4-rich air mass inflows are possibly linked with the large CH4 sources over the SMA in KR such as rice cultivation and waste treatment [42] and these over CNN such as energy activities (e.g., coal mining in Hebei) and agricultural activities (e.g., enteric fermentation in Shandong) [36]. Unlike CO2, CH4 in GS 2014 was probably not dominantly affected by the vegetation draw down and not significantly scavenged by precipitation due to water insolubility. Besides that, frequent cloud and precipitation events in GS during summer 2014 may have reduced atmospheric hydroxyl sinks (i.e., CH4 + OH → CH3 + H2O), thereby prolonging the atmospheric residence time of the CH4 molecules (e.g., [43]). Similarly, the GOSAT satellite data also show an increase in CH4 over the GS site during summer 2014 compared to this during summer 2013 (Figure 5j).
Through the data selection procedure in Section 2.2.1, we distinguished the measured CO2 and CH4 data into the polluted and background cases for the 2012–2014 period. We selected about 33% (56%) of CO2 (CH4) data as the polluted cases (i.e., C_pol) and the leftover data were designated as the background cases (i.e., C_bg). Continuously fluctuated pollution events (‘Polluted’ in Figure A2) imply the significant influence of the massively distributed emission sources in the northeast Asian domain (refer to Figure A3). The continuously measured concentrations of CO2 (CH4) for the polluted case ranged from 392.9 ppm in August 2014 (1887 ppb in January 2012) to 438 ppm in July 2013 (2161 ppb in July 2013) and these for the background case ranged from 346.4 ppm in August 2014 (1788 ppb in July 2012) to 408 ppm in November 2014 (1957 ppb in October 2012). For CO2_pol, the highest seasonal average concentrations occurred in spring (CO2_pol = 410.6 ppm), followed by winter (409.6 ppm), autumn (407.6 ppm) and summer (407 ppm). For CH4_pol, the highest seasonal average concentration appeared in summer (1970 ppb), followed by autumn (1956 ppb), winter (1951 ppb) and spring (1939 ppb). Meanwhile, the dCO2 and dCH4 values (CO2 and CH4 enhancements above their background levels) showed different seasonal distribution compared to the CO2_pol and CH4_pol values. Namely, the average dCO2 was high in the order of summer (15.7 ppm), autumn (12.9 ppm), spring (dCO2 = 12 ppm) and winter (10.2 ppm), whereas the average dCH4 was high in the order of summer (75 ppb), winter (49 ppb), spring (44 ppb) and autumn (43 ppb). Overall, the three-year averaged concentrations of CO2 and CH4 in the polluted case (CO2: 408.8 ppm and CH4: 1952 ppb) were approximately 3.4% and 2.6% higher than these in the background case (CO2: 395.4 ppm and CH4: 1904 ppb), respectively (Table A1).

3.2. Seasonal Transport Pathways and Contributions

Through the back trajectory cluster analyses, representative paths of air masses arriving at GS were seasonally identified (see the seasonal mean trajectories in Figure 1). In addition, the relative contributions of the seasonal air mass pathways to the observed GHG concentrations were also summarized by locating the delta GHG concentrations at GS on seasonal trajectory clusters reaching the GS station (Table 2).
The winter air mass inflows were dominated by the northwesterly long-range (L-R) and medium-range (M-R) clusters, representing 68% (combined fraction of tree clusters: C1 from the border area of the Northern Mongolia (MNN) and the Eastern Mongolia (MNE), C3 from the Northern Siberia of Russia (RUSBN), and C4 from the east of the Eastern Siberia of Russia (RUSBE)) and 22% (fraction of C2 which is from the Inner Mongolia of China (CNIM)) of total winter inflows, respectively. The remaining 10% trajectories were northerly flows represented by the L-R cluster (C5) that is greatly curved air trajectory cluster from CNNE to the southern receptor (i.e., GS). These northwesterly and northerly flow patterns can be explained by massive cold advection driven by the wide expansion of Siberian High (SH). The SH generally develops at the end of summer, peaks in the winter, and sustains until the middle of spring. The anticyclonic circulations of the surface level SH have a prevailing role on air mass moving and temperature and precipitation variations over China (CN), North Korea (KP), KR, Japan (JP), and the surrounding regions during the winter season [44,45]. The highest CO2 and CH4 enhancements commonly belonged to C5 (about 12 ppm and 63 ppb of CO2 and CH4 enhancements respectively above their background levels, i.e., dCO2 = 12 ppm and dCH4 = 63 ppb for the 2012–2014 period), followed by C1, C2, C3 and C4. Across the clusters, the mean increments of CO2 and CH4 concentrations above their background levels (i.e., dCO2 and dCH4) ranged from 8.5 to 11.3 ppm (C4-C1) and from 40 to 55 ppb (C4-C1), respectively.
In spring, the transition period between the cold dry winter and the hot summer, the distinctive feature is the dominance of the west-orient cluster (C1: 38%) with air mass coming from the Shandong in CNN and crossing the West Sea of KR (or Yellow Sea) at a medium speed with large curvature. The winter northeasterly cluster was transited to the northerly cluster (C4: 19%) although the fast moving northwesterly (C2 + C3: 36%) air inflowing patterns remain similar to the winter. The cold anticyclones, like SH, occur over the continent in warm season and over oceans on any occasion, and become warm anticyclones or breakdown [46]. Thus, the prevailing westerly cluster (i.e., C1) can occur due to the migratory highs (MH) over CNN and Yellow Sea, resulting from the collapsing SH by spring warm air. There were newly observed southeasterly clusters from the northern Kantor region in the Mid Japan (JPM) (C5: 7%) with air mass passing over the East Sea at a medium speed before reaching GS. The highest CO2 and CH4 increments were observed at the cluster originating from the Shandong in CNN (C1: dCO2 = 13.4 ppm) and the MNE (C2: dCH4 = 50 ppb), respectively. The mean dCO2 and dCH4 across the clusters ranged from 10.4 to 13.4 ppm (C3–C1) and from 32 to 50 ppb (C5–C2), respectively.
In summer, most northwesterly clusters with origin of continental areas were replaced by southwesterly or southerly clusters with the origin of coastal or sea areas, except for the northwesterly short-range (S-R) cluster (C2: 35%) originating from Liaoning of CNNE and the easterly M-R cluster (C3: 21%) coming from the East Sea of KR (or West Sea of JP). The newly pronounced clusters include the southwesterly M-R cluster originating from the Yangtze River Delta (YRD) in the Eastern China (CNE) (C1: 29%) and the southeasterly L-R from NWPO (C4: 14.9%). These new inflowing patterns can be characterized by the Western North Pacific Subtropical High (WNPSH) and the Bonin High (BH), high pressure over the Bonin Islands to the south of JP (25–30° N, 140–145° E) relating to the East Asian summer monsoon (EASM) variability. Ha et al. [47] showed that both WNPSH and BH cause the low-level flow of the merged southwest–southeast flow from lower latitudes around the Korean Peninsula. The highest increments in CO2 and CH4 concentrations were commonly observed at the YRD cluster (C1: dCO2 = 16.5 ppm and dCH4 = 83 ppb). The mean dCO2 and dCH4 values across the clusters ranged from 11.9 to 16.5 ppm (C3–C1) and from 59 to 83 ppb (C3–C1), respectively.
Entering autumn, air trajectory occurrence tended to restore the winter pattern except for the northeasterly M-R cluster (C3: 32%) coming from the south sea of RUFEE. Due to the influence of the developing SH and weakening EASM system [44], clusters with northwesterly flows were predominant during autumn but had less strength than these during winter. The northwesterly flows were grouped into the L-R cluster coming from RUSBE (C2: 19.7%) and the M-R clusters from the east part of CNIM and the northern Hebei in CNN (combined fraction of C1 and C4: 48.4%). The highest CO2 and CH4 enhancements belonged to C3 (dCO2 = 13.5 ppm) and C4 (dCH4 = 48 ppb), respectively. The mean dCO2 and dCH4 values across the clusters ranged from 11.7 to 13.5 ppm (C2–C3) and from 33 to 48 ppb (C2–C4), respectively.

3.3. Direction of Local Sources

We investigated the directions of local emission sources associated with the rise in CO2 and CH4 concentrations at GS for each season by using the bivariate polar plots for each pollutant at the GS site (Figure 6).
Moderate CO2 increments were observed in winter and spring during the prevalence of southeasterly and southwesterly (SE-SW) winds, indicating the potential impact of combustion sources such as cooking, heating and open burning. In summer, very strong enhancements of CO2 concentrations were detected in GS under the influence of the northwesterly and northerly (NW-N) winds. This is likely to be the influence of automobile emissions from the national route No. 46 that runs from the southwest to the northeast. Furthermore, strong CO2 source signals were observed near the receptor (i.e., GS) under lower winds (<1 m/sec) and during the prevalence of SE-W winds. This could be associated with the combined effect of multiple sources, such as the respiration of nearby plants and fuel combustion for human activities in the village (e.g., cooking). In autumn, the CO2 rise during the prevalence of N-E and S-W winds may also be attributed to the mixed influence of the respiration of nearby plants and combustion for human activities.
The strong winter increments of CH4 to the NW and SW directions can be associated with the influence of fugitive emissions from the gas and oil system (e.g., gas station) near the national route No. 46 and the livestock breeding (e.g., enteric fermentation, manure management) in the village, respectively. In spring and autumn, the moderate CH4 enhancements observed during the prevalence of SE-SW winds might be associated with the potential impact of the fugitive emissions from agricultural activities (e.g., rice cultivation, livestock breeding). The strong summer CH4 enhancements spread in the SE-W wind sectors can occur due to the influence of fugitive emissions from very active agricultural and livestock breeding activities.

3.4. Distribution of Regional Sources

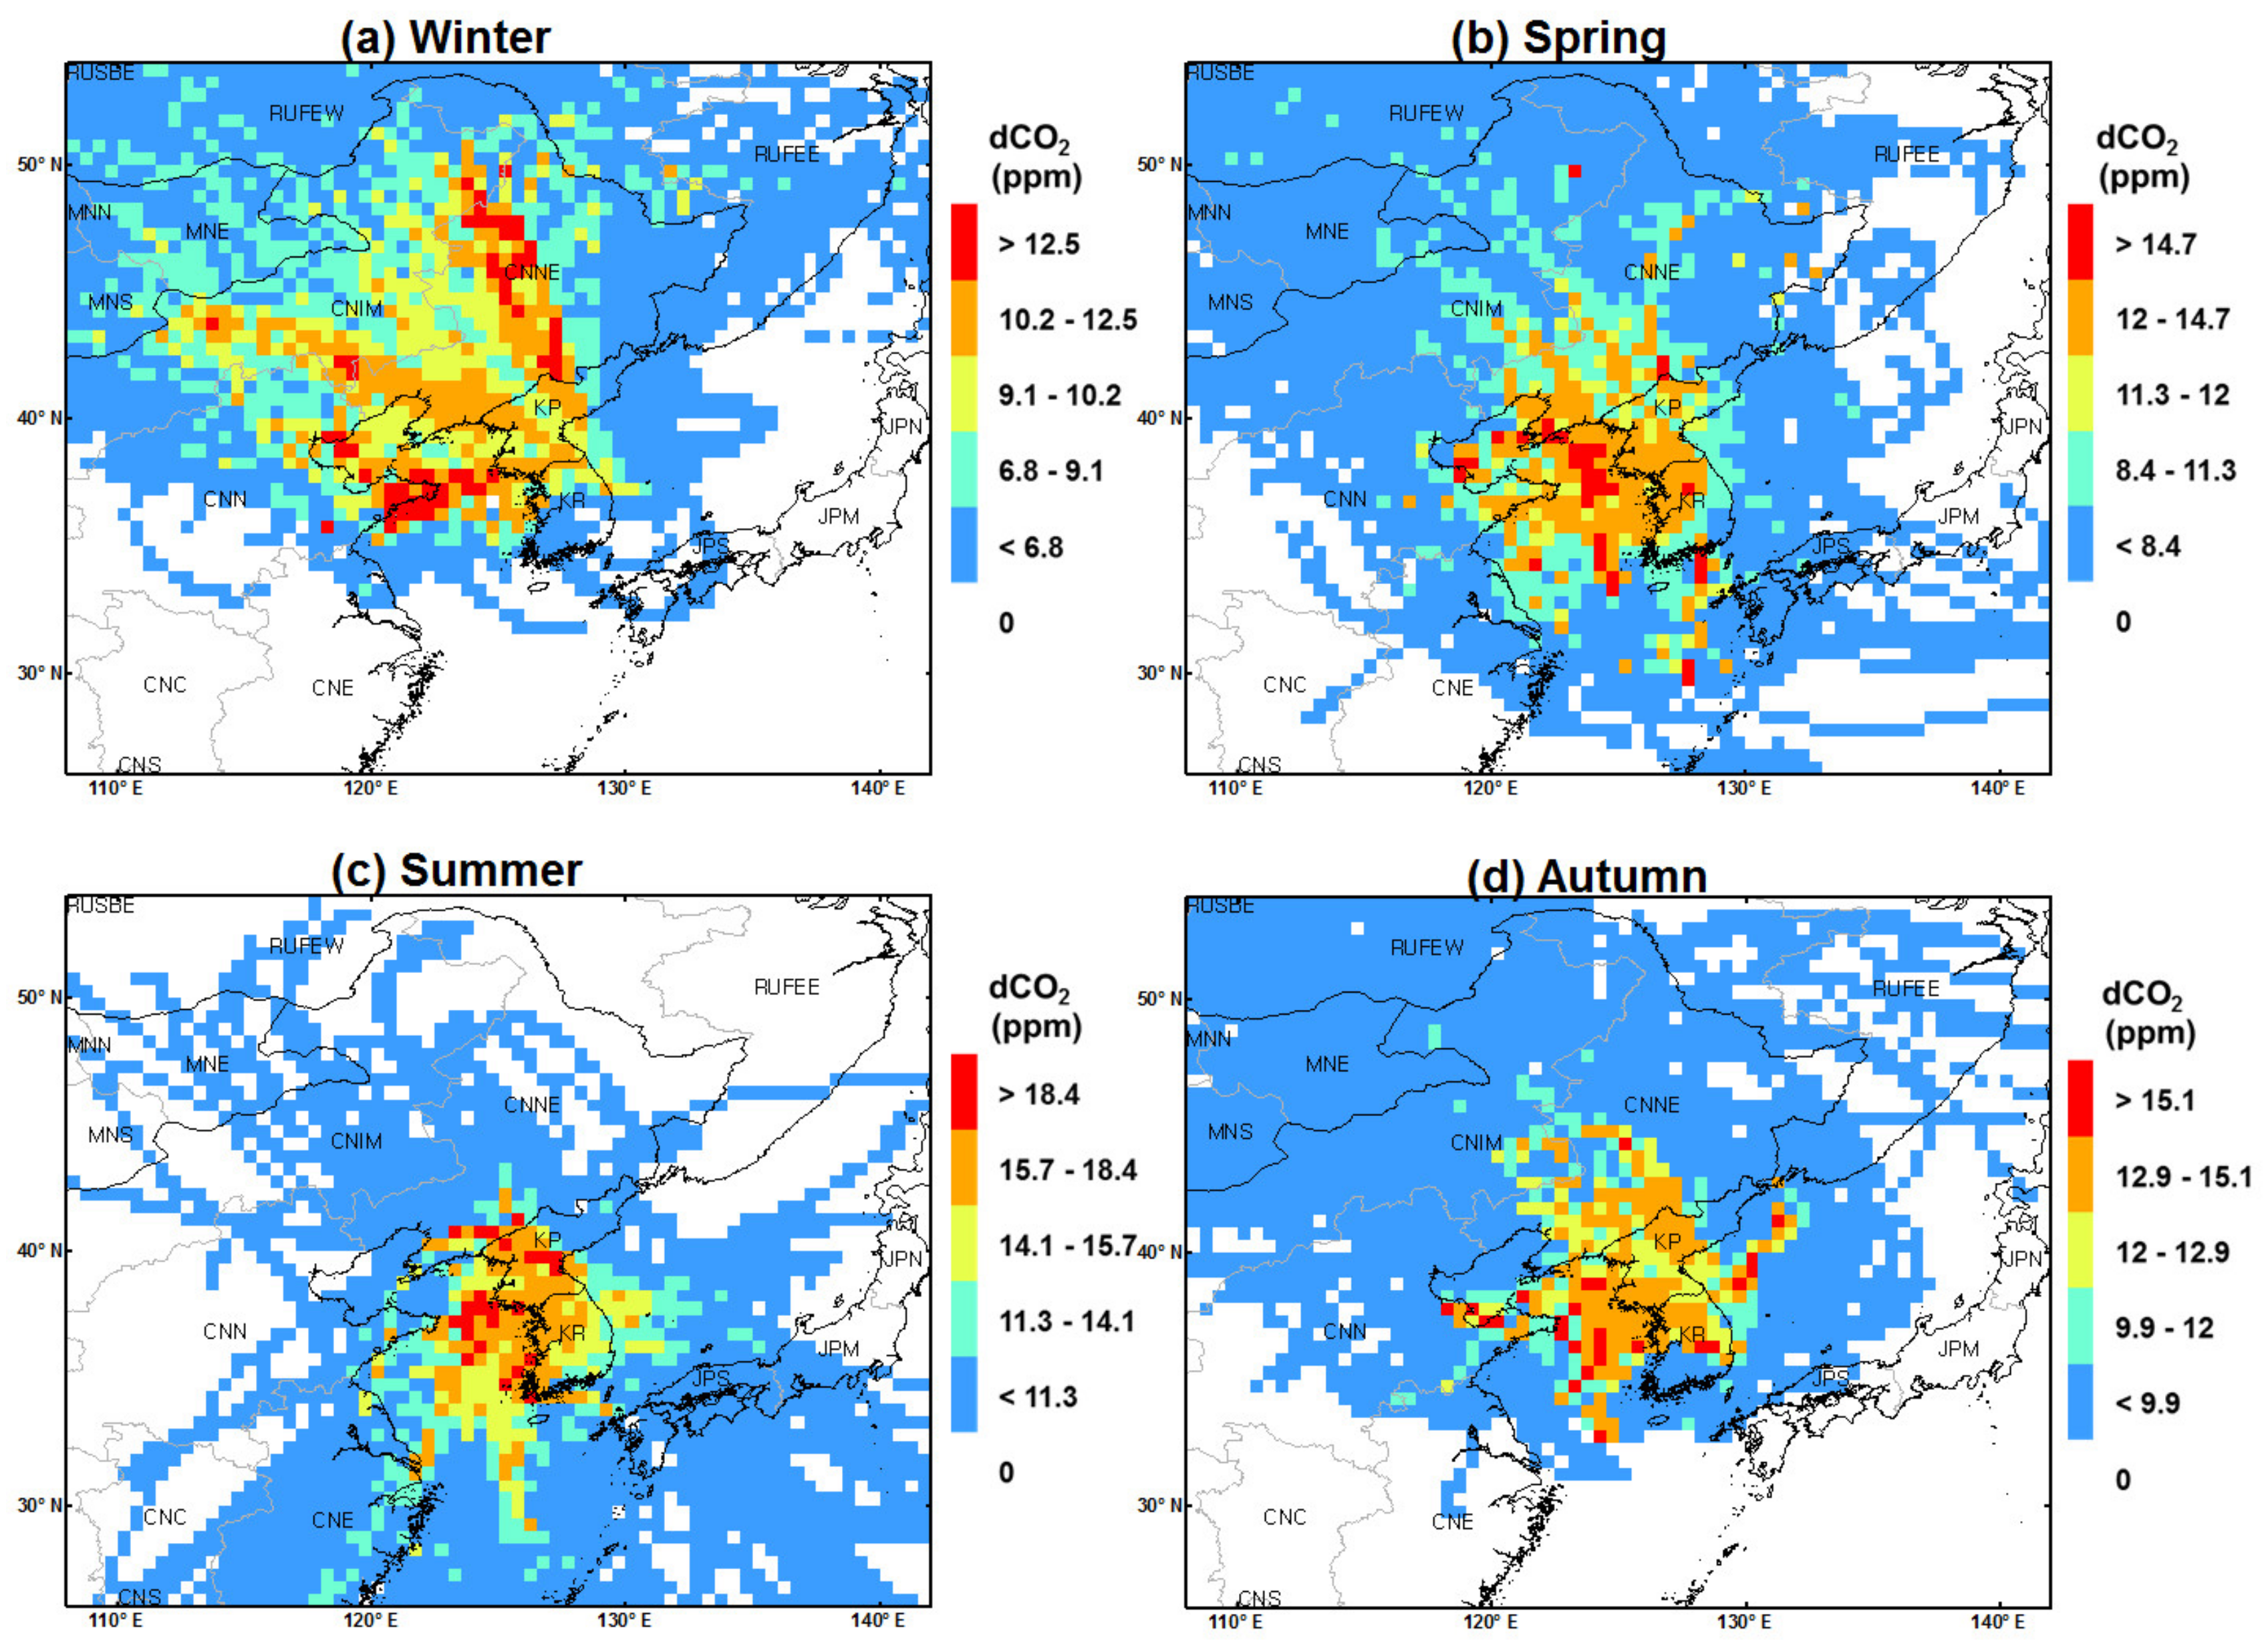
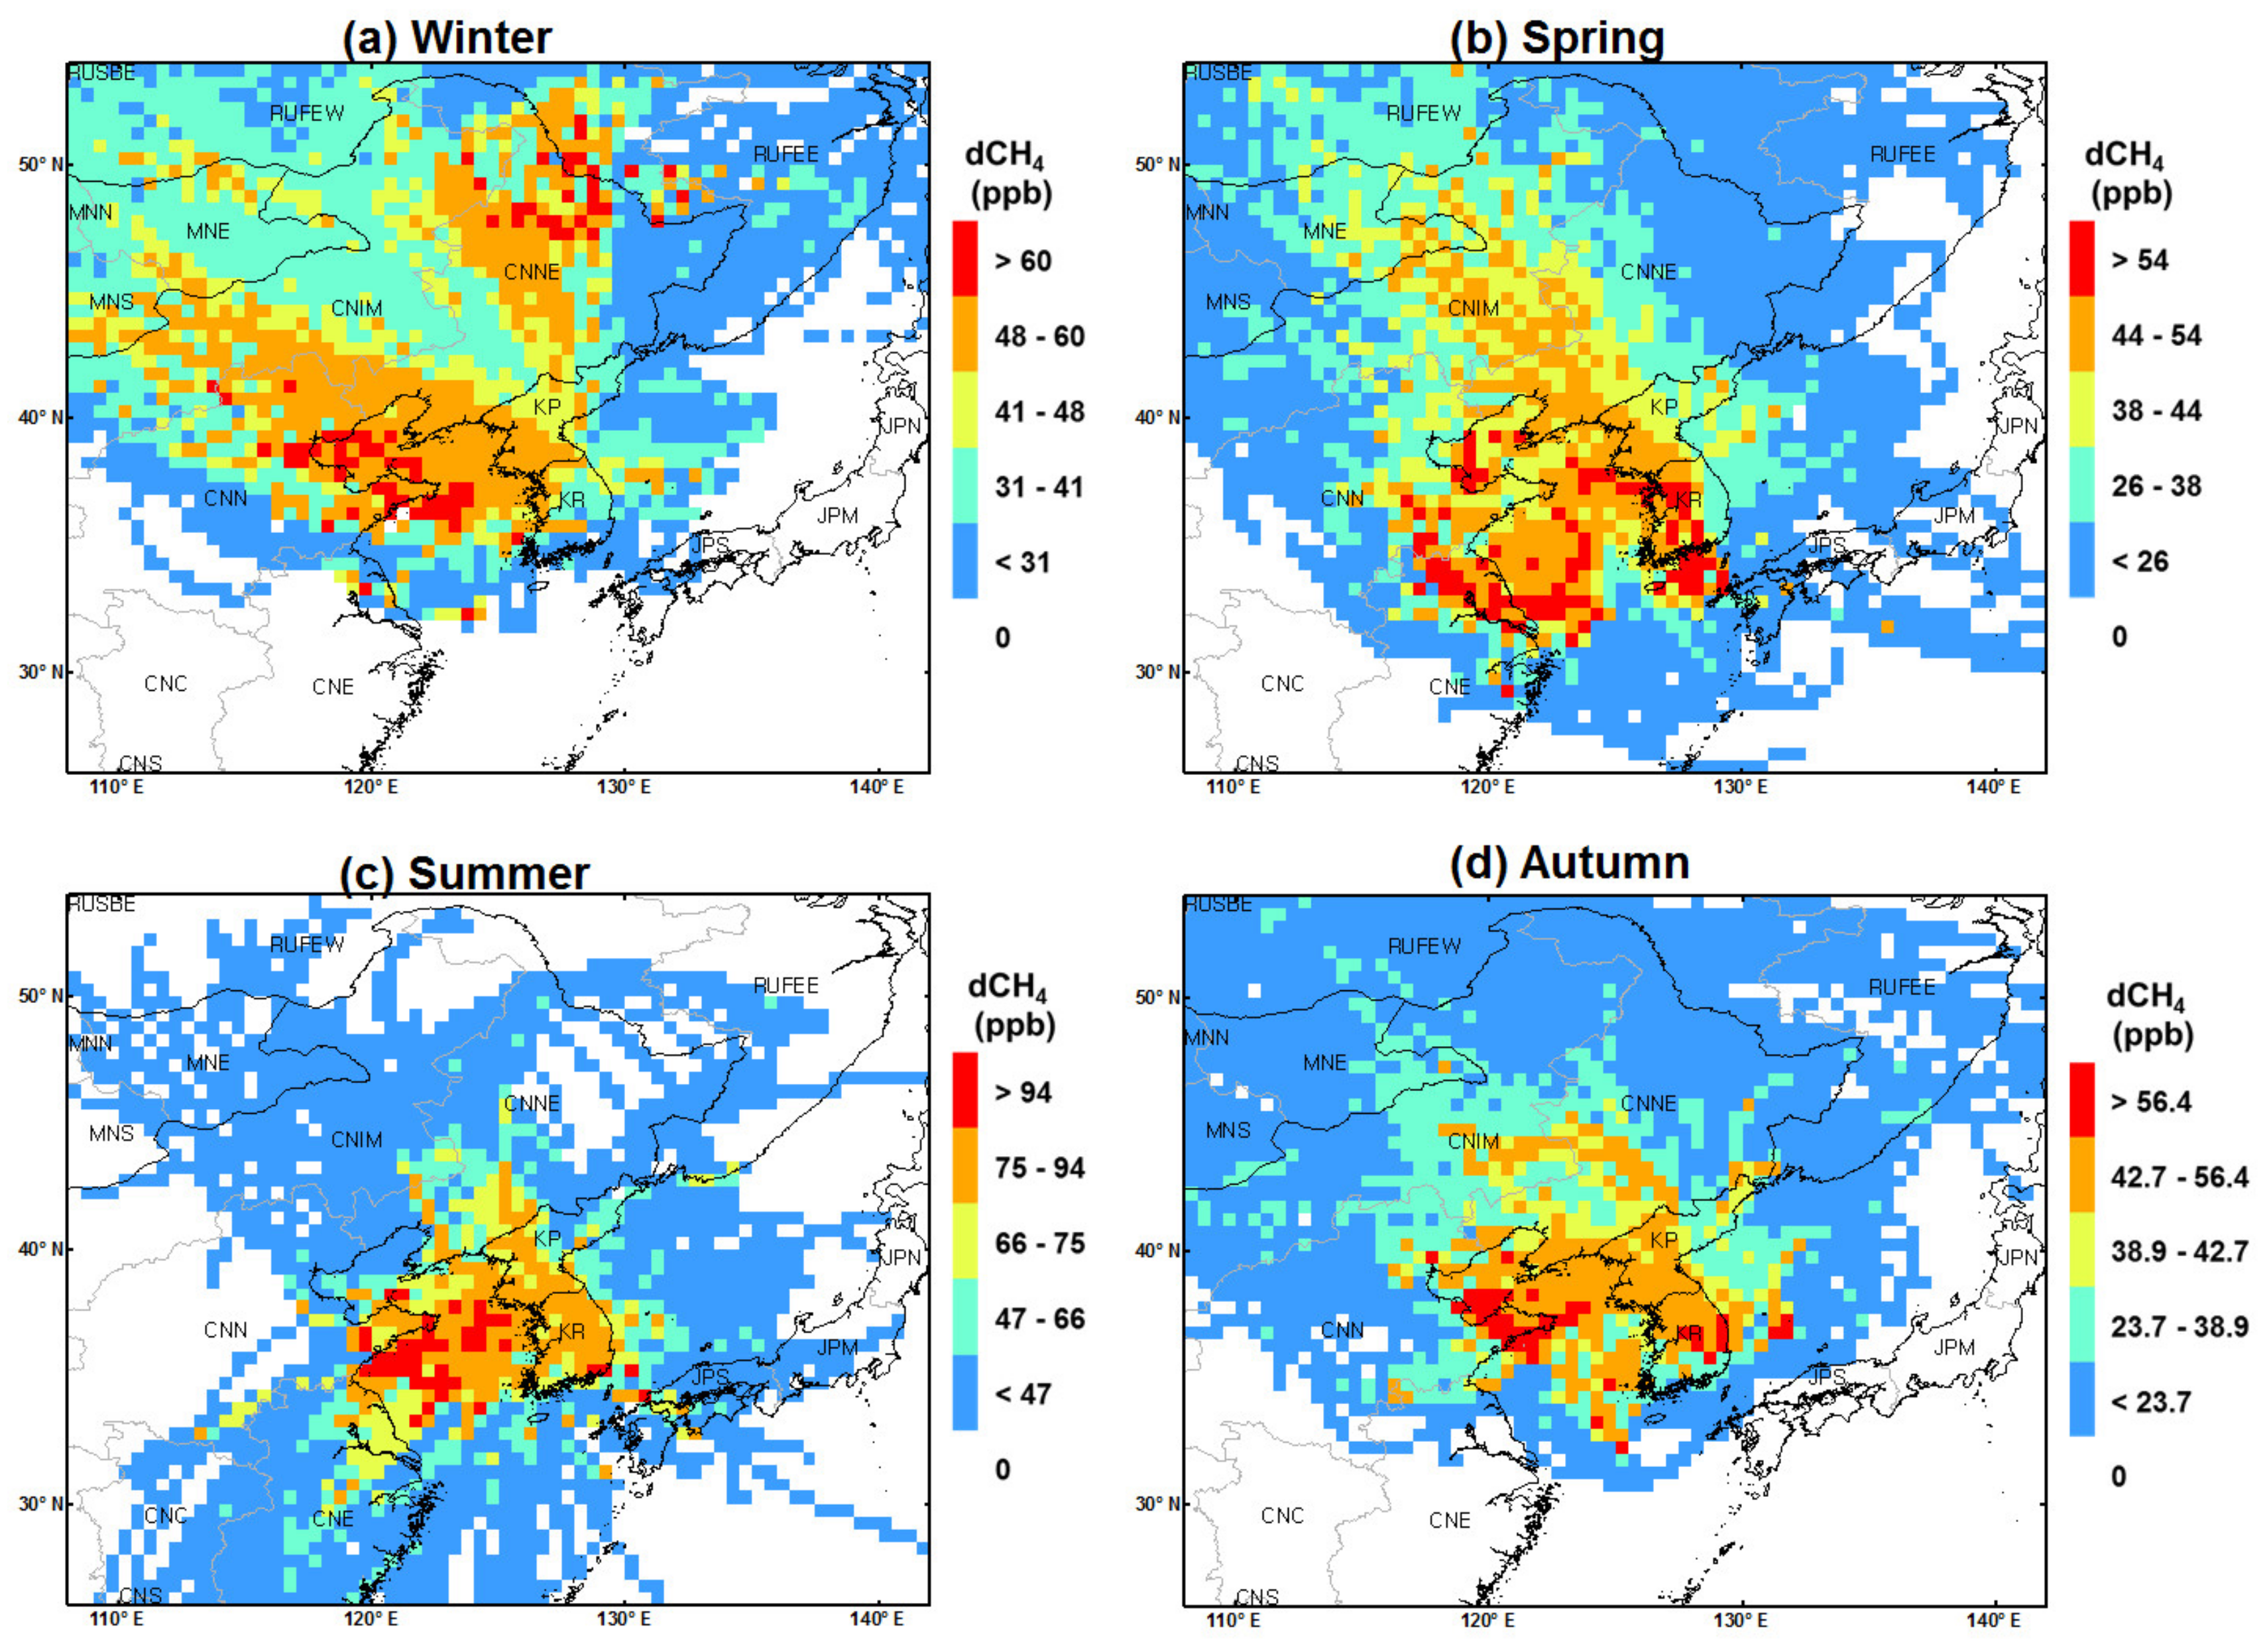
We performed the CWT analysis for each season and investigated major source areas, the areas significantly influencing the seasonal increments in CO2 and CH4 concentrations in GS (Figure 7 and Figure 8). We listed the identified source areas for CO2 and CH4 with major emission sectors in Table 3 and Table 4, respectively. It should be noted that we defined the major source area as the grid area holding CWT values for CO2 and CH4 more than the 75th percentile of the seasonally determined dC values for CO2 and CH4 at GS (e.g., 12.5, 14.7, 18.4 and 15.1 ppm of dCO2 in winter, spring, summer and autumn, respectively). While it is possible that a grid area for CO2 (CH4) with a CWT value of less than the 75th percentile value can contribute to the CO2 (CH4) concentration at GS, in order to reduce the complexity of data interpretation, such values were used as the cut-off criteria for the selection. Thus, the red-colored grid cells in the figures refer to the major source areas that significantly elevate the GHG concentrations at GS. Table 3 and Table 4 contain the detailed list of provinces or cities that were identified as the major sources of the increased CO2 and CH4 levels in GS, respectively.
In winter, the major source areas for CO2 in GS are indicated by the red grids in the three orange grid-strips that respectively stretch from the CNIM and CNNE continental regions and the coastal areas of CNN to the surrounding area of the receptor (i.e., GS), reflecting the strong effect of synoptic air flows (i.e., northwesterly) (Figure 7a). In the case of CH4, the major sources were identified by the red grids in or nearby the two orange grid-strips, one that stretches from the border areas of the western part (W) of the Russia Far East (RUFEW)–eastern part (E) of the Russia Far East (RUFEE) to the lower CNNE and another that runs from MNS to Korea (KR and KP) (Figure 8a). In springtime, distribution patterns for CO2 and CH4 sources seemed to be affected by the recurrent northwest-orient airflows and the newly intervened west- and southwest-orient airflows (Figure 7b and Figure 8b). Consequently, the major source areas for CO2 were identified by a small number of red-grids in CNIM, CNNE, KP and KR, together with a few scattered red-grids along the coastal regions of CNN-CNNE and over some littoral sea areas of KP, KR and JP. The identified major source areas for CH4 were scattered in CNN, CNE, KP, KR, western JPS and some sea areas (i.e., Bohai Sea, Yellow Sea near YRD, West Sea of KP and KR, South Sea of KR).
In summertime, the major source signals are not observed in continental regions remote to the northwest direction, such as RUFE and CNIM, due to the combined effects of the prevailed air flows from sea areas in the southwest or in the south and the weakened air flows from the northwest continental regions (Figure 7c and Figure 8c). Major CO2 source locations were identified in the southern CNNE, the mid KP, the western edges of KR and some areas in the Yellow Sea. Meanwhile, the major source areas of CH4 were identified in the eastern part of CNN and the southeastern part of KR. Furthermore, major CH4 source areas were also distributed over many off- and on-shore areas of the eastern CNN as well as western JPS and some sea areas (i.e., Bohai Sea, Yellow Sea, South Sea of KR).
In autumn, distributions of the source signals for CO2 and CH4 looked more extended toward the west and northwest compared to the summer case (Figure 7d and Figure 8d), illustrating the effect of the northwesterly air flows associated with the reestablished SH. The major CO2 sources were located in Jilin in CNNE, some coastal areas of Shandong in CNN and the northern part of Gyeongsang in KR, along with some sea areas between China and Korea and some eastern sea areas of KP. For CH4, many red grids were detected in the eastern Shandong in CNN and the nearby sea areas (e.g., Bohai Sea and Yellow Sea) along with the southern Gangwon and northern Gyongsang in KR. There were also some scattered CH4 source areas in the South Sea and the East Sea of KR.
Table 3, as previously mentioned, comprises lists of identified source areas for CO2 with major emission sectors. As an example, for wintertime we know from Table 3 that the detected CO2 source signals (i.e., red grid cells) over CNIM, CNNE (i.e., Heilongjiang, Jilin and Liaoning) and CNN (i.e., Shandong) are likely to be affected predominantly by the emissions from power generation sectors and additionally from industrial sectors [34]. Shandong and Liaoning have ranked as the top two contributors for the China national total CO2 emissions in the last 13 years [34]. We also know from Table 3 that the winter CO2 source signals northwest of KR are likely to be attributed to fuel combustion for energy/electricity/heat, transportation and industry (accounting for more than 96% of the total CO2 emissions in these areas) according to the Korea national GHG emission inventory for 2013 (so-called GHG-CAPSS 2013) [42]. According to the national estimates in a global emission inventory, EDGARv4.3.2 [5], the CO2 source signals over KP are likely to occur mainly due to the manufacturing industries, accounting for 46% of the KP national total CO2 emissions, followed by the fuel combustion for power generation (24%), and the residential and other sectors (20%). Like the winter CO2 case, the potential source areas and major emission sectors for other seasons can also be found in Table 3.
As mentioned above, Table 4 include lists of identified source areas for CH4 with major emission sectors. For example, we know from Table 4 that the wintertime CH4 source signals in CNNE (i.e., the mid-north of Heilongjiang) and CNN (i.e., Tianjin, Hebei and Shandong) are likely to have an association with the energy generation activities. Namely, the dominant CH4 emission source at Heilongjiang, Tianjin and Hebei in CNNE and CNN was coal mining [36]. Meanwhile, the wintertime red grid cells over the mid and east of Shandong in CNN can be characterized by both the enteric fermentation and the waste management sectors (i.e., the MSW land fill and wastewater treatment) [36]. The observed winter CH4 signal in Jiangsu in CNE is likely to be associated with the fugitive emissions from the farmland cultivation and waste management activities [36]. According to EDGARv4.3.2 [5], CH4 emissions from RUFEW and RUFEE can be mostly attributed to coal mining and the oil and gas system leakages. Like the winter CH4 case, the potential source areas and major emission sectors for other seasons can also be found in Table 4.
Meanwhile, the distributed red grids for CO2 and CH4 in many coastal cities and over many sea areas in all seasons may indicate the influence of ship emission sources (i.e., direct CO2 emissions from the ship engine combustions and CH4 leakages during fueling for ship activities) in the Chinese and Korean coastal areas, and the Bohai Sea and the Yellow Sea areas [5,42,48,49].
Ship emissions have been increasing with the increasing size and frequency of international trade and shipping. Consequently, emissions from shipping and port activities are important pollution sources in several sea areas of Northeast Asia such as Bohai Sea, the near sea areas of Yangtze River Delta and Pearl River Delta (e.g., [48] and [50,51]), and the Yellow Sea [49]. However, it seemed that the global emission inventory, EDGARv4.3.2, provides spatially weaker emissions signals for CO2 and CH4 in the sea areas of our domain. Namely, the strong CWT signals appear with comparable strengths to those occurring in inland areas of China or Korea in many sea areas (Figure 7 and Figure 8), whereas the GHG emissions of EDGARv4.3.2 in the sea areas are substantially lower than those in inland areas (Figure 3A). It also seems that there is no similarity between the distribution pattern of the red CWT grids and those of the ship emissions in this study. However, the distribution pattern of the red CWT grid derived in this study seemed to have more similarity when compared to the distribution pattern of the ship emissions estimated at a regional scale study (e.g., Figure 1 in [49]). Overall, such differences in emissions distribution are likely to be ascribed by the outdated data and information used for the ship emission estimation, including ship movement data (e.g., shipping routes, departure/arrival time, etc.), technical information on the ships (e.g., engine type/power, speed, fuels, etc.) and emission factor. Specifically, the ship traffic proxies used for the ship emission estimation (e.g., the ship position, ship lanes between ports, etc.) in EDGARv4.3.2 were based on old database [52] and were not updated for the East Asian region [5]. Since such proxy data are used for the disaggregation of the total amount GHG emissions along the shipping routes, spatial dissimilarity between the estimated and the real-world distribution of GHG emissions in the sea areas is likely to occur. In a recent regional investigation of ship tracks using a satellite-based Automatic Identification System (S-AIS) [53], we can see a number of ship tracks from the near sea areas of Shandong to a western edge (i.e., entrance areas of the Daedong River) area of North Korea (Figure 6 in [53]). Interestingly, the high CWT values were detected in similar sea areas (Figure 7 and Figure 8) where many ship tracks were reported. However, we cannot find similar patterns of emissions in the sea areas from EDGARv4.3.2. It is very likely that such detailed ship track information was not considered in the recent global and regional emission inventorying studies. Recent studies have also mentioned these problems (e.g., [49,51]). Therefore, this result suggests that future research utilizing updated regional scale ship emissions data would be beneficial to elucidate the red signal of CWT, which frequently occurs in sea areas in all seasons.
Meanwhile, there might be curiosity about whether these red signals (i.e., the high CWT values in the sea areas) can indicate the influence of emissions or just artefacts (like the products of the trailing effect). The trailing effect denotes the effect or the cases where upwind and downwind areas of sources are likely to also be detected as sources along the trajectories, due to an evenly distributed trajectory pattern [10,16,54]. It also occurs when the sample numbers (trajectory numbers) are limited in the standard PSCF approach [10,16]. Usually, such trailing effect is regarded as a common limitation in most HRM analysis that is critically dependent on trajectory patterns, and applying multi-receptors is suggested as a typical approach to reduce uncertainty subject to this problem [16,54]. In this study, we have examined whether the high CWT values in the sea areas are associated with such a trailing effect, focusing on the Yellow Sea area (Figure A4). Consequently, we confirmed that the trailing effect does not significantly affect the CWT calculation results in the sea areas. For example, in the grid cells over the areas of interest (AOI, i.e., some Yellow Sea areas in Figure A4a), we can see that there are not only one-way patterns of trajectories, but trajectories that come from the transverse and longitudinal directions with various patterns such as straight, curved, spiral types (Figure A4b). Moreover, seasonal distribution of the CWT values calculated by weighting GHG concentrations at the endpoints of these trajectories distributed in each grid cells does not show abnormal distribution patterns (Figure A4c,d).

4. Conclusions

We reported the summary of the atmospheric CO2 and CH4 levels in GS for the 2012–2014 period. We also examined the potential source areas influencing the rise in the CO2 and CH4 concentrations in GS by employing BPP and CWT methods together with currently available information on emission sources.
The highest peak-to-peak amplitude for CO2 was observed in summer, followed by spring, autumn and winter, whereas, for CH4, this was identified in spring, followed by winter, autumn and summer. The observed positive correlations between the hourly CO2 and CH4 in every season suggested the possibility of shared common emission sources, but there is a necessity for clarification of this in the future. Seasonally, the highest mean concentration of CO2 was observed in winter, followed by spring, autumn and summer, while the highest mean concentration of CH4 was in winter, followed by autumn, spring and summer. The BPP analysis indicated that the combustion activities and plant respirations in the locality, along with vehicle emissions on the national route No. 46, are likely be associated with the rise in CO2 observed at GS. For CH4, fugitive emissions from the gas and oil stations along the national route No. 46 and agricultural activities, including plant cultivation and livestock breeding, were considered as the likely source of the rise in CH4 observed at GS. The CWT results indicated that the major source areas are scattered at different regions in each season because pollution inflows occurred through seasonally different routes, except for the northwest-orient air inflows that were sustained throughout all seasons. For example, the air inflows that passed over the northwest and the north continental regions during winter were the two dominant routes in the increase of overall CO2 and CH4 in GS. Meanwhile, the southwest-/south-/southeast-orient airflows became the prevalent routes during summer, although slow air inflows from the northwest still remain as a path. Integrating these kinds of results with emission source information from national and global emission inventories, we identified potential source areas and characterized major emission sources. For example, we identified that major sources for the winter CO2 are coal combustion, coal washing and industrial activities in CNIM, CNN and CNNE and fuel combustion for energy for the infrastructure of Incheon of KR. The manufacturing industry and fuel combustion in Yanggang and Pyeongan of KP also are likely to be the potential sources of CO2 in GS. For the winter CH4 in GS, the identified major sources are coal mining and oil and gas leakages in RUFEW and RUFEE, coal mining and enteric fermentation in CNNE and CNN, and rice cultivation and waste landfill in CNE. The CWT results often implied ship emissions over coastal and sea areas as the potential sources that significantly influence the GHG levels in GS. However, it seemed that this result had less confidence due to large uncertainties in the ship emission inventory data that were used for the purpose of verifying the model results.
This is the first paper summarizing the recent atmospheric CO2 and CH4 measurements in the GS station in Korea and characterizing their potential emission sources. We expect that the results of this paper will be useful for further studies to investigate the connections between the atmospheric GHG trends, emissions, and the regional or national mitigation efforts. Moreover, further research in GS could be conducted by applying other practical tools, such as isotopic signatures (e.g., the 13C/12C-ratios in atmospheric CO2 and CH4). This kind of further research is likely to be useful in the verification of the representativeness of the results of this paper, deriving even more thorough results.

Author Contributions

Conceptualization, H.-K.K.; Data curation, M.-H.S. and J.S.; Investigation, H.-K.K.; Methodology, H.-K.K., C.-K.S., S.-C.H., M.-H.S., J.S., S.-K.K. and Y.L.; Project administration, C.-K.S.; Resources, Y.L.; Validation, H.-K.K, S.-C.H., S.-K.K., Y.L., and C.-K.S.; Writing—original draft, H.-K.K.; Writing—review and editing, H.-K.K and C.-K.S. All authors have read and agreed to the published version of the manuscript.

Funding

This research is supported by the National Research Foundation of Korea (NRF) grant funded by the Ministry of Education (NRF-2019R1I1A1A01045978) and the 2020 Research Fund of UNIST (Ulsan National Institute of Science and Technology) (1.200038.01).

Acknowledgments

The authors acknowledge NIER for providing the measured CO2 and CH4 data at GS. The authors also acknowledge Japan Aerospace Exploration Agency, National Institute for Environmental Studies, and Japan Ministry of the Environment for releasing the GOSAT data used in this study. Finally, the author thanks to three anonymous reviewers for their helpful comments and suggestions.

Conflicts of Interest

The authors declare no conflict of interest.

Appendix A

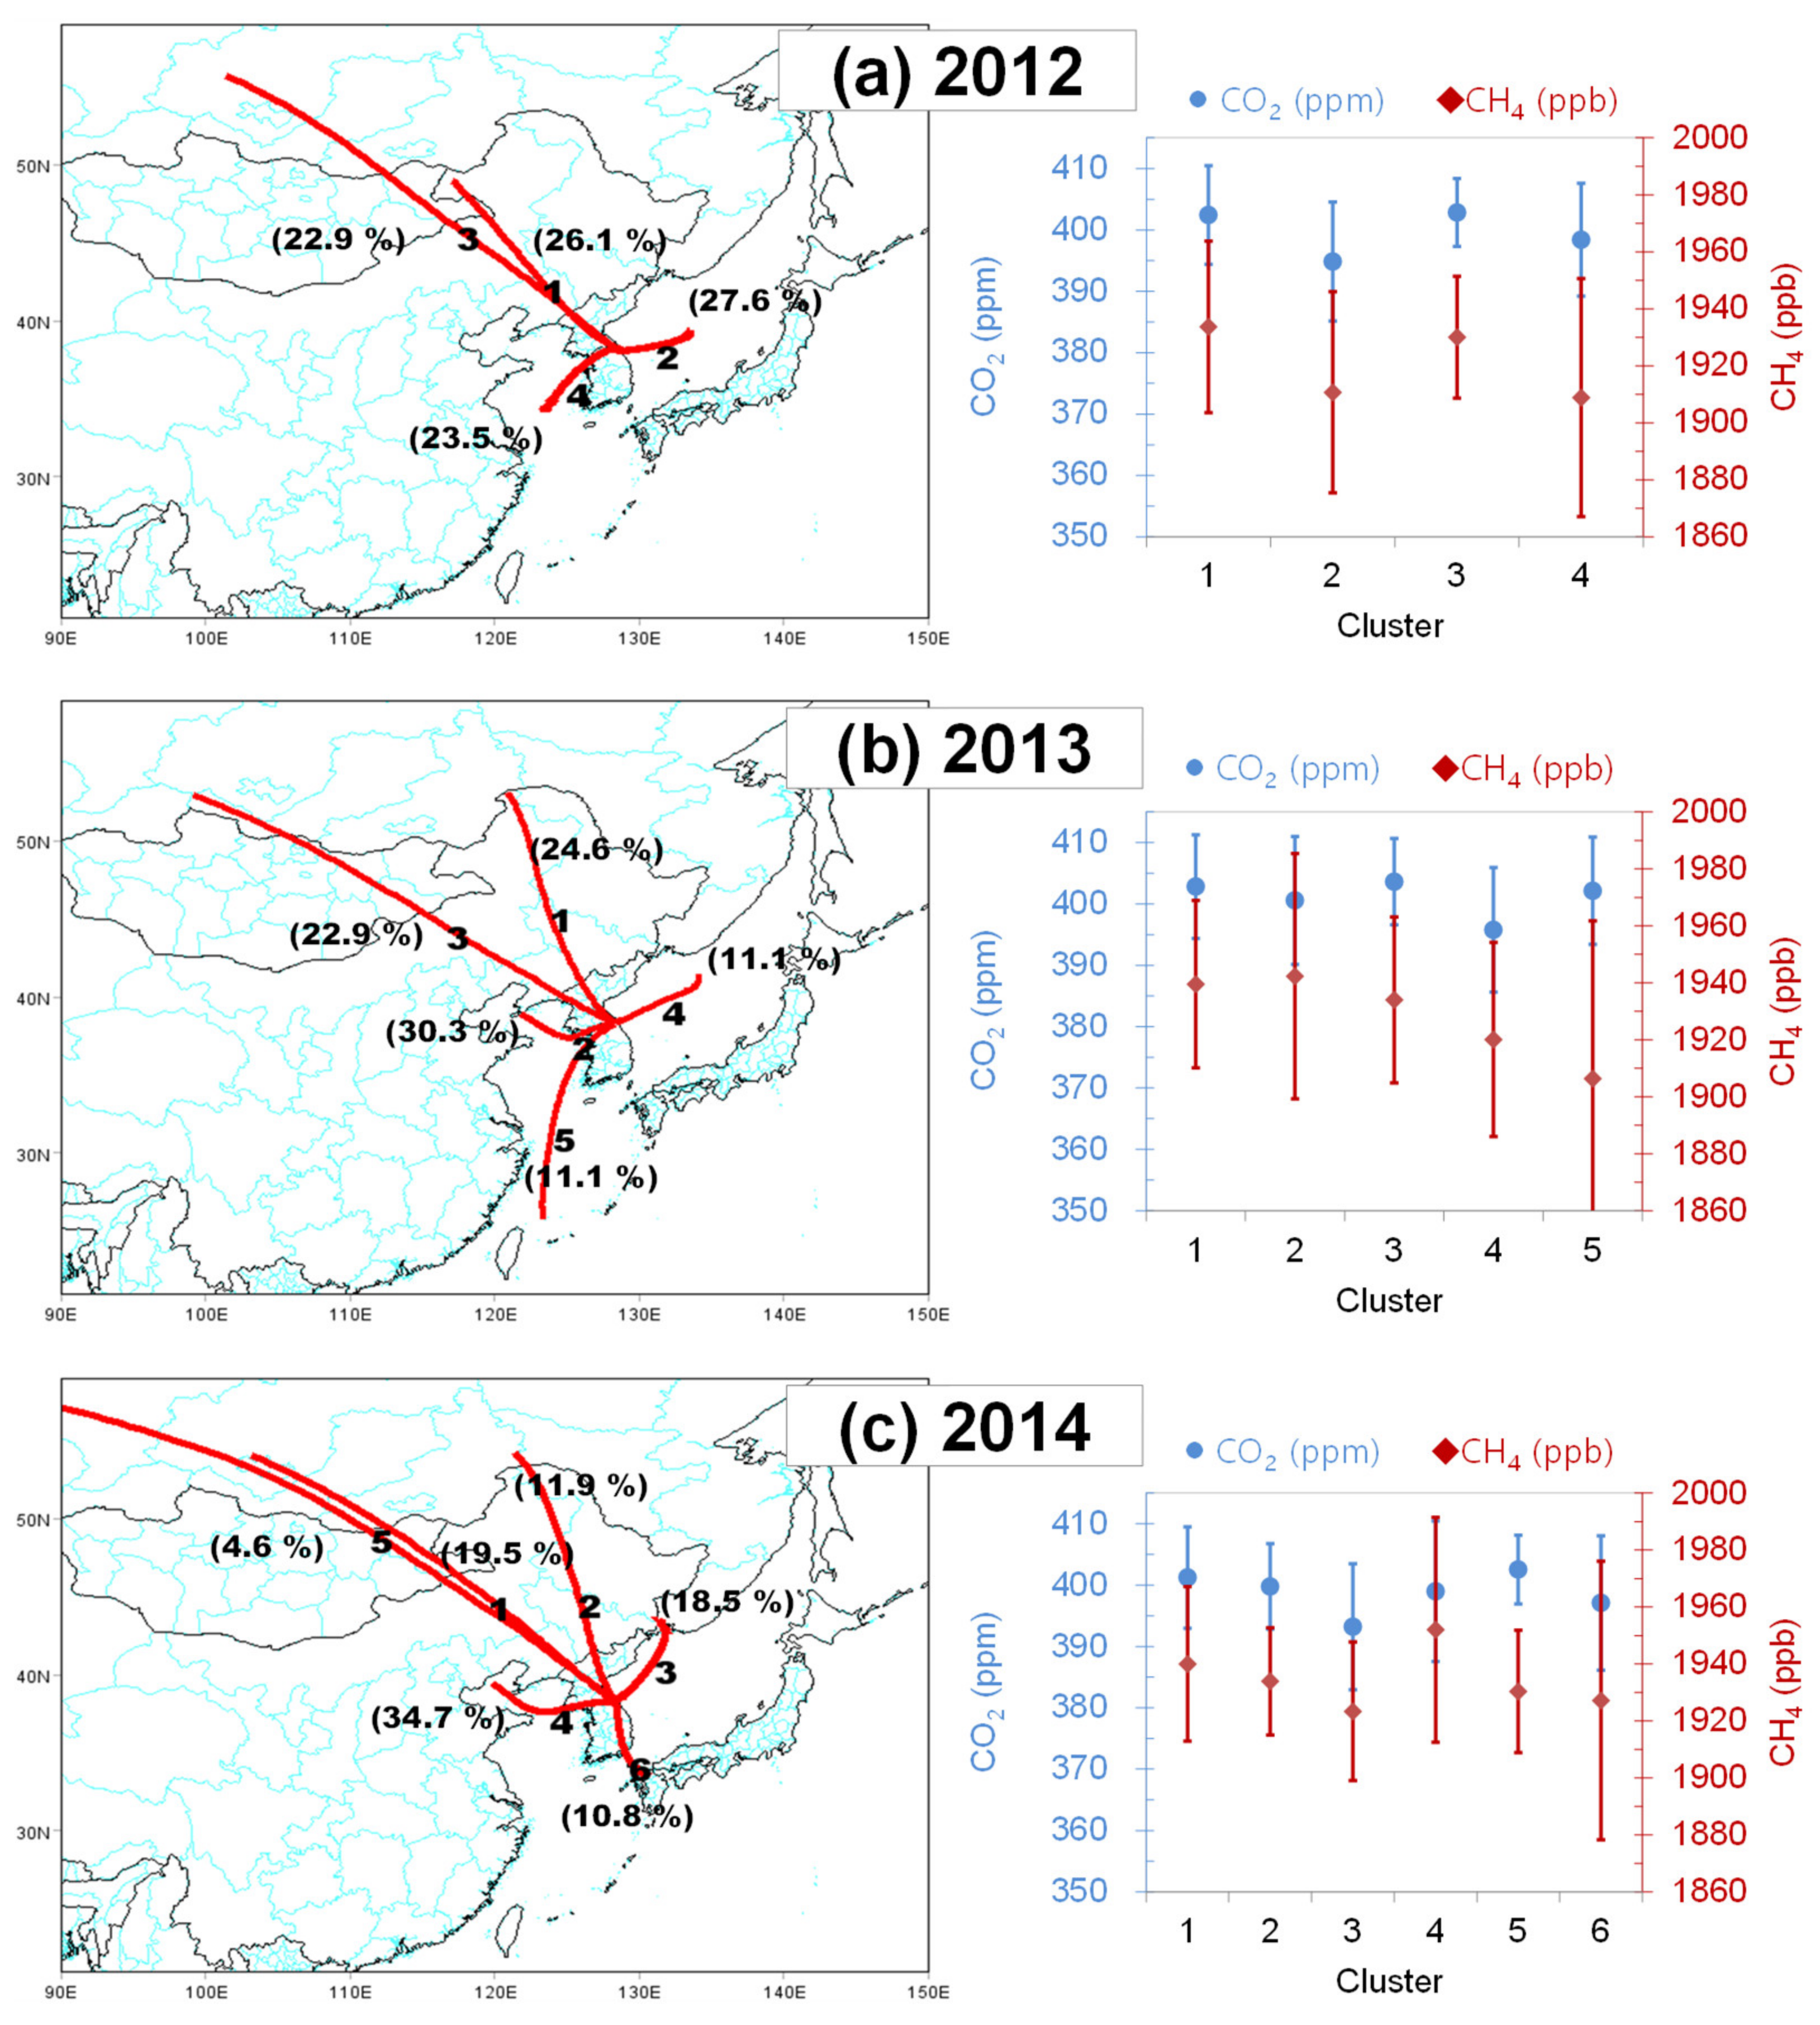
Figure A1. Annual mean trajectory clusters reaching the GS station (the left figures) and associated annual mean CO2 and CH4 concentrations (the right figures) for the year of (a) 2012, (b) 2013, and (c) 2014. In the map, each trajectory cluster is denoted by bold-face number and the percentage of air masses from each cluster is shown in parenthesis.
Atmosphere 11 00509 g0a1
Figure A2. Time series of the measured (a) CO2 and (b) CH4 concentrations at the GS station from 2012 to 2014. The background and the polluted concentrations are illustrated in circled and squared symbols, respectively.
Atmosphere 11 00509 g0a2
Table A1. Summary of the filtered CO2 and CH4 concentrations observed for in GS for the 2012–2014 period.
YearPolluted CaseBackground Case
CO2 (ppm)CH4 (ppb)CO2 (ppm)CH4 (ppb)
2012408.3 1939 395.4 1895
2013410.2 1956 396.2 1900
2014408.0 1963 394.5 1916
Mean408.8 1952 395.4 1904
Figure A3. Spatial distribution maps of the annual total emissions for (a) CO2 and (b) CH4. The CO2 and CH4 emissions are expressed in Gg CO2 per 0.25° × 0.25°.
Atmosphere 11 00509 g0a3
Figure A4. (a) A map indicating areas of interest (AOI) (here, some Yellow Sea areas) in which the patterns of air mass trajectories are curious, (b) seasonal air mass trajectories in the grid cells over the selected Yellow Sea areas (i.e., AOI), (c) Air mass trajectories superimposed over the CO2 source distribution derived by CWT analysis in some Yellow Sea areas in each season and (d) Air mass trajectories superimposed over the CH4 source distribution derived by CWT analysis in some Yellow Sea areas in each season.
Atmosphere 11 00509 g0a4

References

  1. WMO/GAW. The state of greenhouse gases in the atmosphere based on global observations through 2018. In WMO Greenhouse Gas Bulletin; World Meteorological Organization: Geneva, Switzerland, 2019. [Google Scholar]
  2. WMO/GAW. The state of greenhouse gases in the atmosphere based on global observations through 2013. In WMO Greenhouse Gas Bulletin; World Meteorological Organization: Geneva, Switzerland, 2014. [Google Scholar]
  3. Canadell, J.G.; Schulze, E.D. Global potential of biospheric carbon management for climate mitigation. Nat. Commun. 2014, 5, 5282. [Google Scholar] [CrossRef] [PubMed] [Green Version]
  4. Qi, J.; Xin, X.; John, R.; Groisman, P.; Chen, J. Understanding livestock production and sustainability of grassland ecosystems in the Asian Dryland Belt. Ecol. Process. 2017, 6, 22. [Google Scholar] [CrossRef]
  5. Janssens-Maenhout, G.; Crippa, M.; Guizzardi, D.; Muntean, M.; Schaaf, E.; Dentener, F.; Bergamaschi, P.; Pagliari, V.; Olivier, J.G.J.; Peters, J.A.H.W.; et al. EDGAR v4.3.2 Global Atlas of the three major greenhouse gas emissions for the period 1970–2012. Earth Syst. Sci. Data 2019, 11, 959–1002. [Google Scholar] [CrossRef] [Green Version]
  6. UNFCCC. Adoption of the Paris Agreement FCCC/CP/2015/L. 9/Rev. 1; United Nations Framework Convention on Climate Change: Paris, France, 2015. [Google Scholar]
  7. Cheng, I.; Xu, X.; Zhang, L. Overview of receptor-based source apportionment studies for speciated atmospheric mercury. Atmos. Chem. Phys. 2015, 15, 7877–7895. [Google Scholar] [CrossRef] [Green Version]
  8. Li, S.; Kim, J.; Park, S.; Kim, S.-K.; Park, M.-K.; Mühle, J.; Lee, G.; Lee, M.; Jo, C.O.; Kim, K.-R. Source Identification and Apportionment of Halogenated Compounds Observed at a Remote Site in East Asia. Environ. Sci. Technol. 2014, 48, 491–498. [Google Scholar] [CrossRef]
  9. Giemsa, E.; Jacobeit, J.; Ries, L.; Hachinger, S. Investigating regional source and sink patterns of Alpine CO2 and CH4 concentrations based on a back trajectory receptor model. Environ. Sci. Eur. 2019, 31, 49. [Google Scholar] [CrossRef]
  10. Jeong, U.; Kim, J.; Lee, H.; Jung, J.; Kim, Y.J.; Song, C.H.; Koo, J.-H. Estimation of the contributions of long range transported aerosol in East Asia to carbonaceous aerosol and PM concentrations in Seoul, Korea using highly time resolved measurements: A PSCF model approach. J. Environ. Monit. 2011, 13, 1905–1918. [Google Scholar] [CrossRef]
  11. Cheng, I.; Zhang, L.; Blanchard, P.; Dalziel, J.; Tordon, R. Concentration-weighted trajectory approach to identifying potential sources of speciated atmospheric mercury at an urban coastal site in Nova Scotia, Canada. Atmos. Chem. Phys. 2013, 13, 6031–6048. [Google Scholar] [CrossRef] [Green Version]
  12. Dimitriou, K.; Kassomenos, P. Three year study of tropospheric ozone with back trajectories at a metropolitan and a medium scale urban area in Greece. Sci. Total Environ. 2015, 502, 493–501. [Google Scholar] [CrossRef]
  13. Jin, F.; Kim, J.; Kim, K.-R. Estimation of Potential Source Region in Northeast Asia through Continuous In-Situ Measurement of Atmospheric CO2 at Gosan, Jeju Island, Korea. Terr. Atmos. Ocean. Sci. 2010, 21, 313–323. [Google Scholar] [CrossRef] [Green Version]
  14. Seibert, P.; Kromp-Kolb, H.; Baltensperger, U.; Jost, D.; Schwikowski, M.; Kasper, A.; Puxbaum, H. Trajectory Analysis of Aerosol Measurements at High Alpine Sites; Borrell, P.M., Borrell, P., Cvitaš, T., Seiler, W., Eds.; Academic Publishing: Den Haag, The Netherlands, 1994; Volume 15, pp. 689–693. [Google Scholar]
  15. Polissar, A.V.; Hopke, P.K.; Harris, J.M. Source Regions for Atmospheric Aerosol Measured at Barrow, Alaska. Environ. Sci. Technol. 2001, 35, 4214–4226. [Google Scholar] [CrossRef] [PubMed]
  16. Hsu, Y.-K.; Holsen, T.M.; Hopke, P.K. Comparison of hybrid receptor models to locate PCB sources in Chicago. Atmos. Environ. 2003, 37, 545–562. [Google Scholar] [CrossRef]
  17. Carslaw, D.C.; Beevers, S.D.; Ropkins, K.; Bell, M.C. Detecting and quantifying aircraft and other on-airport contributions to ambient nitrogen oxides in the vicinity of a large international airport. Atmos. Environ. 2006, 40, 5424–5434. [Google Scholar] [CrossRef]
  18. Carslaw, D.C.; Beevers, S.D. Characterising and understanding emission sources using bivariate polar plots and k-means clustering. Environ. Model. Softw. 2013, 40, 325–329. [Google Scholar] [CrossRef]
  19. Xia, L.; Zhou, L.; Tans, P.P.; Liu, L.; Zhang, G.; Wang, H.; Luan, T. Atmospheric CO2 and its δ13C measurements from flask sampling at Lin’an regional background station in China. Atmos. Environ. 2015, 117, 220–226. [Google Scholar] [CrossRef]
  20. Schaefer, H.; Fletcher, S.E.M.; Veidt, C.; Lassey, K.R.; Brailsford, G.W.; Bromley, T.M.; Dlugokencky, E.J.; Michel, S.E.; Miller, J.B.; Levin, I.; et al. A 21st-century shift from fossil-fuel to biogenic methane emissions indicated by 13CH4. Science 2016, 352, 80–84. [Google Scholar] [CrossRef] [PubMed]
  21. MoE. Guidelines for Installation and Operation of Air Pollution Monitoring Network; Ministry of Environment (MoE): Gwacheon, Korea, 2011. (In Korean) [Google Scholar]
  22. O’Doherty, S.; Simmonds, P.G.; Cunnold, D.M.; Wang, H.J.; Sturrock, G.A.; Fraser, P.J.; Ryall, D.; Derwent, R.G.; Weiss, R.F.; Salameh, P.; et al. In situ chloroform measurements at Advanced Global Atmospheric Gases Experiment atmospheric research stations from 1994 to 1998. J. Geophys. Res. Atmos. 2001, 106, 20429–20444. [Google Scholar] [CrossRef]
  23. Fang, S.X.; Tans, P.P.; Steinbacher, M.; Zhou, L.X.; Luan, T. Comparison of the regional CO2 mole fraction filtering approaches at a WMO/GAW regional station in China. Atmos. Meas. Tech. 2015, 8, 5301–5313. [Google Scholar] [CrossRef] [Green Version]
  24. Carslaw, D.C.; Ropkins, K. Openair—An R package for air quality data analysis. Environ. Model. Softw. 2012, 27–28, 52–61. [Google Scholar] [CrossRef]
  25. Stein, A.F.; Draxler, R.R.; Rolph, G.D.; Stunder, B.J.B.; Cohen, M.D.; Ngan, F. NOAA’s HYSPLIT Atmospheric Transport and Dispersion Modeling System. Bull. Am. Meteorol. Soc. 2015, 96, 2059–2077. [Google Scholar] [CrossRef]
  26. Makra, L.; Matyasovszky, I.; Guba, Z.; Karatzas, K.; Anttila, P. Monitoring the long-range transport effects on urban PM10 levels using 3D clusters of backward trajectories. Atmos. Environ. 2011, 45, 2630–2641. [Google Scholar] [CrossRef]
  27. Stohl, A. Computation, accuracy and applications of trajectories—A review and bibliography. Atmos. Environ. 1998, 32, 947–966. [Google Scholar] [CrossRef]
  28. Reimann, S.; Schaub, D.; Stemmler, K.; Folini, D.; Hill, M.; Hofer, P.; Buchmann, B.; Simmonds, P.G.; Greally, B.R.; O’Doherty, S. Halogenated greenhouse gases at the Swiss High Alpine Site of Jungfraujoch (3580 m asl): Continuous measurements and their use for regional European source allocation. J. Geophys. Res. Atmos. 2004, 109. [Google Scholar] [CrossRef]
  29. Kong, X.; He, W.; Qin, N.; He, Q.; Yang, B.; Ouyang, H.; Wang, Q.; Xu, F. Comparison of transport pathways and potential sources of PM10 in two cities around a large Chinese lake using the modified trajectory analysis. Atmos. Res. 2013, 122, 284–297. [Google Scholar] [CrossRef]
  30. Wang, Y.Q.; Zhang, X.Y.; Draxler, R.R. TrajStat: GIS-based software that uses various trajectory statistical analysis methods to identify potential sources from long-term air pollution measurement data. Environ. Model. Softw. 2009, 24, 938–939. [Google Scholar] [CrossRef]
  31. Oishi, Y.; Ishida, H.; Nakajima, T.Y.; Nakamura, R.; Matsunaga, T. The impact of different support vectors on GOSAT-2 CAI-2 L2 cloud discrimination. Remote Sens. 2017, 9, 1236. [Google Scholar] [CrossRef] [Green Version]
  32. Park, Y.-J.; Ahn, J.-B. Characteristics of atmospheric circulation over East Asia associated with summer blocking. J. Geophys. Res. Atmos. 2014, 119, 726–738. [Google Scholar] [CrossRef]
  33. Nemani, R.; White, M.; Thornton, P.; Nishida, K.; Reddy, S.; Jenkins, J.; Running, S. Recent trends in hydrologic balance have enhanced the terrestrial carbon sink in the United States. Geophys. Res. Lett. 2002, 29, 106-1–106-4. [Google Scholar] [CrossRef] [Green Version]
  34. Shan, Y.; Liu, J.; Liu, Z.; Xu, X.; Shao, S.; Wang, P.; Guan, D. New provincial CO2 emission inventories in China based on apparent energy consumption data and updated emission factors. Appl. Energy 2016, 184, 742–750. [Google Scholar] [CrossRef] [Green Version]
  35. Sun, J.; Peng, H.; Chen, J.; Wang, X.; Wei, M.; Li, W.; Yang, L.; Zhang, Q.; Wang, W.; Mellouki, A. An estimation of CO2 emission via agricultural crop residue open field burning in China from 1996 to 2013. J. Clean. Prod. 2016, 112, 2625–2631. [Google Scholar] [CrossRef]
  36. Zhang, B.; Chen, G.Q. China’s CH4 and CO2 emissions: Bottom-up estimation and comparative analysis. Ecol. Indic. 2014, 47, 112–122. [Google Scholar] [CrossRef]
  37. Zhang, B.; Yang, T.R.; Chen, B.; Sun, X.D. China’s regional CH4 emissions: Characteristics, interregional transfer and mitigation policies. Appl. Energy 2016, 184, 1184–1195. [Google Scholar] [CrossRef]
  38. WMO/GAW. The state of greenhouse gases in the atmosphere based on global observations through 2012. In WMO Greenhouse Gas Bulletin; World Meteorological Organization: Geneva, Switzerland, 2013. [Google Scholar]
  39. WMO/GAW. The state of greenhouse gases in the atmosphere based on global observations through 2014. In WMO Greenhouse Gas Bulletin; World Meteorological Organization: Geneva, Switzerland, 2015. [Google Scholar]
  40. GIR. 2016 National Greenhouse Gas Inventory Report of Korea; Greenhouse Gas Inventory & Research Center (GIR): Seoul, Korea, 2016. (In Korean) [Google Scholar]
  41. MOTIE/KEEI. Yearbook of Energy Statistics; Ministry of Trade, Industry and Energy (MOTIE) and Korea Energy Economics Institute (KEEI) (MOTIE/KEEI): Ulsan, Korea, 2015. (In Korean) [Google Scholar]
  42. NIER. Handbook of Greenhouse Gases-Clean Air Policy Support System (GHG-CAPSS) Emissions Inventory; National Institute of Environmental Research (NIER): Incheon, Korea, 2016. (In Korean) [Google Scholar]
  43. Jacob, D.J. Introduction to Atmospheric Chemistry; Princeton University Press: Princeton, NJ, USA, 1999. [Google Scholar]
  44. Chan, J.C.L.; Li, C. The East Asia Winter Monsoon. In East Asian Monsoon; Chang, C.-P., Ed.; World Scientific: Hackensack, NJ, USA, 2004; pp. 54–106. [Google Scholar] [CrossRef] [Green Version]
  45. Park, T.-W.; Ho, C.-H.; Jeong, J.-H.; Heo, J.-W.; Deng, Y. A new dynamical index for classification of cold surge types over East Asia. Clim. Dyn. 2015, 45, 2469–2484. [Google Scholar] [CrossRef]
  46. Kemp, J.F.; Young, P. Notes on Meteorology, 3rd ed.; Routledge: London, UK; New York, NY, USA, 1993. [Google Scholar]
  47. Ha, K.-J.; Park, S.-K.; Kim, K.-Y. On interannual characteristics of Climate Prediction Center merged analysis precipitation over the Korean peninsula during the summer monsoon season. Int. J. Climatol. 2005, 25, 99–116. [Google Scholar] [CrossRef]
  48. Chen, D.; Wang, X.; Li, Y.; Lang, J.; Zhou, Y.; Guo, X.; Zhao, Y. High-spatiotemporal-resolution ship emission inventory of China based on AIS data in 2014. Sci. Total Environ. 2017, 609, 776–787. [Google Scholar] [CrossRef] [PubMed]
  49. Liu, H.; Fu, M.; Jin, X.; Shang, Y.; Shindell, D.; Faluvegi, G.; Shindell, C.; He, K. Health and climate impacts of ocean-going vessels in East Asia. Nat. Clim. Chang. 2016, 6, 1037–1041. [Google Scholar] [CrossRef]
  50. Fu, M.; Liu, H.; Jin, X.; He, K. National- to port-level inventories of shipping emissions in China. Environ. Res. Lett. 2017, 12, 114024. [Google Scholar] [CrossRef]
  51. Chen, D.; Zhao, Y.; Nelson, P.; Li, Y.; Wang, X.; Zhou, Y.; Lang, J.; Guo, X. Estimating ship emissions based on AIS data for port of Tianjin, China. Atmos. Environ. 2016, 145, 10–18. [Google Scholar] [CrossRef]
  52. Wang, C.; Corbett, J.J.; Firestone, J. Improving Spatial Representation of Global Ship Emissions Inventories. Environ. Sci. Technol. 2008, 42, 193–199. [Google Scholar] [CrossRef]
  53. Hong, D.-B.; Yang, C.-S.; Kim, T.-H. Investigation of Passing Ships in Inaccessible Areas Using Satellite-based Automatic Identification System (S-AIS) Data. Korean J. Remote Sens. 2018, 34, 579–590. [Google Scholar]
  54. Jin, F.; Fang, Y.; Chen, T.; Li, D.; Kim, J.; Park, M.-K.; Park, S.; Kim, K.-R. In situ measurement of atmospheric carbon dioxide at Yanbian, China: Estimating its northeast Asian emission regions. Sci. China Earth Sci. 2012, 55, 1742–1754. [Google Scholar] [CrossRef]
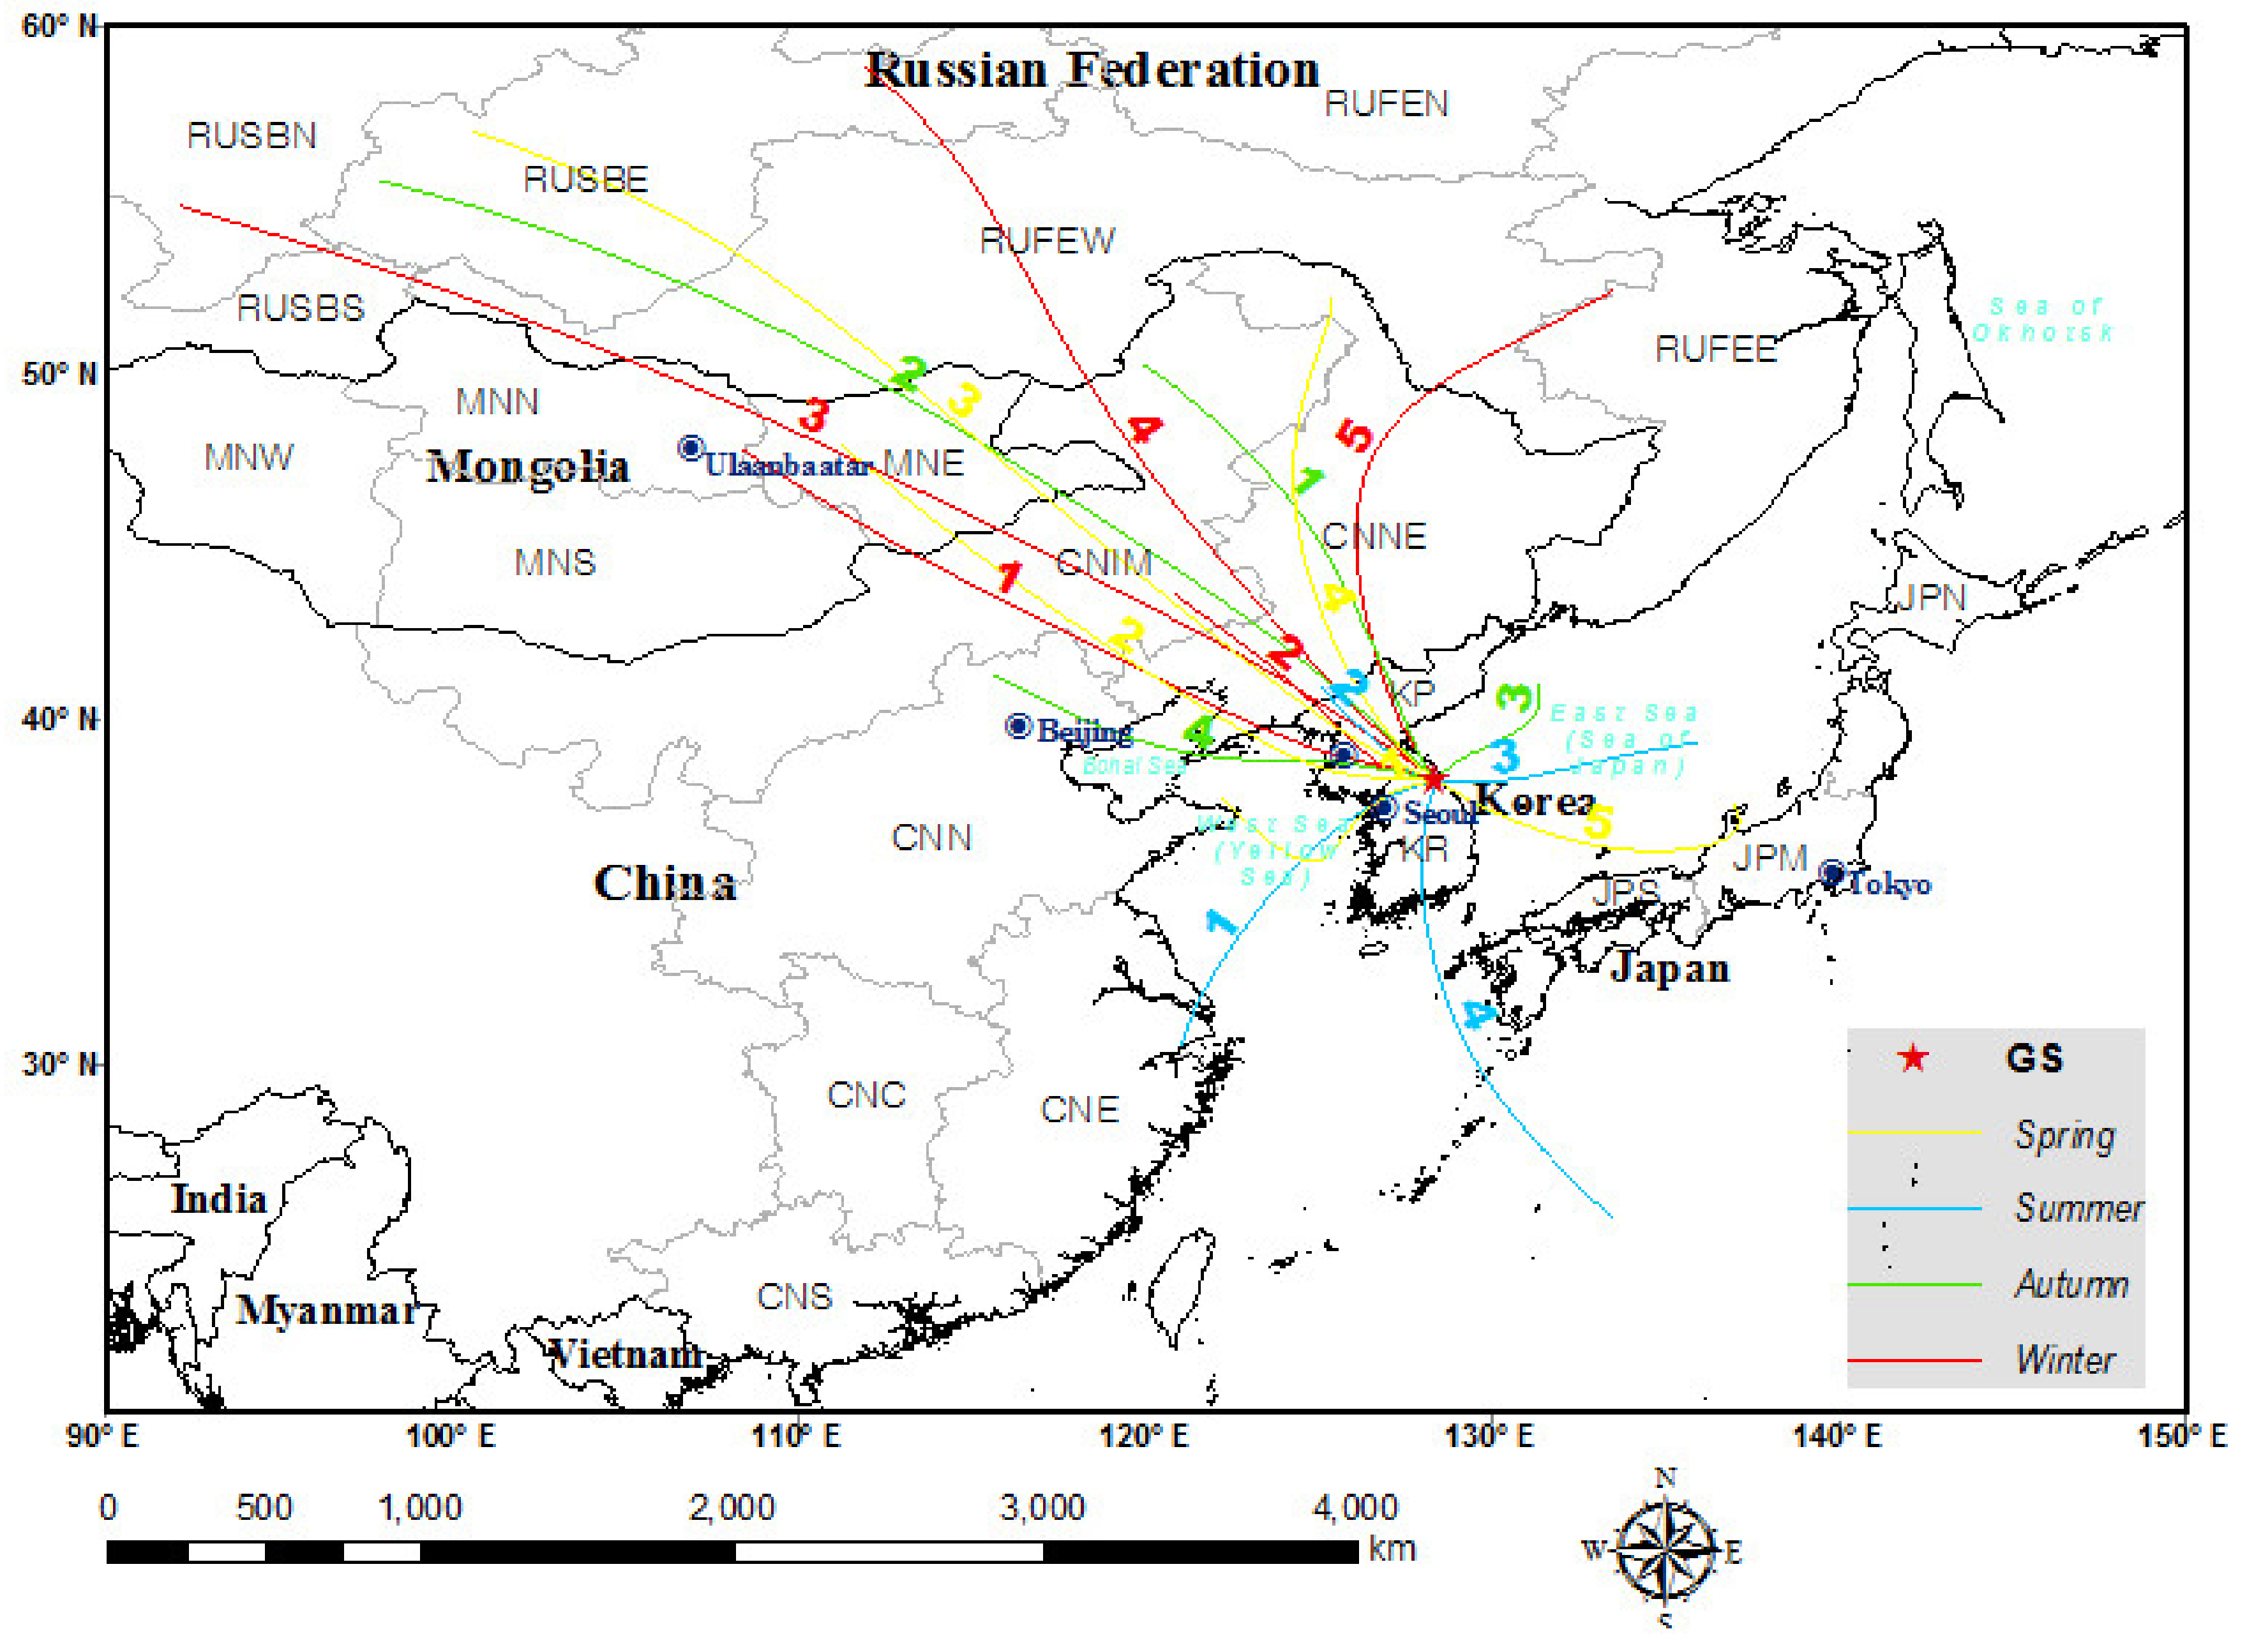
Figure 1. Location of the study site, the Ganseong (GS) represented by the red star. The colored (yellow to red) lines show the seasonal mean trajectory clusters and indicate the main directions of air flows seasonally reaching the GS station. RUFEE: Eastern part (E) of the Russia Far East (RUFE), RUFEN: Northern part (N) of the Russia Far East, RUFEW: Western part (W) of the Russia Far East, RUSBE: Eastern (E) Siberia of Russia (RUSB), RUSBN: Northern (N) Siberia of Russia, RUSBS: Southern (S) Siberia of Russia, MNE: Eastern Mongolia (MN), MNN: Northern Mongolia, MNS: Southern Mongolia, MNW: Western Mongolia, CNC: Central (C) China (CN), CNE: Eastern China, CNIM: Inner Mongolia (IM) of China, CNN: Northern China, CNNE: Northeastern (NE) China, CNS: Southern China, KP: North Korea, KR: South Korea, JPM: Mid (M) Japan (JP), JPN: Northern Japan, JPS: Southern Japan. The numbers in bold with seasonally different colors denotes the individual clusters in each season.
Atmosphere 11 00509 g001
Figure 2. (a) Time series of hourly CO2 and CH4 concentrations and (b) diurnal variations of hourly average CO2 and CH4 at the GS station from 2012 to 2014.
Atmosphere 11 00509 g002
Figure 3. Seasonal variations of the measured (a) CO2 and (b) CH4 concentration in the GS station. The boxes represent the range between the 25th and 75th percentile of the measured values at GS. The line and circle components in boxes indicate the median and mean values, respectively. The whiskers indicate the highest (1.5× IQR (the interquartile range) of the upper quartile) and lowest (1.5× IQR of the lower quartile) values.
Atmosphere 11 00509 g003
Figure 4. Time series of CO2 and CH4 derived from the GOSAT satellite in the study domain. Circle and diamond symbols denote the averaged concentrations of over the complete domain in Figure 1 and error bars show the standard deviation.
Atmosphere 11 00509 g004
Figure 5. Spatial distributions of the mean summer XCO2 (ac) every year and increments of mean XCO2 this summer from previous summer (d,e). Spatial distributions of the mean summer XCH4 (fh) every year and increments of mean XCH4 this summer from previous summer (i,j).
Atmosphere 11 00509 g005
Figure 6. Bivariate polar plots for (a) dCO2 and (b) dCH4 together with (c) map showing the locations of the GS site and surrounded emission sources.
Atmosphere 11 00509 g006
Figure 7. CO2 source distribution map derived by CWT analysis for (a) winter, (b) spring, (c) summer, and (d) autumn. Each gridded map value denotes the trajectory residence time weighted average of the dCO2 values.
Atmosphere 11 00509 g007
Figure 8. CH4 source distribution map derived by CWT analysis for (a) winter, (b) spring, (c) summer, and (d) autumn. Each gridded map value denotes the trajectory residence time weighted average of the dCH4 values.
Atmosphere 11 00509 g008
Table 1. Annual average CO2 and CH4 concentrations for the 2012–2014 period at the Ganseong (GS) site and global wide.
YearGS (This Study)Global Average *
CO2 (ppm)CH4 (ppb)CO2 (ppm)CH4 (ppb)
2012399.61920.7393.11818
2013401.51933.4395.81824
2014398.41938.7397.71833
Mean399.81930.9395.51825
* adopted from the WMO Greenhouse Gas Bulletins [2,38,39].
Table 2. Seasonal mean trajectory clusters and associated mean delta concentrations for CO2 and CH4 (i.e., dCO2 and dCH4). The delta concentrations are equal to the polluted concentration minus the background concentrations (e.g., dCO2 = CO2pol − CO2bg). The percentage of air masses from each cluster is in parenthesis.
SeasonClusterFraction (%)CO2bg (ppm)CH4bg (ppb)dCO2 (ppm)dCH4 (ppb)
Winter121.4399.4 ± 3.81914 ± 1011.3 ± 5.955 ± 30
222.1400.1 ± 3.51913 ± 1110.7 ± 4.952 ± 26
322.6400.1 ± 3.71911 ± 149.5 ± 4.442 ± 22
424.3400.7 ± 3.31913 ± 138.5 ± 3.640 ± 21
59.6400.1 ± 4.01918 ± 812.0 ± 6.163 ± 33
Spring138.3398.3 ± 6.51900 ± 2013.4 ± 5.147 ± 31
217.4398.0 ± 6.71906 ± 2010.9 ± 5.550 ± 30
318.1400.5 ± 4.31909 ± 1810.4 ± 4.143 ± 19
418.9400.4 ± 4.71909 ± 2212.1 ± 5.734 ± 15
57.4399.5 ± 3.71889 ± 2412.0 ± 3.732 ± 22
Summer128.8391.7 ± 8.21891 ± 3016.5 ± 6.483 ± 40
235.3389.5 ± 8.81909 ± 2516.0 ± 6.371 ± 31
321388.0 ± 8.81904 ± 2411.9 ± 4.159 ± 27
414.9391.9 ± 7.41859 ± 3415.4 ± 5.277 ± 61
Autumn123.9394.5 ± 6.41917 ± 1313.1 ± 3.738 ± 19
219.7396.9 ± 5.31915 ± 1211.7 ± 4.033 ± 19
331.9391.1 ± 7.61912 ± 1913.5 ± 5.348 ± 21
424.5394.5 ± 6.81923 ± 1513.2 ± 4.648 ± 26
Table 3. Summary of the major source areas for CO2 identified by the CWT analysis.
SeasonCO2Reference
Major Source AreaMajor Sector
WinterCNIM: the mid and east of CNIMraw coal combustion for energy generation[34]
CNNE: the west of Heilongjiang, the mideast of Liaoning and the midnorth-to-south of Jilincoal washing, crude oils and petroleum refineries, heavy industries[34]
CNN: the central and on-/off-shore areas of eastern Shandongcoal combustion, oil refining, coal washing and industrial activities[34]
KP: Yanggang and Pyeonganmanufacturing industries, fuel combustion for power generation, and residential and other sectors[5]
KR: northwest, west, central areas of Incheonfuel combustion for public electricity/heat, transportation and industries[42]
SpringCNIM: the east of CNIMraw coal combustion for energy generation[34]
CNNE: the southwest of Jilin, and the midnorth-to-south and the east of Liaoningheavy industry and petroleum refineries[34]
CNN: the on-/off-shore areas of the northern Shandongcoal washing, heavy industries, and petroleum refineries[34]
KR: border area of Gangwon, Gyeonggi and Chungcheongfuel combustion for nonmetal industries and transportation[42]
SummerCNNE: the south of Liaoningpetroleum refineries[34]
KP: north area of Pyeongan and south areas of Hamgyongmanufacturing industries, fuel combustion for power generation, and residential and other sectors[5]
AutumnCNNE: mid-north of Jilinheavy industry[34]
CNN: the north and north coasts of Shandong and the east coasts of Shandongcoal washing, heavy industries, and petroleum refineries[34]
KR: west area of the northern Gyeongsangfuel combustion for nonmetal/metal industries, transportation[42]
Table 4. Summary of the major source areas for CH4 identified by the CWT analysis.
SeasonCH4Reference
Major Source AreaMajor Sector
WinterRUFEW and RUFEE: the southeast of Amurskaya and the south of Khabarovskcoal mining, fugitive emissions from oil and gas[5]
CNNE: the midnorth of Heilongjiangcoal mining and enteric fermentation[36]
CNN: some areas in northern and mid Hebei, the south of Tianjin, the mid and east parts and the east coasts of Shandongcoal mining, enteric fermentation, and MSW landfill, fugitive emissions from shipping and aviation activities[36]
CNE: the mid Jiangsurice cultivation and MSW landfill[36]
SpringCNN: the north of Shandong enteric fermentation and waste management sectors (MSW land fill and the wastewater treatment)[36]
CNE: the west of Jiangsu, Shanghai and the border area of the southern Jiangsu and Shanghairice cultivation and MSW landfill[36]
KP: Pyeongan, Pyongyang, and Hwanghaecoal mining, rice cultivation, wastewater treatment, solid waste disposal[5]
KR: some city areas of Gyeonggi, northwest and central areas of Incheon, northwest and southwest areas of Gangwon, west areas of Chungcheong, central and west areas of the northern Jeolla, west areas of the southern Jeolla, some south and north areas of Gyeongsang, some areas in Jejurice cultivation, enteric fermentation, fugitive emissions from energy sector, solid waste disposal[42]
JP: Nagasaki in western JPSrice cultivation, the enteric fermentation, and the wastewater treatment[5]
SummerCNN: the mid and eastern Shandong and the north and southeast coasts of Shandongenteric fermentation, MSW land fill and industrial wastewater treatment[36]
KR: southeast areas in Gyeongsangenteric fermentation, rice cultivation, energy sectors, manure management[42]
JP: Nagasaki in western JPSrice cultivation, the enteric fermentation, and the wastewater treatment[5]
AutumnCNN: border area of mid Hebei and Tianjin, the north and east parts and the north and east coasts of Shandongenteric fermentation, MSW land fill and industrial wastewater treatment[36]
KR: east areas of the southern Gangwon, west, central and eastern areas of the northern Geyongsangsolid waste disposal, enteric fermentation and rice cultivation[42]